UNITED STATES
SECURITIES AND EXCHANGE COMMISSION
Washington, D.C. 20549
FORM N-CSR
Certified Shareholder Report of
Registered Management Investment Companies
Investment Company Act File Number: 811-02333
New Perspective Fund
(Exact Name of Registrant as Specified in Charter)
333 South Hope Street
Los Angeles, California 90071
(Address of Principal Executive Offices)
Registrant's telephone number, including area code: (949) 975-5000
Date of fiscal year end: September 30
Date of reporting period: September 30, 2020
Brian C. Janssen
New Perspective Fund
6455 Irvine Center Drive
Los Angeles, California 90071
(Name and Address of Agent for Service)
ITEM 1 – Reports to Stockholders
New Perspective Fund® Annual report
for the year ended
September 30, 2020 |  |

Tap into the growth
potential of global
equities
Beginning January 1, 2021, as permitted by regulations adopted by the U.S. Securities and Exchange Commission, we intend to no longer mail paper copies of the fund’s shareholder reports, unless specifically requested from American Funds or your financial intermediary, such as a broker-dealer or bank. Instead, the reports will be made available on the Capital Group website (capitalgroup.com); you will be notified by mail and provided with a website link to access the report each time a report is posted. If you have already elected to receive shareholder reports electronically, you will not be affected by this change and do not need to take any action. If you prefer to receive shareholder reports and other communications electronically, you may update your mailing preferences with your financial intermediary, or enroll in e-delivery at capitalgroup.com (for accounts held directly with the fund).
You may elect to receive paper copies of all future reports free of charge. If you invest through a financial intermediary, you may contact your financial intermediary to request that you continue to receive paper copies of your shareholder reports. If you invest directly with the fund, you may inform American Funds that you wish to continue receiving paper copies of your shareholder reports by contacting us at (800) 421-4225. Your election to receive paper reports will apply to all funds held with American Funds or through your financial intermediary.
New Perspective Fund seeks to provide you with long-term growth of capital.
This fund is one of more than 40 offered by Capital Group, home of American Funds, one of the nation’s largest mutual fund families. For nearly 90 years, Capital Group has invested with a long-term focus based on thorough research and attention to risk.
Fund results shown in this report, unless otherwise indicated, are for Class A shares at net asset value. If a sales charge (maximum 5.75%) had been deducted, the results would have been lower. Results are for past periods and are not predictive of results for future periods. Current and future results may be lower or higher than those shown. Prices and returns will vary, so investors may lose money. Investing for short periods makes losses more likely. For current information and month-end results, visit capitalgroup.com.
See page 4 for Class A share results with relevant sales charges deducted. For other share class results, visit capitalgroup.com and americanfundsretirement.com.
The total annual fund operating expense ratio is 0.76% for Class A shares as of the prospectus dated December 1, 2020 (unaudited). The expense ratio is restated to reflect current fees.
Investment results assume all distributions are reinvested and reflect applicable fees and expenses. When applicable, investment results reflect fee waivers, without which results would have been lower. Visit capitalgroup.com for more information.
Investing outside the United States may be subject to risks, such as currency fluctuations, periods of illiquidity and price volatility. These risks may be heightened in connection with investments in developing countries. Refer to the fund prospectus and the Risk Factors section of this report for more information on these and other risks associated with investing in the fund.
Investments are not FDIC-insured, nor are they deposits of or guaranteed by a bank or any other entity, so they may lose value.
Fellow investors:
In an unprecedented year marked by a deadly pandemic, government-imposed lockdowns and extreme market volatility, New Perspective Fund generated strong results and surpassed its benchmark by a wide margin.
The fund returned 25.33% for the fiscal year ended September 30, 2020, exceeding the 10.44% increase recorded by its primary benchmark, the MSCI ACWI (All Country World Index). The fund’s return includes a dividend of 48 cents a share and a capital gain of $1.26 per share paid in December 2019.
The fund’s result also exceeded that of the Standard & Poor’s 500 Composite Index, which gained 15.15%. Over longer time frames, New Perspective’s results compare favorably to its benchmark.
Markets hit by extreme turbulence
World equity markets experienced high levels of volatility amid a severe coronavirus outbreak that brought the global economy to a virtual standstill. The pandemic triggered lockdowns in nearly all countries as authorities struggled to halt the spread of the virus and treat large numbers of patients. Markets plummeted in February and March as populations sheltered in place and economic activity declined sharply. A decade-long bull market in U.S. equities came to an end as the widening pandemic sparked the worst global recession since 2008.
Governments around the world responded with massive fiscal and monetary stimulus measures, including trillions of dollars in direct aid to companies and workers impacted by the crisis. In the U.S. alone, lawmakers approved a $2.2 trillion stimulus bill known as the Coronavirus Aid, Relief, and Economic Security (CARES) Act, the largest such spending measure in the country’s history. Central banks responded by aggressively cutting interest rates and dramatically expanding their bond-buying stimulus programs. The U.S. Federal Reserve lowered its key policy rate to near zero, and the European Central Bank maintained its negative interest rate policy. Government bond markets rallied amid safe-haven buying.
Reacting to the torrent of stimulus, markets rebounded in late March and April, turning the fastest bear market in history into the quickest recovery on record. Led by a ferocious rally in technology and consumer tech stocks, the S&P 500 soared 61% between March 23 and September 2 — surpassing the record highs reached before the start of the pandemic. Economic activity slowly picked up as businesses reopened and people adapted to new guidelines affecting work, commerce and recreation. Near the end of the 12-month period, market gains were tempered by a second wave of COVID-19 outbreaks in
Results at a glance
For periods ended September 30, 2020, with all distributions reinvested
| | | Cumulative
total returns | | Average annual total returns |
| | | 1 year | | 5 years | | 10 years | | Lifetime
(since 3/13/73) |
| | | | | | | | | |
| New Perspective Fund (Class A shares) | | | 25.33 | % | | | 14.35 | % | | | 11.86 | % | | | 12.37 | % |
| MSCI ACWI (All Country World Index)*,† | | | 10.44 | | | | 10.30 | | | | 8.55 | | | | 8.61 | |
| | | | | | | | | | | | | | | | | |
| * | MSCI ACWI is a free float-adjusted market capitalization-weighted index that is designed to measure equity market results in the global developed and emerging markets, consisting of more than 40 developed and emerging market country indexes. The index is unmanaged and, therefore, has no expenses. Investors cannot invest directly in an index. Source: MSCI. |
| † | From March 13, 1973, through December 31, 1987, the MSCI World Index was used because the MSCI ACWI did not exist. MSCI World Index results reflect dividends net of withholding taxes, and MSCI ACWI results reflect dividends gross of withholding taxes through December 31, 2000, and dividends net of withholding taxes thereafter. |
We remain optimistic about the companies we have chosen for this portfolio through fundamental, bottom-up security selection. We believe well-managed multinationals are ideally positioned to navigate turbulent times and come out stronger on the other side.
the U.S., Europe and elsewhere, as well as investor unease ahead of the U.S. presidential election.
Sector returns mixed
Sector returns diverged widely. Digitally focused, growth-oriented stocks rallied as millions of home-bound customers switched to online services for food, entertainment and other basic needs. Old-economy companies — particularly those without online avenues — fared much worse, creating a significant divide between companies that benefited from the lockdowns and those crushed by them. Large capitalization companies generally outpaced smaller companies, and growth stocks exceeded value stocks in aggregate.
Information technology stocks enjoyed the largest gains, led by semiconductor companies, software firms and digital payment processors. Companies that provide cloud-computing services also soared as thousands of corporations moved en masse to enable employees to work from home. Consumer discretionary stocks rose sharply, lifted by a surge in global e-commerce. However, returns in the consumer discretionary sector were more bifurcated as, for instance, online retailers saw their business skyrocket while many offline, brick-and-mortar retailers were forced to close.
Health care stocks climbed amid a frantic race to develop effective treatments for COVID-19, as well as a pandemic-ending vaccine. Shares of several biotechnology firms advanced on news of successful clinical trials for new types of cancer treatments. Communication services stocks also produced double-digit gains, led by video streaming and social media platforms that boomed in popularity during the lockdowns. Video game companies, in particular, generated huge increases in overall revenue, per-player revenue and new-player engagement.
Materials stocks also moved significantly higher amid rising demand for raw materials as economies reopened.
Energy stocks suffered the biggest losses as global demand for oil and gas plummeted. Several large oil companies posted multibillion dollar write-downs on assets. Rising demand for alternative energy sources pressured companies in the traditional oil and gas industry. Financial stocks fell sharply, hurt by ultra-low interest rates and a global economy in recession. Bank shares plunged as some lenders suspended dividend payments in a bid to conserve cash. Real estate stocks declined on investor worries about the viability of the commercial real estate industry in a recession and, as more people work from home, potentially on a permanent basis. Meanwhile, consumer staples, industrials and utilities stocks lagged the overall market.
Inside the portfolio
Select investments in the consumer discretionary sector generated strong returns for the fund, including automaker Tesla and e-commerce giant Amazon. Tesla shares rallied on rising demand for the company’s tech-infused electric vehicles, as well as investor optimism for its innovative battery technology. Amazon shares soared as demand for online shopping and delivery services rose dramatically. On the other hand, consumer discretionary holdings in the travel and tourism industry hurt returns relative to the index. Shares of Norwegian Cruise Line and MGM Resorts declined as cruise lines and casinos worldwide paused operations amid COVID-19 fears. Both holdings were eliminated from the portfolio.
Communication services stocks proved to be another bright spot for the fund, primarily due to the growing popularity of Facebook and Netflix. Both companies saw massive increases in customer engagement during the lockdowns. Netflix enjoyed rapid subscriber growth,
demonstrating the power of disruptive, internet-driven business models. Stocks in the information technology sector boosted returns as well, led by chipmakers ASML and Taiwan Semiconductor Manufacturing. PayPal proved a strong contributor as online payment activity continued to grow at a rapid pace. Elsewhere in the information technology sector, Apple and NVIDIA detracted on a relative basis. The fund owned a relatively small, underweight position in Apple and did not own NVIDIA shares; both stocks rallied during the 12-month period.
Health care stocks advanced, led by innovative biotech firms working on novel treatments for cancer and other serious diseases. Seattle Genetics and Regeneron Pharmaceuticals rallied. Some health care companies detracted, however. Boston Scientific shares fell primarily due to a decline in elective surgeries and other non-essential medical procedures during the pandemic.
Certain investments in the industrials sector disappointed for the 12-month period. The two largest detractors relative to the index were Airbus and Safran, both of which were hit hard by cratering demand for air travel. Portfolio managers believe Airbus and Safran are well-managed companies with a strong potential to rebound once the pandemic is under control. Elsewhere in the portfolio, shares of CME Group declined as the derivatives exchange company experienced a decrease in trading of interest rate products amid the Fed’s bond buying activities and near zero rate policy.
Across all sectors, the fund remains focused on companies that have potentially long growth runways. This continues to be expressed through large positions in technology and consumer-orientated companies, which account for a substantial share of the portfolio. While income is a consideration in the management of the fund, its primary investment objective remains long-term growth of capital. To articulate a clearer expression of our investment approach, in December 2019, we adjusted the fund’s objective by removing references to the secondary objective of future income.
Looking ahead
Even before the COVID-19 outbreak, the outlook for global equity markets was clouded by trade uncertainty, rising political risk and slowing economic growth in major developed markets. In many ways, the virus has exacerbated those issues through a further deterioration in U.S.-China relations, ongoing political divisiveness and a worldwide economic downturn from which it could take years to recover. Given these challenges, our outlook for 2021 and beyond remains cautious. We urge our shareholders to brace for more volatility while maintaining focus on their long-term investment goals.
As we head into a new year, we expect a challenging investment and economic environment, dominated by the search for an effective vaccine. In addition, the newly elected U.S. president will be faced with the daunting task of uniting a bitterly divided nation while continuing to navigate increasingly choppy global trade waters. The virus has underscored an urgent need for global cooperation, but rising geopolitical tensions and growing nationalist sentiments are threatening to undermine that goal.
Against this difficult backdrop, however, we remain optimistic about the companies we have chosen for this portfolio through fundamental, bottom-up security selection. We believe well-managed multinationals are ideally positioned to navigate turbulent times and come out stronger on the other side. In addition, our long-term investment horizon allows us to take advantage of volatile markets and invest in companies that we think will prosper over a period of years.
We thank you for your commitment to New Perspective Fund, and we look forward to reporting to you again in six months.
Sincerely,

Robert W. Lovelace
Co-President

Joanna F. Jonsson
Co-President
November 6, 2020
For current information about the fund, visit capitalgroup.com.
The value of a long-term perspective

Fund results shown are for Class A shares and reflect deduction of the maximum sales charge of 5.75% on the $10,0001. Thus, the net amount invested was $9,4252. Results are for past periods and are not predictive of results for future periods. Current and future results may be lower or higher than those shown. Share prices and returns will vary, so investors may lose money. For current information and month-end results, visit capitalgroup.com.
The results shown are before taxes on fund distributions and sale of fund shares.
| 1 | The maximum initial sales charge was 8.5% prior to July 1, 1988. |
| 2 | As outlined in the prospectus, the sales charge is reduced for accounts (and aggregated investments) of $25,000 or more and is eliminated for purchases of $1 million or more. There is no sales charge on dividends or capital gain distributions that are reinvested in additional shares. |
| 3 | The market index is unmanaged and, therefore, has no expenses. Investors cannot invest directly in an index. Source: MSCI. |
| 4 | From March 13, 1973, through December 31, 1987, the MSCI World Index was used because the MSCI ACWI did not exist. MSCI World Index results reflect dividends net of withholding taxes, and MSCI ACWI results reflect dividends gross of withholding taxes through December 31, 2000, and dividends net of withholding taxes thereafter. |
| 5 | For the period March 13, 1973, commencement of operations, through September 30, 1973. |
How a hypothetical $10,000 investment has grown
There have always been reasons not to invest. If you look beyond the negative headlines, however, you will find that despite occasional stumbles, financial markets have tended to reward investors over the long term. As the chart below shows, over its lifetime, New Perspective Fund has done demonstrably better than its primary benchmark. Dividends, particularly when reinvested, have accounted for a large portion of the fund’s overall results.

Summary investment portfolio September 30, 2020
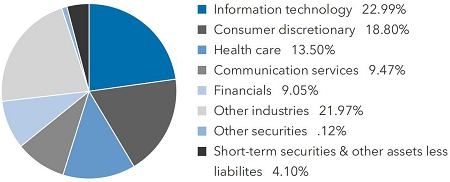
| Country diversification by domicile | | Percent of
net assets |
| United States | | | 55.56 | % |
| Eurozone* | | | 12.77 | |
| Japan | | | 4.23 | |
| United Kingdom | | | 3.95 | |
| Taiwan | | | 2.95 | |
| Hong Kong | | | 2.93 | |
| Switzerland | | | 2.66 | |
| Denmark | | | 2.32 | |
| Canada | | | 1.61 | |
| Other countries | | | 6.92 | |
| Short-term securities & other assets less liabilities | | | 4.10 | |
| | |
| * | Countries using the euro as a common currency; those represented in the fund’s portfolio are Belgium, Finland, France, Germany, Ireland, Italy, the Netherlands and Spain. |
| | |
| Common stocks 95.78% | | Shares | | | Value
(000) | |
| Information technology 22.99% | | | | | | | | |
| Microsoft Corp. | | | 15,931,615 | | | $ | 3,350,897 | |
| Taiwan Semiconductor Manufacturing Company, Ltd.1 | | | 208,775,941 | | | | 3,135,517 | |
| Taiwan Semiconductor Manufacturing Company, Ltd. (ADR) | | | 1,500,631 | | | | 121,656 | |
| ASML Holding NV1 | | | 3,839,942 | | | | 1,415,920 | |
| ASML Holding NV (New York registered) (ADR) | | | 1,842,254 | | | | 680,289 | |
| Mastercard Inc., Class A | | | 6,058,408 | | | | 2,048,772 | |
| PayPal Holdings, Inc.2 | | | 6,753,719 | | | | 1,330,685 | |
| Broadcom Inc. | | | 3,550,760 | | | | 1,293,613 | |
| Visa Inc., Class A | | | 6,011,295 | | | | 1,202,079 | |
| Shopify Inc., Class A, subordinate voting shares2 | | | 1,009,646 | | | | 1,032,838 | |
| Adobe Inc.2 | | | 2,011,759 | | | | 986,627 | |
| Samsung Electronics Co., Ltd.1 | | | 19,139,258 | | | | 964,344 | |
| Keyence Corp.1 | | | 1,342,740 | | | | 625,774 | |
| Other securities | | | | | | | 7,456,869 | |
| | | | | | | | 25,645,880 | |
| | | | | | | | | |
| Consumer discretionary 18.80% | | | | | | | | |
| Tesla, Inc.2 | | | 16,920,148 | | | | 7,258,914 | |
| Amazon.com, Inc.2 | | | 1,207,504 | | | | 3,802,104 | |
| NIKE, Inc., Class B | | | 7,850,432 | | | | 985,543 | |
| Prosus NV1,2 | | | 9,396,927 | | | | 866,566 | |
| LVMH Moët Hennessy-Louis Vuitton SE1 | | | 1,643,062 | | | | 768,125 | |
| Kering SA1 | | | 940,482 | | | | 624,842 | |
| MercadoLibre, Inc.2 | | | 539,465 | | | | 583,960 | |
| Hermès International1 | | | 612,842 | | | | 528,260 | |
| Other securities | | | | | | | 5,561,181 | |
| | | | | | | | 20,979,495 | |
| | | | | | | | | |
| Health care 13.50% | | | | | | | | |
| Intuitive Surgical, Inc.2 | | | 1,664,012 | | | | 1,180,683 | |
| Vertex Pharmaceuticals Inc.2 | | | 3,916,394 | | | | 1,065,729 | |
| AstraZeneca PLC1 | | | 9,580,002 | | | | 1,042,697 | |
| Thermo Fisher Scientific Inc. | | | 2,055,408 | | | | 907,504 | |
| BeiGene, Ltd. (ADR)2 | | | 3,006,235 | | | | 861,106 | |
| Seattle Genetics, Inc.2 | | | 3,868,911 | | | | 757,107 | |
| Regeneron Pharmaceuticals, Inc.2 | | | 1,278,718 | | | | 715,801 | |
| Boston Scientific Corp.2 | | | 18,652,342 | | | | 712,706 | |
| Zoetis Inc., Class A | | | 4,283,079 | | | | 708,293 | |
| Pfizer Inc. | | | 15,284,410 | | | | 560,938 | |
| Other securities | | | | | | | 6,552,692 | |
| | | | | | | | 15,065,256 | |
| | | Shares | | | Value
(000) | |
| Communication services 9.47% | | | | | | | | |
| Facebook, Inc., Class A2 | | | 13,945,897 | | | $ | 3,652,430 | |
| Alphabet Inc., Class C2 | | | 727,133 | | | | 1,068,595 | |
| Alphabet Inc., Class A2 | | | 632,981 | | | | 927,697 | |
| Netflix, Inc.2 | | | 3,510,735 | | | | 1,755,473 | |
| Other securities | | | | | | | 3,165,841 | |
| | | | | | | | 10,570,036 | |
| | | | | | | | | |
| Financials 9.05% | | | | | | | | |
| AIA Group Ltd.1 | | | 131,061,400 | | | | 1,291,109 | |
| JPMorgan Chase & Co. | | | 12,762,048 | | | | 1,228,602 | |
| London Stock Exchange Group PLC1 | | | 8,949,954 | | | | 1,023,882 | |
| Moody’s Corp. | | | 2,835,843 | | | | 821,969 | |
| CME Group Inc., Class A | | | 4,758,456 | | | | 796,137 | |
| Other securities | | | | | | | 4,940,538 | |
| | | | | | | | 10,102,237 | |
| | | | | | | | | |
| Industrials 6.95% | | | | | | | | |
| DSV Panalpina A/S1 | | | 4,373,697 | | | | 713,741 | |
| Honeywell International Inc. | | | 4,295,196 | | | | 707,032 | |
| Safran SA1,2 | | | 5,527,719 | | | | 543,949 | |
| Nidec Corp.1 | | | 5,749,332 | | | | 534,694 | |
| Other securities | | | | | | | 5,253,793 | |
| | | | | | | | 7,753,209 | |
| | | | | | | | | |
| Consumer staples 5.47% | | | | | | | | |
| Nestlé SA1 | | | 9,797,150 | | | | 1,162,325 | |
| Costco Wholesale Corp. | | | 2,213,980 | | | | 785,963 | |
| Mondelez International, Inc. | | | 9,704,778 | | | | 557,540 | |
| Other securities | | | | | | | 3,594,329 | |
| | | | | | | | 6,100,157 | |
| | | | | | | | | |
| Materials 5.08% | | | | | | | | |
| Koninklijke DSM NV1 | | | 5,217,736 | | | | 859,861 | |
| Vale SA, ordinary nominative (ADR) | | | 58,699,457 | | | | 621,040 | |
| Vale SA, ordinary nominative | | | 16,512,655 | | | | 173,804 | |
| Sherwin-Williams Company | | | 904,541 | | | | 630,230 | |
| Other securities | | | | | | | 3,387,249 | |
| | | | | | | | 5,672,184 | |
| | | | | | | | | |
| Energy 1.90% | | | | | | | | |
| Reliance Industries Ltd.1 | | | 22,770,563 | | | | 693,529 | |
| Other securities | | | | | | | 1,426,787 | |
| | | | | | | | 2,120,316 | |
| | | | | | | | | |
| Utilities 1.44% | | | | | | | | |
| Ørsted AS1 | | | 5,700,232 | | | | 786,261 | |
| Other securities | | | | | | | 818,875 | |
| | | | | | | | 1,605,136 | |
| | | | | | | | | |
| Real estate 1.13% | | | | | | | | |
| Other securities | | | | | | | 1,263,966 | |
| | | | | | | | | |
| Total common stocks (cost: $57,088,731,000) | | | | | | | 106,877,872 | |
| | | | | | | | | |
| Preferred securities 0.10% | | | | | | | | |
| Other 0.10% | | | | | | | | |
| Other securities | | | | | | | 110,987 | |
| | | | | | | | | |
| Total preferred securities (cost: $83,254,000) | | | | | | | 110,987 | |
| | | | | | | | | |
| Bonds, notes & other debt instruments 0.02% | | | Principal amount
(000) | | | | | |
| Corporate bonds, notes & loans 0.02% | | | | | | | | |
| Energy 0.02% | | | | | | | | |
| Other securities | | | | | | | 24,410 | |
| | | | | | | | | |
| Total bonds, notes & other debt instruments (cost: $29,234,000) | | | | | | | 24,410 | |
| Short-term securities 4.46% | | Shares | | | Value
(000) | |
| Money market investments 4.46% | | | | | | | | |
| Capital Group Central Cash Fund 0.12%3,4 | | | 47,628,149 | | | $ | 4,763,291 | |
| BlackRock Liquidity Funds – FedFund, Institutional Shares 0%3,5 | | | 75,000,000 | | | | 75,000 | |
| Goldman Sachs Financial Square Government Fund, Institutional Shares 0%3,5 | | | 75,000,000 | | | | 75,000 | |
| Invesco Short-Term Investments Trust – Government & Agency Portfolio, Institutional Class 0.02%3,5 | | | 31,398,470 | | | | 31,399 | |
| State Street Institutional U.S. Government Money Market Fund, Premier Class 0.03%3,5 | | | 25,000,000 | | | | 25,000 | |
| Fidelity Investments Money Market Government Portfolio, Class I 0.01%3,5 | | | 1,000,000 | | | | 1,000 | |
| Morgan Stanley Institutional Liquidity Funds – Government Portfolio, Institutional Class 0.02%3,5 | | | 986,450 | | | | 986 | |
| | | | | | | | | |
| Total short-term securities (cost: $4,970,975,000) | | | | | | | 4,971,676 | |
| Total investment securities 100.36% (cost: $62,172,194,000) | | | | | | | 111,984,945 | |
| Other assets less liabilities (0.36)% | | | | | | | (402,160 | ) |
| | | | | | | | | |
| Net assets 100.00% | | | | | | $ | 111,582,785 | |
This summary investment portfolio is designed to streamline the report and help investors better focus on the fund’s principal holdings. See the inside back cover for details on how to obtain a complete schedule of portfolio holdings.
“Other securities” includes all issues that are not disclosed separately in the summary investment portfolio. “Other securities” also includes securities (with an aggregate value of $24,410,000, which represented .02% of the net assets of the fund) which were acquired in transactions exempt from registration under Rule 144A of the Securities Act of 1933 and may be resold in the U.S. in transactions exempt from registration, normally to qualified institutional buyers. “Other securities” also includes securities on loan. The total value of securities on loan was $199,690,000, which represented .18% of the net assets of the fund. Refer to Note 5 for more information on securities lending.
Investments in affiliates4
| | | Value of
affiliates at
10/1/2019
(000) | | | Additions
(000) | | | Reductions
(000) | | | Net
realized
gain (loss)
(000) | | | Net
unrealized
appreciation
(depreciation)
(000) | | | Value of
affiliates at
9/30/2020
(000) | | | Dividend
income
(000) | |
| Common stocks 0.82% | | | | | | | | | | | | | | | | | | | | | | | | | | | | |
| Information technology 0.30% | | | | | | | | | | | | | | | | | | | | | | | | | | | | |
| Smartsheet Inc., Class A2 | | $ | — | | | $ | 297,796 | | | $ | 25,195 | | | $ | 814 | | | $ | 59,499 | | | $ | 332,914 | | | $ | — | |
| Consumer discretionary 0.10% | | | | | | | | | | | | | | | | | | | | | | | | | | | | |
| Hilton Grand Vacations Inc.2 | | | 153,229 | | | | 12,958 | | | | 920 | | | | 168 | | | | (50,962 | ) | | | 114,473 | | | | — | |
| Health care 0.28% | | | | | | | | | | | | | | | | | | | | | | | | | | | | |
| Ultragenyx Pharmaceutical Inc.2 | | | 160,386 | | | | — | | | | 1,105 | | | | (60 | ) | | | 147,030 | | | | 306,251 | | | | — | |
| Agios Pharmaceuticals, Inc.2,6 | | | 108,917 | | | | 11,271 | | | | 24,156 | | | | (45,668 | ) | | | 53,229 | | | | — | | | | — | |
| | | | | | | | | | | | | | | | | | | | | | | | 306,251 | | | | | |
| Industrials 0.14% | | | | | | | | | | | | | | | | | | | | | | | | | | | | |
| PageGroup PLC1,2 | | | 68,786 | | | | 23,660 | | | | 475 | | | | 115 | | | | (10,015 | ) | | | 82,071 | | | | — | |
| Aggreko PLC1 | | | 169,892 | | | | — | | | | 938 | | | | (48 | ) | | | (90,535 | ) | | | 78,371 | | | | 1,104 | |
| | | | | | | | | | | | | | | | | | | | | | | | 160,442 | | | | | |
| Total common stocks | | | | | | | | | | | | | | | | | | | | | | | 914,080 | | | | | |
| Short-term securities 4.27% | | | | | | | | | | | | | | | | | | | | | | | | | | | | |
| Money market investments 4.27% | | | | | | | | | | | | | | | | | | | | | | | | | | | | |
| Capital Group Central Cash Fund 0.12%3 | | | 4,745,146 | | | | 10,287,055 | | | | 10,268,886 | | | | (716 | ) | | | 692 | | | | 4,763,291 | | | | 42,576 | |
| Total 5.09% | | | | | | | | | | | | | | $ | (45,395 | ) | | $ | 108,938 | | | $ | 5,677,371 | | | $ | 43,680 | |
| 1 | Valued under fair value procedures adopted by authority of the board of trustees. The total value of all such securities, including those in “Other securities,” was $38,331,234,000, which represented 34.35% of the net assets of the fund. This amount includes $38,107,944,000 related to certain securities trading outside the U.S. whose values were adjusted as a result of significant market movements following the close of local trading. |
| 2 | Security did not produce income during the last 12 months. |
| 3 | Rate represents the seven-day yield at 9/30/2020. |
| 4 | Affiliate of the fund or part of the same group of investment companies as the fund, in each case as defined under the Investment Company Act of 1940. |
| 5 | Security purchased with cash collateral from securities on loan. Refer to Note 5 for more information on securities lending. |
| 6 | Unaffiliated issuer at 9/30/2020. |
Key to abbreviation
ADR = American Depositary Receipts
See notes to financial statements.
Financial statements
Statement of assets and liabilities
at September 30, 2020 | (dollars in thousands) |
| Assets: | | | | | | | | |
| Investment securities, at value: | | | | | | | | |
| Unaffiliated issuers (cost: $56,447,777) | | $ | 106,307,574 | | | | | |
| Affiliated issuers (cost: $5,724,417) | | | 5,677,371 | | | $ | 111,984,945 | |
| Cash | | | | | | | 530 | |
| Cash denominated in currencies other than U.S. dollars (cost: $42,222) | | | | | | | 42,220 | |
| Receivables for: | | | | | | | | |
| Sales of investments | | | 52,496 | | | | | |
| Sales of fund’s shares | | | 105,519 | | | | | |
| Dividends and interest | | | 147,059 | | | | | |
| Securities lending income | | | 58 | | | | | |
| Other | | | 439 | | | | 305,571 | |
| | | | | | | | 112,333,266 | |
| Liabilities: | | | | | | | | |
| Collateral for securities on loan | | | | | | | 208,385 | |
| Payables for: | | | | | | | | |
| Purchases of investments | | | 254,172 | | | | | |
| Repurchases of fund’s shares | | | 145,012 | | | | | |
| Investment advisory services | | | 33,704 | | | | | |
| Services provided by related parties | | | 21,259 | | | | | |
| Trustees’ deferred compensation | | | 6,269 | | | | | |
| U.S. and non-U.S. taxes | | | 72,787 | | | | | |
| Other | | | 8,893 | | | | 542,096 | |
| Net assets at September 30, 2020 | | | | | | $ | 111,582,785 | |
| | | | | | | | | |
| Net assets consist of: | | | | | | | | |
| Capital paid in on shares of beneficial interest | | | | | | $ | 58,431,562 | |
| Total distributable earnings | | | | | | | 53,151,223 | |
| Net assets at September 30, 2020 | | | | | | $ | 111,582,785 | |
(dollars and shares in thousands, except per-share amounts)
Shares of beneficial interest issued and outstanding (no stated par value) —
unlimited shares authorized (2,077,439 total shares outstanding)
| | | Net assets | | | Shares
outstanding | | | Net asset value
per share | |
| Class A | | $ | 50,985,900 | | | | 947,566 | | | $ | 53.81 | |
| Class C | | | 1,394,816 | | | | 27,225 | | | | 51.23 | |
| Class T | | | 14 | | | | — | * | | | 53.83 | |
| Class F-1 | | | 1,803,723 | | | | 33,759 | | | | 53.43 | |
| Class F-2 | | | 14,016,095 | | | | 261,133 | | | | 53.67 | |
| Class F-3 | | | 7,784,005 | | | | 144,402 | | | | 53.90 | |
| Class 529-A | | | 2,695,828 | | | | 50,780 | | | | 53.09 | |
| Class 529-C | | | 119,071 | | | | 2,329 | | | | 51.12 | |
| Class 529-E | | | 91,260 | | | | 1,740 | | | | 52.46 | |
| Class 529-T | | | 17 | | | | — | * | | | 53.80 | |
| Class 529-F-1 | | | 179,602 | | | | 3,389 | | | | 52.99 | |
| Class R-1 | | | 68,971 | | | | 1,357 | | | | 50.81 | |
| Class R-2 | | | 570,365 | | | | 11,119 | | | | 51.30 | |
| Class R-2E | | | 68,206 | | | | 1,293 | | | | 52.74 | |
| Class R-3 | | | 1,557,474 | | | | 29,721 | | | | 52.40 | |
| Class R-4 | | | 2,166,231 | | | | 40,884 | | | | 52.98 | |
| Class R-5E | | | 220,315 | | | | 4,123 | | | | 53.43 | |
| Class R-5 | | | 1,742,043 | | | | 32,356 | | | | 53.84 | |
| Class R-6 | | | 26,118,849 | | | | 484,263 | | | | 53.94 | |
| * | Amount less than one thousand. |
See notes to financial statements.
Statement of operations
for the year ended September 30, 2020 | (dollars in thousands) |
| Investment income: | | | | | | | | |
| Income: | | | | | | | | |
| Dividends (net of non-U.S. taxes of $4,349; also includes $43,680 from affiliates) | | $ | 1,237,254 | | | | | |
| Interest | | | 42,091 | | | | | |
| Securities lending income (net of fees) | | | 867 | | | $ | 1,280,212 | |
| Fees and expenses*: | | | | | | | | |
| Investment advisory services | | | 359,538 | | | | | |
| Distribution services | | | 154,717 | | | | | |
| Transfer agent services | | | 66,688 | | | | | |
| Administrative services | | | 29,007 | | | | | |
| Reports to shareholders | | | 2,509 | | | | | |
| Registration statement and prospectus | | | 2,351 | | | | | |
| Trustees’ compensation | | | 1,740 | | | | | |
| Auditing and legal | | | 333 | | | | | |
| Custodian | | | 7,218 | | | | | |
| Other | | | 1,888 | | | | 625,989 | |
| Net investment income | | | | | | | 654,223 | |
| | | | | | | | | |
| Net realized gain and unrealized appreciation: | | | | | | | | |
| Net realized gain (loss) on: | | | | | | | | |
| Investments: | | | | | | | | |
| Unaffiliated issuers | | | 3,673,317 | | | | | |
| Affiliated issuers | | | (45,395 | ) | | | | |
| In-kind redemptions | | | 293,256 | | | | | |
| Currency transactions | | | (19,046 | ) | | | 3,902,132 | |
| Net unrealized appreciation (depreciation) on: | | | | | | | | |
| Investments (net of non-U.S. taxes of $31,385): | | | | | | | | |
| Unaffiliated issuers | | | 18,084,946 | | | | | |
| Affiliated issuers | | | 108,938 | | | | | |
| Currency translations | | | (4,423 | ) | | | 18,189,461 | |
| Net realized gain and unrealized appreciation | | | | | | | 22,091,593 | |
| | | | | | | | | |
| Net increase in net assets resulting from operations | | | | | | $ | 22,745,816 | |
| * | Additional information related to class-specific fees and expenses is included in the notes to financial statements. |
| Statements of changes in net assets | |
| | (dollars in thousands) |
| | | Year ended September 30, | |
| | | 2020 | | | 2019 | |
| Operations: | | | | | | | | |
| Net investment income | | $ | 654,223 | | | $ | 786,621 | |
| Net realized gain | | | 3,902,132 | | | | 2,665,924 | |
| Net unrealized appreciation (depreciation) | | | 18,189,461 | | | | (1,278,653 | ) |
| Net increase in net assets resulting from operations | | | 22,745,816 | | | | 2,173,892 | |
| | | | | | | | | |
| Distributions paid to shareholders | | | (3,547,007 | ) | | | (5,328,174 | ) |
| | | | | | | | | |
| Net capital share transactions | | | 3,079,332 | | | | 6,388,417 | |
| | | | | | | | | |
| Total increase in net assets | | | 22,278,141 | | | | 3,234,135 | |
| | | | | | | | | |
| Net assets: | | | | | | | | |
| Beginning of year | | | 89,304,644 | | | | 86,070,509 | |
| End of year | | $ | 111,582,785 | | | $ | 89,304,644 | |
See notes to financial statements.
Notes to financial statements
1. Organization
New Perspective Fund (the “fund”) is registered under the Investment Company Act of 1940 as an open-end, diversified management investment company. The fund seeks to provide long-term growth of capital.
The fund has 19 share classes consisting of six retail share classes (Classes A, C, T, F-1, F-2 and F-3), five 529 college savings plan share classes (Classes 529-A, 529-C, 529-E, 529-T and 529-F-1) and eight retirement plan share classes (Classes R-1, R-2, R-2E, R-3, R-4, R-5E, R-5 and R-6). The 529 college savings plan share classes can be used to save for college education. The retirement plan share classes are generally offered only through eligible employer-sponsored retirement plans. The fund’s share classes are described further in the following table:
| Share class | | Initial sales charge | Contingent deferred sales
charge upon redemption | | Conversion feature | |
| Classes A and 529-A | | Up to 5.75%1 | | None (except 1% for certain redemptions within 18 months of purchase without an initial sales charge) | | None | |
| Class C | | None | | 1% for redemptions within one year of purchase | | Class C converts to Class F-1 after 10 years2 | |
| Class 529-C | | None | | 1% for redemptions within one year of purchase | | Class 529-C converts to Class 529-A after 10 years3 | |
| Class 529-E | | None | | None | | None | |
| Classes T and 529-T4 | | Up to 2.50% | | None | | None | |
| Classes F-1, F-2, F-3 and 529-F-1 | | None | | None | | None | |
| Classes R-1, R-2, R-2E, R-3, R-4, R-5E, R-5 and R-6 | | None | | None | | None | |
| 1 | Up to 3.50% for Class 529-A shares purchased on or after June 30, 2020. |
| 2 | Effective June 30, 2020, Class C converts to Class A after 8 years. |
| 3 | Effective June 30, 2020, Class 529-C converts to Class 529-A after 5 years. |
| 4 | Class T and 529-T shares are not available for purchase. |
Holders of all share classes have equal pro rata rights to the assets, dividends and liquidation proceeds of the fund. Each share class has identical voting rights, except for the exclusive right to vote on matters affecting only its class. Share classes have different fees and expenses (“class-specific fees and expenses”), primarily due to different arrangements for distribution, transfer agent and administrative services. Differences in class-specific fees and expenses will result in differences in net investment income and, therefore, the payment of different per-share dividends by each share class.
2. Significant accounting policies
The fund is an investment company that applies the accounting and reporting guidance issued in Topic 946 by the U.S. Financial Accounting Standards Board. The fund’s financial statements have been prepared to comply with U.S. generally accepted accounting principles (“U.S. GAAP”). These principles require the fund’s investment adviser to make estimates and assumptions that affect reported amounts and disclosures. Actual results could differ from those estimates. Subsequent events, if any, have been evaluated through the date of issuance in the preparation of the financial statements. The fund follows the significant accounting policies described in this section, as well as the valuation policies described in the next section on valuation.
Security transactions and related investment income — Security transactions are recorded by the fund as of the date the trades are executed with brokers. Realized gains and losses from security transactions are determined based on the specific identified cost of the securities. In the event a security is purchased with a delayed payment date, the fund will segregate liquid assets sufficient to meet its payment obligations. Dividend income is recognized on the ex-dividend date and interest income is recognized on an accrual basis. Market discounts, premiums and original issue discounts on fixed-income securities are amortized daily over the expected life of the security.
Class allocations — Income, fees and expenses (other than class-specific fees and expenses), realized gains and losses and unrealized appreciation and depreciation are allocated daily among the various share classes based on their relative net assets. Class-specific fees and expenses, such as distribution, transfer agent and administrative services, are charged directly to the respective share class.
Distributions paid to shareholders — Income dividends and capital gain distributions are recorded on the ex-dividend date.
Currency translation — Assets and liabilities, including investment securities, denominated in currencies other than U.S. dollars are translated into U.S. dollars at the exchange rates supplied by one or more pricing vendors on the valuation date. Purchases and sales of investment securities and income and expenses are translated into U.S. dollars at the exchange rates on the dates of such transactions. The effects of changes in exchange rates on investment securities are included with the net realized gain or loss and net unrealized appreciation or depreciation on investments in the fund’s statement of operations. The realized gain or loss and unrealized appreciation or depreciation resulting from all other transactions denominated in currencies other than U.S. dollars are disclosed separately.
In-kind redemptions — The fund normally redeems shares in cash; however, under certain conditions and circumstances, payment of the redemption price wholly or partly with portfolio securities or other fund assets may be permitted. A redemption of shares in-kind is based upon the closing value of the shares being redeemed as of the trade date. Realized gains/losses resulting from redemptions of shares in-kind are reflected separately in the fund’s statement of operations.
3. Valuation
Capital Research and Management Company (“CRMC”), the fund’s investment adviser, values the fund’s investments at fair value as defined by U.S. GAAP. The net asset value of each share class of the fund is generally determined as of approximately 4:00 p.m. New York time each day the New York Stock Exchange is open.
Methods and inputs — The fund’s investment adviser uses the following methods and inputs to establish the fair value of the fund’s assets and liabilities. Use of particular methods and inputs may vary over time based on availability and relevance as market and economic conditions evolve.
Equity securities are generally valued at the official closing price of, or the last reported sale price on, the exchange or market on which such securities are traded, as of the close of business on the day the securities are being valued or, lacking any sales, at the last available bid price. Prices for each security are taken from the principal exchange or market on which the security trades.
Fixed-income securities, including short-term securities, are generally valued at prices obtained from one or more pricing vendors. Vendors value such securities based on one or more of the inputs described in the following table. The table provides examples of inputs that are commonly relevant for valuing particular classes of fixed-income securities in which the fund is authorized to invest. However, these classifications are not exclusive, and any of the inputs may be used to value any other class of fixed-income security.
| Fixed-income class | | Examples of standard inputs |
| All | | Benchmark yields, transactions, bids, offers, quotations from dealers and trading systems, new issues, spreads and other relationships observed in the markets among comparable securities; and proprietary pricing models such as yield measures calculated using factors such as cash flows, financial or collateral performance and other reference data (collectively referred to as “standard inputs”) |
| Corporate bonds, notes & loans; convertible securities | | Standard inputs and underlying equity of the issuer |
| Bonds & notes of governments & government agencies | | Standard inputs and interest rate volatilities |
When the fund’s investment adviser deems it appropriate to do so (such as when vendor prices are unavailable or deemed to be not representative), fixed-income securities will be valued in good faith at the mean quoted bid and ask prices that are reasonably and timely available (or bid prices, if ask prices are not available) or at prices for securities of comparable maturity, quality and type.
Securities with both fixed-income and equity characteristics, or equity securities traded principally among fixed-income dealers, are generally valued in the manner described for either equity or fixed-income securities, depending on which method is deemed most appropriate by the fund’s investment adviser. The Capital Group Central Cash Fund (“CCF”), a fund within the Capital Group Central Fund Series (“Central Funds”), is valued based upon a floating net asset value, which fluctuates with changes in the value of CCF’s portfolio securities. The underlying securities are valued based on the policies and procedures in CCF’s statement of additional information.
Securities and other assets for which representative market quotations are not readily available or are considered unreliable by the fund’s investment adviser are fair valued as determined in good faith under fair valuation guidelines adopted by authority of the fund’s board of trustees as further described. The investment adviser follows fair valuation guidelines, consistent with U.S. Securities and Exchange Commission rules and guidance, to consider relevant principles and factors when making fair value determinations. The investment adviser considers relevant indications of value that are reasonably and timely available to it in determining the fair value to be assigned to a particular security, such as the type and cost of the security; contractual or legal restrictions on resale of the security; relevant financial or business developments of the issuer; actively traded similar or related securities; conversion or exchange rights on the security; related corporate actions; significant events occurring after the close of trading in the security; and changes in overall market conditions. In addition, the closing prices of equity securities that trade in markets outside U.S. time zones may be adjusted to reflect significant events that occur after the close of local trading but before the net asset value of each share class of the fund is determined. Fair valuations and valuations of investments that are not actively trading involve judgment and may differ materially from valuations that would have been used had greater market activity occurred.
Processes and structure — The fund’s board of trustees has delegated authority to the fund’s investment adviser to make fair value determinations, subject to board oversight. The investment adviser has established a Joint Fair Valuation Committee (the “Fair Valuation Committee”) to administer, implement and oversee the fair valuation process, and to make fair value decisions. The Fair Valuation Committee regularly reviews its own fair value decisions, as well as decisions made under its standing instructions to the investment adviser’s valuation teams. The Fair Valuation Committee reviews changes in fair value measurements from period to period and may, as deemed appropriate, update the fair valuation guidelines to better reflect the results of back testing and address new or evolving issues. The Fair Valuation Committee reports any changes to the fair valuation guidelines to the board of trustees. The fund’s board and audit committee also regularly review reports that describe fair value determinations and methods.
The fund’s investment adviser has also established a Fixed-Income Pricing Review Group to administer and oversee the fixed-income valuation process, including the use of fixed-income pricing vendors. This group regularly reviews pricing vendor information and market data. Pricing decisions, processes and controls over security valuation are also subject to additional internal reviews, including an annual control self-evaluation program facilitated by the investment adviser’s compliance group.
Classifications — The fund’s investment adviser classifies the fund’s assets and liabilities into three levels based on the inputs used to value the assets or liabilities. Level 1 values are based on quoted prices in active markets for identical securities. Level 2 values are based on significant observable market inputs, such as quoted prices for similar securities and quoted prices in inactive markets. Certain securities trading outside the U.S. may transfer between Level 1 and Level 2 due to valuation adjustments resulting from significant market movements following the close of local trading. Level 3 values are based on significant unobservable inputs that reflect the investment adviser’s determination of assumptions that market participants might reasonably use in valuing the securities. The valuation levels are not necessarily an indication of the risk or liquidity associated with the underlying investment. For example, U.S. government securities are reflected as Level 2 because the inputs used to determine fair value may not always be quoted prices in an active market. The following table presents the fund’s valuation levels as of September 30, 2020 (dollars in thousands):
| | | Investment securities | |
| | | Level 1 | | | Level 2 | | | Level 3 | | | Total | |
| Assets: | | | | | | | | | | | | | | | | |
| Common stocks: | | | | | | | | | | | | | | | | |
| Information technology | | $ | 17,581,285 | | | $ | 8,064,595 | | | $ | — | | | $ | 25,645,880 | |
| Consumer discretionary | | | 14,717,792 | | | | 6,261,703 | | | | — | | | | 20,979,495 | |
| Health care | | | 11,728,260 | | | | 3,336,996 | | | | — | | | | 15,065,256 | |
| Communication services | | | 9,004,332 | | | | 1,565,704 | | | | — | | | | 10,570,036 | |
| Financials | | | 5,430,197 | | | | 4,672,040 | | | | — | | | | 10,102,237 | |
| Industrials | | | 2,810,494 | | | | 4,942,715 | | | | — | | | | 7,753,209 | |
| Consumer staples | | | 2,238,316 | | | | 3,861,841 | | | | — | | | | 6,100,157 | |
| Materials | | | 3,126,593 | | | | 2,545,591 | | | | — | | | | 5,672,184 | |
| Energy | | | 868,080 | | | | 1,252,236 | | | | — | | | | 2,120,316 | |
| Utilities | | | 346,459 | | | | 1,258,677 | | | | — | | | | 1,605,136 | |
| Real estate | | | 785,171 | | | | 478,795 | | | | — | | | | 1,263,966 | |
| Preferred securities | | | 20,646 | | | | 90,341 | | | | — | | | | 110,987 | |
| Bonds, notes & other debt instruments | | | — | | | | 24,410 | | | | — | | | | 24,410 | |
| Short-term securities | | | 4,971,676 | | | | — | | | | — | | | | 4,971,676 | |
| Total | | $ | 73,629,301 | | | $ | 38,355,644 | | | $ | — | | | $ | 111,984,945 | |
4. Risk factors
Investing in the fund may involve certain risks including, but not limited to, those described below.
Market conditions — The prices of, and the income generated by, the securities held by the fund may decline — sometimes rapidly or unpredictably — due to various factors, including events or conditions affecting the general economy or particular industries; overall market changes; local, regional or global political, social or economic instability; governmental, governmental agency or central bank responses to economic conditions; and currency exchange rate, interest rate and commodity price fluctuations.
Economies and financial markets throughout the world are highly interconnected. Economic, financial or political events, trading and tariff arrangements, wars, terrorism, cybersecurity events, natural disasters, public health emergencies (such as the spread of infectious disease) and other circumstances in one country or region, including actions taken by governmental or quasi-governmental authorities in response to any of the foregoing, could have impacts on global economies or markets. As a result, whether or not the fund invests in securities of issuers located in or with significant exposure to the countries affected, the value and liquidity of the fund’s investments may be negatively affected by developments in other countries and regions.
Issuer risks — The prices of, and the income generated by, securities held by the fund may decline in response to various factors directly related to the issuers of such securities, including reduced demand for an issuer’s goods or services, poor management performance, major litigation related to the issuer, changes in government regulations affecting the issuer or its competitive environment and strategic initiatives such as mergers, acquisitions or dispositions and the market response to any such initiatives.
Investing in growth-oriented stocks — Growth-oriented common stocks and other equity-type securities (such as preferred stocks, convertible preferred stocks and convertible bonds) may involve larger price swings and greater potential for loss than other types of investments.
Investing outside the U.S. — Securities of issuers domiciled outside the U.S., or with significant operations or revenues outside the U.S., may lose value because of adverse political, social, economic or market developments (including social instability, regional conflicts, terrorism and war) in the countries or regions in which the issuers operate or generate revenue. These securities may also lose value due to changes in foreign currency exchange rates against the U.S. dollar and/or currencies of other countries. Issuers of these securities may be more susceptible to actions of foreign governments, such as nationalization, currency blockage or the imposition of price controls or punitive taxes, each of which could adversely impact the value of these securities. Securities markets in certain countries may be more volatile and/or less liquid than those in the U.S. Investments outside the U.S. may also be subject to different accounting practices and different regulatory, legal and reporting standards and practices, and may be more difficult to value, than those in the U.S. In addition, the value of investments outside the U.S. may be reduced by foreign taxes, including foreign withholding taxes on interest and dividends. Further, there may be increased risks of delayed settlement of securities purchased or sold by the fund. The risks of investing outside the U.S. may be heightened in connection with investments in emerging markets.
Management — The investment adviser to the fund actively manages the fund’s investments. Consequently, the fund is subject to the risk that the methods and analyses, including models, tools and data, employed by the investment adviser in this process may be flawed or incorrect and may not produce the desired results. This could cause the fund to lose value or its investment results to lag relevant benchmarks or other funds with similar objectives.
5. Certain investment techniques
Securities lending — The fund has entered into securities lending transactions in which the fund earns income by lending investment securities to brokers, dealers or other institutions. Each transaction involves three parties: the fund, acting as the lender of the securities, a borrower, and a lending agent that acts as an intermediary.
Securities lending transactions are entered into by the fund under a securities lending agent agreement with the lending agent. The lending agent facilitates the exchange of securities between the fund and approved borrowers, ensures that securities loans are properly coordinated and documented, marks-to-market the value of collateral daily, secures additional collateral from a borrower if it falls below preset terms, and may reinvest cash collateral on behalf of the fund according to agreed parameters. The lending agent provides indemnification to the fund against losses resulting from a borrower default. Although risk is mitigated by the collateral and indemnification, the fund could experience a delay in recovering its securities and a potential loss of income or value if a borrower fails to return securities, collateral investments decline in value or the lending agent fails to perform.
The borrower is required to post highly liquid assets, such as cash or U.S. government securities, as collateral for the loan in an amount at least equal to the value of the securities loaned. Investments made with cash collateral are recognized as assets in the fund’s investment portfolio. The same amount is recorded as a liability in the fund’s statement of assets and liabilities. While securities are on loan, the fund will continue to receive the equivalent of the interest, dividends or other distributions paid by the issuer, as well as a portion of the interest on the investment of the collateral. Additionally, although the fund does not have the right to vote on securities while they are on loan, the fund has a right to consent on corporate actions and a right to recall loaned securities to vote. A borrower is obligated to return loaned securities at the conclusion of a loan or, during the pendency of a loan, on demand from the fund.
As of September 30, 2020, the total value of securities on loan was $199,690,000, and the total value of collateral received was $209,077,000. Collateral received includes cash of $208,385,000 and U.S. government securities of $692,000. Investment securities purchased from cash collateral are disclosed in the investment portfolio as short-term securities. Securities received as collateral, if any, are not recognized as fund assets. The contractual maturity of cash collateral received under the securities lending agreement is classified as overnight and continuous.
Collateral — The fund receives highly liquid assets, such as cash or U.S. government securities, as collateral in exchange for lending investment securities. The purpose of the collateral is to cover potential losses that could occur in the event the borrower cannot meet its contractual obligation. The lending agent may reinvest cash collateral from securities lending transactions according to agreed parameters. Cash collateral reinvested by the lending agent, if any, is disclosed in the fund’s summary investment portfolio.
6. Taxation and distributions
Federal income taxation — The fund complies with the requirements under Subchapter M of the Internal Revenue Code applicable to mutual funds and intends to distribute substantially all of its net taxable income and net capital gains each year. The fund is not subject to income taxes to the extent such distributions are made. Therefore, no federal income tax provision is required.
As of and during the year ended September 30, 2020, the fund did not have a liability for any unrecognized tax benefits. The fund recognizes interest and penalties, if any, related to unrecognized tax benefits as income tax expense in the statement of operations. During the period, the fund did not incur any significant interest or penalties.
The fund’s tax returns are not subject to examination by federal, state and, if applicable, non-U.S. tax authorities after the expiration of each jurisdiction’s statute of limitations, which is generally three years after the date of filing but can be extended in certain jurisdictions.
Non-U.S. taxation — Dividend and interest income are recorded net of non-U.S. taxes paid. The fund may file withholding tax reclaims in certain jurisdictions to recover a portion of amounts previously withheld. As a result of rulings from European courts, the fund filed for additional reclaims related to prior years. These reclaims are recorded when the amount is known and there are no significant uncertainties on collectability. Gains realized by the fund on the sale of securities in certain countries, if any, may be subject to non-U.S. taxes. If applicable, the fund records an estimated deferred tax liability based on unrealized gains to provide for potential non-U.S. taxes payable upon the sale of these securities.
Distributions — Distributions paid to shareholders are based on net investment income and net realized gains determined on a tax basis, which may differ from net investment income and net realized gains for financial reporting purposes. These differences are due primarily to different treatment for items such as currency gains and losses; short-term capital gains and losses; capital losses related to sales of certain securities within 30 days of purchase; unrealized appreciation of certain investments in securities outside the U.S.; cost of investments sold and income on certain investments. The fiscal year in which amounts are distributed may differ from the year in which the net investment income and net realized gains are recorded by the fund for financial reporting purposes. The fund may also designate a portion of the amount paid to redeeming shareholders as a distribution for tax purposes.
During the year ended September 30, 2020, the fund reclassified $443,755,000 from total distributable earnings to capital paid in on shares of beneficial interest to align financial reporting with tax reporting.
As of September 30, 2020, the tax basis components of distributable earnings, unrealized appreciation (depreciation) and cost of investments were as follows (dollars in thousands):
| Undistributed ordinary income | | $ | 234,130 | |
| Undistributed long-term capital gains | | | 4,164,731 | |
| Post-October capital loss deferral* | | | (988,285 | ) |
| Gross unrealized appreciation on investments | | | 52,247,638 | |
| Gross unrealized depreciation on investments | | | (2,596,288 | ) |
| Net unrealized appreciation on investments | | | 49,651,350 | |
| Cost of investments | | | 62,333,595 | |
| * | This deferral is considered incurred in the subsequent year. |
Distributions paid were characterized for tax purposes as follows (dollars in thousands):
| | | Year ended September 30, 2020 | | | Year ended September 30, 2019 | |
| Share class | | Ordinary
income | | | Long-term
capital gains | | | Total
distributions
paid | | | Ordinary
income | | | Long-term
capital gains | | | Total
distributions
paid | |
| Class A | | $ | 451,802 | | | $ | 1,191,209 | | | $ | 1,643,011 | | | $ | 410,143 | | | $ | 2,218,136 | | | $ | 2,628,279 | |
| Class C | | | 4,387 | | | | 40,662 | | | | 45,049 | | | | 3,528 | | | | 82,910 | | | | 86,438 | |
| Class T | | | — | † | | | — | † | | | — | † | | | — | † | | | 1 | | | | 1 | |
| Class F-1 | | | 16,936 | | | | 47,437 | | | | 64,373 | | | | 15,194 | | | | 90,949 | | | | 106,143 | |
| Class F-2 | | | 135,265 | | | | 295,152 | | | | 430,417 | | | | 106,278 | | | | 469,285 | | | | 575,563 | |
| Class F-3 | | | 76,567 | | | | 155,358 | | | | 231,925 | | | | 54,404 | | | | 225,546 | | | | 279,950 | |
| Class 529-A | | | 22,064 | | | | 61,464 | | | | 83,528 | | | | 19,553 | | | | 114,500 | | | | 134,053 | |
| Class 529-C | | | 524 | | | | 6,752 | | | | 7,276 | | | | 377 | | | | 14,999 | | | | 15,376 | |
| Class 529-E | | | 647 | | | | 2,331 | | | | 2,978 | | | | 591 | | | | 4,655 | | | | 5,246 | |
| Class 529-T | | | — | † | | | — | † | | | — | † | | | — | † | | | 1 | | | | 1 | |
| Class 529-F-1 | | | 1,819 | | | | 4,105 | | | | 5,924 | | | | 1,592 | | | | 7,230 | | | | 8,822 | |
| Class R-1 | | | 155 | | | | 1,995 | | | | 2,150 | | | | 149 | | | | 4,541 | | | | 4,690 | |
| Class R-2 | | | 1,614 | | | | 14,879 | | | | 16,493 | | | | 1,075 | | | | 29,681 | | | | 30,756 | |
| Class R-2E | | | 407 | | | | 1,887 | | | | 2,294 | | | | 304 | | | | 3,268 | | | | 3,572 | |
| Class R-3 | | | 10,371 | | | | 41,201 | | | | 51,572 | | | | 9,972 | | | | 87,540 | | | | 97,512 | |
| Class R-4 | | | 20,128 | | | | 54,912 | | | | 75,040 | | | | 19,227 | | | | 110,262 | | | | 129,489 | |
| Class R-5E | | | 1,720 | | | | 3,809 | | | | 5,529 | | | | 1,293 | | | | 5,327 | | | | 6,620 | |
| Class R-5 | | | 21,030 | | | | 44,270 | | | | 65,300 | | | | 20,316 | | | | 87,662 | | | | 107,978 | |
| Class R-6 | | | 269,130 | | | | 545,018 | | | | 814,148 | | | | 215,828 | | | | 891,857 | | | | 1,107,685 | |
| Total | | $ | 1,034,566 | | | $ | 2,512,441 | | | $ | 3,547,007 | | | $ | 879,824 | | | $ | 4,448,350 | | | $ | 5,328,174 | |
| † | Amount less than one thousand. |
7. Fees and transactions with related parties
CRMC, the fund’s investment adviser, is the parent company of American Funds Distributors®, Inc. (“AFD”), the principal underwriter of the fund’s shares, and American Funds Service Company® (“AFS”), the fund’s transfer agent. CRMC, AFD and AFS are considered related parties to the fund.
Investment advisory services — The fund has an investment advisory and service agreement with CRMC that provides for monthly fees accrued daily. These fees are based on a series of decreasing annual rates beginning with 0.600% on the first $500 million of daily net assets and decreasing to 0.352% on such assets in excess of $89 billion. For the year ended September 30, 2020, the investment advisory services fee was $359,538,000, which was equivalent to an annualized rate of 0.372% of average daily net assets.
Class-specific fees and expenses — Expenses that are specific to individual share classes are accrued directly to the respective share class. The principal class-specific fees and expenses are further described below:
Distribution services — The fund has plans of distribution for all share classes, except Class F-2, F-3, R-5E, R-5 and R-6 shares. Under the plans, the board of trustees approves certain categories of expenses that are used to finance activities primarily intended to sell fund shares and service existing accounts. The plans provide for payments, based on an annualized percentage of average daily net assets, ranging from 0.25% to 1.00% as noted in this section. In some cases, the board of trustees has limited the amounts that may be paid to less than the maximum allowed by the plans. All share classes with a plan may use up to 0.25% of average daily net assets to pay service fees, or to compensate AFD for paying service fees, to firms that have entered into agreements with AFD to provide certain shareholder services. The remaining amounts available to be paid under each plan are paid to dealers to compensate them for their sales activities.
| Share class | | Currently approved limits | | Plan limits |
| Class A | | | 0.25 | % | | | 0.25 | % |
| Class 529-A | | | 0.25 | | | | 0.50 | |
| Classes C, 529-C and R-1 | | | 1.00 | | | | 1.00 | |
| Class R-2 | | | 0.75 | | | | 1.00 | |
| Class R-2E | | | 0.60 | | | | 0.85 | |
| Classes 529-E and R-3 | | | 0.50 | | | | 0.75 | |
| Classes T, F-1, 529-T, 529-F-1 and R-4 | | | 0.25 | | | | 0.50 | |
For Class A and 529-A shares, distribution-related expenses include the reimbursement of dealer and wholesaler commissions paid by AFD for certain shares sold without a sales charge. These share classes reimburse AFD for amounts billed within the prior 15 months but only to the extent that the overall annual expense limits are not exceeded. As of September 30, 2020, there were no unreimbursed expenses subject to reimbursement for Class A or 529-A shares.
Transfer agent services — The fund has a shareholder services agreement with AFS under which the fund compensates AFS for providing transfer agent services to each of the fund’s share classes. These services include recordkeeping, shareholder communications and transaction processing. In addition, the fund reimburses AFS for amounts paid to third parties for performing transfer agent services on behalf of fund shareholders.
Administrative services — The fund has an administrative services agreement with CRMC under which the fund compensates CRMC for providing administrative services to all share classes. Administrative services are provided by CRMC and its affiliates to help assist third parties providing non-distribution services to fund shareholders. These services include providing in-depth information on the fund and market developments that impact fund investments. Administrative services also include, but are not limited to, coordinating, monitoring and overseeing third parties that provide services to fund shareholders. The agreement provides the fund the ability to charge an administrative services fee at the annual rate of 0.05% of the daily net assets attributable to each share class of the fund. Currently the fund pays CRMC an administrative services fee at the annual rate of 0.03% of daily net assets attributable to each share class of the fund for CRMC’s provision of administrative services.
529 plan services — Each 529 share class is subject to service fees to compensate the Virginia College Savings Plan (“Virginia529”) for its oversight and administration of the CollegeAmerica 529 college savings plan. The fee is based on the combined net assets invested in Class 529 and ABLE shares of the American Funds. Class ABLE shares are offered on other American Funds by Virginia529 through ABLEAmerica®, a tax-advantaged savings program for individuals with disabilities. Prior to January 1, 2020, the quarterly fee was based on a series of decreasing annual rates beginning with 0.10% on the first $20 billion of the combined net assets invested in the American Funds and decreasing to 0.03% on such assets in excess of $100 billion. Effective January 1, 2020, the quarterly fee was amended to a series of decreasing annual rates beginning with 0.09% on the first $20 billion of the combined net assets invested in the American Funds and decreasing to 0.03% on such assets in excess of $100 billion. The fee for any given calendar quarter is accrued and calculated on the basis of the average net assets of Class 529 and ABLE shares of the American Funds for the last month of the prior calendar quarter. The fee is included in other expenses in the fund’s statement of operations. Virginia529 is not considered a related party to the fund.
For the year ended September 30, 2020, class-specific expenses under the agreements were as follows (dollars in thousands):
| Share class | | Distribution
services | | Transfer agent
services | | Administrative
services | | 529 plan
services | |
| Class A | | $111,478 | | $40,468 | | $13,508 | | Not applicable | |
| Class C | | 13,870 | | 1,268 | | 422 | | Not applicable | |
| Class T | | — | | — | * | — | * | Not applicable | |
| Class F-1 | | 4,293 | | 2,243 | | 519 | | Not applicable | |
| Class F-2 | | Not applicable | | 12,648 | | 3,482 | | Not applicable | |
| Class F-3 | | Not applicable | | 367 | | 1,885 | | Not applicable | |
| Class 529-A | | 5,386 | | 1,884 | | 697 | | $1,455 | |
| Class 529-C | | 2,017 | | 178 | | 62 | | 130 | |
| Class 529-E | | 415 | | 38 | | 25 | | 53 | |
| Class 529-T | | — | | — | * | — | * | — | * |
| Class 529-F-1 | | — | | 126 | | 47 | | 98 | |
| Class R-1 | | 673 | | 72 | | 20 | | Not applicable | |
| Class R-2 | | 3,911 | | 1,857 | | 156 | | Not applicable | |
| Class R-2E | | 386 | | 137 | | 19 | | Not applicable | |
| Class R-3 | | 7,318 | | 2,247 | | 439 | | Not applicable | |
| Class R-4 | | 4,970 | | 1,982 | | 596 | | Not applicable | |
| Class R-5E | | Not applicable | | 264 | | 52 | | Not applicable | |
| Class R-5 | | Not applicable | | 764 | | 483 | | Not applicable | |
| Class R-6 | | Not applicable | | 145 | | 6,595 | | Not applicable | |
| Total class-specific expenses | | $154,717 | | $66,688 | | $29,007 | | $1,736 | |
| * | Amount less than one thousand. |
Trustees’ deferred compensation — Trustees who are unaffiliated with CRMC may elect to defer the cash payment of part or all of their compensation. These deferred amounts, which remain as liabilities of the fund, are treated as if invested in shares of the fund or other American Funds. These amounts represent general, unsecured liabilities of the fund and vary according to the total returns of the selected funds. Trustees’ compensation of $1,740,000 in the fund’s statement of operations reflects $506,000 in current fees (either paid in cash or deferred) and a net increase of $1,234,000 in the value of the deferred amounts.
Affiliated officers and trustees — Officers and certain trustees of the fund are or may be considered to be affiliated with CRMC, AFD and AFS. No affiliated officers or trustees received any compensation directly from the fund.
Investment in CCF — The fund holds shares of CCF, an institutional prime money market fund managed by CRMC. CCF invests in high-quality, short-term money market instruments. CCF is used as the primary investment vehicle for the fund’s short-term investments. CCF shares are only available for purchase by CRMC, its affiliates, and other funds managed by CRMC or its affiliates, and are not available to the public. CRMC does not receive an investment advisory services fee from CCF.
Security transactions with related funds — The fund purchased securities from, and sold securities to, other funds managed by CRMC (or funds managed by certain affiliates of CRMC) under procedures adopted by the fund’s board of trustees. The funds involved in such transactions are considered related by virtue of having a common investment adviser (or affiliated investment advisers), common trustees and/or common officers. Each transaction was executed at the current market price of the security and no brokerage commissions or fees were paid in accordance with Rule 17a-7 of the 1940 Act. During the year ended September 30, 2020, the fund engaged in such purchase and sale transactions with related funds in the amounts of $732,041,000 and $744,233,000, respectively, which generated $26,924,000 of net realized gains from such sales.
Interfund lending — Pursuant to an exemptive order issued by the SEC, the fund, along with other CRMC-managed funds (or funds managed by certain affiliates of CRMC), may participate in an interfund lending program. The program provides an alternate credit facility that permits the funds to lend or borrow cash for temporary purposes directly to or from one another, subject to the conditions of the exemptive order. The fund did not lend or borrow cash through the interfund lending program at any time during the year ended September 30, 2020.
8. Capital share transactions
Capital share transactions in the fund were as follows (dollars and shares in thousands):
| | | Sales* | | | Reinvestments of
distributions | | | Repurchases* | | | Net (decrease)
increase | |
| Share class | | Amount | | | Shares | | | Amount | | | Shares | | | Amount | | | Shares | | | Amount | | | Shares | |
| | | | | | | | | | | | | | | | | | | | | | | | | | | | | | | | | |
| Year ended September 30, 2020 | | | | | | | | | | | | | | | | | | | | | | | | | |
| | | | | | | | | | | | | | | | | | | | | | | | | | | | | | | | | |
| Class A | | $ | 3,519,638 | | | | 75,821 | | | $ | 1,604,011 | | | | 34,084 | | | $ | (5,432,481 | ) | | | (118,494 | ) | | $ | (308,832 | ) | | | (8,589 | ) |
| Class C | | | 217,259 | | | | 4,944 | | | | 44,539 | | | | 988 | | | | (571,025 | ) | | | (12,659 | ) | | | (309,227 | ) | | | (6,727 | ) |
| Class T | | | — | | | | — | | | | — | | | | — | | | | — | | | | — | | | | — | | | | — | |
| Class F-1 | | | 339,536 | | | | 7,345 | | | | 62,989 | | | | 1,348 | | | | (586,688 | ) | | | (12,878 | ) | | | (184,163 | ) | | | (4,185 | ) |
| Class F-2 | | | 4,183,905 | | | | 90,972 | | | | 407,407 | | | | 8,694 | | | | (3,137,503 | ) | | | (69,005 | ) | | | 1,453,809 | | | | 30,661 | |
| Class F-3 | | | 2,103,915 | | | | 45,227 | | | | 229,518 | | | | 4,881 | | | | (1,161,026 | ) | | | (25,129 | ) | | | 1,172,407 | | | | 24,979 | |
| Class 529-A | | | 366,357 | | | | 7,720 | | | | 83,508 | | | | 1,798 | | | | (372,370 | ) | | | (7,976 | ) | | | 77,495 | | | | 1,542 | |
| Class 529-C | | | 24,028 | | | | 545 | | | | 7,273 | | | | 161 | | | | (189,064 | ) | | | (4,039 | ) | | | (157,763 | ) | | | (3,333 | ) |
| Class 529-E | | | 8,951 | | | | 199 | | | | 2,978 | | | | 65 | | | | (18,860 | ) | | | (408 | ) | | | (6,931 | ) | | | (144 | ) |
| Class 529-T | | | — | | | | — | | | | 1 | | | | — | † | | | — | | | | — | | | | 1 | | | | — | † |
| Class 529-F-1 | | | 36,227 | | | | 776 | | | | 5,923 | | | | 128 | | | | (34,265 | ) | | | (740 | ) | | | 7,885 | | | | 164 | |
| Class R-1 | | | 8,254 | | | | 192 | | | | 2,134 | | | | 48 | | | | (25,029 | ) | | | (564 | ) | | | (14,641 | ) | | | (324 | ) |
| Class R-2 | | | 100,434 | | | | 2,256 | | | | 16,456 | | | | 365 | | | | (162,251 | ) | | | (3,693 | ) | | | (45,361 | ) | | | (1,072 | ) |
| Class R-2E | | | 14,465 | | | | 315 | | | | 2,293 | | | | 50 | | | | (25,825 | ) | | | (568 | ) | | | (9,067 | ) | | | (203 | ) |
| Class R-3 | | | 238,054 | | | | 5,273 | | | | 51,531 | | | | 1,121 | | | | (496,936 | ) | | | (10,967 | ) | | | (207,351 | ) | | | (4,573 | ) |
| Class R-4 | | | 316,370 | | | | 7,105 | | | | 75,032 | | | | 1,619 | | | | (589,579 | ) | | | (12,920 | ) | | | (198,177 | ) | | | (4,196 | ) |
| Class R-5E | | | 102,696 | | | | 2,272 | | | | 5,529 | | | | 119 | | | | (48,720 | ) | | | (1,042 | ) | | | 59,505 | | | | 1,349 | |
| Class R-5 | | | 222,992 | | | | 4,739 | | | | 65,245 | | | | 1,389 | | | | (448,450 | ) | | | (9,838 | ) | | | (160,213 | ) | | | (3,710 | ) |
| Class R-6 | | | 4,881,455 | | | | 108,768 | | | | 813,086 | | | | 17,281 | | | | (3,784,585 | ) | | | (80,869 | ) | | | 1,909,956 | | | | 45,180 | |
| Total net increase (decrease) | | $ | 16,684,536 | | | | 364,469 | | | $ | 3,479,453 | | | | 74,139 | | | $ | (17,084,657 | ) | | | (371,789 | ) | | $ | 3,079,332 | | | | 66,819 | |
| | | | | | | | | | | | | | | | | | | | | | | | | | | | | | | | | |
| Year ended September 30, 2019 | | | | | | | | | | | | | | | | | | | | | | | | | |
| | | | | | | | | | | | | | | | | | | | | | | | | | | | | | | | | |
| Class A | | $ | 2,588,400 | | | | 60,890 | | | $ | 2,566,637 | | | | 70,706 | | | $ | (4,792,423 | ) | | | (112,893 | ) | | $ | 362,614 | | | | 18,703 | |
| Class C | | | 209,287 | | | | 5,133 | | | | 85,561 | | | | 2,457 | | | | (359,476 | ) | | | (8,829 | ) | | | (64,628 | ) | | | (1,239 | ) |
| Class T | | | — | | | | — | | | | — | | | | — | | | | — | | | | — | | | | — | | | | — | |
| Class F-1 | | | 336,606 | | | | 7,948 | | | | 103,813 | | | | 2,878 | | | | (483,670 | ) | | | (11,432 | ) | | | (43,251 | ) | | | (606 | ) |
| Class F-2 | | | 3,560,364 | | | | 83,641 | | | | 542,924 | | | | 15,019 | | | | (2,144,265 | ) | | | (51,065 | ) | | | 1,959,023 | | | | 47,595 | |
| Class F-3 | | | 1,641,819 | | | | 38,516 | | | | 275,231 | | | | 7,588 | | | | (737,204 | ) | | | (17,349 | ) | | | 1,179,846 | | | | 28,755 | |
| Class 529-A | | | 223,433 | | | | 5,306 | | | | 134,011 | | | | 3,738 | | | | (333,570 | ) | | | (7,885 | ) | | | 23,874 | | | | 1,159 | |
| Class 529-C | | | 27,897 | | | | 687 | | | | 15,361 | | | | 442 | | | | (76,075 | ) | | | (1,864 | ) | | | (32,817 | ) | | | (735 | ) |
| Class 529-E | | | 7,874 | | | | 189 | | | | 5,230 | | | | 147 | | | | (16,694 | ) | | | (402 | ) | | | (3,590 | ) | | | (66 | ) |
| Class 529-T | | | — | | | | — | | | | 1 | | | | — | † | | | — | | | | — | | | | 1 | | | | — | † |
| Class 529-F-1 | | | 41,910 | | | | 987 | | | | 8,821 | | | | 247 | | | | (24,455 | ) | | | (578 | ) | | | 26,276 | | | | 656 | |
| Class R-1 | | | 7,338 | | | | 181 | | | | 4,665 | | | | 135 | | | | (25,237 | ) | | | (617 | ) | | | (13,234 | ) | | | (301 | ) |
| Class R-2 | | | 96,909 | | | | 2,375 | | | | 30,708 | | | | 881 | | | | (153,908 | ) | | | (3,768 | ) | | | (26,291 | ) | | | (512 | ) |
| Class R-2E | | | 19,692 | | | | 469 | | | | 3,572 | | | | 100 | | | | (16,435 | ) | | | (387 | ) | | | 6,829 | | | | 182 | |
| Class R-3 | | | 227,037 | | | | 5,448 | | | | 97,429 | | | | 2,747 | | | | (486,627 | ) | | | (11,682 | ) | | | (162,161 | ) | | | (3,487 | ) |
| Class R-4 | | | 320,623 | | | | 7,581 | | | | 129,458 | | | | 3,619 | | | | (528,069 | ) | | | (12,612 | ) | | | (77,988 | ) | | | (1,412 | ) |
| Class R-5E | | | 98,097 | | | | 2,330 | | | | 6,616 | | | | 183 | | | | (21,678 | ) | | | (509 | ) | | | 83,035 | | | | 2,004 | |
| Class R-5 | | | 198,871 | | | | 4,646 | | | | 107,839 | | | | 2,976 | | | | (416,783 | ) | | | (9,864 | ) | | | (110,073 | ) | | | (2,242 | ) |
| Class R-6 | | | 3,735,193 | | | | 88,176 | | | | 1,105,773 | | | | 30,479 | | | | (1,560,014 | ) | | | (36,405 | ) | | | 3,280,952 | | | | 82,250 | |
| Total net increase (decrease) | | $ | 13,341,350 | | | | 314,503 | | | $ | 5,223,650 | | | | 144,342 | | | $ | (12,176,583 | ) | | | (288,141 | ) | | $ | 6,388,417 | | | | 170,704 | |
| * | Includes exchanges between share classes of the fund. |
| † | Amount less than one thousand. |
9. Investment transactions
The fund made purchases and sales of investment securities, excluding short-term securities and U.S. government obligations, if any, of $24,050,587,000 and $23,772,247,000, respectively, during the year ended September 30, 2020.
Financial highlights
| | | | | | Income from
investment operations1 | | | Dividends and distributions | | | | | | | | | | | | | | | | | | |
| Period ended | | Net asset
value,
beginning
of period | | | Net
investment
income
(loss) | | | Net gains on
securities (both
realized and
unrealized) | | | Total from
investment
operations | | | Dividends
(from net
investment
income) | | | Distributions
(from capital
gains) | | | Total
dividends
and
distributions | | | Net asset
value,
end
of period | | | Total
return2,3 | | | Net assets,
end of period
(in millions) | | | Ratio of
expenses to
average net
assets before
reimburse-
ments4 | | | Ratio of
expenses to
average net
assets after
reimburse-
ments3,4 | | | Ratio of
net income
(loss)
to average
net assets3 | |
| Class A: | | | | | | | | | | | | | | | | | | | | | | | | | | | | | | | | | | | | | | | | | | | | | | | | | | | | |
| 9/30/2020 | | $ | 44.52 | | | $ | .27 | | | $ | 10.76 | | | $ | 11.03 | | | $ | (.48 | ) | | $ | (1.26 | ) | | $ | (1.74 | ) | | $ | 53.81 | | | | 25.33 | % | | $ | 50,986 | | | | .75 | % | | | .75 | % | | | .57 | % |
| 9/30/2019 | | | 46.89 | | | | .37 | | | | .12 | | | | .49 | | | | (.45 | ) | | | (2.41 | ) | | | (2.86 | ) | | | 44.52 | | | | 2.55 | | | | 42,567 | | | | .75 | | | | .75 | | | | .85 | |
| 9/30/2018 | | | 43.54 | | | | .38 | | | | 5.34 | | | | 5.72 | | | | (.19 | ) | | | (2.18 | ) | | | (2.37 | ) | | | 46.89 | | | | 13.48 | | | | 43,958 | | | | .74 | | | | .74 | | | | .85 | |
| 9/30/2017 | | | 37.41 | | | | .39 | | | | 7.11 | | | | 7.50 | | | | (.29 | ) | | | (1.08 | ) | | | (1.37 | ) | | | 43.54 | | | | 20.87 | | | | 40,527 | | | | .75 | | | | .75 | | | | .98 | |
| 9/30/2016 | | | 35.80 | | | | .34 | | | | 3.48 | | | | 3.82 | | | | (.26 | ) | | | (1.95 | ) | | | (2.21 | ) | | | 37.41 | | | | 10.91 | | | | 36,897 | | | | .77 | | | | .77 | | | | .94 | |
| Class C: | | | | | | | | | | | | | | | | | | | | | | | | | | | | | | | | | | | | | | | | | | | | | | | | | | | | |
| 9/30/2020 | | | 42.46 | | | | (.08 | ) | | | 10.25 | | | | 10.17 | | | | (.14 | ) | | | (1.26 | ) | | | (1.40 | ) | | | 51.23 | | | | 24.39 | | | | 1,395 | | | | 1.49 | | | | 1.49 | | | | (.18 | ) |
| 9/30/2019 | | | 44.80 | | | | .03 | | | | .14 | | | | .17 | | | | (.10 | ) | | | (2.41 | ) | | | (2.51 | ) | | | 42.46 | | | | 1.76 | | | | 1,442 | | | | 1.52 | | | | 1.52 | | | | .07 | |
| 9/30/2018 | | | 41.82 | | | | .02 | | | | 5.14 | | | | 5.16 | | | | — | | | | (2.18 | ) | | | (2.18 | ) | | | 44.80 | | | | 12.62 | | | | 1,576 | | | | 1.53 | | | | 1.53 | | | | .06 | |
| 9/30/2017 | | | 35.98 | | | | .07 | | | | 6.85 | | | | 6.92 | | | | — | | | | (1.08 | ) | | | (1.08 | ) | | | 41.82 | | | | 19.88 | | | | 1,448 | | | | 1.55 | | | | 1.55 | | | | .18 | |
| 9/30/2016 | | | 34.53 | | | | .05 | | | | 3.35 | | | | 3.40 | | | | — | | | | (1.95 | ) | | | (1.95 | ) | | | 35.98 | | | | 10.03 | | | | 1,390 | | | | 1.57 | | | | 1.57 | | | | .14 | |
| Class T: | | | | | | | | | | | | | | | | | | | | | | | | | | | | | | | | | | | | | | | | | | | | | | | | | | | | |
| 9/30/2020 | | | 44.53 | | | | .38 | | | | 10.76 | | | | 11.14 | | | | (.58 | ) | | | (1.26 | ) | | | (1.84 | ) | | | 53.83 | | | | 25.62 | 5 | | | — | 6 | | | .50 | 5 | | | .50 | 5 | | | .82 | 5 |
| 9/30/2019 | | | 46.91 | | | | .46 | | | | .11 | | | | .57 | | | | (.54 | ) | | | (2.41 | ) | | | (2.95 | ) | | | 44.53 | | | | 2.80 | 5 | | | — | 6 | | | .53 | 5 | | | .53 | 5 | | | 1.07 | 5 |
| 9/30/2018 | | | 43.57 | | | | .47 | | | | 5.34 | | | | 5.81 | | | | (.29 | ) | | | (2.18 | ) | | | (2.47 | ) | | | 46.91 | | | | 13.71 | 5 | | | — | 6 | | | .53 | 5 | | | .53 | 5 | | | 1.04 | 5 |
| 9/30/20177,8 | | | 38.61 | | | | .27 | | | | 4.69 | | | | 4.96 | | | | — | | | | — | | | | — | | | | 43.57 | | | | 12.85 | 5,9 | | | — | 6 | | | .27 | 5,9 | | | .27 | 5,9 | | | .64 | 5,9 |
| Class F-1: | | | | | | | | | | | | | | | | | | | | | | | | | | | | | | | | | | | | | | | | | | | | | | | | | | | | |
| 9/30/2020 | | | 44.21 | | | | .24 | | | | 10.69 | | | | 10.93 | | | | (.45 | ) | | | (1.26 | ) | | | (1.71 | ) | | | 53.43 | | | | 25.27 | | | | 1,804 | | | | .79 | | | | .79 | | | | .52 | |
| 9/30/2019 | | | 46.57 | | | | .33 | | | | .12 | | | | .45 | | | | (.40 | ) | | | (2.41 | ) | | | (2.81 | ) | | | 44.21 | | | | 2.47 | | | | 1,677 | | | | .82 | | | | .82 | | | | .78 | |
| 9/30/2018 | | | 43.26 | | | | .36 | | | | 5.30 | | | | 5.66 | | | | (.17 | ) | | | (2.18 | ) | | | (2.35 | ) | | | 46.57 | | | | 13.40 | | | | 1,795 | | | | .81 | | | | .81 | | | | .79 | |
| 9/30/2017 | | | 37.19 | | | | .35 | | | | 7.07 | | | | 7.42 | | | | (.27 | ) | | | (1.08 | ) | | | (1.35 | ) | | | 43.26 | | | | 20.76 | | | | 1,717 | | | | .83 | | | | .83 | | | | .91 | |
| 9/30/2016 | | | 35.60 | | | | .32 | | | | 3.47 | | | | 3.79 | | | | (.25 | ) | | | (1.95 | ) | | | (2.20 | ) | | | 37.19 | | | | 10.83 | | | | 1,546 | | | | .84 | | | | .84 | | | | .88 | |
| Class F-2: | | | | | | | | | | | | | | | | | | | | | | | | | | | | | | | | | | | | | | | | | | | | | | | | | | | | |
| 9/30/2020 | | | 44.40 | | | | .38 | | | | 10.73 | | | | 11.11 | | | | (.58 | ) | | | (1.26 | ) | | | (1.84 | ) | | | 53.67 | | | | 25.61 | | | | 14,016 | | | | .53 | | | | .53 | | | | .80 | |
| 9/30/2019 | | | 46.81 | | | | .46 | | | | .09 | | | | .55 | | | | (.55 | ) | | | (2.41 | ) | | | (2.96 | ) | | | 44.40 | | | | 2.74 | | | | 10,234 | | | | .54 | | | | .54 | | | | 1.07 | |
| 9/30/2018 | | | 43.47 | | | | .47 | | | | 5.33 | | | | 5.80 | | | | (.28 | ) | | | (2.18 | ) | | | (2.46 | ) | | | 46.81 | | | | 13.71 | | | | 8,560 | | | | .54 | | | | .54 | | | | 1.05 | |
| 9/30/2017 | | | 37.38 | | | | .47 | | | | 7.08 | | | | 7.55 | | | | (.38 | ) | | | (1.08 | ) | | | (1.46 | ) | | | 43.47 | | | | 21.09 | | | | 5,611 | | | | .55 | | | | .55 | | | | 1.19 | |
| 9/30/2016 | | | 35.77 | | | | .42 | | | | 3.49 | | | | 3.91 | | | | (.35 | ) | | | (1.95 | ) | | | (2.30 | ) | | | 37.38 | | | | 11.13 | | | | 4,130 | | | | .55 | | | | .55 | | | | 1.18 | |
| Class F-3: | | | | | | | | | | | | | | | | | | | | | | | | | | | | | | | | | | | | | | | | | | | | | | | | | | | | |
| 9/30/2020 | | | 44.58 | | | | .43 | | | | 10.77 | | | | 11.20 | | | | (.62 | ) | | | (1.26 | ) | | | (1.88 | ) | | | 53.90 | | | | 25.74 | | | | 7,784 | | | | .42 | | | | .42 | | | | .91 | |
| 9/30/2019 | | | 46.98 | | | | .51 | | | | .08 | | | | .59 | | | | (.58 | ) | | | (2.41 | ) | | | (2.99 | ) | | | 44.58 | | | | 2.85 | | | | 5,324 | | | | .44 | | | | .44 | | | | 1.18 | |
| 9/30/2018 | | | 43.63 | | | | .52 | | | | 5.34 | | | | 5.86 | | | | (.33 | ) | | | (2.18 | ) | | | (2.51 | ) | | | 46.98 | | | | 13.81 | | | | 4,260 | | | | .45 | | | | .45 | | | | 1.16 | |
| 9/30/20177,10 | | | 37.16 | | | | .36 | | | | 6.11 | | | | 6.47 | | | | — | | | | — | | | | — | | | | 43.63 | | | | 17.41 | 9 | | | 2,478 | | | | .45 | 11 | | | .45 | 11 | | | 1.27 | 11 |
| Class 529-A: | | | | | | | | | | | | | | | | | | | | | | | | | | | | | | | | | | | | | | | | | | | | | | | | | | | | |
| 9/30/2020 | | | 43.94 | | | | .25 | | | | 10.61 | | | | 10.86 | | | | (.45 | ) | | | (1.26 | ) | | | (1.71 | ) | | | 53.09 | | | | 25.27 | | | | 2,696 | | | | .79 | | | | .79 | | | | .53 | |
| 9/30/2019 | | | 46.31 | | | | .33 | | | | .12 | | | | .45 | | | | (.41 | ) | | | (2.41 | ) | | | (2.82 | ) | | | 43.94 | | | | 2.47 | | | | 2,163 | | | | .82 | | | | .82 | | | | .78 | |
| 9/30/2018 | | | 43.05 | | | | .35 | | | | 5.27 | | | | 5.62 | | | | (.18 | ) | | | (2.18 | ) | | | (2.36 | ) | | | 46.31 | | | | 13.41 | | | | 2,227 | | | | .82 | | | | .82 | | | | .78 | |
| 9/30/2017 | | | 37.01 | | | | .35 | | | | 7.03 | | | | 7.38 | | | | (.26 | ) | | | (1.08 | ) | | | (1.34 | ) | | | 43.05 | | | | 20.76 | | | | 1,893 | | | | .82 | | | | .82 | | | | .91 | |
| 9/30/2016 | | | 35.43 | | | | .30 | | | | 3.46 | | | | 3.76 | | | | (.23 | ) | | | (1.95 | ) | | | (2.18 | ) | | | 37.01 | | | | 10.80 | | | | 1,618 | | | | .86 | | | | .86 | | | | .86 | |
See end of table for footnotes.
Financial highlights (continued)
| | | | | | Income from
investment operations1 | | | Dividends and distributions | | | | | | | | | | | | | | | | | | |
| Period ended | | Net asset
value,
beginning
of period | | | Net
investment
income
(loss) | | | Net gains on
securities (both
realized and
unrealized) | | | Total from
investment
operations | | | Dividends
(from net
investment
income) | | | Distributions
(from capital
gains) | | | Total
dividends
and
distributions | | | Net asset
value,
end
of period | | | Total
return2,3 | | | Net assets,
end of period
(in millions) | | | Ratio of
expenses to
average net
assets before
reimburse-
ments4 | | | Ratio of
expenses to
average net
assets after
reimburse-
ments3,4 | | | Ratio of
net income
(loss)
to average
net assets3 | |
| Class 529-C: | | | | | | | | | | | | | | | | | | | | | | | | | | | | | | | | | | | | | | | | | | | | | | | | | | | | |
| 9/30/2020 | | $ | 42.35 | | | $ | (.11 | ) | | $ | 10.24 | | | $ | 10.13 | | | $ | (.10 | ) | | $ | (1.26 | ) | | $ | (1.36 | ) | | $ | 51.12 | | | | 24.35 | % | | $ | 119 | | | | 1.54 | % | | | 1.54 | % | | | (.24 | )% |
| 9/30/2019 | | | 44.66 | | | | .01 | | | | .15 | | | | .16 | | | | (.06 | ) | | | (2.41 | ) | | | (2.47 | ) | | | 42.35 | | | | 1.71 | | | | 240 | | | | 1.57 | | | | 1.57 | | | | .02 | |
| 9/30/2018 | | | 41.72 | | | | (.01 | ) | | | 5.13 | | | | 5.12 | | | | — | | | | (2.18 | ) | | | (2.18 | ) | | | 44.66 | | | | 12.54 | | | | 286 | | | | 1.58 | | | | 1.58 | | | | (.03 | ) |
| 9/30/2017 | | | 35.92 | | | | .05 | | | | 6.83 | | | | 6.88 | | | | — | | | | (1.08 | ) | | | (1.08 | ) | | | 41.72 | | | | 19.80 | | | | 393 | | | | 1.60 | | | | 1.60 | | | | .13 | |
| 9/30/2016 | | | 34.49 | | | | .03 | | | | 3.35 | | | | 3.38 | | | | — | | | | (1.95 | ) | | | (1.95 | ) | | | 35.92 | | | | 9.95 | | | | 351 | | | | 1.63 | | | | 1.63 | | | | .08 | |
| Class 529-E: | | | | | | | | | | | | | | | | | | | | | | | | | | | | | | | | | | | | | | | | | | | | | | | | | | | | |
| 9/30/2020 | | | 43.44 | | | | .14 | | | | 10.49 | | | | 10.63 | | | | (.35 | ) | | | (1.26 | ) | | | (1.61 | ) | | | 52.46 | | | | 24.99 | | | | 91 | | | | 1.01 | | | | 1.01 | | | | .30 | |
| 9/30/2019 | | | 45.79 | | | | .23 | | | | .14 | | | | .37 | | | | (.31 | ) | | | (2.41 | ) | | | (2.72 | ) | | | 43.44 | | | | 2.24 | | | | 82 | | | | 1.04 | | | | 1.04 | | | | .55 | |
| 9/30/2018 | | | 42.58 | | | | .24 | | | | 5.22 | | | | 5.46 | | | | (.07 | ) | | | (2.18 | ) | | | (2.25 | ) | | | 45.79 | | | | 13.15 | | | | 89 | | | | 1.05 | | | | 1.05 | | | | .55 | |
| 9/30/2017 | | | 36.62 | | | | .26 | | | | 6.96 | | | | 7.22 | | | | (.18 | ) | | | (1.08 | ) | | | (1.26 | ) | | | 42.58 | | | | 20.47 | | | | 84 | | | | 1.06 | | | | 1.06 | | | | .67 | |
| 9/30/2016 | | | 35.07 | | | | .22 | | | | 3.42 | | | | 3.64 | | | | (.14 | ) | | | (1.95 | ) | | | (2.09 | ) | | | 36.62 | | | | 10.54 | | | | 74 | | | | 1.09 | | | | 1.09 | | | | .62 | |
| Class 529-T: | | | | | | | | | | | | | | | | | | | | | | | | | | | | | | | | | | | | | | | | | | | | | | | | | | | | |
| 9/30/2020 | | | 44.51 | | | | .36 | | | | 10.75 | | | | 11.11 | | | | (.56 | ) | | | (1.26 | ) | | | (1.82 | ) | | | 53.80 | | | | 25.55 | 5 | | | — | 6 | | | .56 | 5 | | | .56 | 5 | | | .77 | 5 |
| 9/30/2019 | | | 46.89 | | | | .44 | | | | .11 | | | | .55 | | | | (.52 | ) | | | (2.41 | ) | | | (2.93 | ) | | | 44.51 | | | | 2.73 | 5 | | | — | 6 | | | .57 | 5 | | | .57 | 5 | | | 1.03 | 5 |
| 9/30/2018 | | | 43.56 | | | | .45 | | | | 5.34 | | | | 5.79 | | | | (.28 | ) | | | (2.18 | ) | | | (2.46 | ) | | | 46.89 | | | | 13.65 | 5 | | | — | 6 | | | .59 | 5 | | | .59 | 5 | | | .99 | 5 |
| 9/30/20177,8 | | | 38.61 | | | | .26 | | | | 4.69 | | | | 4.95 | | | | — | | | | — | | | | — | | | | 43.56 | | | | 12.82 | 5,9 | | | — | 6 | | | .29 | 5,9 | | | .29 | 5,9 | | | .62 | 5,9 |
| Class 529-F-1: | | | | | | | | | | | | | | | | | | | | | | | | | | | | | | | | | | | | | | | | | | | | | | | | | |
| 9/30/2020 | | | 43.86 | | | | .35 | | | | 10.60 | | | | 10.95 | | | | (.56 | ) | | | (1.26 | ) | | | (1.82 | ) | | | 52.99 | | | | 25.55 | | | | 180 | | | | .56 | | | | .56 | | | | .76 | |
| 9/30/2019 | | | 46.28 | | | | .43 | | | | .09 | | | | .52 | | | | (.53 | ) | | | (2.41 | ) | | | (2.94 | ) | | | 43.86 | | | | 2.72 | | | | 142 | | | | .59 | | | | .59 | | | | 1.03 | |
| 9/30/2018 | | | 43.00 | | | | .45 | | | | 5.27 | | | | 5.72 | | | | (.26 | ) | | | (2.18 | ) | | | (2.44 | ) | | | 46.28 | | | | 13.67 | | | | 119 | | | | .59 | | | | .59 | | | | 1.00 | |
| 9/30/2017 | | | 36.98 | | | | .44 | | | | 7.01 | | | | 7.45 | | | | (.35 | ) | | | (1.08 | ) | | | (1.43 | ) | | | 43.00 | | | | 21.02 | | | | 97 | | | | .61 | | | | .61 | | | | 1.13 | |
| 9/30/2016 | | | 35.41 | | | | .39 | | | | 3.44 | | | | 3.83 | | | | (.31 | ) | | | (1.95 | ) | | | (2.26 | ) | | | 36.98 | | | | 11.07 | | | | 76 | | | | .63 | | | | .63 | | | | 1.09 | |
| Class R-1: | | | | | | | | | | | | | | | | | | | | | | | | | | | | | | | | | | | | | | | | | | | | | | | | | | | | |
| 9/30/2020 | | | 42.09 | | | | (.09 | ) | | | 10.17 | | | | 10.08 | | | | (.10 | ) | | | (1.26 | ) | | | (1.36 | ) | | | 50.81 | | | | 24.38 | | | | 69 | | | | 1.52 | | | | 1.52 | | | | (.21 | ) |
| 9/30/2019 | | | 44.41 | | | | .02 | | | | .15 | | | | .17 | | | | (.08 | ) | | | (2.41 | ) | | | (2.49 | ) | | | 42.09 | | | | 1.73 | | | | 71 | | | | 1.54 | | | | 1.54 | | | | .05 | |
| 9/30/2018 | | | 41.49 | | | | .02 | | | | 5.08 | | | | 5.10 | | | | — | | | | (2.18 | ) | | | (2.18 | ) | | | 44.41 | | | | 12.59 | | | | 88 | | | | 1.54 | | | | 1.54 | | | | .04 | |
| 9/30/2017 | | | 35.70 | | | | .07 | | | | 6.80 | | | | 6.87 | | | | — | | | | (1.08 | ) | | | (1.08 | ) | | | 41.49 | | | | 19.89 | | | | 85 | | | | 1.54 | | | | 1.54 | | | | .18 | |
| 9/30/2016 | | | 34.27 | | | | .05 | | | | 3.33 | | | | 3.38 | | | | — | | | | (1.95 | ) | | | (1.95 | ) | | | 35.70 | | | | 10.01 | | | | 89 | | | | 1.56 | | | | 1.56 | | | | .14 | |
| Class R-2: | | | | | | | | | | | | | | | | | | | | | | | | | | | | | | | | | | | | | | | | | | | | | | | | | | | | |
| 9/30/2020 | | | 42.52 | | | | (.09 | ) | | | 10.27 | | | | 10.18 | | | | (.14 | ) | | | (1.26 | ) | | | (1.40 | ) | | | 51.30 | | | | 24.38 | | | | 571 | | | | 1.52 | | | | 1.52 | | | | (.20 | ) |
| 9/30/2019 | | | 44.85 | | | | .02 | | | | .15 | | | | .17 | | | | (.09 | ) | | | (2.41 | ) | | | (2.50 | ) | | | 42.52 | | | | 1.73 | | | | 518 | | | | 1.54 | | | | 1.54 | | | | .06 | |
| 9/30/2018 | | | 41.87 | | | | .02 | | | | 5.14 | | | | 5.16 | | | | — | | | | (2.18 | ) | | | (2.18 | ) | | | 44.85 | | | | 12.60 | | | | 570 | | | | 1.54 | | | | 1.54 | | | | .05 | |
| 9/30/2017 | | | 36.03 | | | | .07 | | | | 6.85 | | | | 6.92 | | | | — | 12 | | | (1.08 | ) | | | (1.08 | ) | | | 41.87 | | | | 19.87 | | | | 557 | | | | 1.55 | | | | 1.55 | | | | .18 | |
| 9/30/2016 | | | 34.56 | | | | .05 | | | | 3.37 | | | | 3.42 | | | | — | | | | (1.95 | ) | | | (1.95 | ) | | | 36.03 | | | | 10.05 | | | | 536 | | | | 1.55 | | | | 1.55 | | | | .16 | |
| Class R-2E: | | | | | | | | | | | | | | | | | | | | | | | | | | | | | | | | | | | | | | | | | | | | | | | | | | | | |
| 9/30/2020 | | | 43.68 | | | | .04 | | | | 10.55 | | | | 10.59 | | | | (.27 | ) | | | (1.26 | ) | | | (1.53 | ) | | | 52.74 | | | | 24.73 | | | | 68 | | | | 1.23 | | | | 1.23 | | | | .09 | |
| 9/30/2019 | | | 46.02 | | | | .16 | | | | .13 | | | | .29 | | | | (.22 | ) | | | (2.41 | ) | | | (2.63 | ) | | | 43.68 | | | | 2.05 | | | | 65 | | | | 1.24 | | | | 1.24 | | | | .38 | |
| 9/30/2018 | | | 42.85 | | | | .15 | | | | 5.26 | | | | 5.41 | | | | (.06 | ) | | | (2.18 | ) | | | (2.24 | ) | | | 46.02 | | | | 12.92 | | | | 60 | | | | 1.24 | | | | 1.24 | | | | .33 | |
| 9/30/2017 | | | 37.01 | | | | .20 | | | | 7.00 | | | | 7.20 | | | | (.28 | ) | | | (1.08 | ) | | | (1.36 | ) | | | 42.85 | | | | 20.26 | | | | 53 | | | | 1.24 | | | | 1.24 | | | | .51 | |
| 9/30/2016 | | | 35.67 | | | | .19 | | | | 3.47 | | | | 3.66 | | | | (.37 | ) | | | (1.95 | ) | | | (2.32 | ) | | | 37.01 | | | | 10.46 | | | | 25 | | | | 1.24 | | | | 1.24 | | | | .52 | |
| | | | | | Income from
investment operations1 | | | Dividends and distributions | | | | | | | | | | | | | | | | | | |
| Period ended | | Net asset
value,
beginning
of period | | | Net
investment
income
(loss) | | | Net gains on
securities (both
realized and
unrealized) | | | Total from
investment
operations | | | Dividends
(from net
investment
income) | | | Distributions
(from capital
gains) | | | Total
dividends
and
distributions | | | Net asset
value,
end
of period | | | Total
return2,3 | | | Net assets,
end of period
(in millions) | | | Ratio of
expenses to
average net
assets before
reimburse-
ments4 | | | Ratio of
expenses to
average net
assets after
reimburse-
ments3,4 | | | Ratio of
net income
(loss)
to average
net assets3 | |
| Class R-3: | | | | | | | | | | | | | | | | | | | | | | | | | | | | | | | | | | | | | | | | | | | | | | | | | | | | |
| 9/30/2020 | | $ | 43.39 | | | $ | .11 | | | $ | 10.48 | | | $ | 10.59 | | | $ | (.32 | ) | | $ | (1.26 | ) | | $ | (1.58 | ) | | $ | 52.40 | | | | 24.91 | % | | $ | 1,557 | | | | 1.07 | % | | | 1.07 | % | | | .25 | % |
| 9/30/2019 | | | 45.73 | | | | .21 | | | | .13 | | | | .34 | | | | (.27 | ) | | | (2.41 | ) | | | (2.68 | ) | | | 43.39 | | | | 2.21 | | | | 1,488 | | | | 1.09 | | | | 1.09 | | | | .50 | |
| 9/30/2018 | | | 42.52 | | | | .22 | | | | 5.22 | | | | 5.44 | | | | (.05 | ) | | | (2.18 | ) | | | (2.23 | ) | | | 45.73 | | | | 13.09 | | | | 1,728 | | | | 1.09 | | | | 1.09 | | | | .49 | |
| 9/30/2017 | | | 36.57 | | | | .25 | | | | 6.95 | | | | 7.20 | | | | (.17 | ) | | | (1.08 | ) | | | (1.25 | ) | | | 42.52 | | | | 20.44 | | | | 1,750 | | | | 1.09 | | | | 1.09 | | | | .64 | |
| 9/30/2016 | | | 35.03 | | | | .21 | | | | 3.41 | | | | 3.62 | | | | (.13 | ) | | | (1.95 | ) | | | (2.08 | ) | | | 36.57 | | | | 10.52 | | | | 1,600 | | | | 1.11 | | | | 1.11 | | | | .60 | |
| Class R-4: | | | | | | | | | | | | | | | | | | | | | | | | | | | | | | | | | | | | | | | | | | | | | | | | | | | | |
| 9/30/2020 | | | 43.85 | | | | .25 | | | | 10.60 | | | | 10.85 | | | | (.46 | ) | | | (1.26 | ) | | | (1.72 | ) | | | 52.98 | | | | 25.30 | | | | 2,166 | | | | .77 | | | | .77 | | | | .55 | |
| 9/30/2019 | | | 46.23 | | | | .34 | | | | .11 | | | | .45 | | | | (.42 | ) | | | (2.41 | ) | | | (2.83 | ) | | | 43.85 | | | | 2.49 | | | | 1,977 | | | | .79 | | | | .79 | | | | .81 | |
| 9/30/2018 | | | 42.96 | | | | .35 | | | | 5.28 | | | | 5.63 | | | | (.18 | ) | | | (2.18 | ) | | | (2.36 | ) | | | 46.23 | | | | 13.44 | | | | 2,149 | | | | .79 | | | | .79 | | | | .80 | |
| 9/30/2017 | | | 36.94 | | | | .37 | | | | 7.01 | | | | 7.38 | | | | (.28 | ) | | | (1.08 | ) | | | (1.36 | ) | | | 42.96 | | | | 20.80 | | | | 2,092 | | | | .79 | | | | .79 | | | | .95 | |
| 9/30/2016 | | | 35.37 | | | | .32 | | | | 3.44 | | | | 3.76 | | | | (.24 | ) | | | (1.95 | ) | | | (2.19 | ) | | | 36.94 | | | | 10.84 | | | | 1,814 | | | | .81 | | | | .81 | | | | .90 | |
| Class R-5E: | | | | | | | | | | | | | | | | | | | | | | | | | | | | | | | | | | | | | | | | | | | | | | | | | | | | |
| 9/30/2020 | | | 44.22 | | | | .36 | | | | 10.68 | | | | 11.04 | | | | (.57 | ) | | | (1.26 | ) | | | (1.83 | ) | | | 53.43 | | | | 25.56 | | | | 220 | | | | .56 | | | | .56 | | | | .76 | |
| 9/30/2019 | | | 46.69 | | | | .48 | | | | .05 | | | | .53 | | | | (.59 | ) | | | (2.41 | ) | | | (3.00 | ) | | | 44.22 | | | | 2.72 | | | | 123 | | | | .57 | | | | .57 | | | | 1.13 | |
| 9/30/2018 | | | 43.40 | | | | .31 | | | | 5.47 | | | | 5.78 | | | | (.31 | ) | | | (2.18 | ) | | | (2.49 | ) | | | 46.69 | | | | 13.68 | | | | 36 | | | | .57 | | | | .57 | | | | .68 | |
| 9/30/2017 | | | 37.30 | | | | .47 | | | | 7.04 | | | | 7.51 | | | | (.33 | ) | | | (1.08 | ) | | | (1.41 | ) | | | 43.40 | | | | 20.98 | | | | 2 | | | | .59 | | | | .59 | | | | 1.17 | |
| 9/30/20167,13 | | | 39.06 | | | | .35 | | | | .23 | | | | .58 | | | | (.39 | ) | | | (1.95 | ) | | | (2.34 | ) | | | 37.30 | | | | 1.68 | 9 | | | — | 6 | | | .70 | 11 | | | .69 | 11 | | | 1.14 | 11 |
| Class R-5: | | | | | | | | | | | | | | | | | | | | | | | | | | | | | | | | | | | | | | | | | | | | | | | | | | | | |
| 9/30/2020 | | | 44.53 | | | | .40 | | | | 10.77 | | | | 11.17 | | | | (.60 | ) | | | (1.26 | ) | | | (1.86 | ) | | | 53.84 | | | | 25.68 | | | | 1,742 | | | | .46 | | | | .46 | | | | .85 | |
| 9/30/2019 | | | 46.92 | | | | .48 | | | | .10 | | | | .58 | | | | (.56 | ) | | | (2.41 | ) | | | (2.97 | ) | | | 44.53 | | | | 2.82 | | | | 1,606 | | | | .49 | | | | .49 | | | | 1.11 | |
| 9/30/2018 | | | 43.56 | | | | .50 | | | | 5.34 | | | | 5.84 | | | | (.30 | ) | | | (2.18 | ) | | | (2.48 | ) | | | 46.92 | | | | 13.79 | | | | 1,798 | | | | .49 | | | | .49 | | | | 1.10 | |
| 9/30/2017 | | | 37.44 | | | | .49 | | | | 7.10 | | | | 7.59 | | | | (.39 | ) | | | (1.08 | ) | | | (1.47 | ) | | | 43.56 | | | | 21.16 | | | | 1,691 | | | | .49 | | | | .49 | | | | 1.24 | |
| 9/30/2016 | | | 35.82 | | | | .44 | | | | 3.49 | | | | 3.93 | | | | (.36 | ) | | | (1.95 | ) | | | (2.31 | ) | | | 37.44 | | | | 11.19 | | | | 1,475 | | | | .50 | | | | .50 | | | | 1.21 | |
| Class R-6: | | | | | | | | | | | | | | | | | | | | | | | | | | | | | | | | | | | | | | | | | | | | | | | | | | | | |
| 9/30/2020 | | | 44.61 | | | | .43 | | | | 10.78 | | | | 11.21 | | | | (.62 | ) | | | (1.26 | ) | | | (1.88 | ) | | | 53.94 | | | | 25.74 | | | | 26,119 | | | | .42 | | | | .42 | | | | .91 | |
| 9/30/2019 | | | 47.00 | | | | .51 | | | | .09 | | | | .60 | | | | (.58 | ) | | | (2.41 | ) | | | (2.99 | ) | | | 44.61 | | | | 2.88 | | | | 19,586 | | | | .44 | | | | .44 | | | | 1.18 | |
| 9/30/2018 | | | 43.64 | | | | .52 | | | | 5.34 | | | | 5.86 | | | | (.32 | ) | | | (2.18 | ) | | | (2.50 | ) | | | 47.00 | | | | 13.82 | | | | 16,772 | | | | .44 | | | | .44 | | | | 1.15 | |
| 9/30/2017 | | | 37.51 | | | | .51 | | | | 7.11 | | | | 7.62 | | | | (.41 | ) | | | (1.08 | ) | | | (1.49 | ) | | | 43.64 | | | | 21.22 | | | | 12,727 | | | | .45 | | | | .45 | | | | 1.29 | |
| 9/30/2016 | | | 35.88 | | | | .45 | | | | 3.51 | | | | 3.96 | | | | (.38 | ) | | | (1.95 | ) | | | (2.33 | ) | | | 37.51 | | | | 11.26 | | | | 9,398 | | | | .45 | | | | .45 | | | | 1.25 | |
| | | Year ended September 30, |
| | | 2020 | | 2019 | | 2018 | | 2017 | | 2016 |
| Portfolio turnover rate for all share classes14 | | | 26 | %15 | | | 20 | % | | | 23 | % | | | 28 | % | | | 22 | %15 |
| 1 | Based on average shares outstanding. |
| 2 | Total returns exclude any applicable sales charges, including contingent deferred sales charges. |
| 3 | This column reflects the impact, if any, of certain reimbursements from CRMC. During one of the periods shown, CRMC reimbursed a portion of transfer agent services fees for certain share classes. |
| 4 | Ratios do not include expenses of any Central Funds. The fund indirectly bears its proportionate share of the expenses of any Central Funds. |
| 5 | All or a significant portion of assets in this class consisted of seed capital invested by CRMC and/or its affiliates. Fees for distribution services are not charged or accrued on these seed capital assets. If such fees were paid by the fund on seed capital assets, fund expenses would have been higher and net income and total return would have been lower. |
| 6 | Amount less than $1 million. |
| 7 | Based on operations for a period that is less than a full year. |
| 8 | Class T and 529-T shares began investment operations on April 7, 2017. |
| 9 | Not annualized. |
| 10 | Class F-3 shares began investment operations on January 27, 2017. |
| 11 | Annualized. |
| 12 | Amount less than $.01. |
| 13 | Class R-5E shares began investment operations on November 20, 2015. |
| 14 | Rates do not include the fund’s portfolio activity with respect to any Central Funds. |
| 15 | Includes the value of securities sold due to redemptions of shares in-kind. The rates would have been 25% and 21% for the years ended September 30, 2020, and September 30, 2016, respectively, if the value of securities sold due to in-kind redemptions were excluded. |
See notes to financial statements.
Report of Independent Registered Public Accounting Firm
To the Shareholders and Board of Trustees of New Perspective Fund:
Opinion on the Financial Statements and Financial Highlights
We have audited the accompanying statement of assets and liabilities of New Perspective Fund (the “Fund”), including the summary investment portfolio, as of September 30, 2020, the related statement of operations for the year then ended, the statements of changes in net assets for each of the two years in the period then ended, the financial highlights for each of the five years in the period then ended, and the related notes. In our opinion, the financial statements and financial highlights present fairly, in all material respects, the financial position of the Fund as of September 30, 2020, and the results of its operations for the year then ended, the changes in its net assets for each of the two years in the period then ended, and the financial highlights for each of the five years in the period then ended, in conformity with accounting principles generally accepted in the United States of America.
Basis for Opinion
These financial statements and financial highlights are the responsibility of the Fund’s management. Our responsibility is to express an opinion on the Fund’s financial statements and financial highlights based on our audits. We are a public accounting firm registered with the Public Company Accounting Oversight Board (United States) (PCAOB) and are required to be independent with respect to the Fund in accordance with the U.S. federal securities laws and the applicable rules and regulations of the Securities and Exchange Commission and the PCAOB.
We conducted our audits in accordance with the standards of the PCAOB. Those standards require that we plan and perform the audit to obtain reasonable assurance about whether the financial statements and financial highlights are free of material misstatement, whether due to error or fraud. The Fund is not required to have, nor were we engaged to perform, an audit of its internal control over financial reporting. As part of our audits we are required to obtain an understanding of internal control over financial reporting but not for the purpose of expressing an opinion on the effectiveness of the Fund’s internal control over financial reporting. Accordingly, we express no such opinion.
Our audits included performing procedures to assess the risks of material misstatement of the financial statements and financial highlights, whether due to error or fraud, and performing procedures that respond to those risks. Such procedures included examining, on a test basis, evidence regarding the amounts and disclosures in the financial statements and financial highlights. Our audits also included evaluating the accounting principles used and significant estimates made by management, as well as evaluating the overall presentation of the financial statements and financial highlights. Our procedures included confirmation of securities owned as of September 30, 2020, by correspondence with the custodian and brokers; when replies were not received from brokers, we performed other auditing procedures. We believe that our audits provide a reasonable basis for our opinion.
Deloitte & Touche LLP
Costa Mesa, California
November 6, 2020
We have served as the auditor of one or more American Funds investment companies since 1956.
As a fund shareholder, you incur two types of costs: (1) transaction costs, such as initial sales charges on purchase payments and contingent deferred sales charges on redemptions (loads), and (2) ongoing costs, including management fees, distribution and service (12b-1) fees, and other expenses. This example is intended to help you understand your ongoing costs (in dollars) of investing in the fund so you can compare these costs with the ongoing costs of investing in other mutual funds. The example is based on an investment of $1,000 invested at the beginning of the period and held for the entire six-month period (April 1, 2020, through September 30, 2020).
Actual expenses:
The first line of each share class in the table on the following page provides information about actual account values and actual expenses. You may use the information in this line, together with the amount you invested, to estimate the expenses that you paid over the period. Simply divide your account value by $1,000 (for example, an $8,600 account value divided by $1,000 = 8.6), then multiply the result by the number in the first line under the heading titled “Expenses paid during period” to estimate the expenses you paid on your account during this period.
Hypothetical example for comparison purposes:
The second line of each share class in the table on the following page provides information about hypothetical account values and hypothetical expenses based on the actual expense ratio for the share class and an assumed rate of return of 5.00% per year before expenses, which is not the actual return of the share class. The hypothetical account values and expenses may not be used to estimate the actual ending account balance or expenses you paid for the period. You may use this information to compare the ongoing costs of investing in the fund and other funds. To do so, compare this 5.00% hypothetical example with the 5.00% hypothetical examples that appear in the shareholder reports of the other funds.
Notes:
Retirement plan participants may be subject to certain fees charged by the plan sponsor, and Class F-1, F-2, F-3 and 529-F-1 shareholders may be subject to fees charged by financial intermediaries, typically ranging from 0.75% to 1.50% of assets annually depending on services offered. You can estimate the impact of these fees by adding the amount of the fees to the total estimated expenses you paid on your account during the period as calculated above. In addition, your ending account value would be lower by the amount of these fees.
Note that the expenses shown in the table on the following page are meant to highlight your ongoing costs only and do not reflect any transactional costs, such as sales charges (loads). Therefore, the second line of each share class in the table is useful in comparing ongoing costs only and will not help you determine the relative total costs of owning different funds. In addition, if these transactional costs were included, your costs would have been higher.
| | | Beginning
account value
4/1/2020 | | | Ending
account value
9/30/2020 | | | Expenses paid
during period* | | | Annualized
expense ratio | |
| Class A – actual return | | $ | 1,000.00 | | | $ | 1,393.30 | | | $ | 4.50 | | | | .75 | % |
| Class A – assumed 5% return | | | 1,000.00 | | | | 1,021.31 | | | | 3.80 | | | | .75 | |
| Class C – actual return | | | 1,000.00 | | | | 1,387.97 | | | | 8.92 | | | | 1.49 | |
| Class C – assumed 5% return | | | 1,000.00 | | | | 1,017.60 | | | | 7.54 | | | | 1.49 | |
| Class T – actual return | | | 1,000.00 | | | | 1,394.90 | | | | 3.00 | | | | .50 | |
| Class T – assumed 5% return | | | 1,000.00 | | | | 1,022.56 | | | | 2.54 | | | | .50 | |
| Class F-1 – actual return | | | 1,000.00 | | | | 1,392.87 | | | | 4.74 | | | | .79 | |
| Class F-1 – assumed 5% return | | | 1,000.00 | | | | 1,021.11 | | | | 4.00 | | | | .79 | |
| Class F-2 – actual return | | | 1,000.00 | | | | 1,394.78 | | | | 3.12 | | | | .52 | |
| Class F-2 – assumed 5% return | | | 1,000.00 | | | | 1,022.46 | | | | 2.64 | | | | .52 | |
| Class F-3 – actual return | | | 1,000.00 | | | | 1,395.31 | | | | 2.52 | | | | .42 | |
| Class F-3 – assumed 5% return | | | 1,000.00 | | | | 1,022.96 | | | | 2.13 | | | | .42 | |
| Class 529-A – actual return | | | 1,000.00 | | | | 1,392.71 | | | | 4.74 | | | | .79 | |
| Class 529-A – assumed 5% return | | | 1,000.00 | | | | 1,021.11 | | | | 4.00 | | | | .79 | |
| Class 529-C – actual return | | | 1,000.00 | | | | 1,387.60 | | | | 9.22 | | | | 1.54 | |
| Class 529-C – assumed 5% return | | | 1,000.00 | | | | 1,017.35 | | | | 7.79 | | | | 1.54 | |
| Class 529-E – actual return | | | 1,000.00 | | | | 1,391.13 | | | | 6.05 | | | | 1.01 | |
| Class 529-E – assumed 5% return | | | 1,000.00 | | | | 1,020.00 | | | | 5.11 | | | | 1.01 | |
| Class 529-T – actual return | | | 1,000.00 | | | | 1,394.50 | | | | 3.36 | | | | .56 | |
| Class 529-T – assumed 5% return | | | 1,000.00 | | | | 1,022.26 | | | | 2.84 | | | | .56 | |
| Class 529-F-1 – actual return | | | 1,000.00 | | | | 1,394.48 | | | | 3.36 | | | | .56 | |
| Class 529-F-1 – assumed 5% return | | | 1,000.00 | | | | 1,022.26 | | | | 2.84 | | | | .56 | |
| Class R-1 – actual return | | | 1,000.00 | | | | 1,387.88 | | | | 9.04 | | | | 1.51 | |
| Class R-1 – assumed 5% return | | | 1,000.00 | | | | 1,017.50 | | | | 7.64 | | | | 1.51 | |
| Class R-2 – actual return | | | 1,000.00 | | | | 1,387.97 | | | | 9.04 | | | | 1.51 | |
| Class R-2 – assumed 5% return | | | 1,000.00 | | | | 1,017.50 | | | | 7.64 | | | | 1.51 | |
| Class R-2E – actual return | | | 1,000.00 | | | | 1,389.70 | | | | 7.31 | | | | 1.22 | |
| Class R-2E – assumed 5% return | | | 1,000.00 | | | | 1,018.95 | | | | 6.17 | | | | 1.22 | |
| Class R-3 – actual return | | | 1,000.00 | | | | 1,390.64 | | | | 6.41 | | | | 1.07 | |
| Class R-3 – assumed 5% return | | | 1,000.00 | | | | 1,019.70 | | | | 5.42 | | | | 1.07 | |
| Class R-4 – actual return | | | 1,000.00 | | | | 1,392.74 | | | | 4.56 | | | | .76 | |
| Class R-4 – assumed 5% return | | | 1,000.00 | | | | 1,021.26 | | | | 3.85 | | | | .76 | |
| Class R-5E – actual return | | | 1,000.00 | | | | 1,394.31 | | | | 3.30 | | | | .55 | |
| Class R-5E – assumed 5% return | | | 1,000.00 | | | | 1,022.31 | | | | 2.79 | | | | .55 | |
| Class R-5 – actual return | | | 1,000.00 | | | | 1,395.16 | | | | 2.82 | | | | .47 | |
| Class R-5 – assumed 5% return | | | 1,000.00 | | | | 1,022.71 | | | | 2.38 | | | | .47 | |
| Class R-6 – actual return | | | 1,000.00 | | | | 1,395.59 | | | | 2.52 | | | | .42 | |
| Class R-6 – assumed 5% return | | | 1,000.00 | | | | 1,022.96 | | | | 2.13 | | | | .42 | |
| * | The “expenses paid during period” are equal to the “annualized expense ratio,” multiplied by the average account value over the period, multiplied by the number of days in the period, and divided by 365 (to reflect the one-half year period). |
We are required to advise you of the federal tax status of certain distributions received by shareholders during the fiscal year. The fund hereby designates the following amounts for the fund’s fiscal year ended September 30, 2020:
| Long-term capital gains | | $ | 2,512,441,000 | |
| Qualified dividend income | | | 100 | % |
| Corporate dividends received deduction | | $ | 579,984,000 | |
| U.S. government income that may be exempt from state taxation | | $ | 9,647,000 | |
Individual shareholders should refer to their Form 1099 or other tax information, which will be mailed in January 2021, to determine the calendar year amounts to be included on their 2020 tax returns. Shareholders should consult their tax advisors.
This page intentionally left blank.
This page intentionally left blank.
This page intentionally left blank.
This page intentionally left blank.
This page intentionally left blank.
This page intentionally left blank.
Board of trustees and other officers
Independent trustees1
| Name and year of birth | | Year first elected
a trustee
of the fund2 | | Principal occupation(s) during past five years | | Number of
portfolios in fund
complex overseen
by trustee3 | | Other directorships4
held by trustee |
| Vanessa C. L. Chang, 1952 | | 2000 | | Former Director, EL & EL Investments (real estate) | | 16 | | Edison International/ Southern California Edison; Sykes Enterprises; Transocean Ltd. |
| Pablo R. González Guajardo, 1967 | | 2014 | | CEO, Kimberly-Clark de México, S.A.B. de C.V. | | 16 | | América Móvil, S.A.B. de C.V.; Grupo Lala, S.A.B. de C.V.; Grupo Sanborns, S.A.B. de C.V.; Kimberly- Clark de México, S.A.B. de C.V. |
| Martin E. Koehler, 1957 | | 2015 | | Independent management consultant | | 3 | | None |
| Pascal Millaire, 1983 | | 2019 | | CEO, CyberCube Analytics, Inc. (cyber risk software for insurers); former Vice President and General Manager, Symantec Corporation (cybersecurity company) | | 3 | | None |
William I. Miller, 1956
Chairman of the Board (Independent and Non-Executive) | | 1992 | | President, The Wallace Foundation | | 3 | | Cummins, Inc. |
| Josette Sheeran, 1954 | | 2015 | | President and CEO, Asia Society; United Nations Special Envoy for Haiti | | 7 | | None |
| Christopher E. Stone, 1956 | | 2020 | | Professor of Practice of Public Integrity, University of Oxford, Blavatnik School of Government; former President, Open Society Foundations | | 9 | | None |
| Amy Zegart, PhD, 1967 | | 2019 | | Senior Fellow, Hoover Institution, Stanford University; Senior Fellow, Freeman Spogli Institute, Stanford University | | 3 | | Kratos Defense & Security Solutions |
| | | | | | | | | |
| Interested trustees5,6 | | | | |
| | | | | | | | | |
Name, year of birth and
position with fund | | Year first elected
a trustee or
officer
of the fund2 | | Principal occupation(s) during past five years and
positions held with affiliated entities or the principal
underwriter of the fund | | Number of
portfolios in fund
complex overseen
by trustee3 | | Other directorships4
held by trustee |
Joanna F. Jonsson, 1963
Co-President and Trustee | | 2008 | | Partner — Capital World Investors, Capital Research and Management Company; Vice Chair and President, Capital Research and Management Company; Director, The Capital Group Companies, Inc.7 | | 3 | | None |
Carl M. Kawaja, 1964
Trustee | | 2019 | | Chairman and Director, Capital Research and Management Company; Partner — Capital World Investors, Capital Research and Management Company; Partner — Capital World Investors, Capital Bank and Trust Company7; Director, The Capital Group Companies, Inc.7 | | 3 | | None |
The fund’s statement of additional information includes further details about fund trustees and is available without charge upon request by calling American Funds Service Company at (800) 421-4225 or by visiting the Capital Group website at capitalgroup.com. The address for all trustees and officers of the fund is 333 South Hope Street, Los Angeles, CA 90071, Attention: Secretary.
Other officers6
Name, year of birth and
position with fund | | Year first
elected
an officer
of the fund2 | | Principal occupation(s) during past five years and positions held with affiliated entities or
the principal underwriter of the fund |
Robert W. Lovelace, 1962
Co-President | | 2001 | | Vice Chairman of the Board and President, The Capital Group Companies, Inc.7; Chief Executive Officer and Director, Capital Research and Management Company; Partner — Capital International Investors, Capital Bank and Trust Company7; Partner — Capital International Investors, Capital Research and Management Company |
Walter R. Burkley, 1966
Executive Vice President | | 2012 | | Senior Vice President and Senior Counsel — Fund Business Management Group, Capital Research and Management Company; Director, Capital Research Company7; Director, Capital Research and Management Company |
Noriko Honda Chen, 1967
Senior Vice President | | 2015 | | Partner — Capital International Investors, Capital Research and Management Company; President and Director, Capital Research Company7; Director, The Capital Group Companies, Inc.7 |
Brady L. Enright, 1967
Senior Vice President | | 2008 | | Partner — Capital World Investors, Capital Research and Management Company; Partner — Capital World Investors, Capital Bank and Trust Company7; Director, The Capital Group Companies, Inc.7 |
Jonathan Knowles, PhD, 1961
Senior Vice President | | 1998 | | Partner — Capital World Investors, Capital International, Inc.7 |
Andraz Razen, 1975
Senior Vice President | | 2019 | | Partner — Capital World Investors, Capital Research Company7 |
Steven T. Watson, 1955
Senior Vice President | | 2019 | | Partner — Capital International Investors, Capital International, Inc.7; Director, Capital International, Inc.7 |
Michael W. Stockton, 1967
Secretary | | 2013 | | Senior Vice President — Fund Business Management Group, Capital Research and Management Company |
Brian C. Janssen, 1972
Treasurer | | 2010 | | Vice President — Investment Operations, Capital Research and Management Company |
Jennifer L. Butler, 1966
Assistant Secretary | | 2013 | | Assistant Vice President — Fund Business Management Group, Capital Research and Management Company |
Sandra Chuon, 1972
Assistant Treasurer | | 2019 | | Assistant Vice President — Investment Operations, Capital Research and Management Company |
Gregory F. Niland, 1971
Assistant Treasurer | | 2016 | | Vice President — Investment Operations, Capital Research and Management Company |
| 1 | The term independent trustee refers to a trustee who is not an “interested person” of the fund within the meaning of the Investment Company Act of 1940. |
| 2 | Trustees and officers of the fund serve until their resignation, removal or retirement. |
| 3 | Funds managed by Capital Research and Management Company or its affiliates. |
| 4 | This includes all directorships/trusteeships (other than those in the American Funds or other funds managed by Capital Research and Management Company or its affiliates) that are held by each trustee as a trustee or director of a public company or a registered investment company. |
| 5 | The term interested trustee refers to a trustee who is an “interested person” within the meaning of the Investment Company Act of 1940, on the basis of their affiliation with the fund’s investment adviser, Capital Research and Management Company, or affiliated entities (including the fund’s principal underwriter). |
| 6 | All of the trustees and/or officers listed are officers and/or directors/trustees of one or more of the other funds for which Capital Research and Management Company serves as investment adviser. |
| 7 | Company affiliated with Capital Research and Management Company. |
Office of the fund
333 South Hope Street
Los Angeles, CA 90071-1406
Investment adviser
Capital Research and Management
Company
333 South Hope Street
Los Angeles, CA 90071-1406
Transfer agent for shareholder accounts
American Funds Service Company
(Write to the address near you.)
P.O. Box 6007
Indianapolis, IN 46206-6007
P.O. Box 2280
Norfolk, VA 23501-2280
Custodian of assets
JPMorgan Chase Bank
270 Park Avenue
New York, NY 10017-2070
Counsel
Dechert LLP
One Bush Street, Suite 1600
San Francisco, CA 94104-4446
Independent registered public accounting firm
Deloitte & Touche LLP
695 Town Center Drive
Suite 1000
Costa Mesa, CA 92626-7188
Principal underwriter
American Funds Distributors, Inc.
333 South Hope Street
Los Angeles, CA 90071-1406
Investors should carefully consider investment objectives, risks, charges and expenses. This and other important information is contained in the fund prospectus and summary prospectus, which can be obtained from your financial professional and should be read carefully before investing. You may also call American Funds Service Company (AFS) at (800) 421-4225 or visit the Capital Group website at capitalgroup.com.
“American Funds Proxy Voting Procedures and Principles” — which describes how we vote proxies relating to portfolio securities — is available on our website or upon request by calling AFS. The fund files its proxy voting record with the U.S. Securities and Exchange Commission (SEC) for the 12 months ended June 30 by August 31. The proxy voting record is available free of charge on the SEC website at sec.gov and on our website.
A complete September 30, 2020, portfolio of New Perspective Fund’s investments is available free of charge by calling AFS or visiting the SEC website (where it is part of Form N-CSR).
New Perspective Fund files a complete list of its portfolio holdings with the SEC for the first and third quarters of each fiscal year on Form NPORT-P. This filing is available free of charge on the SEC website. Additionally, the list of portfolio holdings is available by calling AFS.
This report is for the information of shareholders of New Perspective Fund, but it also may be used as sales literature when preceded or accompanied by the current prospectus or summary prospectus, which gives details about charges, expenses, investment objectives and operating policies of the fund. If used as sales material after December 31, 2020, this report must be accompanied by an American Funds statistical update for the most recently completed calendar quarter.
MCSI has not approved, reviewed or produced this report, makes no express or implied warranties or representations and is not liable whatsoever for any data in the report. You may not redistribute the MSCI data or use it as a basis for other indices or investment products.
The Standard & Poor’s 500 Composite Index (“Index”) is a product of S&P Dow Jones Indices LLC and/or its affiliates and has been licensed for use by Capital Group. Copyright© 2020 S&P Dow Jones Indices LLC, a division of S&P Global, and/or its affiliates. All rights reserved. Redistribution or reproduction in whole or in part are prohibited without written permission of S&P Dow Jones Indices LLC.
American Funds Distributors, Inc., member FINRA.
The Capital Advantage®
Since 1931, Capital Group, home of American Funds, has helped investors pursue long-term investment success. Our consistent approach — in combination with The Capital SystemSM — has resulted in superior outcomes.
| | Aligned with investor success |
| | We base our decisions on a long-term perspective, which we believe aligns our goals with the interests of our clients. Our portfolio managers average 28 years of investment industry experience, including 22 years at our company, reflecting a career commitment to our long-term approach.1 |
| | |
| | The Capital System |
| | The Capital System combines individual accountability with teamwork. Funds using The Capital System are divided into portions that are managed independently by investment professionals with diverse backgrounds, ages and investment approaches. An extensive global research effort is the backbone of our system. |
| | |
| | American Funds’ superior outcomes |
| | Equity funds have beaten their Lipper peer indexes in 92% of 10-year periods and 99% of 20-year periods.2 Fixed income funds have helped investors achieve diversification through attention to correlation between bonds and equities.3 Fund management fees have been among the lowest in the industry.4 |
| | |
| | 1 | Investment industry experience as of December 31, 2019. |
| | 2 | Based on Class F-2 share results for rolling periods through December 31, 2019. Periods covered are the shorter of the fund’s lifetime or since the comparable Lipper index inception date (except Capital Income Builder and SMALLCAP World Fund, for which the Lipper average was used). Expenses differ for each share class, so results will vary. |
| | 3 | Based on Class F-2 share results as of December 31, 2019. Fifteen of the 17 fixed income American Funds that have been in existence for the three-year period showed a three-year correlation below 0.2. Standard & Poor’s 500 Composite Index was used as an equity market proxy. Correlation based on monthly total returns. Correlation is a statistical measure of how two securities move in relation to each other. A correlation ranges from –1 to 1. A positive correlation close to 1 implies that as one security moves, either up or down, the other security will move in “lockstep,” in the same direction. A negative correlation close to –1 indicates that the securities have moved in the opposite direction. |
| | 4 | On average, our management fees were in the lowest quintile 65% of the time, based on the 20-year period ended December 31, 2019, versus comparable Lipper categories, excluding funds of funds. |
Class F-2 shares were first offered on August 1, 2008. Class F-2 share results prior to the date of first sale are hypothetical based on the results of the original share class of the fund without a sales charge, adjusted for typical estimated expenses. Results for certain funds with an inception date after August 1, 2008, also include hypothetical returns because those funds’ Class F-2 shares sold after the funds’ date of first offering. Please see capitalgroup.com for more information on specific expense adjustments and the actual dates of first sale.
All Capital Group trademarks mentioned are owned by The Capital Group Companies, Inc., an affiliated company or fund. All other company and product names mentioned are the property of their respective companies.

ITEM 2 – Code of Ethics
The Registrant has adopted a Code of Ethics that applies to its Principal Executive Officer and Principal Financial Officer. The Registrant undertakes to provide to any person without charge, upon request, a copy of the Code of Ethics. Such request can be made by calling 800/421-4225 or to the Secretary of the Registrant, 333 South Hope Street, Los Angeles, California 90071.
ITEM 3 – Audit Committee Financial Expert
The Registrant’s board has determined that Pablo R. González Guajardo, a member of the Registrant’s audit committee, is an “audit committee financial expert” and "independent," as such terms are defined in this Item. This designation will not increase the designee’s duties, obligations or liability as compared to his or her duties, obligations and liability as a member of the audit committee and of the board, nor will it reduce the responsibility of the other audit committee members. There may be other individuals who, through education or experience, would qualify as "audit committee financial experts" if the board had designated them as such. Most importantly, the board believes each member of the audit committee contributes significantly to the effective oversight of the Registrant’s financial statements and condition.
ITEM 4 – Principal Accountant Fees and Services
| Registrant: | | |
| a) Audit Fees: | | |
| Audit | 2019 | 2,000 |
| | 2020 | 209,000 |
| | | |
| b) Audit-Related Fees: | | |
| | 2019 | 19,000 |
| | 2020 | 21,000 |
| | | |
| c) Tax Fees: | | |
| | 2019 | 14,000 |
| | 2020 | 18,000 |
| | The tax fees consist of professional services relating to the preparation of the Registrant’s tax returns. | |
| | | |
| d) All Other Fees: | | |
| | 2019 | None |
| | 2020 | None |
| | | |
| | Adviser and affiliates (includes only fees for non-audit services billed to the adviser and affiliates for engagements that relate directly to the operations and financial reporting of the Registrant and were subject to the pre-approval policies described below): | |
| a) Audit Fees: | | |
| | Not Applicable | |
| | | |
| b) Audit-Related Fees: | | |
| | 2019 | 1,440,000 |
| | 2020 | 1,873,000 |
| | The audit-related fees consist of assurance and related services relating to the examination of the Registrant’s transfer agent, principal underwriter and investment adviser conducted in accordance with Statement on Standards for Attestation Engagements Number 18 issued by the American Institute of Certified Public Accountants. | |
| | | |
| c) Tax Fees: | | |
| | 2019 | 78,000 |
| | 2020 | 68,000 |
| | The tax fees consist of consulting services relating to the Registrant’s investments. | |
| | | |
| | | |
| d) All Other Fees: | | |
| | 2019 | None |
| | 2020 | 2,000 |
| | The other fees consist of subscription services related to an accounting research tool. | |
| | | |
| | | |
| | All audit and permissible non-audit services that the Registrant’s audit committee considers compatible with maintaining the independent registered public accounting firm’s independence are required to be pre-approved by the committee. The pre-approval requirement will extend to all non-audit services provided to the Registrant, the investment adviser, and any entity controlling, controlled by, or under common control with the investment adviser that provides ongoing services to the Registrant, if the engagement relates directly to the operations and financial reporting of the Registrant. The committee will not delegate its responsibility to pre-approve these services to the investment adviser. The committee may delegate to one or more committee members the authority to review and pre-approve audit and permissible non-audit services. Actions taken under any such delegation will be reported to the full committee at its next meeting. The pre-approval requirement is waived with respect to non-audit services if certain conditions are met. The pre-approval requirement was not waived for any of the non-audit services listed above provided to the Registrant, adviser and affiliates. | |
| | | |
| | Aggregate non-audit fees paid to the Registrant’s auditors, including fees for all services billed to the Registrant, adviser and affiliates that provide ongoing services to the Registrant, were $1,551,000 for fiscal year 2019 and $1,981,000 for fiscal year 2020. The non-audit services represented by these amounts were brought to the attention of the committee and considered to be compatible with maintaining the auditors’ independence. | |
ITEM 5 – Audit Committee of Listed Registrants
Not applicable to this Registrant, insofar as the Registrant is not a listed issuer as defined in Rule 10A-3 under the Securities Exchange Act of 1934.
ITEM 6 – Schedule of Investments

New Perspective Fund®
Investment portfolio
September 30, 2020
Common stocks 95.78%
Information technology 22.99% | Shares | Value
(000) |
| Microsoft Corp. | 15,931,615 | $3,350,897 |
| Taiwan Semiconductor Manufacturing Company, Ltd.1 | 208,775,941 | 3,135,517 |
| Taiwan Semiconductor Manufacturing Company, Ltd. (ADR) | 1,500,631 | 121,656 |
| ASML Holding NV1 | 3,839,942 | 1,415,920 |
| ASML Holding NV (New York registered) (ADR) | 1,842,254 | 680,289 |
| Mastercard Inc., Class A | 6,058,408 | 2,048,772 |
| PayPal Holdings, Inc.2 | 6,753,719 | 1,330,685 |
| Broadcom Inc. | 3,550,760 | 1,293,613 |
| Visa Inc., Class A | 6,011,295 | 1,202,079 |
| Shopify Inc., Class A, subordinate voting shares2 | 1,009,646 | 1,032,838 |
| Adobe Inc.2 | 2,011,759 | 986,627 |
| Samsung Electronics Co., Ltd.1 | 19,139,258 | 964,344 |
| Keyence Corp.1 | 1,342,740 | 625,774 |
| ServiceNow, Inc.2 | 1,024,196 | 496,735 |
| GoDaddy Inc., Class A2 | 6,352,671 | 482,612 |
| Advanced Micro Devices, Inc.2 | 5,472,068 | 448,655 |
| Apple Inc. | 3,685,847 | 426,858 |
| Temenos AG1 | 2,882,645 | 388,195 |
| TE Connectivity Ltd. | 3,860,925 | 377,367 |
| SAP SE1 | 2,358,249 | 367,235 |
| Autodesk, Inc.2 | 1,573,718 | 363,545 |
| Trimble Inc.2 | 7,277,583 | 354,418 |
| Smartsheet Inc., Class A2,3 | 6,736,421 | 332,914 |
| Amadeus IT Group SA, Class A, non-registered shares1 | 4,185,258 | 232,265 |
| Worldline SA, non-registered shares1,2 | 2,773,013 | 227,381 |
| Zendesk, Inc.2 | 1,897,991 | 195,341 |
| Alteryx, Inc., Class A2,4 | 1,630,177 | 185,107 |
| Global Payments Inc. | 1,038,006 | 184,329 |
| Edenred SA1 | 3,761,392 | 168,756 |
| Tokyo Electron Ltd.1 | 644,308 | 168,634 |
| FleetCor Technologies, Inc.2 | 699,458 | 166,541 |
| ON Semiconductor Corp.2 | 7,593,270 | 164,698 |
| Motorola Solutions, Inc. | 961,971 | 150,847 |
| Micron Technology, Inc.2 | 3,050,139 | 143,234 |
| STMicroelectronics NV1 | 4,466,688 | 136,535 |
| Halma PLC1 | 4,295,453 | 129,467 |
| Dell Technologies Inc., Class C2 | 1,839,870 | 124,541 |
| Cree, Inc.2 | 1,944,267 | 123,928 |
| CDK Global, Inc. | 2,669,202 | 116,350 |
| Infosys Ltd. (ADR) | 7,675,275 | 105,995 |
| VeriSign, Inc.2 | 499,471 | 102,317 |
| Texas Instruments Inc. | 700,000 | 99,953 |
| Fidelity National Information Services, Inc. | 634,808 | 93,450 |
| FLIR Systems, Inc. | 2,497,357 | 89,530 |
| Workday, Inc., Class A2 | 361,274 | 77,721 |
| NetApp, Inc. | 1,531,167 | 67,126 |
| Nokia Corp.1,2 | 16,563,004 | 64,920 |
New Perspective Fund — Page 1 of 8
Common stocks (continued)
Information technology (continued) | Shares | Value
(000) |
| Intel Corp. | 1,153,276 | $59,717 |
| MediaTek Inc.1 | 1,620,000 | 34,161 |
| Largan Precision Co., Ltd.1 | 47,000 | 5,491 |
| | | 25,645,880 |
| Consumer discretionary 18.80% | | |
| Tesla, Inc.2 | 16,920,148 | 7,258,914 |
| Amazon.com, Inc.2 | 1,207,504 | 3,802,104 |
| NIKE, Inc., Class B | 7,850,432 | 985,543 |
| Prosus NV1,2 | 9,396,927 | 866,566 |
| LVMH Moët Hennessy-Louis Vuitton SE1 | 1,643,062 | 768,125 |
| Kering SA1 | 940,482 | 624,842 |
| MercadoLibre, Inc.2 | 539,465 | 583,960 |
| Hermès International1 | 612,842 | 528,260 |
| Naspers Ltd., Class N1,2 | 2,843,448 | 501,518 |
| Booking Holdings Inc.2 | 276,732 | 473,400 |
| adidas AG1,2 | 1,272,430 | 411,839 |
| EssilorLuxottica1,2 | 2,488,602 | 338,414 |
| Hilton Worldwide Holdings Inc. | 3,823,452 | 326,217 |
| Home Depot, Inc. | 1,137,221 | 315,818 |
| Hyundai Motor Co.1 | 1,907,873 | 290,803 |
| Industria de Diseño Textil, SA1 | 9,234,984 | 256,758 |
| Suzuki Motor Corp.1 | 5,758,325 | 246,638 |
| Delivery Hero SE1,2 | 1,999,514 | 230,005 |
| Restaurant Brands International Inc. | 3,788,776 | 217,893 |
| Trip.com Group Ltd. (ADR)2 | 6,996,354 | 217,866 |
| Flutter Entertainment PLC (GBP denominated)1 | 1,346,220 | 212,016 |
| Renault SA1,2 | 7,449,413 | 192,285 |
| Galaxy Entertainment Group Ltd.1 | 25,505,000 | 172,627 |
| Peugeot SA1,2 | 8,551,205 | 154,181 |
| Melco Resorts & Entertainment Ltd. (ADR) | 8,759,727 | 145,849 |
| InterContinental Hotels Group PLC1,2 | 2,564,584 | 134,643 |
| Hilton Grand Vacations Inc.2,3 | 5,456,290 | 114,473 |
| Cie. Financière Richemont SA, Class A1 | 1,468,364 | 98,352 |
| Domino’s Pizza, Inc. | 223,064 | 94,865 |
| YUM! Brands, Inc. | 1,010,014 | 92,214 |
| General Motors Company | 2,996,828 | 88,676 |
| Wynn Macau, Ltd.1,2 | 47,631,918 | 76,248 |
| Nitori Holdings Co., Ltd.1 | 334,300 | 69,531 |
| Valeo SA, non-registered shares1 | 1,058,991 | 32,366 |
| Evolution Gaming Group AB1 | 433,990 | 28,687 |
| Sodexo SA1 | 199,769 | 14,226 |
| Samsonite International SA1,2 | 12,516,700 | 12,773 |
| | | 20,979,495 |
| Health care 13.50% | | |
| Intuitive Surgical, Inc.2 | 1,664,012 | 1,180,683 |
| Vertex Pharmaceuticals Inc.2 | 3,916,394 | 1,065,729 |
| AstraZeneca PLC1 | 9,580,002 | 1,042,697 |
| Thermo Fisher Scientific Inc. | 2,055,408 | 907,504 |
| BeiGene, Ltd. (ADR)2 | 3,006,235 | 861,106 |
| Seattle Genetics, Inc.2 | 3,868,911 | 757,107 |
| Regeneron Pharmaceuticals, Inc.2 | 1,278,718 | 715,801 |
| Boston Scientific Corp.2 | 18,652,342 | 712,706 |
| Zoetis Inc., Class A | 4,283,079 | 708,293 |
New Perspective Fund — Page 2 of 8
Common stocks (continued)
Health care (continued) | Shares | Value
(000) |
| Pfizer Inc. | 15,284,410 | $560,938 |
| Danaher Corp. | 2,323,706 | 500,364 |
| Insulet Corp.2 | 1,990,627 | 470,962 |
| Novo Nordisk A/S, Class B1 | 5,833,356 | 405,195 |
| IDEXX Laboratories, Inc.2 | 967,088 | 380,172 |
| Abbott Laboratories | 3,101,394 | 337,525 |
| Edwards Lifesciences Corp.2 | 4,161,182 | 332,146 |
| Koninklijke Philips NV (EUR denominated)1,2 | 6,876,387 | 323,948 |
| Incyte Corp.2 | 3,566,070 | 320,019 |
| Ultragenyx Pharmaceutical Inc.2,3 | 3,726,135 | 306,251 |
| NovoCure Ltd.2 | 2,704,548 | 301,043 |
| CRISPR Therapeutics AG2 | 3,218,342 | 269,182 |
| Teva Pharmaceutical Industries Ltd. (ADR)2 | 21,430,672 | 193,090 |
| Coloplast A/S, Class B1 | 1,031,475 | 163,126 |
| Grifols, SA, Class B (ADR) | 9,250,000 | 160,488 |
| Sanofi1 | 1,479,425 | 148,341 |
| bioMérieux SA1 | 852,257 | 133,412 |
| Olympus Corp.1 | 6,402,800 | 132,904 |
| Shionogi & Co., Ltd.1 | 2,458,300 | 131,522 |
| Galapagos NV1,2 | 911,551 | 129,473 |
| Bayer AG1 | 1,954,133 | 122,135 |
| Baxter International Inc. | 1,500,000 | 120,630 |
| Novartis AG1 | 1,381,208 | 120,029 |
| Mettler-Toledo International Inc.2 | 118,974 | 114,899 |
| WuXi Biologics (Cayman) Inc.1,2 | 4,431,500 | 108,751 |
| Agios Pharmaceuticals, Inc.2 | 2,959,798 | 103,593 |
| Lonza Group AG1 | 159,735 | 98,601 |
| Straumann Holding AG1 | 95,678 | 96,258 |
| Fisher & Paykel Healthcare Corp. Ltd.1 | 4,353,082 | 95,819 |
| Tandem Diabetes Care, Inc.2 | 667,781 | 75,793 |
| Vir Biotechnology, Inc.2 | 2,206,591 | 75,752 |
| Daiichi Sankyo Company, Ltd.1 | 2,046,900 | 62,898 |
| Gilead Sciences, Inc. | 935,557 | 59,118 |
| Merck & Co., Inc. | 505,947 | 41,968 |
| Eli Lilly and Company | 278,092 | 41,163 |
| Teladoc Health, Inc.2,4 | 165,945 | 36,382 |
| Roche Holding AG, nonvoting, non-registered shares1 | 63,972 | 21,887 |
| Bluebird Bio, Inc.2 | 134,769 | 7,271 |
| Allakos Inc.2,4 | 72,223 | 5,883 |
| Sarepta Therapeutics, Inc.2 | 33,464 | 4,699 |
| | | 15,065,256 |
| Communication services 9.47% | | |
| Facebook, Inc., Class A2 | 13,945,897 | 3,652,430 |
| Alphabet Inc., Class C2 | 727,133 | 1,068,595 |
| Alphabet Inc., Class A2 | 632,981 | 927,697 |
| Netflix, Inc.2 | 3,510,735 | 1,755,473 |
| Activision Blizzard, Inc. | 6,373,109 | 515,903 |
| SoftBank Group Corp.1 | 6,328,500 | 390,767 |
| Cellnex Telecom, SA, non-registered shares1 | 6,321,630 | 384,202 |
| América Móvil, SAB de CV, Series L (ADR)4 | 30,105,176 | 376,014 |
| Sea Ltd., Class A (ADR)2 | 2,199,991 | 338,887 |
| Nintendo Co., Ltd.1 | 345,000 | 196,126 |
| Adevinta ASA1,2 | 10,139,267 | 173,887 |
| Z Holdings Corp.1 | 24,714,900 | 165,124 |
New Perspective Fund — Page 3 of 8
Common stocks (continued)
Communication services (continued) | Shares | Value
(000) |
| Vodafone Group PLC1 | 95,576,085 | $126,799 |
| Snap Inc., Class A2 | 4,196,058 | 109,559 |
| Koninklijke KPN NV1 | 44,582,227 | 104,829 |
| Twitter, Inc.2 | 2,000,000 | 89,000 |
| Electronic Arts Inc.2 | 559,127 | 72,916 |
| Altice USA, Inc., Class A2 | 2,030,276 | 52,787 |
| Spotify Technology SA2 | 142,272 | 34,511 |
| Bharti Airtel Ltd.1 | 4,184,975 | 23,970 |
| Live Nation Entertainment, Inc.2 | 196,000 | 10,560 |
| | | 10,570,036 |
| Financials 9.05% | | |
| AIA Group Ltd.1 | 131,061,400 | 1,291,109 |
| JPMorgan Chase & Co. | 12,762,048 | 1,228,602 |
| London Stock Exchange Group PLC1 | 8,949,954 | 1,023,882 |
| Moody’s Corp. | 2,835,843 | 821,969 |
| CME Group Inc., Class A | 4,758,456 | 796,137 |
| BlackRock, Inc. | 906,419 | 510,812 |
| Chubb Ltd. | 4,093,269 | 475,310 |
| Hong Kong Exchanges and Clearing Ltd.1 | 9,463,300 | 444,817 |
| DNB ASA1,2 | 27,108,265 | 374,411 |
| Intercontinental Exchange, Inc. | 3,114,812 | 311,637 |
| Deutsche Boerse AG1 | 1,379,369 | 242,244 |
| UBS Group AG1 | 20,627,767 | 230,281 |
| ICICI Bank Ltd.1,2 | 22,240,773 | 107,889 |
| ICICI Bank Ltd. (ADR)2 | 10,778,729 | 105,955 |
| Aon PLC, Class A | 893,454 | 184,320 |
| Arch Capital Group Ltd.2 | 6,258,120 | 183,050 |
| SVB Financial Group2 | 683,604 | 164,489 |
| Hiscox Ltd.1,2 | 13,988,882 | 161,009 |
| AXA SA1 | 7,713,722 | 142,398 |
| Prudential PLC1 | 8,782,809 | 125,390 |
| Bank of America Corp. | 4,981,312 | 120,000 |
| Everest Re Group, Ltd. | 535,747 | 105,831 |
| Banco Bilbao Vizcaya Argentaria, SA1 | 36,496,509 | 100,868 |
| Fairfax Financial Holdings Ltd., subordinate voting shares | 310,102 | 91,315 |
| TMX Group Ltd. | 805,130 | 82,802 |
| Willis Towers Watson PLC | 381,288 | 79,621 |
| QBE Insurance Group Ltd.1 | 12,430,371 | 76,930 |
| UniCredit SpA1,2 | 8,502,768 | 70,120 |
| Morgan Stanley | 1,262,721 | 61,053 |
| RenaissanceRe Holdings Ltd. | 323,416 | 54,897 |
| Sumitomo Mitsui Financial Group, Inc.1,4 | 1,925,000 | 53,565 |
| Goldman Sachs Group, Inc. | 260,720 | 52,397 |
| Macquarie Group Ltd.1 | 582,615 | 50,045 |
| Société Générale1,2 | 3,326,215 | 44,014 |
| Skandinaviska Enskilda Banken AB, Class A1,2 | 4,448,555 | 39,378 |
| Discovery Ltd.1 | 5,095,651 | 38,873 |
| Aviva PLC1 | 9,205,256 | 33,849 |
| Barclays PLC1,2 | 16,662,946 | 20,968 |
| | | 10,102,237 |
New Perspective Fund — Page 4 of 8
Common stocks (continued)
Industrials 6.95% | Shares | Value
(000) |
| DSV Panalpina A/S1 | 4,373,697 | $713,741 |
| Honeywell International Inc. | 4,295,196 | 707,032 |
| Safran SA1,2 | 5,527,719 | 543,949 |
| Nidec Corp.1 | 5,749,332 | 534,694 |
| ASSA ABLOY AB, Class B1 | 18,624,144 | 434,707 |
| Airbus SE, non-registered shares1,2 | 5,478,133 | 397,629 |
| Copart, Inc.2 | 3,305,168 | 347,571 |
| Komatsu Ltd.1 | 14,093,600 | 310,265 |
| Equifax Inc. | 1,950,085 | 305,968 |
| SMC Corp.1 | 547,200 | 304,548 |
| Lennox International Inc. | 1,100,633 | 300,044 |
| ABB Ltd.1 | 11,466,509 | 290,619 |
| IDEX Corp. | 1,538,022 | 280,551 |
| Ryanair Holdings PLC (ADR)2 | 3,288,823 | 268,894 |
| AB Volvo, Class B1,2 | 12,456,814 | 239,253 |
| Spirax-Sarco Engineering PLC1 | 1,515,205 | 215,425 |
| Boeing Company | 973,881 | 160,944 |
| TransDigm Group Inc. | 308,162 | 146,414 |
| Aalberts NV, non-registered shares1 | 3,940,723 | 142,311 |
| Experian PLC1 | 3,518,697 | 131,673 |
| Epiroc AB, Class B1 | 4,528,047 | 62,977 |
| Epiroc AB, Class A1 | 4,183,340 | 60,718 |
| RELX PLC1 | 4,742,187 | 104,968 |
| PageGroup PLC1,2,3 | 17,021,049 | 82,071 |
| Westinghouse Air Brake Technologies Corp. | 1,324,457 | 81,957 |
| Aggreko PLC1,3 | 16,529,649 | 78,371 |
| BAE Systems PLC1 | 12,012,859 | 74,306 |
| Carrier Global Corp. | 2,217,406 | 67,720 |
| Uber Technologies, Inc.2 | 1,838,673 | 67,075 |
| Meggitt PLC1,2 | 18,773,152 | 62,257 |
| Northrop Grumman Corp. | 160,810 | 50,734 |
| Recruit Holdings Co., Ltd.1 | 1,220,683 | 48,433 |
| MTU Aero Engines AG1 | 226,261 | 37,631 |
| Techtronic Industries Co. Ltd.1 | 2,533,500 | 33,315 |
| General Electric Co. | 4,107,517 | 25,590 |
| JGC Holdings Corp.1 | 1,786,462 | 18,556 |
| Bunzl PLC1 | 321,000 | 10,357 |
| DCC PLC1 | 129,000 | 9,941 |
| | | 7,753,209 |
| Consumer staples 5.47% | | |
| Nestlé SA1 | 9,797,150 | 1,162,325 |
| Costco Wholesale Corp. | 2,213,980 | 785,963 |
| Mondelez International, Inc. | 9,704,778 | 557,540 |
| British American Tobacco PLC1 | 9,338,945 | 335,669 |
| Carlsberg A/S, Class B1,4 | 2,490,460 | 335,341 |
| Anheuser-Busch InBev SA/NV1 | 5,613,229 | 302,989 |
| Pernod Ricard SA1 | 1,843,174 | 294,152 |
| L’Oréal SA, bonus shares1 | 686,197 | 223,290 |
| L’Oréal SA, non-registered shares1 | 195,803 | 63,715 |
| Philip Morris International Inc. | 3,435,128 | 257,600 |
| Colgate-Palmolive Company | 3,292,914 | 254,048 |
| Reckitt Benckiser Group PLC1 | 2,437,884 | 237,677 |
| Walgreens Boots Alliance, Inc. | 4,223,449 | 151,706 |
| Unilever NV (EUR denominated)1 | 2,295,703 | 138,592 |
New Perspective Fund — Page 5 of 8
Common stocks (continued)
Consumer staples (continued) | Shares | Value
(000) |
| Shiseido Company, Ltd.1 | 2,408,100 | $138,178 |
| Danone SA1 | 1,955,756 | 126,501 |
| Unilever PLC1 | 2,019,740 | 124,452 |
| KOSÉ Corp.1 | 946,800 | 115,765 |
| General Mills, Inc. | 1,615,989 | 99,674 |
| Godrej Consumer Products Ltd.1 | 9,060,047 | 89,275 |
| Associated British Foods PLC1 | 3,270,314 | 78,778 |
| PepsiCo, Inc. | 546,322 | 75,720 |
| Uni-Charm Corp.1 | 1,297,100 | 57,947 |
| Fomento Económico Mexicano, SAB de CV | 9,949,300 | 56,065 |
| Japan Tobacco Inc.1 | 2,036,900 | 37,195 |
| | | 6,100,157 |
| Materials 5.08% | | |
| Koninklijke DSM NV1 | 5,217,736 | 859,861 |
| Vale SA, ordinary nominative (ADR) | 58,699,457 | 621,040 |
| Vale SA, ordinary nominative | 16,512,655 | 173,804 |
| Sherwin-Williams Company | 904,541 | 630,230 |
| Shin-Etsu Chemical Co., Ltd.1 | 4,004,000 | 522,610 |
| Linde PLC | 1,995,450 | 475,177 |
| Sika AG1 | 1,860,577 | 457,088 |
| Asahi Kasei Corp.1 | 40,891,973 | 356,962 |
| Gerdau SA (ADR) | 68,807,000 | 254,586 |
| Chr. Hansen Holding A/S1 | 1,638,741 | 182,130 |
| LyondellBasell Industries NV | 2,514,000 | 177,212 |
| Dow Inc. | 3,473,592 | 163,432 |
| DuPont de Nemours Inc. | 2,296,742 | 127,423 |
| Air Liquide SA, non-registered shares1 | 786,378 | 124,785 |
| Barrick Gold Corp. | 4,053,052 | 113,931 |
| AngloGold Ashanti Ltd. (ADR) | 3,239,471 | 85,457 |
| Grupo México, SAB de CV, Series B | 30,735,000 | 78,188 |
| Newmont Corp. | 1,081,105 | 68,596 |
| Wheaton Precious Metals Corp. (CAD denominated) | 1,073,094 | 52,649 |
| Celanese Corp. | 423,552 | 45,511 |
| Alrosa PJSC1 | 44,404,993 | 42,155 |
| Air Products and Chemicals, Inc. | 100,712 | 29,998 |
| CF Industries Holdings, Inc. | 618,689 | 19,000 |
| First Quantum Minerals Ltd. | 1,162,000 | 10,359 |
| | | 5,672,184 |
| Energy 1.90% | | |
| Reliance Industries Ltd.1 | 22,770,563 | 693,529 |
| Reliance Industries Ltd., interim shares1 | 1,150,559 | 21,071 |
| Rosneft Oil Company PJSC (GDR)1 | 45,132,749 | 221,445 |
| Schlumberger Ltd. | 11,675,611 | 181,673 |
| Total SE1,4 | 4,679,599 | 160,665 |
| Baker Hughes Co., Class A | 12,003,184 | 159,522 |
| EOG Resources, Inc. | 4,240,449 | 152,402 |
| ConocoPhillips | 4,589,171 | 150,708 |
| TC Energy Corp. (CAD denominated) | 3,532,712 | 148,307 |
| Royal Dutch Shell PLC, Class B1 | 5,133,368 | 62,098 |
| Canadian Natural Resources, Ltd. (CAD denominated) | 3,292,716 | 52,770 |
| LUKOIL Oil Co. PJSC (ADR)1 | 582,132 | 33,658 |
| Gazprom PJSC (ADR)1 | 7,266,968 | 31,615 |
| INPEX Corp.1 | 5,262,800 | 28,155 |
New Perspective Fund — Page 6 of 8
Common stocks (continued)
Energy (continued) | Shares | Value
(000) |
| Chevron Corp. | 305,191 | $21,974 |
| Weatherford International2 | 371,207 | 724 |
| | | 2,120,316 |
| Utilities 1.44% | | |
| Ørsted AS1 | 5,700,232 | 786,261 |
| Enel SpA1 | 42,204,199 | 366,465 |
| AES Corp. | 10,118,808 | 183,252 |
| Sempra Energy | 1,378,905 | 163,207 |
| Engie SA1,2 | 7,927,225 | 105,951 |
| | | 1,605,136 |
| Real estate 1.13% | | |
| Equinix, Inc. REIT | 545,968 | 415,007 |
| American Tower Corp. REIT | 1,174,157 | 283,829 |
| Goodman Logistics (HK) Ltd. REIT1 | 18,307,046 | 235,613 |
| CK Asset Holdings Ltd.1 | 27,684,500 | 135,075 |
| ESR Cayman Ltd.1,2 | 34,650,000 | 108,107 |
| Digital Realty Trust, Inc. REIT | 588,276 | 86,335 |
| | | 1,263,966 |
| Total common stocks (cost: $57,088,731,000) | | 106,877,872 |
Preferred securities 0.10%
Health care 0.06% | | |
| Grifols, SA, Class B, nonvoting preferred, non-registered shares1 | 3,768,551 | 64,619 |
| Information technology 0.02% | | |
| Samsung Electronics Co., Ltd., nonvoting preferred shares1 | 596,200 | 25,722 |
| Materials 0.02% | | |
| Gerdau SA, preferred nominative | 5,574,300 | 20,646 |
| Total preferred securities (cost: $83,254,000) | | 110,987 |
Bonds, notes & other debt instruments 0.02%
Corporate bonds, notes & loans 0.02%
Energy 0.02% | Principal amount
(000) | |
| Weatherford International PLC 8.75% 20245 | $9,276 | 9,528 |
| Weatherford International PLC 11.00% 20245 | 24,701 | 14,882 |
| | | 24,410 |
| Total corporate bonds, notes & loans | | 24,410 |
| Total bonds, notes & other debt instruments (cost: $29,234,000) | | 24,410 |
Short-term securities 4.46%
Money market investments 4.46% | Shares | |
| Capital Group Central Cash Fund 0.12%3,6 | 47,628,149 | 4,763,291 |
| BlackRock Liquidity Funds – FedFund, Institutional Shares 0%6,7 | 75,000,000 | 75,000 |
| Goldman Sachs Financial Square Government Fund, Institutional Shares 0%6,7 | 75,000,000 | 75,000 |
New Perspective Fund — Page 7 of 8
Short-term securities (continued)
Money market investments (continued) | Shares | Value
(000) |
Invesco Short-Term Investments Trust – Government & Agency Portfolio,
Institutional Class 0.02%6,7 | 31,398,470 | $31,399 |
| State Street Institutional U.S. Government Money Market Fund, Premier Class 0.03%6,7 | 25,000,000 | 25,000 |
| Fidelity Investments Money Market Government Portfolio, Class I 0.01%6,7 | 1,000,000 | 1,000 |
Morgan Stanley Institutional Liquidity Funds – Government Portfolio,
Institutional Class 0.02%6,7 | 986,450 | 986 |
| | | 4,971,676 |
| Total short-term securities (cost: $4,970,975,000) | | 4,971,676 |
| Total investment securities 100.36% (cost: $62,172,194,000) | | 111,984,945 |
| Other assets less liabilities (0.36)% | | (402,160) |
| Net assets 100.00% | | $111,582,785 |
| 1 | Valued under fair value procedures adopted by authority of the board of trustees. The total value of all such securities was $38,331,234,000, which represented 34.35% of the net assets of the fund. This amount includes $38,107,944,000 related to certain securities trading outside the U.S. whose values were adjusted as a result of significant market movements following the close of local trading. |
| 2 | Security did not produce income during the last 12 months. |
| 3 | Affiliate of the fund or part of the same group of investment companies as the fund, in each case as defined under the Investment Company Act of 1940. |
| 4 | All or a portion of this security was on loan. The total value of all such securities was $199,690,000, which represented .18% of the net assets of the fund. |
| 5 | Acquired in a transaction exempt from registration under Rule 144A of the Securities Act of 1933. May be resold in the U.S. in transactions exempt from registration, normally to qualified institutional buyers. The total value of all such securities was $24,410,000, which represented .02% of the net assets of the fund. |
| 6 | Rate represents the seven-day yield at 9/30/2020. |
| 7 | Security purchased with cash collateral from securities on loan. |
| Key to abbreviations | | |
| ADR = American Depositary Receipts | | |
| CAD = Canadian dollars | | |
| EUR = Euros | | |
| GBP = British pounds | | |
| GDR = Global Depositary Receipts | | |
Additional financial disclosures are included in the fund’s current shareholder report and should be read in conjunction with this report.
Investments are not FDIC-insured, nor are they deposits of or guaranteed by a bank or any other entity, so they may lose value.
Investors should carefully consider investment objectives, risks, charges and expenses. This and other important information is contained in the fund prospectus and summary prospectus, which can be obtained from your financial professional and should be read carefully before investing. You may also call American Funds Service Company (AFS) at (800) 421-4225 or visit the Capital Group website at capitalgroup.com.
All Capital Group trademarks mentioned are owned by The Capital Group Companies, Inc., an affiliated company or fund. All other company and product names mentioned are the property of their respective companies.
American Funds Distributors, Inc., member FINRA.
© 2020 Capital Group. All rights reserved.
| MFGEFP4-007-1120O-S78112 | New Perspective Fund — Page 8 of 8 |
REPORT OF INDEPENDENT REGISTERED PUBLIC ACCOUNTING FIRM ON INVESTMENT PORTFOLIO
To the Shareholders and Board of Trustees of New Perspective Fund:
Opinion on the Investment Portfolio
We have audited the accompanying investment portfolio of New Perspective Fund (the “Fund”), as of September 30, 2020, and the related notes (“investment portfolio”) (included in Item 6 of this Form N-CSR). In our opinion, the investment portfolio presents fairly, in all material respects, the investments in securities of the Fund as of September 30, 2020, in conformity with accounting principles generally accepted in the United States of America.
Basis for Opinion
The investment portfolio is the responsibility of the Fund’s management. Our responsibility is to express an opinion on the investment portfolio based on our audit. We are a public accounting firm registered with the Public Company Accounting Oversight Board (United States) (PCAOB) and are required to be independent with respect to the Fund in accordance with the U.S. federal securities laws and the applicable rules and regulations of the Securities and Exchange Commission and the PCAOB.
We conducted our audit in accordance with the standards of the PCAOB. Those standards require that we plan and perform the audit to obtain reasonable assurance about whether the investment portfolio is free of material misstatement, whether due to error or fraud. The Fund is not required to have, nor were we engaged to perform, an audit of its internal control over financial reporting. As part of our audit we are required to obtain an understanding of internal control over financial reporting but not for the purpose of expressing an opinion on the effectiveness of the Fund's internal control over financial reporting. Accordingly, we express no such opinion.
Our audit included performing procedures to assess the risks of material misstatement of the investment portfolio, whether due to error or fraud, and performing procedures that respond to those risks. Such procedures included examining, on a test basis, evidence regarding the amounts and disclosures in the investment portfolio. Our audit also included evaluating the accounting principles used and significant estimates made by management, as well as evaluating the overall presentation of the investment portfolio. We believe that our audit provides a reasonable basis for our opinion.

Costa Mesa, California
November 6, 2020
We have served as the auditor of one or more American Funds investment companies since 1956.
ITEM 7 – Disclosure of Proxy Voting Policies and Procedures for Closed-End Management Investment Companies
Not applicable to this Registrant, insofar as the Registrant is not a closed-end management investment company.
ITEM 8 – Portfolio Managers of Closed-End Management Investment Companies
Not applicable to this Registrant, insofar as the Registrant is not a closed-end management investment company.
ITEM 9 – Purchases of Equity Securities by Closed-End Management Investment Company and Affiliated Purchasers
Not applicable to this Registrant, insofar as the Registrant is not a closed-end management investment company.
ITEM 10 – Submission of Matters to a Vote of Security Holders
There have been no material changes to the procedures by which shareholders may recommend nominees to the Registrant’s board of trustees since the Registrant last submitted a proxy statement to its shareholders. The procedures are as follows. The Registrant has a nominating and governance committee comprised solely of persons who are not considered ‘‘interested persons’’ of the Registrant within the meaning of the Investment Company Act of 1940, as amended. The committee periodically reviews such issues as the board’s composition, responsibilities, committees, compensation and other relevant issues, and recommends any appropriate changes to the full board of trustees. While the committee normally is able to identify from its own resources an ample number of qualified candidates, it will consider shareholder suggestions of persons to be considered as nominees to fill future vacancies on the board. Such suggestions must be sent in writing to the nominating and governance committee of the Registrant, c/o the Registrant’s Secretary, and must be accompanied by complete biographical and occupational data on the prospective nominee, along with a written consent of the prospective nominee for consideration of his or her name by the nominating and governance committee.
ITEM 11 – Controls and Procedures
| (a) | The Registrant’s Principal Executive Officer and Principal Financial Officer have concluded, based on their evaluation of the Registrant’s disclosure controls and procedures (as such term is defined in Rule 30a-3 under the Investment Company Act of 1940), that such controls and procedures are adequate and reasonably designed to achieve the purposes described in paragraph (c) of such rule. |
| | |
| (b) | There were no changes in the Registrant’s internal controls over financial reporting (as defined in Rule 30a-3(d) under the Investment Company Act of 1940) that occurred during the Registrant’s semi-annual period covered by this report that has materially affected, or is reasonably likely to materially affect, the Registrant’s internal control over financial reporting. |
ITEM 12 – Exhibits
| (a)(1) | The Code of Ethics that is the subject of the disclosure required by Item 2 is attached as an exhibit hereto. |
| | |
| (a)(2) | The certifications required by Rule 30a-2 of the Investment Company Act of 1940 and Sections 302 and 906 of the Sarbanes-Oxley Act of 2002 are attached as exhibits hereto. |
SIGNATURES
Pursuant to the requirements of the Securities Exchange Act of 1934 and the Investment Company Act of 1940, the Registrant has duly caused this report to be signed on its behalf by the undersigned, thereunto duly authorized.
| | NEW PERSPECTIVE FUND |
| | |
| | By __/s/ Walter R. Burkley________________ |
| | Walter R. Burkley, Executive Vice President and Principal Executive Officer |
| | |
| | Date: November 30, 2020 |
Pursuant to the requirements of the Securities Exchange Act of 1934 and the Investment Company Act of 1940, this report has been signed below by the following persons on behalf of the Registrant and in the capacities and on the dates indicated.
| By _ /s/ Walter R. Burkley_____________ |
Walter R. Burkley, Executive Vice President and Principal Executive Officer |
| |
| Date: November 30, 2020 |
| By ___/s/ Brian C. Janssen__________________ |
Brian C. Janssen, Treasurer and Principal Financial Officer |
| |
| Date: November 30, 2020 |