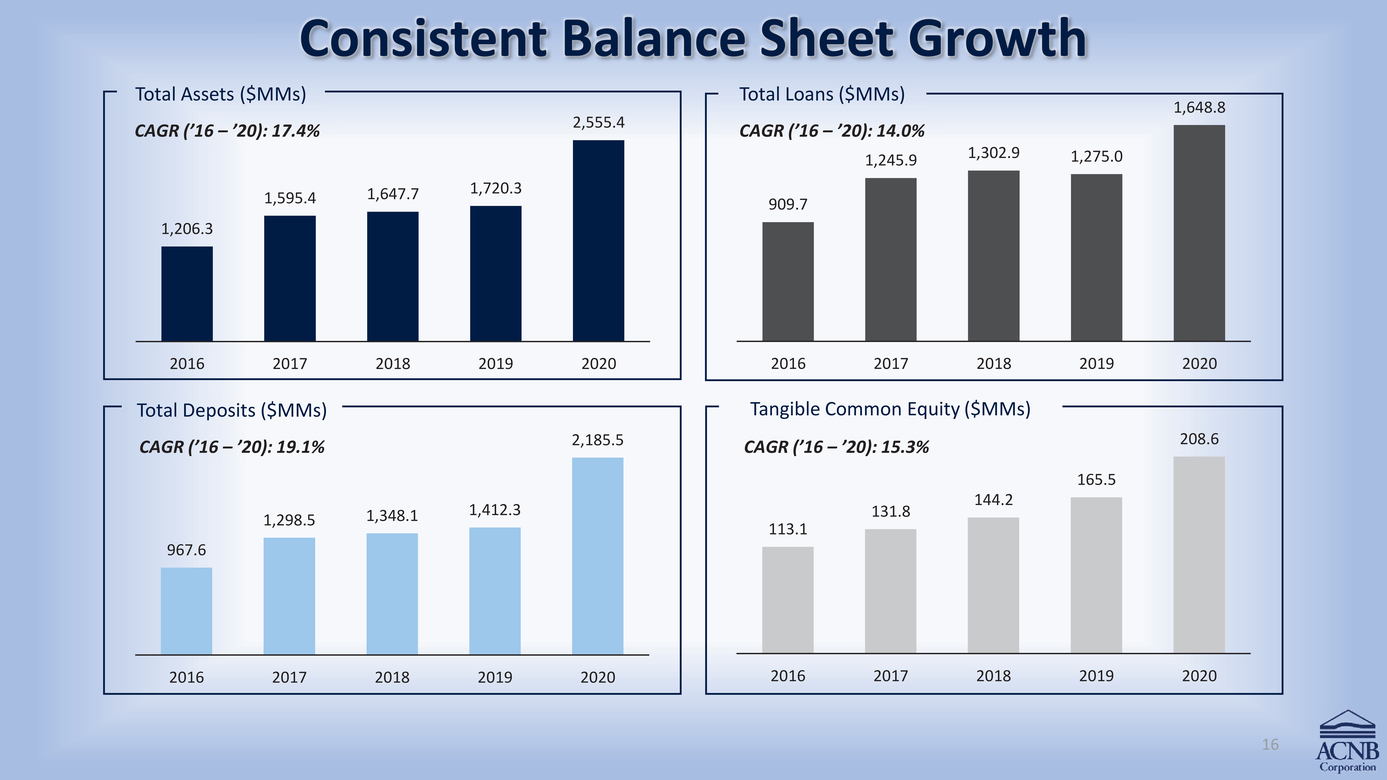
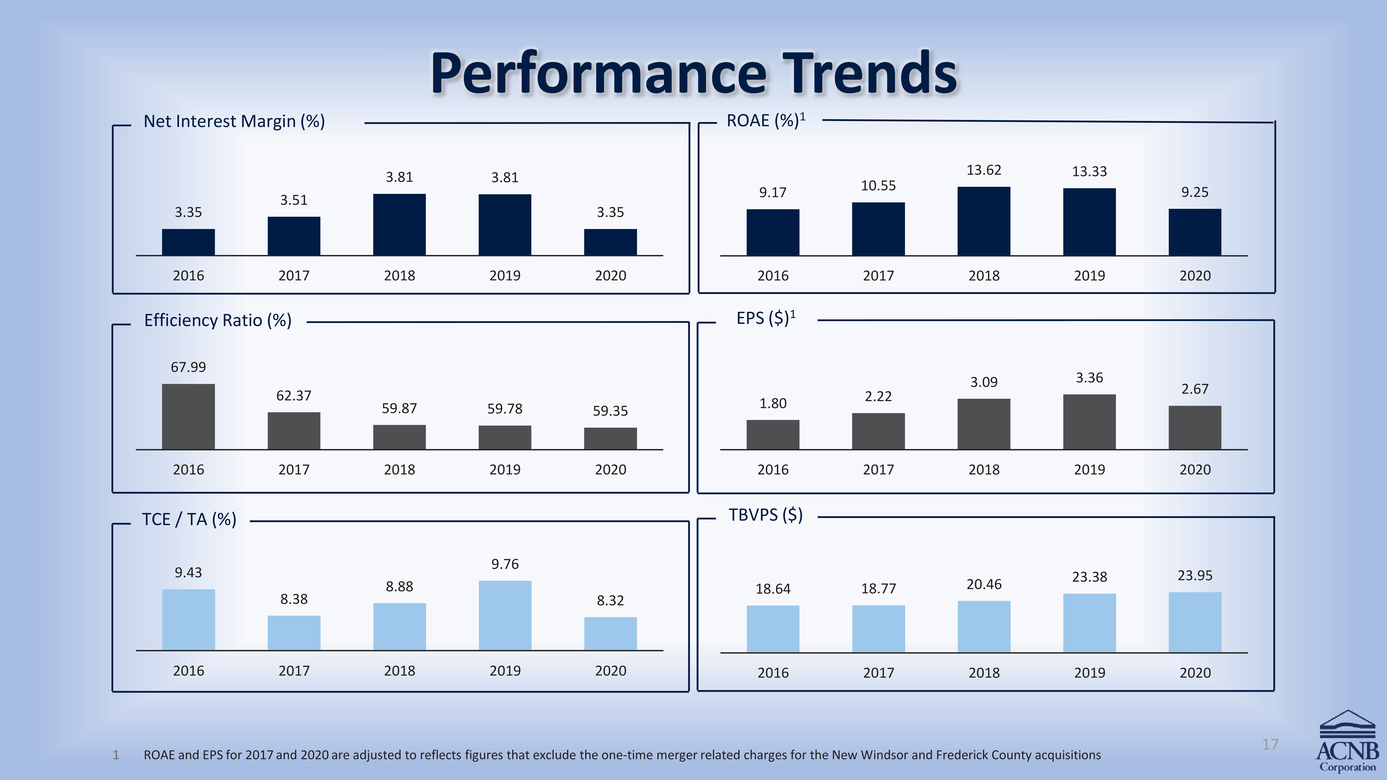
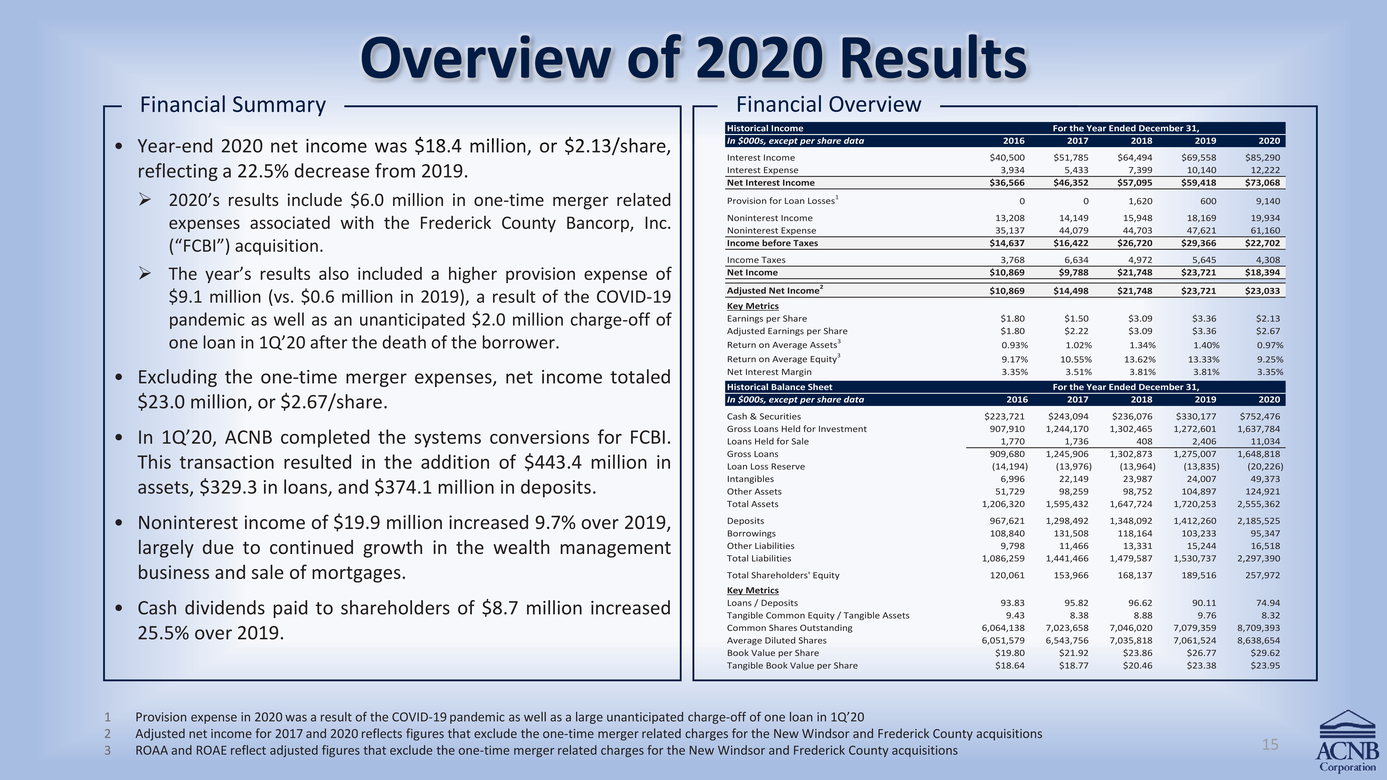
 | Financial Summary Overview of 2020 Results Financial Overview Historical IncomeFor the Year Ended December 31, Year-end 2020 net income was $18.4 million, or $2.13/share, reflecting a 22.5% decrease from 2019. 2020’s results include $6.0 million in one-time merger related expenses associated with the Frederick County Bancorp, Inc. (“FCBI”) acquisition. The year’s results also included a higher provision expense of $9.1 million (vs. $0.6 million in 2019), a result of the COVID-19 pandemic as well as an unanticipated $2.0 million charge-off of one loan in 1Q’20 after the death of the borrower. Excluding the one-time merger expenses, net income totaled $23.0 million, or $2.67/share. In 1Q’20, ACNB completed the systems conversions for FCBI. This transaction resulted in the addition of $443.4 million in assets, $329.3 in loans, and $374.1 million in deposits. Noninterest income of $19.9 million increased 9.7% over 2019, largely due to continued growth in the wealth management business and sale of mortgages. Cash dividends paid to shareholders of $8.7 million increased 25.5% over 2019. In $000s, except per share data 2016 2017 2018 2019 2020 Cash & Securities $223,721 $243,094 $236,076 $330,177 $752,476 Gross Loans Held for Investment 907,910 1,244,170 1,302,465 1,272,601 1,637,784 Loans Held for Sale 1,770 1,736 408 2,406 11,034 Gross Loans 909,680 1,245,906 1,302,873 1,275,007 1,648,818 Loan Loss Reserve (14,194) (13,976) (13,964) (13,835) (20,226) Intangibles 6,996 22,149 23,987 24,007 49,373 Other Assets 51,729 98,259 98,752 104,897 124,921 Total Assets 1,206,320 1,595,432 1,647,724 1,720,253 2,555,362 Deposits 967,621 1,298,492 1,348,092 1,412,260 2,185,525 Borrowings 108,840 131,508 118,164 103,233 95,347 Other Liabilities 9,798 11,466 13,331 15,244 16,518 Total Liabilities 1,086,259 1,441,466 1,479,587 1,530,737 2,297,390 Total Shareholders' Equity 120,061 153,966 168,137 189,516 257,972 Key Metrics Loans / Deposits 93.83 95.82 96.62 90.11 74.94 Tangible Common Equity / Tangible Assets 9.43 8.38 8.88 9.76 8.32 Common Shares Outstanding 6,064,138 7,023,658 7,046,020 7,079,359 8,709,393 Average Diluted Shares 6,051,579 6,543,756 7,035,818 7,061,524 8,638,654 Book Value per Share $19.80 $21.92 $23.86 $26.77 $29.62 Tangible Book Value per Share $18.64 $18.77 $20.46 $23.38 $23.95 Adjusted Net Income2 $10,869 $14,498 $21,748 $23,721 $23,033 Key Metrics Earnings per Share $1.80 $1.50 $3.09 $3.36 $2.13 Adjusted Earnings per Share $1.80 $2.22 $3.09 $3.36 $2.67 Return on Average Assets3 0.93% 1.02% 1.34% 1.40% 0.97% Return on Average Equity3 9.17% 10.55% 13.62% 13.33% 9.25% Net Interest Margin 3.35% 3.51% 3.81% 3.81% 3.35% Provision expense in 2020 was a result of the COVID-19 pandemic as well as a large unanticipated charge-off of one loan in 1Q’20 Adjusted net income for 2017 and 2020 reflects figures that exclude the one-time merger related charges for the New Windsor and Frederick County acquisitions ROAA and ROAE reflect adjusted figures that exclude the one-time merger related charges for the New Windsor and Frederick County acquisitions15 |