Free signup for more
- Track your favorite companies
- Receive email alerts for new filings
- Personalized dashboard of news and more
- Access all data and search results
Filing tables
Filing exhibits
TILE similar filings
- 2 Jun 09 Entry into a Material Definitive Agreement
- 28 May 09 Departure of Directors or Certain Officers
- 29 Apr 09 Entry into a Material Definitive Agreement
- 10 Mar 09 Results of Operations and Financial Condition
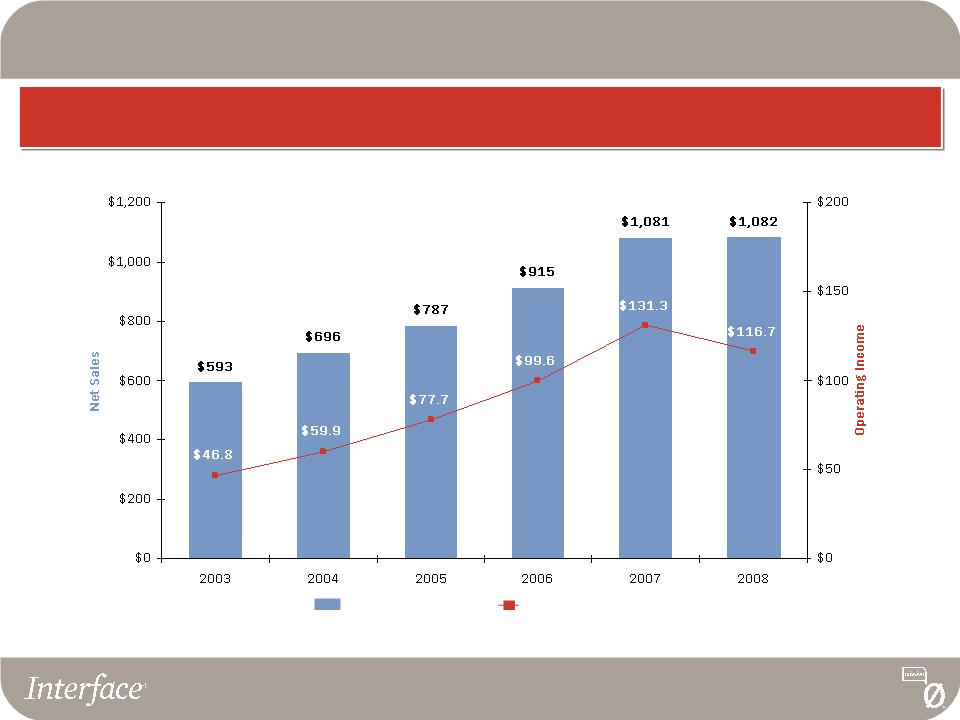
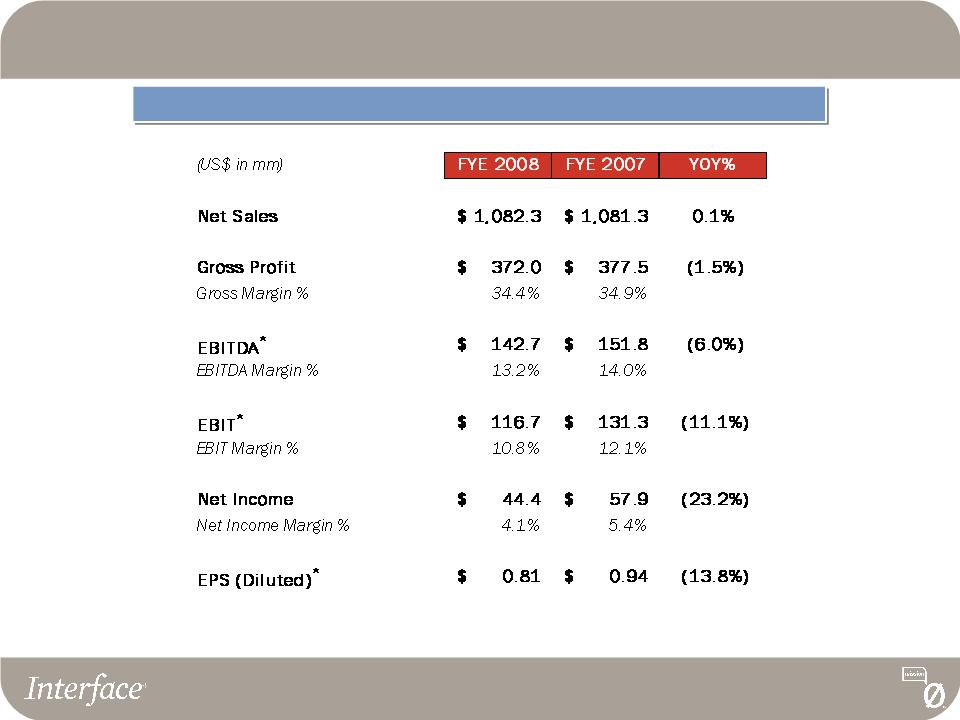
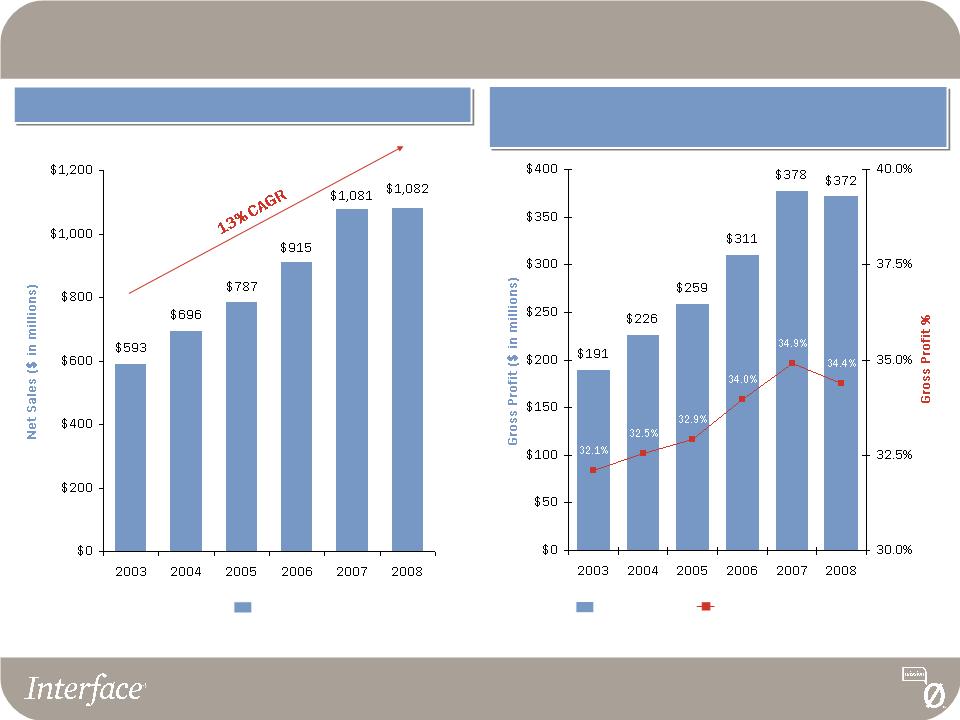
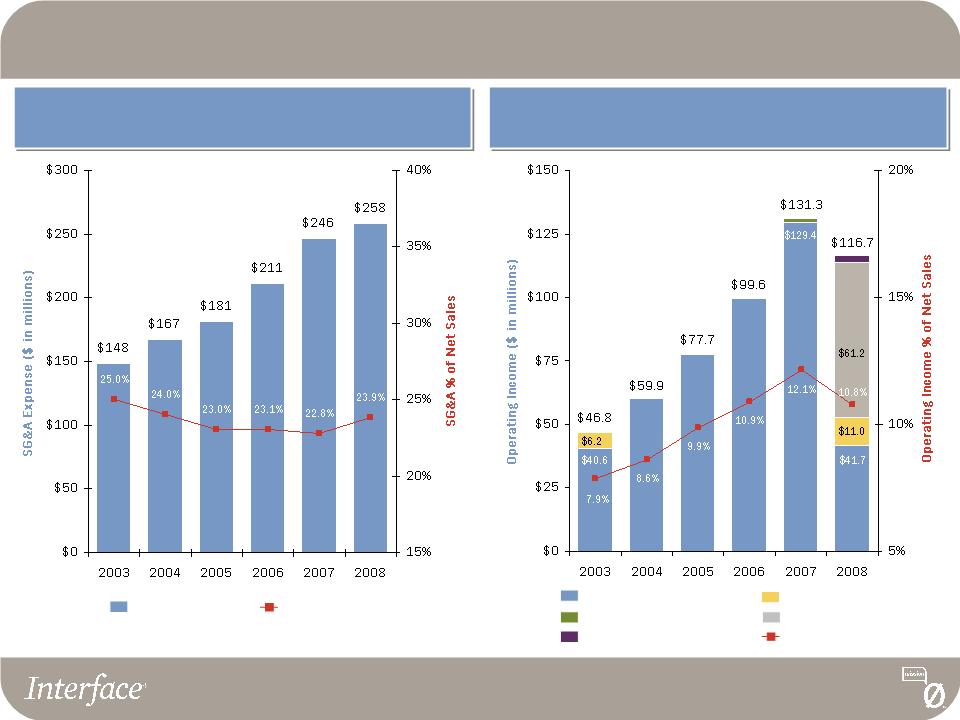
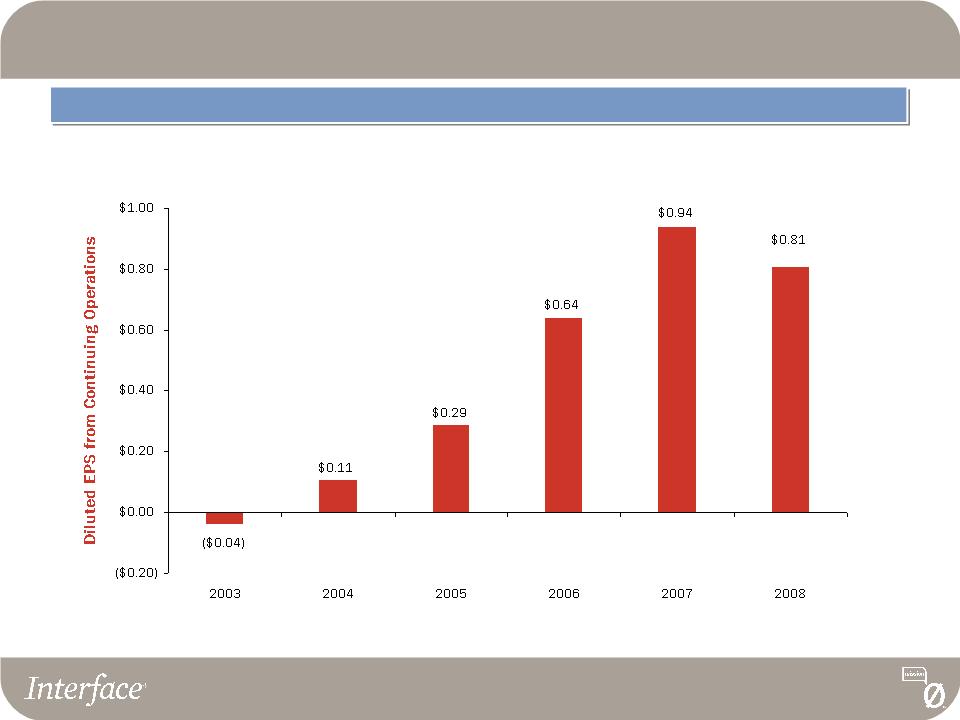
- 25 Feb 09 Interface Reports Fourth Quarter and Full Year 2008 Results
- 2 Jan 09 Split Dollar Insurance Agreement
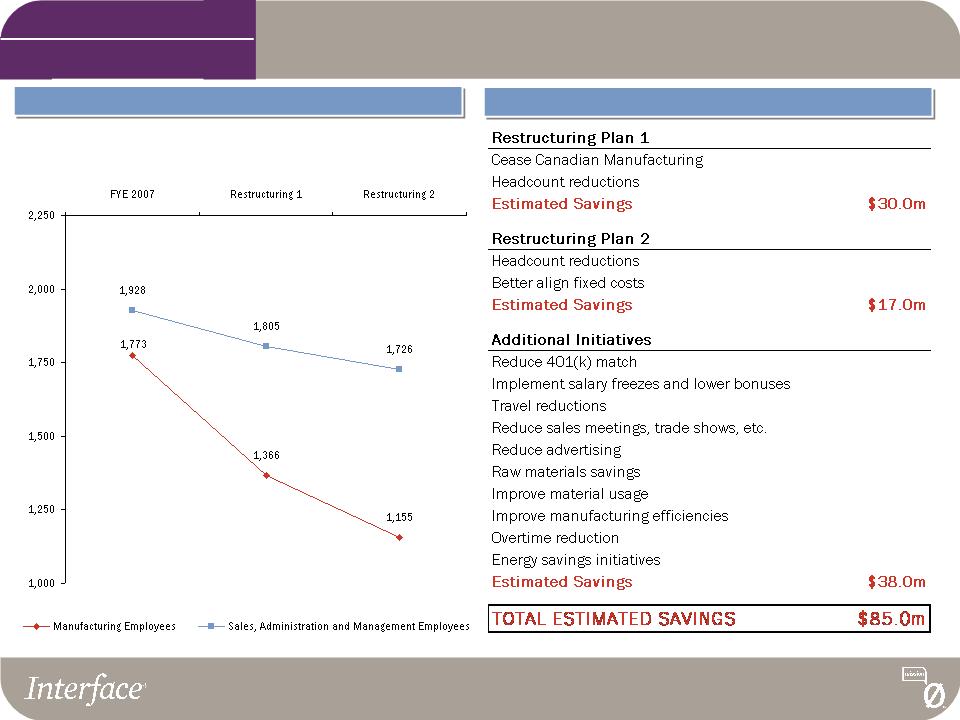
- 30 Dec 08 Interface Announces Global Restructuring Plan
Filing view
External links