Investor Presentation
May 2009
May 2009

2
This presentation contains forward-looking statements, including, in particular, statements about
Interface’s plans, strategies and prospects. These are based on the Company’s current assumptions,
expectations and projections about future events.
Interface’s plans, strategies and prospects. These are based on the Company’s current assumptions,
expectations and projections about future events.
Although Interface believes that the expectations reflected in these forward-looking statements are
reasonable, the Company can give no assurance that these expectations will prove to be correct or that
savings or other benefits anticipated in the forward-looking statements will be achieved. Important
factors, some of which may be beyond the Company’s control, that could cause actual results to differ
materially from management’s expectations are discussed under the heading “Risk Factors” included
in Item 1A of the Company’s most recent Annual Report on Form 10-K, filed with the Securities and
Exchange Commission, which discussion is hereby incorporated by reference. Forward-looking
statements speak only as of the date made. The Company assumes no responsibility to update or
revise forward-looking statements and cautions listeners and conference attendees not to place undue
reliance on any such statements.
Forward Looking Statements

3
Daniel Hendrix
§ President and Chief Executive Officer
Patrick Lynch
§ Senior Vice President and Chief Financial Officer
Presenters

Company Overview

5
Investment Highlights
§ Interface is the largest manufacturer of modular carpet in the world, with 35%
market share, and some of the most recognized brands
market share, and some of the most recognized brands
§ Interface is the only global manufacturer with a presence on four continents
§ Interface serves diversified end markets, with the non-office market representing
almost 40% of the overall business
almost 40% of the overall business
§ Interface has been focused on organic growth of its modular business and debt
paydown
paydown
§ Substantial liquidity position
- Undrawn ABL Revolver and European Credit facility utilized for LCs and working
capital needs
capital needs
§ Management committed to conservative financial policies

6
Current Realities Facing our Business
§ Our operating structure was built for a $1 billion+ revenue base, which has now been
right-sized to meet current demand
right-sized to meet current demand
§ A continued secular shift to carpet tile in non-corporate commercial markets
represents a partial hedge against the declining office market
represents a partial hedge against the declining office market
§ Our operating philosophy in the current under capitalized global carpet industry is to
take market share, particularly in Europe, through our superior global position
take market share, particularly in Europe, through our superior global position
§ Raw material pricing should continue to be favorable due to lower demand and lower
inputs costs, which will help offset margin erosion due to underabsorption
inputs costs, which will help offset margin erosion due to underabsorption
§ Foreign exchange rates are moving in an unfavorable direction, however, our local
manufacturing footprint creates a competitive advantage against importers
manufacturing footprint creates a competitive advantage against importers
7
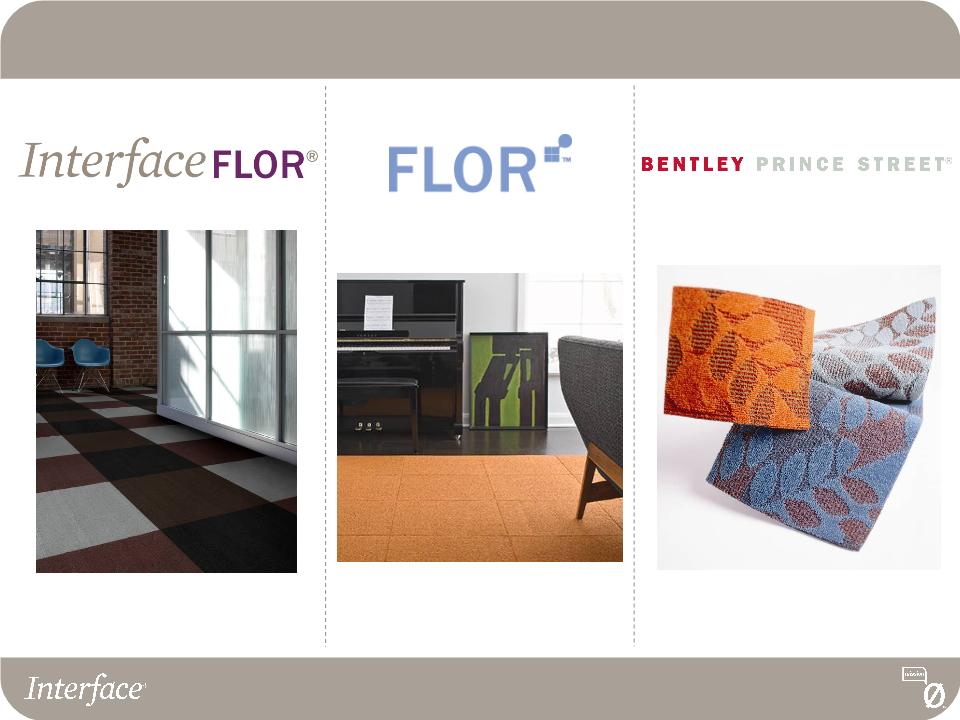
Interface Brands - Most Recognized in the Industry
8
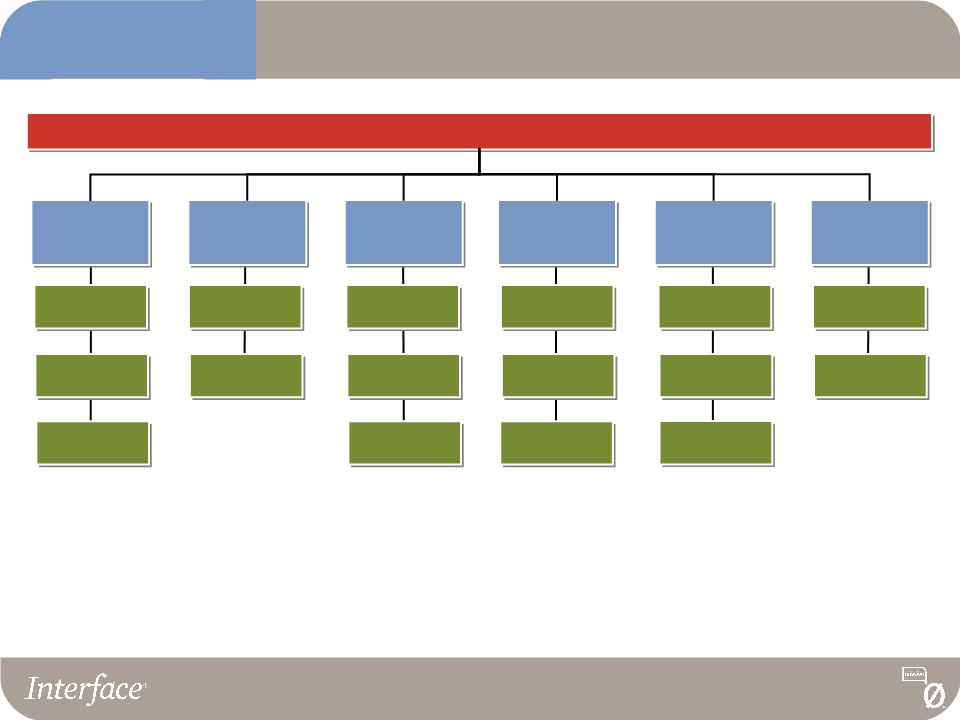
High Margin, Low Capital Requirements and Enhanced Liquidity
First Mover in Sustainability
Rapid Innovation, Leading Brands and Designs
Global Make-to-Order Manufacturing and Local Distribution
Leading Position
in Modular Carpet
in Modular Carpet
Global Capabilities
with Expanding
Position in
Emerging Markets
with Expanding
Position in
Emerging Markets
Broadened Reach
with Residential
Modular Carpet
with Residential
Modular Carpet
Offering
Segmented Sales
Portfolio with
Diversified End
Markets
Portfolio with
Diversified End
Markets
Strengths
Interface Strengths and Value Drivers
9
4
1
2
3
5
6
7
MODULAR carpet means NO glue,
NO pad
NO pad
MODULAR lowers the cost of
change
change
MODULAR produces less waste
MODULAR means faster and more
profitable installations for
contractor
profitable installations for
contractor
MODULAR is easier to reconfigure
and maintain
and maintain
MODULAR means creative design
freedom
freedom
MODULAR is easily recycled and
repurposed
repurposed
Modular Carpet is Becoming the Category for
Commercial Flooring - Secular Shift
Commercial Flooring - Secular Shift
Modular Core
Easy
Repairs
11
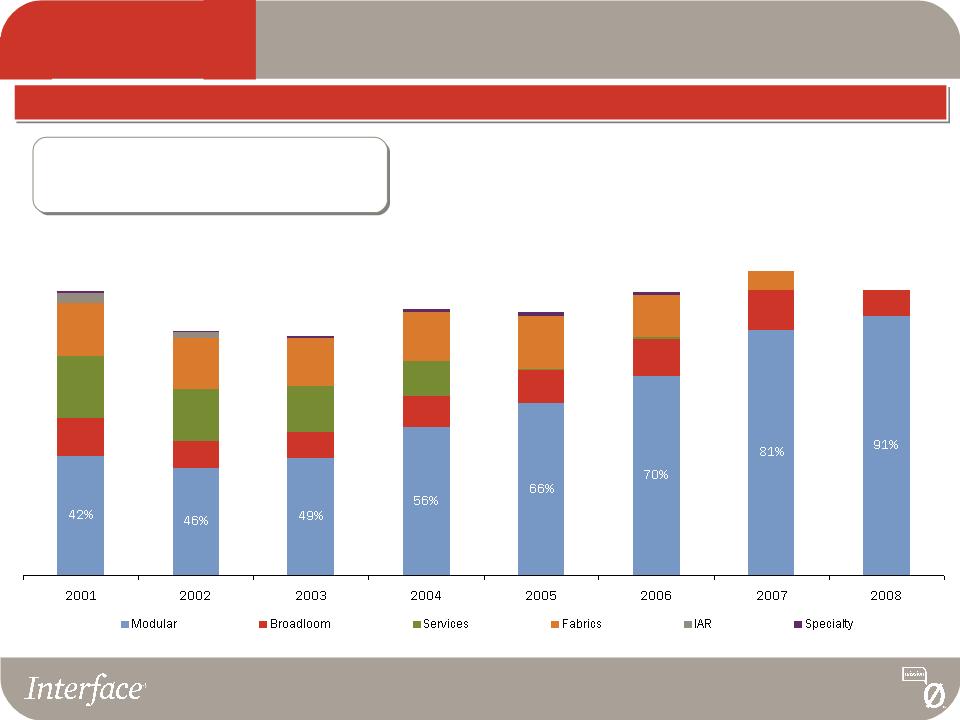
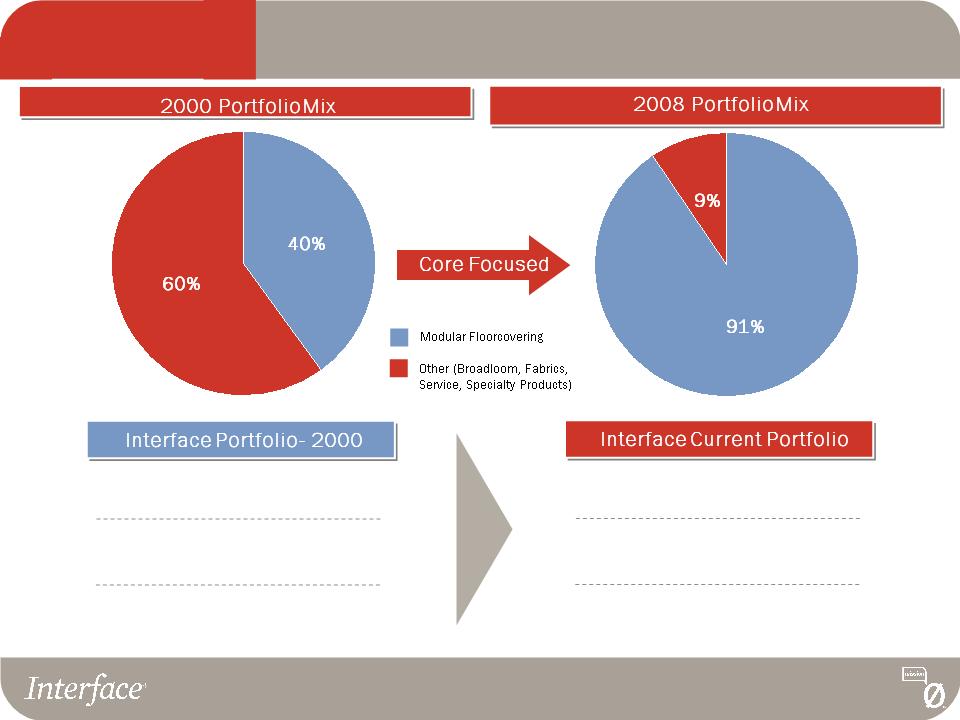
Modular Carpet Represents 91% of Interface
Divested
Raised
Access
Flooring
Raised
Access
Flooring
Divested
European
Fabrics
European
Fabrics
Divested
N. American
Fabrics
Divested
European
Broadloom
Divested
Installation &
Maintenance
Installation &
Maintenance
Sales by Business Type
Divested
Vinyl
Vinyl
Matting
Modular Core
Divested $500M in Revenue Base and
Replaced with Organic Modular Sales
Growth
Growth
12
98% Commercial
2% Residential
2% Residential
70% Corporate Office
30% Non-Corporate Office
30% Non-Corporate Office
90% Refurbishment
10% New Construction
10% New Construction
95% Commercial
5% Residential
5% Residential
60% Corporate Office
40% Non-Corporate Office
40% Non-Corporate Office
90% Refurbishment
10% New Construction
10% New Construction
Modular Core
Over the Past Five Years, Interface Has Focused
on its Core Modular Business
on its Core Modular Business
13
Source: Invista, Carpet and Rug Institute, Catalina Research Inc., U.S. Flooring Forecast and management estimates
§ Preferred interior design element
§ “Becoming the Flooring of Choice”
§ Random products merge design with
function
function
§ Sustainability drives recycled and
repurposed products
repurposed products
§ Stressed the functionality
of modular carpet
of modular carpet
§ Exploited the benefits of
modular vs. broadloom
modular vs. broadloom
§ Limited application and
design
design
§ Open office plans emerge
Pioneering Stage
Functionality Stage
Secular Shift
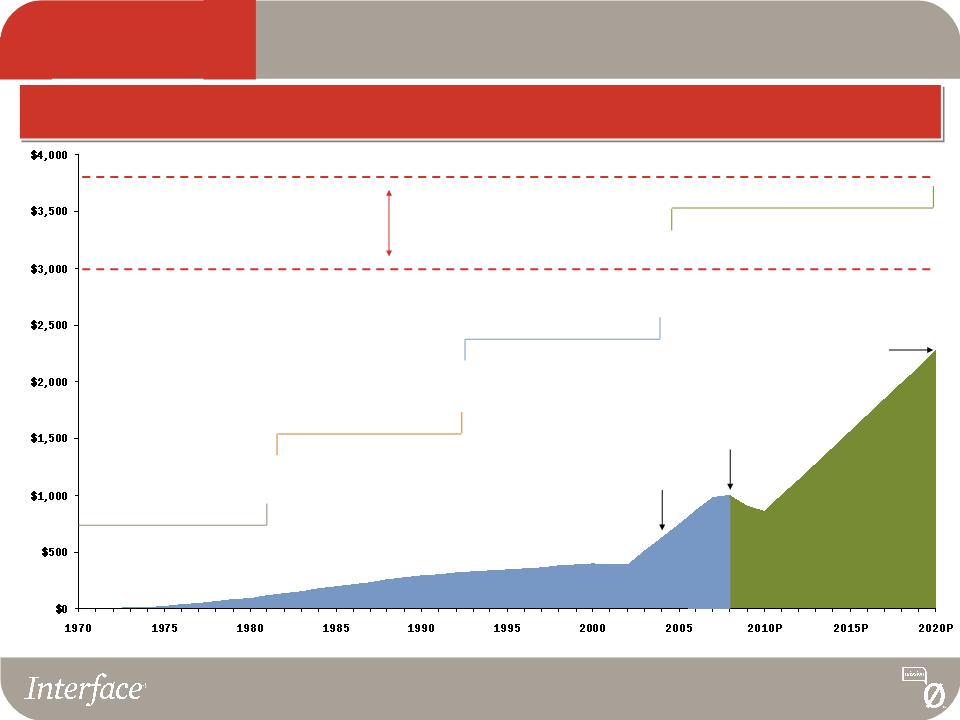
2008 Total U.S. Specified
Commercial Carpet Market = $3.0B
§ Celebrating the square
§ Sustainability is introduced
§ Pattern by tile
Liberation of Design
2020P Total U.S. Specified
Commercial Carpet Market = $3.8B
2.0%
CAGR
2008
34% Penetration
2020P
60% Penetration
U.S. Modular Carpet Sales
Specified Commercial Market
($ in millions)
What if modular
carpet reached
60% market
share of the
commercial
market by 2020?
carpet reached
60% market
share of the
commercial
market by 2020?
Modular Core
2004
26% Penetration
Functionality and Design Create a Secular Shift
From a Niche to a Category
From a Niche to a Category
14
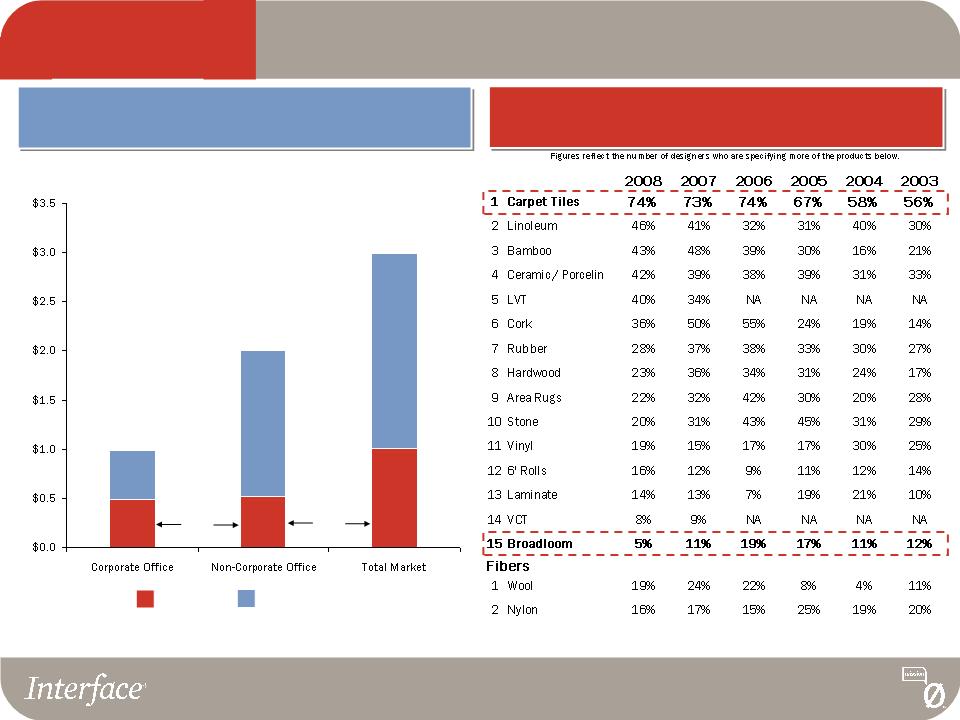
Source: 2007 Floor Focus Magazine.
U.S. Floorcovering Opportunity
2008 Specified Commercial Market
$1B
50%
26%
Carpet
Tile
Penetration
$2B
U.S. Commercial Market Opportunity
$3B
34%
Carpet
Tile
Penetration
Carpet Tile
Other Floor Coverings
($ in Billions)
Floor Focus Top 250 Design Survey 2008:
Hot Products
Modular Core
Source: Invista, Carpet and Rug Institute, Catalina Research Inc., U.S. Flooring Forecast and management estimates
15
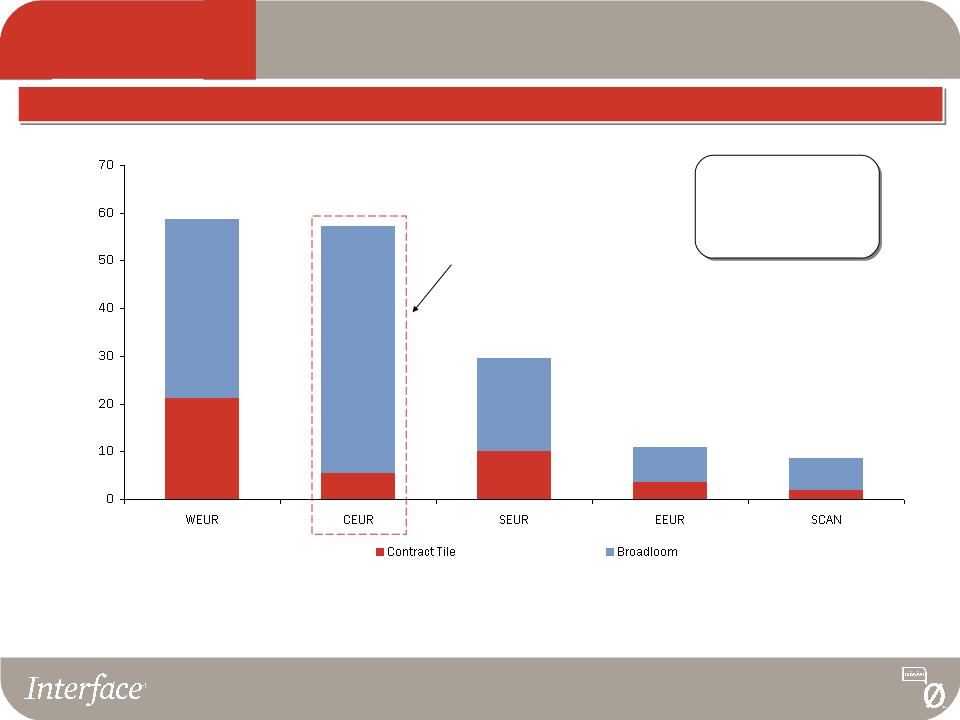
Carpet Tile Penetration of the European Contract Soft Flooring Market
There is significant opportunity for growth as Interface continues to penetrate major markets across
Europe
Europe
~26% Penetration
of the European
Commercial Market
Note: WEUR = BEN and UK/Ireland; CEUR includes Germany; SEUR includes France
Source: BMW Associates and management estimates
German market poised
for considerable carpet
tile expansion
for considerable carpet
tile expansion
European Market Opportunity
36%
9%
34%
33%
22%
(millions of square meters)
Modular Core
(millions of square meters)
German Market
16
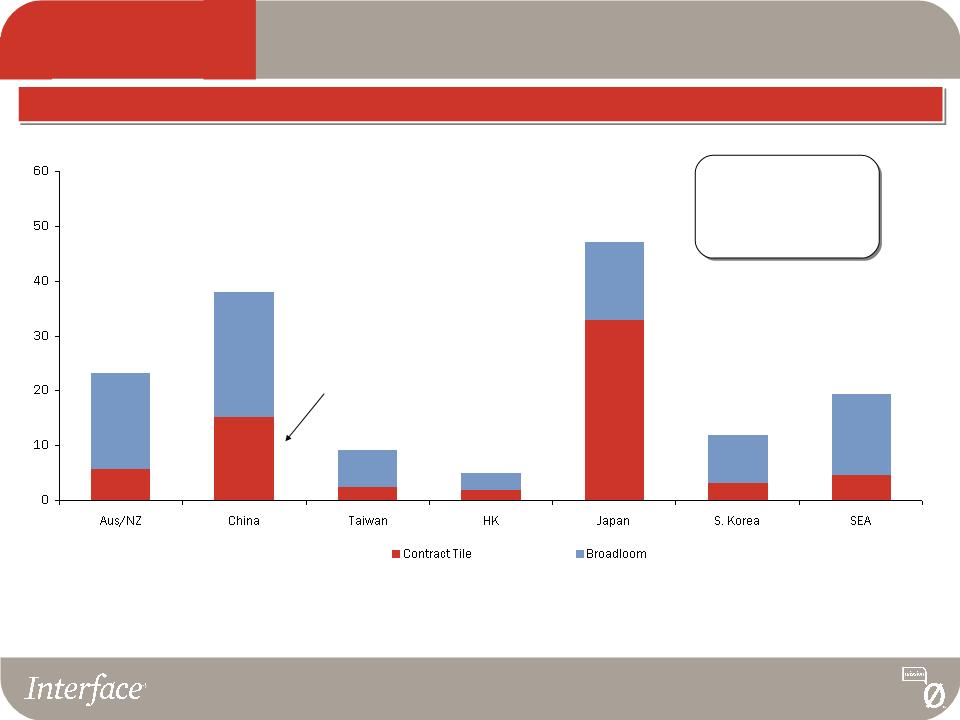
Carpet Tile Penetration of the Asia-Pacific Commercial Carpet Market
Strong penetration of Chinese and Japanese markets with significant opportunity for growth in other
major Asian and Australian markets
major Asian and Australian markets
~34% Penetration
of the Asia-Pacific
Commercial Market
(excluding Japan)
Source: BMW Associates and management estimates
Asia-Pacific Market Opportunity
(millions of square meters)
25%
40%
25%
39%
70%
26%
24%
Modular Core
Only 15% penetration of
Specified Commercial
Carpet Market in China
Specified Commercial
Carpet Market in China
17
Corporate
Office
Office
Government
Religious
Establishments
Establishments
Hospitals
Medical Office
Buildings
Buildings
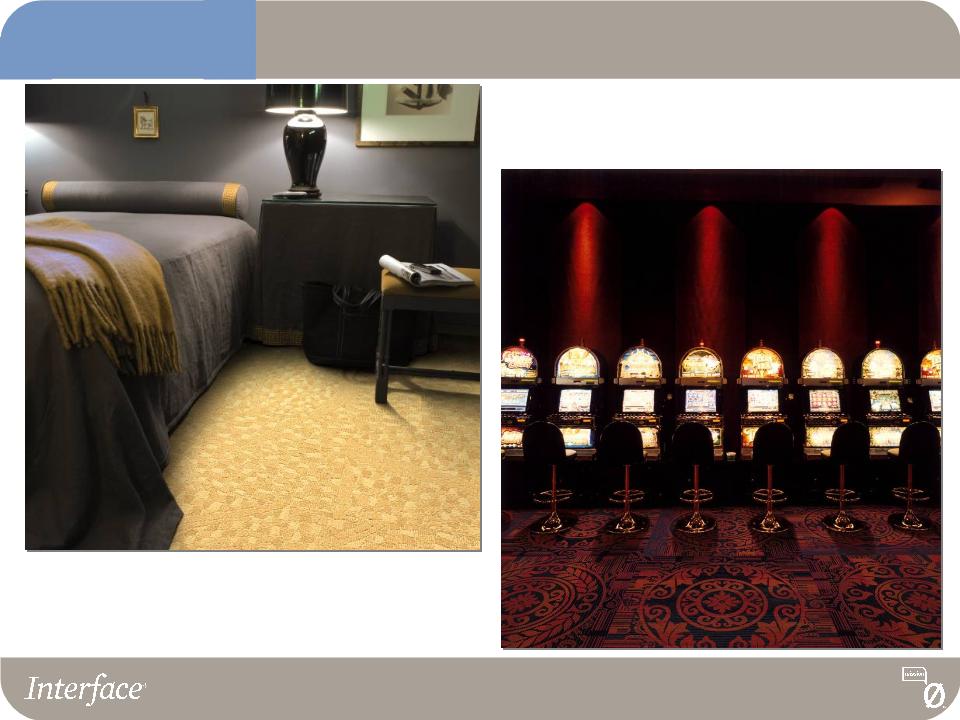
Hotels/Resorts
Casinos
Stores
Malls
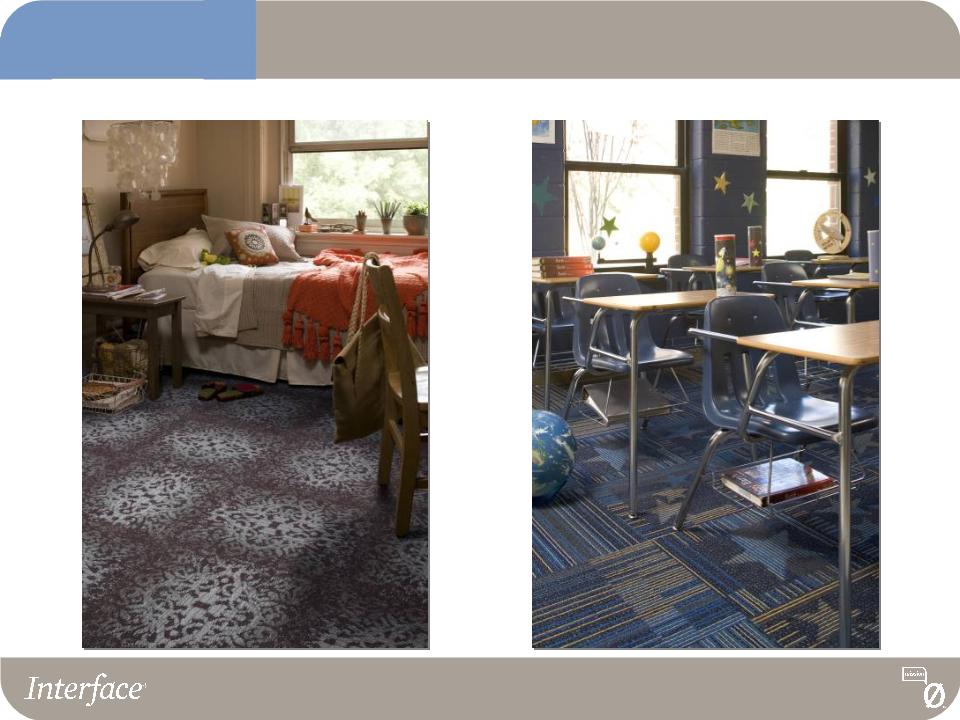
K-12
Colleges &
Universities
Universities
Assisted
Living
Boutique
Turnkey
Solutions
Segmented Commercial Market Approach
Institutional
Healthcare
Hospitality
Retail
Education
Commercial Segmentation
Financial
Service
Service
Fortune 1000
Main
Street
Segmentation
18
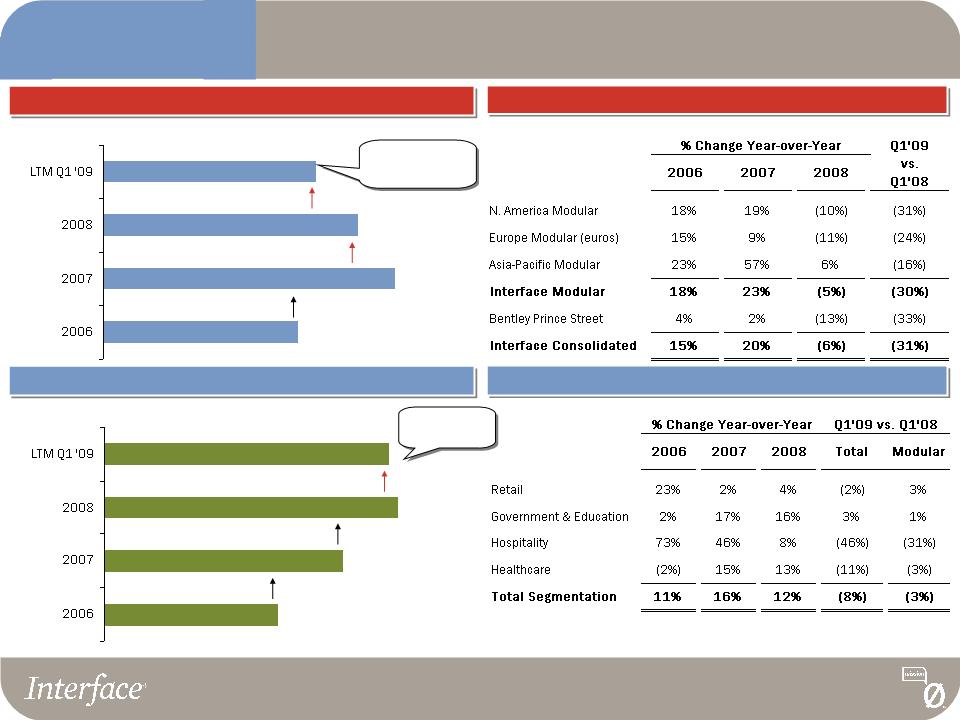
Strong Growth from Non-Corporate Segments
Segmentation
Only 50% of the
overall business
Over 35% of
our business
Gross Billings from Non-Corporate Office Segments
16% Growth
(Institutional, Healthcare, Hospitality, Retail, Education)
Non-Corporate Office Growth Comparison by Segment
Gross Billings from Mature Corporate Office
20% Growth
Mature Corporate Office Growth Comparison by Geography
6% Decline
12% Growth
(excludes Emerging Office Markets)
(excludes Emerging Office Markets)
* Growth due to CVS acquisition of Albertson’s drug
stores
stores
*
8% Decline
2% Decline
19
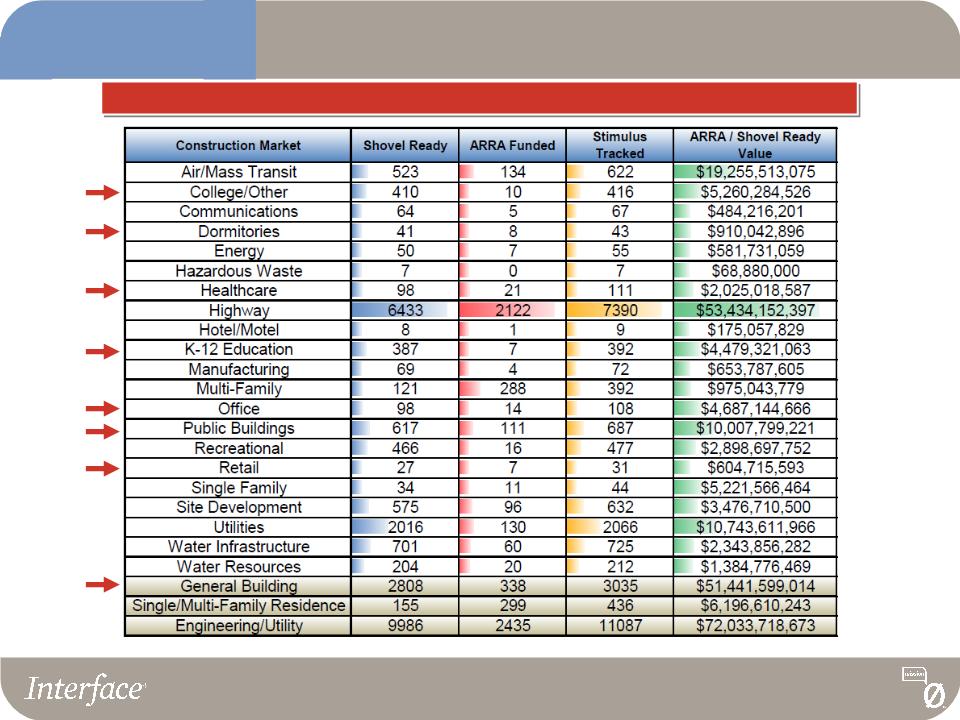
United States Stimulus Package
Reported Stimulus by Markets
Source: McGraw Hill Construction
Segmentation
20
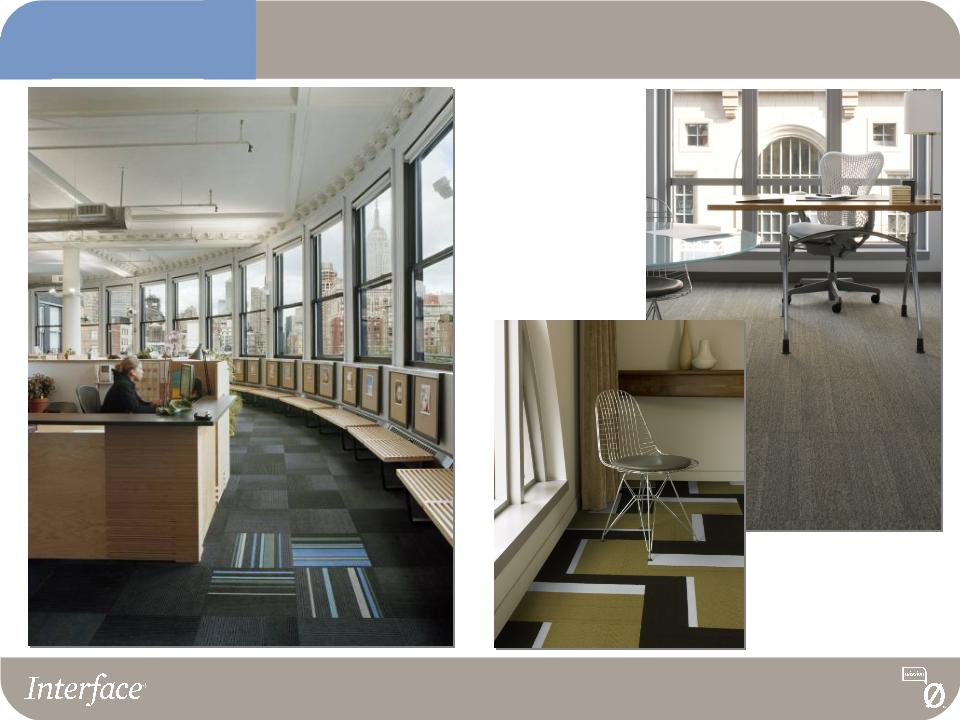
Corporate Office Segment
Segmentation
21
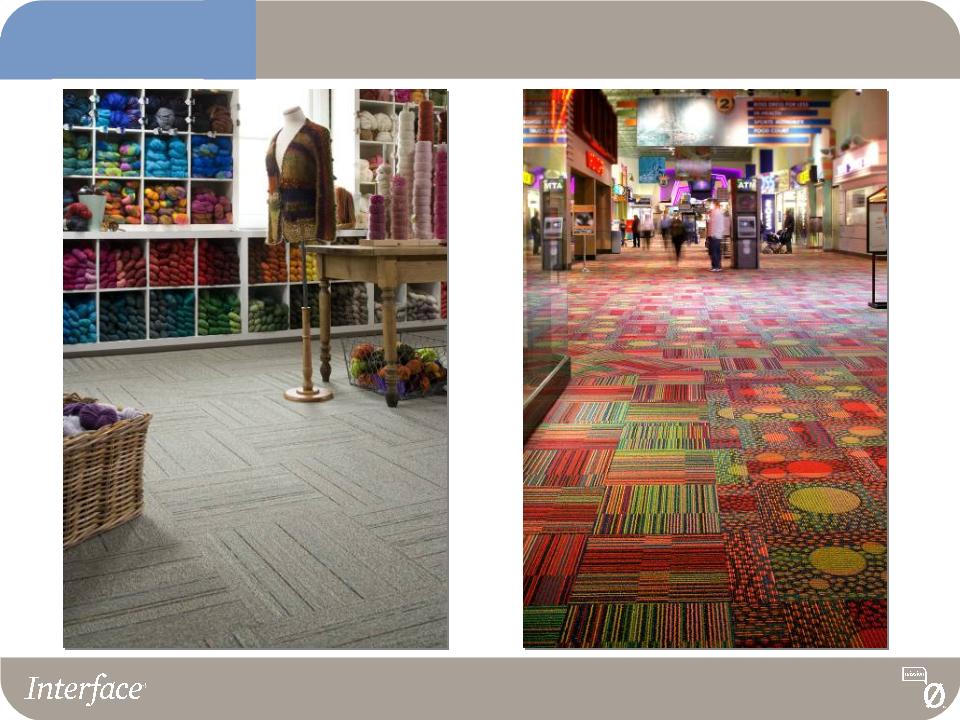
Retail
Segmentation
22
Higher Education
K-12 Education
Education
Segmentation
23
Healthcare
Segmentation
24
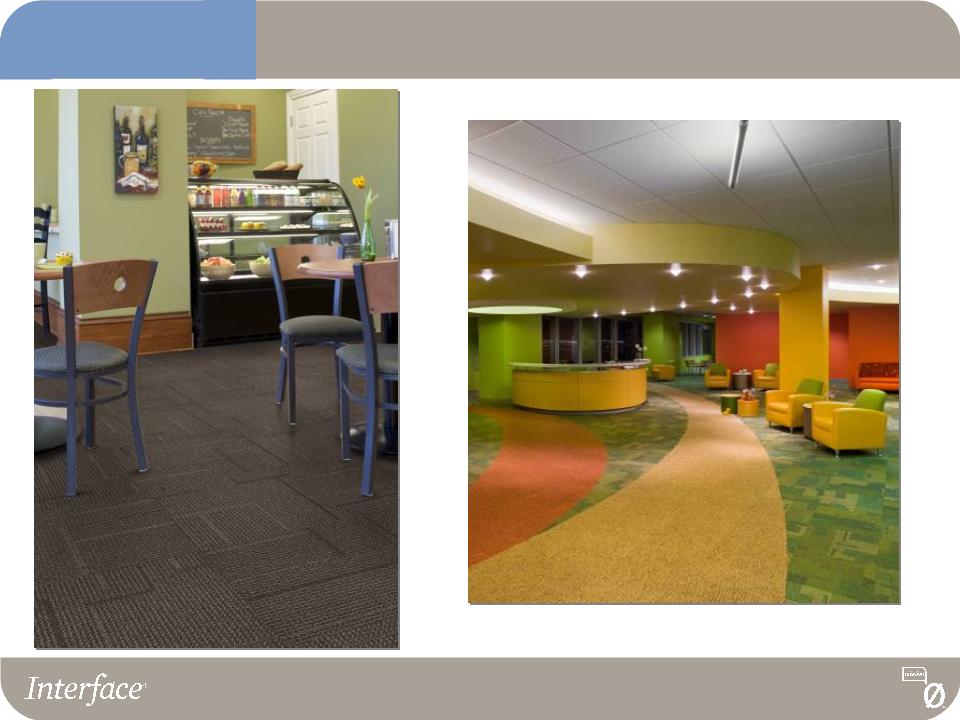
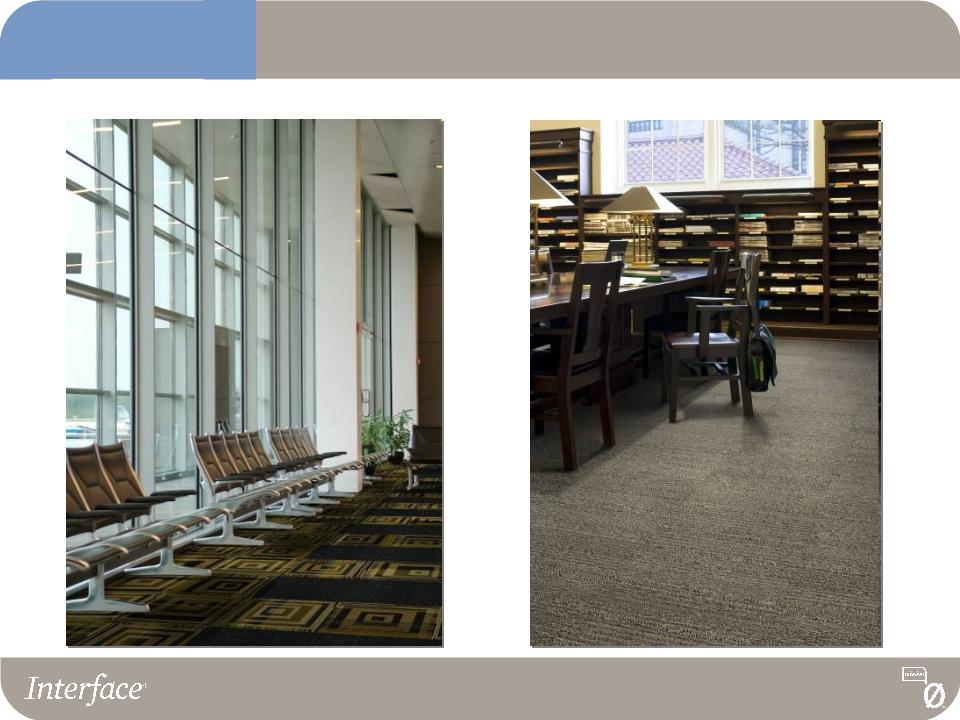
Public Spaces
Library
Government
Segmentation
25
Hospitality
Segmentation
26
Hospitality - - Interface Hospitality Installations
Segmentation
27
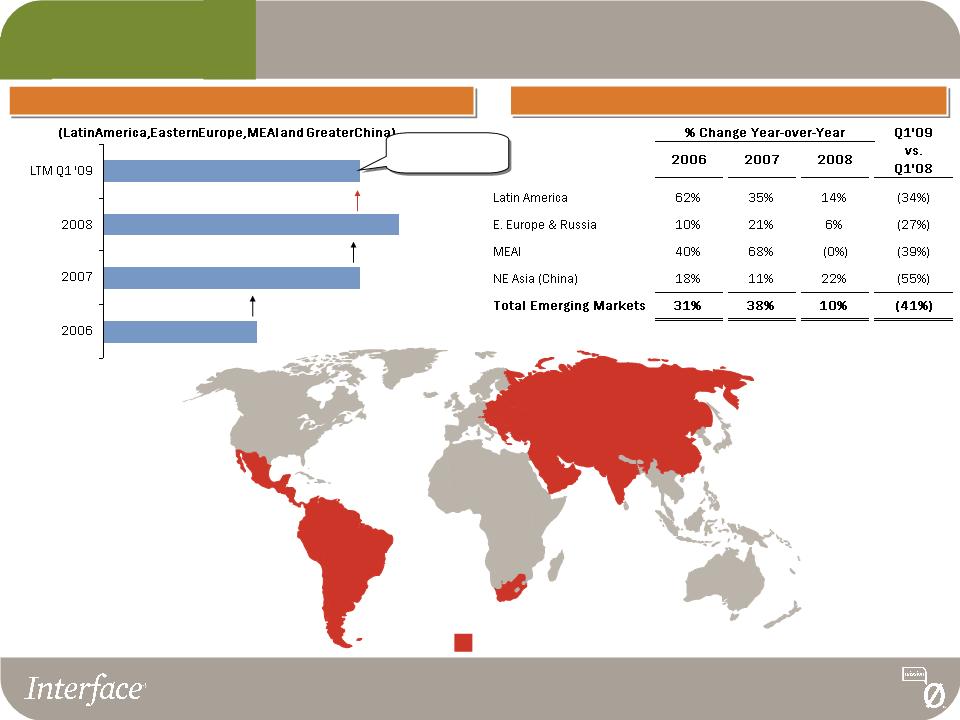
Successfully Penetrating Emerging Markets
Emerging
Markets
Markets
Emerging Markets
Gross Billings from Emerging Markets
Emerging Market Growth Comparison by Geography
38% Growth
10% Growth
9% Decline
Represents 10%
of our business
of our business
28
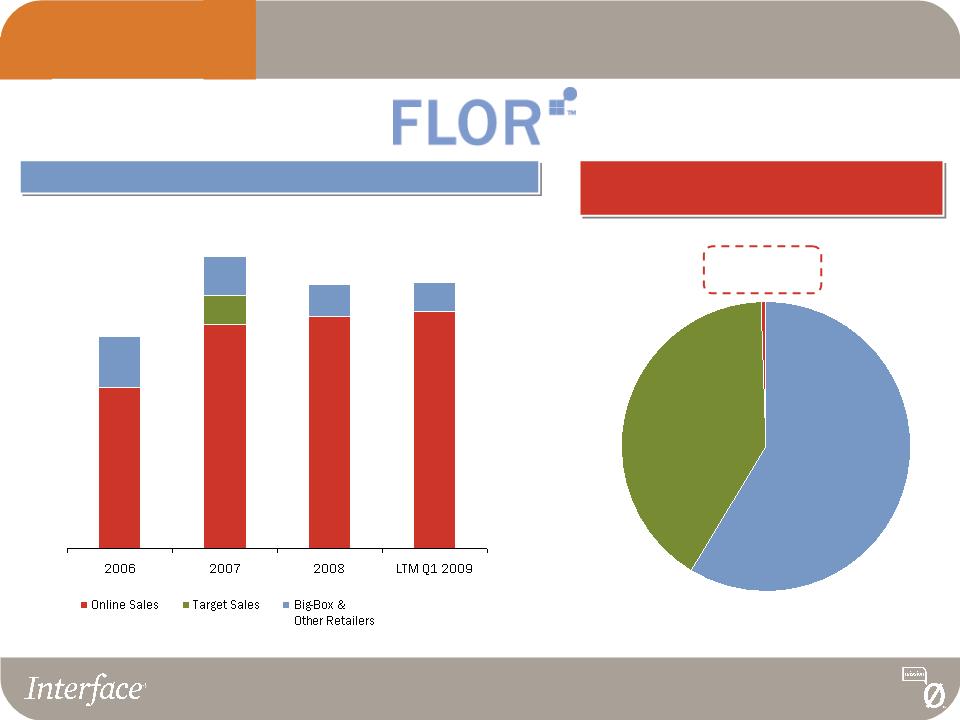
Carpet Tile
<1%
FLOR Sales by Channel
FLOR is Creating a Category:
“Modular Carpet for the Home”
“Modular Carpet for the Home”
↑ 44%
↑ 4%
↑ 39%
Carpet Tile Penetration of the $11B
U.S. Residential Floorcovering Market
↑ Online Sales
Y-o-Y Growth
Residential
Opportunity
Opportunity
Area Rugs
41%
Other
Floorcoverings
58%
↑ 2%
Online Sales up 9% in Q1 2009 vs. Q1 2008
29
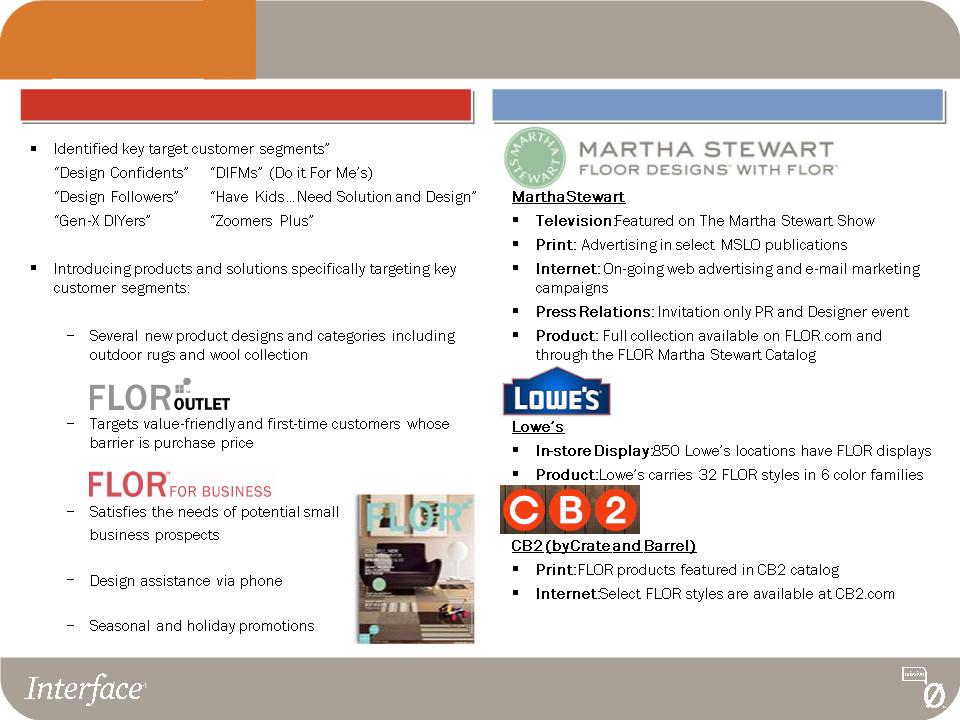
FLOR is Expanding its Online and Retail Presence
Residential
Opportunity
Opportunity
FLOR Catalog and Online Sales
FLOR Retail Presence
30
Modular Goes in the Home
Residential
Opportunity
Opportunity
31
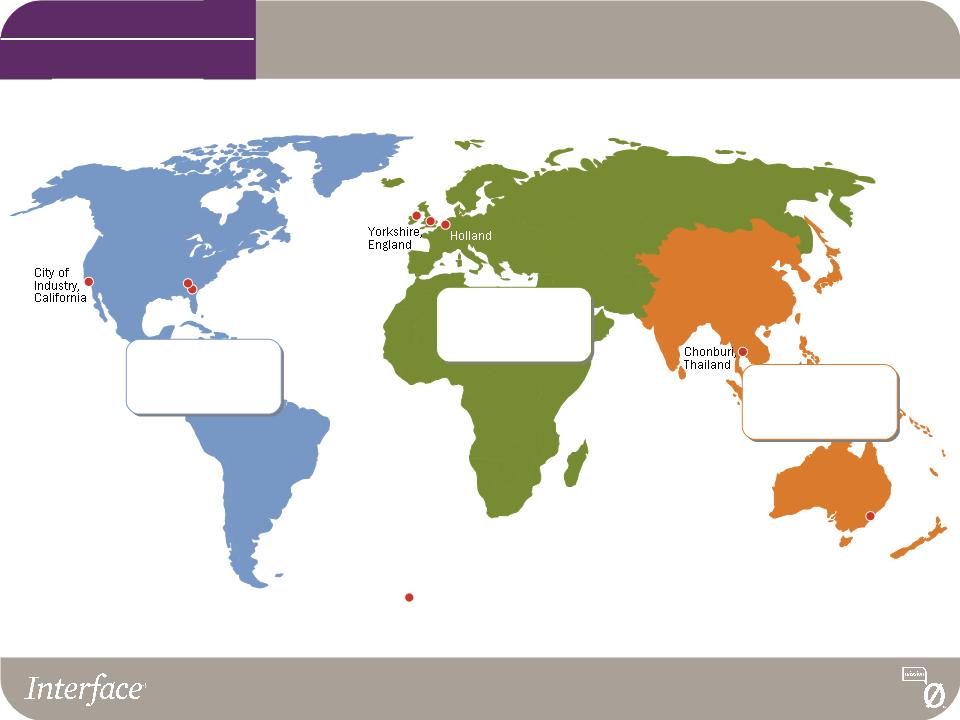
Global Manufacturing Capabilities and Local
Distribution
Distribution
N. Ireland
Picton,
Australia
Australia
Manufacturing Facility
LaGrange,
Georgia
Georgia
Americas
55% of Sales
50% of Production
Europe
34% of Sales
34% of Production
Asia-Pacific
11% of Sales
16% of Production
Note: Figures represent FYE 2008
Global Make-to-Order
Value Drivers
32
1. Increases speed to market
2. Promotes innovation
3. Offers unique custom product
capabilities
capabilities
4. Supports a constant flow of new
products
products
5. Offers sales force the opportunity to
visit the customer with new products
visit the customer with new products
6. Decreases lead time to customers
7. Increases inventory turns
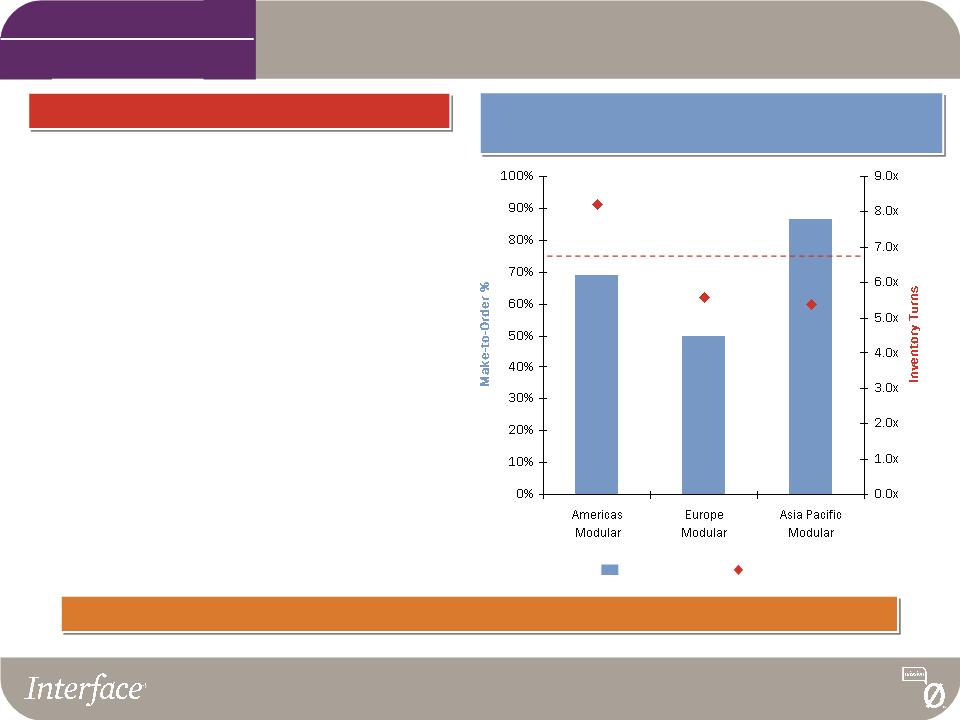
The Made-to-Order ADVANTAGE
Interface Modular Businesses
2008 Make-to-Order % and Inventory Turns
Interface is the ONLY company with a “make-to-order” approach to the market
75% TARGET Level
Strong Competitive Advantage Through
Make-to-Order Philosophy
Make-to-Order Philosophy
Note: Figures represent FYE 2008
Global Make-to-Order
Value Drivers
Make-to-Order %
Inventory Turns
33
Interface Innovation
1. INVENTED carpet tile in Europe (1950s) and PIONEERED the modular concept
In the U.S. (1970s)
In the U.S. (1970s)
2. FIRST to move away from the monolithic broadloom look for carpet tile
3. FIRST to introduce a make-to-order offering
4. FIRST in the industry to recognize the importance of sustainability
5. FIRST to introduce 100% post-consumer recycled backing
6. FIRST to introduce modular products designed to be installed randomly
7. EARLY adopter in the residential market
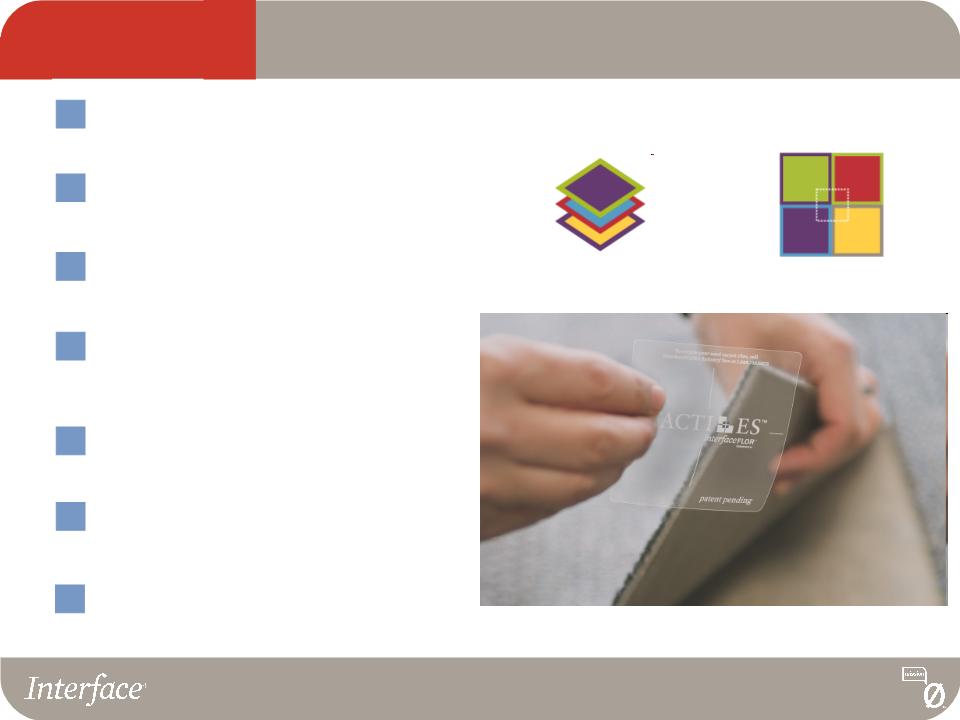
8. FIRST to introduce a “glueless” installation - TacTiles
9. FIRST to introduce post-consumer recycled content face yarns
10. FIRST to introduce moisture vapor barrier
Interface Leads with INNOVATION
Value Drivers
Innovation & Design
34
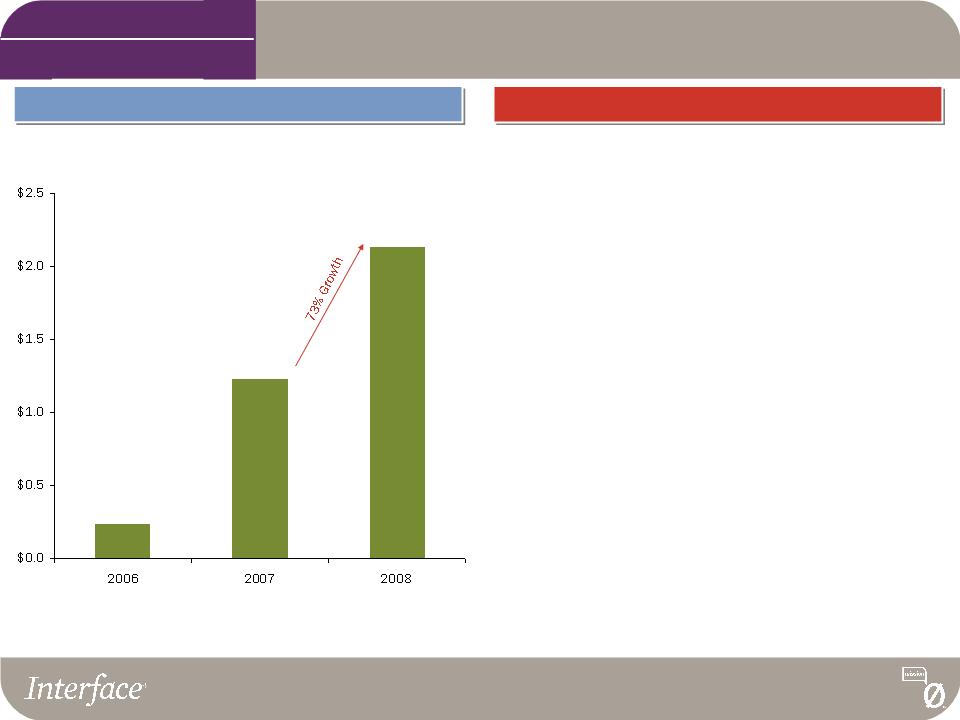
TacTiles Sales Exceed $2 Million as We Drive
“Glueless” Installation Exclusive to Interface
“Glueless” Installation Exclusive to Interface
Value Drivers
($ in mms)
* Includes TacTiles and TacTiles dispensers
$0.2
$1.2
$2.1
Sales of TacTiles
Benefits of TacTiles
§ Patented No Glue / No VOCs installation
system
system
§ 25% of current orders include TacTiles
§ High margin product
§ Leading to other new innovations - Moisture
Guard 2.0
Guard 2.0
§ Outside distribution protects our share of
new channels that switch to “glueless”
installation
new channels that switch to “glueless”
installation
Innovation & Design
35
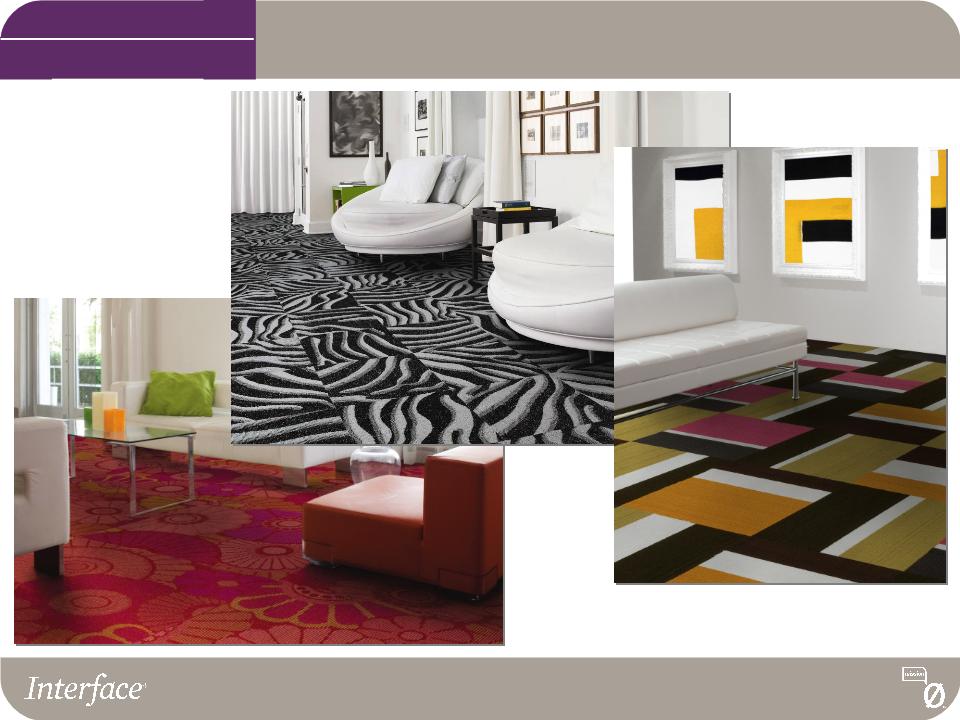
Market Leader in Product DESIGN and FASHION
Value Drivers
Innovation & Design

36
Brands that Deliver Our Promise of High End
Functionality, Quality and Design
Functionality, Quality and Design
Source: 2008 Floor Focus Magazine (U.S. Market)
Interface Rated the “Best
Overall Business Experience”
for the 5th
for the 5th
Year in a Row
Favorite Carpet Manufacturers
Service
Quality
Design
Performance
Value
Value Drivers
Innovation & Design
37
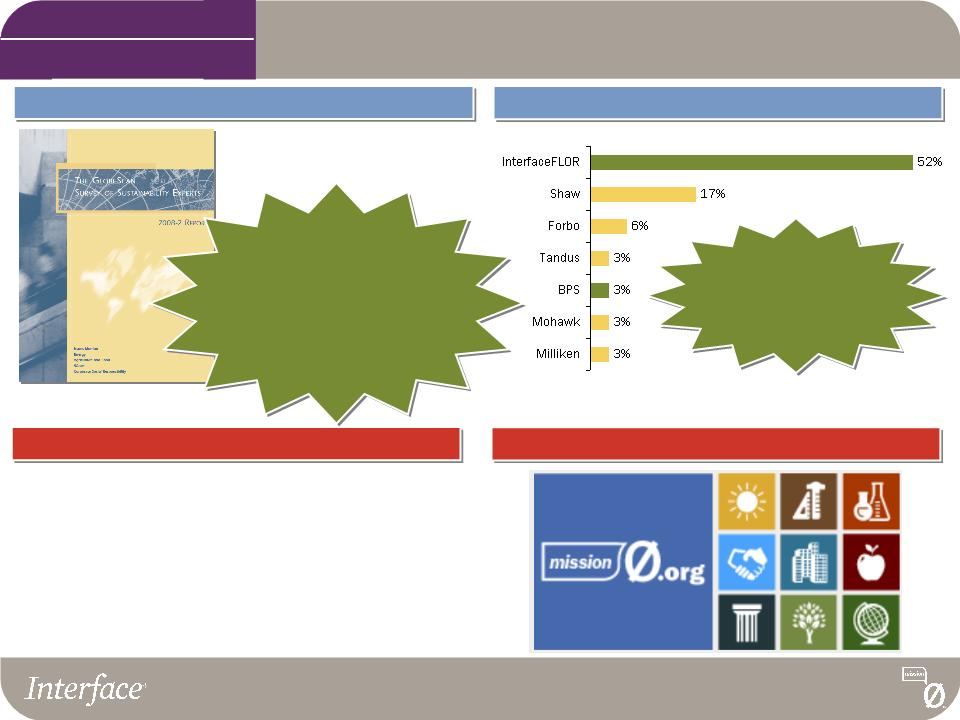
Interface Continues to be Recognized as the
Leader in Sustainability
Leader in Sustainability
Sustainability
2008 GlobeScan Survey of Sustainability Experts
Floor Focus Green Leaders 2008
Source: 2008 Floor Focus Magazine (U.S. Market)
§ Employee programs
§ NGO partnerships
§ Policy working groups
§ Standards development groups
Interface received
“Green Kudos”
for closed loop processes
and recycled content
Value Drivers
Stakeholder Engagement
MissonZero.org
Interface was again
named the top company
above companies like BP, General
Electric, Shell and Toyota
that comes to mind as fulfilling
their responsibility to society
better than others.
38
Interface Continues to be Recognized as the
Leader in Sustainability
Leader in Sustainability
Sustainability
Value Drivers
§ Product/Process Innovation:
– Random Carpet Tile Patent
– TacTiles
– Cool Blue (100% Recycled Backing)
– Cool Carpet (Climate Neutral)
– Landfill Gas Project
– LEED innovation credits
– ReEntry Process (post-consumer content
recycled face yarn)
recycled face yarn)
§ The Federal Stimulus bill will provide potential
opportunities for funding of corporate research and
development incentives for projects focused on
renewable energy and carbon reductions
opportunities for funding of corporate research and
development incentives for projects focused on
renewable energy and carbon reductions
Sustainability-Focused Innovation
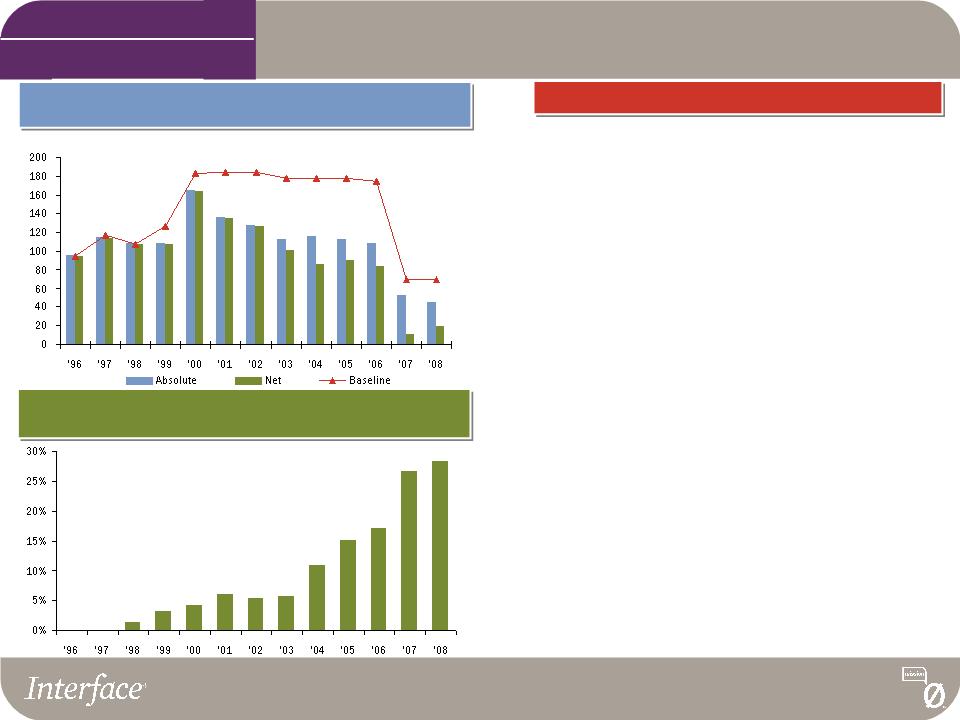
Greenhouse Gas Emissions
(metric tons of CO2 equivalent in thousands)
Energy from Renewable Resources at Carpet Manufacturing
Facilities (percent of total energy use)
Facilities (percent of total energy use)
28%
Absolute GHG emissions have been reduced by 34% and further offset by an
additional 37% as a result of company owned GHG projects.
39
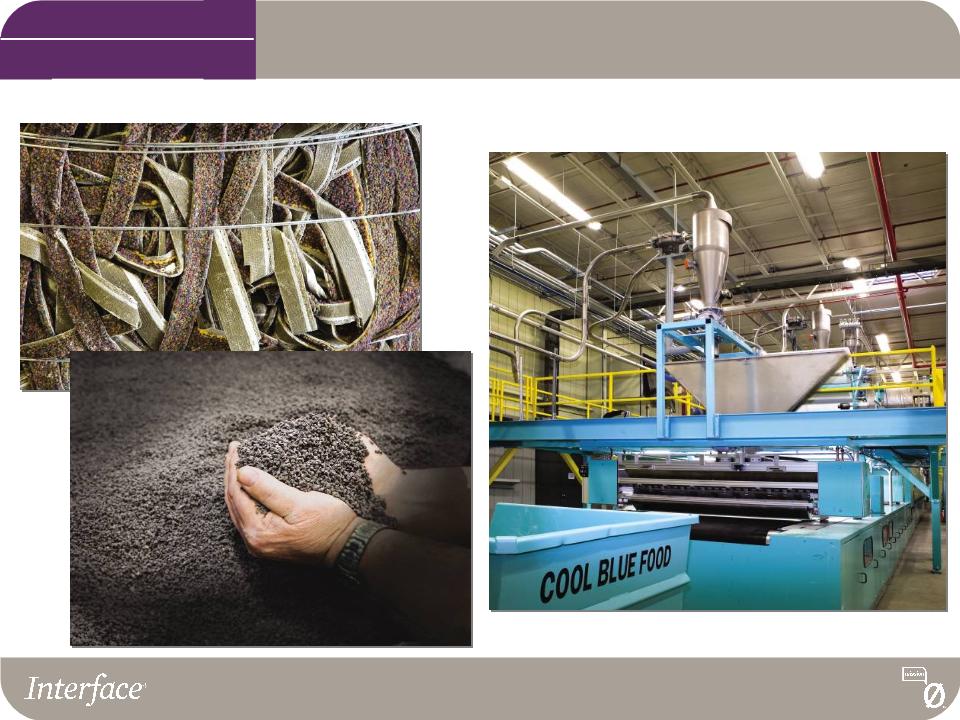
ReEntry and Cool Blue
ReEntry
Cool Blue
Sustainability
Value Drivers
40
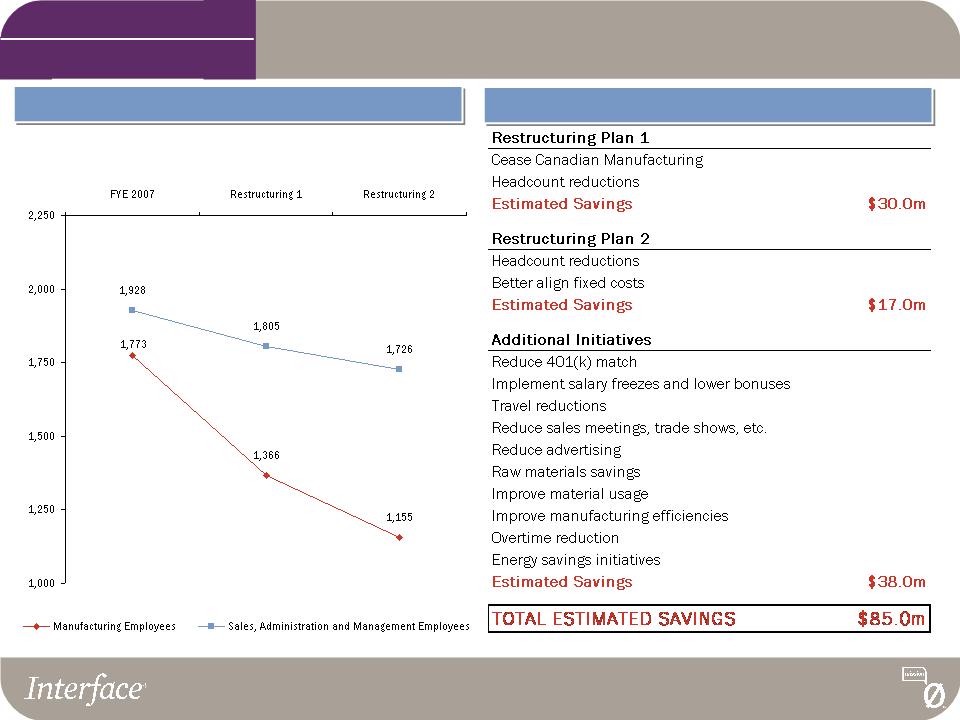
Right-sizing our Business
Profitability
Value Drivers
Interface Headcount
↓ 530
Employees
↓ 290
Employees
Cost Savings Initiatives
↓ 35%
↓ 10%
41
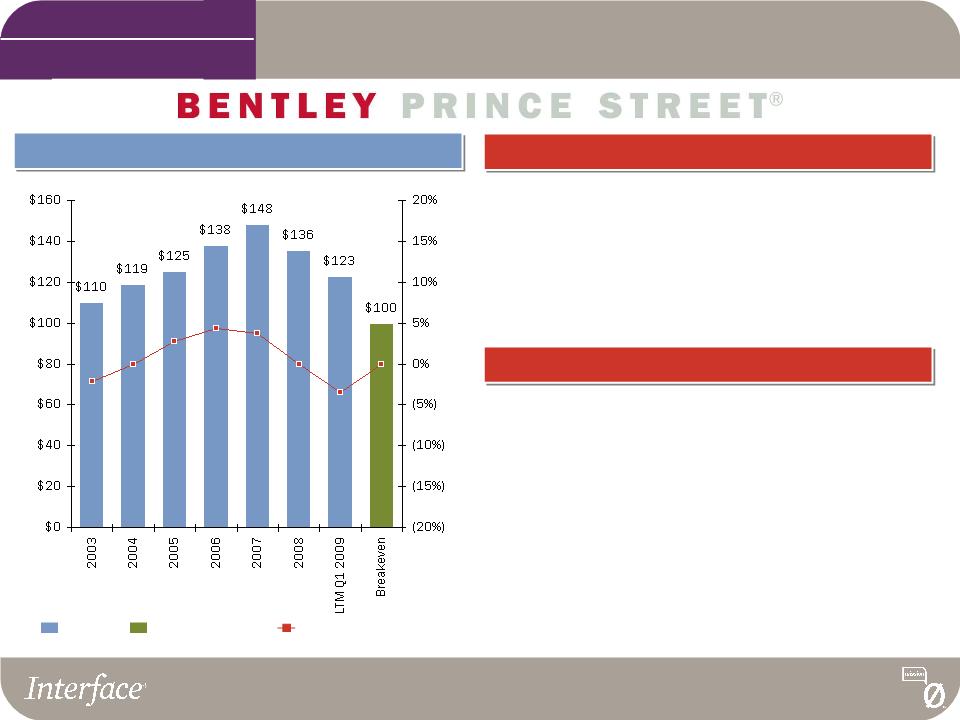
Downsizing Bentley Prince Street to Breakeven
Profitability
Value Drivers
Net Sales and Operating Income
Current Realities
Net Sales
Operating Income % of Net Sales
§ Contracting broadloom market - particularly high-end
§ Non-cash goodwill charge of $61.2 million in 2008 due to
revised projections and declining valuations of market
comparables
revised projections and declining valuations of market
comparables
§ Operating efficiency challenges resulting from declining
revenue base
revenue base
Profitability Protection
§ Realigned business to $100 million breakeven point:
- Reduced headcount by 157 employees (30%)
- Implemented expense reduction and manufacturing
efficiency initiatives that are expected to yield $7
million in annualized savings
efficiency initiatives that are expected to yield $7
million in annualized savings
- Anticipated raw materials savings of almost $3 million
- Realigned product portfolio and rationalized
manufacturing operations
manufacturing operations
Breakeven Net Sales
($ in millions)

Financial Overview
43
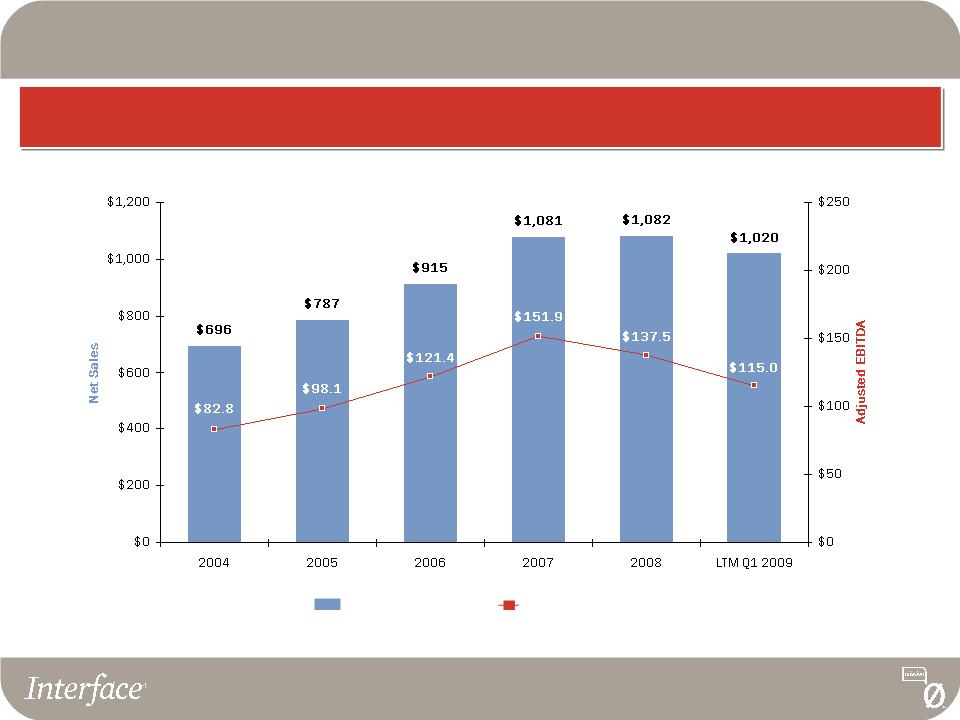
Net Sales and Adjusted EBITDA*
(Continuing Operations)
Consolidated Financial Results
($ in millions)
Adjusted EBITDA
Net Sales
* See page 48 for a reconciliation of Adjusted EBITDA
44
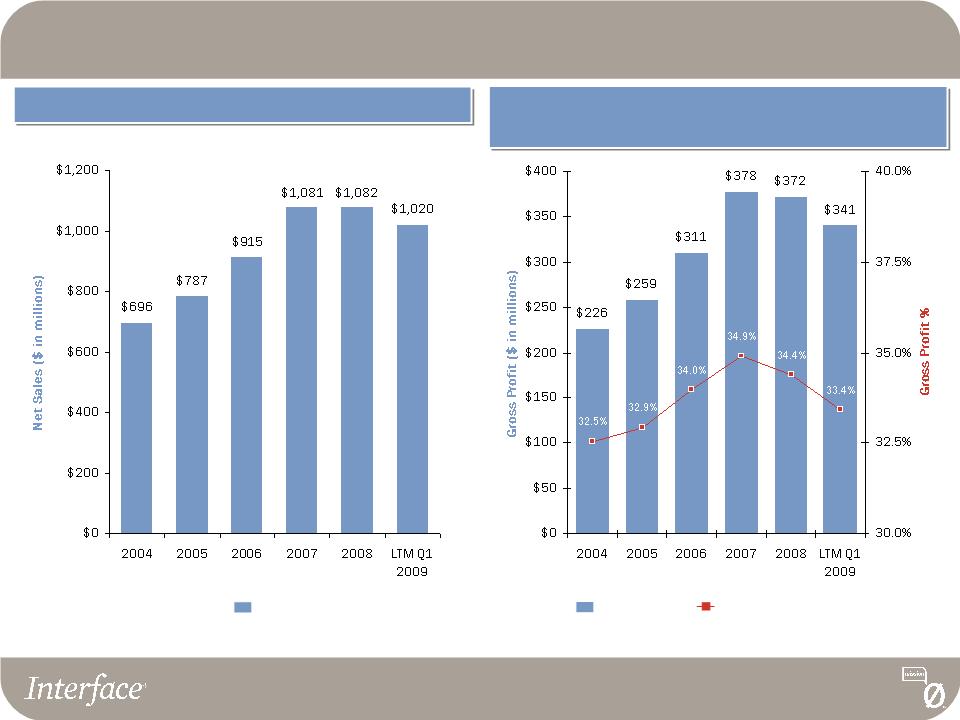
Net Sales
Gross Profit and
Gross Profit % of Net Sales
Net Sales
Gross Profit
Gross Profit % of Net Sales
Interface Financial Results From Continuing Operations
45
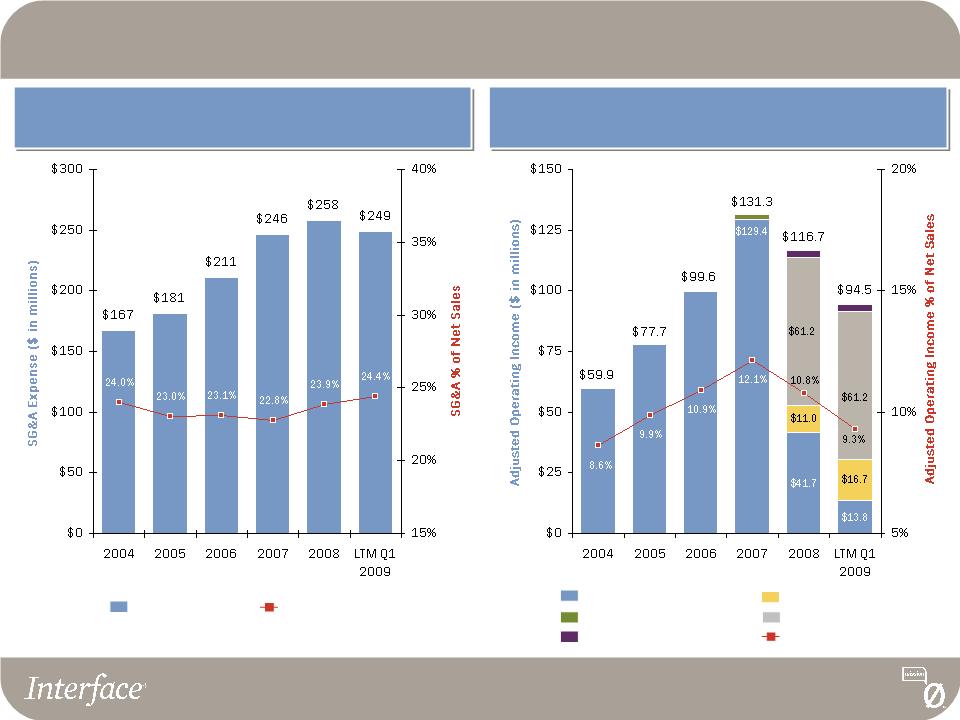
SG&A Expense and
SG&A % of Net Sales
Adjusted Operating Income* and
Adjusted Operating Income % of Net Sales
SG&A Expense
SG&A % of Net Sales
Reported Operating Income
Restructuring Charges
Loss on Disposal ($1.9m)
Operating Income % of Net Sales
Goodwill Impairment
Decline in Insurance Value ($2.8m)
* See page 48 for a reconciliation of Adjusted Operating Income
Interface Financial Results From Continuing Operations
46
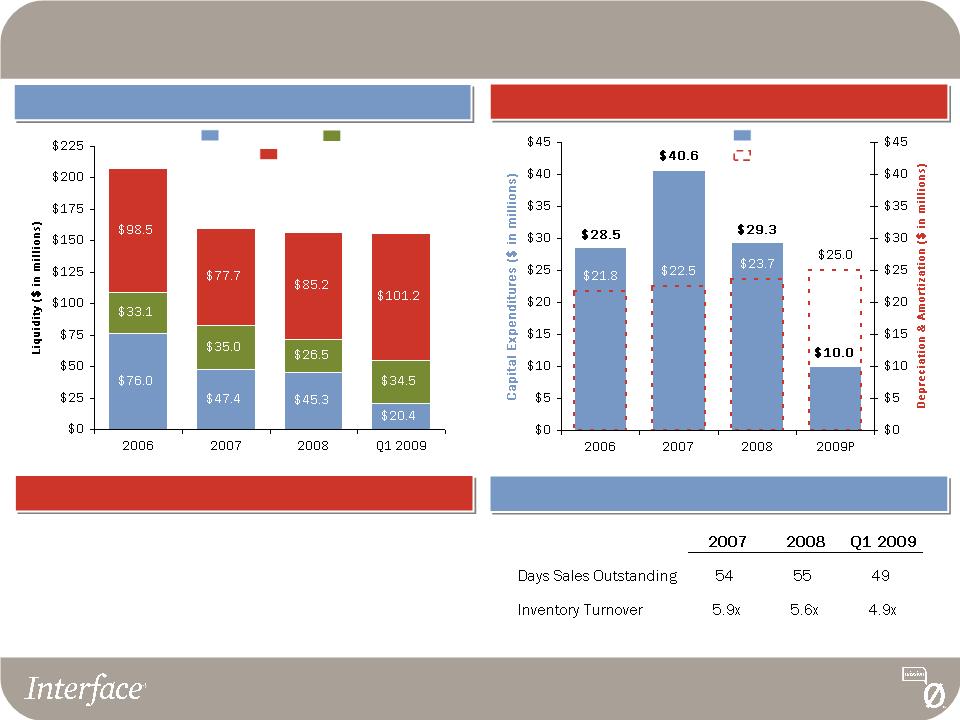
§ Protect profitability - expect to generate $35-$50 million of cash
from operating activities in 2009
from operating activities in 2009
§ Reduce capital spending to $10 million - maintenance capital
expenditures only or a payback period of one year or less
expenditures only or a payback period of one year or less
§ Continue to maximize working capital including DSO contraction and
increased inventory turns
increased inventory turns
Interface Liquidity Strategy
Capital Expenditures
Working Capital Ratios
Interface Liquidity Strategy
Capital Expenditures
Depreciation &
Amortization
Liquidity Position
U.S. Cash Position
International Cash Position
Availability Under U.S. and
International Revolvers*
$207.7
$160.1
$157.0
* Q1 2009 revolver availability includes the €32 million ($42 million) European credit facility effective May 1, 2009
$156.1
47
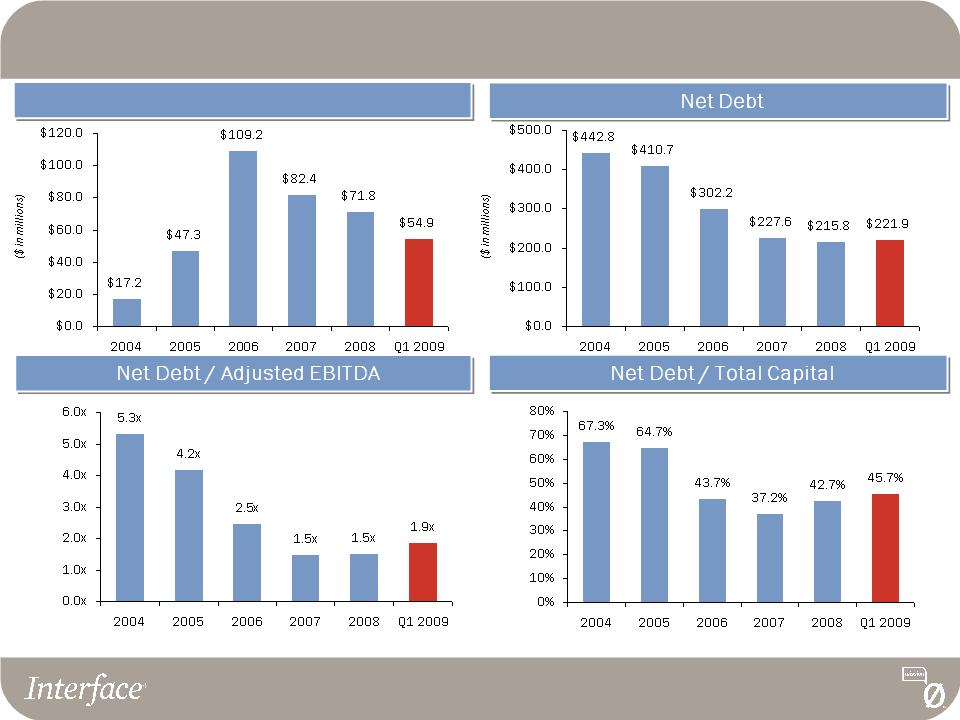
Key Credit Statistics* (All data excludes the Fabrics Division sold in 2007)
Ending Cash Balance
* See page 48 for a reconciliation of Net Debt and Adjusted EBITDA
48
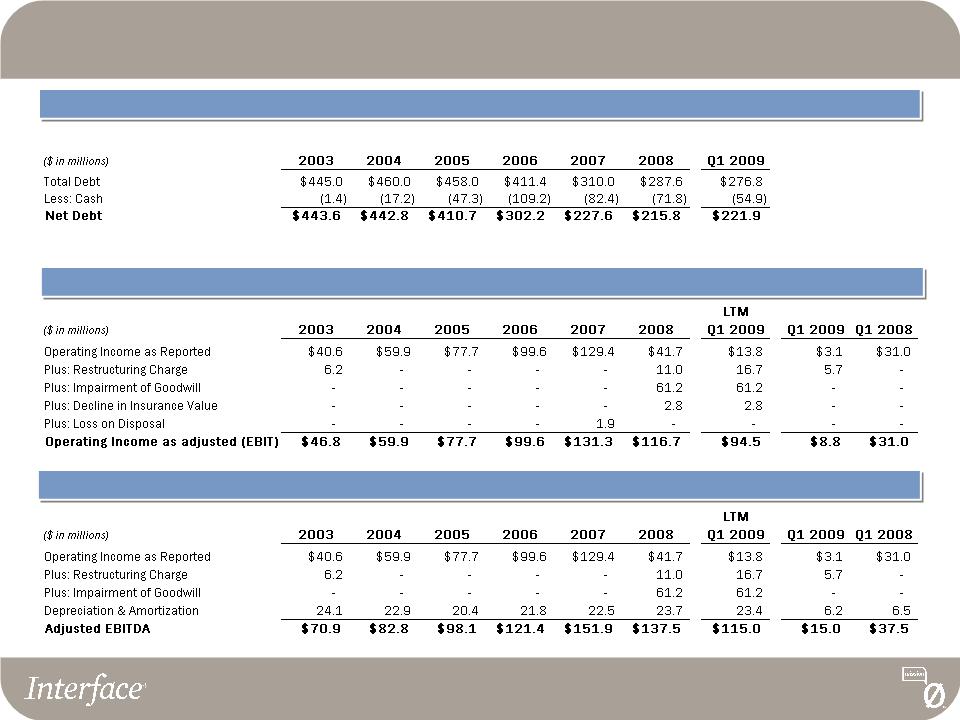
Appendix: Reconciliation of Non-GAAP Financial Measures
Net Debt (pg. 47)
Adjusted Operating Income (pg. 45)
Adjusted EBITDA (pg. 43 and 47)