Free signup for more
- Track your favorite companies
- Receive email alerts for new filings
- Personalized dashboard of news and more
- Access all data and search results
Filing tables
Filing exhibits
- 8-K/A Current report
- 4.1 First Supplemental Indenture Dated Nov. 17, 2010
- 4.2 Second Supplemental Indenture Dated Nov. 17, 2010
- 99.1 Termination of Split-dollar Agreement Dated Nov. 18, 2010
- 99.2 Press Release Announcing Receipt of Requisite Consents
- 99.3 Press Release Announcing Commencement of Private Debt Offering
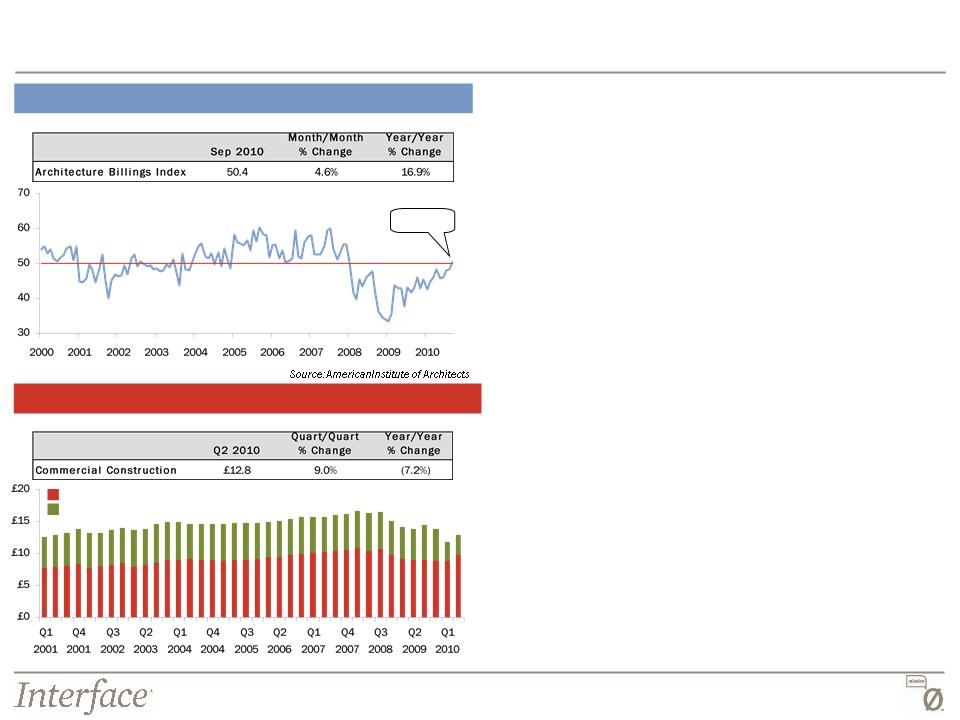
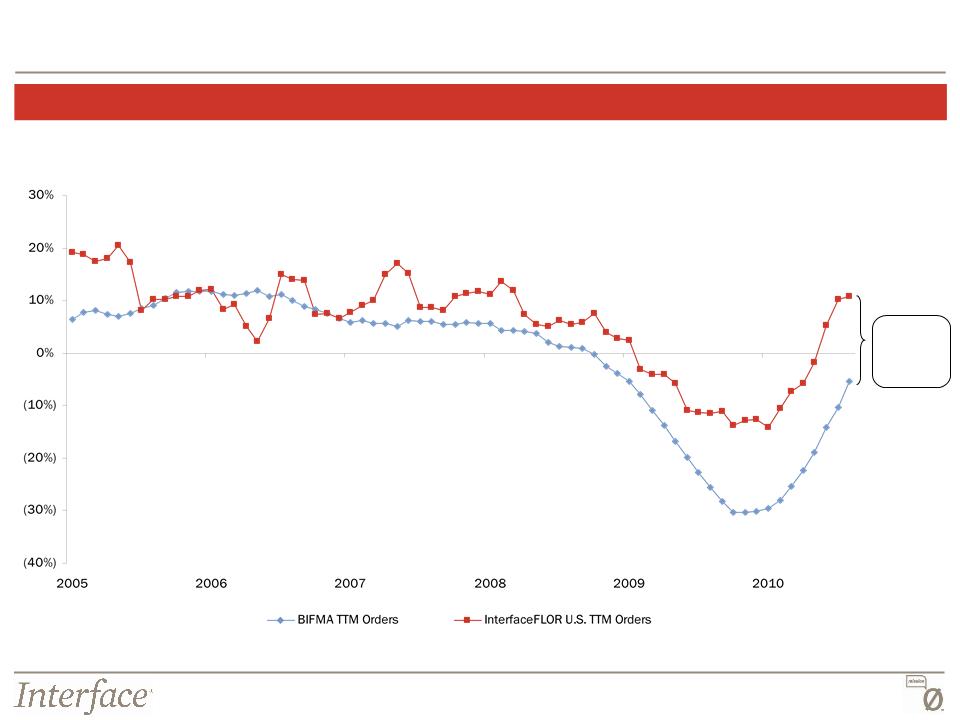
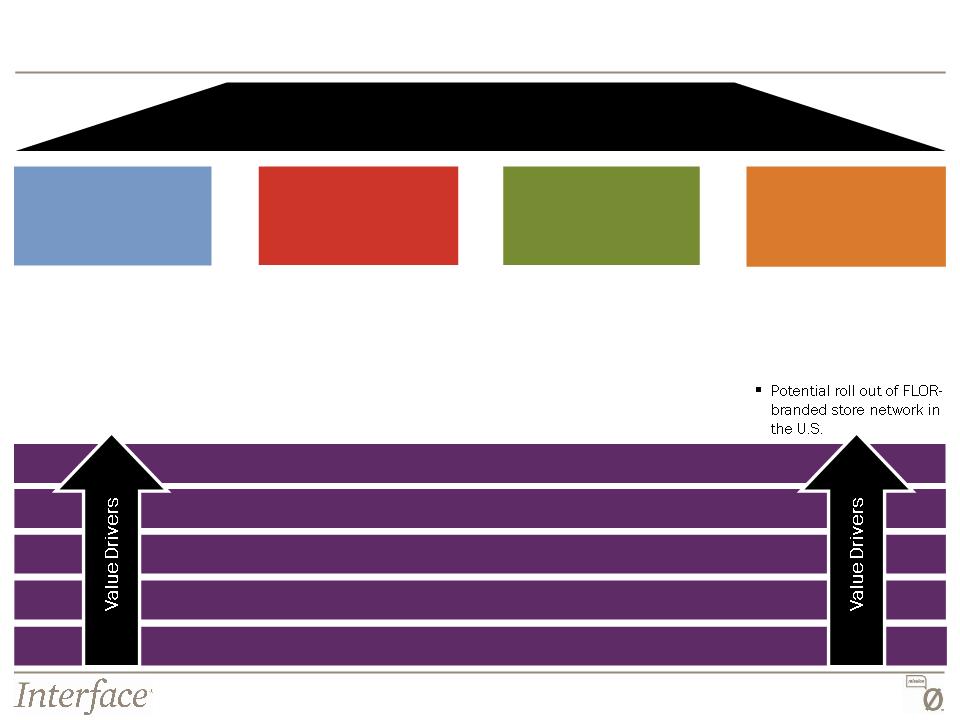
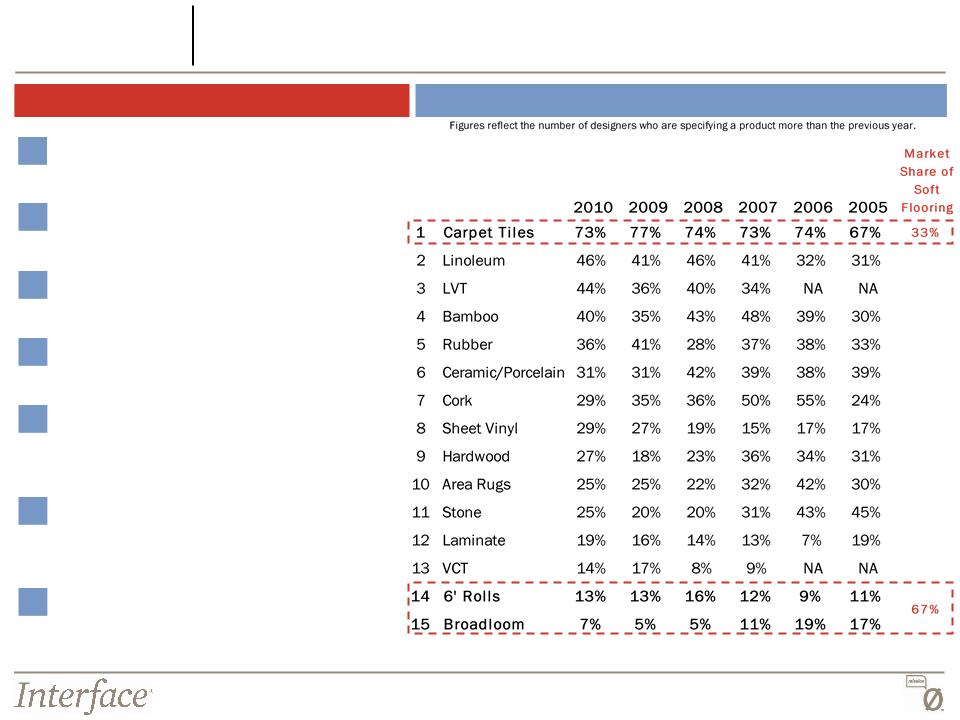
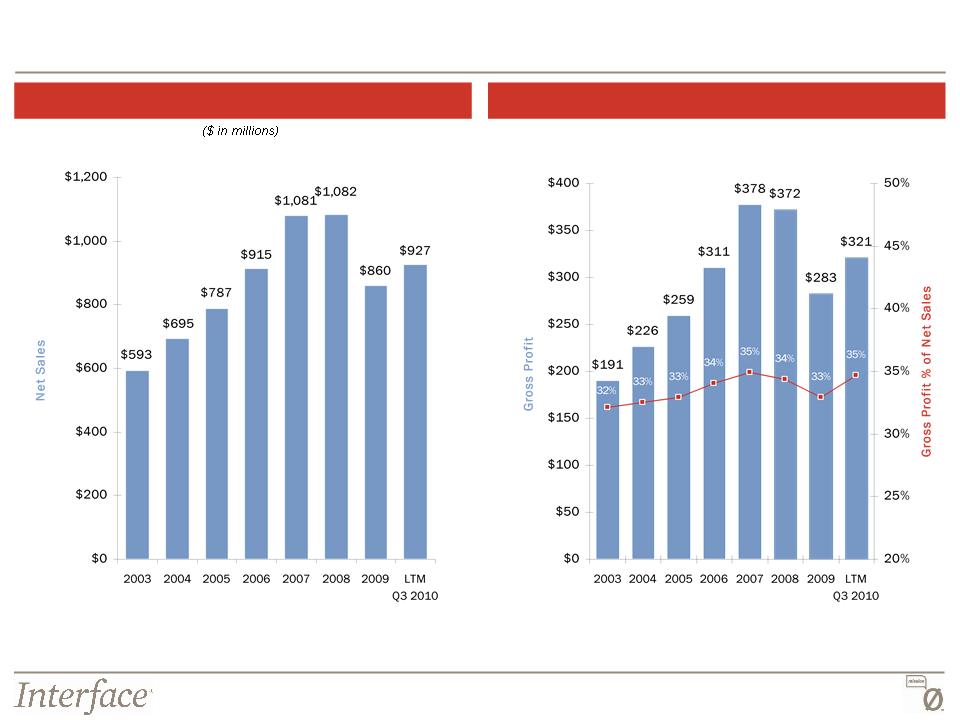
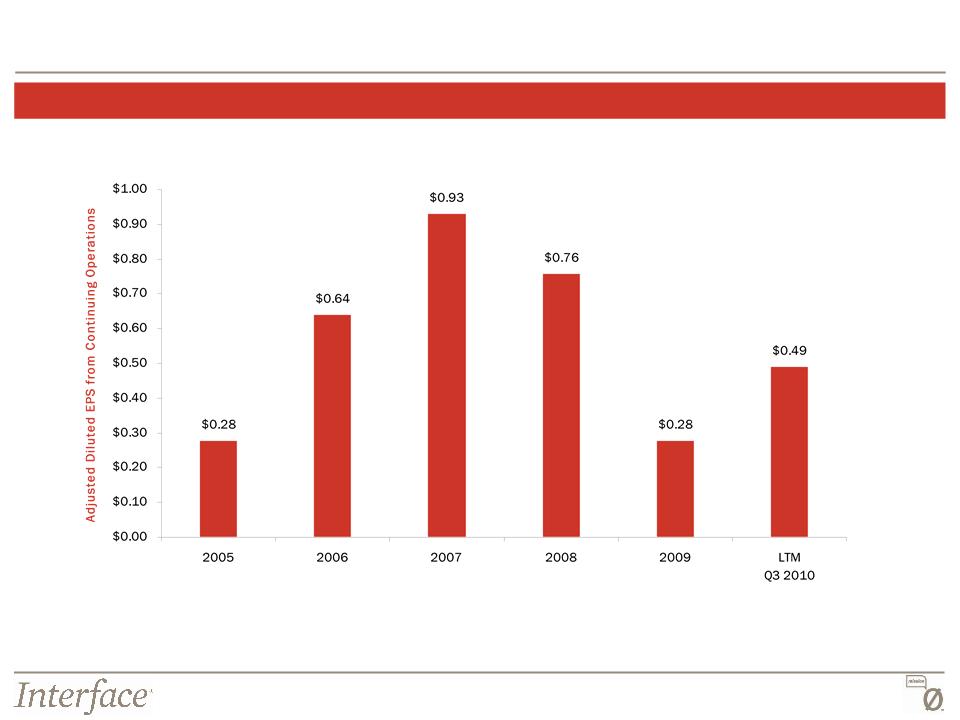
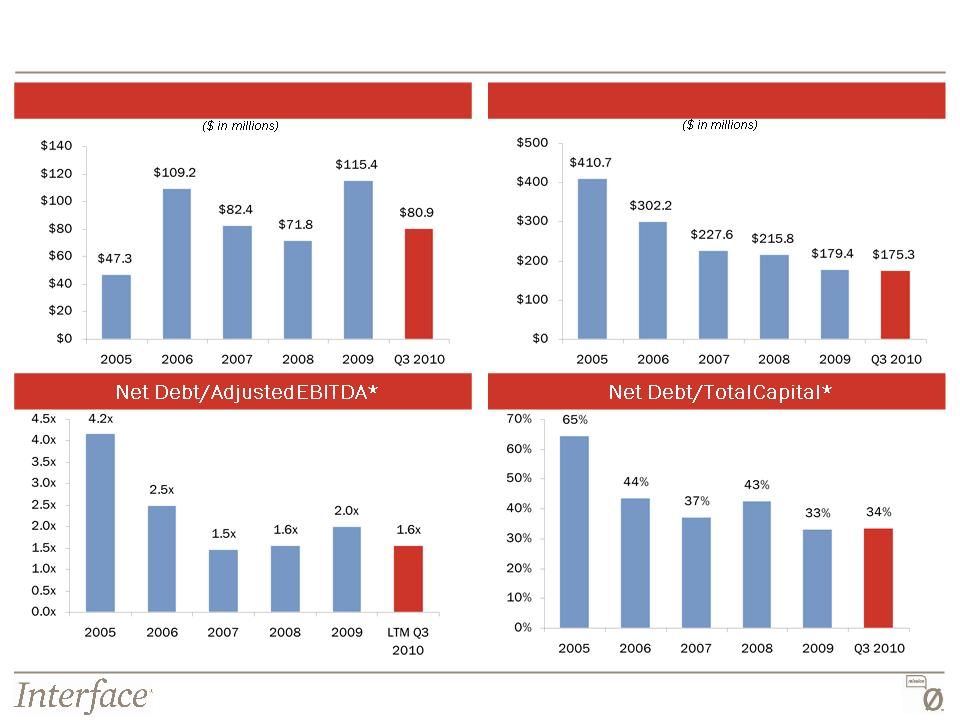
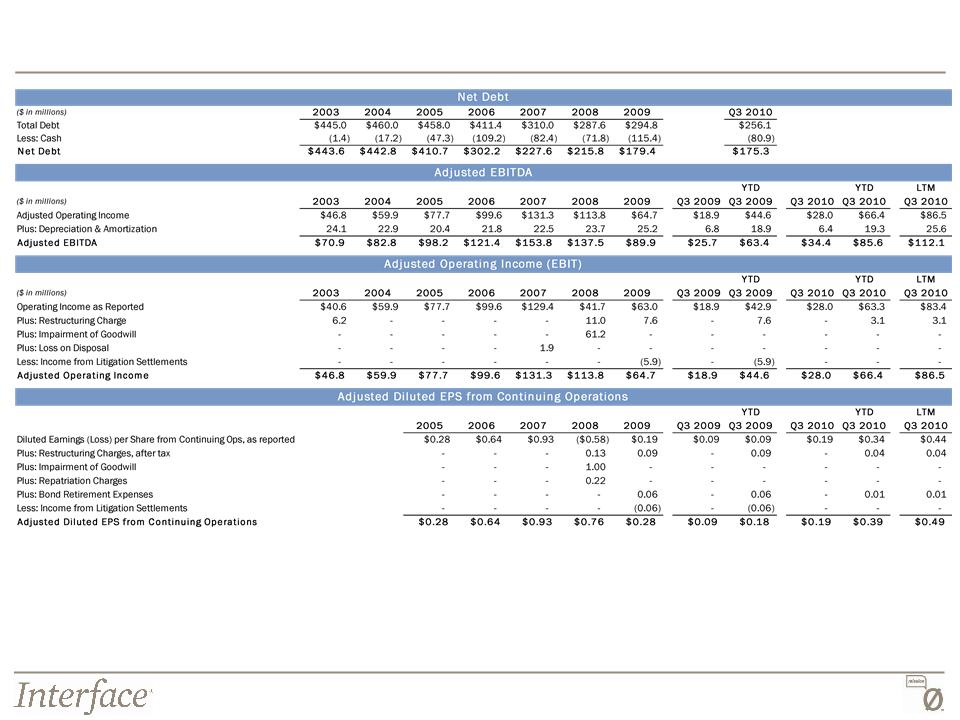
- 99.4 Investor Presentation Dated November 2010
TILE similar filings
- 23 Feb 11 Interface Reports Fourth Quarter and Full Year 2010 Results
- 2 Feb 11 Entry into a Material Definitive Agreement
- 7 Dec 10 Interface Announces Closing of $275 Million Senior Notes Offering
- 19 Nov 10 Entry into a Material Definitive Agreement
- 18 Nov 10 Entry into a Material Definitive Agreement
- 9 Nov 10 Interface Commences Tender Offer and Consent Solicitation
- 27 Oct 10 Interface Reports Third Quarter 2010 Results
Filing view
External links