Investor Presentation2018
This presentation contains forward-looking statements, including, in particular, statements about Interface’s plans, strategies and prospects. These are based on the Company’s current assumptions, expectations and projections about future events.Although Interface believes that the expectations reflected in these forward-looking statements are reasonable, the Company can give no assurance that these expectations will prove to be correct or that savings or other benefits anticipated in the forward-looking statements will be achieved. Important factors, some of which may be beyond the Company’s control, that could cause actual results to differ materially from management’s expectations include the risk that the recently completed nora acquisition will not perform as expected, as well as the matters discussed under the heading “Risk Factors” included in Item 1A of the Company’s most recent Annual Report on Form 10-K, filed with the Securities and Exchange Commission, which discussion is hereby incorporated by reference. Forward-looking statements speak only as of the date made. Forward-looking statements in this presentation include, without limitation, the information set forth on the slide titled “Growth and Value Creation Strategy”, the section of this presentation titled “Growth and Value Creation” (including without limitation the slide titled “Transaction Overview”) and the slide titled “Targets”. Other forward-looking statements can be identified by words such as “may,” “expect,” “forecast,” “anticipate,” “intend,” “plan,” “believe,” “could,” “seek,” “project,” “estimate,” “target,” and similar expressions. The Company assumes no responsibility to update or revise forward-looking statements and cautions listeners and meeting attendees not to place undue reliance on any such statements. Forward Looking Statements
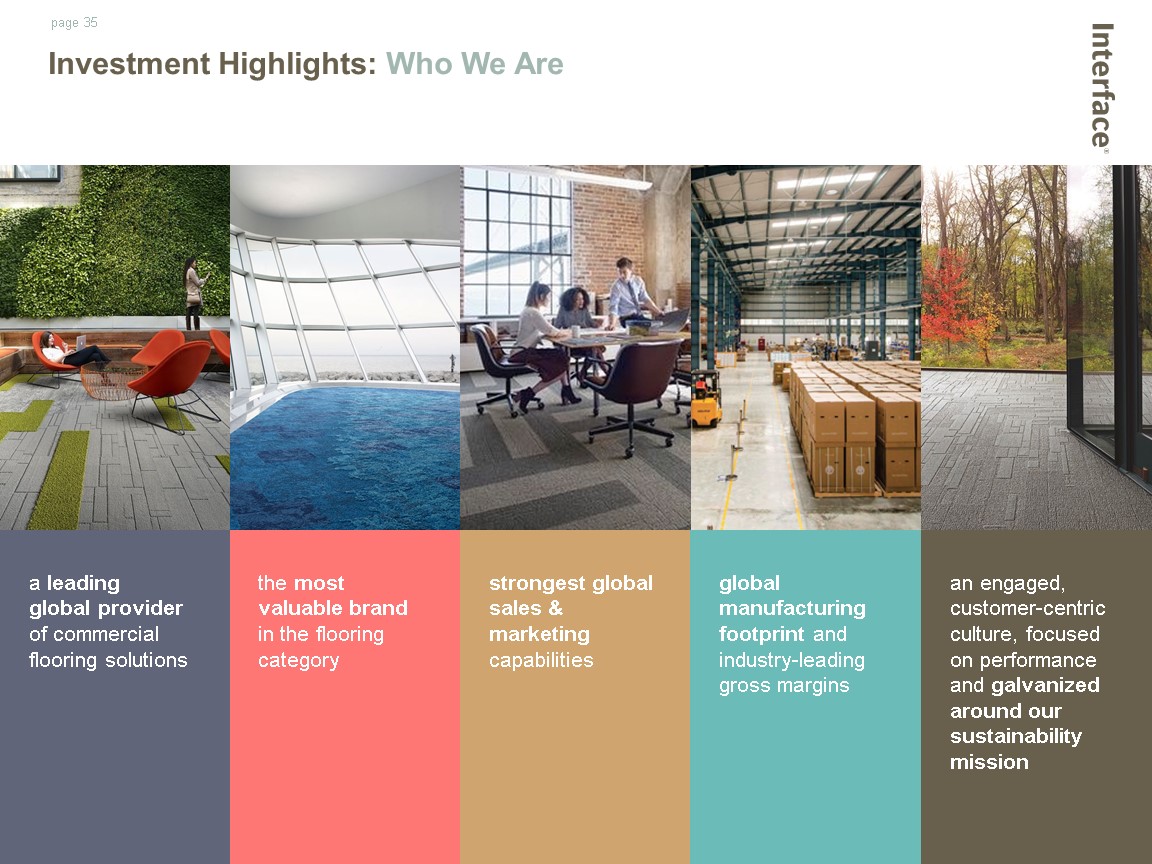
Investment Highlights: Who We Are a leadingglobal provider of commercial flooring solutions the most valuable brand in the flooring category strongest global sales & marketing capabilities global manufacturing footprint and industry-leading gross margins an engaged, customer-centric culture, focused on performance and galvanized around our sustainability mission
Grow the CoreCarpet Tile Business Build a Modular Resilient Flooring Business ExecuteSupply ChainProductivity Optimize SG&AResources Growth and Value Creation Strategy Lead a World-Changing Sustainability MovementCentered Around Mission Zero and Climate Take Back. Interface’s vision is to become the world’s most valuable interior products & services company
Interface Positioning InterfacePositioning
GLOBAL COMMERCIAL FLOORING SEGMENT (in billions) Source: Management estimates Leading Global Provider of Modular Flooring Solutions Interface participates in the $34 Billion Global Commercial Flooring segment We are the global share leader in the $4.4 Billion Carpet Tile segment which continues to take share from broadloom We entered the high growth $2.4 Billion LVT segment, expanding our served customer base by 50% $9.8B $9.8 $5.1 $2.3 $0.9 $1.0 $2.4 $2.4 $5.6 $4.4
GLOBAL COMMERCIAL FLOORING: SEGMENT SIZE vs FORECAST GROWTH and GROSS MARGIN Source: USFLOOReport, Catalina Research and Management estimates Participating in Attractive Commercial Flooring Segments Interface serves growing segments of hard and soft surface with the highest margins
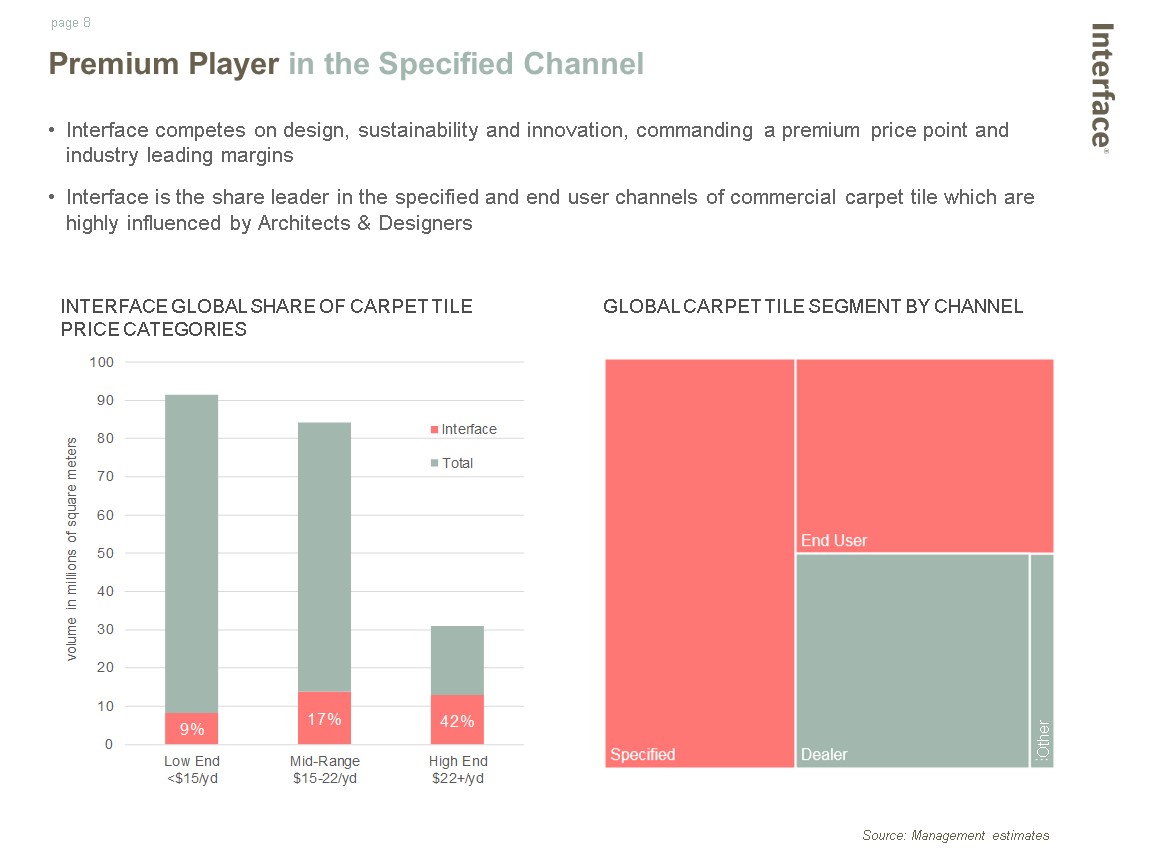
GLOBAL CARPET TILE SEGMENT BY CHANNEL Premium Player in the Specified Channel Interface competes on design, sustainability and innovation, commanding a premium price point and industry leading marginsInterface is the share leader in the specified and end user channels of commercial carpet tile which are highly influenced by Architects & Designers INTERFACE GLOBAL SHARE OF CARPET TILE PRICE CATEGORIES Source: Management estimates Other
Benefits of ModularCreative design freedomNo glue, no padLower cost to changeProduces less wasteFaster, more profitable installation for contractorsEasier to reconfigure and maintainSelective Replacement Modular Product Portfolio
Carpet TileBiomimicry-inspired random design (i2)High recycled content No glue installation (TacTiles®)Climate neutral offering (Cool Floor™)Faster, more profitable installation for contractorsEasily recycled (ReEntry® program)Luxury Vinyl Tile (LVT)Creative design freedomComplements and enhances our carpet tile portfolio No transition strips needed Same sizes as our carpet tilesHigh acoustic value (Sound Choice™ backing) Climate neutral offering (Cool Floor™) Modular Product Portfolio
Global Sales and Manufacturing Platform Sales in over 110 countries600+ Interface sales & marketing professionalsGlobal account management Note: Figures represent FYE 2017 Six manufacturing locations on four continentsGlobal supply chain managementUnique blend of efficiency and customization Manufacturing Facility Showroom Location AMERICAS59%of Net Sales EMEA25%of Net Sales ASIA-PACIFC16% of Net Sales
Diversified Customer Verticals CORPORATE OFFICEHighest penetration of carpet tile vs broadloomGlobal Account managementEmerging market penetration EDUCATIONK-12 and higher educationSecond highest penetration of carpet tile vs broadloom HOSPITALITYGuest rooms, corridors and public spacesNamed the brand standard or alternate at Hilton, Marriott, IGH and Choice Hotels properties RETAILRetail and bank branchesSignificant opportunity for broadloom conversionHigh penetration of LVT Note: Figures represent FYE 2017
Growth andValue Creation
Grow the CoreCarpet Tile Business Build a Modular Resilient Flooring Business ExecuteSupply ChainProductivity Optimize SG&AResources Growth and Value Creation Strategy Lead a World-Changing Sustainability MovementCentered Around Mission Zero and Climate Take Back. Interface’s vision is to become the world’s most valuable interior products & services company
Grow the Core Carpet Tile Business Enhance salesforce productivity – Execute on selling system transformation including reorganization, training and technology toolsElevate and grow segments – Drive growth in priority segments including Corporate Office, Hospitality, Living and EducationOptimize product portfolio – Expand our portfolio to increase the addressable marketLead the market in design and innovation – Continue to introduce innovative new products that energize and inspireContinue to develop brand love, commanding the strongest Net Promoter Score among A&D and End Users
Build a Modular Resilient Flooring Business Continue penetrating the high growth LVT segment – Build on successful global LVT launchExpand product portfolioLeverage innovation pipelineExpand global participation
Modular Resilient Flooring: nora Acquisition nora is a leading global manufacturer of commercial rubber floorcovering systems for healthcare, education, life sciences, public buildings and other end markets
GLOBAL COMMERCIAL FLOORING: SEGMENT SIZE vs FORECAST GROWTH and GROSS MARGIN Source: USFLOOReport, Catalina Research and Management estimates nora is a Global Leader in Performance Flooring nora is the leader in the nearly $1B rubber flooring category of the $34B global commercial flooring industryRubber flooring is ideal for applications that require hygienic, safe flooring with strong chemical resistance, and it is extremely durable compared to other flooring alternatives
Sales of €229M in 2017Founded in 1938 Headquartered in Weinheim, Germany with 15 offices worldwide One manufacturing facility in Weinheim with capacity for growthWarehouses in Weinheim, Salem, NH and Shanghai, China1,100 employees worldwideExperienced, direct sales force focused on specified market and generating sales in more than 80 countriesPremium brand recognition focused on products with superior performance and design:norament® - sheet rubbernoraplan® - modular rubber tilesFlooring related products – stair treads, inlays, accessories Who is nora SALES BY REGION SALES BY SEGMENT North America Europe Germany China EmergingMarkets Shoe Healthcare Education Industry Public Buildings Transportation Other Figures represent FY 2017
Interface and nora Together: Geographic Reach * * * * * * * Based on proforma 2017 gross billings +
Interface and nora Together: Segmentation * Based on proforma 2017 gross billings * * * Americas EMEA APAC Americas EMEA APAC + * * *
Transaction Overview Accelerates Interface’s value creation strategy by expanding Interface’s resilient product portfolio and accelerating growth in key non-office segments All cash purchase of approximately $400M for 100% of nora. Financed entirely with debt through a new term loan under Interface’s existing credit facilityPre-synergy purchase price multiple of 8.5x LTM Adjusted EBITDA. Post-synergy purchase price multiple of 7.0x LTM Adjusted EBITDAAnticipate revenue synergies that will provide 50-100 bps of additional sales for Interface and approximately $0.5M - $1M per year of cost synergies over the next five yearsExpected to be immediately accretive to gross margins and adjusted EPS, improving adjusted EPS by $0.03 to $0.06 in 2018 and $0.15 to $0.20 in 2019 Estimated sales of $280M in 2018Gross profit margins of approximately 45%SG&A as percentage of sales of approximately 34%Operating income margins of approximately 11%Adjusted EBITDA* margins of approximately 16% nora’s Financial Results * See Appendix for reconciliation
Execute Supply Chain Productivity Execute Troup Co. Optimization plan which we expect to yield annualized savings of $30MImplement a dynamic yarn strategyContinue to deliver on productivity pipeline initiativesFinalize global ERP system execution down to the factory floor
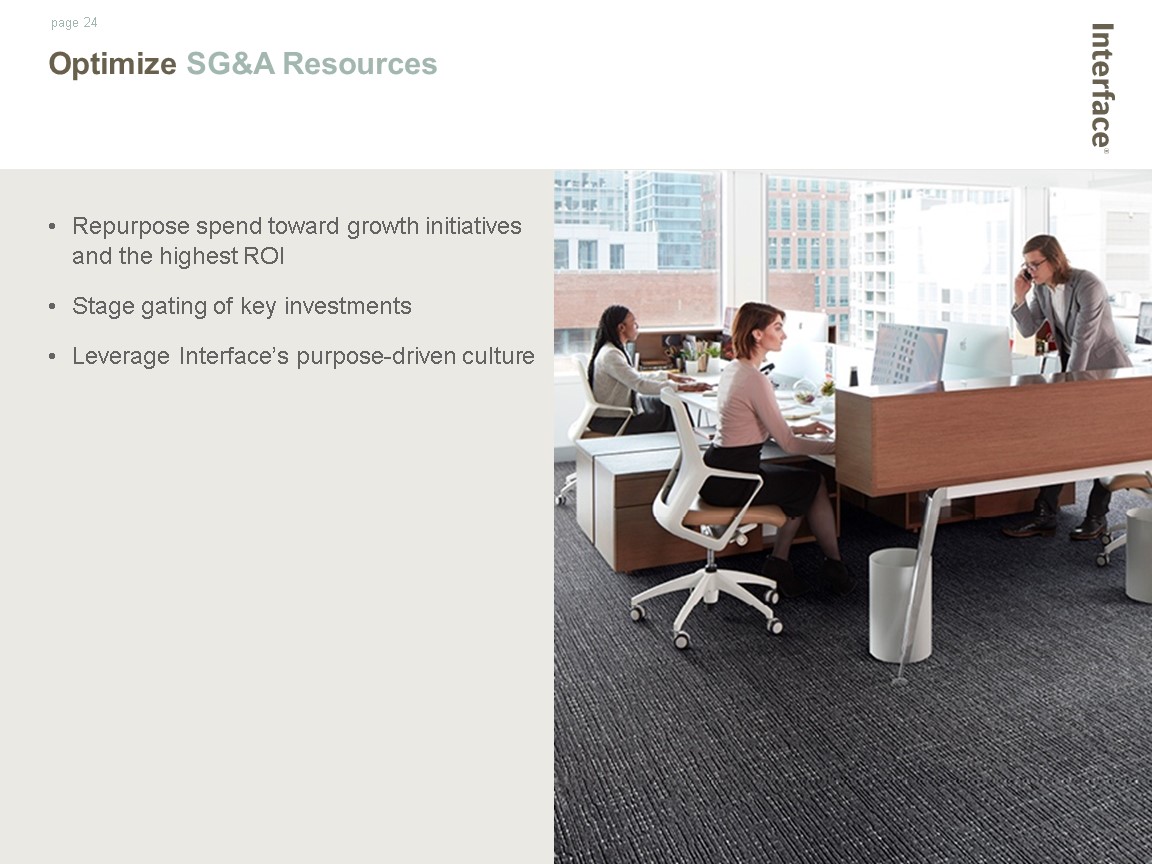
Optimize SG&A Resources Repurpose spend toward growth initiatives and the highest ROIStage gating of key investments Leverage Interface’s purpose-driven culture
Purpose-DrivenCultureGalvanizedAround aCommonSustainability Mission GLOBESCAN SUSTAINABILITY SURVEY – 20 YEAR HISTORY Unilever Patagonia Interface IKEA Tesla Natura M&S Nestle
We commit to running our business in a way that creates a climate fit for life – and we call on others to do the same.We are the only company that sells all of our flooring as carbon neutral and we expect to demonstrate that industry can operate with carbon negative business models. Purpose-Driven Companies Outperform their Peer Sets ENERGY USE 43% RENEWABLE ENERGY 88% GHG EMISSIONS 96% WASTE TO LANDFILL 91% WATER INTAKE 88% RECYCLED & BIOBASED MATERIALS 58% PRODUCT CARBON FOOTPRINT 66% Reduction versus 1996 Baseline CLIMATE TAKE BACK
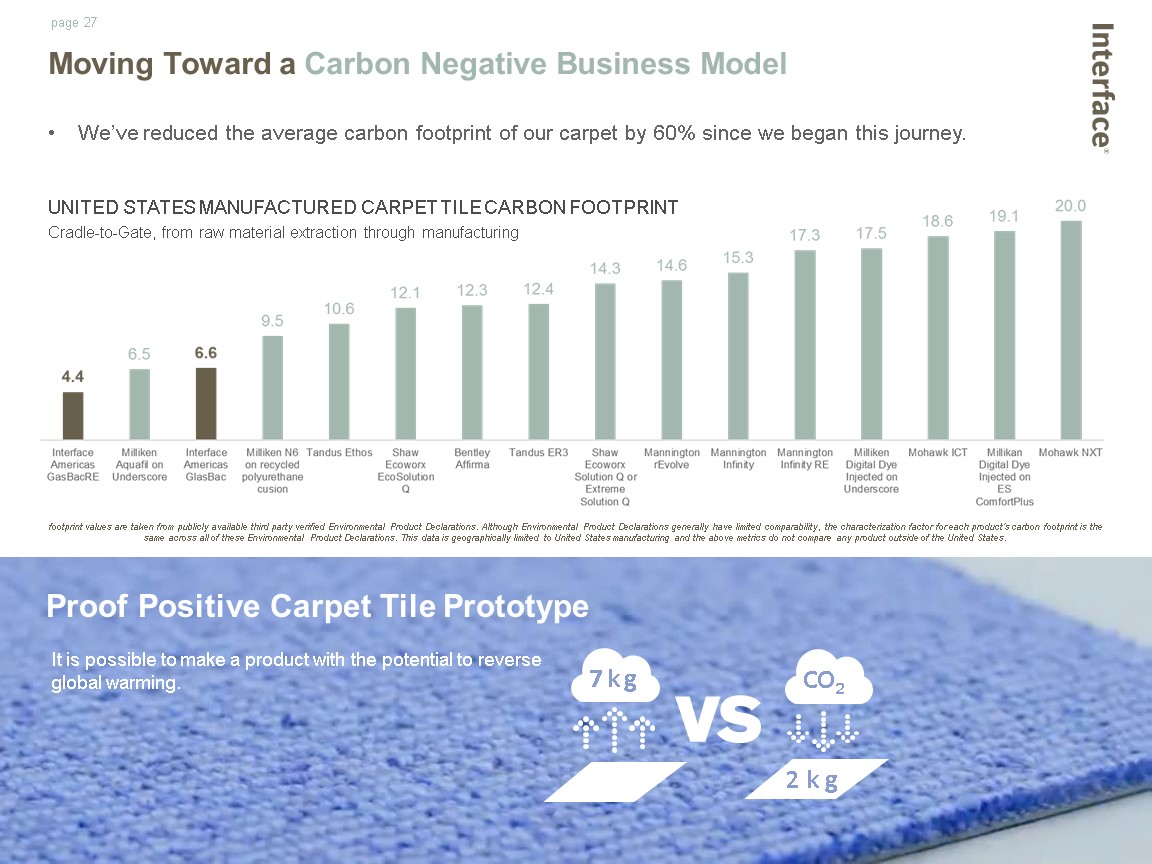
7 k g 2 k g UNITED STATES MANUFACTURED CARPET TILE CARBON FOOTPRINTCradle-to-Gate, from raw material extraction through manufacturing Moving Toward a Carbon Negative Business Model It is possible to make a product with the potential to reverse global warming. Proof Positive Carpet Tile Prototype CO2 footprint values are taken from publicly available third party verified Environmental Product Declarations. Although Environmental Product Declarations generally have limited comparability, the characterization factor for each product's carbon footprint is the same across all of these Environmental Product Declarations. This data is geographically limited to United States manufacturing and the above metrics do not compare any product outside of the United States. We’ve reduced the average carbon footprint of our carpet by 60% since we began this journey.
FinancialPerformance
Grow Revenue at 2x the IndustryBuild Industry Leading Gross Margins Manage SG&A Spend While Investing in Our Brand & Growth DriversEPS Growth 2x – 2.5x Revenue Growth Targets
GAAP Financial Results
* See Appendix for a reconciliation on Non-GAAP figures Financial Results*
Revenue Growth YTD ORGANIC SALES*($ in millions) Q2 ORGANIC SALES*($ in millions) 11% Growth * See Appendix for a reconciliation on Non-GAAP figures Organic Sales were up 11% in the second quarter and were up 9% year-to-date 9% Growth
Adjusted Earnings Per Share ADJUSTED EARNINGS PER SHARE*(Adjusted Diluted Earnings Per Share) * See Appendix for a reconciliation on Non-GAAP figures Our value creation strategy is generating double digit Adjusted EPS growth 15% CAGR
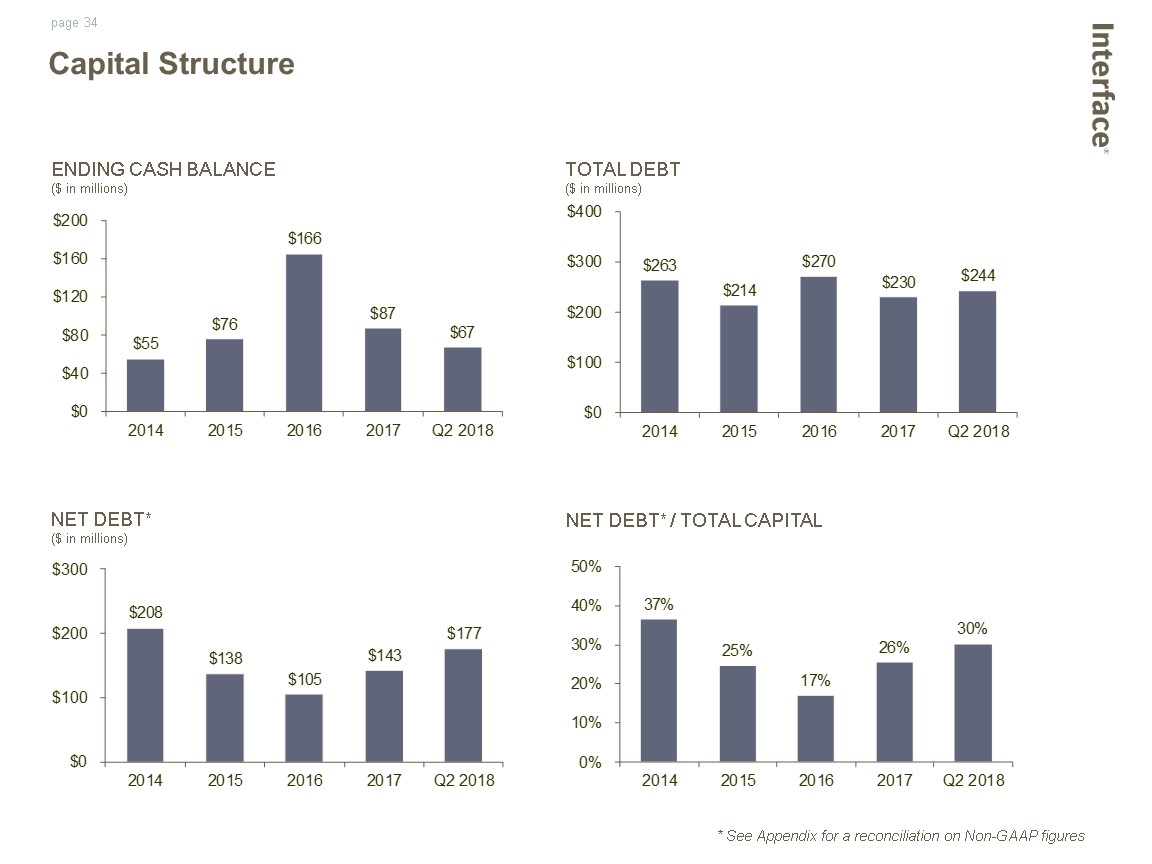
ENDING CASH BALANCE($ in millions) TOTAL DEBT($ in millions) NET DEBT*($ in millions) NET DEBT* / TOTAL CAPITAL * See Appendix for a reconciliation on Non-GAAP figures Capital Structure
Investment Highlights: Who We Are a leadingglobal provider of commercial flooring solutions the most valuable brand in the flooring category strongest global sales & marketing capabilities global manufacturing footprint and industry-leading gross margins an engaged, customer-centric culture, focused on performance and galvanized around our sustainability mission
Appendix Appendix
Commercial Flooring represents an estimated $34 Billion segment with growth aligned to GDP expansion. Approximately 20% of hard surface volume is in the high growth resilient category, which includes LVT.Carpet Tile represents approximately 13% of global commercial flooring with continued growth above segment rates as it takes share from broadloom and hard surface. Global Commercial Flooring Segment Source: Management estimates GLOBAL COMMERCIAL FLOORING
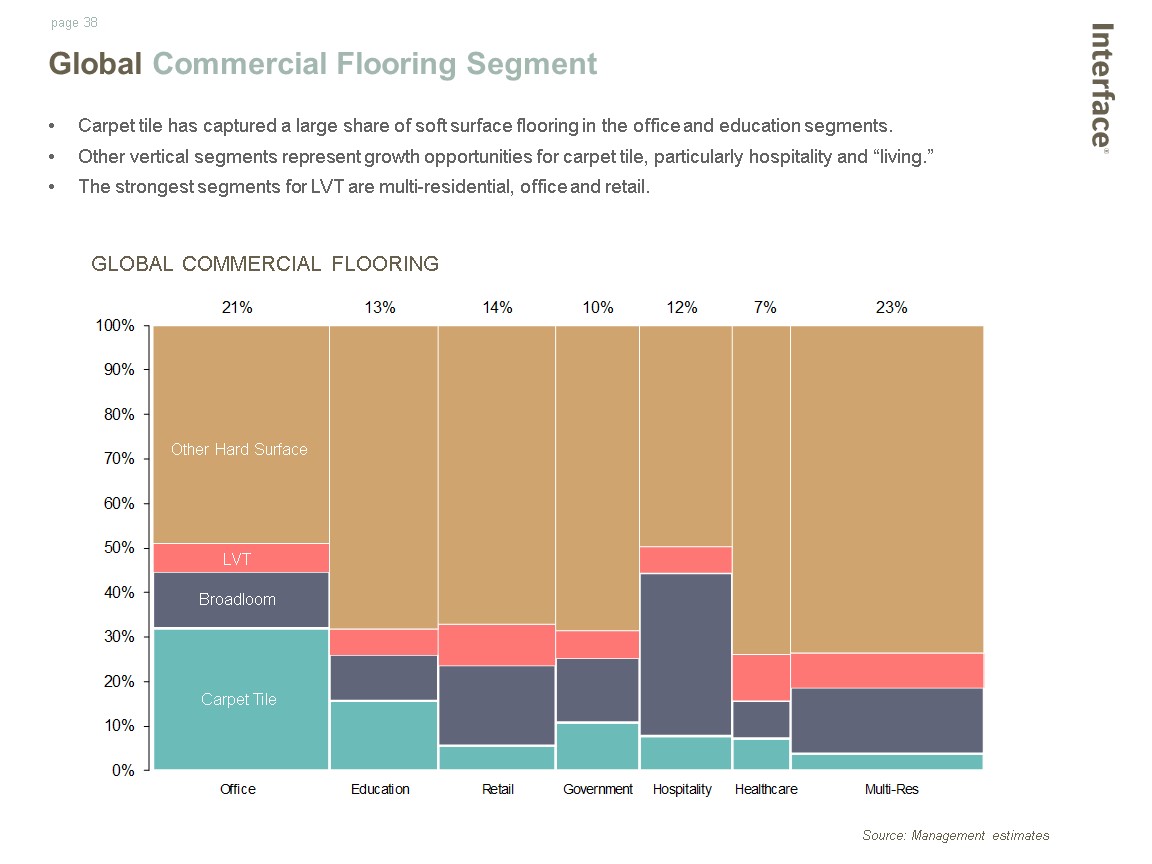
Global Commercial Flooring Segment Carpet tile has captured a large share of soft surface flooring in the office and education segments.Other vertical segments represent growth opportunities for carpet tile, particularly hospitality and “living.”The strongest segments for LVT are multi-residential, office and retail. GLOBAL COMMERCIAL FLOORING Source: Management estimates Carpet Tile Broadloom LVT Other Hard Surface
Global Commercial Flooring Segment An estimated 70% of the carpet tile segment is highly influenced by A&D and End Users.Dealers influence more commodity portions of demand. Source: Management estimates GLOBAL CARPET TILE Specified Dealer/Trade End User
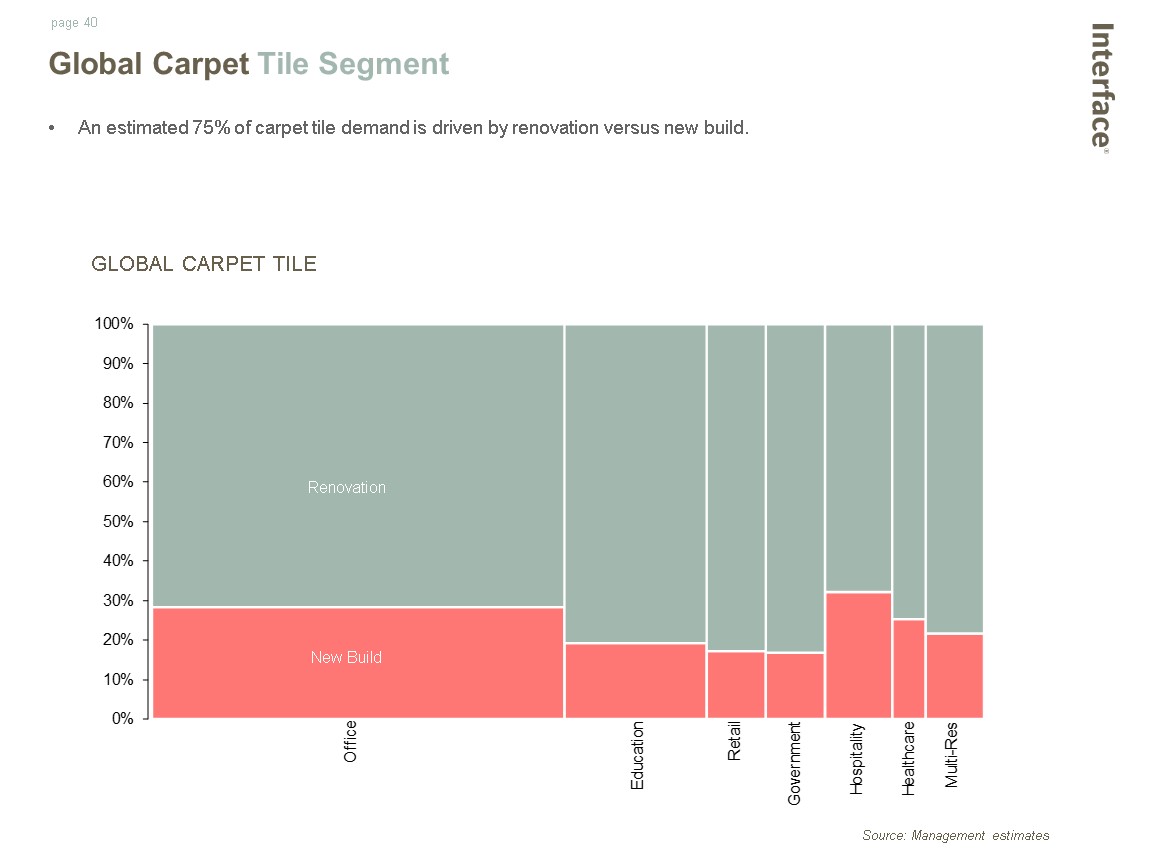
New Build Renovation Source: Management estimates An estimated 75% of carpet tile demand is driven by renovation versus new build. Global Carpet Tile Segment GLOBAL CARPET TILE
Appendix: Reconciliation of Non-GAAP Figures
Appendix: Reconciliation of Nora EBITDA