
Investor Presentation | August 2024
2 Forward Looking Statements and Non-GAAP Measures This presentation contains forward-looking statements, including, in particular, statements about Interface’s plans, strategies and prospects. These are based on the Company’s current assumptions, expectations and projections about future events. Although Interface believes that the expectations reflected in these forward-looking statements are reasonable, the Company can give no assurance that these expectations will prove to be correct or that savings or other benefits anticipated in the forward-looking statements will be achieved. The forward-looking statements set forth involve a number of risks and uncertainties that could cause actual results to differ materially from any such statement, including risks and uncertainties associated with economic conditions in the commercial interiors industry and the risks under the heading “Risk Factors” in the Company's Annual Report on Form 10-K for the fiscal year ended December 31, 2023, which discussions are hereby incorporated by reference. You should also consider any additional or updated information we include under the heading “Risk Factors” in our subsequent annual and quarterly reports. Forward-looking statements in this presentation include, without limitation, the information set forth on the slides titled “Interface: a compelling investment”, “Brand Leader in the Specified Channel”, and “Financial Policy”. Other forward-looking statements can be identified by words such as “may,” “expect,” “forecast,” “anticipate,” “intend,” “plan,” “believe,” “could,” “should”, “goal”, “aim”, “objective”, “commitment”, “seek,” “project,” “estimate,” “target,” and similar expressions. Forward-looking statements speak only as of the date made. The Company assumes no responsibility to update or revise forward-looking statements and cautions listeners and meeting attendees not to place undue reliance on any such statements. This presentation includes certain financial measures not calculated in accordance with U.S. GAAP. They may be different from similarly titled non-GAAP measures used by other companies, and should not be used as a substitute for, or considered superior to, GAAP measures. Reconciliations to the most directly comparable GAAP measures appear in the Appendix Note: Sum of reconciling items may differ from total due to rounding of individual components
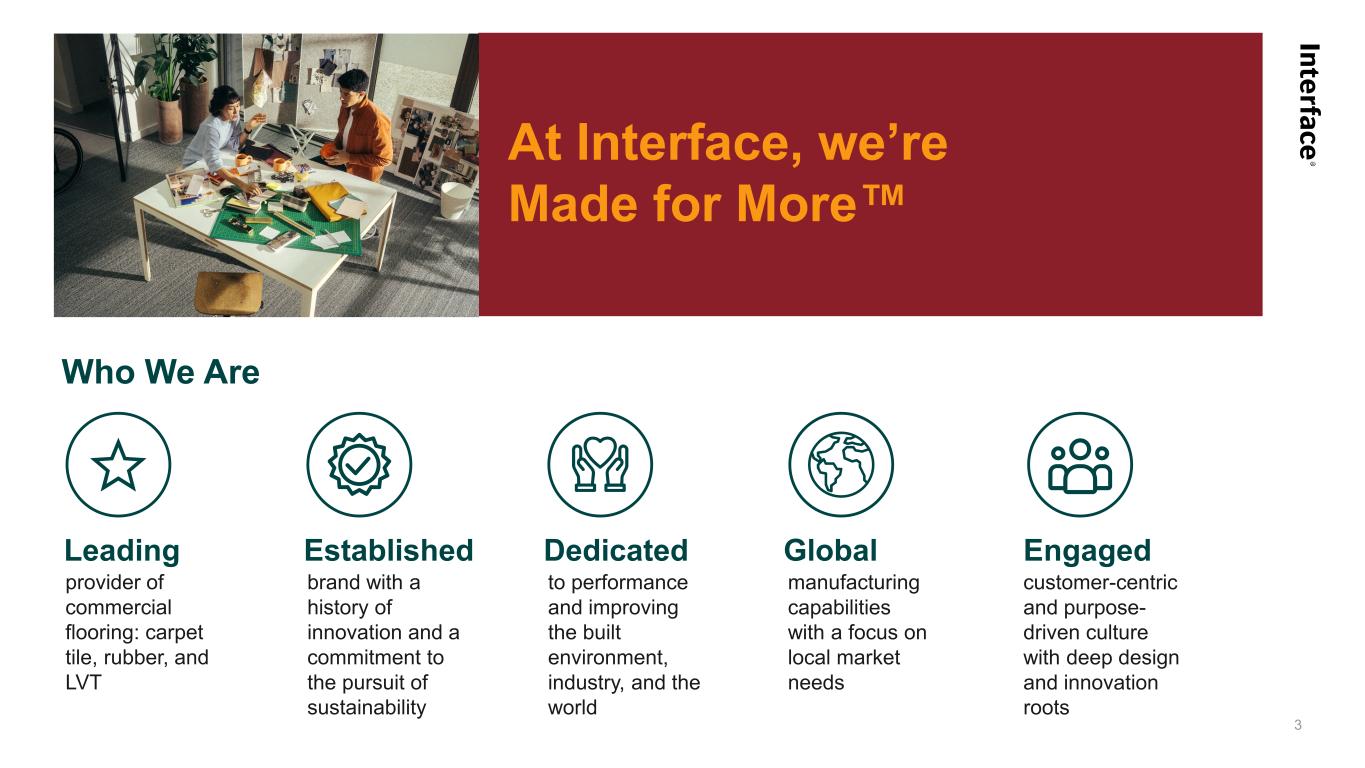
3 At Interface, we’re Made for More Who We Are Leading Established GlobalDedicated Engaged provider of commercial flooring: carpet tile, rubber, and LVT brand with a history of innovation and a commitment to the pursuit of sustainability to performance and improving the built environment, industry, and the world manufacturing capabilities with a focus on local market needs customer-centric and purpose- driven culture with deep design and innovation roots
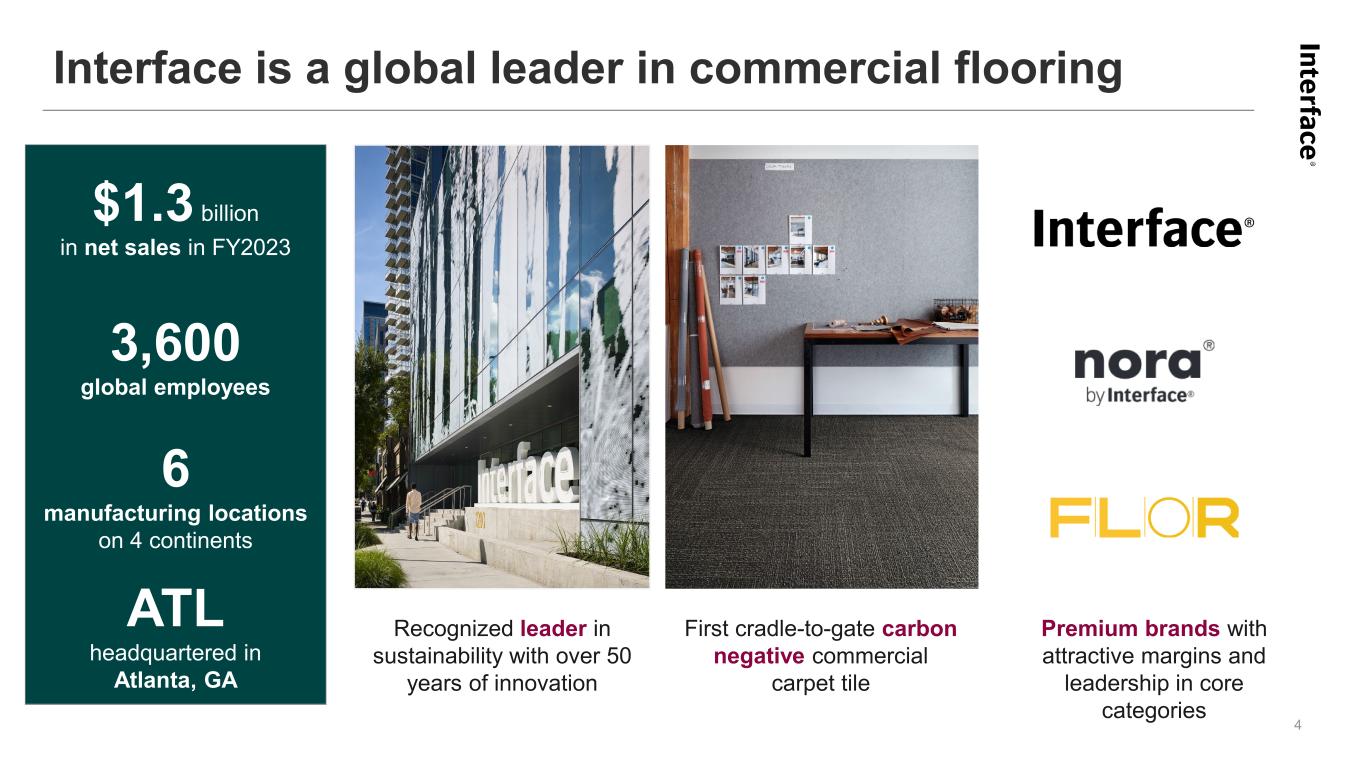
Interface is a global leader in commercial flooring 4 $1.3 billion in net sales in FY2023 3,600 global employees 6 manufacturing locations on 4 continents ATL headquartered in Atlanta, GA Recognized leader in sustainability with over 50 years of innovation First cradle-to-gate carbon negative commercial carpet tile Premium brands with attractive margins and leadership in core categories
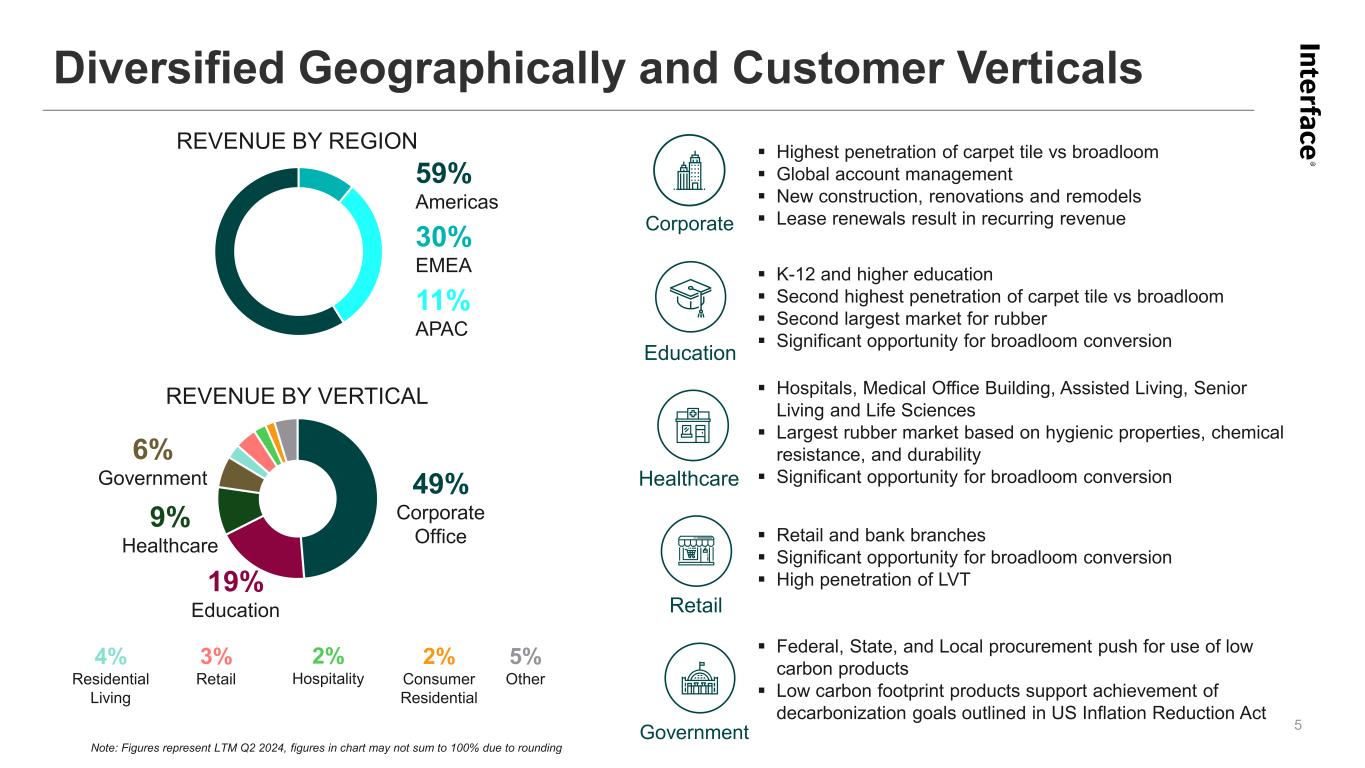
59% Americas 30% EMEA 11% APAC REVENUE BY REGION Diversified Geographically and Customer Verticals 5 Note: Figures represent LTM Q2 2024, figures in chart may not sum to 100% due to rounding 49% Corporate Office 19% Education Highest penetration of carpet tile vs broadloom Global account management New construction, renovations and remodels Lease renewals result in recurring revenue K-12 and higher education Second highest penetration of carpet tile vs broadloom Second largest market for rubber Significant opportunity for broadloom conversion Hospitals, Medical Office Building, Assisted Living, Senior Living and Life Sciences Largest rubber market based on hygienic properties, chemical resistance, and durability Significant opportunity for broadloom conversion Retail and bank branches Significant opportunity for broadloom conversion High penetration of LVT Federal, State, and Local procurement push for use of low carbon products Low carbon footprint products support achievement of decarbonization goals outlined in US Inflation Reduction Act Corporate Education Healthcare Retail 9% Healthcare 6% Government 4% Residential Living 3% Retail 2% Hospitality 2% Consumer Residential 5% Other REVENUE BY VERTICAL Government
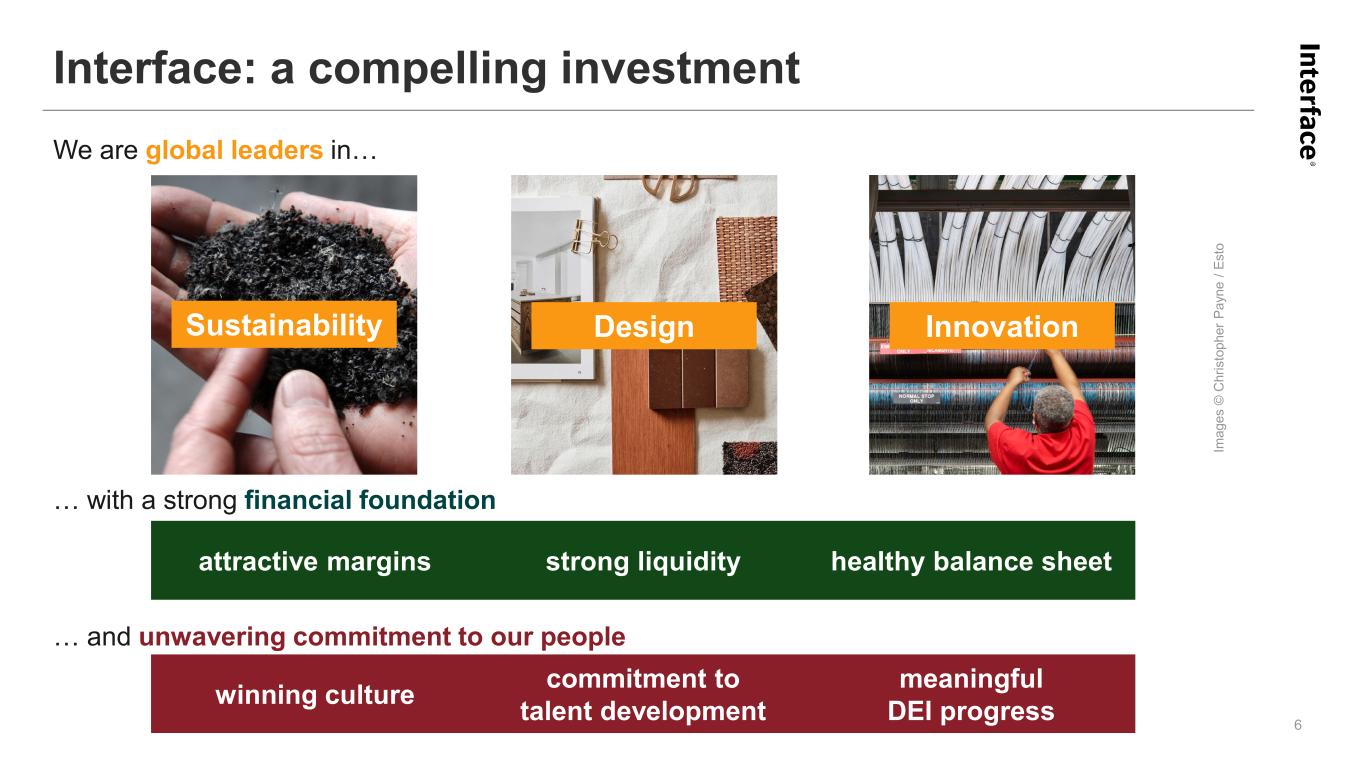
Interface: a compelling investment 6 We are global leaders in… … with a strong financial foundation Design InnovationSustainability attractive margins strong liquidity healthy balance sheet Im ag es © C hr is to ph er P ay ne / Es to … and unwavering commitment to our people winning culture commitment to talent development meaningful DEI progress
Interface: a compelling investment 7 Strengths to Leverage Selling system and customer partnerships Sustainability leadership Manufacturing expertise Diversified portfolio Strong cash generation and balance sheet Opportunities for Growth Reset operating model to one global company with strong global functions Expand margins through global supply chain management & improved productivity Accelerate new global products & designs Reallocate investment to big bets; drive profitable growth

Interface Positioning
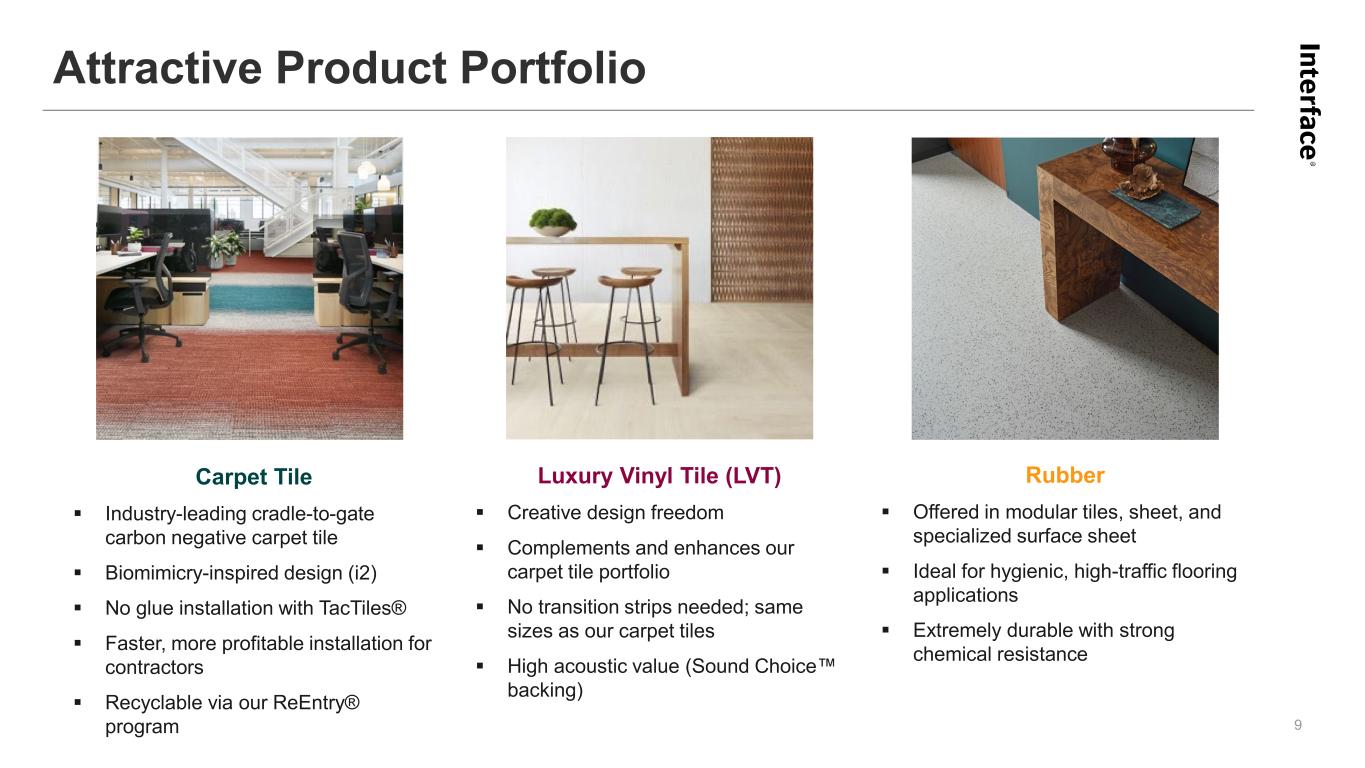
Attractive Product Portfolio 9 Carpet Tile Industry-leading cradle-to-gate carbon negative carpet tile Biomimicry-inspired design (i2) No glue installation with TacTiles® Faster, more profitable installation for contractors Recyclable via our ReEntry® program Luxury Vinyl Tile (LVT) Creative design freedom Complements and enhances our carpet tile portfolio No transition strips needed; same sizes as our carpet tiles High acoustic value (Sound Choice backing) Rubber Offered in modular tiles, sheet, and specialized surface sheet Ideal for hygienic, high-traffic flooring applications Extremely durable with strong chemical resistance
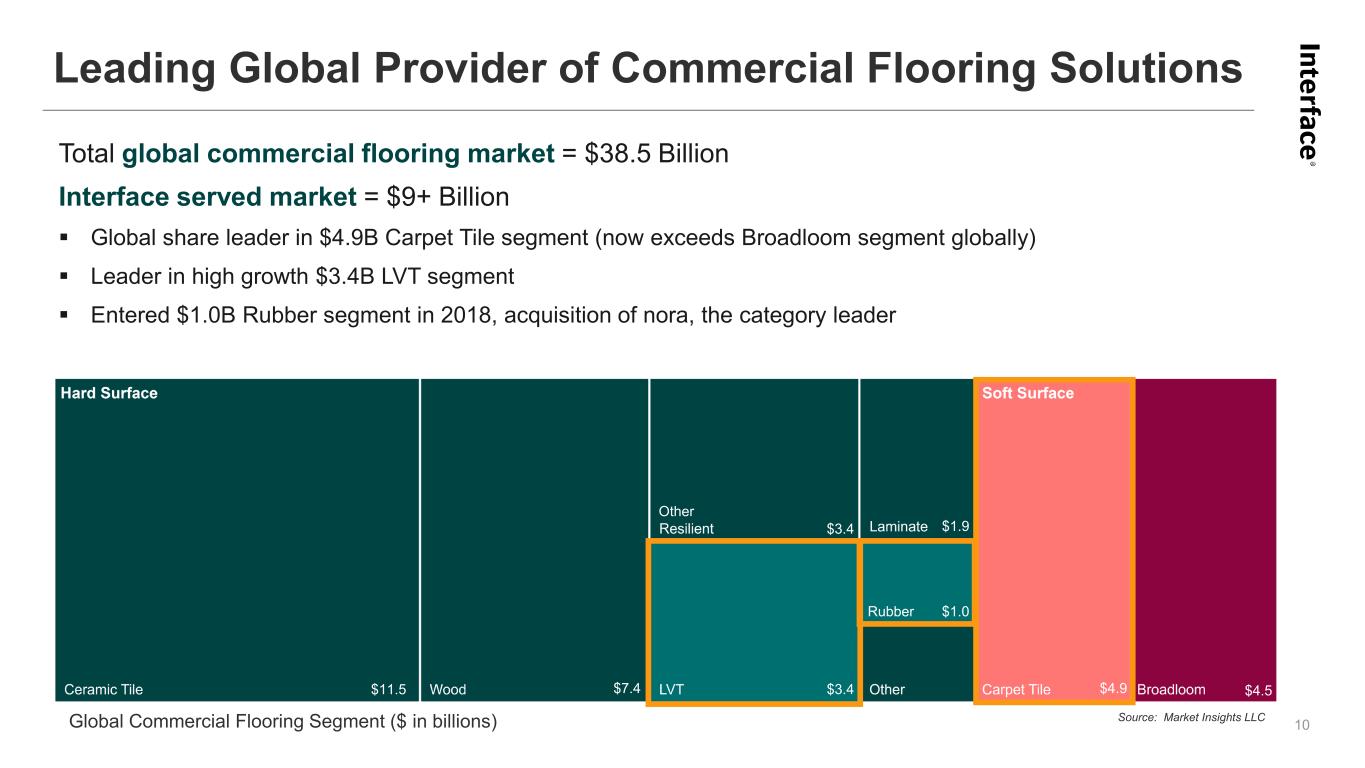
Total global commercial flooring market = $38.5 Billion Interface served market = $9+ Billion Global share leader in $4.9B Carpet Tile segment (now exceeds Broadloom segment globally) Leader in high growth $3.4B LVT segment Entered $1.0B Rubber segment in 2018, acquisition of nora, the category leader Source: Market Insights LLC $11.5 $7.4 $1.9 $1.0 $3.4 $3.4 $4.5 Other Global Commercial Flooring Segment ($ in billions) Leading Global Provider of Commercial Flooring Solutions 10 Rubber $4.9
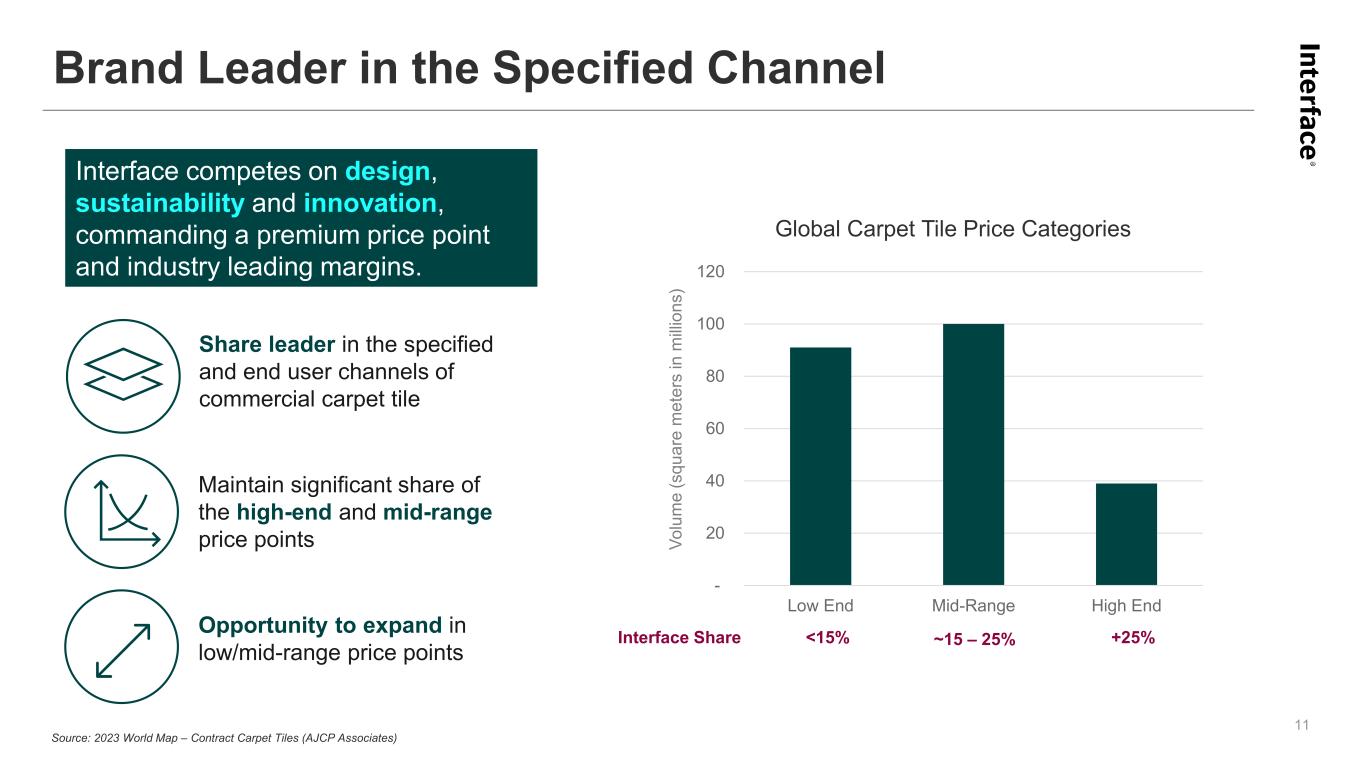
- 20 40 60 80 100 120 Low End Mid-Range High End Brand Leader in the Specified Channel 11 Interface competes on design, sustainability and innovation, commanding a premium price point and industry leading margins. Source: 2023 World Map – Contract Carpet Tiles (AJCP Associates) Opportunity to expand in low/mid-range price points Maintain significant share of the high-end and mid-range price points Share leader in the specified and end user channels of commercial carpet tile Global Carpet Tile Price Categories Interface Share <15% ~15 – 25% +25% Vo lu m e (s qu ar e m et er s in m illi on s)
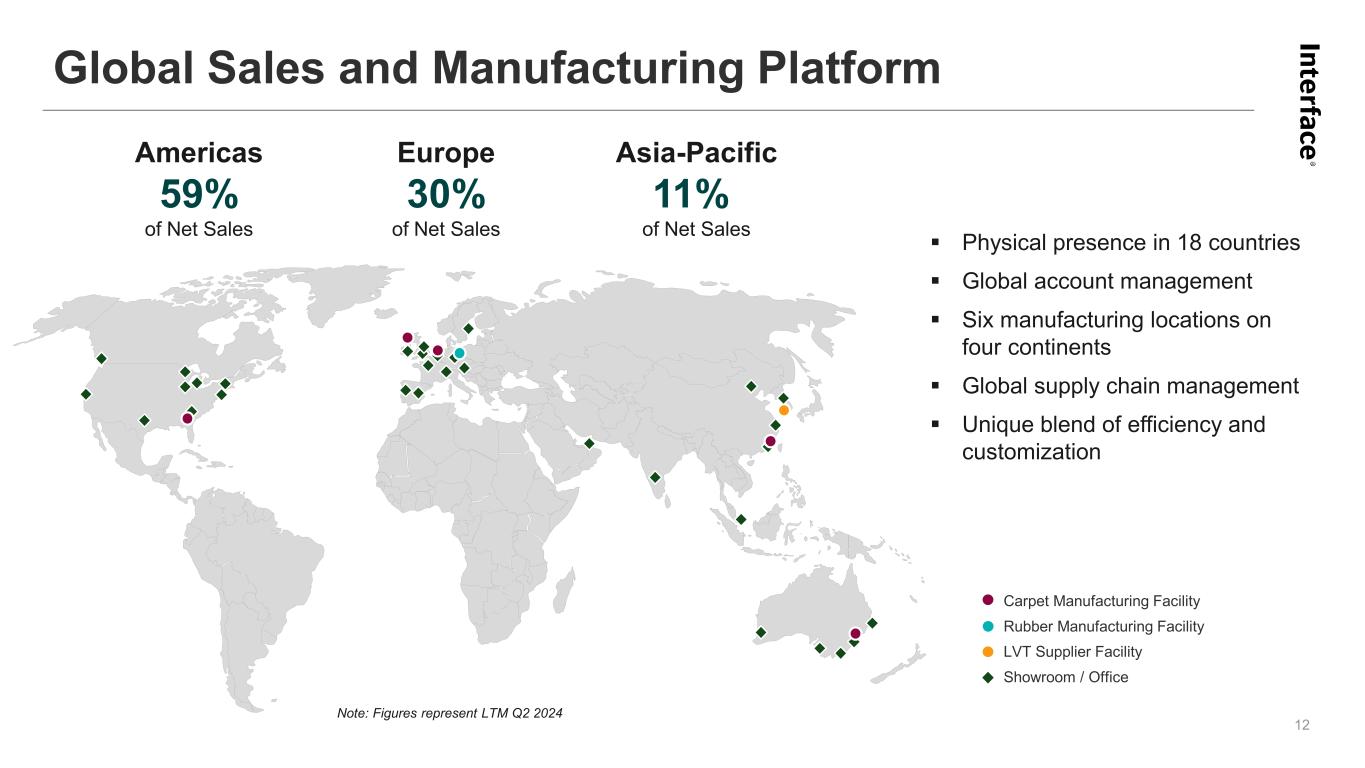
Physical presence in 18 countries Global account management Six manufacturing locations on four continents Global supply chain management Unique blend of efficiency and customization Note: Figures represent LTM Q2 2024 Americas 59% of Net Sales Europe 30% of Net Sales Asia-Pacific 11% of Net Sales Carpet Manufacturing Facility Rubber Manufacturing Facility LVT Supplier Facility Showroom / Office Global Sales and Manufacturing Platform 12

ESG Overview
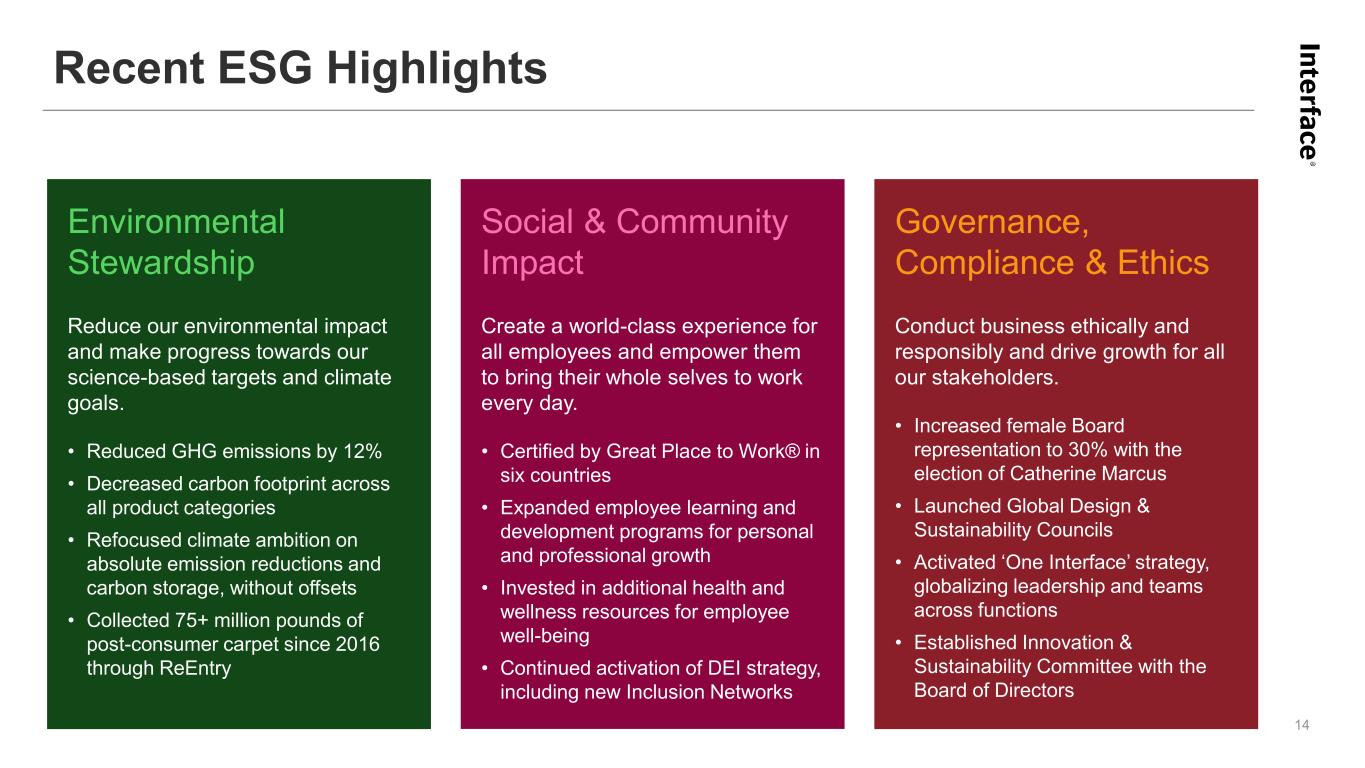
Recent ESG Highlights 14 Environmental Stewardship Reduce our environmental impact and make progress towards our science-based targets and climate goals. • Reduced GHG emissions by 12% • Decreased carbon footprint across all product categories • Refocused climate ambition on absolute emission reductions and carbon storage, without offsets • Collected 75+ million pounds of post-consumer carpet since 2016 through ReEntry Social & Community Impact Create a world-class experience for all employees and empower them to bring their whole selves to work every day. • Certified by Great Place to Work® in six countries • Expanded employee learning and development programs for personal and professional growth • Invested in additional health and wellness resources for employee well-being • Continued activation of DEI strategy, including new Inclusion Networks Governance, Compliance & Ethics Conduct business ethically and responsibly and drive growth for all our stakeholders. • Increased female Board representation to 30% with the election of Catherine Marcus • Launched Global Design & Sustainability Councils • Activated ‘One Interface’ strategy, globalizing leadership and teams across functions • Established Innovation & Sustainability Committee with the Board of Directors
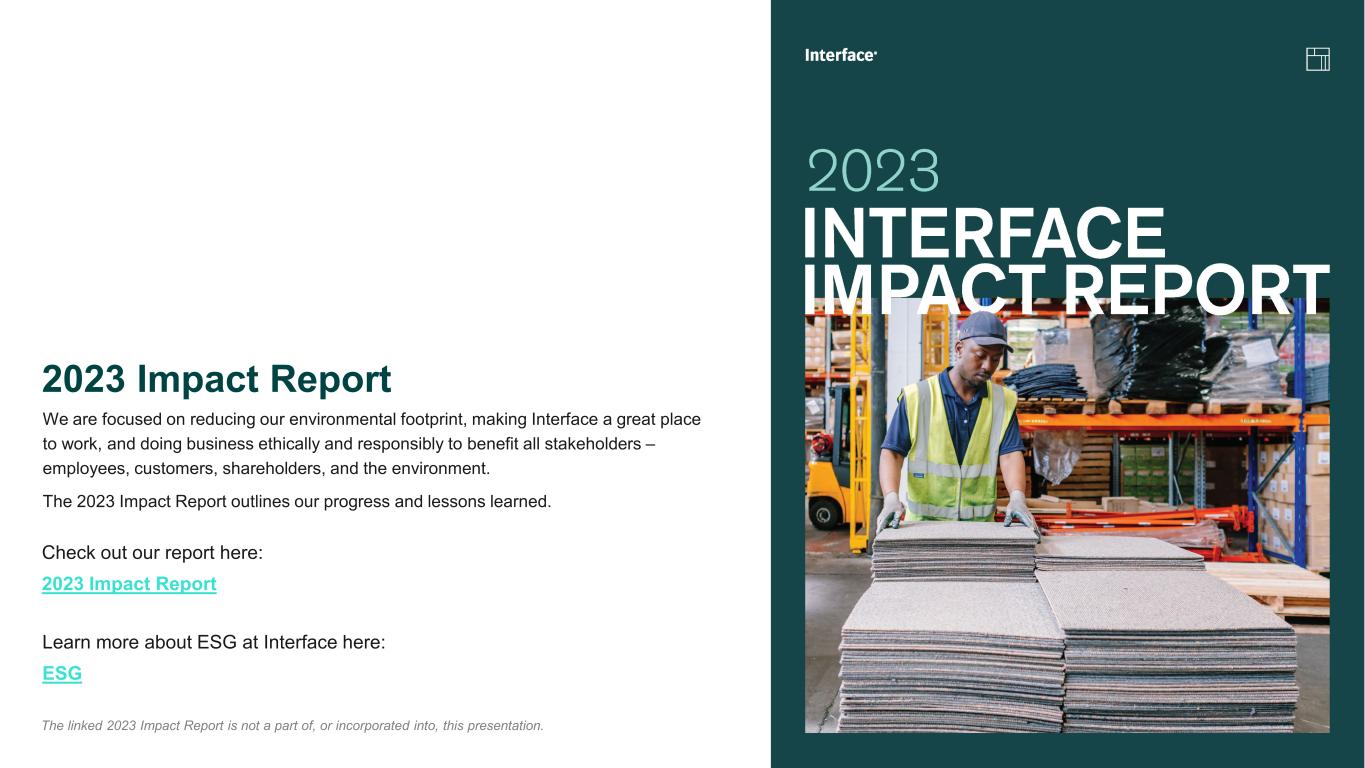
15 Check out our report here: 2023 Impact Report The linked 2023 Impact Report is not a part of, or incorporated into, this presentation. 2023 Impact Report We are focused on reducing our environmental footprint, making Interface a great place to work, and doing business ethically and responsibly to benefit all stakeholders – employees, customers, shareholders, and the environment. The 2023 Impact Report outlines our progress and lessons learned. Learn more about ESG at Interface here: ESG

Financial Performance
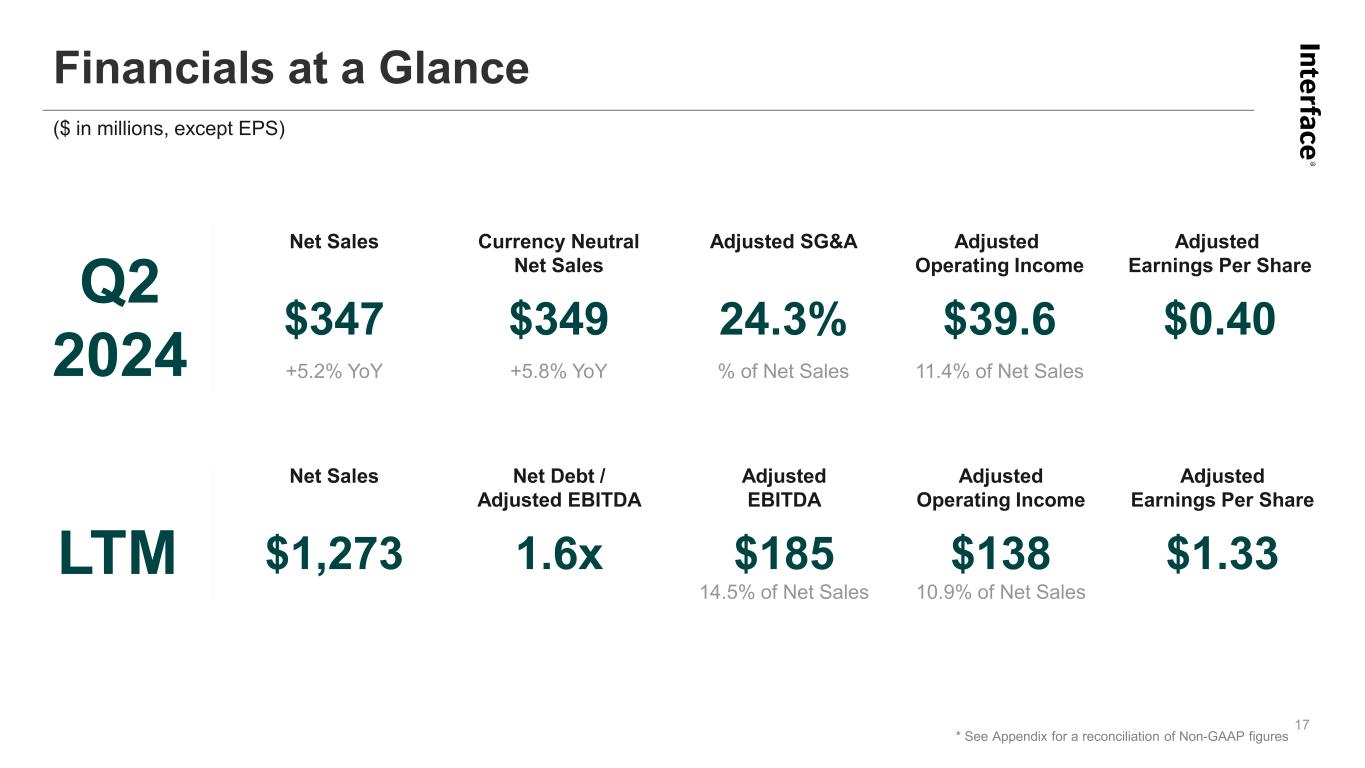
Financials at a Glance 17 Currency Neutral Net Sales $349 +5.8% YoY Net Sales $347 +5.2% YoY Adjusted SG&A 24.3% % of Net Sales Adjusted Operating Income $39.6 11.4% of Net Sales Net Debt / Adjusted EBITDA 1.6x Net Sales $1,273 Adjusted EBITDA $185 14.5% of Net Sales Adjusted Operating Income $138 10.9% of Net Sales Q2 2024 LTM Adjusted Earnings Per Share $0.40 Adjusted Earnings Per Share $1.33 * See Appendix for a reconciliation of Non-GAAP figures ($ in millions, except EPS)
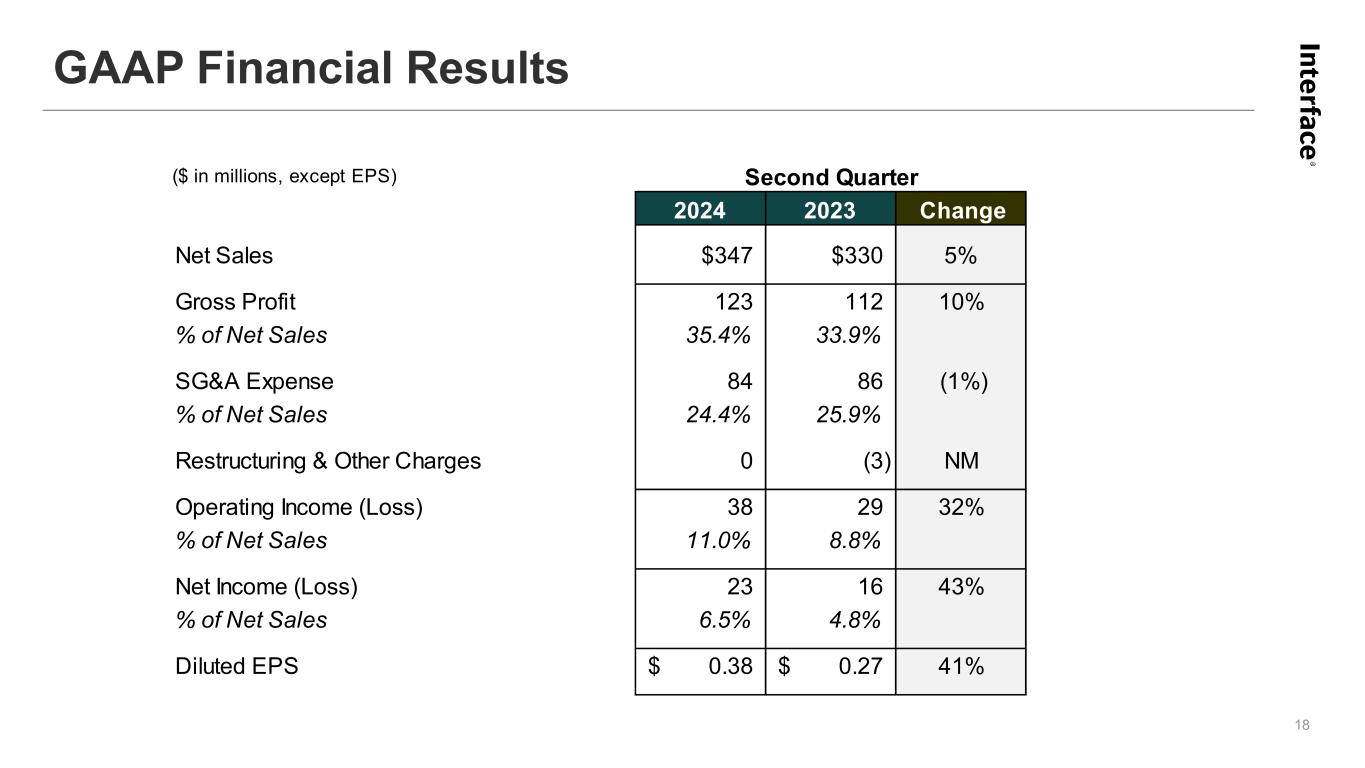
($ in millions, except EPS) 2024 2023 Change Net Sales $347 $330 5% Gross Profit 123 112 10% % of Net Sales 35.4% 33.9% SG&A Expense 84 86 (1%) % of Net Sales 24.4% 25.9% Restructuring & Other Charges 0 (3) NM Operating Income (Loss) 38 29 32% % of Net Sales 11.0% 8.8% Net Income (Loss) 23 16 43% % of Net Sales 6.5% 4.8% Diluted EPS 0.38$ 0.27$ 41% Second Quarter GAAP Financial Results 18
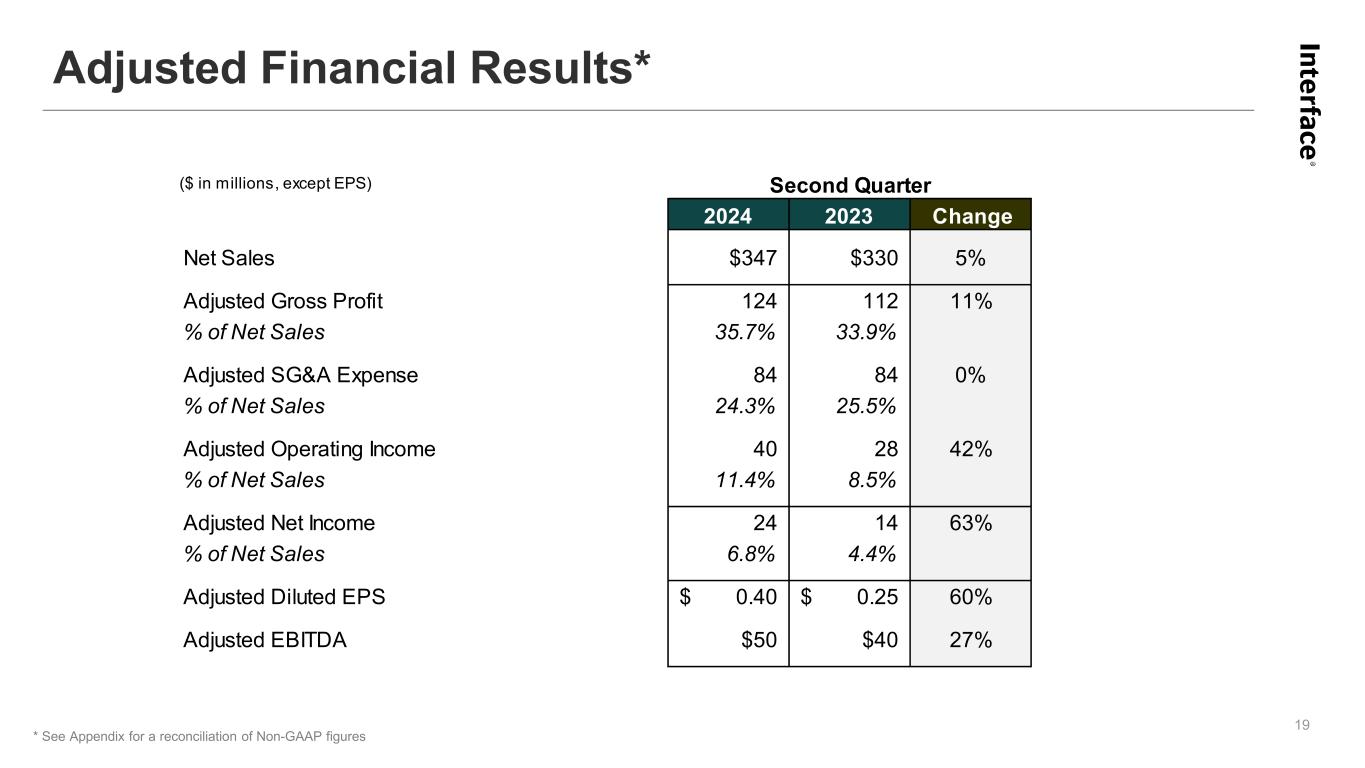
($ in millions, except EPS) 2024 2023 Change Net Sales $347 $330 5% Adjusted Gross Profit 124 112 11% % of Net Sales 35.7% 33.9% Adjusted SG&A Expense 84 84 0% % of Net Sales 24.3% 25.5% Adjusted Operating Income 40 28 42% % of Net Sales 11.4% 8.5% Adjusted Net Income 24 14 63% % of Net Sales 6.8% 4.4% Adjusted Diluted EPS 0.40$ 0.25$ 60% Adjusted EBITDA $50 $40 27% Second Quarter Adjusted Financial Results* 19 * See Appendix for a reconciliation of Non-GAAP figures
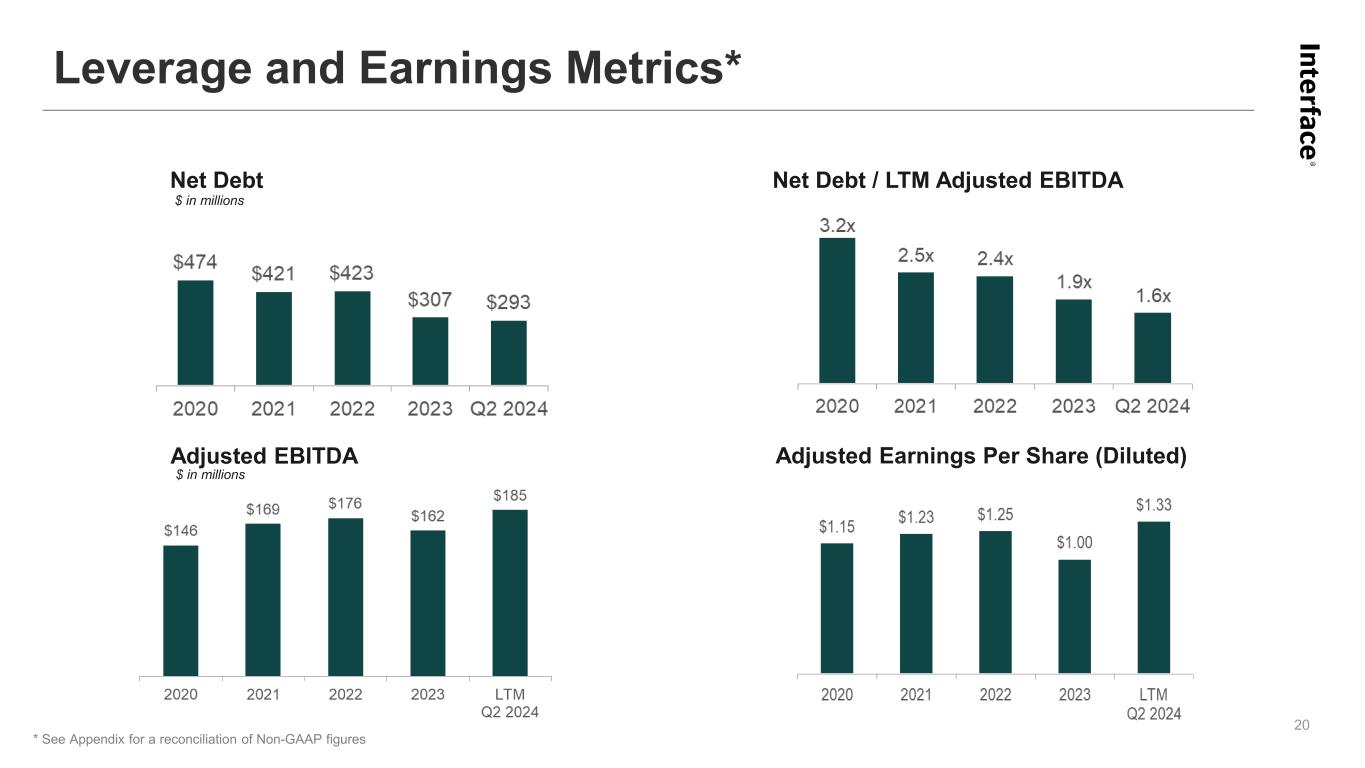
Adjusted EBITDA Adjusted Earnings Per Share (Diluted) Net Debt / LTM Adjusted EBITDANet Debt Leverage and Earnings Metrics* 20 $ in millions * See Appendix for a reconciliation of Non-GAAP figures $ in millions
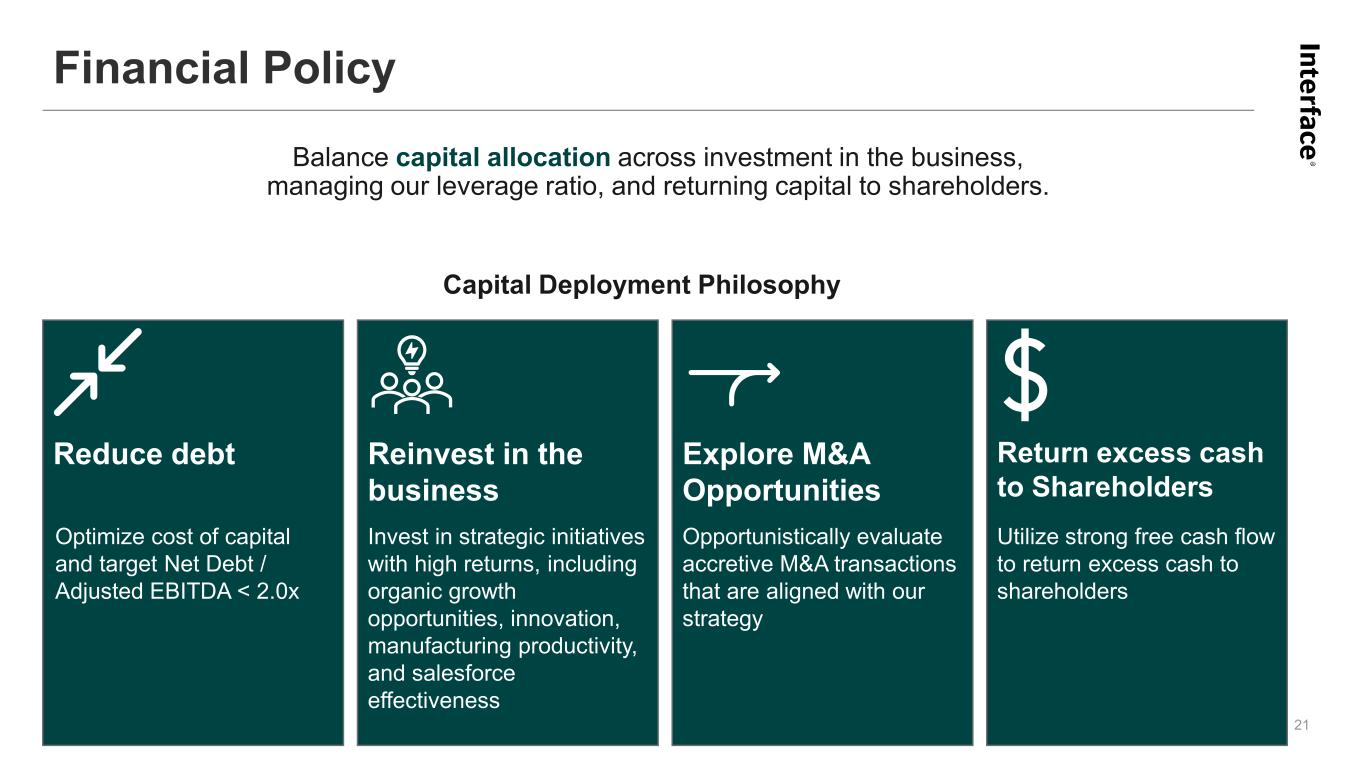
Financial Policy 21 Balance capital allocation across investment in the business, managing our leverage ratio, and returning capital to shareholders. Reduce debt Optimize cost of capital and target Net Debt / Adjusted EBITDA < 2.0x Reinvest in the business Invest in strategic initiatives with high returns, including organic growth opportunities, innovation, manufacturing productivity, and salesforce effectiveness Explore M&A Opportunities Opportunistically evaluate accretive M&A transactions that are aligned with our strategy Return excess cash to Shareholders Utilize strong free cash flow to return excess cash to shareholders Capital Deployment Philosophy

Appendix
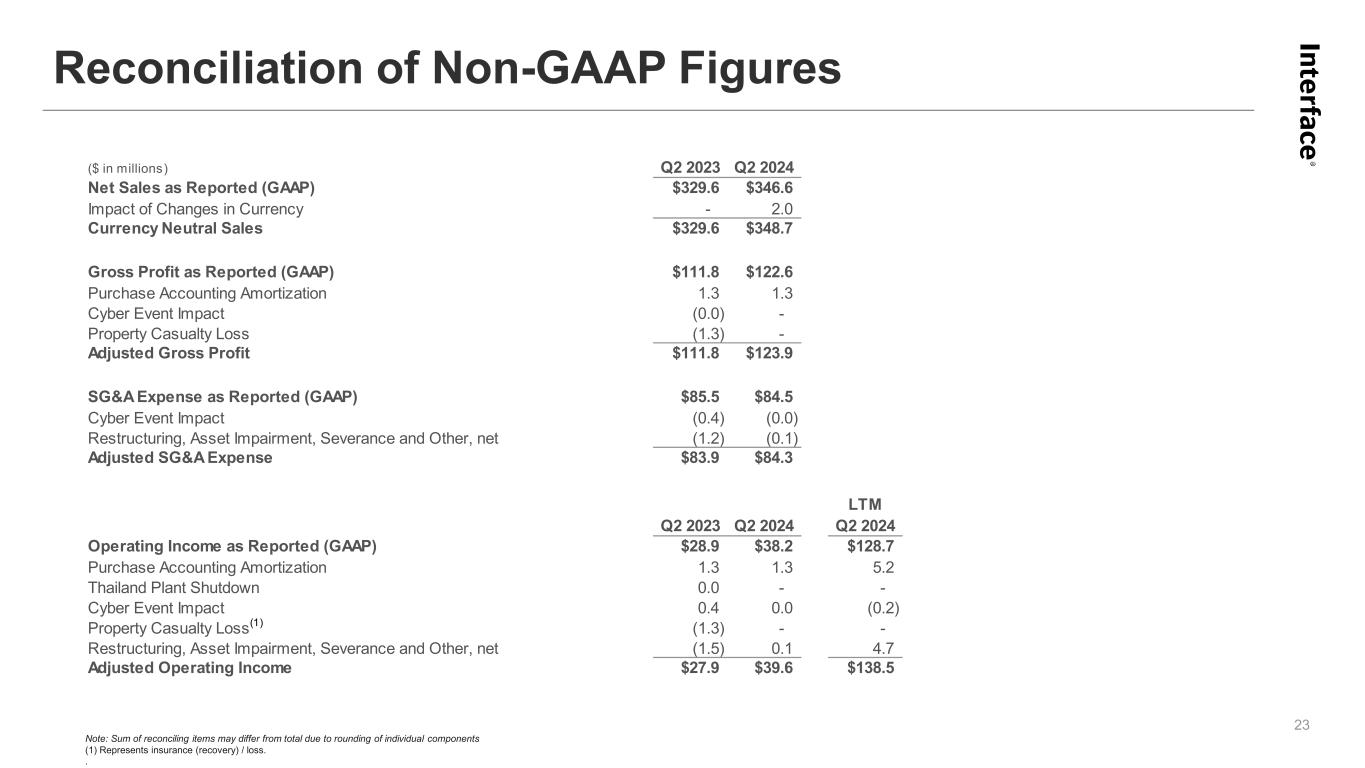
Reconciliation of Non-GAAP Figures 23 Note: Sum of reconciling items may differ from total due to rounding of individual components (1) Represents insurance (recovery) / loss. . ($ in millions) Q2 2023 Q2 2024 Net Sales as Reported (GAAP) $329.6 $346.6 Impact of Changes in Currency - 2.0 Currency Neutral Sales $329.6 $348.7 Gross Profit as Reported (GAAP) $111.8 $122.6 Purchase Accounting Amortization 1.3 1.3 Cyber Event Impact (0.0) - Property Casualty Loss (1.3) - Adjusted Gross Profit $111.8 $123.9 SG&A Expense as Reported (GAAP) $85.5 $84.5 Cyber Event Impact (0.4) (0.0) Restructuring, Asset Impairment, Severance and Other, net (1.2) (0.1) Adjusted SG&A Expense $83.9 $84.3 LTM Q2 2023 Q2 2024 Q2 2024 Operating Income as Reported (GAAP) $28.9 $38.2 $128.7 Purchase Accounting Amortization 1.3 1.3 5.2 Thailand Plant Shutdown 0.0 - - Cyber Event Impact 0.4 0.0 (0.2) Property Casualty Loss(1) (1.3) - - Restructuring, Asset Impairment, Severance and Other, net (1.5) 0.1 4.7 Adjusted Operating Income $27.9 $39.6 $138.5
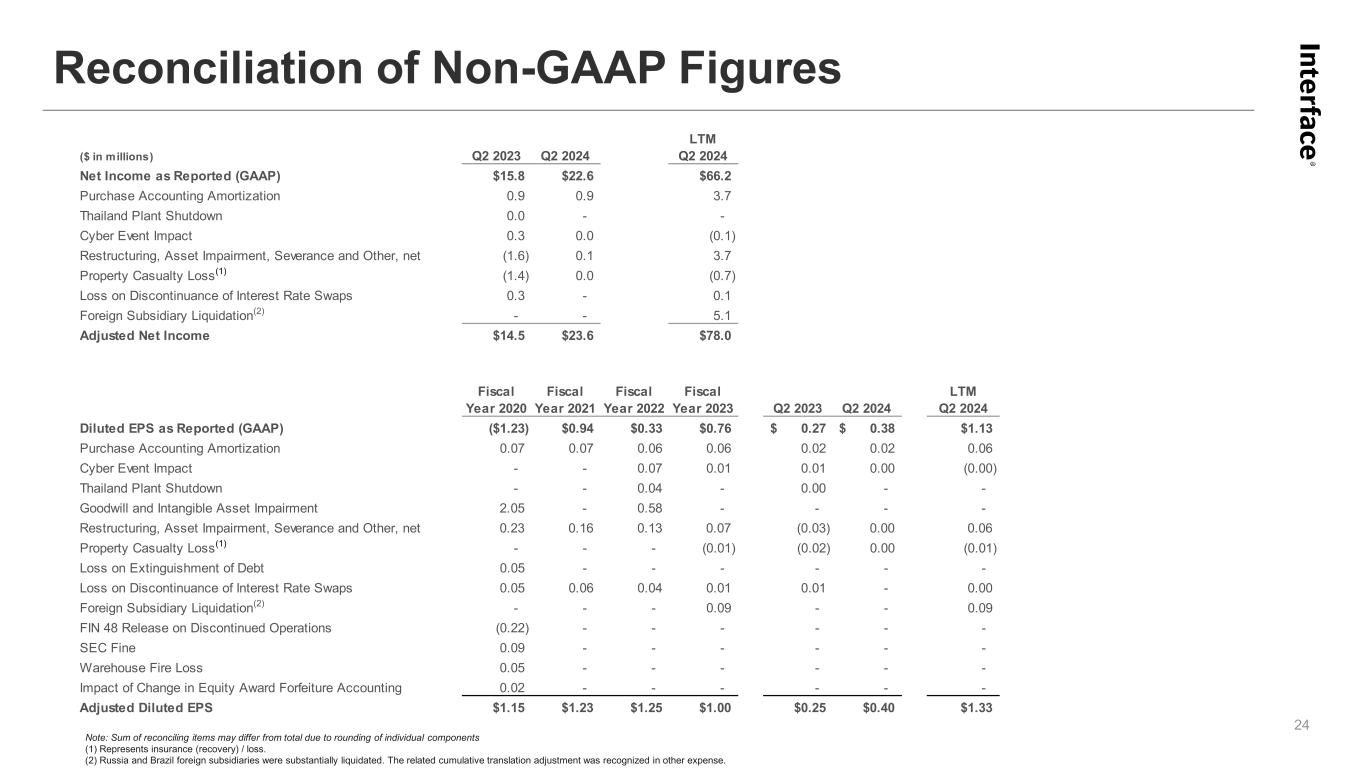
Reconciliation of Non-GAAP Figures 24 Note: Sum of reconciling items may differ from total due to rounding of individual components (1) Represents insurance (recovery) / loss. (2) Russia and Brazil foreign subsidiaries were substantially liquidated. The related cumulative translation adjustment was recognized in other expense. ($ in millions) Q2 2023 Q2 2024 LTM Q2 2024 Net Income as Reported (GAAP) $15.8 $22.6 $66.2 Purchase Accounting Amortization 0.9 0.9 3.7 Thailand Plant Shutdown 0.0 - - Cyber Event Impact 0.3 0.0 (0.1) Restructuring, Asset Impairment, Severance and Other, net (1.6) 0.1 3.7 Property Casualty Loss(1) (1.4) 0.0 (0.7) Loss on Discontinuance of Interest Rate Swaps 0.3 - 0.1 Foreign Subsidiary Liquidation(2) - - 5.1 Adjusted Net Income $14.5 $23.6 $78.0 Fiscal Year 2020 Fiscal Year 2021 Fiscal Year 2022 Fiscal Year 2023 Q2 2023 Q2 2024 LTM Q2 2024 Diluted EPS as Reported (GAAP) ($1.23) $0.94 $0.33 $0.76 0.27$ 0.38$ $1.13 Purchase Accounting Amortization 0.07 0.07 0.06 0.06 0.02 0.02 0.06 Cyber Event Impact - - 0.07 0.01 0.01 0.00 (0.00) Thailand Plant Shutdown - - 0.04 - 0.00 - - Goodwill and Intangible Asset Impairment 2.05 - 0.58 - - - - Restructuring, Asset Impairment, Severance and Other, net 0.23 0.16 0.13 0.07 (0.03) 0.00 0.06 Property Casualty Loss(1) - - - (0.01) (0.02) 0.00 (0.01) Loss on Extinguishment of Debt 0.05 - - - - - - Loss on Discontinuance of Interest Rate Swaps 0.05 0.06 0.04 0.01 0.01 - 0.00 Foreign Subsidiary Liquidation(2) - - - 0.09 - - 0.09 FIN 48 Release on Discontinued Operations (0.22) - - - - - - SEC Fine 0.09 - - - - - - Warehouse Fire Loss 0.05 - - - - - - Impact of Change in Equity Award Forfeiture Accounting 0.02 - - - - - - Adjusted Diluted EPS $1.15 $1.23 $1.25 $1.00 $0.25 $0.40 $1.33
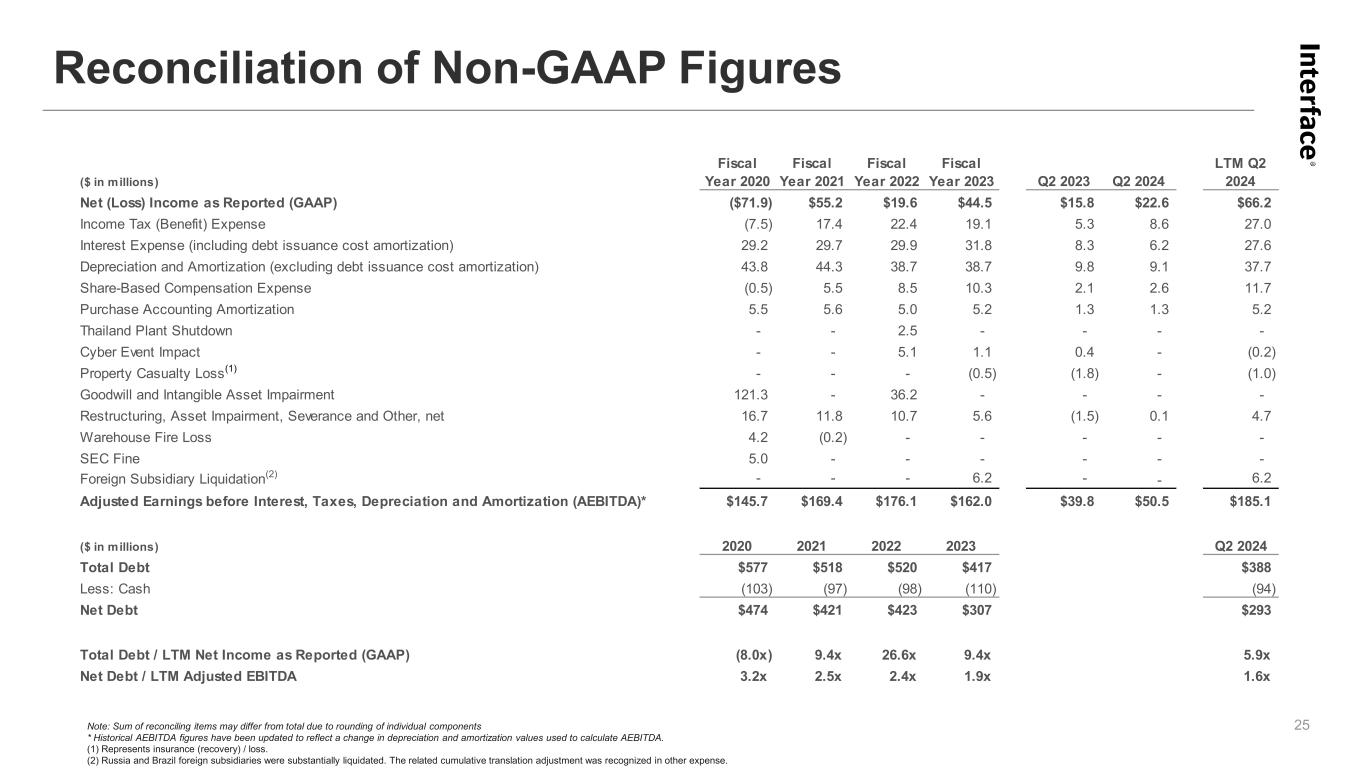
Note: Sum of reconciling items may differ from total due to rounding of individual components * Historical AEBITDA figures have been updated to reflect a change in depreciation and amortization values used to calculate AEBITDA. (1) Represents insurance (recovery) / loss. (2) Russia and Brazil foreign subsidiaries were substantially liquidated. The related cumulative translation adjustment was recognized in other expense. Reconciliation of Non-GAAP Figures 25 ($ in millions) Fiscal Year 2020 Fiscal Year 2021 Fiscal Year 2022 Fiscal Year 2023 Q2 2023 Q2 2024 LTM Q2 2024 Net (Loss) Income as Reported (GAAP) ($71.9) $55.2 $19.6 $44.5 $15.8 $22.6 $66.2 Income Tax (Benefit) Expense (7.5) 17.4 22.4 19.1 5.3 8.6 27.0 Interest Expense (including debt issuance cost amortization) 29.2 29.7 29.9 31.8 8.3 6.2 27.6 Depreciation and Amortization (excluding debt issuance cost amortization) 43.8 44.3 38.7 38.7 9.8 9.1 37.7 Share-Based Compensation Expense (0.5) 5.5 8.5 10.3 2.1 2.6 11.7 Purchase Accounting Amortization 5.5 5.6 5.0 5.2 1.3 1.3 5.2 Thailand Plant Shutdown - - 2.5 - - - - Cyber Event Impact - - 5.1 1.1 0.4 - (0.2) Property Casualty Loss(1) - - - (0.5) (1.8) - (1.0) Goodwill and Intangible Asset Impairment 121.3 - 36.2 - - - - Restructuring, Asset Impairment, Severance and Other, net 16.7 11.8 10.7 5.6 (1.5) 0.1 4.7 Warehouse Fire Loss 4.2 (0.2) - - - - - SEC Fine 5.0 - - - - - - Foreign Subsidiary Liquidation(2) - - - 6.2 - - 6.2 Adjusted Earnings before Interest, Taxes, Depreciation and Amortization (AEBITDA)* $145.7 $169.4 $176.1 $162.0 $39.8 $50.5 $185.1 ($ in millions) 2020 2021 2022 2023 Q2 2024 Total Debt $577 $518 $520 $417 $388 Less: Cash (103) (97) (98) (110) (94) Net Debt $474 $421 $423 $307 $293 Total Debt / LTM Net Income as Reported (GAAP) (8.0x) 9.4x 26.6x 9.4x 5.9x Net Debt / LTM Adjusted EBITDA 3.2x 2.5x 2.4x 1.9x 1.6x


