UNITED STATES
SECURITIES AND EXCHANGE COMMISSION
Washington, D.C. 20549
_______________
Form 10-K
☑ ANNUAL REPORT PURSUANT TO SECTION 13 OR 15(d) OF THE SECURITIES EXCHANGE ACT OF 1934
For the Fiscal Year Ended December 29, 2024
☐ TRANSITION REPORT PURSUANT TO SECTION 13 OR 15(d) OF THE SECURITIES EXCHANGE ACT OF 1934
Commission File No.: 001-33994
INTERFACE INC
(Exact name of registrant as specified in its charter)
| | | | | | | | |
| Georgia | | 58-1451243 |
| (State of incorporation) | | (I.R.S. Employer Identification No.) |
| | | | | | | | | | | |
| 1280 West Peachtree Street | Atlanta | Georgia | 30309 |
| (Address of principal executive offices) | (zip code) |
Registrant’s telephone number, including area code: (770) 437-6800
Securities Registered Pursuant to Section 12(b) of the Act:
| | | | | | | | |
| Title of Each Class | Trading Symbol(s) | Name of Each Exchange on Which Registered: |
| Common Stock, $0.10 Par Value Per Share | TILE | Nasdaq Global Select Market |
Securities Registered Pursuant to Section 12(g) of the Act: None
Indicate by check mark if the registrant is a well-known seasoned issuer, as defined in Rule 405 of the Securities Act.
Yes þ No o
Indicate by check mark if the registrant is not required to file reports pursuant to Section 13 or Section 15(d) of the Act.
Yes o No þ
Indicate by check mark whether the registrant (1) has filed all reports required to be filed by Section 13 or 15(d) of the Securities Exchange Act of 1934 during the preceding 12 months (or for such shorter period that the registrant was required to file such reports), and (2) has been subject to such filing requirements for the past 90 days. Yes þ No o
Indicate by check mark whether the registrant has submitted electronically every Interactive Date File required to be submitted pursuant to Rule 405 of Regulation S-T (§232.405 of this chapter) during the preceding 12 months (or for such shorter period that the registrant was required to submit and post such files). Yes þ No o
Indicate by check mark whether the registrant is a large accelerated filer, an accelerated filer, a non-accelerated filer or a smaller reporting company. See the definitions of “large accelerated filer,” “accelerated filer,” “smaller reporting company” and “emerging growth company” in Rule 12b-2 of the Securities Exchange Act of 1934.
Large accelerated filer þ Accelerated filer o Non-accelerated filer o Smaller reporting company ☐ Emerging growth company ☐
If an emerging growth company, indicate by check mark if the registrant has elected not to use the extended transition period for complying with any new or revised financial accounting standards provided pursuant to Section 13(a) of the Exchange Act. o
Indicate by check mark whether the registrant has filed a report on and attestation to its management’s assessment of the effectiveness of its internal control over financial reporting under Section 404(b) of the Sarbanes-Oxley Act (15 U.S.C. 7262(b)) by the registered public accounting firm that prepared or issued its audit report. þ
If securities are registered pursuant to Section 12(b) of the Act, indicate by check mark whether the financial statements of the registrant included in the filing reflect the correction of an error to previously issued financial statements. ☐
Indicate by check mark whether any of those error corrections are restatements that required a recovery analysis of incentive-based compensation received by any of the registrant’s executive officers during the relevant recovery period pursuant to § 240.10D-1(b). o
Indicate by check mark whether the registrant is a shell company (as defined in Rule 12b-2 of the Exchange Act). Yes ☐ No þ
Aggregate market value of the voting and non-voting stock held by non-affiliates of the registrant as of June 28, 2024: $834,272,048 (56,830,521 shares valued at the closing sale price of $14.68 on June 28, 2024). See Item 12.
Number of shares outstanding of each of the registrant’s classes of Common Stock, as of February 14, 2025:
| | | | | |
| Class | Number of Shares |
| Common Stock, $0.10 par value per share | 58,313,040 |
DOCUMENTS INCORPORATED BY REFERENCE
Portions of the Proxy Statement for the 2025 Annual Meeting of Shareholders are incorporated by reference into Part III.
TABLE OF CONTENTS
PART I
ITEM 1. BUSINESS
General
References in this Annual Report on Form 10-K to “Interface,” “the Company,” “we,” “our,” “ours” and “us” refer to Interface, Inc. and its subsidiaries or any of them, unless the context requires otherwise.
Interface is a global flooring solutions company and sustainability leader, offering an integrated portfolio of carpet tile and resilient flooring products that includes Interface® carpet tile and luxury vinyl tile (“LVT”), nora® rubber flooring, and FLOR® premium area rugs for commercial and residential spaces. We help our customers create high-performance interior spaces that support well-being, productivity, and creativity, as well as sustainability of the planet.
As a global company with a reputation for high quality, reliability and premium positioning, we market modular carpet under the established brand names Interface® and FLOR®, we market LVT under the brand Interface®, and we market rubber flooring under the brands noraplan® and norament®.
Reportable Segments
The Company has two operating and reportable segments – namely Americas (“AMS”) and Europe, Africa, Asia and Australia (collectively “EAAA”). The AMS operating segment includes the United States, Canada and Latin America geographic areas. See Note 20 entitled “Segment Information” included in Item 8 of this Annual Report on Form 10-K for additional information.
Below is a summary of total net sales percentages by reportable segment for the last three fiscal years.
| | | | | | | | | | | | | | | | | | | | |
| | 2024 | | 2023 | | 2022 |
| AMS | | 61% | | 58% | | 58% |
| EAAA | | 39% | | 42% | | 42% |
Market Segmentation
Our business, as well as the commercial interiors industry in general, is cyclical in nature and is impacted by economic conditions and trends that affect the markets for commercial and institutional business spaces. We believe the appeal and utilization of our products will continue to grow, and we are using our considerable skills and experience with designing, producing and marketing our products to make us a market leader. We primarily focus our sales efforts on the corporate office, education, healthcare, government, hospitality, and residential living market segments.
Disruptions in economic markets due to inflation, high interest rates, geo-political tensions, including the Russia-Ukraine war and the Middle East conflict, a still challenging supply chain environment, slow economic conditions in several markets that we serve, and significant financial pressures in the commercial office market globally, all pose challenges for us and impact the markets we operate in.
Products and Services
Modular Carpet
Our AMS and EAAA reportable segments sell the same products within their respective geographical regions. We produce carpet tiles in a wide variety of colors, patterns, textures, pile heights and densities. These varieties are designed to meet both the practical and aesthetic needs of a broad spectrum of commercial interiors — particularly offices, educational facilities, healthcare facilities, government-related facilities (including but not limited to airports), hospitality spaces, retail facilities, and residential interiors. Our carpet tile systems permit distinctive styling and patterning that can be used to complement interior designs, to set off areas for particular purposes and create visual cues. While we continue to manufacture and sell a substantial portion of our carpet tile in standard styles, most of our modular carpet sales in the Americas and Asia-Pacific regions are made-to-order products designed to meet customer specifications.
Our modular carpet systems are marketed under the established brands Interface and FLOR. We manufacture carpet tiles cut in precise, dimensionally stable squares (usually 50 cm x 50 cm) or rectangles (such as planks and Skinny Planks™). Our GlasBac® technology employs a fiberglass-reinforced polymeric composite backing that provides dimensional stability and reduces the need for adhesives or fasteners. We also make carpet tiles with a backing containing post-industrial and/or post-consumer recycled materials. In addition, we make carpet tile with yarn containing varying degrees of recycled post-consumer nylon, depending on the style and color.
In 2021, we introduced our Open Air™ collection of more affordable carpet tiles — an expansive platform of hard-working carpet tile styles designed with open spaces in mind. Innovations in both design and manufacturing allow us to create these high-quality, high-performance carpet products at a lower price point.
Launched in 2020, our next generation carpet tile backings are called CQuest™ backings. Guided by materials science and inspired by nature’s carbon-storing abilities, we added new bio-based materials and more recycled content to our backings. The materials in the CQuest backings, when measured on a stand-alone basis, are net carbon negative — meaning that their global warming potential emissions are net negative. The CQuest backings are:
•CQuest™GB – Which features superior performance with a construction of post-consumer recycled content from carpet tiles, bio-based additives, and pre-consumer recycled materials.
•CQuest™Bio – A non-vinyl bio-composite backing made with bio-based and recycled fillers.
•CQuest™BioX – The same material make-up as CQuestBio with a higher concentration of carbon negative materials.
Our i2™ modular product line, which includes our popular Entropy® product, features mergeable dye lots, and includes a number of carpet tile products that are designed to be installed randomly without reference to the orientation of neighboring tiles. The i2 line offers cost-efficient installation and maintenance, interactive flexibility, and recycled and recyclable materials. Our TacTiles® carpet tile installation system uses small squares of adhesive plastic film to connect intersecting carpet tiles, thus eliminating the need for traditional carpet adhesive and resulting in a reduction in installation time and material waste.
We also sell our FLOR line of products to specifically target modular carpet sales to the residential market segment, and in recent years FLOR products have had crossover success in commercial markets. In addition, we have created modular carpet products designed for each of the education, healthcare, hospitality and retail market segments.
The award-winning design firm David Oakey Designs has had a pivotal role in developing many of our innovative product designs. David Oakey Designs has developed products that are manufactured using state-of-the-art tufting technology, which allows us to pinpoint tufts of different colored yarns in virtually any arrangement within a carpet tile. These unique designs are best exemplified by our Urban Retreat®, Net Effect®, Human Nature® and World Woven® collections, which are sold throughout our international operations.
In 2020, we achieved a substantial milestone in our journey toward becoming a sustainable enterprise. Simultaneously with the launch of our CQuest backings described above, we introduced in the Americas and subsequently in our EAAA geographical regions, our first ever “cradle-to-gate” carbon negative carpet tile products in three unique styles: Shishu Stitch™, Tokyo Texture™, and Zen Stitch™. These pioneering products, which are part of our Embodied Beauty™ collection, are created with a combination of our CQuestBioX carpet backing (featuring bio-based materials and more recycled content), specialty yarns and tufting processes that create a carpet tile with a net negative value of “embodied carbon”.
Embodied carbon is the carbon footprint (meaning the global warming potential of emissions of greenhouse gases measured in carbon dioxide equivalents) of a product from raw material creation, growth and extraction (the “cradle”) through processing until it is packaged and ready to be shipped from our factory (the “gate”), thus referred to as “cradle-to-gate” in the life cycle assessment of a product. Embodied carbon is distinct from operational carbon, which refers to the carbon footprint of everything that happens after the product leaves our factory, such as shipment, customer use, and end of life.
Modular Resilient Flooring
In 2016, we began offering a category of products we call modular resilient flooring, and our first product introductions into this category were LVT products in the United States. LVT shares many of the same attributes and benefits as carpet tile, but has a resilient or hard surface instead of a soft surface of yarn. In 2017, we launched our LVT products globally, beginning with the Level Set™ collection which is available in styles with printed top layers in a variety of aesthetic looks, including natural woodgrains and stones, textured woodgrains, and patterns. Our LVT products are modular and come in sizes that match certain of our modular carpet tile squares and planks. Some of our LVT products are engineered to the same or similar height as our modular carpet, which means our customers have the ability to install our LVT and modular carpet products side by side without transition strips or layering. In addition, some of our LVT products include a backing system that provides acoustic insulation without the need for additional underlayment, which can reduce the impact of sound in the space where the flooring is used.
Rubber Flooring
With the acquisition of nora in 2018, we began offering rubber flooring products under the established noraplan and norament brands, which enhances the Company’s resilient flooring portfolio. Rubber flooring is ideal for applications that require hygienic, safe flooring with strong chemical resistance. Rubber flooring is extremely durable compared to other flooring alternatives.
Other Products and Services
We sell our TacTiles carpet tile installation system, along with a variety of traditional adhesives and products for carpet installation and maintenance that are manufactured by a third party. We also continue to provide “turnkey” project management services for a number of global accounts and other large customers through our InterfaceSERVICES™ business.
Manufacturing and Raw Materials
We manufacture carpet tile at two locations in the United States and at facilities in the Netherlands, the United Kingdom, China and Australia. We manufacture rubber flooring in Germany.
Our raw materials are generally available from multiple sources — both regionally and globally — with the exception of synthetic fiber (nylon yarn). For yarn, we principally rely upon two major global suppliers, but we also have significant relationships with at least two other suppliers. Although our number of principal yarn suppliers is limited, we do have the capability to manufacture carpet using yarn produced from two separate polymer feedstocks — nylon 6 and nylon 6,6 — which provides additional flexibility with respect to yarn supply inputs, if needed. Our global sourcing strategy, including with respect to our principal yarn suppliers and dual polymer manufacturing capability, allows us to help guard against any potential shortages of raw materials or raw material suppliers in a specific polymer supply chain. For rubber flooring, the key polymer raw materials are available from multiple sources, and we can source both synthetic and natural rubber depending on product specification and material availability.
We also have technology that separates the face fiber and backing of reclaimed and waste carpet, thus making it easier to recycle some of its components and providing a purer supply of inputs for our CQuestGB carpet backing. This technology, which is part of our ReEntry®2.0 carpet reclamation program, allows us to send some of the reclaimed face fiber back to our fiber supplier to be blended with virgin or other post-industrial materials and extruded into new fiber.
The environmental management systems of our floorcovering manufacturing facilities in LaGrange, Georgia, West Point, Georgia, Northern Ireland, the Netherlands, China and Australia are certified under International Standards Organization (ISO) Standard No. 14001. Nora’s manufacturing facility, which is located in Weinheim, Germany, is ISO14001 certified as well and sells the majority of its products with the Blauer Engel label. Blauer Engel is the leading German institute that recognizes products that have environmentally friendly aspects.
Sales and Marketing
We distribute our products through two primary channels: (1) direct sales to end users; and (2) indirect sales through independent contractors, installers and distributors. We use an exclusive third-party distributor to sell our products in the Latin American region. We have traditionally focused our carpet marketing strategy on major accounts, seeking to build lasting relationships with national and multinational end-users, and on architects, interior designers, engineers, contracting firms, and other specifiers who often make or significantly influence purchasing decisions. While the corporate office market segment, including new construction and renovation, is our largest, we also emphasize sales in other market segments, including schools and educational facilities, government institutions, retail space, healthcare facilities, tenant improvement space, hospitality centers, residences and home office space. Our marketing efforts are enhanced by the established and well-known brand names of our carpet products, including Interface and FLOR, as well as the strength of the nora rubber flooring brands of noraplan and norament.
An important part of our marketing and sales efforts involves the preparation of custom-made samples of requested carpet designs, in conjunction with the development of innovative product designs and styles to meet the customer’s particular needs. In most cases, we can produce samples to customer specifications in less than five days, which significantly enhances our marketing and sales efforts. In addition, through our websites, we have made it easy to view and request samples of our products. We also use technology which allows us to provide digital, simulated samples of our products, which helps reduce raw material and energy consumption associated with our samples.
We primarily use our internal marketing and sales force teams to market our flooring products. In order to implement our global marketing efforts, we have product showrooms or design studios in the United States, England, France, Germany, Spain, the Netherlands, India, Australia, United Arab Emirates, Singapore, Hong Kong, China and elsewhere. We may open offices in other locations around the world as necessary to capitalize on opportunities.
Business Strategy and Principal Initiatives
Our business strategy is to continue to use our leading position in modular carpet, product design and global made-to-order capabilities as a platform from which to position our modular carpet, LVT products, rubber flooring, and other resilient products across several industry segments.
Recently, we also launched our One Interface strategy which is a multi-year effort focused on:
•Building strong global functions like Marketing, IT, Human Resources, and Finance to support our world-class local selling teams.
•Accelerating growth through enhanced productivity of our commercial team.
•Expanding margins through global supply chain management and simplifying operations.
•Leading in design, innovation, and sustainability.
Through these strategies, we will seek to increase revenues and profitability by pursuing the following key initiatives:
Continue to Penetrate Diversified Market Segments. We plan to continue our strategic focus on product design and marketing and sales efforts in the corporate office, government, education, healthcare, hospitality, and residential living market segments. This initiative is part of a market diversification strategy to reduce our exposure to the economic cyclicality of the corporate office market segment, and it has become a principal strategy generally for growing our business and enhancing profitability.
Develop a Substantial Resilient Flooring Business. Building upon the success of our products in the LVT market, we plan to expand our LVT product offerings while also seeking to introduce new products in the resilient flooring category. We believe our ability to offer and sell our soft and hard surfaces in an integrated flooring design helps meet the needs of our customers by complementing and enhancing our carpet tile portfolio with true modular installation, no transition strips between surfaces, carpet tile and resilient products that are in some cases the same size and shape, and favorable acoustic properties. Our nora products are a key component of our strategy in this area.
Sustain Leadership in Product Design, Product Development, and Sustainability. Our CQuest backings, Embodied Beauty collection, and our plank, Skinny Plank, and i2 products and TacTiles installation system have confirmed our position as an innovation leader in modular flooring. We plan to continue to pursue initiatives to sustain, augment and capitalize upon that strength to continue to increase our market share in targeted market segments. We also plan to continue to focus on carbon reductions in our products and operations as we work toward achieving our science-based targets by 2030 and as we work toward our goal of becoming a carbon negative enterprise by 2040.
Seasonality
As we have executed on our strategy, sales in the education market segment have increased, in recent years, particularly in the second and third quarters as schools often schedule renovation projects during the summer months when schools are typically closed.
Competition
We compete, on a global basis, in the sale of our modular carpet products with other carpet manufacturers and manufacturers of vinyl and other types of floorcoverings. Although the industry has experienced significant consolidation, a large number of manufacturers remain in the industry. A number of domestic and foreign competitors manufacture modular carpet as one segment of their business, and some of these competitors have financial resources greater than ours. In addition, some of the competing carpet manufacturers have the ability to extrude at least some of their requirements for fiber used in carpet products and own manufacturing facilities for their resilient product offerings, which decreases their dependence on third-party suppliers.
We believe the principal competitive factors in our primary floorcovering markets are brand recognition, quality, design, service, broad product lines, product performance, marketing strategy, pricing and sustainability. We compete against various floorcoverings including carpet tile, broadloom carpet, LVT and other hard surface flooring, and polished concrete. We believe the quality, service, design, better product performance, flexibility (such as design options, selective rotation or replacement, and use in combination with our resilient products), environmental footprint and convenience of our flooring products are our principal competitive advantages.
We believe we have competitive advantages in several other areas as well. First, having both an internal design staff as well as our relationship with David Oakey Designs allows us to introduce numerous innovative and attractive carpet tile and resilient products to our customers. Additionally, we believe that our global carpet tile manufacturing capabilities are an important competitive advantage in serving the needs of multinational corporate customers.
Our sustainability goals are a brand-enhancing, competitive strength as well as a strategic initiative. Many of our customers are concerned about the environmental and broader ecological implications of their operations and the products they use in them. Our leadership, knowledge and expertise in the area, especially in the “green building” movement and related environmental certification programs, resonate deeply with many of our customers and prospects around the globe. Our modular carpet products historically have had inherent installation and maintenance advantages that have translated into greater efficiency and waste reduction. We are using raw materials and production technologies, such as our ReEntry 2.0 reclaimed carpet separation process and our CQuest backings, that directly reduce adverse impacts of those operations on the environment and limit our dependence on petrochemicals.
Product Design, Research and Development
We maintain an active research and development, product development and design staff. We also draw on the research and development efforts of our suppliers, particularly in the areas of fibers, yarns and modular carpet backing materials. The research and development team provides us with technical support and advanced materials research and development. Innovation and increased customization in product design and styling are the principal focus of our product development efforts, and this focus has led to several design breakthroughs such as our CQuest backings, plank and Skinny Plank products, as well as our i2 product line. Our design and development team is recognized as an industry leader in design and product engineering for the commercial and institutional markets.
David Oakey Designs provides carpet design and consulting services to us pursuant to a consulting agreement, and this firm augments our internal research, development and design staff. David Oakey Designs’ services under the agreement include creating commercial carpet designs for use by our modular carpet businesses throughout the world and overseeing product development, design and coloration functions for our modular carpet business in North America. The agreement can be terminated by either party upon six months prior written notice to the other party.
In 2020, we launched our first ever cradle-to-gate carbon negative carpet tile. Our goal is to offer products with the lowest carbon footprint possible and products that help maintain a climate fit for life. Our carbon negative carpet tile features carbon negative materials in the CQuestBioX backing in combination with specialty yarns and tufting processes. We have developed innovative ways to work with recycled content and bio-based materials, which has led us to make carpet tiles that store carbon, preventing its release into the atmosphere.
Our nora rubber flooring products have also focused on innovative performance and design. A key innovation is the self-adhesive nTx solution for nora tiles and sheet goods. Notable changes in design include noraplan Iona introducing a rubber on rubber print, noraplan valua introducing natural woodlike colors and embossing, and noraplan unita that incorporates real granite parts in a rubber floor. The combination of performance and design makes nora the recognized market leader in rubber flooring. In January 2025, the Company unveiled the first of a kind carbon negative nora rubber flooring prototype, which has a carbon negative footprint when measured cradle to gate.
Environmental and Sustainability Initiatives
Our sustainability strategy began more than 25 years ago with initiatives aimed at reducing waste, environmental footprint and costs. With our CQuestGB, CQuestBio and CQuestBioX backings, we are able to use more bio-based and recycled materials. As more customers in our target markets share our view that sustainability is an important factor, we expect sustainability will become an increasingly important factor in purchasing and design decisions. In 2021, we set a goal to reduce our CO2 emissions across our Company and supply chain by 2030 with targets validated by the Science Based Targets Initiative. Our targets are to reduce our absolute Scope 1 and 2 greenhouse gas emissions 50% by 2030 from a 2019 base year, and to reduce our absolute Scope 3 greenhouse gas emissions from purchased goods and services 50% and from business travel and employee commuting 30% by 2030 from a 2019 base year. We also set a separate goal to become a carbon negative enterprise by 2040.
Compliance with Government Regulations
We are subject to various federal, state and foreign laws and regulations that address various aspects of our business such as worker safety, privacy, trade sanctions and anticorruption. In addition, our operations are subject to laws and regulations relating to the generation, storage, handling, emission, transportation and discharge of materials into the environment. The costs of complying with these laws and regulations have not had a material adverse impact on our financial condition or results of operations in the past and are not expected to have a material adverse impact in the future. The environmental management systems of our floorcovering manufacturing facilities in LaGrange, Georgia, West Point, Georgia, Northern Ireland, the Netherlands, China, Germany and Australia are certified under ISO Standard No. 14001.
Backlog
Our backlog of unshipped orders was approximately $223.4 million at February 2, 2025, compared with approximately $195.5 million at February 4, 2024. Historically, backlog is subject to significant fluctuations due to the timing of orders for individual large projects. Disruptions in supply and distribution chains have resulted in delays of construction projects and flooring installations in many regions worldwide, which also have caused, and may continue to cause, fluctuations in our backlog.
Patents and Trademarks
We own numerous patents in the United States and abroad on floorcovering products and on manufacturing processes. The duration of United States patents is between 14 and 20 years from the date of filing of a patent application or issuance of the patent; the duration of patents issued in other countries varies from country to country. We maintain an active patent and trade secret program in order to protect our proprietary technology, know-how and trade secrets. Although we consider our patents to be very valuable assets, we consider our know-how and technology even more important to our current business than patents, and, accordingly, believe that expiration of existing patents or non-issuance of patents under pending applications would not have a material adverse effect on our operations.
We also own many trademarks in the United States and abroad. In addition to the United States, the primary jurisdictions in which we have registered our trademarks are the European Union, United Kingdom, Canada, Australia, New Zealand, Japan, and various countries in Central America, South America and Asia. Some of our more prominent registered trademarks include: Interface, FLOR, GlasBac, CQuest, nora, norament, noraplan, nTX solution, noraplan unita, noraplan valua, and TacTiles. Trademark registrations in the United States are valid for a period of 10 years and are renewable for additional 10-year periods as long as the mark remains in actual use. The duration of trademarks registered in other jurisdictions varies.
Human Capital
Interface is a purpose-driven company with a passionate team that shares a unique set of values. We strive to do the right thing and to be generous to people and the planet. Our core values represent who we are, how we see the world, how we treat each other and our external customers and stakeholders, and how we approach our work every day. These core values are:
•Design a better way;
•Be genuine and generous;
•Inspire others;
•Connect the whole; and
•Embrace tomorrow, today.
At December 29, 2024, we employed a total of 3,636 employees worldwide. Of such total, 1,371 were clerical, staff, sales, supervisory and management personnel and 2,265 were manufacturing personnel.
Some of our employees in Australia, the United Kingdom and China are represented by unions. In the Netherlands, a Works Council, the members of which are Interface employees, is required to be consulted by management with respect to certain matters relating to our operations in that country, such as a change in control of Interface Europe B.V. (our modular carpet subsidiary based in the Netherlands), and the approval of the Works Council is required for some of our actions, including changes in compensation scales or employee benefits. The majority of our employees in Germany are represented by a Works Council as well. Our management believes that its relations with the Works Councils, the unions and our employees are good.
Information About Our Executive Officers
Our executive officers, their ages as of December 29, 2024, and their principal positions with us are set forth below. Executive officers serve at the pleasure of the Board of Directors.
| | | | | | | | |
| Name | Age | Principal Position(s) |
| Laurel M. Hurd | 55 | President and Chief Executive Officer |
| David B. Foshee | 54 | Vice President, General Counsel and Secretary |
| Bruce A. Hausmann | 55 | Vice President and Chief Financial Officer |
| James Poppens | 60 | Vice President and Chief Commercial Officer |
| Nigel Stansfield | 57 | Vice President and Chief Innovation and Sustainability Officer |
Ms. Hurd joined us in April 2022 after having worked previously for global consumer goods company Newell Brands, Inc. Ms. Hurd served as Segment President, Learning and Development at Newell Brands Inc. starting in February 2019, leading its Baby and Writing businesses. Previously, Ms. Hurd was the Division Chief Executive Officer for Newell Brands’ Writing division starting in February 2018. From 2016 to February 2018, she served as Chief Executive Officer of Newell Brands’ Baby division. From May 2014 until 2016, Ms. Hurd was President of the Baby and Parenting division at Newell Brands, where she oversaw the Calphalon, Goody, and Rubbermaid consumer brands. From 2012 to 2014, Ms. Hurd was Vice President, Global Development for Newell Brands, leading both Marketing and Research & Development for the Graco, Aprica, and Teutonia brands globally.
Mr. Foshee, who previously practiced with an Atlanta-based international law firm, joined us in October 1999 as Associate Counsel. He was promoted to Assistant Secretary in April 2002, Senior Counsel in April 2006, Assistant Vice President in April 2007, Vice President in July 2012, Associate General Counsel in May 2014, and Secretary and General Counsel in January 2017.
Mr. Hausmann joined us in April 2017 as Vice President and Chief Financial Officer. He came to us from the food, facilities and uniform services supplier Aramark Corporation, where he served as Senior Vice President and Chief Financial Officer for Aramark’s Uniform business unit since 2009, and for Aramark’s Direct Store Delivery segment since 2014. Prior to joining Aramark, he served as Vice President and Segment Controller for the Interactive Media Group of The Walt Disney Company, which he joined in 2002. He has also previously held finance and controller positions with several software and internet companies and is a certified public accountant (inactive status) in the State of California.
Mr. Poppens joined us in 2017 to lead the restructuring of our FLOR business and then served as Vice President of Corporate Marketing and was responsible for the global Interface brand, digital strategy, global product commercialization planning as well as leading the FLOR business. He was named President for our Americas business in February 2020. Prior to joining us, Mr. Poppens held leadership roles at Newell Rubbermaid, Kellogg Company, REI, and Coca-Cola. Effective February 1, 2023, Mr. Poppens was named Chief Commercial Officer, and his former role as President of Americas was eliminated.
Mr. Stansfield was the Operations Manager for Firth Carpets (our former European broadloom operations) at the time it was acquired by us in 1997. For two years following that acquisition, Mr. Stansfield served as Manufacturing Systems Manager, part of a global project team that designed and implemented manufacturing software systems at seven of our manufacturing plants. In 1999, he returned to Firth Carpets as Operations Director. In 2002, he became a member of our European research and development team focusing on our sustainability initiatives, and in 2004, he became Product and Innovations Director for all of our European Operations. In 2010, he joined our European management team as Senior Vice President of Product, Design and Innovation, before being named Vice President and Chief Innovations Officer for the Company in March 2012. In December 2016, he became President of our business serving Europe, the Middle East and Africa, and in January 2019 he assumed responsibility for the Asia-Pacific region as well. Effective February 1, 2023, Mr. Stansfield was named Chief Innovation and Sustainability Officer, and his former role as President of Europe, Africa, Australia and Asia was eliminated.
Available Information
We make available free of charge on or through our Internet website our Annual Report on Form 10-K, quarterly reports on Form 10-Q, current reports on Form 8-K and amendments to those reports filed or furnished pursuant to Section 13(a) or 15(d) of the Securities Exchange Act of 1934 as soon as reasonably practicable after we electronically file such material with, or furnish it to, the Securities and Exchange Commission (“SEC”). Our Internet address is http://www.interface.com. The content of our website is not incorporated by reference into this Annual Report on Form 10-K or in any other report or document we file with the SEC, and any references to our website is intended to be inactive textual references only. The SEC maintains a website that contains annual, quarterly and current reports, proxy statements and other information that issuers (including the Company) file electronically with the SEC. The SEC’s website is http://www.sec.gov.
Interface, Inc. was incorporated in Georgia in 1973.
Forward-Looking Statements
This report on Form 10-K contains “forward-looking statements” within the meaning of the Securities Act of 1933, the Securities Exchange Act of 1934, and the Private Securities Litigation Reform Act of 1995. Words such as “believes,” “anticipates,” “plans,” “expects,” “projects,” “estimates” and similar expressions are intended to identify forward-looking statements. Forward-looking statements include statements regarding the intent, belief or current expectations of our management team, as well as the assumptions on which such statements are based. Any forward-looking statements are not guarantees of future performance and involve a number of risks and uncertainties that could cause actual results to differ materially from those contemplated by such forward-looking statements. Forward-looking statements in this report include, without limitation, any statements regarding the effects of inflation, high interest rates, current wars and conflicts, the supply chain environment, slow market conditions in certain geographic areas, tariffs, freight costs, pressures in the commercial office market and other macroeconomic factors, and our future production volumes per unit fixed costs, on our future performance. We undertake no obligation to update or revise forward-looking statements to reflect changed assumptions, the occurrence of unanticipated events or changes to future operating results over time. Important factors currently known to management that could cause actual results to differ materially from those in forward-looking statements include risks and uncertainties associated with economic conditions in the commercial interiors industry as well as the risks and uncertainties discussed below in Item 1A, “Risk Factors.”
ITEM 1A. RISK FACTORS
You should carefully consider the following factors, in addition to the other information included in this Annual Report on Form 10-K and the other documents incorporated herein by reference, before deciding whether to purchase or sell our securities. Any or all of the following risk factors could have a material adverse effect on our business, financial condition, results of operations and prospects.
Risk Factors Related to our Business and Operations
We compete with a large number of manufacturers in the highly competitive floorcovering products market, and some of these competitors have greater financial resources than we do. We may face challenges competing on price, making investments in our business, or competing on product design or sustainability.
The floorcovering industry is highly competitive. Globally, we compete for sales of floorcovering products with other carpet manufacturers and manufacturers of other types of floorcovering. Although the industry has experienced significant consolidation, a large number of manufacturers remain in the industry. From time to time, our competitors add or modify manufacturing capacity throughout the globe, which increases the amount or cost structure of supply in the market. Increased capacity or manufacturing efficiencies at our competitors could result in pricing pressure on our products and less demand for our products, thus adversely affecting both revenues and profitability.
Some of our competitors, including a number of large diversified domestic and foreign companies who manufacture modular carpet and resilient flooring as one segment of their business, have greater financial resources than we do. Competing effectively may require us to make additional investments in our product development efforts, manufacturing facilities, distribution network, and sales and marketing activities.
In addition, we often compete on design preferences. Our customers’ design preferences may evolve or change before we adapt quickly enough to those changes or before we recognize those changes have happened in the marketplace. If this occurs, it could negatively affect our sales as our customers choose other product offerings that more closely align with their design preferences. Moreover, as our competitors improve the sustainability attributes of their products and operations, or if our competitors market the sustainability attributes of their products or operations more effectively than we do, it could negatively affect the degree to which we differentiate from our competitors on those attributes which could negatively affect our ability to compete and gain those sales as customers choose product offerings from our competitors instead of our product offerings. In situations such as these, we may be required by accounting rules to recognize a loss for the write-down of the value of our inventory due to its age or obsolescence.
Our earnings could be adversely affected by non-cash adjustments to goodwill, when a test of goodwill assets indicates a material impairment of those assets.
As prescribed by accounting standards governing goodwill and other intangible assets, we undertake an annual review of the goodwill asset balance reflected in our financial statements. Our review is conducted during the fourth quarter of the year, unless there has been a triggering event prescribed by applicable accounting rules that warrants an earlier interim testing for possible goodwill impairment. A future goodwill impairment test may result in a future non-cash adjustment, which could adversely affect our earnings for any such future period.
In recent years, we recorded goodwill and intangible asset impairment charges of $36.2 million in the fourth quarter of 2022. The 2022 impairment charge was primarily a result of macroeconomic conditions, such as inflation, rising interest rates and the weakening of the Euro against the U.S. dollar causing a negative impact to our revenue and operating income in our EMEA goodwill reporting unit. Future impairment charges could result if these macroeconomic conditions or other negative market events or conditions continue to impact our operations.
Our success depends significantly upon the efforts, abilities and continued service of our senior management executives, our principal design consultant and other key personnel (including experienced sales and manufacturing personnel), and our loss of any of them could affect us adversely.
We believe that our success depends to a significant extent upon the efforts and abilities of our senior management executives. In addition, we rely significantly on the leadership that David Oakey of David Oakey Designs provides to our internal design staff. Specifically, David Oakey Designs provides product design/production engineering services to us under an exclusive consulting contract that contains non-competition covenants. Our agreement with David Oakey Designs can be terminated by either party upon six months prior written notice to the other party. Our business also depends on the recruitment and retention of other key personnel, including experienced sales and manufacturing personnel.
The increasing demand for qualified personnel makes it more difficult for us to attract and retain employees with requisite skill sets, particularly employees with specialized technical and trade experience. In certain locations where we operate, the demand for labor has exceeded the supply of labor, resulting in higher costs. Despite our focused efforts to attract and retain employees, including by offering higher levels of compensation in certain instances, we experienced attrition rates within our hourly workforce in recent years, that exceeded historical levels and we incurred higher operating costs at certain of our facilities in the form of higher levels of overtime pay. The market for professional workers was, and remains, similarly challenging. As a result, we may experience higher levels of attrition within our professional workforce in the future.
We may lose the services of key personnel for a variety of reasons, including if our compensation programs become uncompetitive in the relevant markets for our employees and service providers, or if the Company undergoes significant disruptive change, including economic downturns. The loss of key personnel with a great deal of knowledge, training and experience — particularly in the areas of sales, marketing, operations, product design and management — could have an adverse impact on our business. We may not be able to easily replace such personnel, particularly if the underlying reasons for the loss make the Company relatively unattractive as an employer.
We continue to implement changes within our sales organization, including to the standardized processes and systems that our sales force uses to go to market, interact with customers, work with architects and the design community and, in general, operate day-to-day. We also continue to improve and change the technology tools that the sales force is required to use as part of their day-to-day jobs and monitor managerial positions that are designed to actively manage and coach the sales force. All of these changes are disruptive, which may create challenges for our sales force to adapt, particularly for long tenured employees. There are no guarantees that these efforts will increase sales or improve profitability of the business, or that they will not instead adversely disrupt the business, decrease sales, and decrease overall profitability.
Large increases in the cost of our raw materials, shipping costs, duties or tariffs could adversely affect us if we are unable to pass these cost increases through to our customers.
Petroleum-based products (including yarn) comprise the predominant portion of the cost of raw materials that we use in manufacturing carpet. Synthetic rubber uses petroleum-based products as feedstock as well. We also incur significant shipping and transport costs to move our products around the globe, and those costs have increased dramatically due to global supply chain, macroeconomic and geopolitical challenges. The possibility of government-imposed tariffs in locations where we operate could have an adverse impact on our business. While we attempt to match cost increases with corresponding price increases, inflation and volatility in the cost of raw materials, foreign currency fluctuations, tariffs and potential retaliatory tariffs, transportation, shipping costs, and other costs could adversely affect our financial results if we are unable to pass through such cost increases to our customers.
Unanticipated termination or interruption of any of our arrangements with our primary third-party suppliers of synthetic fiber or our primary third-party supplier for luxury vinyl tile (“LVT”) or other key raw materials could have a material adverse effect on us.
We depend on a small number of third-party suppliers of synthetic fiber and are largely dependent upon a primary supplier for our LVT products. The unanticipated termination or interruption of any of our supply arrangements with our current suppliers of synthetic fiber (nylon), our primary supplier of LVT, or other key raw material suppliers, including failure by any third-party supplier to meet our product specifications, could have a material adverse effect on us because we do not have the capability to manufacture our own fiber for use in our carpet products or our own LVT. Our suppliers may not be able to meet our demand for a variety of reasons, including our inability to forecast our future needs accurately or a shortfall in production by the supplier for reasons unrelated to us, such as work stoppages, acts of war, terrorism, pandemics, epidemics, fire, earthquake, energy shortages, flooding or other natural disasters. The primary manufacturing facility of our primary supplier of LVT is located in South Korea. If any of our supply arrangements with our primary suppliers of synthetic fiber, our primary supplier of LVT, or suppliers of other key raw materials are terminated or interrupted, we likely would incur increased manufacturing costs and experience delays in our manufacturing process (thus resulting in decreased sales and profitability) associated with shifting more of our synthetic fiber purchasing to another synthetic fiber supplier or developing new supply chain sources for LVT. A prolonged inability on our part to source synthetic fiber included in our products, LVT, or other key raw materials on a cost-effective basis could adversely impact our ability to deliver products on a timely basis, which could harm our sales and customer relationships.
Changes to our facilities, manufacturing processes, product construction, and product composition could disrupt our operations, increase our manufacturing costs, increase customer complaints, increase warranty claims, negatively affect our reputation, and have a material adverse effect on our financial condition and results of operations.
From time to time, we make improvements and changes to our physical facilities, move operations to other sites, and change our manufacturing processes. Large scale changes or moves could disrupt our normal operations, leading to possible loss of productivity, which may adversely affect our results. We are also making significant investments and modifications to our manufacturing facilities, processes, product compositions, and product construction including but not limited to the production of our CQuest™ carpet tile backings. These changes can be disruptive. There is also no guarantee that our CQuest™ backings will perform as expected and will not increase warranty claims or customer complaints. These efforts may also not yield the financial returns and improvements in the business that we hope to achieve from them. While these changes are intended to yield stronger financial results, they could potentially impact our financial results in negative ways due to project delays, business disruption as new facilities and equipment come online, increased customer complaints, or increased warranty claims; all of which could negatively affect our operations, reputation, financial condition and results of operations.
Our business operations could suffer significant losses from natural disasters, acts of war, terrorism, catastrophes, fire, adverse weather conditions, pandemics, endemics, unstable geopolitical situations or other unexpected events.
While we manufacture our products in several facilities and maintain insurance covering our facilities, including business interruption insurance, our manufacturing facilities could be materially damaged by natural disasters, such as floods, storms, tornadoes, hurricanes and earthquakes, whether or not as a result of climate change, or by fire or other unexpected events such as adverse weather conditions, acts of war, terrorism, protests, energy shortages and disruptions, pandemics or other public health crises or other disruptions to our facilities, supply chain or our customers’ facilities. We have experienced such losses in the past. We could incur uninsured losses and liabilities arising from such events, including damage to our reputation, and suffer material losses in operational capacity, which could have a material adverse impact on our business, financial condition and results of operations. These types of events could also affect our suppliers, installers, and customers, which could have a material adverse impact on our business.
The market price of our common stock has been volatile and the value of your investment may decline.
The market price of our common stock has been volatile in the past and may continue to be volatile going forward. Such volatility may cause precipitous drops in the price of our common stock on the Nasdaq Global Select Market and may cause your investment in our common stock to lose significant value. As a general matter, market price volatility has had a significant effect on the market values of securities issued by many companies for reasons unrelated to their operating performance. We cannot predict the market price for our common stock going forward.
Sales of our principal products have been and may continue to be affected by adverse economic cycles, and effects in the new construction market and renovation market.
Sales of our principal products are related to the renovation and construction of commercial and institutional buildings. This activity is cyclical and has been affected by the strength of a country’s or region’s general economy, prevailing interest rates and other factors, including increased office vacancies caused by lingering effects from the COVID-19 pandemic and hybrid work schedules, that lead to cost control measures or reduction in the use of space by businesses and other users of commercial or institutional space. In addition, the effects of cyclicality and other factors affecting the corporate office segment have traditionally tended to be more pronounced than the effects on other market segments. Historically, we have generated more sales in the corporate office market segment than in any other market segment. The effects of cyclicality and other factors on the new construction segment of the market have also tended in the past to be more pronounced than the effects on the renovation segment. These effects may recur and could be more pronounced if global economic conditions do not improve or are weakened by negative cycles or other factors.
Disruptions to or failures of information technology systems we use could adversely affect our business.
We rely heavily on information technology systems—both software and computer hardware—to operate our business. Some of these systems are owned and operated by us, and some are owned or operated by third parties pursuant to leases, licenses or other contracts with those third parties. We rely on these systems to, among other things:
•facilitate and plan the purchase, management and distribution of, and payment for, inventory and raw materials;
•control our production processes;
•manage and monitor our distribution network and logistics;
•receive, process and ship orders;
•manage billing, collections, cash applications, customer service, and payables;
•manage financial reporting; and
•manage payroll and human resources information.
The IT systems we use may be disrupted or fail for a number of reasons, including:
•natural disasters, such as fires;
•power loss;
•software “bugs”, hardware defects or human error; and
•hacking, computer viruses, denial of service attacks, malware, ransomware, phishing scams, compromised or irretrievable backups or other cyber-attacks.
Any of these events which deny us use of vital IT systems may seriously disrupt our normal business operations. These disruptions may lead to production or shipping stoppages, which may in turn lead to material revenue loss and reputational harm.
Despite security designs and internal controls, the IT systems we use have in the past experienced, and may in the future become subject to, attempts by unauthorized third parties to access and exfiltrate confidential information, manipulate data or disrupt our operations. In November 2022, we discovered a cybersecurity attack, perpetrated by unauthorized third parties, affecting our IT systems (the “Cyber Event”). In response, we promptly shut down certain systems, including shipping, inventory management and production systems, and engaged forensic experts to evaluate the extent of the Cyber Event and its disruption to our operations. The investigation of the Cyber Event by our forensic experts was completed during fiscal year 2023.
In fiscal year 2022, in connection with the Cyber Event, our revenues were adversely affected by approximately $8 million due to lost sales. Additionally, we incurred Cyber Event costs of approximately $5 million in fiscal year 2022 primarily due to idle plant costs, direct labor costs during the period our manufacturing facilities were idle and third-party remediation costs. We have cyber insurance and during 2024, we recovered $5.6 million of our financial losses related to the Cyber Event.
Following the Cyber Event, we implemented measures to enhance our cybersecurity protections against, and reduce the potential of, any future cybersecurity attack. We expect to incur ongoing costs to enhance cybersecurity with the goal of preventing unauthorized access to, or manipulation of, our systems and data.
However, there is no guarantee that these enhancements and steps will be adequate to mitigate future losses due to IT system disruptions, and we may incur significant expense in correcting and recovering from future disruptions.
To the extent our IT systems store sensitive data, including data related to customers, employees or other parties, security breaches may expose us to fines and other liabilities, and reputational harm if such data is misappropriated. In addition, as cybercriminals continue to become more sophisticated and numerous, the costs to defend and insure against cyberattacks can be expected to rise.
The impact of potential changes to environmental laws and regulations and industry standards regarding climate change and other sustainability matters could lead to unforeseen disruptions to our business operations.
Addressing the effects of climate change has taken on increased importance throughout the world. The continued efforts to combat climate change could include more restrictive federal, state, and foreign environmental laws and regulations, heightened industry standards, or other mitigation measures that may have a material adverse effect on our global operations. These initiatives could, for example, increase the cost of obtaining raw materials for production of our products, increase the cost of energy for our manufacturing processes, negatively impact our supply chain and capital expenditures, or increase our administrative costs.
In 2021, we established and publicly disclosed targets and other commitments related to certain sustainability matters, including a goal to reduce our CO2 emissions across our Company and supply chain by 2030. We also set a goal to become a carbon negative enterprise by 2040. If we are unable to meet these targets or commitments on our projected timelines or at all, or if they are perceived negatively, including the perception that they are not sufficiently robust or, conversely, are too costly, our reputation as well as our relationships with investors, customers and other stakeholders could be harmed, which could in turn adversely impact our business, results of operations and the trading price of our common stock.
Health crisis events, such as epidemics or pandemics, have adversely impacted, and may continue to impact, the economy and disrupt our operations and supply chains, which may have an adverse effect on our results of operations.
Health crisis events, including epidemics or pandemics, such as COVID-19, have impacted areas where we operate and sell our products and could have additional impacts on economic growth, supply chains, and foreign currency exchange rates. A public health emergency in the future could have a material adverse effect on our ability to operate, our results of operations, financial condition, and demand for our products.
International Risk Factors
Our substantial international operations are subject to various political, economic and other uncertainties that could adversely affect our business results, including foreign currency fluctuations, restrictive taxation, custom duties, tariffs, border closings or other adverse government regulations.
We have substantial international operations and intend to continue to pursue and commit resources to growth opportunities beyond the United States. Outside of the United States, we maintain manufacturing facilities in the Netherlands, the United Kingdom, China, Australia and Germany, in addition to product showrooms or design studios in England, France, Germany, Spain, the Netherlands, India, Australia, United Arab Emirates, Singapore, Hong Kong, China and elsewhere. In 2024 and 2023 approximately 43% and 46% of our net sales, respectively, and a significant portion of our production were outside the United States, primarily in Europe and Asia-Pacific.
International operations carry certain risks and associated costs, such as: the complexities and expense of administering a business abroad; complications in compliance with, and unexpected changes in, legal and regulatory restrictions or requirements; foreign laws, international import and export legislation; trading and investment policies; economic and political instability in the global markets; foreign currency fluctuations; exchange controls; increased nationalism and protectionism; crime and social instability; tariffs and other trade barriers; difficulties in collecting accounts receivable; potential adverse tax consequences and increasing tax complexity or changes in tax law associated with operating in multiple tax jurisdictions; uncertainties of laws and enforcement relating to intellectual property and privacy rights; difficulty in managing a geographically dispersed workforce in compliance with diverse local laws and customs, including health and safety regulations and wage and hour laws; potential governmental expropriation (especially in countries with undemocratic or authoritarian ruling parties); and other factors depending upon the jurisdiction involved. There can be no assurance that we will not experience these risks in the future.
In addition, due to our global operations, we are subject to many laws governing international relations and international operations, including laws that prohibit improper payments to government officials and commercial customers and that restrict where we can do business, what information or products we can import and export to and from certain countries and what information we can provide to a non-U.S. government. These laws include but are not limited to the U.S. Foreign Corrupt Practices Act (“FCPA”), the U.K. Bribery Act 2010, the Mexican National Anticorruption System (Sistema Nacional Anticorrupción, or “SNA”), the U.S. Export Administration Act and U.S. and international economic sanctions and money laundering regulations. We have internal policies and procedures relating to compliance with such regulations; however, there is a risk that such policies and procedures will not always protect us from the improper acts of employees, agents, business partners or representatives, particularly in the case of recently acquired operations that may not have significant training in applicable compliance policies and procedures. Violations of these laws, which are complex, may result in criminal penalties, sanctions and/or fines that could have an adverse effect on our business, financial condition and results of operations and reputation. In addition, we are subject to antitrust laws in various countries throughout the world. Changes in these laws or their interpretation, administration or enforcement may occur over time. Any such changes may limit our future acquisitions, divestitures or operations.
Finally, we may not be aware of all the factors that may affect our business in foreign jurisdictions. The risks outlined above, and others specific to certain jurisdictions that we may not be aware of, could adversely and materially affect our business and results.
The conflicts between Russia and Ukraine and in the Middle East could adversely affect our business, results of operations and financial position.
Given the nature of our business and our global operations, political, economic, and other conditions in foreign countries and regions, including geopolitical risks arising from the conflicts between Russia and Ukraine and the Middle East, may adversely affect our business, results of operations and financial position.
Historically, Russia was a key supplier of natural gas, oil, and other raw materials to European countries. We have substantial manufacturing operations in Europe (including Germany, the Netherlands, and the United Kingdom), and we have key suppliers in Europe, which rely upon natural gas, oil, and other raw materials to operate. Our sole rubber flooring plant is in Germany, and our primary European carpet tile plant is in the Netherlands. Any disruption in the supply of natural gas, oil, or other raw materials from Russia to Europe could adversely affect our ability to operate our business, our results of operations and our financial position, or adversely affect the ability of our key suppliers to meet our raw material requirements. In particular, reduced Russian exports of natural gas and oil to Europe may materially impede our European manufacturing operations and may result in higher energy costs to operate our facilities. Our customers’ businesses, results of operations and financial positions also could be adversely impacted by the conflict in Ukraine, which could reduce their spending on our products. While we permanently closed our operations in Russia in the third quarter of 2022, the effects of the conflict between Russia and Ukraine on us as well as the global economy cannot be predicted.
The conflicts between Russia and Ukraine and in the Middle East are ongoing and the duration of the conflict and war are uncertain. We cannot predict the outcome of the conflict and war or the impact on the broader region, as the conflict and war and related government actions are evolving and are beyond our control. To the extent the conflicts between Russia and Ukraine and in the Middle East adversely affects our business, the conflict and war may also have the effect of heightening other risks disclosed in our Annual Report, any of which could materially and adversely affect our business, results of operations and financial condition. Such risks include, but are not limited to, adverse effects on macroeconomic conditions, including inflation and reduced corporate and consumer spending; disruptions to our global technology infrastructure, including through cyberattack, ransom attack, or cyber-intrusion; adverse changes in international trade policies and relations; our ability to maintain or increase our prices, including fuel surcharges in response to rising fuel costs; further disruptions in global supply chains; terrorist activities targeting business infrastructure; our exposure to foreign currency fluctuations; and constraints, volatility, or disruption in the capital markets. Other potential consequences of the ongoing conflict and war include or may include government sanctions, embargoes, unstable energy markets, tariff wars, regional instability, geopolitical shifts, potential retaliatory action by the governments involved in the conflict and war against companies or other countries, and increased tensions between the involved governments and the United States or other countries in which we operate.
Fluctuations in foreign currency exchange rates have had, and could continue to have, an adverse impact on our financial condition and results of operations.
Changes in the value of foreign currencies relative to the U.S. dollar have adversely affected our results of operations and financial position and could continue to do so. In recent periods, as the value of the U.S. dollar has strengthened in comparison to certain foreign currencies — particularly in our EAAA segment and the impact of the Euro on our European operations — our reported revenues have been negatively impacted. As approximately 43% of our revenue is denominated in foreign currencies, these exchange rate fluctuations have had, and could continue to have, a significant adverse impact on our financial results.
The uncertainty surrounding the ongoing implementation and effect of the U.K.’s exit from the European Union, and related negative developments in the European Union, could adversely affect our business, results of operations or financial condition.
In 2016, voters in the U.K. approved an exit from the European Union via a referendum (commonly referred to as “Brexit”). The U.K. ceased to be a member of the European Union on January 31, 2020. In December 2020, the U.K. and the European Union agreed on a trade and cooperation agreement. Because the agreement merely sets forth a framework in many respects and will require complex additional bilateral negotiations between the U.K. and the European Union as both parties continue to work on the rules for implementation, significant political and economic uncertainty remains about how the precise terms of the relationship between the parties will differ from the terms before withdrawal. The uncertainty leading up to and following Brexit has had, and the ongoing implementation of Brexit may continue to have, a negative impact on our business and demand for our products in Europe, and particularly in the U.K. Brexit could adversely affect European or worldwide political, regulatory, economic or market conditions and could contribute to instability in political institutions and regulatory agencies. Brexit could also have the effect of disrupting the free movement of goods, services, and people between the U.K., the European Union and elsewhere. In addition, Brexit has had a detrimental effect, and could have further detrimental effects, on the value of either or both of the Euro and the British Pound sterling, which could negatively impact our business (principally from the translation of sales and earnings in those foreign currencies into our reporting currency of U.S. dollars). Such a development could have other unpredictable adverse effects, including a material adverse effect on demand for office space and our flooring products in the U.K. and in Europe if the U.K. exit leads to economic difficulties in Europe.
Risk Factors Related to our Indebtedness
We have a substantial amount of debt, which could adversely affect our business, financial condition and results of operations and our ability to meet our payment obligations under our debt.
We have a substantial amount of debt and debt service requirements. As of December 29, 2024, we had approximately $305.6 million of outstanding debt, and we had $299.3 million of undrawn borrowing capacity under our Syndicated Credit Facility.
This level of debt could have significant consequences on our future operations, including:
•making it more difficult for us to meet our payment and other obligations under our outstanding debt;
•resulting in an event of default if we fail to comply with the financial and other restrictive covenants contained in our debt agreements, which event of default could result in all of our debt becoming immediately due and payable;
•reducing the availability of our cash flows to fund working capital, capital expenditures, acquisitions or strategic investments and other general corporate purposes, and limiting our ability to obtain additional financing for these purposes;
•subjecting us to the risk of increasing interest expense on variable rate indebtedness, including borrowings under our Syndicated Credit Facility;
•limiting our flexibility in planning for, or reacting to, and increasing our vulnerability to, changes in our business, the industry in which we operate and the general economy;
•placing us at a competitive disadvantage compared to our competitors that have less debt or are less leveraged;
•limiting our ability to attract certain investors to purchase our common stock due to the amount of debt we have outstanding; and
•limiting our ability to refinance our existing indebtedness as it matures.
•limiting our ability to pay dividends or repurchase our shares.
In addition, borrowings under our Syndicated Credit Facility have variable interest rates, and therefore our interest expense will increase if the underlying market rates (upon which the variable interest rates are based) increase. For information regarding the current variable interest rates of these borrowings and the potential impact on our interest expense from hypothetical increases in short term interest rates, please see the discussion in Item 7A of this Report.
Any of the above-listed factors could have an adverse effect on our business, financial condition and results of operations and our ability to meet our payment obligations under our debt.
Servicing our debt requires a significant amount of cash, and we may not have sufficient cash flow from our operations to pay our indebtedness.
Our ability to generate cash in order to make scheduled payments of the principal of, to pay interest on or to refinance our indebtedness depends on our future performance, which is subject to economic, financial, competitive, legislative, regulatory and other factors beyond our control. In addition, our ability to borrow funds in the future to make payments on our debt will depend on the satisfaction of the covenants in our Syndicated Credit Facility and our other financing agreements, including the indenture governing the Senior Notes, and other agreements we may enter into in the future. Specifically, we will need to maintain certain financial ratios under our Syndicated Credit Facility. Our business may not continue to generate sufficient cash flow from operations in the future and future borrowings may not be available to us under our existing revolving credit facility or from other sources in an amount sufficient to service our indebtedness, including the Senior Notes, to make necessary capital expenditures or to fund our other liquidity needs. If we are unable to generate cash from our operations or through borrowings, we may be required to adopt one or more alternatives, such as selling assets, restructuring debt or obtaining additional equity capital on terms that may be onerous or highly dilutive. Our ability to make payments on our indebtedness or refinance our indebtedness will depend on the capital markets and our financial condition at such time, as well as the terms of our financing agreements, including the Syndicated Credit Facility, and the indenture governing the Senior Notes. We may not be able to engage in any of these activities or engage in these activities on desirable terms, which could result in a default on our debt obligations. In addition, borrowings under our Syndicated Credit Facility have variable interest rates, and therefore our interest expense will increase if the underlying market rates (upon which the variable interest rates are based) increase.
We may incur substantial additional indebtedness, which could further exacerbate the risks associated with our substantial indebtedness.
Subject to the restrictions in our Syndicated Credit Facility and in the indenture governing our Senior Notes, we and our subsidiaries may be able to incur additional indebtedness in the future. Although our Syndicated Credit Facility and the indenture governing the Senior Notes contain restrictions on the incurrence of additional debt, these restrictions are subject to a number of significant qualifications and exceptions, including the ability, on a non-committed basis, for us to increase revolving commitments and/or term loans under our Syndicated Credit Facility, and debt incurred in compliance with these restrictions could be substantial. If new debt is added to our and our subsidiaries’ existing debt levels, the related risks we now face would increase.
Legal Risk Factors
We face risks associated with litigation and claims.
We have been, and may in the future become, party to lawsuits including, without limitation, actions and proceedings in the ordinary course of business, such as claims brought by our customers in connection with commercial disputes, employment claims made by our current or former employees, or claims relating to intellectual property matters or regulatory investigations and enforcement. Litigation might result in substantial costs and may divert management’s attention and resources, which may adversely affect our business, results of operations and financial condition. An unfavorable judgment against us in any legal proceeding or claim could require us to pay monetary damages and, depending on the nature of the claim and proceeding, may harm our reputation. Insurance might not cover such claims, might not provide sufficient payments to cover all the costs to resolve one or more such claims, and might not continue to be available on terms acceptable to us. In addition, an unfavorable judgment in which the counterparty is awarded equitable relief, such as an injunction, could harm our business, results of operations and financial condition.
Please refer to Item 3, “Legal Proceedings,” within this Report for additional information related to litigation and claims.
ITEM 1B. UNRESOLVED STAFF COMMENTS
None.
ITEM 1C. CYBERSECURITY
Risk Management Strategy
Assess, Identify and Manage Material Risks from Cybersecurity Threats
Interface has integrated cybersecurity risk management into our broader enterprise risk management framework. This integration ensures that cybersecurity considerations are an integral part of our entity-level risk assessment and decision-making process. Cybersecurity risk management is also a vital part our IT incident management and disaster recovery policy that outlines a systematic approach of implementing and executing strategies and procedures to enable the recovery and restoration of vital business functions and IT infrastructure following a significant disruptive event.
Engagement of Third Parties
Interface engages a range of external experts in evaluating and testing our cybersecurity risk management systems. These partnerships enable us to leverage specialized knowledge and insights, ensuring our cybersecurity strategies and processes remain at the forefront of industry best practices. In the event of a cybersecurity incident, the Company uses external experts to assist with an investigation of the incident, an evaluation of the extent to which the cybersecurity event has impacted the Company’s operations, financial condition, and IT infrastructure, and the recovery and restoration following the incident.
We evaluate the inherent risk associated with using external experts by conducting thorough security assessments before engagement and perform ongoing monitoring to ensure compliance with our cybersecurity standards.
Governance and Oversight
The Audit Committee has oversight responsibility for cybersecurity risk management. The Audit Committee is comprised of board members with diverse experience and expertise to effectively oversee risk, although none of them are cybersecurity experts. Our Chief Information Officer, in his capacity, regularly informs the Audit Committee (typically twice per year) and the full board (typically once per year) on all aspects related to cybersecurity risks, as well as any remediation efforts in response to a cybersecurity incident.
Risks from Cybersecurity Threats
Our IT systems face a myriad of cybersecurity threats, including, without limitation, hacking, computer viruses, denial of service attacks, malware, ransomware, phishing scams, compromised or irretrievable backups, and other cyber attacks. Any of these events which deny us use of vital IT systems may seriously disrupt our normal business operations and lead to production or shipping stoppages, revenue loss, and reputational harm.
To the extent our IT systems store sensitive data, including data related to customers, employees or other parties, risks from cybersecurity threats may expose us to fines and other liabilities, and reputational harm if such data is misappropriated. In addition, as cybercriminals continue to become more sophisticated and numerous, the costs to defend and insure against cyberattacks can be expected to rise.
On November 20, 2022, we discovered a cybersecurity attack, perpetrated by unauthorized third parties, affecting our IT systems. In response to this Cyber Event, we notified law enforcement and took steps to supplement existing security monitoring, including scanning and protective measures. The investigation of the Cyber Event was completed during fiscal year 2023. A more detailed discussion of the Cyber Event can be found in Item 7 entitled “Management’s Discussion and Analysis of Financial Condition and Results of Operations” of this Annual Report on Form 10-K.
ITEM 2. PROPERTIES
We maintain our corporate headquarters in Atlanta, Georgia in approximately 42,000 square feet of leased space. The following table lists our principal manufacturing and distribution facilities and other material physical locations (some locations are comprised of multiple buildings) by reportable segment, all of which we own except as otherwise noted:
| | | | | | | | |
| Location | | Floor
Space
(Sq. Ft.) |
| AMS | | |
| LaGrange, Georgia | | 669,145 | |
LaGrange, Georgia(1) | | 250,000 | |
Union City, Georgia(1) | | 370,000 | |
| West Point, Georgia | | 250,000 | |
Salem, New Hampshire(1) | | 126,766 | |
| | |
| EAAA | | |
Craigavon, N. Ireland(1) | | 72,200 | |
| Minto, Australia | | 240,000 | |
| Scherpenzeel, Netherlands | | 1,250,960 | |
Weinheim, Germany(1) | | 873,243 | |
Taicang, China(1) | | 142,500 | |
(1)Leased.
We maintain sales or marketing offices in over 40 locations in 19 countries. Most of our sales and marketing locations are leased.
We believe that our manufacturing and distribution facilities and our marketing offices are sufficient for our present operations. We will continue, however, to consider the desirability of establishing additional facilities and offices in other locations around the world as part of our business strategy to meet global market demands. Substantially all of our owned properties in the United States are subject to mortgages, which secure borrowings under our Syndicated Credit Facility.
ITEM 3. LEGAL PROCEEDINGS
From time to time, we are a party to legal proceedings, whether arising in the ordinary course of business or otherwise. See Note 18 to the consolidated financial statements included in Item 8 of this Annual Report on Form 10-K.
ITEM 4. MINE SAFETY DISCLOSURES
Not applicable.
PART II
ITEM 5. MARKET FOR THE REGISTRANT’S COMMON EQUITY, RELATED STOCKHOLDER MATTERS AND ISSUER PURCHASES OF EQUITY SECURITIES
Our common stock is traded on the Nasdaq Global Select Market under the symbol TILE. As of February 14, 2025, we had 537 holders of record of our common stock. We estimate that there are in excess of 11,000 beneficial holders of our common stock.
Although we have a history of paying quarterly cash dividends on our common stock, future declaration and payment of dividends is at the discretion of our Board, and depends upon, among other things, our investment policy and opportunities, results of operations, financial condition, cash requirements, future prospects, and other factors that may be considered relevant by our Board at the time of its determination. Such other factors include limitations contained in the agreement for our Syndicated Credit Facility and the indenture for our Senior Notes, each of which specify conditions as to when any dividend payments may be made. As such, we may discontinue our dividend payments in the future if our Board determines that a cessation of dividend payments is proper in light of the factors indicated above.
Stock Performance
The following graph and table compare, for the period comprised of the Company’s five preceding fiscal years ended December 29, 2024, the Company’s total returns to shareholders (assuming all dividends were reinvested) with that of (i) all companies listed on the Nasdaq Composite Index, and (ii) our previous self-determined peer group, and (iii) our new self-determined peer group, assuming an initial investment of $100 in each on December 29, 2019 (the last day of the fiscal year 2019). In 2024, the Company updated its self-determined peer group to exclude PGT Innovations, Inc., SP Plus Corporation, and Glatfelter Corporation, which were acquired in 2024 and no longer trade publicly and also to incorporate other peer group changes to align with the peer group used to measure executive compensation. Unifi, Inc. was removed because its smaller size no longer aligned with the peer group profile. American Woodmark Corporation, Gibraltar Industries, Inc., Quanex Building Products Corporation, and Tredegar Corporation were appropriate additions in terms of size and industry, while also enhancing the group’s sample size and placing the Company near the median of the peer group. In determining its peer group companies, the Company considered various factors, including the potential peer’s industry, business model, size and complexity. The Company chose a peer group that is a better representation of the Company’s size and market capitalization with minimal revenue dispersion, and with companies in similar industries or lines of business or subject to similar economic and business cycles, including companies with a significant international presence that are also focused on sustainability.
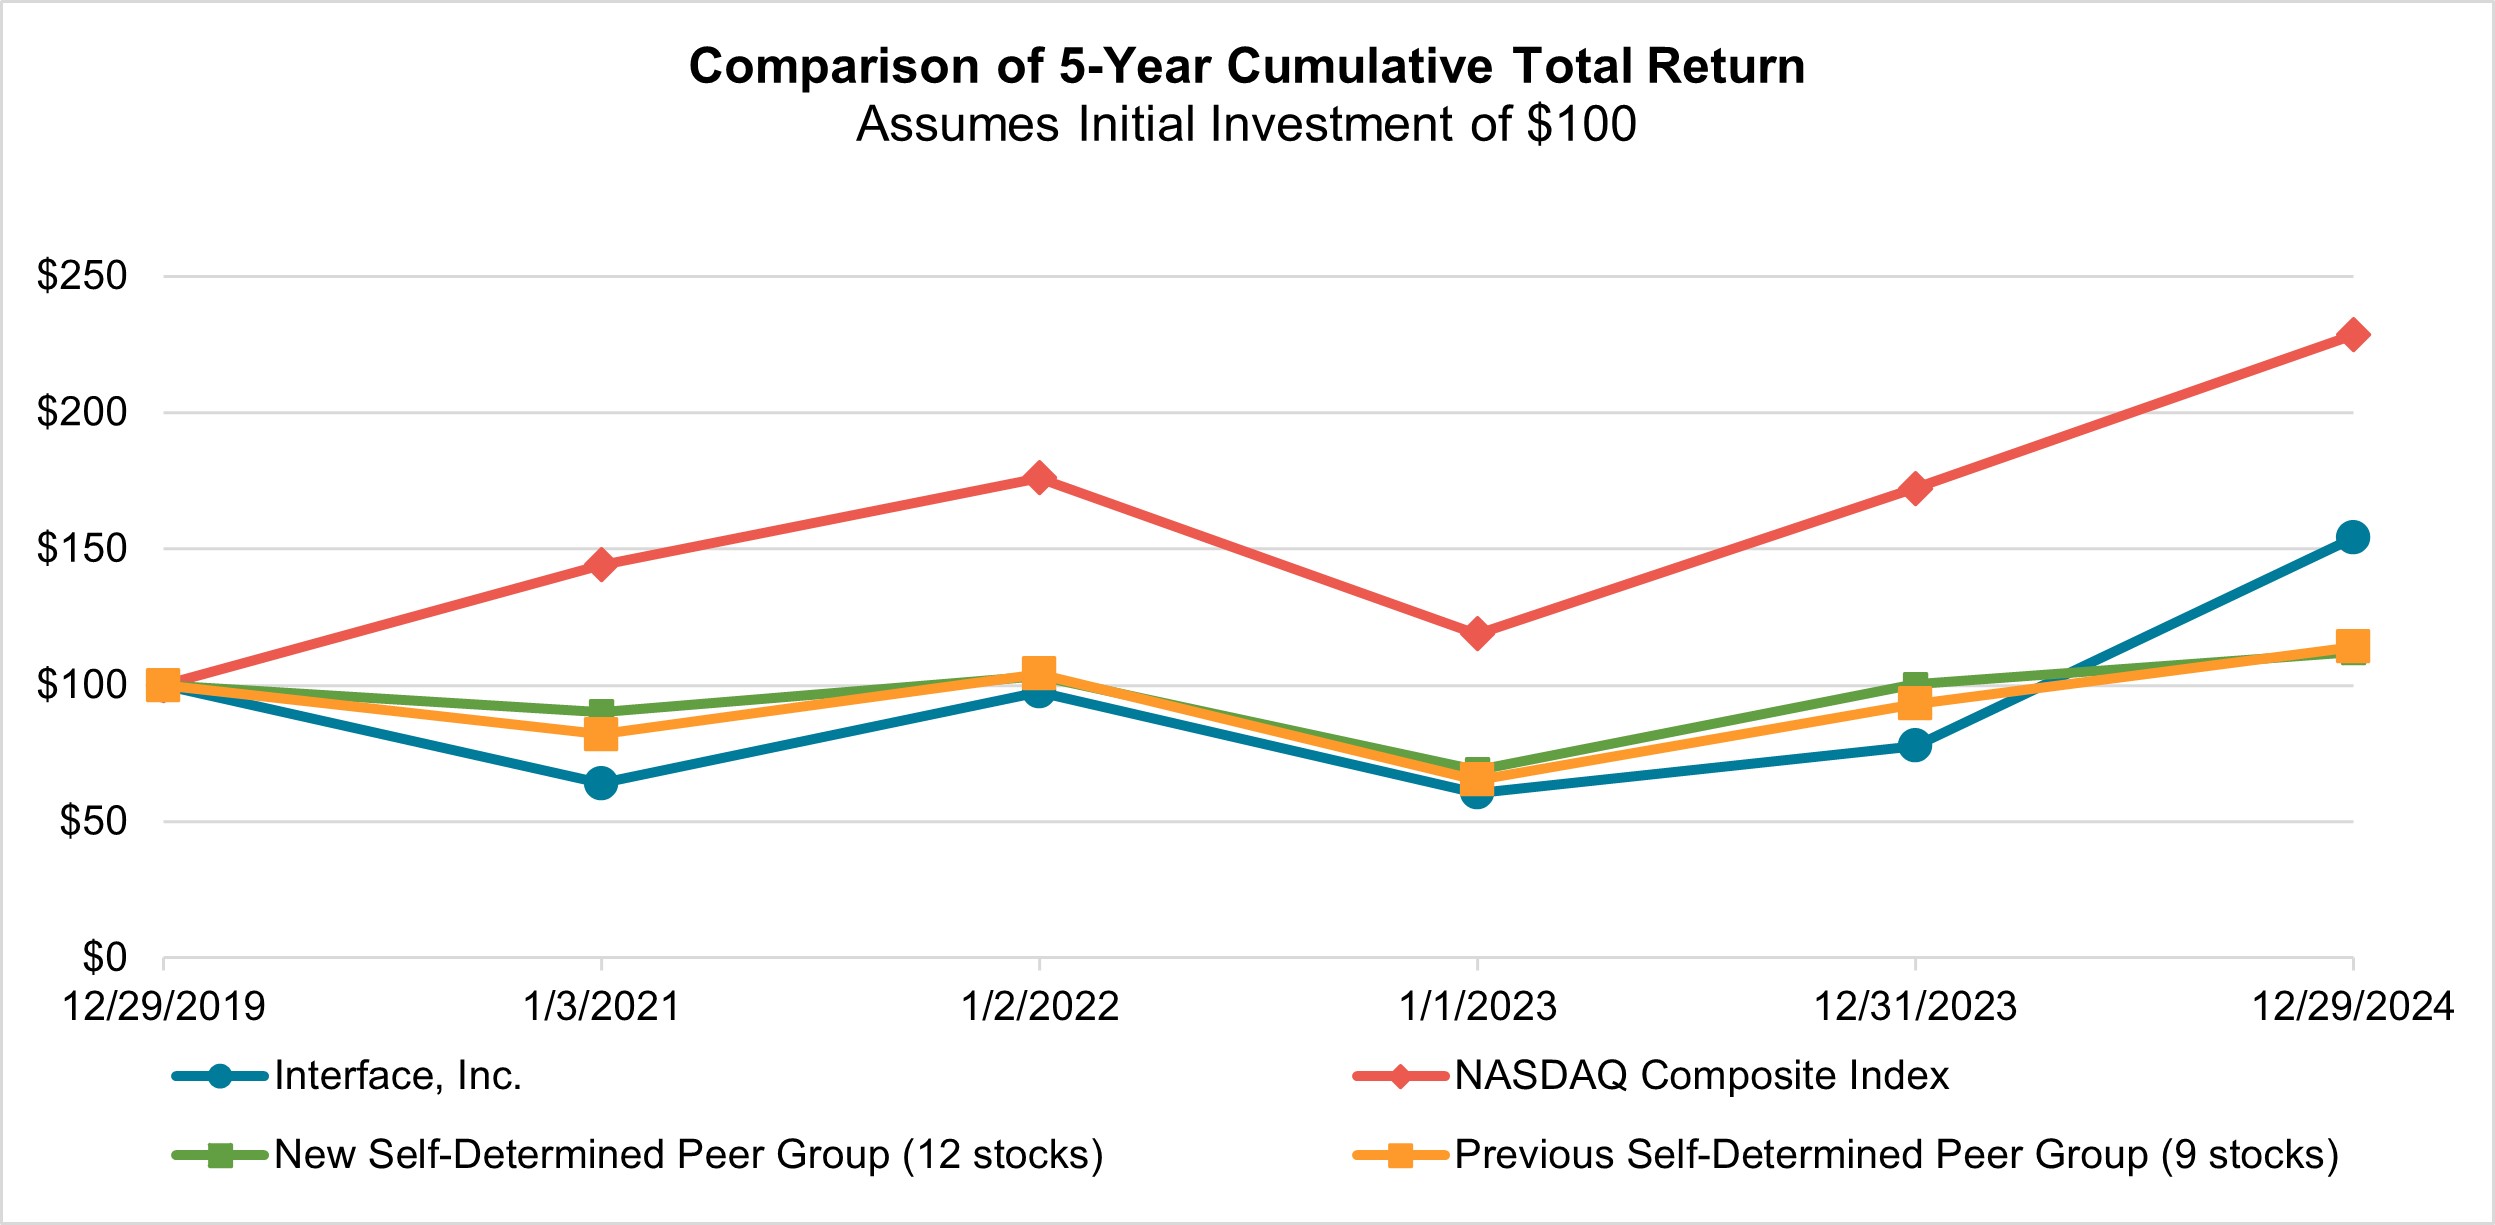
| | | | | | | | | | | | | | | | | | | | | | | | | | | | | | | | | | | |
| | December 29, 2019 | | January 3, 2021 | | January 2, 2022 | | January 1, 2023 | | December 31, 2023 | | December 29, 2024 |
| Interface, Inc. | $100 | | $64 | | $98 | | $61 | | $78 | | $154 |
| NASDAQ Composite Index | $100 | | $144 | | $176 | | $119 | | $172 | | $228 |
| Previous Self-Determined Peer Group (12 Stocks) | $100 | | $82 | | $104 | | $65 | | $93 | | $114 |
| New Self-Determined Peer Group (12 Stocks) | $100 | | $90 | | $103 | | $69 | | $100 | | $112 |
Notes to Performance Graph
(1)If the annual interval, based on the fiscal year-end, is not a trading day, the preceding trading day is used.
(2)The index level was set to $100 as of December 29, 2019 (the last day of fiscal year 2019).
(3)The Company’s fiscal year ends on the Sunday nearest December 31.
(4)The following companies are included in the Previous Self-Determined Peer Group depicted above: ACCO Brands Corporation; Apogee Enterprises, Inc.; Armstrong World Industries, Inc.; Enviri Corporation; HNI Corporation; MillerKnoll, Inc.; Steelcase Inc.; Unifi, Inc.; and VSE Corporation. Glatfelter Corporation, PGT Innovations, Inc., and SP Plus Corporation were acquired in 2024 and no longer trade publicly, and therefore are excluded from the Previous Self-Determined Peer Group.
(5)The following companies are included in the New Self-Determined Peer Group depicted above: ACCO Brands Corporation; American Woodmark Corporation; Apogee Enterprises, Inc.; Armstrong World Industries, Inc.; Enviri Corporation; Gibraltar Industries, Inc.; HNI Corporation; MillerKnoll, Inc.; Quanex Building Products Corporation; Steelcase Inc.; Tredegar Corporation; and VSE Corporation.
Securities Authorized for Issuance Under Equity Compensation Plans
See Item 12 of Part III of this Annual Report on Form 10-K.
Issuer Purchases of Equity Securities
The following table contains information with respect to purchases made by or on behalf of the Company, or any “affiliated purchaser” (as defined in Rule 10b-18(a)(3) under the Securities Exchange Act of 1934), of our common stock during our fourth quarter ended December 29, 2024:
| | | | | | | | | | | | | | | | | | | | | | | | | | |
Period(1) | | Total
Number of
Shares
Purchased | | Average
Price
Paid
Per Share | | Total Number of Shares Purchased as Part of Publicly Announced Plans or Programs(2) | | Approximate Dollar Value of Shares that May Yet Be Purchased Under the Plans or Programs(2) |
| September 30, 2024 – October 27, 2024 | | — | | | $ | — | | | — | | | $ | 82,828,595 | |
| October 28, 2024 – December 1, 2024 | | — | | | — | | | — | | | 82,828,595 | |
| December 2, 2024 – December 29, 2024 | | — | | | — | | | — | | | 82,828,595 | |
| Total | | — | | | $ | — | | | — | | | |
(1) The monthly periods identified above correspond to the Company’s fiscal fourth quarter of 2024, which commenced September 30, 2024 and ended December 29, 2024.
(2) On May 17, 2022, the Company announced a share repurchase program authorizing the repurchase of up to $100 million of common stock. The program has no specific expiration date. There were no shares repurchased pursuant to this program during the Company’s fiscal fourth quarter of 2024.
ITEM 6. [RESERVED]
ITEM 7. MANAGEMENT’S DISCUSSION AND ANALYSIS OF FINANCIAL CONDITION AND RESULTS OF OPERATIONS
Overview
Our revenues are derived from sales of floorcovering products, primarily modular carpet, resilient flooring, including luxury vinyl tile (“LVT”), rubber flooring products, and installation services and accessories. Our business, as well as the commercial interiors industry in general, is cyclical in nature and is impacted by economic conditions and trends that affect the markets for commercial and institutional business space. The commercial interiors industry, including the market for floorcovering products, is largely driven by reinvestment by corporations into their existing businesses in the form of new fixtures and furnishings for their workplaces. In significant part, the timing and amount of such reinvestments are impacted by the profitability of those corporations. As a result, macroeconomic factors such as employment rates, office vacancy rates, work from home policies, capital spending, productivity and efficiency gains that impact corporate profitability in general, also affect our business.
The Company has two operating and reportable segments – namely Americas (“AMS”) and Europe, Africa, Asia and Australia (collectively “EAAA”). The AMS operating segment includes the United States, Canada and Latin America geographic areas. See Note 20 entitled “Segment Information” included in Item 8 of this Annual Report on Form 10-K for additional information. The results of operations discussion below also includes segment information.
We focus our marketing and sales efforts on both corporate office and non-corporate office market segments, to reduce somewhat our exposure to economic cycles that affect the corporate office market segment more adversely, as well as to capture additional market share. More than half of our consolidated net sales were in non-corporate office markets in fiscal years 2024, 2023, and 2022, primarily in education, healthcare, public buildings, retail, residential/living, hospitality, transportation, and consumer residential market segments.
Executive Summary
During 2024, we had consolidated net sales of $1,315.7 million, up 4.3% compared to $1,261.5 million in 2023, primarily due to increased customer demand – particularly in the retail and education market segments. Consolidated operating income for 2024 was $134.4 million compared to consolidated operating income of $104.5 million in 2023, primarily due to higher sales volumes and lower raw material costs. Consolidated net income for 2024 was $86.9 million, or $1.48 per diluted share, compared to consolidated net income of $44.5 million, or $0.76 per diluted share, in 2023.
During 2023, we had consolidated net sales of $1,261.5 million, down 2.8% compared to $1,297.9 million in 2022, primarily due to decreased customer demand – particularly in the retail market segment. Consolidated operating income for 2023 was $104.5 million compared to consolidated operating income of $75.4 million in 2022, primarily due to a non-recurring goodwill and intangible asset impairment charge of $36.2 million recognized in 2022. Consolidated net income for 2023 was $44.5 million, or $0.76 per diluted share, compared to consolidated net income of $19.6 million, or $0.33 per diluted share, in 2022.
A detailed discussion of our 2024 and 2023 consolidated and segment performance appears below under “Analysis of Results of Operations”.
Cybersecurity Event
As previously disclosed in our current report on Form 8-K filed with the Commission on November 23, 2022, we discovered a cybersecurity attack on November 20, 2022, perpetrated by unauthorized third parties, affecting our IT systems. The investigation of the Cyber Event was completed in fiscal year 2023. We have cyber risk insurance and recovered $5.6 million in insurance proceeds during fiscal year 2024, representing business interruption proceeds and reimbursement of certain costs in connection with the Cyber Event. Of the total insurance proceeds received in fiscal 2024, $4.8 million of business interruption proceeds were recognized as a benefit in other income / expense, net in the consolidated statements of operations and $0.8 million was recognized as a reduction of selling, general and administrative expenses. The insurance claim for the Cyber Event has been closed as of December 29, 2024, and we are not expecting additional proceeds.
During 2023, the Company incurred approximately $1.1 million in connection with the investigation of the Cyber Event, which were recorded in selling, general and administrative expenses in the consolidated statements of operations. In 2022, we estimated that the Cyber Event adversely affected our fiscal year 2022 revenues by approximately $8 million in lost sales. We incurred approximately $5 million of costs related to the Cyber Event in 2022 for idle plant costs, direct labor costs during the period our manufacturing facilities were idle and third-party remediation costs. Approximately $4.8 million of the Cyber Event costs in 2022 were included in cost of sales in the consolidated statements of operations and approximately $0.3 million were included in selling, general and administrative expenses.
Impact of Macroeconomic Conditions
Disruptions in economic markets due to inflation, high interest rates, the Russia-Ukraine war and the conflict in the Middle East, a still challenging supply chain environment, slow market conditions in certain parts of the globe, the impact of potential tariffs on the demand for our products, fluctuating freight costs, and significant financial pressures in the commercial office market globally, all pose challenges which may adversely affect our future performance. Management believes it is reasonably likely that these challenges will continue to affect our future operations and demand for our products to some degree during fiscal year 2025. We plan to continue evaluating our cost structure and global manufacturing footprint to identify and activate opportunities to decrease costs and optimize our global cost structure.
The Company expects higher production volumes and lower per unit fixed costs in 2025, and anticipates these impacts will benefit our gross profit margin in 2025. We also expect that continuing challenges in supply chain markets will result in higher freight costs to some degree in 2025 - particularly in the first half of 2025. We anticipate that continuing slow market conditions in parts of the globe and significant financial pressures in the commercial office market globally will adversely impact our future performance and demand for our products.
Analysis of Results of Operations
Consolidated Results
The following discussion and analyses reflect the factors and trends discussed in the preceding sections.
Consolidated net sales denominated in currencies other than the U.S. dollar were approximately 43% in 2024, 46% in 2023, and 47% in 2022. Because we have substantial international operations, we are impacted, from time to time, by international developments that affect foreign currency transactions. In 2024, the weakening of the Euro, Canadian dollar, and Chinese Renminbi against the U.S. dollar had a negative impact on our net sales, partially offset by the strengthening of the British Pound sterling against the U.S. dollar. Currency fluctuations had no material impact to operating income in 2024. In 2023, the strengthening of the Euro against the U.S. dollar had a positive impact on our net sales, partially offset by the weakening of the Australian dollar, Chinese Renminbi, and Canadian dollar. Currency fluctuations had no material impact to operating income in 2023. In 2022, the weakening of the Euro, Australian dollar, British Pound sterling and Chinese Renminbi against the U.S. dollar had a negative impact on our net sales and operating income.
The following table presents the amounts (in U.S. dollars) by which the exchange rates for translating Euros, British Pounds sterling, Australian dollars, Chinese Renminbi, Canadian dollars, and other currencies into U.S. dollars have affected our consolidated net sales and operating income during the past three years:
| | | | | | | | | | | | | | | | | |
| | 2024 | | 2023 | | 2022 |
| | (in millions) |
| Impact of changes in foreign currency on consolidated net sales | $ | (1.8) | | | $ | 1.4 | | | $ | (58.8) | |
| Impact of changes in foreign currency on consolidated operating income | (0.1) | | | (0.6) | | | (8.3) | |
The following table presents, as a percentage of net sales, certain items included in our consolidated statements of operations during the past three years:
| | | | | | | | | | | | | | | | | |
| | Fiscal Year |
| | 2024 | | 2023 | | 2022 |
| Net sales | 100.0 | % | | 100.0 | % | | 100.0 | % |
| Cost of sales | 63.3 | | | 65.0 | | | 66.3 | |
| Gross profit | 36.7 | | | 35.0 | | | 33.7 | |
| Selling, general and administrative expenses | 26.5 | | | 26.9 | | | 25.0 | |
| Restructuring, asset impairment, other (gains) and charges | — | | | (0.2) | | | 0.2 | |
| Goodwill and intangible asset impairment charge | — | | | — | | | 2.8 | |
| Operating income | 10.2 | | | 8.3 | | | 5.7 | |
| Interest/Other expense, net | 1.6 | | | 3.2 | | | 2.6 | |
| Income before income tax expense | 8.6 | | | 5.1 | | | 3.1 | |
| Income tax expense | 2.0 | | | 1.5 | | | 1.7 | |
| Net income | 6.6 | % | | 3.6 | % | | 1.4 | % |
Consolidated Net Sales
Below we provide information regarding our consolidated net sales and analyze those results for each of the last three fiscal years. Fiscal years 2024, 2023, and 2022 each included 52 weeks.
| | | | | | | | | | | | | | | | | | | | | | | | | | | | | |
| | Fiscal Year | | Percentage Change |
| | 2024 | | 2023 | | 2022 | | 2024 compared with 2023 | | 2023 compared with 2022 |
| | (in thousands) | | |
| Consolidated net sales | $ | 1,315,658 | | | $ | 1,261,498 | | | $ | 1,297,919 | | | 4.3 | % | | (2.8) | % |
Consolidated net sales for 2024 compared with 2023
For 2024, our consolidated net sales increased $54.2 million (4.3%) compared to 2023, comprised of higher sales volumes (approximately 2.7%) and higher average sales prices (approximately 1.6%). Fluctuations in currency exchange rates had a negative impact on our year-over-year consolidated net sales comparison of approximately $1.8 million, indicating that if currency levels had remained constant year-over-year, our 2024 net sales would have been higher by this amount. On a market segment basis, the sales increase was most significant in the retail, education, residential living, and public buildings market segments partially offset by decreases in the hospitality, corporate office, and consumer residential market segments. See the segment results discussion below for additional information on market segments.
Consolidated net sales for 2023 compared with 2022
For 2023, our consolidated net sales decreased $36.4 million (2.8%) compared to 2022, comprised of lower sales volumes (approximately 7.9%) partially offset by higher prices (approximately 5.1%). Fluctuations in currency exchange rates had a positive impact on our year-over-year consolidated net sales comparison of approximately $1.4 million, meaning that if currency levels had remained constant year-over-year, our 2023 net sales would have been lower by this amount. On a market segment basis, the sales decrease was most significant in the retail and healthcare market segments partially offset by increases in education and residential living market segments. See the segment results discussion below for additional information on market segments.
Consolidated Cost and Expenses
The following table presents our consolidated cost of sales and selling, general and administrative (“SG&A”) expenses during the past three years:
| | | | | | | | | | | | | | | | | | | | | | | | | | | | | |
| Fiscal Year | | Percentage Change |
| | 2024 | | 2023 | | 2022 | | 2024 compared with 2023 | | 2023 compared with 2022 |
| | (in thousands) | | |
| Consolidated cost of sales | $ | 832,710 | | | $ | 820,429 | | | $ | 860,186 | | | 1.5 | % | | (4.6) | % |
| Consolidated selling, general and administrative expenses | 348,542 | | | 339,049 | | | 324,190 | | | 2.8 | % | | 4.6 | % |
Consolidated Cost of Sales
For 2024, our consolidated cost of sales increased $12.3 million (1.5%) compared to 2023, primarily due to higher sales partially offset by lower raw material costs. Currency translation had a positive impact on consolidated cost of sales and partially reduced our costs by approximately $1.4 million (0.2%) compared to 2023. As a percentage of net sales, our consolidated cost of sales decreased to 63.3% in 2024 versus 65.0% in 2023. Management believes it is reasonably likely that lower per unit fixed costs due to higher production volumes and plant productivity initiatives will reduce our costs to some degree in 2025, particularly in the first half of 2025. These favorable impacts are expected to be partially offset by higher freight costs in 2025.
For 2023, our consolidated cost of sales decreased $39.8 million (4.6%) compared to 2022, primarily due to lower sales and lower freight costs (approximately $19 million) due to stabilizing supply chain conditions. Currency translation had no material impact on consolidated cost of sales compared to 2022. As a percentage of net sales, our consolidated cost of sales decreased to 65.0% in 2023 versus 66.3% in 2022.
Consolidated Gross Profit
For 2024, consolidated gross profit, as a percentage of net sales, was 36.7% compared to 35.0% for 2023. The increase in gross profit percentage was primarily due to (i) lower costs (approximately 1%) driven by lower raw material costs and lower fixed costs per unit as a result of higher volume and (ii) higher pricing (approximately 1%). Management believes it is reasonably likely that gross profit in 2025 will be positively impacted by lower costs as discussed above.
For 2023, consolidated gross profit, as a percentage of net sales, was 35.0% compared to 33.7% for 2022. The increase in gross profit percentage was primarily due to (i) higher pricing (approximately 4%), partially offset by (ii) the unfavorable impact of inflation on raw material costs (approximately 1%), and (iii) unfavorable manufacturing fixed cost absorption and product mix (approximately 2%).
Consolidated SG&A Expenses
For 2024, our consolidated SG&A expenses were $348.5 million versus $339.0 million in 2023. Currency translation had no material impact on consolidated SG&A expenses for 2024. Consolidated SG&A expenses increased $9.5 million (2.8%) in 2024 compared to 2023, primarily due to higher people costs of $15.7 million driven by increased variable compensation as a result of higher operating income compared to 2023, partially offset by lower severance costs of $5.6 million driven by employee headcount reduction and cost saving initiatives in the prior year period. As a percentage of net sales, SG&A expenses decreased to 26.5% in 2024 versus 26.9% in 2023.
For 2023, our consolidated SG&A expenses were $339.0 million versus $324.2 million in 2022. Currency translation had a $1.5 million (0.5%) negative impact on the year-over-year comparison. Consolidated SG&A expenses increased $14.9 million (4.6%) in 2023 compared to 2022, primarily due to (i) $6.5 million of higher selling expenses due to sales and marketing initiatives, (ii) $6.3 million of higher severance costs driven by employee headcount reductions and initiatives to reduce future costs, (iii) $4.4 million of higher professional fees, and (iv) $1.9 million of higher variable compensation costs. These increases were partially offset by lower plant closure costs of approximately $4.1 million related to the closure of our Thailand and Russia operations in 2022. As a percentage of net sales, SG&A expenses increased to 26.9% in 2023 versus 25.0% in 2022.
Restructuring Plan
On September 8, 2021, the Company committed to a restructuring plan that continued to focus on efforts to improve efficiencies and decrease costs across its worldwide operations, involving the closure of the Company’s manufacturing facility in Thailand. During the second quarter of 2023, the Company completed the sale of the Thailand real estate and recognized a gain of $2.7 million. This restructuring plan was completed following the sale of the Thailand facility.
During 2022, in conjunction with the closure of its Thailand facility, the Company recorded a write-down of inventory of $2.5 million within cost of sales in the consolidated statements of operations.
See Note 16 entitled “Restructuring and Other” and Note 7 entitled “Property, Plant and Equipment” of Part II, Item 8 of this Annual Report for additional information.
Goodwill, Intangible Asset and Fixed Asset Impairment
During 2024 and 2023 there was no impairment of our goodwill or indefinite-lived intangible assets. During 2022, we recognized a charge of $36.2 million for the impairment of goodwill and certain intangible assets. See Note 12 entitled “Goodwill and Other Intangible Assets” of Part II, Item 8 of this Annual Report for additional information.
Interest Expense
For 2024, our interest expense was $23.2 million, versus $31.8 million in 2023, primarily due to lower outstanding term loan borrowings under the Syndicated Credit Facility. Our average borrowing rate under the Syndicated Credit Facility as of December 29, 2024, was 5.62% compared to 6.61% at December 31, 2023.
For 2023, our interest expense was $31.8 million, versus $29.9 million in 2022, primarily due to higher interest rates on outstanding term loan borrowings under the Syndicated Credit Facility, partially offset by lower outstanding term loan borrowings under the Facility. Our average borrowing rate under the Syndicated Credit Facility as of December 31, 2023, was 6.61% compared to 5.78% at January 1, 2023.
Other Income Expense, net
During 2024, other (income) expense, net, was $(2.4) million versus $9.1 million in 2023. The decrease was primarily due to the receipt in 2024 of $4.8 million of business interruption insurance proceeds related to the Cyber Event and $2.4 million of insurance proceeds related to a property casualty loss that occurred in fiscal year 2023. These benefits were partially offset by the recognition of $2.2 million of cumulative translation losses reclassified from accumulated other comprehensive loss due to the substantial liquidation of our foreign subsidiary in Thailand during 2024.
During 2023, $6.2 million of cumulative translation losses were recognized in other (income) expense, net as a result of the substantial liquidation of our foreign subsidiaries in Brazil and Russia.
Tax
For fiscal year 2024, the Company recorded income tax expense of $26.6 million on pre-tax income of $113.6 million, resulting in an effective tax rate of 23.4% compared with income tax expense of $19.1 million on pre-tax income of $63.7 million, resulting in an effective tax rate of 30.1%, for fiscal year 2023. The decrease in the effective tax rate for fiscal year 2024, compared to fiscal year 2023, was primarily due to the release of the valuation allowance on interest expense carryforwards, favorable tax benefits related to share-based compensation, and a favorable tax benefit related to a change in tax rate related to the UK pension plan. These favorable changes were partially offset by a decrease in favorable tax benefits related to the repatriation of previously taxed foreign earnings and utilization of foreign tax benefits.
For fiscal year 2023, the Company recorded income tax expense of $19.1 million on pre-tax income of $63.7 million, resulting in an effective tax rate of 30.1%. This compares with income tax expense of $22.4 million on pre-tax income of $41.9 million, resulting in an effective tax rate of 53.3%, for fiscal year 2022. The effective tax rate for fiscal year 2022 was significantly impacted by a non-deductible goodwill impairment charge. Excluding the impact of the non-deductible goodwill impairment charge, the effective tax rate was 31.4% for fiscal year 2022. The decrease in the effective tax rate for fiscal year 2023, as compared to fiscal year 2022, excluding the goodwill impairment, was primarily due to favorable changes related to the cash surrender value of Company-owned life insurance, utilization of foreign tax credits, favorable U.S. tax effects from the repatriation of previously taxed foreign earnings, and non-deductible charges related to the closure of the Company’s manufacturing facility in Thailand in fiscal year 2022. This decrease was partially offset by a favorable change to unrecognized tax benefits in fiscal year 2022.
Segment Results
As discussed above, the Company has two operating and reportable segments – AMS and EAAA. See Note 20 entitled “Segment Information” included in Item 8 of this Annual Report on Form 10-K for additional information.
During fiscal year 2024, the Company implemented a cost center realignment initiative as part of the Company’s efforts to centralize certain global/shared functions. During 2024, SG&A expenses for these global support functions were allocated to adjusted operating income (“AOI”) for each reportable segment consistent with the allocation methodology used to allocate corporate overhead in prior periods. Prior year AOI amounts below were not recast as there was no material impact to the measure of segment profit for each reportable segment. There were no changes to the composition of the Company’s operating or reportable segments.
AMS Segment – Net Sales and Adjusted Operating Income (“AOI”)
The following table presents AMS segment net sales and AOI for the last three fiscal years:
| | | | | | | | | | | | | | | | | | | | | | | | | | | | | |
| Fiscal Year | | Percentage Change |
| 2024 | | 2023 | | 2022 | | 2024 compared with 2023 | | 2023 compared with 2022 |
| (in thousands) | | |
| AMS segment net sales | $ | 800,811 | | | $ | 736,955 | | | $ | 753,740 | | | 8.7 | % | | (2.2) | % |
AMS segment AOI(1) | 106,594 | | | 87,789 | | | 102,370 | | | 21.4 | % | | (14.2) | % |
(1) Includes allocation of corporate SG&A expenses and allocation of global support SG&A expenses as discussed above. Excludes Cyber Event impact, intangible asset impairment charge, and restructuring, asset impairment, severance, and other, net. See Note 20 entitled “Segment Information” included in Item 8 of this Annual Report on Form 10-K for additional information.
AMS Segment Net Sales for 2024 compared with 2023
During 2024, net sales in AMS increased 8.7% versus 2023, comprised of higher sales volume and higher average sales prices. On a market segment basis, the AMS sales increase was most significant in the retail (up 81.5%), education (up 13.5%), public buildings (up 27.9%), and residential living (up 23.3%) market segments partially offset by decreases in the corporate office (down 1.7%), hospitality (down 18.0%), and consumer residential (down 10.4%) market segments.
AMS Segment Net Sales for 2023 compared with 2022
During 2023, net sales in AMS decreased 2.2% versus 2022, comprised of lower sales volume partially offset by higher average sales prices. On a market segment basis, the AMS sales decrease was most significant in the retail (down 50.6%) market segment partially offset by increases in the education (up 7.9%), corporate office (up 4.1%) and residential living (up 15.4%) market segments.
AMS AOI for 2024 compared with 2023
AOI in AMS increased 21.4% during 2024 compared to 2023. Higher adjusted gross profit in 2024, driven by higher sales, lower raw material costs, and favorable fixed cost absorption contributed to the increase in AMS AOI for the current year. AMS SG&A expenses as a percentage of net sales decreased approximately 0.8% compared to 2023, also contributed to the increase in AOI. As a percentage of net sales, AOI increased to 13.3% in 2024 versus 11.9% in 2023.
AMS AOI for 2023 compared with 2022
AOI in AMS decreased 14.2% during 2023 compared to 2022. Lower adjusted gross profit in 2023 driven by unfavorable manufacturing fixed cost absorption and lower sales, partially offset by lower freight costs contributed to the decrease in AMS AOI. AMS SG&A expenses as a percentage of net sales increased approximately 1.1% compared to 2022, primarily due to higher selling expenses also contributed to the decrease in AOI for 2023. As a percentage of net sales, AOI decreased to 11.9% in 2023 versus 13.6% in 2022.
EAAA Segment – Net Sales and AOI
The following table presents EAAA segment net sales and AOI for the last three fiscal years:
| | | | | | | | | | | | | | | | | | | | | | | | | | | | | |
| Fiscal Year | | Percentage Change |
| 2024 | | 2023 | | 2022 | | 2024 compared with 2023 | | 2023 compared with 2022 |
| (in thousands) | | |
| EAAA segment net sales | $ | 514,847 | | | $ | 524,543 | | | $ | 544,179 | | | (1.8) | % | | (3.6) | % |
EAAA segment AOI(1) | 34,803 | | | 28,608 | | | 30,058 | | | 21.7 | % | | (4.8) | % |
(1) Includes allocation of corporate SG&A expenses and allocation of global support SG&A expenses as discussed above. Excludes goodwill and intangible asset impairment charges, purchase accounting amortization, Cyber Event impact, Thailand plant closure inventory write-down, and restructuring, asset impairment, severance, and other, net. See Note 20 entitled “Segment Information” included in Item 8 of this Annual Report on Form 10-K for additional information.
EAAA Segment Net Sales for 2024 compared with 2023
During 2024, net sales in EAAA decreased 1.8% versus 2023, primarily due to lower sales volume. Currency fluctuations had a negative impact of approximately $0.8 million (0.2%) on EAAA net sales for 2024 compared to 2023 due to the weakening of the Euro, Chinese Renminbi, and Australian dollar against the U.S dollar, partially offset by the strengthening of the British Pound sterling against the U.S. dollar. On a market segment basis, the EAAA sales decrease was most significant in the public buildings (down 21%), hospitality (down 24.1%), and healthcare (down 6.8%) market segments, partially offset by an increase in the residential living (up 9.1%) market segment.
EAAA Segment Net Sales for 2023 compared with 2022
During 2023, net sales in EAAA decreased 3.6% versus 2022, comprised of lower sales volume partially offset by higher selling prices. Slower economic recovery and decreased customer demand in Asia resulted in approximately 25% lower net sales in Asia during 2023 compared to 2022. Currency fluctuations had a positive impact of approximately $3.5 million (0.6%) on EAAA net sales for 2023 compared to 2022 due to the strengthening of the Euro, partially offset by the weakening of the Australian dollar and Chinese Renminbi against the U.S. dollar. On a market segment basis, the EAAA sales decrease was most significant in the corporate office (down 3.5%), healthcare (down 23.5%), retail (down 22.8%), and education (down 3.9%) market segments, partially offset by an increase in the hospitality (up 11.5%) market segment.
EAAA AOI for 2024 compared with 2023
AOI in EAAA increased 21.7% during 2024 versus 2023. Higher adjusted gross profit in 2024, driven by lower raw material costs partially offset by lower sales volume contributed to the increase in EAAA AOI for the current year. Currency fluctuations had no material impact on EAAA AOI in 2024 compared to 2023. As a percentage of net sales, AOI was 6.8% in 2024 versus 5.5% in 2023.
EAAA AOI for 2023 compared with 2022
AOI in EAAA decreased 4.8% during 2023 versus 2022. Lower adjusted gross profit in 2023, driven by lower sales, inflationary pressures on raw material costs, and unfavorable manufacturing fixed cost absorption on lower production volumes contributed to the decrease in EAAA AOI. Currency fluctuations had no material impact on EAAA AOI in 2023 compared to 2022. As a percentage of net sales, AOI was 5.5% in both 2023 and 2022.
Financial Condition, Liquidity and Capital Resources
General
In our business, we require cash and other liquid assets primarily to purchase raw materials and to pay other manufacturing costs, in addition to funding normal course SG&A expenses, anticipated capital expenditures, interest expense and potential special projects. We generate our cash and other liquidity requirements primarily from our operations and from borrowings under our Syndicated Credit Facility (the “Facility”) discussed below.
We anticipate that our liquidity, cash flows from operations, cash and cash equivalents, and other sources of liquidity are sufficient to meet our obligations for the next 12 months, and we expect to generate sufficient cash to meet our long-term obligations. However, the Company’s cash flows from operations can be affected by numerous factors including raw material availability and cost, demand for our products, and other factors described in “Risk Factors” included in Part I, Item 1A of this Annual Report on Form 10-K.
Below are estimates of our material cash requirements for future periods. The short-term period represents payments due within the 12 months following December 29, 2024, and the long-term period represents payments due beyond the short-term period.
| | | | | | | | | | | | | | | | | |
| | Payments Due by Period | | |
| | Short-Term | | Long-Term | | Total |
| | | | (in thousands) | | |
| Long-term debt obligations | $ | 482 | | | $ | 305,082 | | | $ | 305,564 | |
| Operating and finance lease obligations | 19,820 | | | 92,314 | | | 112,134 | |
| Expected interest payments | 16,796 | | | 49,952 | | | 66,748 | |
| Purchase obligations | 27,435 | | | 41,147 | | | 68,582 | |
| Pension cash obligations | 4,294 | | | 28,556 | | | 32,850 | |
| Total | $ | 68,827 | | | $ | 517,051 | | | $ | 585,878 | |
Historically, we use more cash in the first half of the fiscal year, as we pay insurance premiums, taxes and incentive compensation and build up inventory in preparation for the holiday/vacation season of our international operations. As outlined in the table above, we have approximately $68.8 million in material contractual cash obligations due within the next year, which includes, among other things, scheduled debt repayments under the Facility, pension contributions, interest payments on our debt, and lease commitments. Our long-term debt obligations include the contractually scheduled principal repayment of our term loan and revolving loan borrowings under the Facility, which matures in 2027, and $300 million on our Senior Notes due in 2028. Operating and finance lease obligations consist of undiscounted lease payments due over the term of the lease. Expected interest payments are those associated with borrowings under the Facility and Senior Notes consistent with our contractually scheduled principal repayments. Our purchase obligations are for non-cancellable agreements primarily for raw material purchases and capital expenditures. Our pension obligations include contributions and expected benefit payments to be paid by the Company related to certain defined benefit pension plans and exclude the expected benefit payments for two of our funded foreign defined benefit plans as these obligations will be paid by the plans.
Based on current interest rates and debt levels, we expect our aggregate interest expense for 2025 to be approximately $20 million. We estimate aggregate capital expenditures in 2025 to be approximately $45 million, although we are not committed to this amount.
Liquidity
At December 29, 2024, we had $99.2 million in cash. Approximately $3.1 million of this cash was located in the U.S., and the remaining $96.1 million was located outside of the U.S. The cash located outside of the U.S. is indefinitely reinvested in the respective jurisdictions (except as identified below). We believe that our strategic plans and business needs, particularly for working capital needs and capital expenditure requirements in Europe, Asia, and Australia, support our assertion that a portion of our cash in foreign locations will be reinvested and remittance will be postponed indefinitely. Of the $96.1 million of cash in foreign jurisdictions, approximately $8.8 million represents earnings which we have determined are not permanently reinvested, and as such we have provided for foreign withholding and U.S. state income taxes on these amounts in accordance with applicable accounting standards.
As of December 29, 2024, we had $5.6 million of borrowings outstanding under our Facility, all of which were term loan borrowings. There were no revolving loan borrowings outstanding as of December 29, 2024. Additionally, $0.7 million in letters of credit were outstanding under the Facility at the end of fiscal year 2024. As of December 29, 2024, we had additional borrowing capacity of $299.3 million under the Facility. As of December 29, 2024, the weighted average interest rate on borrowings outstanding under the Facility was 5.62%. As of December 29, 2024, there were no other lines of credit available to the Company.
In addition, as of December 29, 2024, we had $300.0 million of 5.50% Senior Notes due 2028 (the “Senior Notes”) outstanding, which are discussed further below.
It is important for you to consider that we have a significant amount of indebtedness. Our Facility matures in October of 2027, and the Senior Notes, as discussed below, mature in December 2028. We cannot assure you that we will be able to renegotiate or refinance any of our debt on commercially reasonable terms, or at all. If we are unable to refinance our debt or obtain new financing, we would have to consider other options, such as selling assets to meet our debt service obligations and other liquidity needs, or using cash, if available, that would have been used for other business purposes.
We have borrowings based on variable interest rates (as described below) that expose the Company to the risk that interest rates may increase. For information regarding the current variable interest rates of these borrowings, the potential impact on our interest expense from hypothetical increases in short term interest rates, and the former interest rate swap transaction, please see the discussion in Item 7A of this Report.
We are not a party to any material off-balance sheet arrangements.
Balance Sheet
Accounts receivable, net, were $171.1 million at December 29, 2024, compared to $163.4 million at December 31, 2023. The increase of $7.7 million was primarily due to the impact of higher net sales as a result of increased customer demand in 2024.
Inventories, net, were $260.6 million at December 29, 2024, compared to $279.1 million at December 31, 2023. The decrease of $18.5 million was primarily due to higher sales, stronger working capital management, and lower raw material costs during the current year.
Analysis of Cash Flows
The following table presents a summary of cash flows for fiscal years 2024, 2023 and 2022:
| | | | | | | | | | | | | | | | | |
| | Fiscal Year |
| | 2024 | | 2023 | | 2022 |
| (in thousands) |
| Net cash provided by (used in): | | | | | |
| Operating activities | $ | 148,430 | | | $ | 142,034 | | | $ | 43,061 | |
| Investing activities | (30,374) | | | (19,514) | | | (18,437) | |
| Financing activities | (125,234) | | | (111,564) | | | (19,490) | |
| Effect of exchange rate changes on cash | (4,094) | | | 1,978 | | | (4,822) | |
| Net change in cash and cash equivalents | (11,272) | | | 12,934 | | | 312 | |
| Cash and cash equivalents at beginning of period | 110,498 | | | 97,564 | | | 97,252 | |
| Cash and cash equivalents at end of period | $ | 99,226 | | | $ | 110,498 | | | $ | 97,564 | |
We ended 2024 with $99.2 million in cash, a decrease of $11.3 million during the year. The decrease was primarily due to the following:
•Cash provided by operating activities was $148.4 million for 2024, which represents an increase of $6.4 million compared to 2023. The increase in operating cash flows was primarily due to higher sales during 2024 resulting in a source of cash from lower inventory balances partially offset by a use of cash as a result of higher accounts receivable. The 2023 comparable period includes a source of cash for accounts receivable as delayed customer billings related to the 2022 Cyber Event were collected in 2023.
•Cash used in investing activities was $30.4 million for 2024, which represents an increase of $10.9 million compared to 2023. The increase was primarily attributable to an increase in capital expenditures due to increased capital investment partially offset by $2.4 million of insurance proceeds related to a 2023 property casualty loss. The 2023 comparable period includes proceeds of approximately $6.6 million from the sale of the Company’s Thailand real estate.
•Cash used in financing activities was $125.2 million for 2024, which represents an increase of $13.7 million compared to 2023. The increase was primarily attributable to higher prepayments of term loan borrowings during 2024 compared to the 2023 comparable period.
We ended 2023 with $110.5 million in cash, an increase of $12.9 million during the year. The increase was primarily due to the following:
•Cash provided by operating activities was $142.0 million for 2023, which represents an increase of $99.0 million compared to 2022. The increase in operating cash flows was primarily due to a greater source of cash from working capital in 2023. Specifically, customer collections in 2023 contributed to a decrease in accounts receivable, primarily attributable to delays in customer billings from the Cyber Event, in which due dates for those delayed billings were pushed from the fourth quarter of 2022 to the first quarter of 2023. The 2022 comparable period also included a greater use of cash for working capital attributable to an increase in inventories compared with 2023.
•Cash used in investing activities was $19.5 million for 2023, which represents an increase of $1.1 million compared to 2022. The increase was primarily attributable to an increase in capital expenditures due to increased capital investment, partially offset by the proceeds of approximately $6.6 million from the sale of the Company’s Thailand real estate in 2023.
•Cash used in financing activities was $111.6 million for 2023, which represents an increase of $92.1 million compared to 2022. The year-over-year difference was primarily due to lower revolving loan borrowings combined with higher repayments of term loan borrowings in 2023 as a result of cash generated from operating activities as described above. Fiscal year 2022 also included repurchases of the Company’s common stock that did not occur in 2023, which partially offset the increased use of cash for financing activities in 2023 compared with 2022.
We ended 2022 with $97.6 million in cash, an increase of $0.3 million during the year. The increase was primarily due to the following:
•Cash provided by operating activities was $43.1 million for 2022, which represents a decrease of $43.6 million compared to 2021. The decrease was primarily due to a greater use of cash for working capital during 2022. Specifically, higher inventories as a result of higher raw material costs and input costs contributed to the greater use of cash for working capital in 2022. Higher variable compensation payouts in the first quarter of 2022 (related to 2021 performance) also contributed to the increased use of cash for 2022. Cash provided by operating activities in 2022 also was negatively impacted by delays in billings due to the Cyber Event, which pushed the due dates for those delayed billings from the fourth quarter of 2022 to the first quarter of 2023.
•Cash used in investing activities was $18.4 million for 2022, which represents a decrease of $9.6 million compared to 2021. The decrease was primarily due to reduced capital expenditures.
•Cash used in financing activities was $19.5 million for 2022, which represents a decrease of $41.4 million compared to 2021. The year-over-year difference was primarily due to higher revolving loan borrowings in 2022 as a source of cash to fund operating activities as described above, offset by a use of cash for repurchases of the Company’s common stock pursuant to a new share repurchase program adopted in the second quarter of 2022. Fiscal year 2021 also included higher repayments of approximately $60 million of term loan borrowings which contributed to a greater use of cash in that period.
Share Repurchases
In the second quarter of 2022, the Company adopted a new share repurchase program in which the Company is authorized to repurchase up to $100 million of its outstanding shares of common stock. The program has no specific expiration date. No shares of common stock were repurchased during 2024 and 2023 pursuant to this program. As of December 29, 2024, approximately $82.8 million remains authorized pursuant to this program for future share repurchases. The program does not require the Company to repurchase a specific number or amount of shares, or to do so within any specific time periods.
Syndicated Credit Facility
In the normal course of business, in addition to using our available cash, we fund our operations by borrowing under our Facility. At December 29, 2024, the Facility provided the Company and certain of its subsidiaries with a multicurrency revolving loan facility up to $300 million, as well as other U.S. denominated and multicurrency term loans. On October 14, 2022, in connection with the fifth amendment to the Facility, the maturity date was extended to October 2027. Material terms under the Facility are discussed below. For additional information please see Note 9 entitled “Long-Term Debt” in Item 8 of this Report.
Interest Rates and Fees
Under the Facility, interest on base rate loans is charged at varying rates computed by applying a margin ranging from 0.25% to 2.00%, depending on the Company’s consolidated net leverage ratio (as defined in the Facility agreement) as of the most recently completed fiscal quarter. Interest on SOFR-based and alternative currency loans are charged at varying rates computed by applying a margin ranging from 1.25% to 3.00% over the applicable SOFR rate or alternative currency rate, depending on the Company’s consolidated net leverage ratio as of the most recently completed fiscal quarter. In addition, the Company pays a commitment fee ranging from 0.20% to 0.40% per annum (depending on the Company’s consolidated net leverage ratio as of the most recently completed fiscal quarter) on the unused portion of the Facility.
Fees for commercial letters of credit are computed as 1.00% per annum of the amount available to be drawn under such letters of credit. Fees for standby letters of credit are charged at varying rates computed by applying a margin ranging from 1.25% to 3.00% per annum of the amount available to be drawn under such standby letters of credit, depending on the Company’s consolidated net leverage ratio as of the most recently completed fiscal quarter.
Covenants
The Facility contains standard and customary covenants for agreements of this type, including various reporting, affirmative and negative covenants. Among other things, these covenants limit our ability to:
•create or incur liens on assets;
•make acquisitions of or investments in businesses (in excess of certain specified amounts);
•engage in any material line of business substantially different from the Company’s current lines of business;
•incur indebtedness or contingent obligations;
•sell or dispose of assets (in excess of certain specified amounts);
•pay dividends or repurchase our stock (in excess of certain specified amounts);
•repay other indebtedness prior to maturity unless we meet certain conditions; and
•enter into sale and leaseback transactions.
The Facility also requires us to remain in compliance with the following financial covenants as of the end of each fiscal quarter, based on our consolidated results for the year then ended:
•Consolidated Secured Net Leverage Ratio: Must be no greater than 3.00:1.00.
•Consolidated Interest Coverage Ratio: Must be no less than 2.25:1.00.
Events of Default
If we breach or fail to perform any of the affirmative or negative covenants under the Facility, or if other specified events occur (such as a bankruptcy or similar event or a change of control of Interface, Inc. or certain subsidiaries, or if we breach or fail to perform any covenant or agreement contained in any instrument relating to any of our other indebtedness exceeding $20 million), after giving effect to any applicable notice and right to cure provisions, an event of default will exist. If an event of default exists and is continuing, the lenders’ Administrative Agent may, and upon the written request of a specified percentage of the lender group shall:
•declare all commitments of the lenders under the facility terminated;
•declare all amounts outstanding or accrued thereunder immediately due and payable; and
•exercise other rights and remedies available to them under the agreement and applicable law.
Collateral
Pursuant to a Second Amended and Restated Security and Pledge Agreement, the Facility is secured by substantially all of the assets of Interface, Inc. and our domestic subsidiaries (subject to exceptions for certain immaterial subsidiaries), including all of the stock of our domestic subsidiaries and up to 65% of the stock of certain material foreign subsidiaries. If an event of default occurs under the Facility, the lenders’ Administrative Agent may, upon the request of a specified percentage of lenders, exercise remedies with respect to the collateral, including, in some instances, foreclosing mortgages on real estate assets, taking possession of or selling personal property assets, collecting accounts receivable, or exercising proxies to take control of the pledged stock of domestic and certain material foreign subsidiaries.
Under the Facility, we are required to make quarterly amortization payments of the term loan borrowings. The amortization payments are due on the last day of the calendar quarter. We are in compliance with all covenants under the Facility and anticipate that we will remain in compliance with the covenants for the foreseeable future.
Senior Notes
As of December 29, 2024, the Company had $300 million of Senior Notes outstanding. The Senior Notes bear an interest rate at 5.50% per annum and mature on December 1, 2028. Interest is paid semi-annually on June 1 and December 1 of each year. Debt issuance costs associated with the Senior Notes are recorded as a reduction of long-term debt in the consolidated balance sheets and are amortized over the life of the outstanding debt.
The Senior Notes are unsecured and are guaranteed, jointly and severally, by each of the Company’s material domestic subsidiaries, all of which also guarantee the obligations of the Company under its Facility. The Company’s foreign subsidiaries and certain non-material domestic subsidiaries are considered non-guarantors. Net sales for the non-guarantor subsidiaries were approximately $573 million for fiscal year 2024, $584 million for fiscal year 2023, and $597 million for fiscal year 2022. Total indebtedness of the non-guarantor subsidiaries was approximately $102 million and $133 million as of December 29, 2024, and December 31, 2023, respectively. The Senior Notes can be redeemed on or after December 1, 2023, at specified redemption prices. See Note 9 entitled “Long-Term Debt” in Item 8 of this Report for additional information.
Critical Accounting Policies and Estimates
The policies and estimates discussed below are considered by management to be critical to an understanding of our consolidated financial statements because their application places the most significant demands on management’s judgment, with financial reporting results relying on estimations about the effects of matters that are inherently uncertain. Specific risks for these critical accounting policies are described in the following paragraphs. For all of these policies, management cautions that future events may not develop as forecasted, and the best estimates routinely require adjustment.
Impairment of Long-Lived Assets. Long-lived assets are reviewed for impairment at the asset group level whenever events or changes in circumstances indicate that the carrying value may not be recoverable. If the sum of the expected future undiscounted cash flows is less than the carrying amount of the asset, an impairment is indicated. A loss is then recognized for the difference, if any, between the fair value of the asset (as estimated by management using its best judgment) and the carrying value of the asset. Management’s judgment in estimating the undiscounted cash flows based on market conditions and trends, and other industry specific metrics used in determining the fair value is subject to uncertainty. If actual market value is less favorable than that estimated by management, additional write-downs may be required.
Deferred Income Tax Assets and Liabilities. The carrying values of deferred income tax assets and liabilities reflect the application of our income tax accounting policies in accordance with applicable accounting standards and are based on management’s assumptions and estimates regarding future operating results and levels of taxable income, as well as management’s judgment regarding the interpretation of the provisions of applicable accounting standards. The carrying values of liabilities for income taxes currently payable are based on management’s interpretations of applicable tax laws and incorporate management’s assumptions and judgments regarding the use of tax planning strategies in various taxing jurisdictions. The use of different estimates, assumptions and judgments in connection with accounting for income taxes may result in materially different carrying values of income tax assets and liabilities and results of operations.
We evaluate the recoverability of these deferred tax assets by assessing the adequacy of future expected taxable income from all sources, including reversal of taxable temporary differences, forecasted operating earnings and available tax planning strategies. These sources of income inherently rely heavily on estimates. We use our historical experience and our short-term and long-term business forecasts to provide insight. Further, our global business portfolio gives us the opportunity to employ various prudent and feasible tax planning strategies to facilitate the recoverability of future deductions. To the extent we do not consider it more likely than not that a deferred tax asset will be recovered, a valuation allowance is established. As of December 29, 2024, and December 31, 2023, we had state net operating loss carryforwards of $190.1 million and $192.1 million, respectively. Certain of these state net operating loss carryforwards are reserved with a valuation allowance because, based on the available evidence, we believe it is more likely than not that we would not be able to utilize those deferred tax assets in the future. The remaining year-end 2024 amounts are expected to be fully recoverable within the applicable statutory expiration periods. If the actual amounts of taxable income differ from our estimates, the amount of our valuation allowance could be materially impacted.
Goodwill. We review the carrying values of our goodwill annually at the beginning of the fourth quarter of each fiscal year, or more often if events or changes in circumstances indicate that the carrying value of a reporting unit may exceed its fair value as set forth in Accounting Standards Codification 350 “Intangibles—Goodwill and Other”, as amended by Accounting Standards Update (“ASU”) 2017-04. We test goodwill at the reporting unit level, which is an operating segment or one level below an operating segment. We utilize the present value of expected future cash flows and the guideline public company method to determine the estimated fair value of our reporting units. The present value model requires management to estimate future cash flows, the timing of these cash flows, and a discount rate based on a weighted average cost of capital.
The assumptions we use to estimate future cash flows and the development of any forecasts to be used in the fair value determination are subject to inherent risk and judgment. If we determine that the estimated fair value of the reporting unit exceeds its carrying value, goodwill of the reporting unit is not impaired. If we determine that the carrying value of the reporting unit exceeds its estimated fair value, we measure the goodwill impairment charge based on the excess of the reporting unit’s carrying value over its fair value consistent with ASU 2017-04, “Simplifying the Test for Goodwill Impairment”.
During the fourth quarter of 2024 and 2023, we performed our annual quantitative goodwill impairment testing. We focused our testing on the Americas reporting unit because it is the only reporting unit with an allocated goodwill balance. The allocated goodwill balances for our EMEA and Asia-Pacific reporting units were written off in prior years as a result of goodwill impairment charges. The Company performed limited procedures for our EMEA and Asia-Pacific reporting units during the 2024 and 2023 goodwill testing to facilitate a reconciliation of market capitalization.
The annual quantitative goodwill testing performed in 2024 and 2023 for our Americas reporting unit was consistent with our prior year methodology. The Company prepared valuations for the Americas reporting unit on both a market comparable methodology and an income methodology, utilizing a combination of the present value of expected future cash flows and the guideline public company method to determine the estimated fair value of the reporting unit. In preparing the valuation, past, present and future expectations of performance were considered, including our expectations for the short-term and long-term impacts of macroeconomic conditions, and our expected financial performance, including planned revenue and operating income for the Americas reporting unit. The present value model requires management to estimate future cash flows, the timing of these cash flows, and a discount rate based on a weighted average cost of capital. The discount rate used for the Americas reporting unit was 10.5% in 2024 compared to 11.5% in 2023, which fluctuated based on a lower risk premium assigned to estimates of expected future performance. There is inherent uncertainty associated with key assumptions and estimates used in our impairment testing, including the impact of macroeconomic conditions.
As a result of our 2024 annual goodwill testing, we determined that the fair value of our Americas reporting unit exceeded its carrying value by 132% at the 2024 measurement date, and therefore no impairment was indicated. The goodwill balance of $99.9 million at December 29, 2024, is allocated entirely to our Americas reporting unit.
As a result of our 2023 annual goodwill testing, we determined that the fair value of our Americas reporting unit exceeded its carrying value by 71% at the 2023 measurement date, and therefore no impairment was indicated. The goodwill balance of $105.4 million at December 31, 2023, was allocated entirely to our Americas reporting unit.
During the fourth quarter of 2022, we performed our annual goodwill quantitative testing for each reporting unit. We considered factors such as, but not limited to, our expectations for the short-term and long-term impacts of macroeconomic factors, including ongoing inflation, foreign currency exchange rates, and our expected financial performance, including planned revenue and operating income of each reporting unit. The discount rate used for each reporting unit ranged from 13.5% to 14.0%, which primarily fluctuated based on a country risk premium assigned to the geographical region of the reporting unit.
For fiscal year 2022, we determined that the carrying value of our EMEA reporting unit exceeded its fair value and that the associated goodwill was impaired. We recorded a goodwill impairment charge of $29.4 million to write off all the goodwill allocated to our EMEA reporting unit.
As of the 2022 measurement date, the fair value of our Americas reporting unit exceeded its carrying value by 71%, and the Americas reporting unit was not impaired. The Americas reporting unit had a goodwill balance of $102.4 million at the end of fiscal 2022. The goodwill balance allocated to our Asia-Pacific reporting unit was previously written off in connection with the 2020 goodwill impairment.
We have not made any material changes to our goodwill impairment loss assessment methodology during the past three fiscal years. Currently, we do not believe there is a reasonable likelihood that there will be a material change in future assumptions or estimates we use to calculate impairment losses. However, we cannot predict or control market factors, including the impact of macroeconomic conditions and the impact of certain risks inherent to our operations, as described in Item 1A “Risk Factors” of this Annual Report. If actual results are not consistent with our assumptions and estimates, we may be exposed to additional goodwill impairment losses that could be material.
See Note 12 entitled “Goodwill and Other Intangible Assets” of Part II, Item 8 of this Annual Report for additional information.
Inventories. We determine the value of inventories using the lower of cost or net realizable value. We write down inventories for the difference between the carrying value of the inventories and their net realizable value. If actual market conditions are less favorable than those projected by management, additional write-downs may be required.
Management’s judgment in estimating our reserves for inventory obsolescence is based on continuous examination of our inventories to determine if there are indicators that carrying values exceed net realizable values. Experience has shown that significant indicators that could require the need for additional inventory write-downs are the age of the inventory, the length of its product life cycles, anticipated demand for our products and current economic conditions.
While we believe that adequate write-downs for inventory obsolescence have been made in the consolidated financial statements, consumer tastes and preferences may continue to change, and we could experience additional inventory write-downs in the future. Our inventory reserve on December 29, 2024 and December 31, 2023, was $38.3 million and $34.0 million, respectively. To the extent that actual obsolescence of our inventory differs from our estimate by 10%, our 2024 net income would be higher or lower by approximately $2.9 million, on an after-tax basis.
Pension Benefits. Net pension expense recorded is based on, among other things, assumptions about the discount rate, estimated return on plan assets and salary increases. While management believes these assumptions are reasonable, changes in these and other factors and differences between actual and assumed changes in the present value of liabilities or assets of our plans above certain thresholds could cause net annual expense to increase or decrease materially from year to year. The actuarial assumptions used in our salary continuation plan and our foreign defined benefit plans reporting are reviewed periodically and compared with external benchmarks to ensure that they appropriately account for our future pension benefit obligation. The expected long-term rate of return on plan assets assumption is based on weighted average expected returns for each asset class. Expected returns reflect a combination of historical performance analysis and the forward-looking views of the financial markets, and include input from actuaries, investment service firms and investment managers. The table below represents the changes to the projected benefit obligation as a result of changes in discount rate assumptions:
| | | | | |
| Foreign Defined Benefit Plans | Increase (Decrease) in
Projected Benefit Obligation |
| | (in millions) |
| 1% increase in actuarial assumption for discount rate | $ | (19.7) | |
| 1% decrease in actuarial assumption for discount rate | 25.3 | |
| | | | | |
| Domestic Salary Continuation Plan | Increase (Decrease) in
Projected Benefit Obligation |
| | (in millions) |
| 1% increase in actuarial assumption for discount rate | $ | (1.6) | |
| 1% decrease in actuarial assumption for discount rate | 1.9 | |
Allowances for Expected Credit Losses. We maintain allowances for expected credit losses resulting from the inability of customers to make required payments. Estimating the amount of future expected losses requires us to consider historical losses from our customers, as well as current market conditions and future forecasts of our customers’ ability to make payments for goods and services. By its nature, such an estimate is highly subjective, and it is possible that the amount of accounts receivable that we are unable to collect may be different than the amount initially estimated. Our allowance for expected credit losses on December 29, 2024 and December 31, 2023, was $3.8 million and $3.0 million, respectively. To the extent the actual collectability of our accounts receivable differs from our estimates by 10%, our 2024 net income would be higher or lower by approximately $0.3 million, on an after-tax basis, depending on whether the actual collectability was better or worse, respectively, than the estimated allowance.
Product Warranties. We typically provide limited warranties with respect to certain attributes of our carpet products (for example, warranties regarding excessive surface wear, edge ravel and static electricity) for periods ranging from ten to twenty years, depending on the particular carpet product and the environment in which the product is to be installed. Similar limited warranties are provided on certain attributes of our rubber and LVT products, typically for a period of 5 to 15 years. We typically warrant that any services performed will be free from defects in workmanship for a period of one year following completion. In the event of a breach of warranty, the remedy typically is limited to repair of the problem or replacement of the affected product. We record a provision related to warranty costs based on historical experience and future expectations and periodically adjust these provisions to reflect changes in actual experience. Our warranty and sales allowance reserve on December 29, 2024 and December 31, 2023, was $5.3 million and $4.3 million, respectively. Actual warranty expense incurred could vary significantly from amounts that we estimate. To the extent the actual warranty expense differs from our estimates by 10%, our 2024 net income would be higher or lower by approximately $0.4 million, on an after-tax basis, depending on whether the actual expense is lower or higher, respectively, than the estimated provision.
Recent Accounting Pronouncements
Please see Note 2 entitled “Recent Accounting Pronouncements” in Item 8 of this Report for discussion of these items.
ITEM 7A. QUANTITATIVE AND QUALITATIVE DISCLOSURES ABOUT MARKET RISK
Market Risk
As a result of the scope of our global operations, we are exposed to an element of market risk from changes in interest rates and foreign currency exchange rates. Our results of operations and financial condition could be impacted by this risk. We manage our exposure to market risk through our regular operating and financial activities and, to the extent we deem appropriate, through the use of derivative financial instruments.
From time to time, we employ derivative financial instruments as risk management tools and not for speculative or trading purposes. We monitor the use of derivative financial instruments through objective measurable systems, well-defined market and credit risk limits, and timely reports to senior management according to prescribed guidelines. We have established strict counter-party credit guidelines and enter into transactions only with financial institutions with a rating of investment grade or better. As a result, we consider the risk of counter-party default to be minimal. There were no active derivative instruments as of December 29, 2024.
Interest Rate Market Risk Exposure
Changes in interest rates affect the interest paid on our variable rate debt. To mitigate the impact of fluctuations in interest rates, our management monitors interest rates and has developed and implemented a policy to maintain the percentage of fixed and variable rate debt within certain parameters, subject to approval by our Board of Directors. In addition, from time to time, we may enter into derivative transactions, such as interest rate swaps, in order to manage exposure to interest rate fluctuations. There were no active interest rate derivative instruments as of December 29, 2024.
Foreign Currency Exchange Market Risk Exposure
A significant portion of our operations consists of manufacturing and sales activities in foreign jurisdictions. We manufacture our products in the United States, Northern Ireland, the Netherlands, Germany, China, and Australia, and we sell our products in more than 100 countries. As a result, our financial results have been, and could be, significantly affected by factors such as changes in foreign currency exchange rates or weak economic conditions in the foreign markets in which we distribute our products. Our operating results are exposed to changes in exchange rates between the U.S. dollar and many other currencies, including the Euro, British Pound sterling, Canadian dollar, Australian dollar and Chinese Renminbi. When the U.S. dollar strengthens against a foreign currency, the value of anticipated sales in those currencies decreases, and vice versa. Additionally, to the extent our foreign operations with functional currencies other than the U.S. dollar transact business in countries other than the United States, exchange rate changes between two foreign currencies could ultimately impact us. Finally, because we report in U.S. dollars on a consolidated basis, foreign currency exchange fluctuations could have a translation impact on our financial position. To mitigate the impact of fluctuations in foreign currency exchange rates, we may enter into derivative transactions from time to time, such as forward contracts and foreign currency options. There were no active foreign currency derivative instruments as of December 29, 2024.
During 2024, we recognized a $23.7 million increase in our accumulated other comprehensive loss – foreign currency translation adjustment account compared with fiscal year 2023, primarily due to the weakening of the Euro, Chinese Renminbi, and Australian dollar against the U.S dollar, partially offset by the strengthening of the British Pound sterling against the U.S. dollar.
Sensitivity Analysis
For purposes of specific risk analysis, we use sensitivity analysis to measure the impact that market risk may have on the fair values of our market-sensitive instruments.
To perform sensitivity analysis, we assess the risk of loss in fair values associated with the impact of hypothetical changes in interest rates and foreign currency exchange rates on market-sensitive instruments. The market value of instruments affected by interest rate and foreign currency exchange rate risk is computed based on the present value of future cash flows as impacted by the changes in the rates attributable to the market risk being measured. The discount rates used for the present value computations were selected based on market interest and foreign currency exchange rates in effect at December 29, 2024. The values that result from these computations are then compared with the market values of the financial instruments. The differences are the hypothetical gains or losses associated with each type of risk.
Interest Rate Risk
As discussed above, our Facility is comprised of a combination of term loan and revolving loan borrowings. The following table summarizes our market risks associated with our variable rate debt obligations under the Facility and fixed rate Senior Notes debt as of December 29, 2024. For debt obligations, the table presents principal cash flows by year of maturity.
| | | | | | | | | | | | | | | | | | | | | | | | | | | | | | | | | | | |
| Rate-Sensitive Liabilities | 2025 | | 2026 | | 2027 | | 2028 | | Total | | Fair Value |
| | (in thousands) |
| Long-term Debt: | | | | | | | | | | | |
| Variable Rate | $ | 482 | | | $ | 482 | | | $ | 4,600 | | | $ | — | | | $ | 5,564 | | | $ | 5,564 | |
| Fixed Rate | — | | | — | | | — | | | 300,000 | | | 300,000 | | | 294,738 | |
Our weighted average interest rate for our outstanding borrowings under the Facility as of December 29, 2024 and December 31, 2023 was 5.62% and 6.61%, respectively.
An increase in our effective interest rate of 1% on our variable rate debt would increase annual interest expense by approximately $0.1 million. We will continue to review our exposure to interest rate fluctuations and evaluate whether we should manage such exposures through any future interest rate swap transactions. The carrying value of the Company’s borrowings under our Facility approximates fair value as the Facility bears variable interest rates that are similar to existing market rates. Based on a hypothetical immediate 100 basis point increase in interest rates, with all other variables held constant, the fair value of our fixed rate long-term debt would be impacted by a net decrease of $10.0 million. Conversely, a 100-basis point decrease in interest rates would result in a net increase in the fair value of our fixed rate long-term debt of $6.6 million.
Foreign Currency Exchange Rate Risk
As of December 29, 2024, a 10% decrease or increase in the levels of foreign currency exchange rates against the U.S. dollar, with all other variables held constant, would result in a respective decrease or increase in the fair value of our financial instruments of $12.6 million. As the impact of offsetting changes in the fair market value of our net foreign investments is not included in the sensitivity model, these results are not indicative of our actual exposure to foreign currency exchange risk.
ITEM 8. FINANCIAL STATEMENTS AND SUPPLEMENTARY DATA
INTERFACE, INC. AND SUBSIDIARIES
CONSOLIDATED STATEMENTS OF OPERATIONS
(in thousands, except per share data)
| | | | | | | | | | | | | | | | | |
| | FISCAL YEAR |
| | 2024 | | 2023 | | 2022 |
| Net sales | $ | 1,315,658 | | | $ | 1,261,498 | | | $ | 1,297,919 | |
| Cost of sales | 832,710 | | | 820,429 | | | 860,186 | |
| Gross profit | 482,948 | | | 441,069 | | | 437,733 | |
| | | | | | |
| Selling, general and administrative expenses | 348,542 | | | 339,049 | | | 324,190 | |
| Restructuring, asset impairment, other (gains) and charges | — | | | (2,502) | | | 1,965 | |
| Goodwill and intangible asset impairment charge | — | | | — | | | 36,180 | |
| | | | | | |
| Operating income | 134,406 | | | 104,522 | | | 75,398 | |
| | | | | | |
| Interest expense | 23,205 | | | 31,787 | | | 29,929 | |
| Other (income) expense, net | (2,353) | | | 9,081 | | | 3,552 | |
| | | | | | |
| Income before income tax expense | 113,554 | | | 63,654 | | | 41,917 | |
| Income tax expense | 26,608 | | | 19,137 | | | 22,357 | |
| | | | | | |
| Net income | $ | 86,946 | | | $ | 44,517 | | | $ | 19,560 | |
| | | | | | |
| Earnings per share – basic | $ | 1.49 | | | $ | 0.77 | | | $ | 0.33 | |
| Earnings per share – diluted | $ | 1.48 | | | $ | 0.76 | | | $ | 0.33 | |
| | | | | | |
| Common shares outstanding – basic | 58,282 | | | 58,092 | | | 58,865 | |
| Common shares outstanding – diluted | 58,871 | | | 58,335 | | | 58,865 | |
See accompanying notes to consolidated financial statements.
INTERFACE, INC. AND SUBSIDIARIES
CONSOLIDATED STATEMENTS OF COMPREHENSIVE INCOME
(in thousands)
| | | | | | | | | | | | | | | | | |
| | FISCAL YEAR |
| | 2024 | | 2023 | | 2022 |
| Net income | $ | 86,946 | | | $ | 44,517 | | | $ | 19,560 | |
| Other comprehensive (loss) income, after tax: | | | | | |
| Foreign currency translation adjustment | (23,727) | | | 19,185 | | | (38,334) | |
| Reclassification from accumulated other comprehensive loss – discontinued cash flow hedge | — | | | 749 | | | 1,973 | |
| Pension liability adjustment | (5,818) | | | (6,468) | | | 26,340 | |
| Other comprehensive (loss) income | (29,545) | | | 13,466 | | | (10,021) | |
| | | | | |
| Comprehensive income | $ | 57,401 | | | $ | 57,983 | | | $ | 9,539 | |
See accompanying notes to consolidated financial statements.
INTERFACE, INC. AND SUBSIDIARIES
CONSOLIDATED BALANCE SHEETS
(in thousands, except par values)
| | | | | | | | | | | |
| | END OF FISCAL YEAR |
| | 2024 | | 2023 |
| ASSETS | | | |
| Current assets | | | |
| Cash and cash equivalents | $ | 99,226 | | | $ | 110,498 | |
| Accounts receivable, net | 171,135 | | | 163,386 | |
| Inventories, net | 260,581 | | | 279,079 | |
| Prepaid expenses and other current assets | 33,355 | | | 30,895 | |
| Total current assets | 564,297 | | | 583,858 | |
| Property, plant and equipment, net | 282,374 | | | 291,140 | |
| Operating lease right-of-use assets | 76,815 | | | 87,519 | |
| Deferred tax asset | 24,624 | | | 21,721 | |
| Goodwill | 99,887 | | | 105,448 | |
| Intangible assets, net | 48,273 | | | 56,255 | |
| Other assets | 74,546 | | | 84,154 | |
| | | | |
| Total assets | $ | 1,170,816 | | | $ | 1,230,095 | |
| | | | |
| LIABILITIES AND SHAREHOLDERS’ EQUITY | | | |
| Current liabilities | | | |
| Accounts payable | $ | 68,943 | | | $ | 62,912 | |
| Accrued expenses | 134,996 | | | 130,890 | |
| Current portion of operating lease liabilities | 12,296 | | | 12,347 | |
| Current portion of long-term debt | 482 | | | 8,572 | |
| Total current liabilities | 216,717 | | | 214,721 | |
| Long-term debt | 302,275 | | | 408,641 | |
| Operating lease liabilities | 68,092 | | | 78,269 | |
| Deferred income taxes | 31,822 | | | 33,832 | |
| Other long-term liabilities | 62,762 | | | 68,685 | |
| | | | |
| Total liabilities | 681,668 | | | 804,148 | |
| | | | |
| Commitments and contingencies (Note 18) | | | |
| | | | |
| Shareholders’ equity | | | |
| Preferred stock, par value $1.00 per share; 5,000 shares authorized; none issued or outstanding at December 29, 2024 and December 31, 2023 | — | | | — | |
| Common stock, par value $0.10 per share; 120,000 shares authorized; 58,304 and 58,112 shares issued and outstanding at December 29, 2024 and December 31, 2023, respectively | 5,830 | | | 5,811 | |
| Additional paid-in capital | 261,028 | | | 252,909 | |
| Retained earnings | 405,441 | | | 320,833 | |
| Accumulated other comprehensive loss – foreign currency translation | (143,317) | | | (119,590) | |
| Accumulated other comprehensive loss – pension liability | (39,834) | | | (34,016) | |
| | | | |
| Total shareholders’ equity | 489,148 | | | 425,947 | |
| | | | |
| Total liabilities and shareholders’ equity | $ | 1,170,816 | | | $ | 1,230,095 | |
See accompanying notes to consolidated financial statements.
INTERFACE, INC. AND SUBSIDIARIES
CONSOLIDATED STATEMENTS OF CASH FLOWS
(in thousands)
| | | | | | | | | | | | | | | | | |
| | FISCAL YEAR |
| | 2024 | | 2023 | | 2022 |
| OPERATING ACTIVITIES: | | | | | |
| Net income | $ | 86,946 | | | $ | 44,517 | | | $ | 19,560 | |
| Adjustments to reconcile net income to cash provided by operating activities: | | | | | |
| Depreciation and amortization | 39,333 | | | 40,774 | | | 40,337 | |
| Share-based compensation expense | 12,907 | | | 10,265 | | | 8,527 | |
| Loss (gain) on disposal of property, plant and equipment, net | 264 | | | (2,252) | | | 4,319 | |
| Loss on foreign subsidiary liquidation | 2,152 | | | 6,221 | | | — | |
| Bad debt expense | 1,476 | | | 53 | | | 26 | |
| Deferred income taxes | (3,034) | | | (10,082) | | | 10,310 | |
| Other | (8,480) | | | 1,273 | | | 3,104 | |
| Amortization of acquired intangible assets | 5,172 | | | 5,172 | | | 5,038 | |
| Goodwill and intangible asset impairment | — | | | — | | | 36,180 | |
| Working capital changes: | | | | | |
| Accounts receivable | (13,872) | | | 21,798 | | | (17,489) | |
| Inventories | 10,467 | | | 31,040 | | | (49,651) | |
| Prepaid expenses and other current assets | (3,079) | | | (302) | | | 7,020 | |
| Accounts payable and accrued expenses | 18,178 | | | (6,443) | | | (24,220) | |
| Cash provided by operating activities | 148,430 | | | 142,034 | | | 43,061 | |
| | | | | | |
| INVESTING ACTIVITIES: | | | | | |
| Capital expenditures | (33,788) | | | (26,107) | | | (18,437) | |
| Proceeds from sale of property, plant and equipment | 1,040 | | | 6,593 | | | — | |
| Insurance proceeds from property casualty loss | 2,374 | | | — | | | — | |
| Cash used in investing activities | (30,374) | | | (19,514) | | | (18,437) | |
| | | | | | |
| FINANCING ACTIVITIES: | | | | | |
| Revolving loan borrowing | 34,243 | | | 90,000 | | | 206,031 | |
| Revolving loan repayments | (34,243) | | | (114,381) | | | (189,281) | |
| Term loan repayments | (115,213) | | | (80,927) | | | (13,191) | |
| Repurchase of common stock | — | | | — | | | (17,171) | |
| Dividends paid | (2,338) | | | (2,323) | | | (2,355) | |
| Tax withholding payments for share-based compensation | (4,770) | | | (1,514) | | | (402) | |
| Debt issuance costs | — | | | — | | | (1,032) | |
| Finance lease payments | (2,913) | | | (2,419) | | | (2,089) | |
| Cash used in financing activities | (125,234) | | | (111,564) | | | (19,490) | |
| | | | | | |
| Net cash (used in) provided by operating, investing and financing activities | (7,178) | | | 10,956 | | | 5,134 | |
| Effect of exchange rate changes on cash | (4,094) | | | 1,978 | | | (4,822) | |
| | | | | | |
| CASH AND CASH EQUIVALENTS: | | | | | |
| Net (decrease) increase | (11,272) | | | 12,934 | | | 312 | |
| Balance, beginning of year | 110,498 | | | 97,564 | | | 97,252 | |
| | | | | | |
| Balance, end of year | $ | 99,226 | | | $ | 110,498 | | | $ | 97,564 | |
See accompanying notes to consolidated financial statements.
INTERFACE, INC. AND SUBSIDIARIES
NOTES TO CONSOLIDATED FINANCIAL STATEMENTS
NOTE 1 – SUMMARY OF SIGNIFICANT ACCOUNTING POLICIES
Nature of Operations
Interface is a global flooring company specializing in carpet tile and resilient flooring, including luxury vinyl tile (“LVT”), and nora® rubber flooring. The Company manufactures modular carpet focusing on the high quality, design-oriented sector of the market, sources resilient flooring including LVT from third parties and focuses on the same sector of the market, and provides specialized carpet replacement, installation and maintenance services. The Company also manufactures and sells resilient rubber flooring.
The Company has determined that it has two operating and reportable segments – namely Americas (“AMS”) which includes the United States, Canada and Latin America geographic areas, and Europe, Africa, Asia and Australia (collectively “EAAA”). See Note 20 entitled “Segment Information” for additional information.
Cybersecurity Event
On November 20, 2022, we discovered a cybersecurity attack, perpetrated by unauthorized third parties, affecting our IT systems (the “Cyber Event”). In response to this Cyber Event, we notified law enforcement and took steps to supplement existing security monitoring, including scanning and protective measures. The investigation of the Cyber Event was completed during 2023. During 2024, we recovered $4.8 million in business interruption insurance proceeds, which are recognized as a benefit within other income / expense, net in the consolidated statements of operations. During 2024, we also recovered $0.8 million of costs from our cyber risk insurance, which are recorded as a reduction of selling, general, and administrative expenses. The insurance claim for the Cyber Event is now closed.
Principles of Consolidation
The consolidated financial statements include the accounts of the Company and its subsidiaries. All of our subsidiaries are wholly-owned, and we are not a party to any joint venture, partnership or other variable interest entity that would potentially qualify for consolidation. All material intercompany accounts and transactions are eliminated.
Use of Estimates
The preparation of financial statements in conformity with accounting principles generally accepted in the U.S. requires management to make estimates and assumptions that affect the reported amounts of assets and liabilities, the disclosure of contingent assets and liabilities at the date of the financial statements, and the reported amounts of revenues and expenses during the reporting periods. Examples include provisions for returns, bad debts, product claims reserves, inventory obsolescence and the length of product life cycles, accruals associated with restructuring activities, income tax exposures and valuation allowances, and the carrying value of goodwill, intangible assets and property, plant and equipment. Actual results could vary from these estimates.
Risks and Uncertainties
Global economic challenges, including the impacts of the Russia-Ukraine war, the conflict in the Middle East, and other conflicts around the globe, supply chain disruptions, potential government-imposed tariffs, and slow macro environments in certain geographical regions could cause economic uncertainty and volatility. In connection with the Cyber Event discussed above, security breaches may expose us to fines and other liabilities to the extent sensitive data stored in our IT systems, including data related to customers, suppliers or employees, are misappropriated. The Company considered these impacts and subsequent general uncertainties and volatility in the global economy on the assumptions and estimates used herein, including the goodwill and intangible asset assessments and impairments discussed in Note 12 entitled “Goodwill and Other Intangible Assets.” These uncertainties could result in a future material adverse effect to the Company’s financial statements if actual results differ from these estimates.
Revenue Recognition
Revenue from contracts with customers is recognized to depict the transfer of goods or services to customers in an amount that reflects the consideration to which the entity expects to be entitled in exchange for those goods or services. To achieve this core principle, the guidance provides that an entity should apply the following steps: (1) identify the contract(s) with a customer; (2) identify the performance obligations in the contract; (3) determine the transaction price; (4) allocate the transaction price to the performance obligations in the contract; and (5) recognize revenue when, or as, the entity satisfies a performance obligation.
Revenue Recognized from Contracts with Customers
Contracts with customers typically take the form of invoices for purchase of materials from the Company. Customer payment terms vary by region and are typically less than 60 days. The performance obligation is the delivery of these materials to the customer’s control. Revenue from the sale of modular carpet, resilient flooring, rubber flooring, and related products was approximately 97% of the Company’s total revenue in 2024, approximately 98% of the Company’s total revenue in 2023, and approximately 97% of the Company’s total revenue in 2022. The revenue from sales of these products is recognized upon shipment, or in certain cases, upon delivery to the customer. The transaction price for these sales is readily identifiable. The remaining revenue of approximately 3% for 2024, approximately 2% for 2023, and approximately 3% for 2022 was generated from the installation of carpet and other flooring-related material.
For installation projects underway, the Company recognized installation revenue over time based on a project cost input method as the customer simultaneously received and consumed the benefit of the services. The installation of the carpet and related products is a separate performance obligation from the sale of carpet. The majority of these projects are completed within five days of the start of installation. The transaction price for these sale and installation contracts is readily determinable between flooring material and installation services and typically is specifically identified in the contract with the customer.
The Company has utilized the portfolio approach to its contracts with customers, as its contracts with customers have similar characteristics, and it is reasonable to expect that the effects from applying this approach are not materially different from applying the accounting standard to individual contracts.
The Company does not have any other significant revenue streams outside of these sales of flooring material, and the sale and installation of flooring material, as described above.
The Company does not record taxes collected from customers and remitted to governmental authorities within revenues. The Company records such taxes collected as a liability on our consolidated balance sheets.
Performance Obligations
As noted above, the Company primarily generates revenue through the sale of flooring material to end users either upon shipment or upon arrival of the product at its destination. In these instances, there typically is no other obligation to the customers other than the delivery of flooring material, with the exception of warranty. The Company does offer a warranty to its customers which guarantees certain on-floor performance characteristics and warrants against manufacturing defects. The warranty is not a service warranty, and there is no ability to separate the warranty obligation from the sale of the flooring or purchase it separately. The Company’s incidence of warranty claims is extremely low, with less than 0.5% of revenue in claims on an annual basis for the last three fiscal years. Given the nature of the warranty as well as the financial impact, the Company has determined that there is no need to identify this warranty as a separate performance obligation, and the Company accounts for warranty on an accrual basis.
For the Company’s installation business, the sales of carpet and other flooring materials and installation services are separate deliverables which under the revenue recognition requirements should be characterized as separate performance obligations. The nature of the installation projects is such that the vast majority – an amount in excess of 85% of these installation projects – are completed in less than five days. The Company’s largest installation customers are retail, education and corporate customers, and these are on a project-by-project basis and are short-term installations. The Company has evaluated these projects at the end of each reporting period and recorded revenue in accordance with the accounting standards for projects which were underway as of the end of 2024, 2023 and 2022.
Costs to Obtain Contracts
The Company pays sales commissions to many of its sales personnel based upon their selling activity. These are direct costs associated with obtaining the contracts and are expensed as the revenue is recognized. These commissions become payable upon shipment (or in certain cases delivery) of product. There are no other material costs the Company incurs as part of obtaining the sales contract.
Shipping and Handling
Shipping and handling fees billed to customers are classified in net sales in the consolidated statements of operations. Shipping and handling costs incurred are classified in cost of sales in the consolidated statements of operations.
Advertising and Promotion
The Company’s advertising and promotional activities primarily consist of product samples, printed materials, digital marketing, trade shows, and customer events. Advertising and promotional costs are expensed when the advertising / promotional activity first takes place. Advertising and promotional expenses were $39.2 million, $34.6 million and $31.3 million for the years 2024, 2023 and 2022, respectively, and were recorded in selling, general and administrative (“SG&A”) expenses in the consolidated statements of operations.
Research and Development
Research and development costs are expensed as incurred and are included in SG&A expenses and cost of sales in the consolidated statements of operations. Research and development expense includes costs associated with the development of new products as well as the improvement and enhancement of existing products. Research and development expense was $15.1 million, $17.0 million, and $19.1 million for the years 2024, 2023 and 2022, respectively.
Cash, Cash Equivalents and Short-Term Investments
Highly liquid investments with original maturities of three months or less are classified as cash and cash equivalents. Investments with maturities greater than three months and less than one year are classified as short-term investments. Significant concentrations of credit risk may arise from the Company’s cash maintained at various banks, as from time to time cash balances may exceed the FDIC limits. The Company did not hold any significant amounts of cash equivalents and short-term investments at December 29, 2024 and December 31, 2023.
Supplemental Cash Flow Information
Cash payments for interest amounted to approximately $22.8 million, $28.8 million, and $25.1 million for the years 2024, 2023 and 2022, respectively. Income tax payments amounted to approximately $37.8 million, $25.8 million and $31.4 million for the years 2024, 2023 and 2022, respectively. During the years 2024, 2023 and 2022, the Company received income tax refunds of $3.3 million, $2.5 million and $12.4 million, respectively.
Allowances for Expected Credit Losses
The Company maintains allowances for expected credit losses for estimated losses resulting from the inability of customers to make required payments. Estimating the amount of future expected losses requires the Company to consider historical losses from our customers, as well as current market conditions and future forecasts of our customers’ ability to make payments for goods and services. By its nature, such an estimate is highly subjective, and it is possible that the amount of accounts receivable that the Company is unable to collect may be different than the amount initially estimated.
Inventories
Inventories are carried at the lower of cost (standards approximating the first-in, first-out method) or net realizable value. Costs included in inventories are based on invoiced costs and/or production costs, as applicable. Included in production costs are material, direct labor and allocated overhead. The Company writes down inventories for the difference between the carrying value of the inventories and their estimated net realizable value. If actual market conditions are less favorable than those projected by management, additional write-downs may be required.
Management estimates its reserves for inventory obsolescence by continuously examining its inventories to determine if there are indicators that carrying values exceed net realizable values. Experience has shown that significant indicators that could require the need for additional inventory write-downs are the age of the inventory, the length of its product life cycles, anticipated demand for the Company’s products, and current economic conditions. While management believes that adequate write-downs for inventory obsolescence have been made in the consolidated financial statements, consumer tastes and preferences may continue to change, and the Company could experience additional inventory write-downs in the future.
Leases
The Company records a right-of-use asset and lease liability for operating and finance leases once a contract that contains a lease is executed and the Company has the right to control the use of the leased asset. The right-of-use asset is measured as the present value of the lease obligation. The discount rate used to calculate the present value of the lease liability is the Company’s incremental borrowing rate, which is based on the estimated rate for a fully collateralized borrowing that fully amortizes over a similar lease term at the commencement date and for the applicable geographical region.
The Company made an accounting policy election to exclude leases with an initial term of 12 months or less from the calculation of the right-of-use asset and lease liability recorded on the consolidated balance sheets. These leases primarily represent month-to-month operating leases for equipment where we were reasonably certain that we would not elect an option to extend the lease. The Company also made an accounting policy election not to separate lease and non-lease components for all asset classes and accounts for the lease payments as a single component.
Property, Plant and Equipment and Long-Lived Assets
Property, plant and equipment are carried at cost. Depreciation is computed using the straight-line method over the following estimated useful lives: buildings and improvements – ten to forty years; equipment, furniture and fixtures – three to twelve years; and computer software – three to six years. Certain manufacturing equipment in our Weinheim manufacturing facility have estimated useful lives up to twenty-five years. Leasehold improvements are depreciated over the shorter of the asset life or lease term, generally between three to twelve years. Interest costs for the construction/development of certain long-term assets are capitalized and amortized over the related assets’ estimated useful lives. Total depreciation expense amounted to approximately $34.3 million, $35.9 million, and $36.3 million for the years 2024, 2023 and 2022, respectively.
Long-lived assets are reviewed for impairment whenever events or changes in circumstances indicate that the carrying amount may not be recoverable. If the sum of the expected future undiscounted cash flow is less than the carrying amount of the asset, a loss is recognized for the difference between the fair value and carrying value of the asset. Repair and maintenance costs are charged to operating expense as incurred.
Goodwill and Other Intangible Assets
In accordance with applicable accounting standards, the Company tests goodwill for impairment annually and between annual tests if an event occurs or circumstances change that would more likely than not reduce the fair value of a reporting unit below its carrying amount. During the fourth quarters of 2024, 2023 and 2022, the Company performed the annual goodwill impairment test. The Company tests goodwill at the reporting unit level, which is an operating segment or one level below an operating segment. In performing the impairment testing, the Company prepared valuations of reporting units on both a market comparable methodology and an income methodology, and those valuations were compared with the respective carrying values of the reporting units to determine whether any goodwill impairment existed. In preparing the valuations, past, present and future expectations of performance were considered. See Note 12 entitled “Goodwill and Other Intangible Assets” for additional information.
Trademark and trade name intangible assets acquired in connection with the nora acquisition are not subject to amortization, but are tested for impairment annually and between annual tests if an event occurs or circumstances change that would more likely than not reduce the fair value of the intangible asset below its carrying amount. For the annual tests performed in 2024, 2023, and 2022, the Company prepared valuations of the intangible assets using the present value of cash flows under the relief from royalty method, which were compared to the carrying value of intangible assets to determine whether any impairment existed. See Note 12 entitled “Goodwill and Other Intangible Assets” for additional information.
The Company’s other intangible assets primarily consist of developed technology that is amortized on a straight-line basis over the estimated useful life of 7 years.
Product Warranties
The Company typically provides limited warranties with respect to certain attributes of its carpet products (for example, warranties regarding excessive surface wear, edge ravel and static electricity) for periods ranging from ten to twenty years, depending on the particular carpet product and the environment in which it is to be installed. Similar limited warranties are provided on certain attributes of its rubber and LVT products, typically for a period of 5 to 15 years. The Company typically warrants that services performed will be free from defects in workmanship for a period of one year following completion. In the event of a breach of warranty, the remedy typically is limited to repair of the problem or replacement of the affected product.
The Company records a provision related to warranty costs based on historical experience and future expectations and periodically adjusts these provisions to reflect changes in actual experience. Warranty and sales allowance reserves amounted to $5.3 million and $4.3 million as of December 29, 2024 and December 31, 2023, respectively, and are included in accrued expenses in the accompanying consolidated balance sheets.
Income Taxes
The Company accounts for income taxes under an asset and liability approach that requires the recognition of deferred tax assets and liabilities for the expected future tax consequences of events that have been recognized in the Company’s financial statements or tax returns. In estimating future tax consequences, the Company generally considers all expected future events other than enactments of changes in tax laws or rates. The effect on deferred tax assets and liabilities of a change in tax rates will be recognized as income or expense in the period that includes the enactment date.
The Company has elected to account for tax effects of the global intangible low-taxed income (“GILTI”) in the period when incurred, and therefore has not provided any deferred tax impacts for these provisions in its consolidated financial statements.
The Company records a valuation allowance to reduce its deferred tax assets when it is more likely than not that some portion or all of the deferred tax assets will expire before realization of the benefit or that future deductibility is not probable. The ultimate realization of the deferred tax assets depends on the ability to generate sufficient taxable income of the appropriate character in the future. This requires us to use estimates and make assumptions regarding significant future events such as the taxability of entities operating in the various taxing jurisdictions.
For uncertain tax positions, the Company applies the provisions of relevant authoritative guidance, which requires application of a “more likely than not” threshold to the recognition and derecognition of tax positions. The Company’s ongoing assessments of the more likely than not outcomes of tax authority examinations and related tax positions require significant judgment and can increase or decrease the Company’s effective tax rate as well as impact operating results. For further information, see Note 17 entitled “Income Taxes.”
Fair Values of Financial Instruments
Fair values of cash and cash equivalents and short-term debt approximate cost due to the short period of time to maturity. Fair values of debt are based on quoted market prices or pricing models using current market rates and classified as level 2 within the fair value hierarchy. See Note 5 entitled “Fair Value of Financial Instruments” for further information.
Translation of Foreign Currencies
The financial position and results of operations of most of the Company’s foreign subsidiaries are measured using local currencies as the functional currency. Assets and liabilities of these subsidiaries are translated into U.S. dollars at the exchange rate in effect at each year-end. Income and expense items are translated each month at average monthly exchange rates throughout the year. The resulting translation adjustments are recorded in the foreign currency translation adjustment account. In the event of a divestiture or substantial liquidation of a foreign subsidiary, the related foreign currency translation results are reclassified from equity to income. Foreign exchange translation gains (losses) were $(23.7) million, $19.2 million, and $(38.3) million for the years 2024, 2023 and 2022, respectively.
Earnings per Share
Basic earnings per share is computed based on the average number of common shares outstanding, including participating securities. Diluted earnings per share reflects the potential increase in average common shares outstanding that would result from share-based awards or the assumed exercise of outstanding stock options, calculated using the treasury stock method. See Note 15 entitled “Earnings Per Share” for additional information.
Share-Based Compensation
The Company has share-based employee compensation plans, which are described more fully in Note 14 entitled “Shareholders' Equity.”
The Company recognizes expense related to its restricted stock, restricted share unit and performance share grants based on the grant date fair value of the shares awarded, as determined by its market price at date of grant.
Pension Benefits
Net pension expense recorded is based on, among other things, assumptions about the discount rate, estimated return on plan assets and salary increases. While the Company believes these assumptions are reasonable, changes in these and other factors and differences between actual and assumed changes in the present value of liabilities or assets of the Company’s plans above certain thresholds could cause net annual expense to increase or decrease materially from year to year. The actuarial assumptions used in the Company’s salary continuation plan and foreign defined benefit plans reporting are reviewed periodically and compared with external benchmarks to ensure that they appropriately account for our future pension benefit obligation. The expected long-term rate of return on plan assets assumption is based on weighted average expected returns for each asset class. Expected returns reflect a combination of historical performance analysis and the forward-looking views of the financial markets, and include input from actuaries, investment service firms and investment managers.
Reclassifications
Certain reclassifications to prior year information have been made in the consolidated statements of cash flows to conform to the current period presentation. The previously reported line item “deferred income taxes and other” was separated into two line items in the current period presentation of the consolidated statements of cash flows to provide additional information. These reclassifications had no effect on cash provided by operating activities as previously reported.
Reclassifications were also made to prior year deferred tax assets and deferred tax liabilities and the reconciliation of the beginning and ending amounts of gross unrecognized tax benefits presented in Note 17 entitled “Income Taxes” to conform to the current period presentation. See Note 17 entitled “Income Taxes” for additional information.
Fiscal Year
The Company’s fiscal year is the 52 or 53 week period ending on the Sunday nearest December 31. All references herein to “2024,” “2023,” and “2022,” mean the fiscal years ended December 29, 2024, December 31, 2023, and January 1, 2023, respectively. Fiscal years 2024, 2023 and 2022 were each comprised of 52 weeks.
NOTE 2 – RECENT ACCOUNTING PRONOUNCEMENTS
Recently Issued Accounting Pronouncements – Adopted
In November 2023, the Financial Accounting Standards Board (“FASB”) issued Accounting Standards Update (“ASU”) 2023-07, “Segment Reporting (Topic 280): Improvements to Reportable Segment Disclosures.” This ASU requires additional disclosures in annual and interim periods for significant segment expenses included in the measure of segment profit provided to the chief operating decision maker (“CODM”). Disclosure of other segment items by reportable segment as well as a description of its composition is also required. The new guidance is effective for annual periods beginning after December 15, 2023, and for interim periods beginning after December 15, 2024. The Company adopted the provisions of ASU 2023-07 for the year ended December 29, 2024 (see Note 20 entitled “Segment Information”). The adoption did not have a material impact to our consolidated financial statements.
Recently Issued Accounting Pronouncements – Not Yet Adopted
In November 2024, the FASB issued ASU 2024-03, “Income Statement Reporting - Comprehensive Income - Expense Disaggregation (Topic 220-40)”. This ASU requires public entities to provide additional footnote disclosures to disaggregate the cost and expense line items presented in the income statement into specific categories including (a) purchases of inventory; (b) employee compensation; (c) depreciation: and (d) intangible asset amortization. The ASU also requires qualitative disclosure of other relevant expense categories not separately disclosed, the total amount of selling expenses, and the definition of selling expenses in annual reporting periods. The new guidance in ASU 2024-03 is effective for annual periods beginning after December 15, 2026. In January 2025, the FASB issued ASU 2025-01 to clarify the interim reporting period effective date for ASU 2024-03. The provisions of ASU 2024-03 are effective for interim periods within annual reporting periods beginning after December 15, 2027. Early adoption is permitted. The Company is currently evaluating the impact of this ASU to its consolidated financial statements.
In December 2023, the FASB issued ASU 2023-09, “Income Taxes (Topic 740): Improvements to Income Tax Disclosures.” This ASU requires public entities on an annual basis to disclose a rate reconciliation with explicit categories, as outlined in the ASU, and requires additional disclosures for reconciling items that meet certain quantitative thresholds. Other disclosures include disaggregation of income taxes paid, pre-tax income, and income tax expense. The new guidance is effective for fiscal years beginning after December 15, 2024. Early adoption is permitted. We are currently assessing the updated guidance; however, it is not expected to have a material impact to our consolidated financial statements.
NOTE 3 – REVENUE RECOGNITION
The Company generates revenue from sales of modular carpet, resilient flooring, rubber flooring, and other flooring-related material, and from the installation of carpet and other flooring-related material. A summary of these revenue streams, as a percentage of net sales, for fiscal years 2024, 2023 and 2022 is a follows:
| | | | | | | | | | | | | | | | | |
| Fiscal Year |
| 2024 | | 2023 | | 2022 |
| Revenue from the sale of flooring material | 97 | % | | 98 | % | | 97 | % |
| Revenue from installation of flooring material | 3 | % | | 2 | % | | 3 | % |
Disaggregation of Revenue
For fiscal years 2024, 2023 and 2022, revenue from the Company’s customers is broken down by geography as follows:
| | | | | | | | | | | | | | | | | |
| Fiscal Year |
| Geography | 2024 | | 2023 | | 2022 |
| Americas | 60.9 | % | | 58.4 | % | | 58.0 | % |
| Europe | 28.6 | % | | 30.1 | % | | 29.2 | % |
| Asia-Pacific | 10.5 | % | | 11.5 | % | | 12.8 | % |
Revenue from the Company’s customers in the Americas corresponds to the AMS reportable segment, and the EAAA reportable segment includes revenue from the Europe and Asia-Pacific geographies. See Note 20 entitled “Segment Information” for additional information.
NOTE 4 – RECEIVABLES
The Company has adopted credit policies and standards intended to reduce the inherent risk associated with potential increases in its concentration of credit risk due to increasing trade receivables. Management believes that credit risks are further moderated by the diversity of its end customers and geographic sales areas. The Company performs ongoing credit evaluations of its customers’ financial condition and requires collateral as deemed necessary. The Company maintains allowances for expected credit losses resulting from the inability of customers to make required payments. If the financial condition of its customers were to deteriorate, resulting in a change in their ability to make payments, additional allowances may be required. As of December 29, 2024, and December 31, 2023, the allowance for expected credit losses amounted to $3.8 million and $3.0 million, respectively, for all accounts receivable of the Company.
NOTE 5 – FAIR VALUE OF FINANCIAL INSTRUMENTS
Accounting standards establish a fair value hierarchy that prioritizes the inputs to valuation techniques used to measure estimated fair value. The hierarchy gives the highest priority to unadjusted quoted prices in active markets for identical assets or liabilities (level 1 measurements) and the lowest priority to unobservable inputs (level 3 measurements). The three levels of the fair value hierarchy under applicable accounting standards are described below:
Level 1 Unadjusted quoted prices in active markets that are accessible at the measurement date for identical, unrestricted assets or liabilities.
Level 2 Inputs to the valuation methodology include:
•quoted prices for similar assets in active markets;
•quoted prices for identical or similar assets in inactive markets;
•inputs other than quoted prices that are observable for the asset; and
•inputs that are derived principally or corroborated by observable data by correlation or other.
Level 3 Prices or valuations that require inputs that are both significant to the fair value measurement and unobservable.
A financial instrument’s level within the fair value hierarchy is based on the lowest level of any input that is significant to the fair value measurement.
The following table presents the carrying values and estimated fair values, including the level within the fair value hierarchy, of certain financial instruments:
| | | | | | | | | | | | | | | | | | | | | | | | | | | | | | | | | | | |
| December 29, 2024 | | December 31, 2023 |
| Carrying Value | | Fair Value (Level 1) | | Fair Value (Level 2) | | Carrying Value | | Fair Value (Level 1) | | Fair Value (Level 2) |
| (in thousands) |
| Assets: | | | | | | | | | | | |
| Company-owned life insurance | $ | 22,911 | | | $ | — | | | $ | 22,911 | | | $ | 22,788 | | | $ | — | | | $ | 22,788 | |
| Deferred compensation investments | 30,521 | | | 8,697 | | | 21,824 | | | 28,417 | | | 9,200 | | | 19,217 | |
| | | | | | | | | | | | |
Liabilities(1): | | | | | | | | | | | |
Borrowings under Syndicated Credit Facility(2) | $ | 5,564 | | | $ | — | | | $ | 5,564 | | | $ | 121,658 | | | $ | — | | | $ | 121,658 | |
5.50% Senior Notes due 2028(3) | 300,000 | | | — | | | 294,738 | | | 300,000 | | | — | | | 281,991 | |
(1) Carrying values are presented gross, excluding the impact of unamortized debt issuance costs and including amounts presented as current liabilities on the consolidated balance sheets.
(2) Unamortized debt issuance costs associated with term loan borrowings under the Syndicated Credit Facility, recorded as a reduction of long-term debt in the consolidated balance sheets, were not material as of December 29, 2024, and were $1.0 million as of December 31, 2023.
(3) Unamortized debt issuance costs associated with the Senior Notes, recorded as a reduction of long-term debt in the consolidated balance sheets, were $2.8 million and $3.4 million as of December 29, 2024 and December 31, 2023, respectively.
Company-Owned Life Insurance
The fair value of Company-owned life insurance is measured on a readily determinable cash surrender value on a recurring basis. Company-owned life insurance is recorded at fair value within other assets in the consolidated balance sheets. Changes in the fair value of Company-owned life insurance are recognized in SG&A expenses in the consolidated statements of operations.
Deferred Compensation Investments
Assets associated with the Company’s nonqualified savings plans are held in a rabbi trust and consist of investments in mutual funds and insurance contracts. The fair value of the mutual funds is derived from quoted prices in active markets. The fair value of the insurance contracts is based on observable inputs related to the performance measurement funds that shadow the deferral investment allocations made by participants in the nonqualified savings plans. These investments are recorded at fair value within other assets in the consolidated balance sheets. Changes in the fair value of the investments associated with the nonqualified savings plans are recognized in SG&A expenses in the consolidated statements of operations. See Note 19 entitled “Employee Benefit Plans” for additional information on the Company’s nonqualified savings plans.
Syndicated Credit Facility and Senior Notes
The Company’s liabilities for borrowings under the Syndicated Credit Facility (the “Facility”) and 5.50% Senior Notes due 2028 (the “Senior Notes”) are not recorded at fair value in the consolidated balance sheets. The carrying value of borrowings under the Facility approximates fair value as the Facility bears variable interest rates that are similar to existing market rates. The fair value of the Senior Notes is derived using quoted prices for similar instruments.
Other Assets and Liabilities
Due to the short maturity of cash and cash equivalents, accounts receivable, accounts payable and accrued expenses, their carrying values approximate fair value. See Note 19 entitled “Employee Benefit Plans” for additional information on defined benefit plan assets.
NOTE 6 – INVENTORIES
Inventories are summarized as follows:
| | | | | | | | | | | |
| End of Fiscal Year |
| | 2024 | | 2023 |
| | (in thousands) |
| Finished goods | $ | 192,705 | | | $ | 201,821 | |
| Work-in-process | 18,552 | | | 20,892 | |
| Raw materials | 49,324 | | | 56,366 | |
| Inventories, net | $ | 260,581 | | | $ | 279,079 | |
Reserves for inventory obsolescence amounted to $38.3 million and $34.0 million as of December 29, 2024 and December 31, 2023, respectively, and have been netted against amounts presented above.
NOTE 7 – PROPERTY, PLANT AND EQUIPMENT
Property, plant and equipment consisted of the following:
| | | | | | | | | | | |
| | End of Fiscal Year |
| | 2024 | | 2023 |
| | (in thousands) |
| Land | $ | 14,844 | | | $ | 15,810 | |
| Buildings and improvements | 159,741 | | | 162,359 | |
Equipment, furniture and fixtures(1) | 533,314 | | | 533,418 | |
| Computer software | 66,226 | | | 66,792 | |
Construction-in-progress(2) | 21,394 | | | 21,577 | |
| | | | |
| | 795,519 | | | 799,956 | |
Accumulated depreciation and amortization(3) | (513,145) | | | (508,816) | |
| | | | |
| Property, plant and equipment, net | $ | 282,374 | | | $ | 291,140 | |
(1) Includes $13.1 million and $11.9 million of leased equipment for 2024 and 2023, respectively.
(2) Primarily represents manufacturing equipment not yet placed in service as of December 29, 2024 and December 31, 2023.
(3) Includes $5.0 million and $4.7 million of accumulated amortization on leased equipment for 2024 and 2023, respectively.
Assets Disposed
On September 8, 2021, the Company announced a restructuring plan that involved the closure of its manufacturing facility in Thailand and committed to a plan to sell the Thailand facility in connection with this restructuring plan. See Note 16 entitled “Restructuring and Other” for additional information.
During the second quarter of 2023, the Company completed the sale of the Thailand facility for a selling price of $6.6 million and recognized a gain of $2.7 million, which is recorded in restructuring, asset impairment, other (gains) and charges in the consolidated statements of operations and is attributable to the EAAA reportable segment.
The Company determined that the Thailand facility sale did not meet the criteria for classification as discontinued operations.
NOTE 8 – ACCRUED EXPENSES
Accrued expenses are summarized as follows:
| | | | | | | | | | | |
| | End of Fiscal Year |
| | 2024 | | 2023 |
| | (in thousands) |
| Compensation | $ | 97,190 | | | $ | 87,265 | |
| Interest | 1,276 | | | 1,338 | |
| Taxes | 13,762 | | | 18,300 | |
| Accrued purchases | 3,888 | | | 5,141 | |
| Warranty and sales allowances | 5,254 | | | 4,302 | |
| Other | 13,626 | | | 14,544 | |
| Accrued expenses | $ | 134,996 | | | $ | 130,890 | |
NOTE 9 – LONG-TERM DEBT
Long-term debt consisted of the following:
| | | | | | | | | | | | | | | | | | | | | | | |
| December 29, 2024 | | December 31, 2023 |
| Outstanding Principal | | Interest Rate(1) | | Outstanding Principal | | Interest Rate(1) |
| (in thousands) | | | | (in thousands) | | |
Syndicated Credit Facility(2) | | | | | | | |
| Term loan borrowings | $ | 5,564 | | | 5.62 | % | | $ | 121,658 | | | 6.61 | % |
| Total borrowings under Syndicated Credit Facility | 5,564 | | | 5.62 | % | | 121,658 | | | 6.61 | % |
| | | | | | | |
| 5.50% Senior Notes due 2028 | 300,000 | | | 5.50 | % | | 300,000 | | | 5.50 | % |
| | | | | | | | |
| Total debt | 305,564 | | | | | 421,658 | | | |
| Less: Unamortized debt issuance costs | (2,807) | | | | | (4,445) | | | |
| | | | | | | | |
| Total debt, net | 302,757 | | | | | 417,213 | | | |
| Less: Current portion of long-term debt | (482) | | | | | (8,572) | | | |
| | | | | | | | |
| Total long-term debt, net | $ | 302,275 | | | | | $ | 408,641 | | | |
(1) Represents the weighted average rate of interest for borrowings under the Syndicated Credit Facility and the stated rate of interest for the 5.50% Senior Notes due 2028, without the effect of debt issuance costs.
(2) The Syndicated Credit Facility also includes a multicurrency revolving loan facility as discussed below. There were no revolving loan borrowings outstanding as of December 29, 2024 or December 31, 2023.
Syndicated Credit Facility
The Company’s Facility provides to the Company U.S. denominated and multicurrency term loans and provides to the Company and certain of its subsidiaries a multicurrency revolving credit facility. At December 29, 2024, the Facility provided to the Company and certain of its subsidiaries a multicurrency revolving loan facility up to $300.0 million, as well as other U.S. denominated and multicurrency term loans. At December 29, 2024, the Company had available borrowing capacity of $299.3 million under the revolving loan facility.
Significant Facility Amendments
On October 14, 2022, the Company entered into a fifth amendment to its Facility. The fifth amendment provided for, among other changes, the following amendments to the Facility:
•the amendment of the maturity date of the Facility to October 2027; and
•amendments to replace the LIBOR benchmark interest rates applicable to all loans denominated in U.S. dollars with the SOFR benchmark interest rates.
Interest Rates and Fees
Base rate loans, as defined in the Facility, represent short-term borrowings with applicable interest rates determined as the greater of the federal funds rate plus a margin, the prime rate, or SOFR plus a margin. Interest on base rate loans is charged at varying rates computed by applying a margin ranging from 0.25% to 2.00%, depending on the Company’s consolidated net leverage ratio as of the most recently completed fiscal quarter. Interest on SOFR-based and alternative currency loans are charged at varying rates computed by applying a margin ranging from 1.25% to 3.00% over the applicable SOFR rate or alternative currency rate, depending on the Company’s consolidated net leverage ratio as of the most recently completed fiscal quarter. In addition, the Company pays a commitment fee ranging from 0.20% to 0.40% per annum (depending on the Company’s consolidated net leverage ratio as of the most recently completed fiscal quarter) on the unused portion of the Facility.
Fees for commercial letters of credit are computed as 1.00% per annum of the amount available to be drawn under such letters of credit. Fees for standby letters of credit are charged at varying rates computed by applying a margin ranging from 1.25% to 3.00% per annum of the amount available to be drawn under such standby letters of credit, depending on the Company’s consolidated net leverage ratio as of the most recently completed fiscal quarter.
Covenants
The Facility contains standard and customary covenants for agreements of this type, including various reporting, affirmative and negative covenants. Among other things, these covenants limit the Company’s and its subsidiaries’ ability to:
•create or incur liens on assets;
•make acquisitions of or investments in businesses (in excess of certain specified amounts);
•engage in any material line of business substantially different from the Company’s current lines of business;
•incur indebtedness or contingent obligations;
•sell or dispose of assets (in excess of certain specified amounts);
•pay dividends or repurchase the Company’s stock (in excess of certain specified amounts);
•repay other indebtedness prior to maturity unless the Company meets certain conditions; and
•enter into sale and leaseback transactions.
The Facility also requires the Company to remain in compliance with the following financial covenants as of the end of each fiscal quarter, based on the Company’s consolidated results for the year then ended:
•Consolidated Secured Net Leverage Ratio: Must be no greater than 3.00:1.00.
•Consolidated Interest Coverage Ratio: Must be no less than 2.25:1.00.
Events of Default
If the Company breaches or fails to perform any of the affirmative or negative covenants under the Facility, or if other specified events occur (such as a bankruptcy or similar event or a change of control of Interface, Inc. or certain subsidiaries, or if the Company breaches or fails to perform any covenant or agreement contained in any instrument relating to any of the Company’s other indebtedness exceeding $20 million), after giving effect to any applicable notice and right to cure provisions, an event of default will exist. If an event of default exists and is continuing, the lenders’ Administrative Agent may, and upon the written request of a specified percentage of the lender group shall:
•declare all commitments of the lenders under the facility terminated;
•declare all amounts outstanding or accrued thereunder immediately due and payable; and
•exercise other rights and remedies available to them under the agreement and applicable law.
Collateral
Pursuant to a Second Amended and Restated Security and Pledge Agreement, the Facility is secured by substantially all of the assets of the Company and its domestic subsidiaries (subject to exceptions for certain immaterial subsidiaries), including all of the stock of the Company’s domestic subsidiaries and up to 65% of the stock of certain material foreign subsidiaries. If an event of default occurs under the Facility, the lenders’ Administrative Agent may, upon the request of a specified percentage of lenders, exercise remedies with respect to the collateral, including, in some instances, foreclosing mortgages on real estate assets, taking possession of or selling personal property assets, collecting accounts receivable, or exercising proxies to take control of the pledged stock of domestic and certain material foreign subsidiaries.
As of December 29, 2024 and December 31, 2023, the Company had $0.7 million and $1.6 million, respectively, in letters of credit outstanding under the Facility.
Under the Facility, the Company is required to make quarterly amortization payments of the term loan borrowings. The amortization payments are due on the last day of the calendar quarter.
The Company is in compliance with all covenants under the Facility as of December 29, 2024, and anticipates that it will remain in compliance with the covenants for the foreseeable future.
Senior Notes due 2028
As of December 29, 2024, the Company had $300.0 million of Senior Notes outstanding. The Senior Notes bear an interest rate at 5.50% per annum and mature on December 1, 2028. Interest is paid semi-annually on June 1 and December 1 of each year.
The Senior Notes are unsecured and are guaranteed, jointly and severally, by each of the Company’s material domestic subsidiaries, all of which also guarantee the obligations of the Company under its Facility.
Redemption
On or after December 1, 2023, the Company may redeem the Senior Notes, in whole or in part, at any time at the redemption prices listed below, plus accrued and unpaid interest, if any, to (but excluding) the redemption date, if redeemed during the 12-month period commencing on December 1 of the years set forth below:
| | | | | |
| Period | Redemption Price |
| 2023 | 102.750 | % |
| 2024 | 101.375 | % |
| 2025 and thereafter | 100.000 | % |
In addition, the Company had the option to redeem up to 35% of the aggregate principal amount of the Senior Notes before December 1, 2023 with the proceeds of certain equity offerings at a redemption price of 105.50%, plus accrued and unpaid interest, if any, to (but excluding) the redemption date.
If the Company experiences a change of control, the Company will be required to offer to purchase the Senior Notes at 101% of their principal amount, plus accrued and unpaid interest to (but excluding) the date of repurchase.
Covenants
The indenture governing the Senior Notes contains standard and customary covenants for agreements of this type, including various reporting, affirmative and negative covenants. Among other things, these covenants limit the Company’s and its subsidiaries’ ability to:
•incur additional indebtedness;
•declare or pay dividends, redeem stock or make other distributions to shareholders;
•make investments;
•create liens on their assets or use their assets as security in other transactions;
•enter into mergers, consolidations or sales, transfers, leases or other dispositions of all or substantially all of the Company’s assets;
•enter into certain transactions with affiliates; and
•sell or transfer certain assets.
The Company is in compliance with all covenants under the indenture governing the Senior Notes and anticipates that it will remain in compliance with the covenants for the foreseeable future.
Events of Default
If the Company breaches or fails to perform any of the affirmative or negative covenants under the indenture governing the Senior Notes, or if other specified events occur (such as a bankruptcy or similar event), after giving effect to any applicable notice and right to cure provisions, an event of default will exist. If an event of default exists and is continuing, the terms of the indenture permit the trustee or the holders of at least 25% in principal amount of outstanding Senior Notes to declare the principal, premium, if any, and accrued but unpaid interest on all the Senior Notes to be due and payable.
Debt Issuance Costs
Debt issuance costs associated with the Company’s Senior Notes and term loans under the Facility are reflected as a reduction of long-term debt in accordance with applicable accounting standards. These fees are amortized straight-line, which approximates the effective interest method, and over the life of the outstanding borrowing, the debt balance will increase by the same amount as the fees that are amortized. As of December 29, 2024 and December 31, 2023, the unamortized debt issuance costs recorded as a reduction of long-term debt were $2.8 million and $4.4 million, respectively. Expenses related to such costs for the years 2024, 2023 and 2022 amounted to $1.7 million, $1.7 million, and $1.2 million, respectively.
Debt issuance costs related to the issuance of revolving debt, which include underwriting, legal and other direct costs, net of accumulated amortization, were $1.1 million and $1.4 million, as of December 29, 2024 and December 31, 2023, respectively. These amounts are included in other assets in the Company’s consolidated balance sheets. The Company amortizes these costs over the life of the related debt. Expenses related to such costs amounted to $0.4 million for each of the years 2024, 2023 and 2022.
Future Maturities
The aggregate maturities of borrowings are as follows:
| | | | | |
| Fiscal Year | Amount |
| | (in thousands) |
| 2025 | $ | 482 | |
| 2026 | 482 | |
| 2027 | 4,600 | |
| 2028 | 300,000 | |
| Total debt | $ | 305,564 | |
Total long-term debt in the consolidated balance sheets includes a reduction for unamortized debt issuance costs of $2.8 million which are excluded from the maturities table above.
NOTE 10 – DERIVATIVE INSTRUMENTS
Interest Rate Risk Management
From time to time, the Company enters into interest rate swap transactions to fix the variable interest rate on a portion of its term loan borrowing in order to manage a portion of its exposure to interest rate fluctuations. The Company’s objective and strategy with respect to these interest rate swaps is to protect the Company against adverse fluctuations in interest rates by reducing its exposure to variability to cash flows relating to interest payments on a portion of its outstanding debt.
Cash Flow Interest Rate Swaps
In the fourth quarter of 2020, the Company terminated its designated interest rate swap transactions with a total notional value of $250 million. Hedge accounting was also discontinued at that time. Losses recorded in accumulated other comprehensive loss for these terminated interest rate swaps are reclassified and recorded in the consolidated statements of operations to the extent it is probable that a portion of the original forecasted transactions related to the portion of the hedged debt repaid will not occur by the end of the originally specified time period. See Note 21 entitled “Items Reclassified From Accumulated Other Comprehensive Loss” for additional information.
All amounts related to the terminated interest rate swaps have been recognized in the consolidated statements of operations and there was no remaining balance in accumulated other comprehensive loss associated with the terminated interest rate swaps at December 29, 2024.
NOTE 11 – LEASES
General
The Company has operating and finance leases for manufacturing equipment, corporate offices, showrooms, vehicles, distribution facilities, design centers, as well as computer and office equipment. The Company’s leases have terms ranging from 1 to 20 years, some of which may include options to extend the lease term for up to 5 years, and certain leases may include an option to terminate the lease. Our lease accounting may include these options to extend or terminate a lease when it is reasonably certain that we will exercise that option.
As of December 29, 2024, there were no significant leases that had not commenced.
The table below represents a summary of the balances recorded in the consolidated balance sheets related to the Company’s leases as of December 29, 2024 and December 31, 2023:
| | | | | | | | | | | | | | | | | | | | | | | |
| December 29, 2024 | | December 31, 2023 |
| Balance Sheet Location | Operating Leases | | Finance Leases | | Operating Leases | | Finance Leases |
| (in thousands) |
| Operating lease right-of-use assets | $ | 76,815 | | | | | $ | 87,519 | | | |
| | | | | | | | |
| Current portion of operating lease liabilities | $ | 12,296 | | | | | $ | 12,347 | | | |
| Operating lease liabilities | 68,092 | | | | | 78,269 | | | |
| Total operating lease liabilities | $ | 80,388 | | | | | $ | 90,616 | | | |
| | | | | | | | |
| Property, plant and equipment, net | | | $ | 8,079 | | | | | $ | 7,236 | |
| | | | | | | | |
| Accrued expenses | | | $ | 2,657 | | | | | $ | 2,587 | |
| Other long-term liabilities | | | 5,797 | | | | | 5,035 | |
| Total finance lease liabilities | | | $ | 8,454 | | | | | $ | 7,622 | |
Lease Costs
| | | | | | | | | | | | | | | | | |
| Fiscal Year |
| 2024 | | 2023 | | 2022 |
| (in thousands) |
| Finance lease cost: | | | | | |
| Amortization of right-of-use assets | $ | 3,079 | | | $ | 2,808 | | | $ | 2,238 | |
| Interest on lease liabilities | 457 | | | 319 | | | 164 | |
| Operating lease cost | 19,495 | | | 18,850 | | | 18,916 | |
| Short-term lease cost | 827 | | | 1,143 | | | 849 | |
| Variable lease cost | 2,824 | | | 2,509 | | | 2,692 | |
| Total lease cost | $ | 26,682 | | | $ | 25,629 | | | $ | 24,859 | |
Other Supplemental Information
| | | | | | | | | | | | | | | | | |
| Fiscal Year |
| 2024 | | 2023 | | 2022 |
| (in thousands) |
| Cash paid for amounts included in the measurement of lease liabilities: | | | | | |
| Operating cash flows from finance leases | $ | 431 | | | $ | 237 | | | $ | 128 | |
| Operating cash flows from operating leases | 17,246 | | | 15,552 | | | 18,080 | |
| Financing cash flows from finance leases | 2,913 | | | 2,419 | | | 2,089 | |
| Right-of-use assets obtained in exchange for new finance lease liabilities | 3,993 | | | 3,612 | | | 3,436 | |
| Right-of-use assets obtained in exchange for new operating lease liabilities | 4,598 | | | 15,561 | | | 9,307 | |
Lease Term and Discount Rate
The table below presents the weighted average remaining lease terms and discount rates for finance and operating leases as of December 29, 2024 and December 31, 2023:
| | | | | | | | | | | |
| End of Fiscal Year |
| | 2024 | | 2023 |
| Weighted-average remaining lease term – finance leases (in years) | 3.61 | | 3.70 |
| Weighted-average remaining lease term – operating leases (in years) | 7.68 | | 8.29 |
| Weighted-average discount rate – finance leases | 6.44 | % | | 5.51 | % |
| Weighted-average discount rate – operating leases | 6.39 | % | | 6.25 | % |
Maturity Analysis
A maturity analysis of lease payments under non-cancellable leases is presented as follows:
| | | | | | | | | | | |
| Fiscal Year | Operating Leases | | Finance Leases |
| (in thousands) |
| 2025 | $ | 16,724 | | | $ | 3,096 | |
| 2026 | 16,746 | | | 2,597 | |
| 2027 | 13,863 | | | 2,018 | |
| 2028 | 11,077 | | | 1,151 | |
| 2029 | 9,506 | | | 504 | |
| Thereafter | 34,706 | | | 146 | |
| Total future minimum lease payments (undiscounted) | 102,622 | | | 9,512 | |
| Less: Present value discount | (22,234) | | | (1,058) | |
| Total lease liabilities | $ | 80,388 | | | $ | 8,454 | |
NOTE 12 – GOODWILL AND OTHER INTANGIBLE ASSETS
Goodwill
The Company has two operating and reportable segments – namely AMS and EAAA. See Note 20 entitled “Segment Information” for additional information. The Company tests goodwill for impairment at least annually at the reporting unit level. The Company’s reporting units consist of (1) the Americas, (2) Europe, Middle East and Africa (“EMEA”), and (3) Asia-Pacific. The Americas reporting unit is the same as the AMS reportable segment, and the EMEA and Asia-Pacific reporting units are one level below the EAAA reportable segment.
During the fourth quarter of 2024 and 2023 we performed our annual quantitative goodwill impairment testing. We focused our testing on the Americas reporting unit because it is the only reporting unit with an allocated goodwill balance. The allocated goodwill balances for our EMEA and Asia-Pacific reporting units were written off in prior years as a result of goodwill impairment charges. The Company performed limited procedures for our EMEA and Asia-Pacific reporting units during the 2024 and 2023 goodwill testing to facilitate a reconciliation of market capitalization.
The annual quantitative goodwill impairment testing performed in 2024 and 2023 for our Americas reporting unit was consistent with our prior year methodology. The Company prepared valuations for the Americas reporting unit on both a market comparable methodology and an income methodology, utilizing a combination of the present value of expected future cash flows and the guideline public company method to determine the estimated fair value of the reporting unit. In preparing the valuation, past, present and future expectations of performance were considered, including our expectations for the short-term and long-term impacts of macroeconomic conditions and our expected financial performance, including planned revenue and operating income for the Americas reporting unit. The present value model requires management to estimate future cash flows, the timing of these cash flows, and a discount rate based on a weighted average cost of capital. The discount rate used for the Americas reporting unit was 10.5% in 2024 compared to 11.5% in 2023, which fluctuated based on a lower risk premium assigned to estimates of expected future performance. There is inherent uncertainty associated with key assumptions and estimates used in our impairment testing, including the impact of macroeconomic conditions.
As a result of our 2024 annual goodwill impairment testing, we determined that the fair value of our Americas reporting unit exceeded its carrying value by 132% at the 2024 measurement date, and therefore no impairment was indicated. Improved expectations of financial performance for the Americas reporting unit and a lower discount rate contributed to a higher estimated fair value of our Americas reporting unit for 2024. The consolidated goodwill balance of $99.9 million at December 29, 2024 is allocated entirely to our Americas reporting unit.
As a result of our 2023 annual goodwill testing, we determined that the fair value of our Americas reporting unit exceeded its carrying value by 71% at the 2023 measurement date, and therefore no impairment was indicated. The goodwill balance of $105.4 million at December 31, 2023, was allocated entirely to our Americas reporting unit.
During the fourth quarter of 2022, the Company performed the annual goodwill impairment test, consistent with prior years. The Company performed this test at the reporting unit level, which is an operating segment or one level below the operating segment level. In performing the impairment testing for each reporting unit, the Company prepared valuations of reporting units on both a market comparable methodology and an income methodology, and those valuations were compared with the respective carrying values of the reporting units to determine whether any goodwill impairment existed. In preparing the valuations, past, present and future expectations of performance were considered, including the ongoing impact of the COVID-19 pandemic in 2022. As a result of our 2022 testing, we determined that the carrying value of our EMEA reporting unit exceeded its fair value and that the associated goodwill was impaired at the measurement date. We recorded a goodwill impairment charge of $29.4 million in 2022 to write off all the goodwill allocated to our EMEA reporting unit. Macroeconomic factors, including inflation, foreign currency exchange rates, and the expected impact to planned revenue and operating income contributed to the lower estimated fair value of our EMEA reporting unit. Higher discount rates also contributed to the lower fair value of our reporting units. We determined that the fair value of our Americas reporting unit exceeded its carrying value by 71% at the 2022 measurement date, and therefore no impairment was indicated. The remaining goodwill balance of $102.4 million at January 1, 2023, was allocated to our Americas reporting unit. The goodwill balance allocated to our Asia-Pacific reporting unit was previously written off in connection with the 2020 goodwill impairment.
The ending balances and the changes in the carrying amounts of goodwill allocated to each reportable segment for the years ended December 29, 2024 and December 31, 2023 are as follows(1):
| | | | | | | | | | | | | | | | | |
| AMS | | EAAA | | Total |
| (in thousands) |
| Goodwill balance, at January 1, 2023 | $ | 102,417 | | | $ | — | | | $ | 102,417 | |
Foreign currency translation(2) | 3,031 | | | — | | | 3,031 | |
| Goodwill balance, at December 31, 2023 | 105,448 | | | — | | | 105,448 | |
Foreign currency translation(2) | (5,561) | | | — | | | (5,561) | |
| Goodwill balance, at December 29, 2024 | $ | 99,887 | | | $ | — | | | $ | 99,887 | |
(1) Goodwill balances are presented net of cumulative impairment losses of $358.5 million as of December 29, 2024. The cumulative impairment losses include impairment charges recognized prior to 2020 related to discontinued operations that were allocated to the current reportable segments on a proportionate basis.
(2) A portion of the goodwill balance allocated to the AMS reportable segment is comprised of goodwill denominated in foreign currency attributable to the nora acquisition.
Other Intangible Assets
During the fourth quarter of 2024 and 2023, the Company performed its annual impairment testing of the trademark and trade name intangible assets and determined that no impairment existed at the 2024 or 2023 measurement dates.
In the fourth quarter of 2022, we determined that the trademark and trade name intangible assets related to the acquired nora business were impaired and recognized an impairment loss of $6.3 million. The impairment loss consisted of charges of $3.6 million and $2.7 million attributable to the AMS and EAAA reportable segments, respectively.
The Company’s intangible assets other than goodwill consisted of the following as of December 29, 2024 and December 31, 2023:
| | | | | | | | | | | | | | | | | | | | | | | | | | | | | | | | | | | | | | | | | | | | | | | |
| December 29, 2024 | | December 31, 2023 |
| Gross Carrying Amount | | Accumulated Impairment | | Accumulated Amortization | | Net Carrying Amount | | Gross Carrying Amount | | Accumulated Impairment | | Accumulated Amortization | | Net Carrying Amount |
| (in thousands) |
Intangible assets subject to amortization(1): | | | | | | | | | | | | | | | |
| Technology | $ | 34,429 | | | $ | — | | | $ | (31,522) | | | $ | 2,907 | | | $ | 37,198 | | | $ | — | | | $ | (28,845) | | | $ | 8,353 | |
| Other | 723 | | | (478) | | | (34) | | | 211 | | | 734 | | | (478) | | | (20) | | | 236 | |
| Total intangible assets subject to amortization | 35,152 | | | (478) | | | (31,556) | | | 3,118 | | | 37,932 | | | (478) | | | (28,865) | | | 8,589 | |
| | | | | | | | | | | | | | | | |
Indefinite-lived intangible assets(1): | | | | | | | | | | | | | | | |
| Trademarks and trade names | 56,236 | | | (11,081) | | | — | | | 45,155 | | | 58,747 | | | (11,081) | | | — | | | 47,666 | |
| | | | | | | | | | | | | | | | |
| Total intangible assets | $ | 91,388 | | | $ | (11,559) | | | $ | (31,556) | | | $ | 48,273 | | | $ | 96,679 | | | $ | (11,559) | | | $ | (28,865) | | | $ | 56,255 | |
(1) Certain intangible asset balances are subject to changes attributable to foreign currency translation.
Amortization expense related to intangible assets during the years 2024, 2023 and 2022 was $5.2 million, $5.2 million and $5.0 million, respectively, and is recorded in cost of sales in the consolidated statements of operations. Amortization expense related to intangible assets is expected to be approximately $3.0 million for fiscal year 2025. The developed technology intangible asset is amortized over its estimated useful life, which ends in fiscal year 2025.
NOTE 13 – PREFERRED STOCK
The Company is authorized to designate and issue up to 5,000,000 shares of $1.00 par value preferred stock in one or more series and to determine the rights and preferences of each series, to the extent permitted by the Articles of Incorporation, and to fix the terms of such preferred stock without any vote or action by the shareholders. The issuance of any series of preferred stock may have an adverse effect on the rights of holders of common stock and could decrease the amount of earnings and assets available for distribution to holders of common stock. In addition, any issuance of preferred stock could have the effect of delaying, deferring or preventing a change in control of the Company. As of December 29, 2024, and December 31, 2023, there were no shares of preferred stock issued.
NOTE 14 – SHAREHOLDERS’ EQUITY
The Company is authorized to issue 120 million shares of $0.10 par value Common Stock. The Company’s Common Stock is traded on the Nasdaq Global Select Market under the symbol TILE.
The Company paid cash dividends totaling $0.04 per share, including participating securities, in each of years 2024, 2023 and 2022. The future declaration and payment of dividends is at the discretion of the Company’s Board, and depends upon, among other things, the Company’s investment policy and opportunities, results of operations, financial condition, cash requirements, future prospects, and other factors that may be considered relevant at the time of the Board’s determination. Such other factors include limitations contained in the agreement for its Syndicated Credit Facility and the indenture governing its 5.50% Senior Notes due 2028, which specify conditions as to when any dividend payments may be made. As such, the Company may discontinue its dividend payments in the future if its Board determines that a cessation of dividend payments is appropriate in light of the factors indicated above.
In the second quarter of 2022, the Company adopted a new share repurchase program in which the Company is authorized to repurchase up to $100 million of its outstanding shares of common stock. The program has no specific expiration date. No shares of common stock were repurchased pursuant to this program during 2024 or 2023. During 2022, the Company repurchased and retired an aggregate of 1,383,682 shares, at a weighted average price of $12.41 per share, pursuant to this program. All treasury stock is accounted for using the cost method.
The following tables depict the activity in the accounts which make up shareholders’ equity for fiscal years 2024, 2023 and 2022:
| | | | | | | | | | | | | | | | | | | | | | | | | | | | | | | | | | | | | | | | | |
| | SHARES | | COMMON STOCK | | ADDITIONAL
PAID-IN
CAPITAL | | RETAINED
EARNINGS | | PENSION
LIABILITY | | FOREIGN
CURRENCY
TRANSLATION
ADJUSTMENT | | TOTAL |
| | (in thousands) |
| Balance, at December 31, 2023 | 58,112 | | | $ | 5,811 | | | $ | 252,909 | | | $ | 320,833 | | | $ | (34,016) | | | $ | (119,590) | | | $ | 425,947 | |
| Net income | — | | | — | | | — | | | 86,946 | | | — | | | — | | | 86,946 | |
| Issuances of stock related to restricted share units and performance shares | 479 | | | 48 | | | (48) | | | — | | | — | | | — | | | — | |
| Restricted stock issuances | 58 | | | 6 | | | 941 | | | — | | | — | | | — | | | 947 | |
| Unrecognized compensation expense related to restricted stock awards | — | | | — | | | (946) | | | — | | | — | | | — | | | (946) | |
| Cash dividends declared | — | | | — | | | — | | | (2,338) | | | — | | | — | | | (2,338) | |
| Compensation expense related to share-based plans, net of forfeitures and shares received for tax withholdings | (345) | | | (35) | | | 8,172 | | | — | | | — | | | — | | | 8,137 | |
| Pension liability adjustment | — | | | — | | | — | | | — | | | (5,818) | | | — | | | (5,818) | |
| Foreign currency translation adjustment | — | | | — | | | — | | | — | | | — | | | (23,727) | | | (23,727) | |
| Balance, at December 29, 2024 | 58,304 | | | $ | 5,830 | | | $ | 261,028 | | | $ | 405,441 | | | $ | (39,834) | | | $ | (143,317) | | | $ | 489,148 | |
| | | | | | | | | | | | | | | | | | | | | | | | | | | | | | | | | | | | | | | | | | | | | | | |
| | SHARES | | COMMON STOCK | | ADDITIONAL
PAID-IN
CAPITAL | | RETAINED
EARNINGS | | PENSION
LIABILITY | | FOREIGN
CURRENCY
TRANSLATION
ADJUSTMENT | | CASH FLOW
HEDGE | | TOTAL |
| | (in thousands) |
| Balance, at January 1, 2023 | 58,106 | | | $ | 5,811 | | | $ | 244,159 | | | $ | 278,639 | | | $ | (27,548) | | | $ | (138,775) | | | $ | (749) | | | $ | 361,537 | |
| Net income | — | | | — | | | — | | | 44,517 | | | — | | | — | | | — | | | 44,517 | |
| Issuances of stock related to restricted share units and performance shares | 85 | | | 8 | | | (8) | | | — | | | — | | | — | | | — | | | — | |
| Restricted stock issuances | 107 | | | 11 | | | 749 | | | — | | | — | | | — | | | — | | | 760 | |
| Unrecognized compensation expense related to restricted stock awards | — | | | — | | | (760) | | | — | | | — | | | — | | | — | | | (760) | |
| Cash dividends declared | — | | | — | | | — | | | (2,323) | | | — | | | — | | | — | | | (2,323) | |
| Compensation expense related to share-based plans, net of forfeitures and shares received for tax withholdings | (186) | | | (19) | | | 8,769 | | | — | | | — | | | — | | | — | | | 8,750 | |
| Pension liability adjustment | — | | | — | | | — | | | — | | | (6,468) | | | — | | | — | | | (6,468) | |
| Foreign currency translation adjustment | — | | | — | | | — | | | — | | | — | | | 19,185 | | | — | | | 19,185 | |
| Reclassification out of accumulated other comprehensive loss – discontinued cash flow hedge | — | | | — | | | — | | | — | | | — | | | — | | | 749 | | | 749 | |
| Balance, at December 31, 2023 | 58,112 | | | $ | 5,811 | | | $ | 252,909 | | | $ | 320,833 | | | $ | (34,016) | | | $ | (119,590) | | | $ | — | | | $ | 425,947 | |
| | | | | | | | | | | | | | | | | | | | | | | | | | | | | | | | | | | | | | | | | | | | | | | |
| | SHARES | | COMMON STOCK | | ADDITIONAL
PAID-IN
CAPITAL | | RETAINED
EARNINGS | | PENSION
LIABILITY | | FOREIGN
CURRENCY
TRANSLATION
ADJUSTMENT | | CASH FLOW
HEDGE | | TOTAL |
| | (in thousands) |
| Balance, at January 2, 2022 | 59,055 | | | $ | 5,905 | | | $ | 253,110 | | | $ | 261,434 | | | $ | (53,888) | | | $ | (100,441) | | | $ | (2,722) | | | $ | 363,398 | |
| Net income | — | | | — | | | — | | | 19,560 | | | — | | | — | | | — | | | 19,560 | |
| Restricted stock issuances | 501 | | | 50 | | | 6,499 | | | — | | | — | | | — | | | — | | | 6,549 | |
| Unrecognized compensation expense related to restricted stock awards | — | | | — | | | (6,549) | | | — | | | — | | | — | | | — | | | (6,549) | |
| Cash dividends declared | — | | | — | | | — | | | (2,355) | | | — | | | — | | | — | | | (2,355) | |
| Compensation expense related to share-based plans, net of forfeitures | (66) | | | (6) | | | 8,132 | | | — | | | — | | | — | | | — | | | 8,126 | |
| Share repurchases | (1,384) | | | (138) | | | (17,033) | | | — | | | — | | | — | | | — | | | (17,171) | |
| Pension liability adjustment | — | | | — | | | — | | | — | | | 26,340 | | | — | | | — | | | 26,340 | |
| Foreign currency translation adjustment | — | | | — | | | — | | | — | | | — | | | (38,334) | | | — | | | (38,334) | |
| Reclassification out of accumulated other comprehensive loss – discontinued cash flow hedge | — | | | — | | | — | | | — | | | — | | | — | | | 1,973 | | | 1,973 | |
| Balance, at January 1, 2023 | 58,106 | | | $ | 5,811 | | | $ | 244,159 | | | $ | 278,639 | | | $ | (27,548) | | | $ | (138,775) | | | $ | (749) | | | $ | 361,537 | |
Stock Incentive Plan
The Company has a stock incentive plan under which a committee of independent directors is authorized to grant directors and key employees, including officers, restricted stock, incentive stock options, nonqualified stock options, stock appreciation rights, restricted share units and performance shares.
In May 2024, the shareholders of the Company approved the adoption of an amendment and restatement of the Interface, Inc. 2020 Omnibus Stock Incentive Plan (the “Amended and Restated Plan”). The aggregate number of shares of common stock that may be issued or transferred under the Amended and Restated Plan on or after the effective date of the plan is the sum of 3,200,000 shares not previously authorized for issuance under any plan, plus the number of shares remaining available for issuance under the original Interface, Inc. 2020 Omnibus Stock Incentive Plan (the “Original Plan”) but not subject to outstanding awards under the Original Plan immediately prior to the effective date of the Amended and Restated Plan, plus the number of shares remaining available for issuance pursuant to the outstanding awards under the Original Plan immediately prior to the effective date of the Amended and Restated Plan, including any shares that become available due to the forfeiture, termination or cancellation of such awards. No award may be granted after the tenth anniversary of the effective date of the Amended and Restated Plan.
Accounting standards require that the Company measure the cost of employee services received in exchange for an award of equity instruments based on the grant date fair market value of the award. That expense will be recognized over the period that the employee is required to provide the services – the requisite service period (usually the vesting period) – in exchange for the award. For certain restricted stock and restricted share unit awards with a graded vesting schedule, the Company has elected to recognize compensation expense on a straight-line basis over the requisite service period for the entire award.
Restricted Stock Awards
During fiscal years 2024, 2023 and 2022, the Company granted restricted stock awards totaling 58,400, 107,100, and 500,800 shares, respectively, of Common Stock. The weighted average grant date fair value of restricted stock awards granted during 2024, 2023 and 2022 was $16.22, $7.10, and $13.08, respectively. These awards (or a portion thereof) vest with respect to each recipient over a one to three-year period from the date of grant, provided the individual remains in the employment or service of the Company as of the vesting date. Additionally, certain awards (or a portion thereof) could vest earlier in the event of a change in control of the Company or upon involuntary termination without cause.
Compensation expense related to awards of restricted stock was $2.3 million, $4.5 million and $5.3 million for 2024, 2023 and 2022, respectively. These grants are made primarily to the board of directors and executive-level personnel at the Company, and as a result, no compensation costs have been capitalized. The Company has reduced its expense for any restricted stock forfeited during the period. The expense related to awards of restricted stock is captured in SG&A expenses in the consolidated statements of operations.
The following table summarizes restricted stock outstanding as of December 29, 2024, as well as activity during the year:
| | | | | | | | | | | |
| | Restricted Shares | | Weighted Average Grant Date Fair Value |
| Outstanding at December 31, 2023 | 691,600 | | | $ | 12.55 | |
| Granted | 58,400 | | | 16.22 | |
| Vested | (504,700) | | | 12.31 | |
| Forfeited or canceled | (3,000) | | | 13.19 | |
| Outstanding at December 29, 2024 | 242,300 | | | $ | 13.92 | |
As of December 29, 2024, the unrecognized total compensation cost related to unvested restricted stock was $0.4 million. That cost is expected to be recognized over a weighted-average remaining vesting period of 0.3 years.
Restricted Share Unit Awards
During fiscal year 2024 and 2023, the Company granted awards for 407,300 and 596,200 restricted share units to certain employees pursuant to the Company’s stock incentive plan. There were no restricted share unit awards granted during 2022. The weighted average grant date fair value of the restricted share units granted during 2024 and 2023 was $13.38 and $10.36 respectively. Each restricted share unit represents one share of the Company’s common stock to be issued to the award recipient once the vesting criteria have been satisfied. Awards of restricted share units have a graded vesting schedule over a two to three-year period from the date of grant, provided the individual remains in the employment or service of the Company as of each vesting date. Additionally, certain awards (or a portion thereof) could vest earlier in the event of a change in control of the Company, upon involuntary termination without cause, or upon retirement provided certain eligibility criteria are met.
Compensation expense related to the restricted share units was $3.5 million and $1.9 million for 2024 and 2023, respectively. There was no compensation expense related to restricted share unit awards during 2022. These grants are made primarily to executive-level personnel at the Company and, as a result, no compensation costs have been capitalized. The Company has reduced its expense for any restricted share units forfeited during the period. The expense related to awards of restricted share units is captured primarily in SG&A expenses in the consolidated statements of operations.
The following table summarizes restricted share units outstanding as of December 29, 2024, as well as activity during the year:
| | | | | | | | | | | |
| Restricted Share Units | | Weighted Average Grant Date Fair Value |
| Outstanding at December 31, 2023 | 583,400 | | | $ | 10.35 | |
| Granted | 407,300 | | | 13.38 | |
| Vested | (157,200) | | | 10.77 | |
| Forfeited or canceled | (10,200) | | | 11.41 | |
| Outstanding at December 29, 2024 | 823,300 | | | $ | 11.76 | |
As of December 29, 2024, the unrecognized total compensation cost related to unvested restricted share units was $6.0 million. That cost is expected to be recognized over a weighted-average remaining vesting period of 1.8 years.
Performance Share Awards
In each of the years 2024, 2023 and 2022, the Company issued awards of performance shares to certain employees. These awards vest based on the achievement of certain performance-based goals over a performance period of three years, subject to (among other things) the employee’s continued employment through the last date of the performance period and will be settled in shares of our common stock or in cash at the Company’s election. The number of shares that may be issued in settlement of the performance shares to the award recipients may be greater (up to 200%) or lesser than the nominal award amount depending on actual performance achieved as compared to the performance targets set forth in the awards. The expense related to these performance shares is captured in SG&A expenses in the consolidated statements of operations. The Company evaluates the probability of achieving the performance-based goals as of the end of each reporting period and adjusts compensation expense based on this assessment.
The following table summarizes the performance shares outstanding as of December 29, 2024, as well as the activity during the year:
| | | | | | | | | | | |
| Performance Shares | | Weighted Average Grant Date Fair Value |
| Outstanding at December 31, 2023 | 1,115,000 | | | $ | 12.36 | |
| Granted | 402,800 | | | 13.24 | |
| Vested | (322,200) | | | 13.90 | |
| Forfeited or canceled | (23,900) | | | 12.53 | |
| Outstanding at December 29, 2024 | 1,171,700 | | | $ | 12.23 | |
Compensation expense related to the performance shares for 2024, 2023 and 2022 was $7.1 million, $3.9 million and $3.2 million, respectively. The Company has reduced its expense for any performance shares forfeited during the period. Unrecognized compensation expense related to these performance shares was approximately $7.9 million as of December 29, 2024. The amount and timing of future compensation expense will depend on the performance of the Company. The compensation expense related to these outstanding performance shares is expected to be recognized over a weighted-average remaining vesting period of 1.8 years.
The tax benefit recognized with respect to restricted stock, restricted share units and performance shares was $1.7 million, $0.9 million, and $0.8 million in 2024, 2023 and 2022, respectively.
NOTE 15 – EARNINGS PER SHARE
The Company computes basic earnings per share (“EPS”) by dividing net income by the weighted average common shares outstanding, including participating securities outstanding, during the period as discussed below. Diluted EPS reflects the potential dilution beyond shares for basic EPS that could occur if securities or other contracts to issue common stock were exercised, converted into common stock or resulted in the issuance of common stock that would have shared in the Company’s earnings.
The Company includes all unvested stock awards that contain non-forfeitable rights to dividends or dividend equivalents, whether paid or unpaid, in the number of shares outstanding for basic EPS as these awards are considered participating securities. Unvested share-based awards of restricted stock are paid dividends equally with all other shares of common stock and are considered participating securities. As a result, the Company includes all outstanding restricted stock awards in the calculation of basic and diluted EPS. Any unvested share-based awards considered non-participating securities (restricted share units and performance shares) are included in diluted EPS calculations when the inclusion of these shares would be dilutive. The following table shows the computation of basic and diluted EPS:
| | | | | | | | | | | | | | | | | |
| | Fiscal Year |
| 2024 | | 2023 | | 2022 |
| (in thousands, except per share data) |
Numerator:(1) | | | | | |
| Net income | $ | 86,946 | | | $ | 44,517 | | | $ | 19,560 | |
| | | | | | |
| Denominator: | | | | | |
| Weighted average shares outstanding | 57,937 | | | 57,349 | | | 57,893 | |
| Participating securities | 345 | | | 743 | | 972 | |
| Shares for basic EPS | 58,282 | | | 58,092 | | | 58,865 | |
| Dilutive effect of share-based awards (non-participating securities) | 589 | | | 243 | | | — | |
| Shares for diluted EPS | 58,871 | | | 58,335 | | | 58,865 | |
| | | | | |
| Basic EPS | $ | 1.49 | | | $ | 0.77 | | | $ | 0.33 | |
| Diluted EPS | $ | 1.48 | | | $ | 0.76 | | | $ | 0.33 | |
(1) Including income attributable to participating securities, which was $0.5 million, $0.6 million, and $0.3 million, for fiscal years 2024, 2023 and 2022, respectively.
For 2024, there were no securities excluded from the computation of diluted EPS that would have been antidilutive. For 2023, 657,391 non-participating securities that could potentially dilute basic EPS in the future, consisting of restricted share units and performance shares, were excluded from the computation of diluted EPS as these securities would have been antidilutive for the respective period.
NOTE 16 – RESTRUCTURING AND OTHER
Restructuring, asset impairment, other (gains) and charges by reportable segment are presented as follows:
| | | | | | | | | | | | | | | | | |
| Fiscal Year |
| 2024 | | 2023 | | 2022 |
| (in thousands) |
| AMS | $ | — | | | $ | — | | | $ | — | |
| EAAA | — | | | (2,502) | | | 1,965 | |
| Total restructuring, asset impairment, other (gains) and charges | $ | — | | | $ | (2,502) | | | $ | 1,965 | |
2021 Restructuring Plan
On September 8, 2021, the Company committed to a restructuring plan that focused on efforts to improve efficiencies and decrease costs across its worldwide operations. The plan involved a reduction of approximately 188 employees and the closure of the Company’s manufacturing facility in Thailand at the end of the first quarter of 2022.
During 2022, in conjunction with the closure of its Thailand facility, the Company recorded a write-down of inventory of $2.5 million within cost of sales in the consolidated statements of operations.
The Company recognized a gain of $2.7 million on the sale of the Thailand facility during 2023. See Note 7 entitled “Property, Plant and Equipment” for additional information. This restructuring plan was completed following the sale of the Thailand Facility.
NOTE 17 – INCOME TAXES
Income before income taxes consisted of the following:
| | | | | | | | | | | | | | | | | |
| | Fiscal Year |
| | 2024 | | 2023 | | 2022 |
| | (in thousands) |
| U.S. operations | $ | 37,060 | | | $ | 3,611 | | | $ | 11,758 | |
| Foreign operations | 76,494 | | | 60,043 | | | 30,159 | |
| Income before income taxes | $ | 113,554 | | | $ | 63,654 | | | $ | 41,917 | |
Provisions for federal, foreign and state income taxes in the consolidated statements of operations consisted of the following components:
| | | | | | | | | | | | | | | | | |
| | Fiscal Year |
| | 2024 | | 2023 | | 2022 |
| | (in thousands) |
| Current expense: | | | | | |
| Federal | $ | 7,599 | | | $ | 5,523 | | | $ | 1,624 | |
| Foreign | 20,982 | | | 18,330 | | | 20,903 | |
| State | 2,481 | | | 2,167 | | | 1,307 | |
| Current expense | 31,062 | | | 26,020 | | | 23,834 | |
| | | | | | |
| Deferred (benefit) expense: | | | | | |
| Federal | (3,279) | | | (4,810) | | | 346 | |
| Foreign | (841) | | | (1,212) | | | (2,053) | |
| State | (334) | | | (861) | | | 230 | |
| Deferred benefit | (4,454) | | | (6,883) | | | (1,477) | |
| | | | | | |
| Total income tax expense | $ | 26,608 | | | $ | 19,137 | | | $ | 22,357 | |
The Company’s effective tax rate was 23.4%, 30.1% and 53.3% for fiscal years 2024, 2023 and 2022, respectively. The following summary reconciles income taxes at the U.S. federal statutory rate of 21% applicable for all periods presented to the Company’s actual income tax expense:
| | | | | | | | | | | | | | | | | |
| | Fiscal Year |
| | 2024 | | 2023 | | 2022 |
| | (in thousands) |
| Income taxes at U.S. federal statutory rate | $ | 23,846 | | | $ | 13,367 | | | $ | 8,803 | |
| Increase (decrease) in taxes resulting from: | | | | | |
| State income taxes, net of federal tax effect | 2,319 | | | (432) | | | 817 | |
| Non-deductible business expenses | 940 | | | 747 | | | 237 | |
| Non-deductible employee compensation | 1,587 | | | 1,681 | | | 1,678 | |
| Tax effects of Company-owned life insurance | (576) | | | (587) | | | 612 | |
| Tax effects of undistributed earnings from foreign subsidiaries not deemed to be indefinitely reinvested | 443 | | | 779 | | | 1,123 | |
| Foreign and U.S. tax effects attributable to foreign operations | 4,532 | | | 1,537 | | | 3,528 | |
| Expiring tax attributes | 4,125 | | | 3,780 | | | — | |
| Valuation allowance effect | (7,330) | | | (879) | | | 2,898 | |
| Research and development tax credits | (703) | | | (820) | | | (917) | |
| Goodwill impairment | — | | | — | | | 6,171 | |
| Foreign tax rate change related to UK pension | (2,493) | | | — | | | — | |
| Unrecognized tax benefits | (135) | | | (79) | | | (2,463) | |
| Other | 53 | | | 43 | | | (130) | |
| Income tax expense | $ | 26,608 | | | $ | 19,137 | | | $ | 22,357 | |
On August 16, 2022, the Inflation Reduction Act of 2022 (“Inflation Reduction Act”) was signed into law, with tax provisions primarily focused on implementing a 15% minimum tax on global adjusted financial statement income (“AFSI”) for corporations with average AFSI exceeding $1 billion over a three-year period, a 1% excise tax on share repurchases and various climate and clean energy tax incentives. The Inflation Reduction Act did not have a material impact on the Company’s financial statements for the year ended December 29, 2024.
On December 20, 2021, the Organization for Economic Co-operation and Development (“OECD”) published Pillar Two Model Rules defining the global minimum tax, which calls for the taxation of large corporations at a minimum rate of 15%. The OECD has since issued administrative guidance providing transition and safe harbor rules around the implementation of the Pillar Two global minimum tax. Many non-U.S. tax jurisdictions have either recently enacted legislation to adopt certain components of the Pillar Two Model Rules beginning in 2024 (including the European Union Member States) with the adoption of additional components in later years or announced their plans to enact legislation in future years. For fiscal year 2024, we expect to meet the Transitional Country-by-Country (CbCR) Safe Harbor rules for most if not all jurisdictions and do not expect these provisions to have a material impact on the Company’s financial statements. We will continue to closely monitor ongoing developments and evaluate any potential impact on future periods.
Deferred income taxes for the years ended December 29, 2024 and December 31, 2023, reflect the net tax effects of temporary differences between the carrying amounts of assets and liabilities for financial reporting purposes and the amounts used for income tax purposes.
The temporary differences that give rise to significant portions of the deferred tax assets and liabilities are as follows:
| | | | | | | | | | | |
| | End of Fiscal Year |
| | 2024 | | 2023 |
| | (in thousands) |
Deferred tax assets(1) | | | |
| Lease liability | $ | 22,329 | | | $ | 25,164 | |
| Net operating loss and interest carryforwards | 7,964 | | | 9,587 | |
| Federal tax credit carryforwards | 4,036 | | | 7,876 | |
| Deferred compensation | 16,521 | | | 16,517 | |
| Pensions | 4,982 | | | 6,304 | |
| Property and equipment | 438 | | | 554 | |
| Inventory | 3,121 | | | 6,657 | |
| Prepaids, accruals and reserves | 9,235 | | | 8,147 | |
| Capitalized costs | 10,327 | | | 9,442 | |
| Deferred tax asset, gross | 78,953 | | | 90,248 | |
| Valuation allowance | (10,028) | | | (17,357) | |
| Deferred tax asset, net | $ | 68,925 | | | $ | 72,891 | |
| | | | |
Deferred tax liabilities(1) | | | |
| Property and equipment | $ | 24,899 | | | $ | 25,216 | |
| Inventory | 4,014 | | | 3,616 | |
| Intangible assets | 20,970 | | | 24,411 | |
| Lease asset | 20,887 | | | 23,868 | |
| Pensions | 3,866 | | | 6,309 | |
| Foreign currency | 556 | | | 686 | |
| Foreign withholding and U.S. state taxes on unremitted earnings | 773 | | | 725 | |
| Other | 158 | | | 171 | |
| Deferred tax liabilities | 76,123 | | | 85,002 | |
| | | | |
| Net deferred tax liabilities | $ | 7,198 | | | $ | 12,111 | |
(1) In prior year, certain deferred tax asset and deferred tax liability balances by jurisdiction were presented as a net position. In the current period presentation, deferred tax assets and deferred tax liabilities are presented gross. Amounts above for 2023 have been recast to conform to the current period presentation. These reclassifications change the previously disclosed gross deferred tax asset and gross deferred tax liability positions. However, the net deferred tax liability position presented in the prior year remains unchanged.
Management believes, based on the Company’s history of taxable income and expectations for the future, that it is more likely than not that future taxable income will be sufficient to fully utilize the federal deferred tax assets at December 29, 2024.
As of December 29, 2024, the Company has approximately $4.0 million of foreign tax credit carryforwards with expiration dates through 2033. A full valuation allowance has been provided as the Company does not expect to utilize these foreign tax credits before the expiration dates. As of December 29, 2024, the Company has approximately $190.1 million in state net operating loss carryforwards relating to continuing operations with expiration dates through 2044 and has provided a valuation allowance against $127.6 million of such losses, which the Company does not expect to utilize. In addition, as of December 29, 2024, the Company has approximately $11.0 million in state net operating loss carryforwards relating to discontinued operations against which a full valuation allowance has been provided.
During fiscal year 2024, the Company had approximately $4.1 million in tax attributes related to foreign tax credit carryovers that expired. The expiring foreign tax credit carryover attributes had a full valuation allowance, as a result, the expiration of these tax attributed did not have an impact on the Company’s effective tax rate for fiscal year 2024.
As of December 29, 2024, and December 31, 2023, non-current deferred tax assets were reduced by approximately $2.6 million and $2.8 million of unrecognized tax benefits, respectively.
Historically, the Company has not provided for U.S. income taxes and foreign withholding taxes on the undistributed accumulated earnings of its foreign subsidiaries, with the exception of its Canada and Thailand subsidiaries and a specific portion of the undistributed earnings of foreign subsidiaries outside of Canada and Thailand, because such earnings were deemed to be permanently reinvested. The Company provided for U.S. income taxes and foreign withholding taxes on the undistributed earnings that were not permanently reinvested at December 29, 2024 and December 31, 2023.
Although the Tax Cuts and Jobs Act of 2017 (the “Tax Act”) created a dividends received deduction that generally eliminates additional U.S. federal income taxes on dividends from our foreign subsidiaries, the Company continues to assert that all of its undistributed earnings in its non-U.S. subsidiaries, excluding undistributed earnings for which U.S. income taxes and foreign withholding taxes have been provided, are indefinitely reinvested outside of the U.S. The Company expects that domestic cash resources will be sufficient to fund its domestic operations and cash commitments in the future. In the event the Company determines not to continue to assert that all or part of its undistributed earnings in its non-U.S. subsidiaries are permanently reinvested, an actual repatriation of earnings from its non-U.S. subsidiaries could still be subject to additional foreign withholding and U.S. state taxes, the determination of which is not practicable.
The Company’s federal income tax returns are subject to examination for the years 2021 to the present. The Company files returns in numerous state and local jurisdictions and in general it is subject to examination by the state tax authorities for the years 2019 to the present. The Company files returns in numerous foreign jurisdictions and in general it is subject to examination by the foreign tax authorities for the years 2013 to the present.
In 2023, the Company filed requests with both the Competent Authority in the Netherlands and in the U.K. to initiate a MAP for tax years 2018 through 2020 related to the double taxation arising from Her Majesty’s Revenue & Customs (“HMRC”) adjusting the interest rate applied in the intra-group financing arrangement between the Company’s subsidiary in the U.K. and another in the Netherlands. During 2023, the MAP was concluded, and the Company recognized the related adjustments in its 2023 financial results. The recognition of the adjustments did not have a material impact on the Company’s effective tax rate or its financial position.
As of December 29, 2024, and December 31, 2023, the Company had $4.8 million and $4.9 million, respectively, of unrecognized tax benefits, including accrued interest and penalties. While it is reasonably possible that some of the unrecognized tax benefits will be recognized within the next 12 months, the Company does not expect the recognition of such amounts will have a material impact on the Company’s financial results.
If the Company were to prevail on all uncertain tax positions, there would be a favorable impact on the Company’s effective tax rate of approximately $4.8 million in future periods. If the unrecognized tax positions are not favorably settled, $2.2 million of the total amount of unrecognized tax benefits would require the use of cash in future periods. The timing of the ultimate resolution of the Company’s tax matters and the payment and receipt of related cash is dependent on a number of factors, many of which are outside the Company’s control.
The Company recognizes accrued interest and income tax penalties related to unrecognized tax benefits as a component of income tax expense. As of December 29, 2024 and December 31, 2023, the Company had accrued interest and penalties of $0.4 million for both periods, which are included in the total unrecognized tax benefit noted above.
A reconciliation of the beginning and ending amounts of gross unrecognized tax benefits is as follows:
| | | | | | | | | | | | | | | | | |
| | Fiscal Year |
| | 2024 | | 2023 | | 2022 |
| | (in thousands) |
Balance at beginning of year(1) | $ | 4,532 | | | $ | 5,352 | | | $ | 7,360 | |
| Increases related to tax positions taken during the current year | 316 | | | 320 | | | 342 | |
| Increases related to tax positions taken during the prior years | — | | | 19 | | | 109 | |
| Decreases related to tax positions taken during the prior years | (208) | | | (30) | | | (233) | |
| Decreases related to lapse of applicable statute of limitations | (289) | | | (1,142) | | | (2,225) | |
| Changes due to foreign currency translation | — | | | 13 | | | (1) | |
Balance at end of year(1) | $ | 4,351 | | | $ | 4,532 | | | $ | 5,352 | |
(1) In prior years, interest and penalties were included in the reconciliation of the beginning and ending amounts of gross unrecognized tax benefits. In the current period, interest and penalties are excluded from the reconciliation of the beginning and ending amounts of gross unrecognized tax benefits. Amounts for fiscal years 2023 and 2022 above have been recast to conform to the current period presentation. These reclassifications to the reconciliation of the beginning and ending amounts of gross unrecognized tax benefits do not impact the accrual as recorded in the consolidated balance sheets.
NOTE 18 – COMMITMENTS AND CONTINGENCIES
From time to time, the Company is a party to legal proceedings, whether arising in the ordinary course of business or otherwise. One of the proceedings the Company is involved in is summarized below.
Lawsuit by Former CEO in Connection with Termination
On January 19, 2020, the Company’s Board of Directors voted to terminate for cause the employment of Jay D. Gould, then President and Chief Executive Officer, effective immediately, for violations of the Company’s working environment policies. On February 14, 2020, Mr. Gould filed a lawsuit against the Company in the United States District Court of the Northern District of Georgia, Gould v. Interface, Inc., Case No. 1:20-cv-00695. In his lawsuit, Mr. Gould asserted several claims against the Company in connection with his termination, including that the termination was a wrongful retaliation against Mr. Gould and breached his employment contract with the Company, that public statements made by the Company in connection with his termination defamed Mr. Gould (two counts) and that the Company’s investigation into Mr. Gould’s conduct that preceded the termination was negligently performed. Among other unspecified relief, Mr. Gould sought in excess of $10 million in damages for the breach of contract claim and $100 million for each of the other claims, as well as attorneys’ fees. The Court granted judgment on the pleadings in favor of the Company on Mr. Gould’s putative claim of negligent investigation, and Mr. Gould’s defamation claims were dismissed with prejudice by stipulation of the parties. On March 31, 2022, the Court entered an order granting the Company’s motion for summary judgment on all of Mr. Gould’s remaining claims, leaving only the Company’s counterclaim against Mr. Gould for breach of fiduciary duty pending in the District Court. An attempted interlocutory appeal by Mr. Gould of the summary judgment order was remanded by the 11th Circuit Court of Appeals back to the District Court as premature. Mr. Gould filed a motion for reconsideration of the Court’s grant of summary judgment in favor of the Company on Mr. Gould’s breach of contract claim. On July 31, 2023, the Court denied that motion for reconsideration. Also on July 31, 2023, the Company filed a motion to dismiss without prejudice its counterclaim against Mr. Gould for breach of fiduciary duty. On August 2, 2023, the Court granted that motion to dismiss, resulting in a final judgment in the trial court. The Court’s award of summary judgment in favor of the Company on Mr. Gould’s breach of contract claim was appealed by Mr. Gould to the U.S. Court of Appeals for the 11th Circuit. On November 19, 2024, oral arguments for Mr. Gould’s appeal were held in front of the U.S. Court of Appeals for the 11th Circuit. The Court of Appeals has not issued an opinion on Mr. Gould’s appeal, and it remains pending.
The Company believes Mr. Gould’s lawsuit and the appeal therefrom is without merit and intends to defend vigorously against it.
NOTE 19 – EMPLOYEE BENEFIT PLANS
Defined Contribution and Deferred Compensation Plans
The Company has a 401(k) retirement investment plan (“401(k) Plan”), which is open to all eligible U.S. employees with at least six months of service. The 401(k) Plan provides Company matching contributions on a sliding scale based on the level of the employee’s contribution. The Company may, at its discretion, make additional contributions to the 401(k) Plan based on the attainment of certain performance targets by its subsidiaries. The Company’s matching contributions are funded bi-monthly and totaled approximately $3.6 million, $3.4 million, and $3.3 million for the years 2024, 2023 and 2022, respectively. No discretionary contributions were made in 2024, 2023 or 2022.
Under the Company’s nonqualified savings plans (“NSPs”), the Company provides eligible employees the opportunity to enter into agreements for the deferral of a specified percentage of their compensation, as defined in the NSPs. The NSPs provide Company matching contributions on a sliding scale based on the level of the employee’s contribution. The obligations of the Company under such agreements to pay the deferred compensation in the future in accordance with the terms of the NSPs are unsecured general obligations of the Company. Participants have no right, interest or claim in the assets of the Company, except as unsecured general creditors. The Company has established a rabbi trust to hold, invest and reinvest deferrals and contributions under the NSPs. If a change in control of the Company occurs, as defined in the NSPs, the Company will contribute an amount to the rabbi trust sufficient to pay the obligation owed to each participant. The deferred compensation liability in connection with the NSPs totaled $30.3 million and $28.2 million at December 29, 2024 and December 31, 2023, respectively. The Company invests the deferrals in insurance instruments with readily determinable cash surrender values and in exchange traded mutual funds. The value of the insurance instruments was $21.8 million and $19.2 million as of December 29, 2024 and December 31, 2023, respectively. The fair value of the mutual fund investments at December 29, 2024 and December 31, 2023 was $8.7 million and $9.2 million, respectively.
Multiemployer Plan
On December 31, 2019, a plan amendment was executed to eliminate future service accruals in our defined benefit pension plan in the Netherlands (the “Dutch Plan”), which resulted in a curtailment of the plan. The Dutch Plan remains in existence and continues to pay vested benefits. Active participants no longer accrue benefits after December 31, 2019, and instead participate in the Industry-Wide Pension Fund (the “IWPF”) multi-employer plan beginning in fiscal year 2020. During 2024, 2023 and 2022, the Company recorded multi-employer pension expense related to multiemployer contributions of $2.9 million, $2.7 million and $2.4 million, respectively. The Company’s contributions into the IWPF are less than 5% of total plan contributions. The IWPF is more than 85% funded at the end of 2023, which is the latest date plan information is available. The IWPF multi-employer plan is not considered to be significant based on the funded status of the plan and our contributions.
Foreign Defined Benefit Plans
The Company has trusteed defined benefit retirement plans which cover many of its European employees. The benefits under these defined benefit retirement plans are generally based on years of service and the employee’s average monthly compensation. In connection with the nora acquisition in 2018, the Company acquired an additional defined benefit plan, which covers certain employees in Germany (the “nora Plan”). The nora plan has no plan assets. The Company uses a year-end measurement date for the plans, which is the closest practical date to the Company’s fiscal year end.
As described above, on December 31, 2019, participants in the Dutch Plan no longer accrue benefits under the plan and they became eligible to contribute to the IWPF beginning fiscal year 2020. Although the Dutch Plan is frozen to new participants, vested benefits will continue to be accounted for in accordance with applicable accounting standards for defined benefit plans. The Dutch Plan is financed by assets held in an insurance contract. The guarantee provision included in the insurance contract, that existed to fund any shortfall between the fair value of plan investments and the benefit obligation, expired on December 31, 2019. The Company is obligated to fund the cost to guarantee vested benefits. As of December 29, 2024, the under-funded status of the Dutch Plan of $5.1 million is recorded on the consolidated balance sheet in other long-term liabilities.
Pension expense for our three European defined benefit plans was $1.8 million, $1.3 million, and $2.0 million for the years 2024, 2023 and 2022, respectively. Plan assets are primarily invested in insurance contracts and fixed income securities. As of December 29, 2024, for the European plans, the Company had a net liability recorded of $19.7 million, an amount equal to their under-funded status, and had recorded in accumulated other comprehensive loss an amount equal to $36.3 million (net of taxes of approximately $8.1 million) related to the future amounts to be recorded in net periodic benefit costs. In the next fiscal year, approximately $1.3 million will be reclassified from accumulated other comprehensive loss into net periodic benefit cost.
The tables presented below set forth the funded status of the Company’s significant foreign defined benefit plans and required disclosures in accordance with applicable accounting standards:
| | | | | | | | | | | |
| | Fiscal Year |
| | 2024 | | 2023 |
| | (in thousands) |
| Change in benefit obligation: | | | |
| Benefit obligation, beginning of year | $ | 214,428 | | | $ | 195,440 | |
| Service cost | 500 | | | 458 | |
| Interest cost | 7,933 | | | 8,169 | |
| Benefits and expenses paid | (10,709) | | | (10,832) | |
| Actuarial loss (gain) | (4,321) | | | 12,760 | |
| Currency translation adjustment | (6,943) | | | 8,433 | |
| Benefit obligation, end of year | $ | 200,888 | | | $ | 214,428 | |
| | | | |
| Change in plan assets: | | | |
| Plan assets, beginning of year | $ | 199,348 | | | $ | 187,485 | |
| Actual return on assets | (5,144) | | | 11,596 | |
| Company contributions | 2,626 | | | 2,497 | |
| Benefits paid | (10,709) | | | (10,832) | |
| Currency translation adjustment | (4,968) | | | 8,602 | |
| Plan assets, end of year | $ | 181,153 | | | $ | 199,348 | |
| | | | |
| | | |
| Funded status | $ | (19,735) | | | $ | (15,080) | |
| | | | |
| Amounts recognized in consolidated balance sheets: | | | |
| Other assets | $ | 15,465 | | | $ | 25,235 | |
| Current liabilities | (1,170) | | | (1,182) | |
| Other long-term liabilities, net of current portion | (34,030) | | | (39,133) | |
| Under-funded status at end of fiscal year | $ | (19,735) | | | $ | (15,080) | |
| | | |
| Amounts recognized in accumulated other comprehensive loss, after tax: | | | |
| Unrecognized actuarial loss | $ | 36,323 | | | $ | 29,918 | |
| | | |
| Total amount recognized, end of year | $ | 36,323 | | | $ | 29,918 | |
| | | | |
| Accumulated benefit obligation | $ | 200,888 | | | $ | 214,428 | |
The above disclosure represents the aggregation of information related to the Company’s three defined benefit plans which cover many of its European employees. The decrease in the projected benefit obligation of $13.5 million for 2024 compared to prior year was primarily due to an increase in the weighted average discount rate used to measure the obligation and the impact of foreign currency translation due to the weakening of the Euro against the U.S. dollar in 2024. As of December 29, 2024, one of these plans, which primarily covers certain employees in the United Kingdom (the “UK Plan”), had assets in excess of the accumulated benefit obligation. The accumulated benefit obligation of the Dutch Plan exceeded plan assets as of December 29, 2024. The nora Plan is an unfunded defined benefit plan and the accumulated benefit obligation exceeded plan assets as of December 29, 2024. The following table summarizes this information as of December 29, 2024 and December 31, 2023.
| | | | | | | | | | | |
| | End of Fiscal Year |
| | 2024 | | 2023 |
| | (in thousands) |
| UK Plan | | | |
| Projected benefit obligation | $ | 106,865 | | | $ | 108,424 | |
| Accumulated benefit obligation | 106,865 | | | 108,424 | |
| Plan assets | 122,330 | | | 133,658 | |
| | | | |
Dutch Plan | | | |
| Projected benefit obligation | $ | 63,938 | | | $ | 71,422 | |
| Accumulated benefit obligation | 63,938 | | | 71,422 | |
| Plan assets | 58,823 | | | 65,690 | |
| | | | |
| nora Plan | | | |
| Projected benefit obligation | $ | 30,085 | | | $ | 34,582 | |
| Accumulated benefit obligation | 30,085 | | | 34,582 | |
| Plan assets | — | | | — | |
| | | | | | | | | | | | | | | | | |
| | Fiscal Year |
| | 2024 | | 2023 | | 2022 |
| | (in thousands) |
| Components of net periodic benefit cost: | | | | | |
| Service cost | $ | 500 | | | $ | 458 | | | $ | 840 | |
| Interest cost | 7,933 | | | 8,169 | | | 3,793 | |
| Expected return on plan assets | (7,858) | | | (7,933) | | | (3,957) | |
| Amortization of prior service cost | 180 | | | 137 | | | 117 | |
| Amortization of net actuarial losses | 1,080 | | | 468 | | | 1,201 | |
| | | | | |
| Net periodic benefit cost | $ | 1,835 | | | $ | 1,299 | | | $ | 1,994 | |
In accordance with applicable accounting standards, the service cost component of net periodic benefit costs is presented within operating income in the consolidated statements of operations, while all other components of net periodic benefit costs are presented within other expense, net, in the consolidated statements of operations.
During 2024, other comprehensive loss was impacted by a total net loss of approximately $5.7 million (net of $1.7 million of tax), comprised of actuarial loss of approximately $6.5 million (net of $2.0 million of tax) and amortization of loss of $0.8 million (net of $0.3 million of tax).
| | | | | | | | | | | | | | | | | |
| | Fiscal Year |
| | 2024 | | 2023 | | 2022 |
| Weighted average assumptions used to determine net periodic benefit cost: | | | | | |
| Discount rate | 3.9 | % | | 4.1 | % | | 1.4 | % |
| Expected return on plan assets | 4.6 | % | | 4.6 | % | | 3.0 | % |
| | | | | |
| Weighted average assumptions used to determine benefit obligations: | | | | | |
| Discount rate | 4.7 | % | | 4.1 | % | | 4.4 | % |
| | | | | |
The expected long-term rate of return on plan assets assumption is based on weighted average expected returns for each asset class. Expected returns reflect a combination of historical performance analysis and the forward-looking views of the financial markets, and include input from actuaries, investment service firms and investment managers.
The investment objectives of the foreign defined benefit plans are to maximize the return on the investments to ensure that the assets are sufficient to exceed minimum funding requirements, and to achieve a favorable return against performance expectations based on historical and projected rates of return over the short term. The goal is to optimize the long-term return on plan assets at a moderate level of risk, by balancing higher-returning assets, such as equity securities, with less volatile assets, such as fixed income securities. The assets are managed by professional investment firms and performance is evaluated periodically against specific benchmarks. The plans’ net assets did not include the Company’s own stock at December 29, 2024 or December 31, 2023.
Dutch Plan Assets and Indexation Benefit
As is common in Dutch pension plans, the Dutch Plan includes a provision for discretionary benefit increases termed “indexation.” The indexation benefit is meant to adjust pension benefits for cost-of-living increases, similar to U.S. consumer price index-based cost-of-living adjustments for U.S. retirement plans. The indexation benefit is not guaranteed, and is only provided for and paid out if sufficient assets are available due to favorable asset returns.
Both the vested benefit amounts as well as amounts related to the discretionary indexation benefits under the Dutch Plan are paid pursuant to an insurance contract with a private insurer (the “Contract”). The Dutch Plan itself is financed by investment assets held within the Contract. Prior to December 31, 2019, the Contract guaranteed payment of vested benefits, regardless of whether Dutch Plan assets held through the Contract were ultimately sufficient to pay vested amounts, and also provided for payment of the indexation amount on a contingent basis if the actual return on Dutch Plan assets were sufficient to pay it. This type of insurance arrangement is common in The Netherlands, although not necessarily common in other jurisdictions. After the Dutch Plan curtailment on December 31, 2019, any shortfall in plan assets to pay vested benefits will be funded by the Company. The assets under the Dutch Plan, including any indexation benefit, are identified as level 3 assets under the fair value hierarchy.
Under the express terms of the Contract, contract value is the greater of (i) the value of the discounted vested benefits of the Dutch Plan and (ii) the fair value of the underlying investment assets held by the insurance company under the Contract. As between those two values, the former was the greater for 2024 and 2023. Because the Company will fund the cost to guarantee vested benefits, the Company has recorded a provision, which reduces the Dutch Plan assets, that consists of the net present value of the expected future guarantee payments due to the insurance company pursuant to the Company’s guarantee.
As explained above, the Contract also will pay the indexation benefit if sufficient assets are available, which the Company believes not to be probable as of the end of 2024 based on recent returns. The indexation benefit for 2024 and 2023 is not significant.
The Company’s actual weighted average asset allocations for 2024 and 2023, and the targeted asset allocation for 2025, of the foreign defined benefit plans by asset category, are as follows:
| | | | | | | | | | | | | | | | | | | | | | | |
| | Fiscal Year |
| | 2025 | | 2024 | | 2023 |
| Asset Category | Target Allocation | | Percentage of Plan Assets at Year End |
| Debt and debt securities | 65% | — | 70% | | 58% | | 59% |
| Short-term investments | —% | — | 2% | | 9% | | 8% |
| Other investments | 30% | — | 35% | | 33% | | 33% |
| | 100% | | 100% | | 100% |
The following table sets forth by level within the fair value hierarchy the foreign defined benefit plans’ assets at fair value, as of December 29, 2024 and December 31, 2023. The nora plan is currently unfunded. As required by accounting standards, assets are classified in their entirety based on the lowest level of input that is significant to the fair value measurement. As noted above, the Dutch Plan assets as represented by the insurance contract are classified as a level 3 asset and included in the “Other” asset category.
| | | | | | | | | | | | | | | | | |
| | Pension Plan Assets by Category as of December 29, 2024 |
| | Dutch Plan | | UK Plan | | Total |
| | (in thousands) |
| Level 1 | $ | — | | | $ | 16,182 | | | $ | 16,182 | |
| Level 2 | — | | | 90,330 | | | 90,330 | |
| Level 3 | 58,823 | | | 15,818 | | | 74,641 | |
| Total | $ | 58,823 | | | $ | 122,330 | | | $ | 181,153 | |
| | | | | | | | | | | | | | | | | |
| | Pension Plan Assets by Category as of December 31, 2023 |
| | Dutch Plan | | UK Plan | | Total |
| | (in thousands) |
| Level 1 | $ | — | | | $ | 16,232 | | | $ | 16,232 | |
| Level 2 | — | | | 92,200 | | | 92,200 | |
| Level 3 | 65,690 | | | 25,226 | | | 90,916 | |
| Total | $ | 65,690 | | | $ | 133,658 | | | $ | 199,348 | |
The tables below detail the foreign defined benefit plans’ assets by asset allocation and fair value hierarchy:
| | | | | | | | | | | | | | | | | |
| | End of Fiscal Year 2024 |
| Asset Category | Level 1 | | Level 2 | | Level 3 |
| | | (in thousands) | | |
| Debt and debt securities | $ | — | | | $ | 90,330 | | | $ | 14,950 | |
Short-term investments (1) | 16,182 | | | — | | | — | |
Other investments (2) | — | | | — | | | 59,691 | |
| | $ | 16,182 | | | $ | 90,330 | | | $ | 74,641 | |
| | | | | | | | | | | | | | | | | |
| | End of Fiscal Year 2023 |
| Asset Category | Level 1 | | Level 2 | | Level 3 |
| | (in thousands) |
| Debt and debt securities | $ | — | | | $ | 92,200 | | | $ | 24,325 | |
Short-term investments (1) | 16,232 | | | — | | | — | |
Other investments (2) | — | | | — | | | 66,591 | |
| | $ | 16,232 | | | $ | 92,200 | | | $ | 90,916 | |
(1) Short-term investments are generally invested in interest-bearing accounts.
(2) Other investments are comprised of insurance contracts.
Assets identified as level 2 above pertain to corporate bonds and other debt securities. The fair values of these assets are calculated based on quoted market prices for similar assets.
With the exception of the Dutch Plan assets as discussed above, the assets identified as level 3 above in 2024 and 2023 relate to insured annuities and direct lending assets held by the UK Plan. The fair value of these assets was calculated using the present value of the future cash flows due under the insurance annuities, and for the direct lending assets the value is based on the asset value from the latest available valuation with adjustments for any drawdowns and distribution payments made between the valuation date and the reporting date. The range of discount rates used in the fair value calculation of level 3 assets held by the Dutch Plan and the UK Plan were 3.50% to 5.35% for 2024, and 3.30% to 4.50% for 2023. The weighted average discount rates were 3.53% and 3.32% for 2024 and 2023, respectively. These amounts are weighted based on the fair value of level 3 plan assets subject to fluctuations in the discount rate. Any changes in these variables will impact the fair value of level 3 assets.
The table below indicates the change in value related to these level 3 assets during 2024 and 2023:
| | | | | | | | | | | |
| Fiscal Year |
| | 2024 | | 2023 |
| | (in thousands) |
| Balance of level 3 assets, beginning of year | $ | 90,916 | | | $ | 89,864 | |
Actual return on plan assets (1) | (2,463) | | | 3,429 | |
| Purchases, sales and settlements, net | (10,138) | | | (5,734) | |
| Currency translation adjustment | (3,674) | | | 3,357 | |
| Balance of level 3 assets, end of year | $ | 74,641 | | | $ | 90,916 | |
(1) Includes $(2.1) million and $2.7 million for 2024 and 2023, respectively, of unrealized (losses) / gains recognized during the period in other comprehensive loss for assets held at year end.
During 2025, the Company expects to contribute $2.4 million to the foreign defined benefit plans. It is anticipated that future benefit payments for the foreign defined benefit plans will be as follows:
| | | | | |
| Fiscal Year | Expected Payments |
| | (in thousands) |
| 2025 | $ | 10,551 | |
| 2026 | 10,672 | |
| 2027 | 10,775 | |
| 2028 | 11,041 | |
| 2029 | 11,242 | |
| 2030-2034 | 56,744 | |
Domestic Defined Benefit Plan
The Company maintains a domestic nonqualified salary continuation plan (“SCP”), which is designed to induce selected officers of the Company to remain in the employ of the Company by providing them with retirement, disability and death benefits in addition to those which they may receive under the Company’s other retirement plans and benefit programs. The SCP entitles participants to: (i) retirement benefits upon normal retirement at age 65 (or early retirement as early as age 55) after completing at least 15 years of service with the Company (unless otherwise provided in the SCP), payable for the remainder of their lives (or, if elected by a participant, a reduced benefit is payable for the remainder of the participant’s life and any surviving spouse’s life) and in no event less than 10 years under the death benefit feature; (ii) disability benefits payable for the period of any total disability; and (iii) death benefits payable to the designated beneficiary of the participant for a period of up to 10 years. Benefits are determined according to one of three formulas contained in the SCP, and the SCP is administered by the Compensation Committee of the Company’s Board of Directors, which has full discretion in choosing participants and the benefit formula applicable to each. The Company’s obligations under the SCP are currently unfunded (although the Company uses insurance instruments to hedge its exposure thereunder). The Company is required to contribute the present value of its obligations thereunder to an irrevocable grantor trust in the event of a change in control as defined in the SCP. The Company uses a year-end measurement date for the domestic SCP.
The tables presented below set forth the required disclosures in accordance with applicable accounting standards, and amounts recognized in the consolidated financial statements related to the domestic SCP. There is no service cost component in the change in benefit obligation in 2024 and 2023 as there are no longer any participants accruing benefits in the plan.
| | | | | | | | | | | |
| | Fiscal Year |
| | 2024 | | 2023 |
| | (in thousands) |
| Change in benefit obligation: | | | |
| Benefit obligation, beginning of year | $ | 22,659 | | | $ | 22,731 | |
| Interest cost | 1,065 | | | 1,134 | |
| Benefits paid | (1,872) | | | (1,873) | |
| Actuarial loss (gain) | (787) | | | 667 | |
| Benefit obligation, end of year | $ | 21,065 | | | $ | 22,659 | |
The amounts recognized in the consolidated balance sheets are as follows:
| | | | | | | | | | | |
| End of Fiscal Year |
| | 2024 | | 2023 |
| | (in thousands) |
| Current liabilities | $ | 1,873 | | | $ | 1,873 | |
| Non-current liabilities | 19,192 | | | 20,786 | |
| Total benefit obligation | $ | 21,065 | | | $ | 22,659 | |
The components of the amounts in accumulated other comprehensive loss, after tax, are as follows:
| | | | | | | | | | | |
| Fiscal Year |
| | 2024 | | 2023 |
| | (in thousands) |
| Unrecognized actuarial loss | $ | 3,428 | | | $ | 4,098 | |
The accumulated benefit obligation related to the SCP was $21.1 million at December 29, 2024, and $22.7 million at December 31, 2023. The SCP is currently unfunded; as such, the benefit obligations disclosed are also the benefit obligations in excess of the plan assets. The Company uses insurance instruments to help limit its exposure under the SCP.
| | | | | | | | | | | | | | | | | |
| Fiscal Year |
| | 2024 | | 2023 | | 2022 |
| | (in thousands, except for assumptions) |
| Assumptions used to determine net periodic benefit cost: | | | | | |
| Discount rate | 4.90 | % | | 5.20 | % | | 2.65 | % |
| | | | | |
| | | | | | |
| Assumptions used to determine benefit obligations: | | | | | |
| Discount rate | 5.45 | % | | 4.90 | % | | 5.20 | % |
| | | | | |
| | | | | | |
| Components of net periodic benefit cost: | | | | | |
| | | | | |
| Interest cost | $ | 1,065 | | | $ | 1,134 | | | $ | 771 | |
| Amortization of actuarial losses | 239 | | | 195 | | | 557 | |
| Net periodic benefit cost | $ | 1,304 | | | $ | 1,329 | | | $ | 1,328 | |
In accordance with applicable accounting standards, all components of net periodic benefit cost associated with the SCP are presented within other expense, net, in the consolidated statements of operations.
The change in other comprehensive loss during 2024 related to the SCP as a result of plan activity was a net gain of approximately $0.7 million (net of $0.3 million of tax), primarily comprised of a net gain during the period of $0.6 million (net of $0.2 million of tax) and amortization of loss of $0.1 million (net of $0.1 million of tax).
During 2024, the Company contributed $1.9 million in the form of direct benefit payments for its domestic SCP. It is anticipated that future benefit payments for the SCP will be as follows:
| | | | | |
| Fiscal Year | Expected Payments |
| | (in thousands) |
| 2025 | $ | 1,873 | |
| 2026 | 1,873 | |
| 2027 | 1,873 | |
| 2028 | 1,873 | |
| 2029 | 1,838 | |
| 2030-2034 | 8,601 | |
NOTE 20 – SEGMENT INFORMATION
The Company determines that an operating segment exists if a component (i) engages in business activities from which it earns revenues and incurs expenses, (ii) has operating results that are regularly reviewed by the chief operating decision maker (“CODM”) and (iii) has discrete financial information. Additionally, accounting standards require the utilization of a “management approach” to report the financial results of operating segments, which is based on information used by the CODM to assess performance and make operating and resource allocation decisions. The Company determined that it has two operating segments organized by geographical area – namely (a) Americas (“AMS”) and (b) Europe, Africa, Asia and Australia (collectively “EAAA”). The AMS operating segment includes the United States, Canada and Latin America geographic areas.
Pursuant to the management approach discussed above, the Company’s CODM, our chief executive officer, evaluates performance at the AMS and EAAA operating segment levels and makes operating and resource allocation decisions based on segment operating income (“AOI”). The CODM uses AOI to evaluate segment operating results compared to expectations. AOI is also used by the CODM to develop variable compensation targets and make capital spend decisions. AOI includes allocations of corporate selling, general and administrative expenses and global support as discussed below and excludes: nora purchase accounting amortization; Thailand plant closure inventory write-down; Cyber Event impact; goodwill and intangible asset impairment charges; and restructuring, asset impairment, severance, and other, net. Intersegment revenues for 2024, 2023 and 2022 were $91.1 million, $82.8 million and $75.5 million, respectively. Intersegment revenues are eliminated from net sales presented below since these amounts are not included in the information provided to the CODM.
The Company has determined that it has two reportable segments – AMS and EAAA, as each operating segment meets the quantitative thresholds defined in the accounting guidance.
During fiscal year 2024, the Company implemented a cost center realignment initiative to centralize certain global/shared functions. During 2024, SG&A expenses for these global support functions were allocated to AOI for each reportable segment consistent with the allocation methodology used to allocate corporate overhead in prior periods. Prior year AOI amounts below were not recast as there was no material impact to the measure of segment profit for each reportable segment. There were no changes to the composition of the Company’s operating or reportable segments.
The following table outlines information by reportable segment including net sales, significant segment expenses, and AOI. The table also includes a reconciliation to income before taxes for fiscal years 2024, 2023, and 2022.
| | | | | | | | | | | | | | | | | | | | | | | | | | | | | | | | | | | | | | |
| | Fiscal Year |
| | 2024 | | 2023 | | 2022 |
| | AMS | EAAA | TOTAL | | AMS | EAAA | TOTAL | | AMS | EAAA | TOTAL |
| | | | | | (in thousands) | | | | |
| Net sales | | $ | 800,811 | | $ | 514,847 | | $ | 1,315,658 | | | $ | 736,955 | | $ | 524,543 | | $ | 1,261,498 | | | $ | 753,740 | | $ | 544,179 | | $ | 1,297,919 | |
| | | | | | | | | | | | |
Less: significant segment expenses (1) | | | | | | | | | | | | |
Adjusted cost of sales (2) | | 494,185 | | 333,353 | | | | 458,708 | | 356,591 | | | | 473,761 | | 374,106 | | |
Adjusted selling, general, & administrative expenses(3) | | 200,032 | | 146,691 | | | | 190,458 | | 139,344 | | | | 177,609 | | 140,015 | | |
| Segment AOI | | 106,594 | | 34,803 | | 141,397 | | | 87,789 | | 28,608 | | 116,397 | | | 102,370 | | 30,058 | | 132,428 | |
| Reconciliation of AOI to income before taxes | | | | | | | | | | | | |
| Restructuring, severance, asset impairment and other, net | | | | 2,530 | | | | | 5,631 | | | | | 8,189 | |
| Purchasing accounting amortization | | | | 5,172 | | | | | 5,172 | | | | | 5,038 | |
| Cyber Event impact | | | | (711) | | | | | 1,072 | | | | | 5,093 | |
| Goodwill & intangible asset impairment | | | | — | | | | | — | | | | | 36,180 | |
| Thailand plant inventory write down | | | | — | | | | | — | | | | | 2,530 | |
| Interest expense | | | | 23,205 | | | | | 31,787 | | | | | 29,929 | |
| Other (income) expense, net | | | | (2,353) | | | | | 9,081 | | | | | 3,552 | |
| Income before taxes | | | | $ | 113,554 | | | | | $ | 63,654 | | | | | $ | 41,917 | |
(1) Significant segment expense categories and amounts align with segment level information that is regularly provided to the CODM, included in the measure of segment profit, and considered to be significant. Amounts include allocation of corporate overhead and global support costs. Intersegment expenses are excluded.
(2) Adjusted cost of sales excludes purchase accounting amortization, the Cyber Event impact, and Thailand plant inventory write down.
(3) Adjusted selling, general, and administrative expenses exclude the cyber event impact and restructuring, asset impairment, severance, and other, net.
Segment depreciation and amortization for 2024, 2023 and 2022 is presented in the table below:
| | | | | | | | | | | | | | | | | |
| Fiscal Year |
| 2024 | | 2023 | | 2022 |
| (in thousands) |
| | | | | |
| Depreciation and amortization | | | | | |
| AMS | $ | 17,804 | | | $ | 17,989 | | | $ | 16,827 | |
| EAAA | 21,529 | | | 22,785 | | | 23,510 | |
| Total depreciation and amortization | $ | 39,333 | | | $ | 40,774 | | | $ | 40,337 | |
A reconciliation of the Company’s total operating segment assets to the corresponding consolidated amounts follows:
| | | | | | | | | | | |
| End of Fiscal Year |
| 2024 | | 2023 |
| (in thousands) |
| Assets | | | |
| AMS | $ | 644,085 | | | $ | 627,782 | |
| EAAA | 587,639 | | | 630,939 | |
| Total segment assets | 1,231,724 | | | 1,258,721 | |
| Corporate assets | 111,761 | | | 108,673 | |
| Eliminations | (172,669) | | | (137,299) | |
| Total reported assets | $ | 1,170,816 | | | $ | 1,230,095 | |
The Company has a large and diverse customer base, which includes numerous customers located in foreign countries. No single unaffiliated customer accounted for more than 10% of total sales in any year during the past three years. Sales to customers in foreign markets in 2024, 2023 and 2022 were approximately 43%, 46% and 47%, respectively, of total net sales. These sales were primarily to customers in Europe, Canada, Asia, Australia and Latin America. Net sales and long-lived assets for the United States and other significant countries (that individually represent 10% or greater of consolidated totals for each year presented) are as follows:
| | | | | | | | | | | | | | | | | |
| | Fiscal Year |
Net Sales to Unaffiliated Customers(1) | 2024 | | 2023 | | 2022 |
| | (in thousands) |
| United States | $ | 744,407 | | | $ | 677,342 | | | $ | 694,299 | |
| Other foreign countries | 571,251 | | | 584,156 | | | 603,620 | |
| Total net sales | $ | 1,315,658 | | | $ | 1,261,498 | | | $ | 1,297,919 | |
| | | | | | |
| | | End of Fiscal Year |
Long-Lived Assets(2) | | | 2024 | | 2023 |
| | | (in thousands) |
| United States | | | $ | 151,130 | | | $ | 146,106 | |
| Germany | | | 60,391 | | | 66,740 | |
| Netherlands | | | 36,350 | | | 40,455 | |
| Other foreign countries | | | 34,503 | | | 37,839 | |
| Total long-lived assets | | | $ | 282,374 | | | $ | 291,140 | |
(1) Revenue attributed to geographic areas is based on the location of the customer.
(2) Long-lived assets attributed to geographic areas are based on the physical location of the asset. 2024 includes $3.1 million and $5.0 million of leased equipment, net of accumulated amortization, in the United States and foreign countries, respectively. 2023 includes $2.2 million and $5.0 million of leased equipment, net of accumulated amortization, in the United States and foreign countries, respectively.
NOTE 21 – ITEMS RECLASSIFIED FROM ACCUMULATED OTHER COMPREHENSIVE LOSS
Amounts reclassified out of accumulated other comprehensive loss (“AOCL”), before tax, to the consolidated statements of operations for the fiscal years 2024, 2023 and 2022, are reflected in the table below:
| | | | | | | | | | | | | | | | | | | | | | | |
| | | Fiscal Year |
| Statement of Operations Location | | 2024 | | 2023 | | 2022 |
| | | (in thousands) |
Loss on foreign subsidiary liquidation(1) | Other (income) expense, net | | $ | (2,152) | | | $ | (6,221) | | | $ | — | |
Interest rate swap contracts loss(2) | Interest expense | | — | | | (982) | | | (2,809) | |
Amortization of benefit plan net actuarial losses and prior service cost(3) | Other (income) expense, net | | (1,499) | | | (800) | | | (1,875) | |
| Total loss reclassified from AOCI | | | $ | (3,651) | | | $ | (8,003) | | | $ | (4,684) | |
(1) In 2024, the Company’s foreign subsidiary in Thailand was substantially liquidated and in 2023, the Company’s foreign subsidiaries in Russia and Brazil were substantially liquidated. The cumulative foreign currency translation losses associated with these entities were recognized in the consolidated statements of operations for the respective period. There is no tax impact for the Thailand cumulative foreign currency translation reclassification for 2024 as it is non-deductible. The tax impact for the 2023 cumulative foreign currency translation reclassification was $1.1 million.
(2) The tax impact of the interest rate swap reclassifications were $0.2 million and $0.8 million for 2023 and 2022, respectively, related to the discontinued cash flow hedges. See Note 10 entitled “Derivative Instruments” for additional information.
(3) See Note 19 entitled “Employee Benefit Plans” for the tax impact of reclassifications related to the Company’s defined benefit plans.
Report of Independent Registered Public Accounting Firm
Shareholders and Board of Directors
Interface, Inc.
Atlanta, Georgia
Opinion on the Consolidated Financial Statements
We have audited the accompanying consolidated balance sheets of Interface, Inc. (the “Company”) as of December 29, 2024 and December 31, 2023, the related consolidated statements of operations, comprehensive income, and cash flows for each of the three fiscal years in the period ended December 29, 2024, and the related notes and financial statement schedule listed in the accompanying index (collectively referred to as the “consolidated financial statements”). In our opinion, the consolidated financial statements present fairly, in all material respects, the financial position of the Company at December 29, 2024 and December 31, 2023, and the results of its operations and its cash flows for each of the three fiscal years in the period ended December 29, 2024, in conformity with accounting principles generally accepted in the United States of America.
We also have audited, in accordance with the standards of the Public Company Accounting Oversight Board (United States) (PCAOB), the Company's internal control over financial reporting as of December 29, 2024, based on criteria established in Internal Control – Integrated Framework (2013) issued by the Committee of Sponsoring Organizations of the Treadway Commission (COSO) and our report dated February 26, 2025 expressed an unqualified opinion thereon.
Basis for Opinion
These consolidated financial statements are the responsibility of the Company’s management. Our responsibility is to express an opinion on the Company’s consolidated financial statements based on our audits. We are a public accounting firm registered with the PCAOB and are required to be independent with respect to the Company in accordance with the U.S. federal securities laws and the applicable rules and regulations of the Securities and Exchange Commission and the PCAOB.
We conducted our audits in accordance with the standards of the PCAOB. Those standards require that we plan and perform the audit to obtain reasonable assurance about whether the consolidated financial statements are free of material misstatement, whether due to error or fraud.
Our audits included performing procedures to assess the risks of material misstatement of the consolidated financial statements, whether due to error or fraud, and performing procedures that respond to those risks. Such procedures included examining, on a test basis, evidence regarding the amounts and disclosures in the consolidated financial statements. Our audits also included evaluating the accounting principles used and significant estimates made by management, as well as evaluating the overall presentation of the consolidated financial statements. We believe that our audits provide a reasonable basis for our opinion.
Critical Audit Matter
The critical audit matter communicated below is a matter arising from the current period audit of the consolidated financial statements that was communicated or required to be communicated to the audit committee and that: (1) relates to accounts or disclosures that are material to the consolidated financial statements and (2) involved our especially challenging, subjective, or complex judgments. The communication of the critical audit matter does not alter in any way our opinion on the consolidated financial statements, taken as a whole, and we are not, by communicating the critical audit matter below, providing a separate opinion on the critical audit matter or on the accounts or disclosures to which it relates.
Goodwill and Other Intangible Assets Impairment Assessment
As described in Notes 1 and 12 of the consolidated financial statements, the Company’s consolidated goodwill balance was $99.9 million as of December 29, 2024, all allocated to the Americas reporting unit. Goodwill is tested for impairment annually and between annual tests if events or changes in circumstances indicate the asset might be impaired. If the carrying value of the Americas reporting unit exceeds its estimated fair value, the Company will recognize an impairment loss equal to the amount of the excess, limited to the amount of goodwill allocated to that reporting unit. The Company estimates the fair value of the Americas reporting unit using a combination of fair values derived from an income methodology and a market comparable methodology. The Company’s consolidated Trademark and trade name intangible assets was $45.2 million as of December 29, 2024. Trademark and trade name intangible assets acquired in connection with the nora acquisition are not subject to amortization, but are tested for impairment annually and between annual tests if an event occurs or circumstances change that would more likely than not reduce the fair value of the intangible assets below their carrying amount. The Company prepared valuations of the intangible assets using the present value of cash flows under the relief from royalty method, which were compared to the carrying value of intangible assets to determine whether any impairment existed.
We identified the income approach valuation methodology used in the impairment evaluation of goodwill for the Americas reporting unit and the nora trade name and trademark intangibles as a critical audit matter due to the inherent subjectivity involved in management’s determination of (i) forecasts of revenues and (ii) the discount rate. The audit procedures to evaluate the reasonableness of these assumptions involved a high degree of auditor judgment and an increased extent of effort, including the involvement of individuals with specialized skill or knowledge.
The primary procedures we performed to address this critical audit matter included:
•Evaluating management’s ability to accurately forecast future revenues by performing a retrospective review comparing management’s prior period forecasts to actual results for the same period.
•Inquiring of management to understand the process for developing the forecasts of future revenues and evaluating the consistency of the revenue forecasts used with evidence obtained in other areas of the audit.
•Testing management’s process used to evaluate goodwill and the nora trade name and trademark intangibles for impairment, including evaluating the reasonableness of the forecasts of future revenues by comparing forecasts of future revenues to (1) historical results and the recent trend of revenue growth rates, (2) forecasted information included in industry reports for the Company and its peer companies, (3) publicly available industry analyst projections, and (4) external communications made by the Company.
•Utilizing our valuation specialists to assist in evaluating the reasonableness of the Company’s discount rate by (i) testing the source information underlying the determination of the discount rate, (ii) testing the mathematical accuracy of the calculations; and (iii) developing a range of independent estimates and comparing those to the discount rate selected by management.
/s/ BDO USA, P.C.
We are uncertain as to the year we began serving consecutively as the auditor of the Company's financial statements; however, we are aware that we have been the Company's auditor consecutively since at least 1981.
Atlanta, Georgia
February 26, 2025
Report of Independent Registered Public Accounting Firm
Shareholders and Board of Directors
Interface, Inc.
Atlanta, Georgia
Opinion on Internal Control over Financial Reporting
We have audited Interface, Inc.’s (the “Company’s”) internal control over financial reporting as of December 29, 2024, based on criteria established in Internal Control – Integrated Framework (2013) issued by the Committee of Sponsoring Organizations of the Treadway Commission (the “COSO criteria”). In our opinion, the Company maintained, in all material respects, effective internal control over financial reporting as of December 29, 2024, based on the COSO criteria.
We also have audited, in accordance with the standards of the Public Company Accounting Oversight Board (United States) (PCAOB), the consolidated balance sheets of the Company as of December 29, 2024 and December 31, 2023, the related consolidated statements of operations, comprehensive income, and cash flows for each of the three fiscal years in the period ended December 29, 2024, and the related notes and financial statement schedule listed in the accompanying index and our report dated February 26, 2025 expressed an unqualified opinion thereon.
Basis for Opinion
The Company’s management is responsible for maintaining effective internal control over financial reporting and for its assessment of the effectiveness of internal control over financial reporting, included in the accompanying Item 9A, Management’s Annual Report on Internal Control over Financial Reporting. Our responsibility is to express an opinion on the Company’s internal control over financial reporting based on our audit. We are a public accounting firm registered with the PCAOB and are required to be independent with respect to the Company in accordance with U.S. federal securities laws and the applicable rules and regulations of the Securities and Exchange Commission and the PCAOB.
We conducted our audit of internal control over financial reporting in accordance with the standards of the PCAOB. Those standards require that we plan and perform the audit to obtain reasonable assurance about whether effective internal control over financial reporting was maintained in all material respects. Our audit included obtaining an understanding of internal control over financial reporting, assessing the risk that a material weakness exists, and testing and evaluating the design and operating effectiveness of internal control based on the assessed risk. Our audit also included performing such other procedures as we considered necessary in the circumstances. We believe that our audit provides a reasonable basis for our opinion.
Definition and Limitations of Internal Control over Financial Reporting
A company’s internal control over financial reporting is a process designed to provide reasonable assurance regarding the reliability of financial reporting and the preparation of financial statements for external purposes in accordance with generally accepted accounting principles. A company’s internal control over financial reporting includes those policies and procedures that (1) pertain to the maintenance of records that, in reasonable detail, accurately and fairly reflect the transactions and dispositions of the assets of the company; (2) provide reasonable assurance that transactions are recorded as necessary to permit preparation of financial statements in accordance with generally accepted accounting principles, and that receipts and expenditures of the company are being made only in accordance with authorizations of management and directors of the company; and (3) provide reasonable assurance regarding prevention or timely detection of unauthorized acquisition, use, or disposition of the company’s assets that could have a material effect on the financial statements.
Because of its inherent limitations, internal control over financial reporting may not prevent or detect misstatements. Also, projections of any evaluation of effectiveness to future periods are subject to the risk that controls may become inadequate because of changes in conditions, or that the degree of compliance with the policies or procedures may deteriorate.
/s/ BDO USA, P.C.
Atlanta, Georgia
February 26, 2025
ITEM 9. CHANGES IN AND DISAGREEMENTS WITH ACCOUNTANTS ON ACCOUNTING AND FINANCIAL DISCLOSURE
Not applicable.
ITEM 9A. CONTROLS AND PROCEDURES
Disclosure Controls and Procedures. As of the end of the period covered by this Annual Report on Form 10-K, an evaluation was performed under the supervision and with the participation of our management, including our principal executive officer and our principal financial officer, of the effectiveness of the design and operation of our disclosure controls and procedures as defined in Rule 13a-15(e) under the Securities Exchange Act of 1934, pursuant to Rule 13a-14(c) under the Act. Based on that evaluation, our principal executive officer and our principal financial officer concluded that our disclosure controls and procedures were effective as of the end of the period covered by this Annual Report.
Changes in Internal Control over Financial Reporting. There were no changes in our internal control over financial reporting that occurred during our last fiscal quarter that have materially affected, or are reasonably likely to materially affect, our internal control over financial reporting.
Management’s Annual Report on Internal Control over Financial Reporting. The management of the Company is responsible for establishing and maintaining adequate internal control over financial reporting as defined in Rule 13a-15(f) or 15d-15(f) promulgated under the Securities Exchange Act of 1934. Because of its inherent limitations, internal control over financial reporting may not prevent or detect misstatements. Therefore, even those systems determined to be effective can provide only reasonable assurance with respect to financial statement preparation and presentation.
Our management assessed the effectiveness of our internal control over financial reporting as of December 29, 2024 based on the criteria set forth by the Committee of Sponsoring Organizations of the Treadway Commission (COSO) in “Internal Control – Integrated Framework (2013).” Based on that assessment, management concluded that, as of December 29, 2024, our internal control over financial reporting was effective based on those criteria.
Our independent auditors have issued an audit report on the effectiveness of our internal control over financial reporting. This report immediately precedes Item 9 of this Report.
ITEM 9B. OTHER INFORMATION
During the three months ended December 29, 2024, no director or officer (as defined in Rule 16a-1(f) of the Exchange Act) of the Company adopted or terminated a “Rule 10b5-1 trading arrangement” or “non-Rule 10b5-1 trading arrangement,” as each term is defined in Item 408 of Regulation S-K.
ITEM 9C. DISCLOSURE REGARDING FOREIGN JURISDICTIONS THAT PREVENT INSPECTIONS
Not applicable.
PART III
ITEM 10. DIRECTORS, EXECUTIVE OFFICERS AND CORPORATE GOVERNANCE
The information contained under the captions “Nomination and Election of Directors,” “Delinquent Section 16(a) Reports” and “Meetings and Committees of the Board” in our definitive Proxy Statement for our 2025 Annual Meeting of Shareholders, to be filed with the Securities and Exchange Commission pursuant to Regulation 14A not later than 120 days after the end of our 2024 fiscal year, is incorporated herein by reference. Pursuant to Instruction 3 to Paragraph (b) of Item 401 of Regulation S-K, information relating to our executive officers is included in Item 1 of this Report.
We have adopted the “Interface Code of Conduct” (the “Code”) which applies to all of our employees, officers and directors, including the Chief Executive Officer and Chief Financial Officer. The Code may be viewed on our website at www.interface.com. Changes to the Code will be posted on our website. Any waiver of the Code for executive officers or directors may be made only by our Board of Directors and will be disclosed to the extent required by law or Nasdaq rules on our website or in a filing on Form 8-K.
Interface has adopted insider trading policies and procedures governing the purchase, sale, and/or other dispositions of Interface securities by directors, officers and employees that are reasonably designed to promote compliance with insider trading laws, rules and regulations, and any listing standards applicable to Interface.
ITEM 11. EXECUTIVE COMPENSATION
The information contained under the captions “Executive Compensation,” “Compensation Discussion and Analysis,” “Compensation Committee Report,” “Compensation Committee Interlocks and Insider Participation,” and “Potential Payments upon Termination or Change in Control” in our definitive Proxy Statement for our 2025 Annual Meeting of Shareholders, to be filed with the Securities and Exchange Commission pursuant to Regulation 14A not later than 120 days after the end of our 2024 fiscal year, is incorporated herein by reference.
ITEM 12. SECURITY OWNERSHIP OF CERTAIN BENEFICIAL OWNERS AND MANAGEMENT AND RELATED STOCKHOLDER MATTERS
The information contained under the captions “Principal Shareholders and Management Stock Ownership” and “Equity Compensation Plan Information” in our definitive Proxy Statement for our 2025 Annual Meeting of Shareholders, to be filed with the Securities and Exchange Commission pursuant to Regulation 14A not later than 120 days after the end of our 2024 fiscal year, is incorporated herein by reference.
For purposes of determining the aggregate market value of our voting and non-voting stock held by non-affiliates, shares held by our directors and executive officers have been excluded. The exclusion of such shares is not intended to, and shall not, constitute a determination as to which persons or entities may be “affiliates” as that term is defined under federal securities laws.
ITEM 13. CERTAIN RELATIONSHIPS AND RELATED TRANSACTIONS, AND DIRECTOR INDEPENDENCE
The information contained under the captions “Certain Relationships and Related Transactions” and “Director Independence” in our definitive Proxy Statement for our 2025 Annual Meeting of Shareholders, to be filed with the Securities and Exchange Commission pursuant to Regulation 14A not later than 120 days after the end of our 2024 fiscal year, is incorporated herein by reference.
ITEM 14. PRINCIPAL ACCOUNTANT FEES AND SERVICES
The information contained under the captions “Audit and Non-Audit Fees” and “Policy on Audit Committee Pre-Approval of Audit and Permissible Non-Audit Services of Independent Auditors” in our definitive Proxy Statement for our 2025 Annual Meeting of Shareholders, to be filed with the Securities and Exchange Commission pursuant to Regulation 14A not later than 120 days after the end of our 2024 fiscal year, is incorporated herein by reference.
PART IV
ITEM 15. EXHIBITS AND FINANCIAL STATEMENT SCHEDULES
1. Financial Statements
The following consolidated financial statements and notes thereto of Interface, Inc. and subsidiaries and related Reports of Independent Registered Public Accounting Firm are contained in Item 8 of this Report:
Consolidated Statements of Operations and Comprehensive Income — fiscal years ended December 29, 2024, December 31, 2023 and January 1, 2023.
Consolidated Balance Sheets — December 29, 2024 and December 31, 2023.
Consolidated Statements of Cash Flows — fiscal years ended December 29, 2024, December 31, 2023, and January 1, 2023.
Notes to Consolidated Financial Statements
Report of Independent Registered Public Accounting Firm (BDO USA, P.C., Atlanta, Georgia, PCAOB ID: 243)
Report of Independent Registered Public Accounting Firm on Internal Control over Financial Reporting
2. Financial Statement Schedule
The following consolidated financial statement schedule of Interface, Inc. and subsidiaries is included as part of this Report (see the pages immediately preceding the signatures in this Report).
Schedule II — Valuation and Qualifying Accounts and Reserves
3. Exhibits
The following exhibits are filed or furnished with this Report:
| | | | | |
Exhibit Number | Description of Exhibit |
| 3.1 | |
| 3.2 | |
| 4.1 | |
| 4.2 | |
| 4.3 | |
| 10.1 | Salary Continuation Plan, dated May 7, 1982 (included as Exhibit 10.20 to the Company’s registration statement on Form S-1, File No. 2-82188, previously filed with the Commission and incorporated herein by reference).* |
| 10.2 | |
| 10.3 | |
| 10.4 | |
| 10.5 | Interface, Inc. Nonqualified Savings Plan (as amended and restated effective January 1, 2002) (included as Exhibit 10.4 to the Company’s annual report on Form 10-K for the year ended December 30, 2001, previously filed with the Commission and incorporated herein by reference); First Amendment thereto, dated as of December 20, 2002 (included as Exhibit 10.2 to the Company’s quarterly report on Form 10-Q for the quarter ended June 29, 2003, previously filed with the Commission and incorporated herein by reference); Second Amendment thereto, dated as of December 30, 2002 (included as Exhibit 10.3 to the Company’s quarterly report on Form 10-Q for the quarter ended June 29, 2003, previously filed with the Commission and incorporated herein by reference); Third Amendment thereto, dated as of May 8, 2003 (included as Exhibit 10.6 to the Company’s annual report on Form 10-K for the year ended December 28, 2003 (the “2003 10-K”), previously filed with the Commission and incorporated herein by reference); and Fourth Amendment thereto, dated as of December 31, 2003 (included as Exhibit 10.7 to the 2003 10-K, previously filed with the Commission and incorporated herein by reference).* |
| 10.6 | |
| 10.7 | |
| 10.8 | |
| | | | | |
| 10.9 | Interface, Inc. Nonqualified Savings Plan II, as amended and restated effective January 1, 2009 (included as Exhibit 10.18 to the Company’s annual report on Form 10-K for the year ended December 30, 2012 (the “2012 10-K”), previously filed with the Commission and incorporated herein by reference); First Amendment thereto, dated February 26, 2009 (included as Exhibit 10.19 to the 2012 10-K, previously filed with the Commission and incorporated herein by reference); Second Amendment thereto, dated December 9, 2009 (included as Exhibit 10.20 to the 2012 10-K, previously filed with the Commission and incorporated herein by reference); Third Amendment thereto, dated April 15, 2010 (included as Exhibit 10.21 to the 2012 10-K, previously filed with the Commission and incorporated herein by reference); Fourth Amendment thereto, dated August 9, 2012 (included as Exhibit 10.22 to the 2012 10-K, previously filed with the Commission and incorporated herein by reference); Fifth Amendment thereto, dated September 6, 2019 (included as Exhibit 99.6 to the Company’s registration statement on Form S-8 filed on March 24, 2023, previously filed with the Commission and incorporated herein by reference); Sixth Amendment thereto, dated March 30, 2020 (included as Exhibit 10.1 to the Company’s current report on Form 8-K filed on March 31, 2020, previously filed with the Commission and incorporated herein by reference); Seventh Amendment thereto (included as Exhibit 10.1 to the Company’s quarterly report on Form 10-Q filed on August 11, 2020, previously filed with the Commission and incorporated herein by reference); Eighth Amendment thereto, dated November 19, 2020 (included as Exhibit 10.1 to the Company’s current report on Form 8-K filed on November 24, 2020, previously filed with the Commission and incorporated herein by reference); and Ninth Amendment thereto, dated as of December 31, 2020 (included as Exhibit 10.9 to the Company's annual report on Form 10-K for the year ended January 2, 2022, previously filed with the Commission and incorporated herein by reference).* |
| 10.10 | |
| 10.11 | First Restatement Agreement, dated as of July 20, 2018, among Interface, Inc., certain subsidiaries of the Company as borrowers, certain subsidiaries of the Company as guarantors, Bank of America, N.A. as Administrative Agent, and the other lenders party thereto (included as Exhibit 10.1 to the Company’s current report on Form 8-K filed on July 26, 2018, previously filed with the Commission and incorporated herein by reference). |
| 10.12 | |
| 10.13 | |
| 10.14 | |
| 10.15 | |
| 10.16 | |
| 10.17 | |
| 10.18 | |
| 10.19 | |
| 10.20 | |
| | | | | |
| 10.21 | |
| 10.22 | |
| 10.23 | |
| 10.24 | |
| 16.1 | |
| 19.1 | |
| 21 | |
| 23 | |
| 24 | |
| 31.1 | |
| 31.2 | |
| 32.1 | |
| 32.2 | |
| 97 | |
| 101.INS | XBRL Instance Document – The Instance Document does not appear in the Interactive Data Files because its XBRL tags are embedded within the Inline XBRL document. |
| 101.SCH | XBRL Taxonomy Extension Schema Document. |
| 101.CAL | XBRL Taxonomy Extension Calculation Linkbase Document. |
| 101.LAB | XBRL Taxonomy Extension Label Linkbase Document. |
| 101.PRE | XBRL Taxonomy Presentation Linkbase Document. |
| 101.DEF | XBRL Taxonomy Definition Linkbase Document. |
| 104 | The cover page from this Annual Report on Form 10-K for the year ended December 29, 2024, formatted in Inline XBRL. |
*Management contract or compensatory plan or agreement required to be filed pursuant to Item 15(b) of this Report.
ITEM 16. FORM 10-K SUMMARY
None.
INTERFACE, INC. AND SUBSIDIARIES
SCHEDULE II – VALUATION AND QUALIFYING ACCOUNTS AND RESERVES
| | | | | | | | | | | | | | | | | | | | | | | | | | | | | |
| | COLUMN A
BALANCE, AT
BEGINNING
OF YEAR | | COLUMN B
CHARGED TO
COSTS AND
EXPENSES (A) | | COLUMN C
CHARGED TO
OTHER
ACCOUNTS | | COLUMN D
DEDUCTIONS
(DESCRIBE) (B) | | COLUMN E
BALANCE, AT
END OF YEAR |
| | (in thousands) |
| Allowance for Expected Credit Losses | | | | | | | | | |
| Year ended: | | | | | | | | | |
| December 29, 2024 | $ | 2,953 | | | $ | 1,154 | | | $ | — | | | $ | 312 | | | $ | 3,795 | |
| December 31, 2023 | 3,952 | | | (527) | | | — | | | 472 | | | 2,953 | |
| January 1, 2023 | 4,960 | | | (357) | | | — | | | 651 | | | 3,952 | |
(A)Includes changes in foreign currency exchange rates.
(B)Write off of bad debt and recovery of previously provided for amounts.
| | | | | | | | | | | | | | | | | | | | | | | | | | | | | |
| | COLUMN A
BALANCE, AT
BEGINNING
OF YEAR | | COLUMN B
CHARGED TO
COSTS AND
EXPENSES (A) | | COLUMN C
CHARGED
TO OTHER
ACCOUNTS | | COLUMN D
DEDUCTIONS
(DESCRIBE) (B) | | COLUMN E
BALANCE, AT
END OF YEAR |
| | (in thousands) |
| Warranty and Sales Allowances Reserves | | | | | | | | | |
| Year ended: | | | | | | | | | |
| December 29, 2024 | $ | 4,302 | | | $ | 855 | | | $ | — | | | $ | (97) | | | $ | 5,254 | |
| December 31, 2023 | 2,091 | | | 3,624 | | | — | | | 1,413 | | | 4,302 | |
| January 1, 2023 | 2,702 | | | (41) | | | — | | | 570 | | | 2,091 | |
(A)Includes changes in foreign currency exchange rates.
(B)Represents credits and costs applied against reserve and adjustments to reflect actual exposure.
(All other Schedules for which provision is made in the applicable accounting requirements of the Securities and Exchange Commission are omitted because they are either not applicable or the required information is shown in the Company’s consolidated financial statements or the notes thereto.)
SIGNATURES
Pursuant to the requirements of Section 13 or 15(d) of the Securities Exchange Act of 1934, the registrant has duly caused this Report to be signed on its behalf by the undersigned, thereunto duly authorized.
| | | | | | | | |
| Date: February 26, 2025 | | INTERFACE, INC. |
| | | |
| | By: | /s/ LAUREL M. HURD |
| | | Laurel M. Hurd |
| | | President and Chief Executive Officer |
POWER OF ATTORNEY
KNOW ALL PERSONS BY THESE PRESENTS, that each person whose signature appears below constitutes and appoints Laurel M. Hurd as attorney-in-fact, with power of substitution, for him or her in any and all capacities, to sign any amendments to this Report on Form 10-K, and to file the same, with exhibits thereto, and other documents in connection therewith, with the Securities and Exchange Commission, hereby ratifying and confirming all that said attorney-in-fact may do or cause to be done by virtue hereof.
Pursuant to the requirements of the Securities Exchange Act of 1934, this Report has been signed below by the following persons on behalf of the registrant and in the capacities and on the dates indicated.
| | | | | | | | | | | | | | | | | |
| Signature | | Capacity | | Date |
| | | | | | |
| /s/ LAUREL M. HURD | | | President, Chief Executive Officer and Director | | February 26, 2025 |
| Laurel M. Hurd | | | (Principal Executive Officer) | | |
| | | | | | |
| /s/ BRUCE A. HAUSMANN | | | Vice President and Chief Financial Officer | | February 26, 2025 |
| Bruce A. Hausmann | | | (Principal Financial Officer) | | |
| | | | | | |
| /s/ ROBERT PRIDGEN | | | Vice President and Chief Accounting Officer | | February 26, 2025 |
| Robert Pridgen | | | (Principal Accounting Officer) | | |
| | | | | |
| /s/ DANIEL T. HENDRIX | | | Director | | February 26, 2025 |
| Daniel T. Hendrix | | | | | |
| | | | | |
| /s/ JOHN P. BURKE | | | Director | | February 26, 2025 |
| John P. Burke | | | | | |
| | | | | | |
| /s/ DWIGHT GIBSON | | | Director | | February 26, 2025 |
| Dwight Gibson | | | | | |
| | | | | |
| /s/ CHRISTOPHER G. KENNEDY | | | Chairman of the Board | | February 26, 2025 |
| Christopher G. Kennedy | | | | | |
| | | | | | |
| /s/ JOSEPH KEOUGH | | | Director | | February 26, 2025 |
| Joseph Keough | | | | | |
| | | | | | |
| /s/ CATHERINE M. KILBANE | | | Director | | February 26, 2025 |
| Catherine M. Kilbane | | | | | |
| | | | | | |
| /s/ K. DAVID KOHLER | | | Director | | February 26, 2025 |
| K. David Kohler | | | | | |
| | | | | | |
| /s/ CATHERINE MARCUS | | | Director | | February 26, 2025 |
| Catherine Marcus | | | | | |
| | | | | |
| /s/ ROBERT T. O’BRIEN | | | Director | | February 26, 2025 |
| Robert T. O’Brien | | | | | |