Exhibit 99.3
I N T E R F A C E Interface, Inc. Investor Presentation February 2006
Forward Looking Statements This presentation contains forward-looking statements, including, in particular, statements about Interface’s plans, strategies and prospects. These are based on the Company’s current assumptions, expectations and projections about future events. Although Interface believes that the expectations reflected in these forward-looking statements are reasonable, the Company can give no assurance that these expectations will prove to be correct or that savings or other benefits anticipated in the forward-looking statements will be achieved. Important factors, some of which may be beyond the company’s control, that could cause actual results to differ materially from management’s expectations are discussed under the heading “Safe Harbor Compliance Statement for Forward-Looking Statements” included in Item 1 of the Company’s Annual Report on Form 10-K for the fiscal year ended January 2, 2005, which discussion is hereby incorporated by reference. Forward-looking statements speak only as of the date made. The Company assumes no responsibility to update or revise forward-looking statements and cautions listeners and conference attendees not to place undue reliance on any such statements.
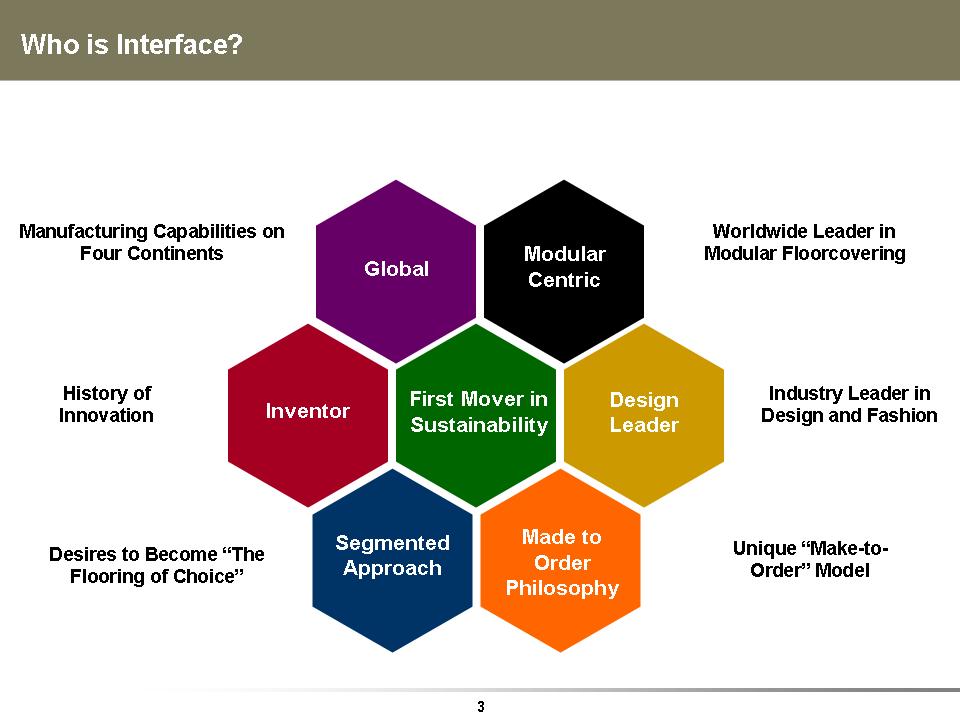
Who is Interface? Global Inventor First Mover in Sustainability Design Leader Modular Centric Segmented Approach Made to Order Philosophy Manufacturing Capabilities on Four Continents Industry Leader in Design and Fashion Desires to Become “The Flooring of Choice” Unique “Make-to-Order” Model History of Innovation Worldwide Leader in Modular Floorcovering
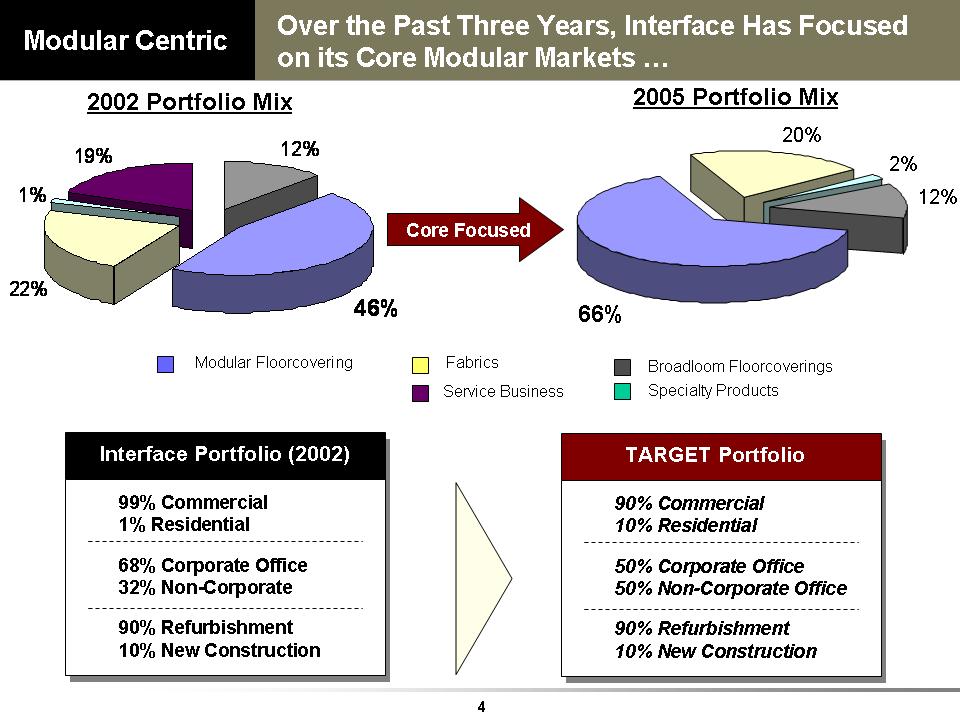
66% 12% 2% 20% Over the Past Three Years, Interface Has Focused on its Core Modular Markets …99% Commercial 1% Residential68% Corporate Office 32% Non-Corporate90% Refurbishment 10% New Construction Interface Portfolio (2002) 90% Commercial 10% Residential50% Corporate Office 50% Non-Corporate Office 90% Refurbishment 10% New Construction TARGET Portfolio2005 Portfolio Mix Core Focused Modular Floorcovering Fabrics Specialty Products Broadloom Floorcoverings2002 Portfolio Mix Service Business46%12%19%1%22%Modular Centric
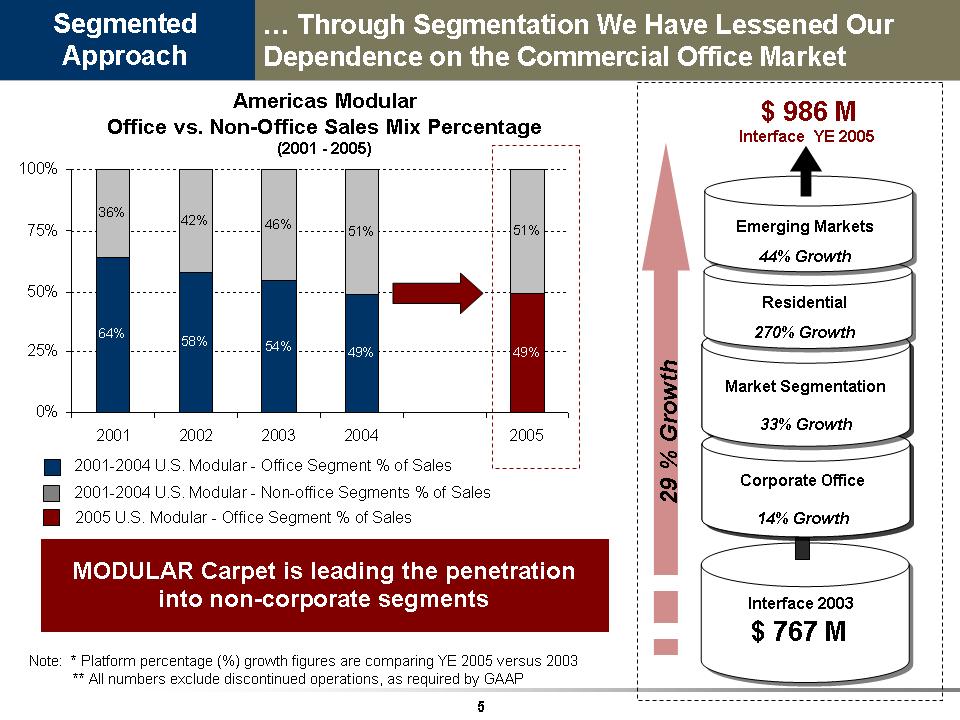
Segmented Approach …Through Segmentation We Have Lessened Our Dependence on the Commercial Office Market 64% 58% 54% 49% 49% 36% 42% 46% 51% 51% 0% 25% 50% 75% 100% 2001 2002 2003 2004 2005Americas Modular Office vs. Non-Office Sales Mix Percentage (2001 -2005)2001-2004 U.S. Modular -Office Segment % of Sales 2005 U.S. Modular -Office Segment % of Sales MODULAR Carpet is leading the penetration into non-corporate segments29 % Growth Note: * Platform percentage (%) growth figures are comparing YE2005 versus 2003** All numbers exclude discontinued operations, as required by GAAP2001-2004 U.S. Modular -Non-office Segments % of Sales Emerging Markets44% Growth$ 986 M Interface YE 2005 Residential 270% Growth Corporate Office14% Growth Interface 2003 Market Segmentation 33% Growth $ 767 M
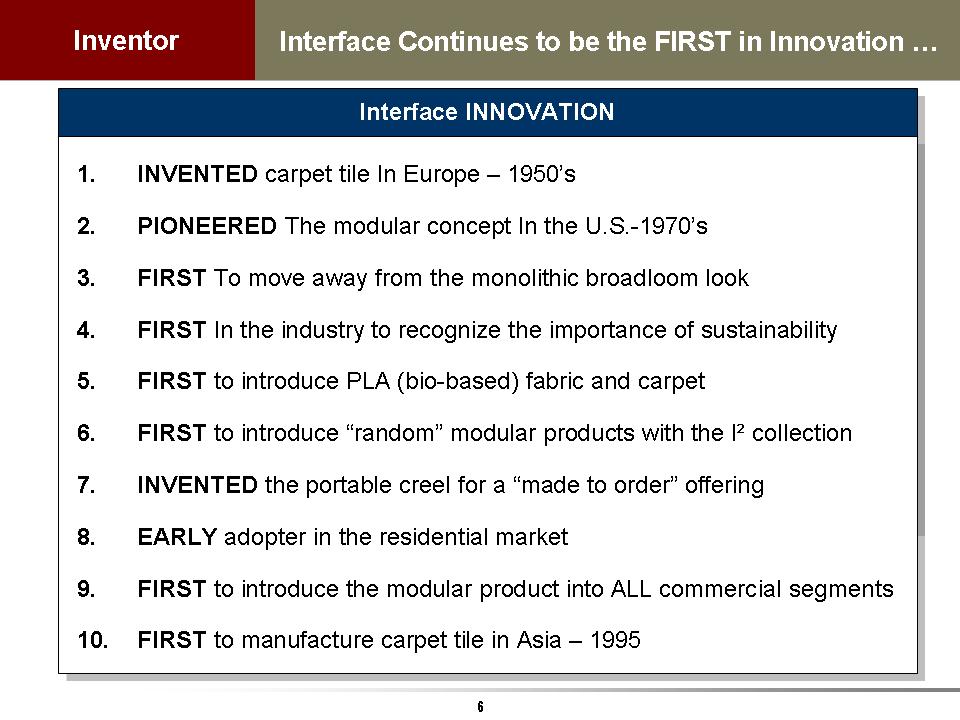
Interface Continues to be the FIRST in Innovation …1.INVENTED carpet tile In Europe -1950’s 2. PIONEERED The modular concept In the U.S.-1970’s 3. FIRST To move away from the monolithic broadloom look 4. FIRST In the industry to recognize the importance of sustainability 5. FIRST to introduce PLA (bio-based) fabric and carpet 6. FIRST to introduce “random” modular products with the I² collection 7. INVENTED the portable creel for a “made to order”offering 8. EARLYadopter in the residential market 9. FIRST to introduce the modular product into ALL commercial segments 10. FIRST to manufacture carpet tile in Asia -1995 Interface INNOVATION Inventor
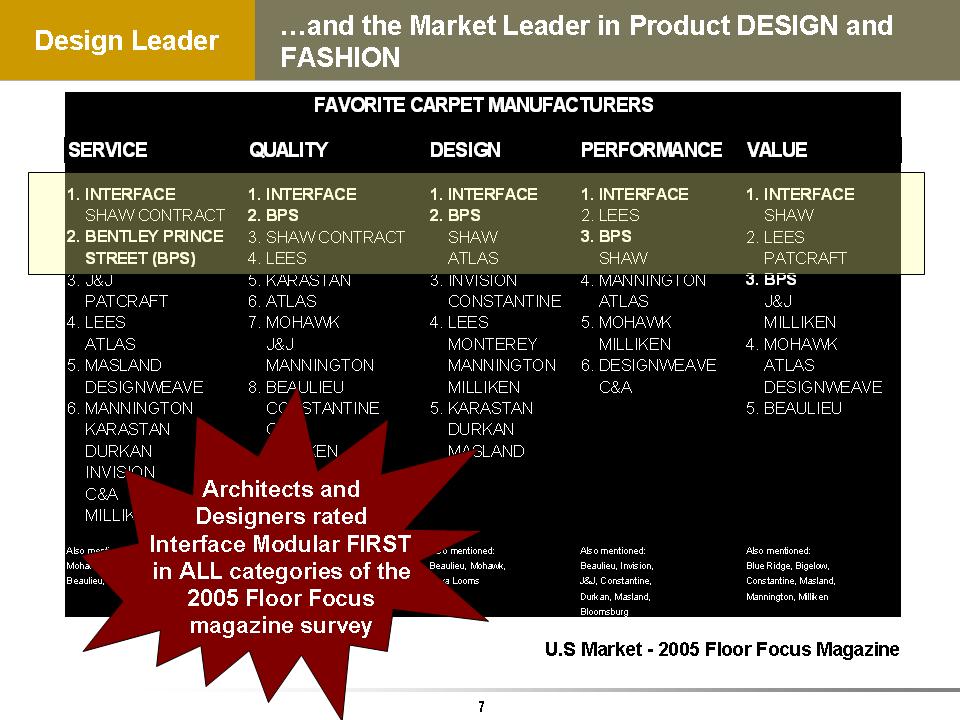
SERVICE QUALITY DESIGN PERFORMANCE VALUE 1. INTERFACE 1. INTERFACE 1. INTERFACE 1. INTERFACE 1. INTERFACE SHAW CONTRACT 2. BPS 2. BPS 2. LEES SHAW 2. BENTLEY PRINCE 3. SHAW CONTRACT SHAW 3. BPS 2. LEES STREET (BPS) 4. LEES ATLAS SHAW PATCRAFT 3. J&J5. KARASTAN 3. INVISION 4. MANNINGTON 3. BPS PATCRAFT 6. ATLAS CONSTANTINE ATLAS J&J4. LEES 7. MOHAWK 4. LEES 5. MOHAWK MILLIKEN ATLAS J&J MONTEREY MILLIKEN 4. MOHAWK 5. MASLAND MANNINGTON MANNINGTON 6. DESIGNWEAVE ATLAS DESIGNWEAVE8. BEAULIEU MILLIKEN C&A DESIGNWEAVE 6. MANNINGTON CONSTANTINE 5. KARASTAN 5. BEAULIEU KARASTAN C&A DURKAN DURKAN MILLIKEN MASLAND INVISION C&A MILLIKEN Also mentioned:Also mentioned: Also mentioned: Also mentioned: Also mentioned: Mohawk, Blue Ridge, Blue Ridge, Masland, Beaulieu, Mohawk, Beaulieu, Invision, Blue Ridge, Bigelow, Beaulieu, Constantine Burtco, Designweave, Tuva Looms J&J, Constantine, Constantine, Masland ,Masland, Monterey, Durkan, Masland, Mannington, Milliken Patcraft Bloomsburg FAVORITE CARPET MANUFACTURERS…and the Market Leader in Product DESIGN and FASHIONU.S Market -2005 Floor Focus Magazine Architects and Designers rated Interface Modular FIRST in ALL categories of the 2005 Floor Focus magazine survey Design Leader

Make-to-Order Philosophy Interface Maintains a Strong Competitive Advantage Through its Made to Order Philosophy Interface Operational Model INVENTORY TURNS % MADE TO ORDER Americas Modular 1 120% 100% Asia Pacific Modular Europe Modular Fabrics Americas Broadloom1.Increases speed to market 2.Offers unique custom product capabilities3.Supports a constant flow of new products 4.Offers sales force the opportunity to visit the customer with new product 5.Decreases lead time to customers 6.Offers differentiation to support high price points and fight commoditization 7.Increases inventory turns 8.Promotes innovation and manufacturing process adaptability The Made to Order ADVANTAGE Interface is the ONLY company with a “make-to-order” approach to the market
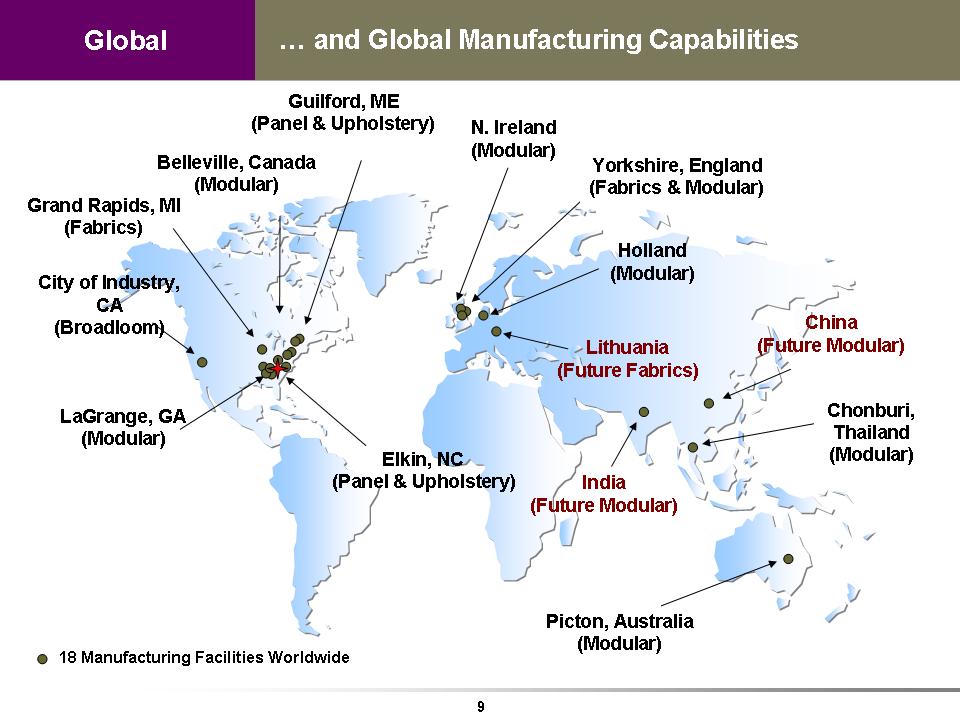
Global …and Global Manufacturing Capabilities Guilford, ME (Panel & Upholstery) LaGrange, GA (Modular)18 Manufacturing Facilities Worldwide Yorkshire, England (Fabrics & Modular) Picton, Australia (Modular) Belleville, Canada (Modular) Chonburi, Thailand (Modular) City of Industry, CA (Broadloom) Holland (Modular) China (Future Modular) Lithuania (Future Fabrics) Elkin, NC (Panel & Upholstery) Grand Rapids, MI (Fabrics) N. Ireland (Modular) India (Future Modular)
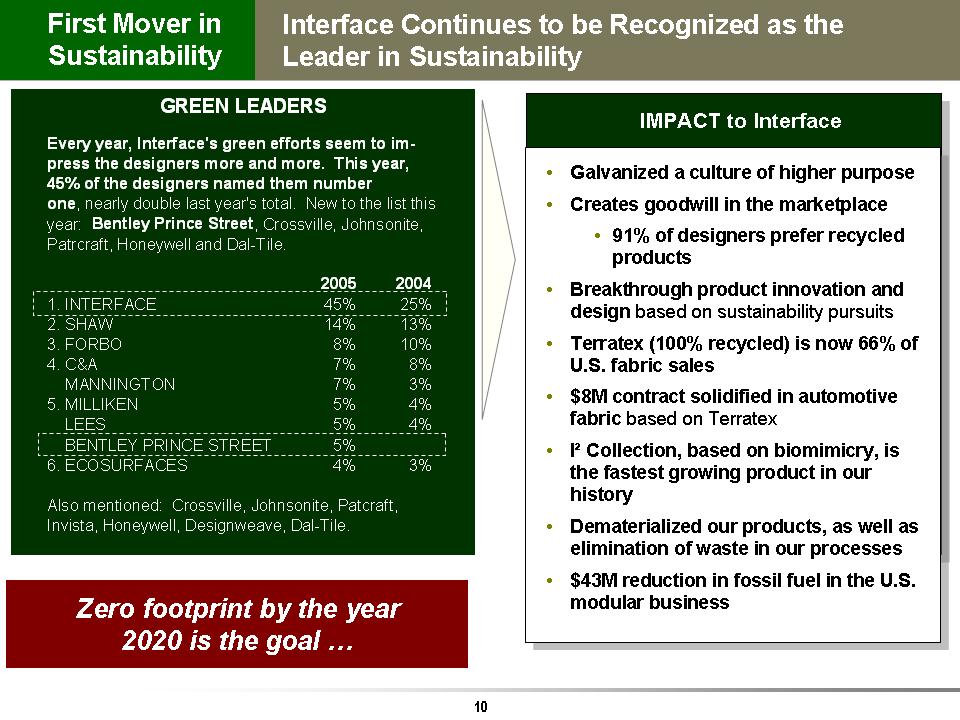
IMPACT to Interface •Galvanized a culture of higher purpose • Creates goodwill in the marketplace • 91% of designers prefer recycled products • Breakthrough product innovation and design based on sustainability pursuits • Terratex (100% recycled) is now 66% of U.S. fabric sales • $8M contract solidified in automotive fabric based on Terratex • I²Collection, based on biomimicry, is the fastest growing product in our history • Dematerialized our products, as well as elimination of waste in our processes•$43M reduction in fossil fuel in the U.S. modular business Interface Continues to be Recognized as the Leader in Sustainability Zero footprint by the year 2020 is the goal …Every year, Interface's green efforts seem to im-press the designers more and more. This year,45% of the designers named them number one, nearly double last year's total. New to the list this year: Bentley Prince Street, Crossville, Johnsonite, Patrcraft, Honeywell and Dal-Tile.2005 2004 1. INTERFACE 45% 25% 2. SHAW 14% 13% 3. FORBO 8% 10% 4. C&A 7% 8% MANNINGTON 7% 3% 5. MILLIKEN 5% 4% LEES 5% 4% BENTLEY PRINCE STREET 5% 6. ECOSURFACES 4% 3% Also mentioned: Crossville, Johnsonite, Patcraft, Invista, Honeywell, Designweave, Dal-Tile. GREEN LEADERS First Mover in Sustainability

…The Turnaround Story Where Have We Been?
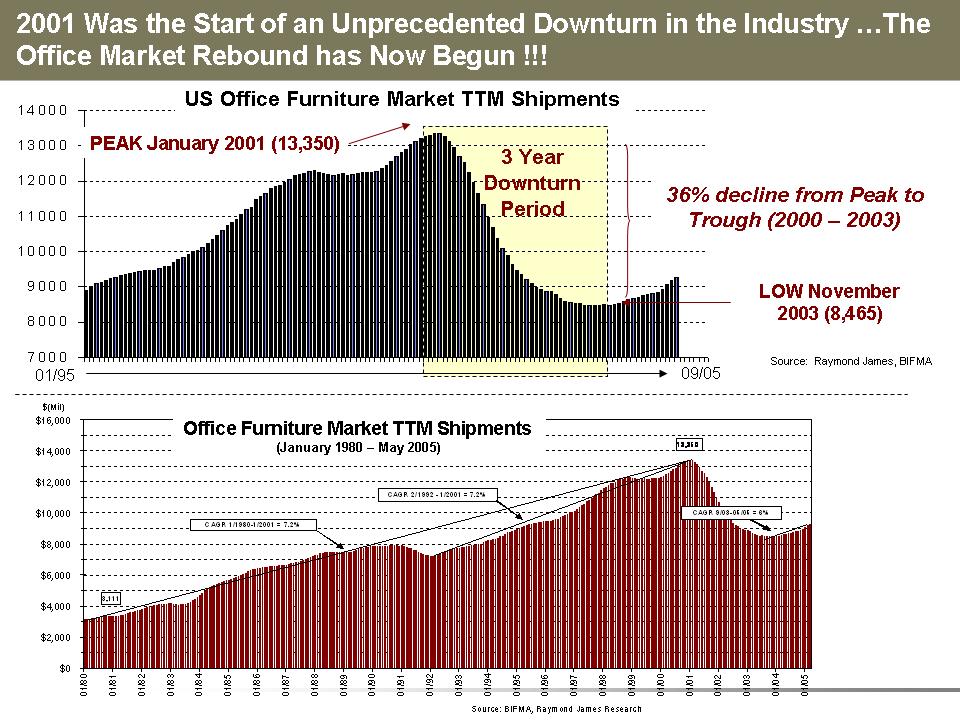
70008000900010000110001200013000140002001 Was the Start of an Unprecedented Downturn in the Industry …The Office Market Rebound has Now Begun !!! US Office Furniture Market TTM Shipments 36% decline from Peak to Trough (2000 -2003)01/9509/05Source: Raymond James, BIFMAPEAK January 2001 (13,350)LOW November 2003 (8,465)3 Year Downturn Period Office Furniture Market Trailing Twelve Months Shipments January 1980 - May 200513, 3503,111 $0 $2,000 $4,000 $6,000 $8,000 $10,000 $12,000 $14,000 $16,0000 1/8001/8101/8201/8301/8401/8501/8601/8701/8801/8901/9001/9101/9201/9301/9401/9501/9601/9701/9801/9901/0001/0101/0201/0301/0401/05$(Mil)Source: BIFMA, Raymond James Research CAGR 1/1980-1/2001 = 7.2%CAGR 2/1992 - 1/2001 = 7.2% CAGR 9/03-05/05 = 6% Office Furniture Market TTM Shipments (January 1980 -May 2005)
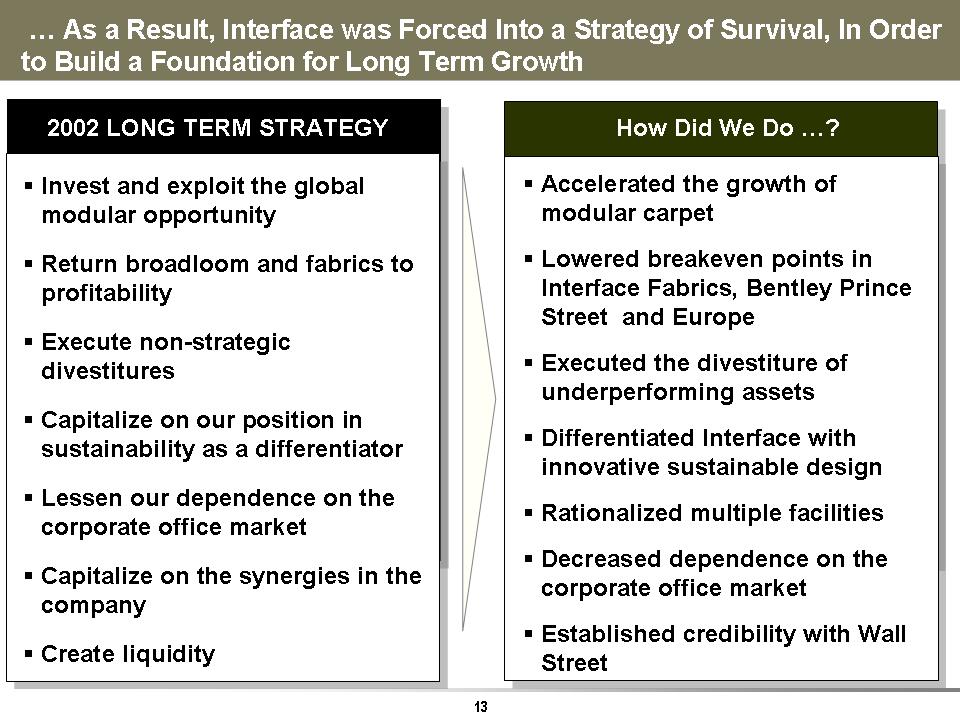
How Did We Do …?…As a Result, Interface was Forced Into a Strategy of Survival, In Order to Build a Foundation for Long Term Growth Invest and exploit the global modular opportunity Return broadloom and fabrics to profitability Execute non-strategic divestitures Capitalize on our position in sustainability as a differentiat or Lessen our dependence on the corporate office market Capitalize on the synergies in the company Create liquidity Accelerated the growth of modular carpet Lowered breakeven points in Interface Fabrics, Bentley Prince Street and Europe Executed the divestiture of underperforming assets Differentiated Interface with innovative sustainable design Rationalized multiple facilities Decreased dependence on the corporate office market Established credibility with Wall Street2002 LONG TERM STRATEGY
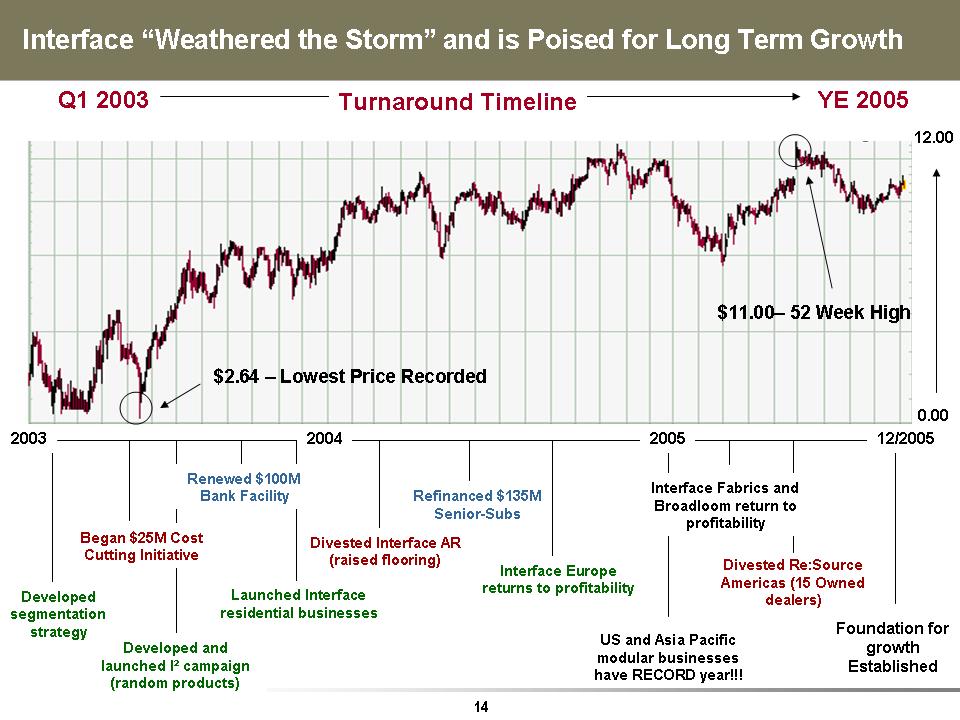
US and Asia Pacific modular businesses have RECORD year!!! Interface “Weathered the Storm” and is Poised for Long Term Growth Divested Re:Source Americas (15 Owned dealers)Refinanced $135M Senior-Subs Developed and launched I²campaign (random products)Launched Interface residential businesses Began $25M Cost Cutting Initiative Developed segmentation strategy Interface Fabrics and Broadloom return to profitability Renewed $100M Bank Facility Divested Interface AR (raised flooring)Q1 2003 YE 2005Turnaround Timeline $2.64 -Lowest Price Recorded $11.00-52 Week High 0.00 2003 2004 2005 12/2005 Foundation for growth Established Interface Europe returns to profitability12.00
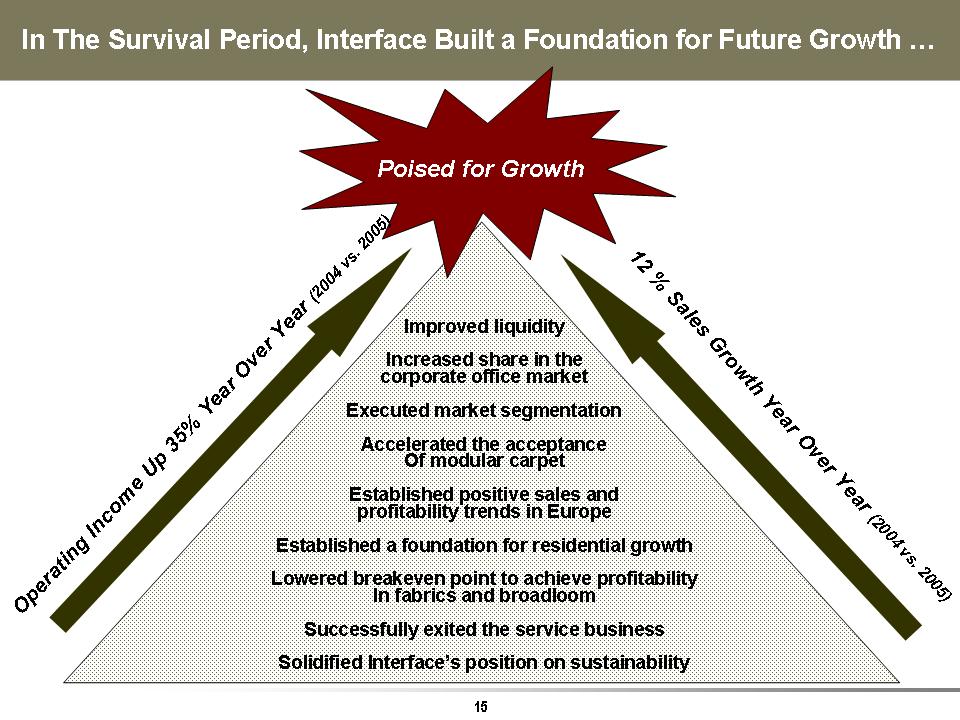
Poised for Growth In The Survival Period, Interface Built a Foundation for Future Growth …Improved liquidity Increased share in the corporate office market Executed market segmentation Accelerated the acceptance Of modular carpet Established positive sales and profitability trends in Europe Established a foundation for residential growth Lowered breakeven point to achieve profitability In fabrics and broadloom Successfully exited the service business Solidified Interface’s position on sustainability Operating Income Up 35% Year Over Year (2004 vs. 2005)12 % Sales Growth Year Over Year (2004 vs. 2005)
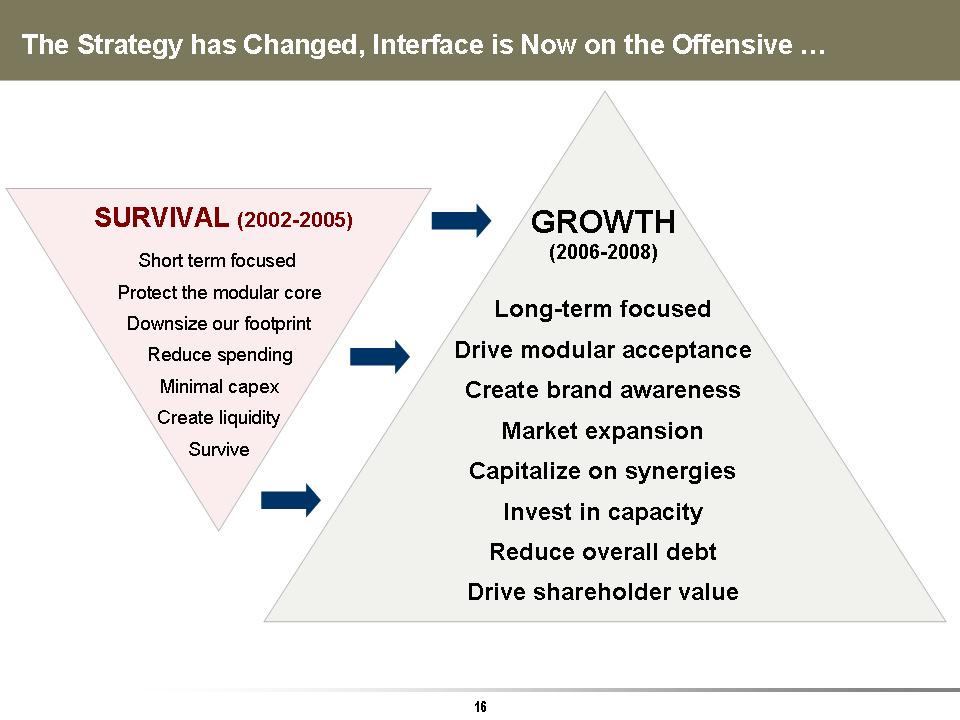
GROWTH (2006-2008 )Long-term focused Drive modular acceptance Create brand awareness Market expansion Capitalize on synergies Invest in capacity Reduce overall debt Drive shareholder value The Strategy has Changed, Interface is Now on the Offensive …SURVIVAL (2002-2005) Short term focused Protect the modular core Downsize our footprint Reduce spending Minimal capex Create liquidity Survive

How are We Positioned …?Where are Our Opportunities …?The Marketplace Has Momentum and Interface is Positioned to Capture the Opportunities for GROWTH …Modular Carpet -accelerates acceptance in ALL flooring segments Segmentation -Hospitality, Healthcare, Retail and Education Emerging Markets -China, India, SE Asia and the Middle East Sustainability -now in favor Automotive Segment -Interface Fabrics Residential Opportunity -$11 billion market untapped Rebounding Office Market-in the second year of a recovery Interface is leading the worldwide modular carpet expansion Our make-to-order philosophy simplifies our approach Our global capabilities give us a competitive advantage Our first mover status has created tremendous goodwill Terratex has been specified in a 2007 hybrid car Interface has been successful in introducing carpet tile as a residential flooring alternative We are well-positioned to participate in the office market rebound
…Becoming the Flooring of Choice An Introduction to Carpet Tile
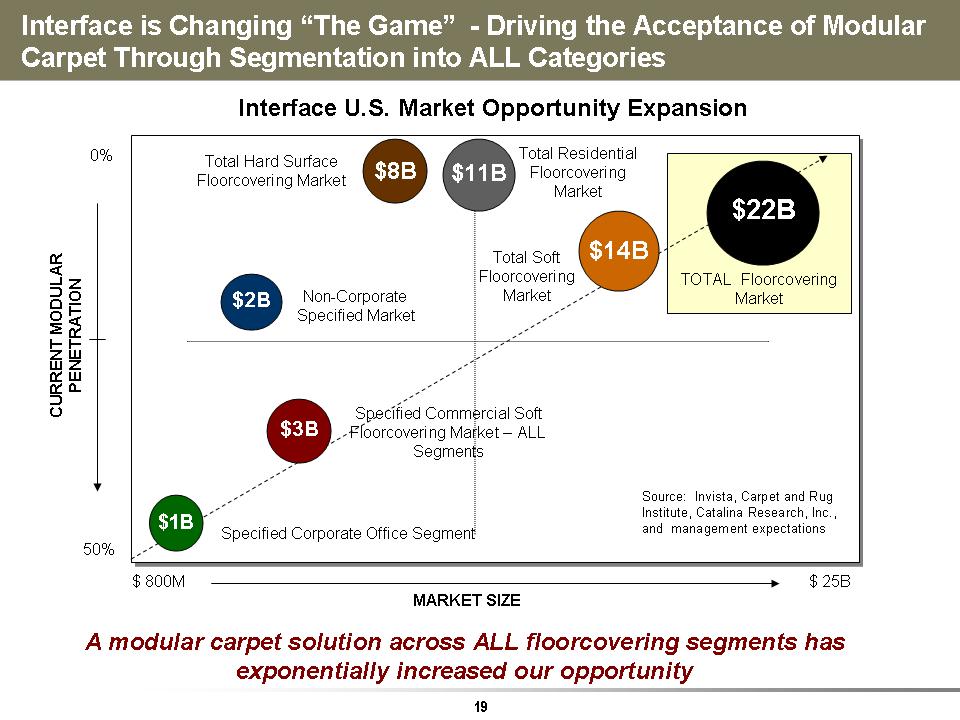
Interface is Changing “The Game”-Driving the Acceptance of Modular Carpet Through Segmentation into ALL Categories MARKET SIZE CURRENT MODULAR PENETRATION 50% 0% $2B Specified Corporate Office Segment Non-Corporate Specified Market $ 800M $ 25BSpecified Commercial Soft Floorcovering Market -ALL Segments Total Soft Floorcovering Market Total Residential Floorcovering Market TOTAL Floorcovering Market A modular carpet solution across ALL floorcovering segments has exponentially increased our opportunity $8BTotal Hard Surface Floorcovering Market $3B $14B $11B $1B $22B Interface U.S. Market Opportunity ExpansionSource: Invista, Carpet and Rug Institute, Catalina Research, Inc., and management expectations
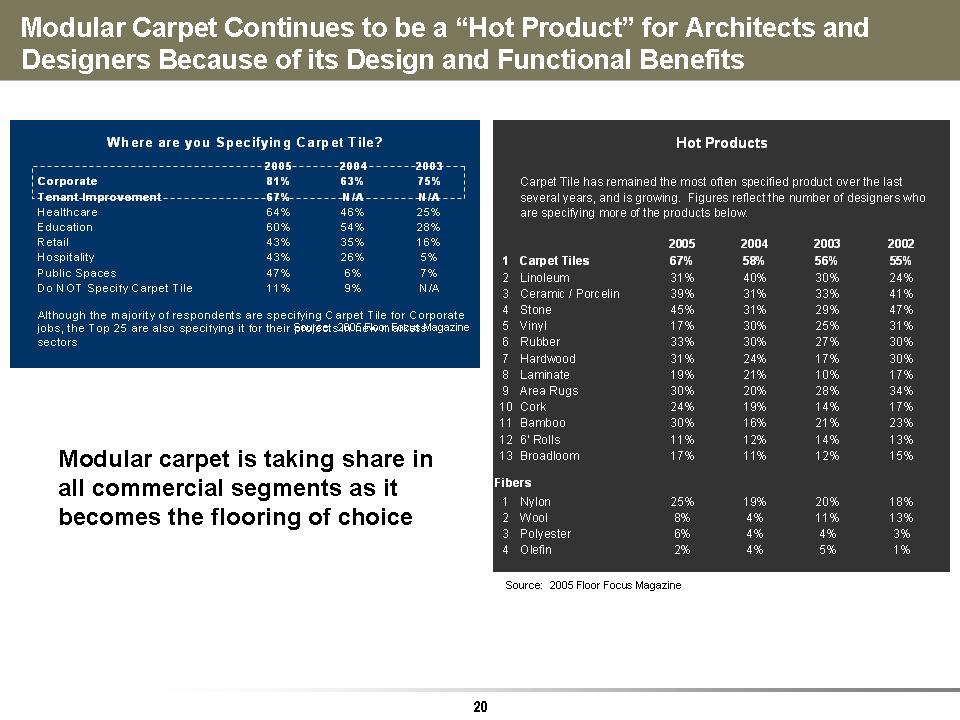
Modular Carpet Continues to be a “Hot Product” for Architects and Designers Because of its Design and Functional Benefits 2005 2004 2003 Corporate 81% 63% 75%Tenant Improvement 67% N/AN/A Healthcare 64% 46% 25% Education 60% 54% 28% Retail 43% 35% 16% Hospitality 43% 26% 5% Public Spaces 47% 6% 7% Do NOT Specify Carpet Tile 11% 9% N/A Where are you Specifying Carpet Tile? Although the majority of respondents are specifying Carpet Tile for Corporate jobs, the Top 25 are also specifying it for their projects in new markets sectors Source: 2005 Floor Focus Magazine Modular carpet is taking share in all commercial segments as it becomes the flooring of choice Source: 2005 Floor Focus Magazine2005 2004 2003 2002 1Carpet Tiles 67% 58% 56% 55% 2 Linoleum 31% 40% 30% 24% 3 Ceramic / Porcelin 39% 31% 33% 41% 4 Stone 45% 31% 29% 47% 5 Vinyl 17% 30% 25% 31% 6 Rubber 33% 30% 27% 30% 7 Hardwood 31% 24% 17% 30% 8 Laminate 19% 21% 10% 17% 9 Area Rugs 30% 20% 28% 34% 10 Cork 24% 19% 14% 17% 11 Bamboo 30% 16% 21% 23% 126' Rolls 11% 12% 14% 13% 13 Broadloom 17% 11% 12% 15% 1 Nylon 25% 19% 20% 18% 2 Wool 8% 4% 11% 13% 3 Polyester 6% 4% 4% 3% 4 Olefin 2% 4% 5% 1% Carpet Tile has remained the most often specified product over the last several years, and is growing. Figures reflect the number of designers who are specifying more of the products below. FibersHot Products
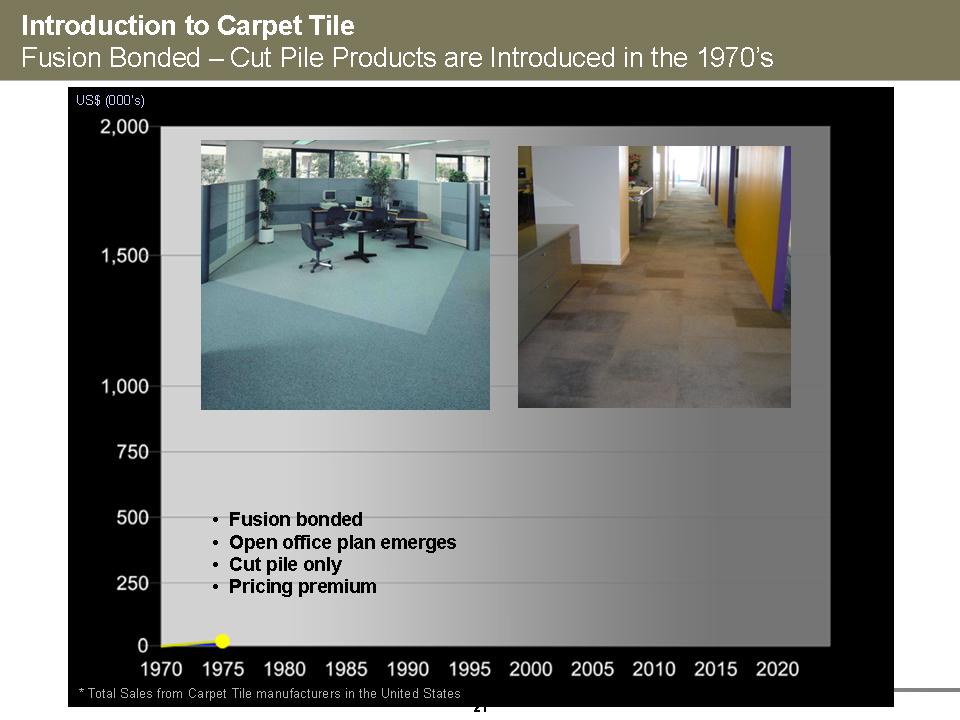
21•Fusion bonded •Open office plan emerges • Cut pile only • Pricing premium Introduction to Carpet Tile Fusion Bonded -Cut Pile Products are Introduced in the 1970’s U S$ (000’s)* Total Sales from Carpet Tile manufacturers in the United States
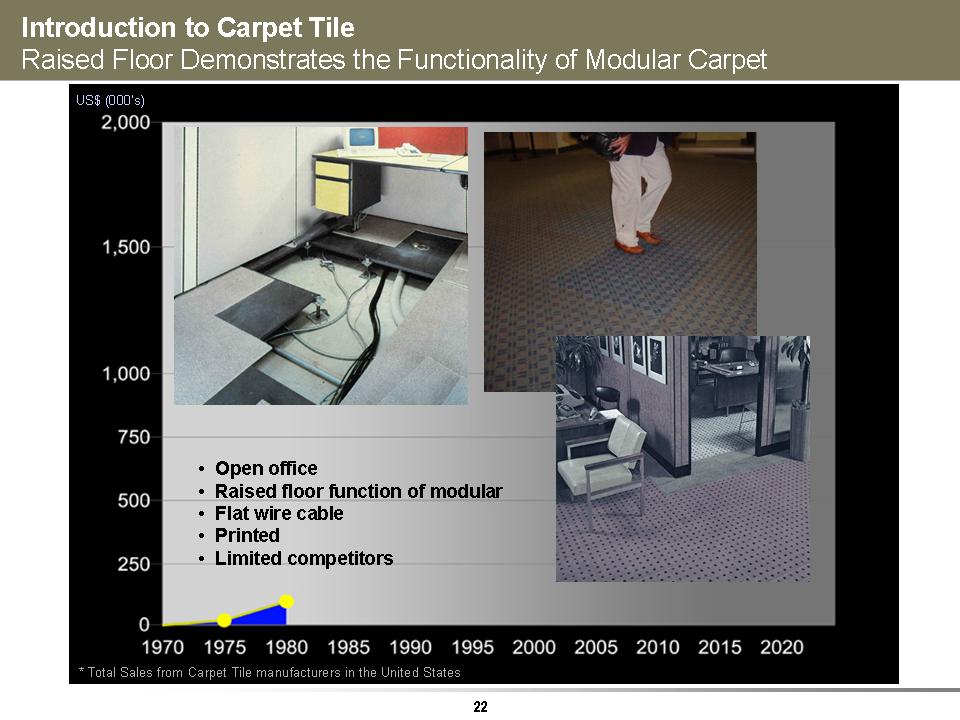
•Open office • Raised floor function of modular •Flat wire cable • Printed • Limited competitors Introduction to Carpet Tile Raised Floor Demonstrates the Functionality of Modular Carpet US$ (000’s)* Total Sales from Carpet Tile manufacturers in the United States
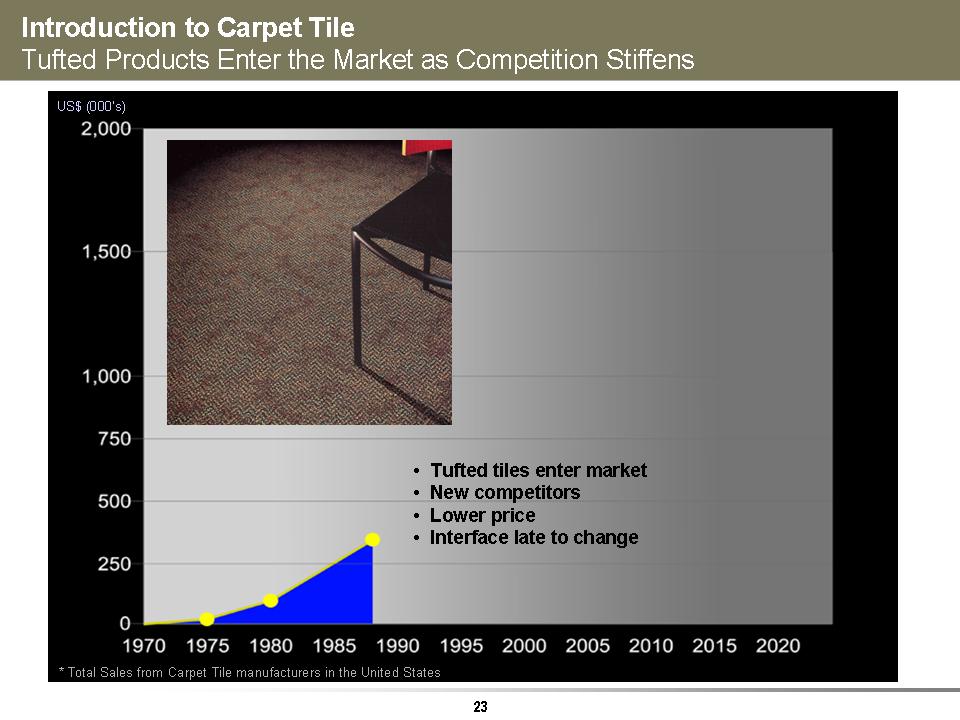
•Tufted tiles enter market • New competitors •Lower price • Interface late to change Introduction to Carpet Tile Tufted Products Enter the Market as Competition Stiffens US $ (000’s)* Total Sales from Carpet Tile manufacturers in the United States
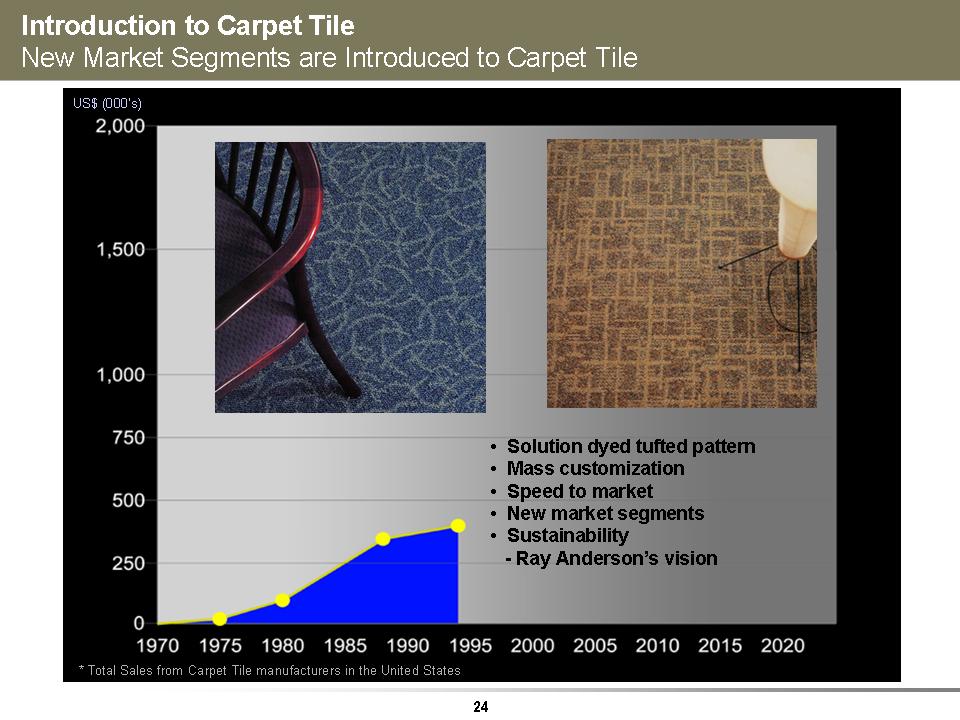
•Solution dyed tufted pattern • Mass customization •Speed to market • New market segments • Sustainability-Ray Anderson’s vision Introduction to Carpet Tile New Market Segments are Introduced to Carpet Tile US$ (000’s)* Total Sales from Carpet Tile manufacturers in the United States
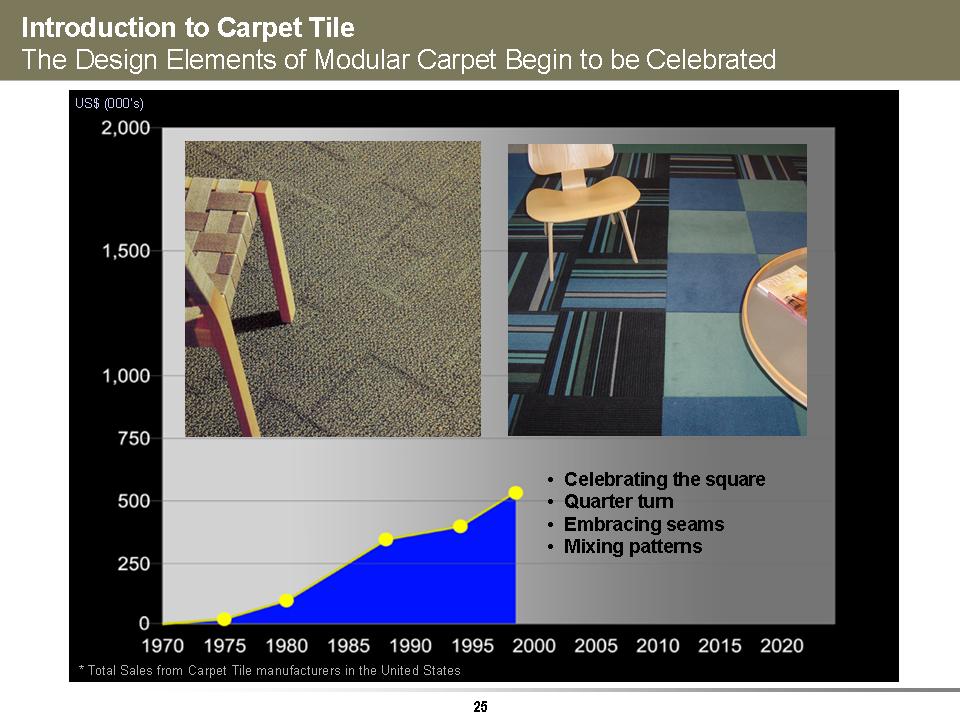
•Celebrating the square • Quarter turn •Embracing seams •Mixing patterns Introduction to Carpet Tile The Design Elements of Modular Carpet Begin to be Celebrated US$ (000’s)* Total Sales from Carpet Tile manufacturers in the United States
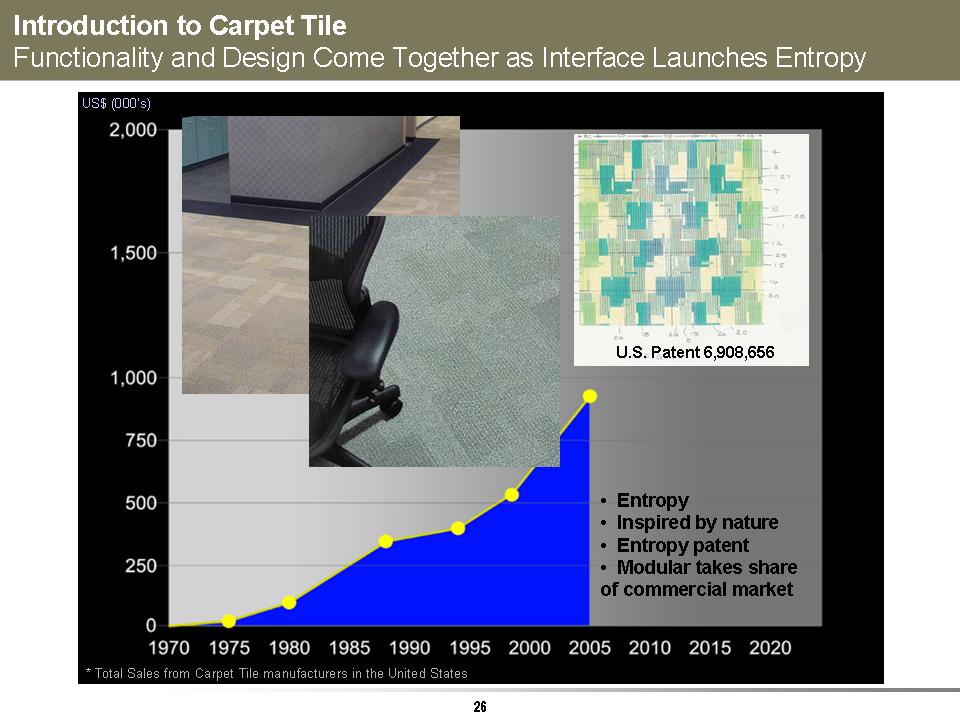
•Entropy • Inspired by nature •Entropy patent • Modular takes share of commercial market U.S. Patent 6,908,656 Introduction to Carpet Tile Functionality and Design Come Together as Interface Launches Entropy US$ (000’s)* Total Sales from Carpet Tile manufacturers in the United States
…Poised for Growth Where Are We Going …?
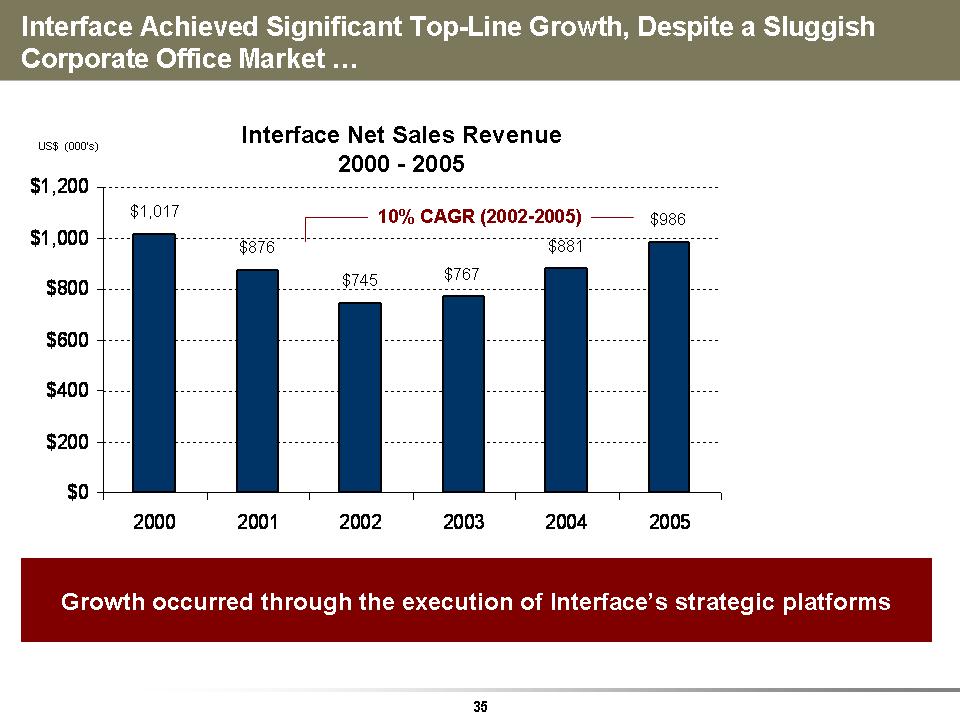
$1,017 $876 $745 $767 $881 $986 $0 $200 $400 $600 $800 $1,000 $1,200 2000 2001 2002 2003 2004 2005 Interface Achieved Significant Top-Line Growth, Despite a Sluggish Corporate Office Market …US$ (000’s)Growth occurred through the execution of Interface’s strategic platforms Interface Net Sales Revenue 2000 -2005 10% CAGR (2002-2005)
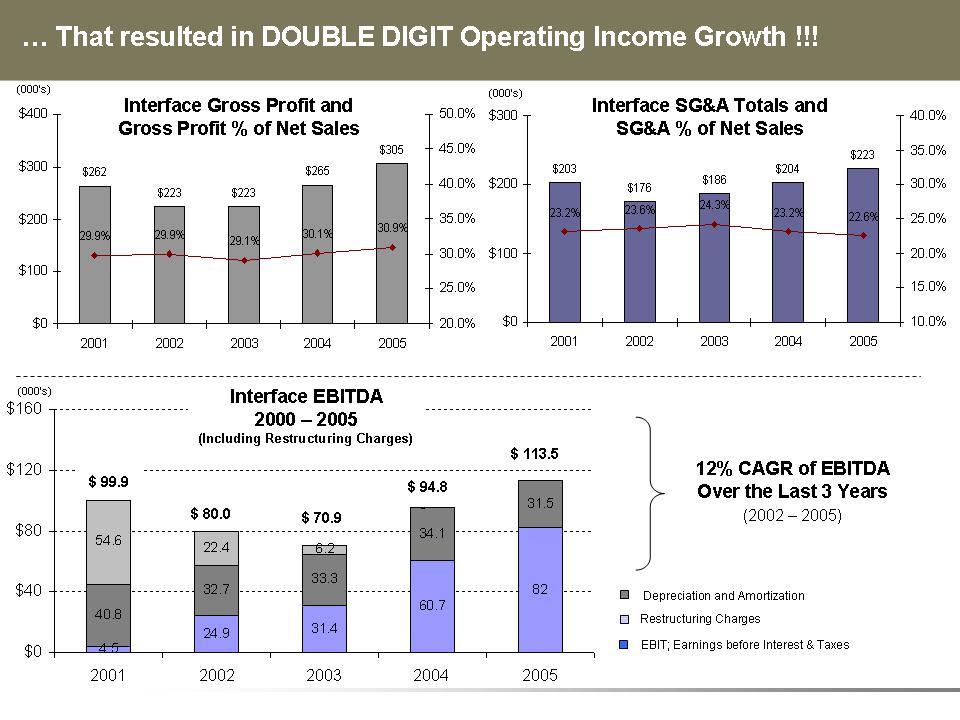
4.52 4.9 31.4 60.78 240.8 32.7 33.3 34.1 31.5 54.6 22.4 6.2-$0 $40 $80 $120 $160 2001 2002 2003 2004 2005…That resulted in DOUBLE DIGIT Operating Income Growth !!! Interface Gross Profit and Gross Profit % of Net Sales Interface SG&A Totals and SG&A % of Net Sales Restructuring Charges Interface EBITDA 2000 -2005 (Including Restructuring Charges) EBIT; Earnings before Interest & Taxes $ 99.9 $ 80.0 $ 70.9 $ 94.8 (000’s) $ 113.5 12% CAGR of EBITDA Over the Last 3 Years (2002 -2005) Depreciation and Amortization $262 $223 $223 $265 $305 29.9% 29.9% 29.1% 30.1% 30.9% $0 $100 $200 $300 $400 2001 2002 2003 2004 2005 20.0% 25.0% 30.0% 35.0% 40.0% 45.0% 50.0% $203 $176 $186 $204 $223 23.2% 23.6% 24.3% 23.2% 22.6% $0 $100 $200 $300 2001 2002 2003 2004 2005 10.0% 15.0% 20.0% 25.0% 30.0% 35.0% 40.0% (000’s) (000’s)
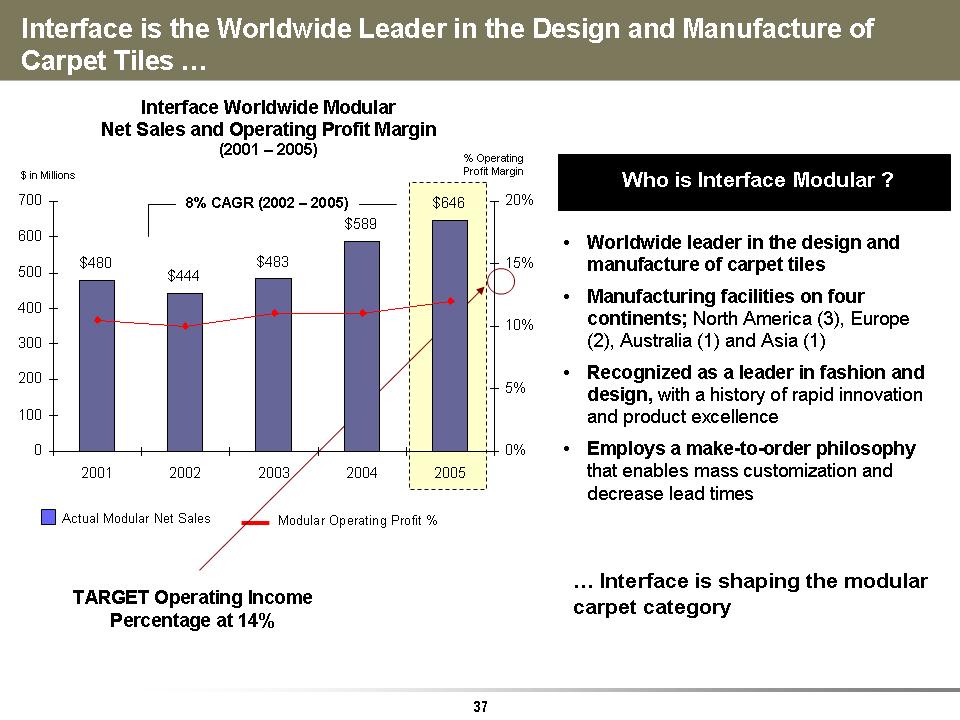
TARGET Operating Income Percentage at 14%…Interface is shaping the modular carpet category Interface Worldwide Modular Net Sales and Operating Profit Margin (2001 -2005) Interface is the Worldwide Leader in the Design and Manufacture of Carpet Tiles …$ in Millions % Operating Profit Margin Modular Operating Profit % Actual Modular Net Sales 8% CAGR (2002 -2005) • Worldwide leader in the design and manufacture of carpet tiles • Manufacturing facilities on four continents; North America (3), Europe (2), Australia (1) and Asia (1) • Recognized as a leader in fashion and design, with a history of rapid innovation and product excellence • Employs a make-to-order philosophythat enables mass customization and decrease lead times Who is Interface Modular ? $480 $444 $483 $589 $64 60 100 200 300 400 500 600 700 2001 2002 2003 2004 2005 0% 5% 10% 15% 20%
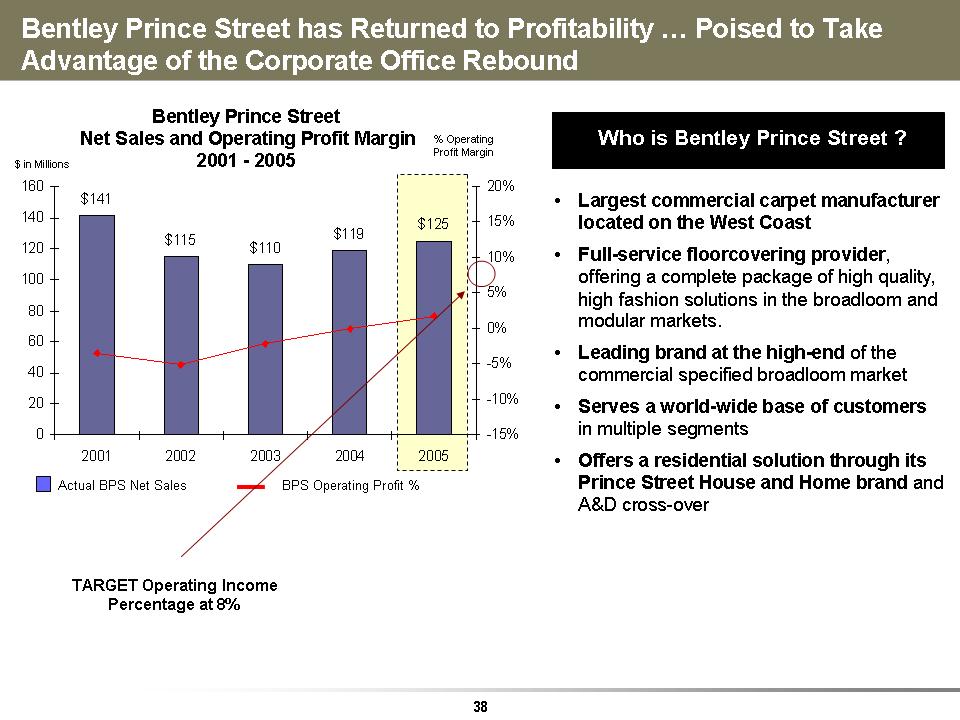
$141 $115 $110 $119 $125 0 20 40 60 80 1001 20 14 01 60 2001 2002 2003 2004 2005-15%-10%-5% 0% 5% 10% 15% 20% Bentley Prince Street has Returned to Profitability …Poised to Take Advantage of the Corporate Office Rebound Bentley Prince Street Net Sales and Operating Profit Margin 2001 -2005 $ in Millions BPS Operating Profit %Actual BPS Net Sales% Operating Profit Margin • Largest commercial carpet manufacturer located on the West Coast • Full-service floorcovering provider, offering a complete package of high quality, high fashion solutions in the broadloom and modular markets. •Leading brand at the high-end of the commercial specified broadloom market • Serves a world-wide base of customers in multiple segments • Offers a residential solution through its Prince Street House and Home brand and A&D cross-over Who is Bentley Prince Street ? TARGET Operating Income Percentage at 8%
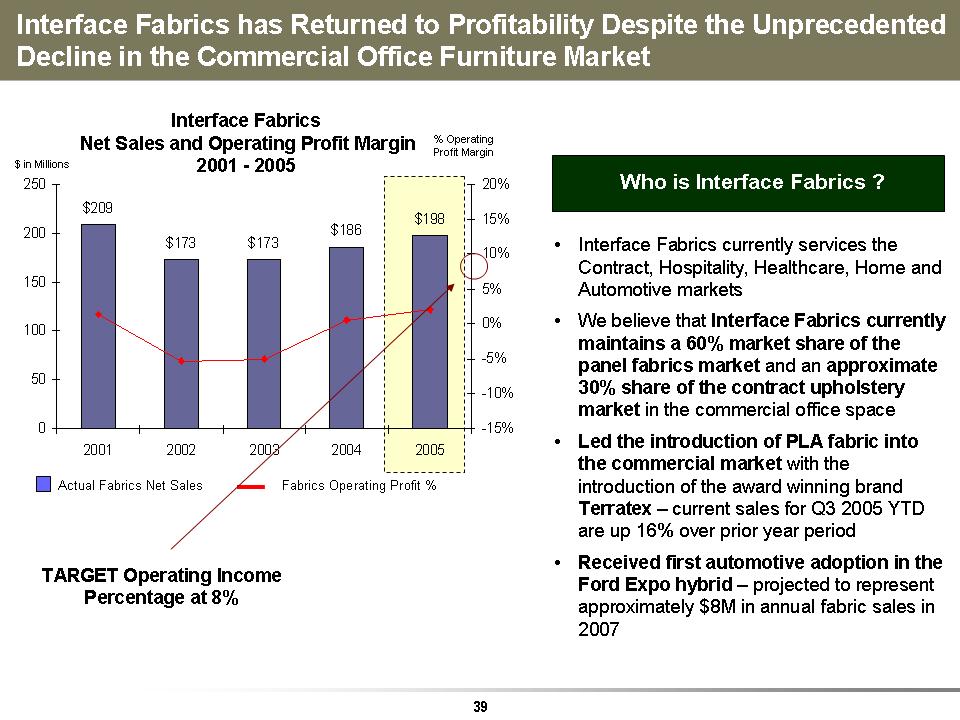
$141 $115 $110 $119 $125 0 20 40 60 80 1001 20 14 01 60 2001 2002 2003 2004 2005-15%-10%-5% 0% 5% 10% 15% 20% Bentley Prince Street has Returned to Profitability …Poised to Take Advantage of the Corporate Office Rebound Bentley Prince Street Net Sales and Operating Profit Margin 2001 -2005 $ in Millions BPS Operating Profit %Actual BPS Net Sales% Operating Profit Margin • Largest commercial carpet manufacturer located on the West Coast • Full-service floorcovering provider, offering a complete package of high quality, high fashion solutions in the broadloom and modular markets. •Leading brand at the high-end of the commercial specified broadloom market • Serves a world-wide base of customers in multiple segments • Offers a residential solution through its Prince Street House and Home brand and A&D cross-over Who is Bentley Prince Street ? TARGET Operating Income Percentage at 8%
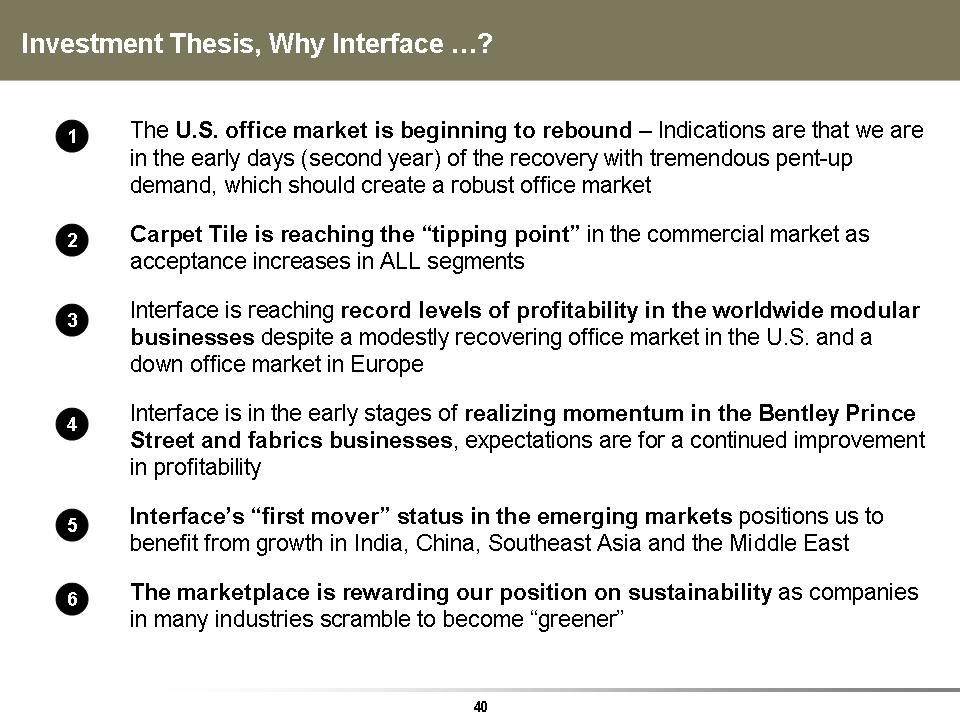
Investment Thesis, Why Interface …?The U.S. office market is beginning to rebound-Indications are that we are in the early days (second year) of the recovery with tremendous pent-up demand, which should create a robust office market Carpet Tile is reaching the “tipping point” in the commercial market as acceptance increases in ALL segments Interface is reaching record levels of profitability in the worldwide modular businesses despite a modestly recovering office market in the U.S. and a down office market in Europe Interface is in the early stages of realizing momentum in the Bentley Prince Street and fabrics businesses, expectations are for a continued improvement in profitability Interface’s “first mover” status in the emerging markets positions us to benefit from growth in India, China, Southeast Asia and the Middle East The marketplace is rewarding our position on sustain ability as companies in many industries scramble to become “greener”123456

…We Don’t Know How Far Modular Can Go