Exhibit 99.2
Investors and Analysts Meeting May 24, 2005
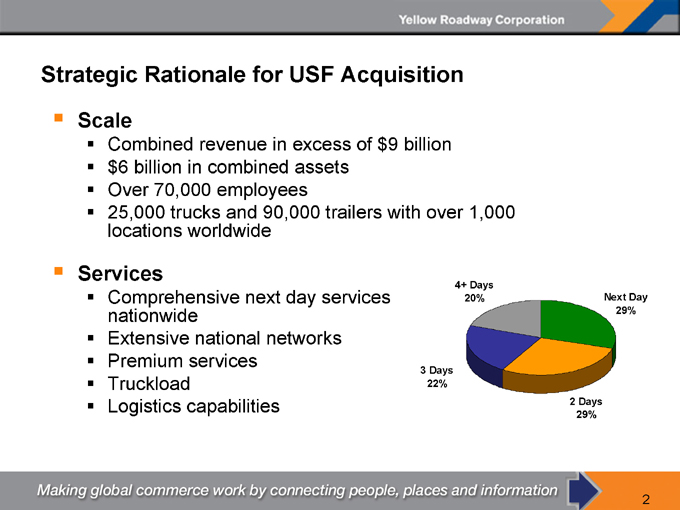
Strategic Rationale for USF Acquisition
Scale
Combined revenue in excess of $9 billion $6 billion in combined assets Over 70,000 employees 25,000 trucks and 90,000 trailers with over 1,000 locations worldwide
Services
Comprehensive next day services nationwide Extensive national networks Premium services Truckload Logistics capabilities
4+ Days 20%
Next Day 29%
2 Days 29%
3 Days 22%
2
Strategic Rationale for USF Acquisition (continued)
Synergies $40 million expected in the first twelve months
About $10 - $15 million required to be accretive
Longer-term synergy potential in excess of $150 million
About $1.50 per share on a pro forma basis Expect to capture in less than 3 years
3
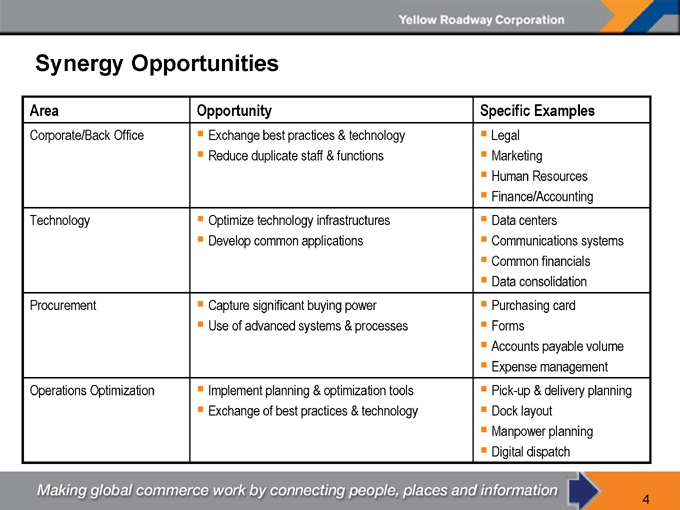
Synergy Opportunities
Area Opportunity Specific Examples
Corporate/Back Office Exchange best practices & technology Legal
Reduce duplicate staff & functions Marketing
Human Resources
Finance/Accounting
Technology Optimize technology infrastructures Data centers
Develop common applications Communications systems
Common financials
Data consolidation
Procurement Capture significant buying power Purchasing card
Use of advanced systems & processes Forms
Accounts payable volume
Expense management
Operations Optimization Implement planning & optimization tools Pick-up & delivery planning
Exchange of best practices & technology Dock layout
Manpower planning
Digital dispatch
4
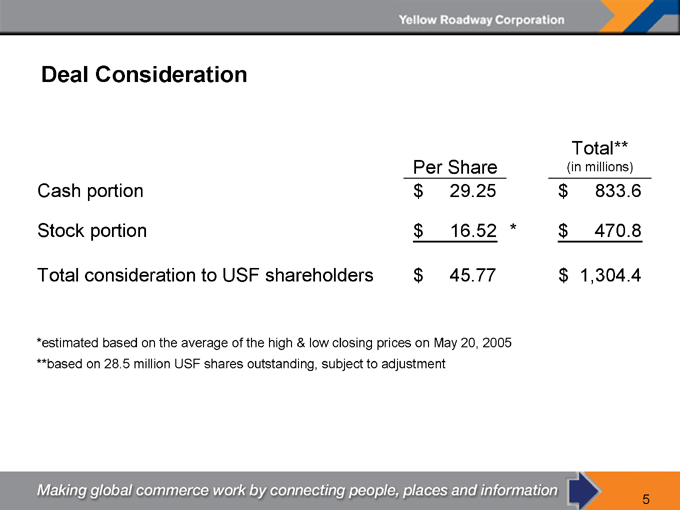
Deal Consideration
Per Share Total** (in millions)
Cash portion $29.25 $833.6
Stock portion $16.52* $470.8
Total consideration to USF shareholders $45.77 $1,304.4
*estimated based on the average of the high & low closing prices on May 20, 2005 **based on 28.5 million USF shares outstanding, subject to adjustment
5
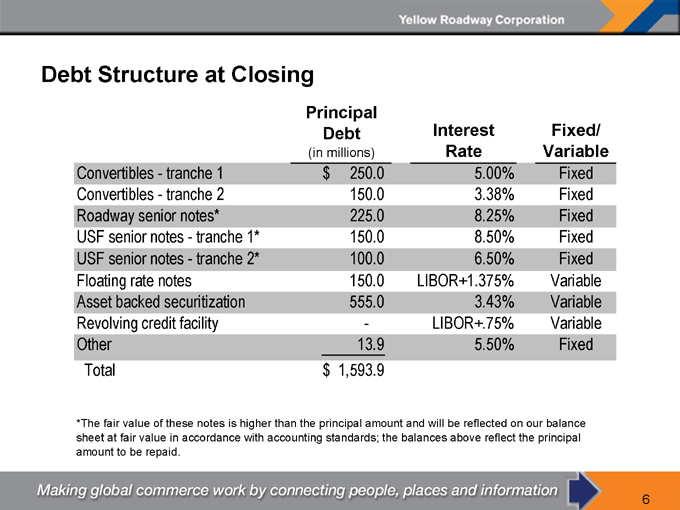
Debt Structure at Closing
Principal Debt (in millions) Interest Rate Fixed/ Variable
Convertibles—tranche 1 $250.0 5.00% Fixed
Convertibles—tranche 2 150.0 3.38% Fixed
Roadway senior notes* 225.0 8.25% Fixed
USF senior notes—tranche 1* 150.0 8.50% Fixed
USF senior notes—tranche 2* 100.0 6.50% Fixed
Floating rate notes 150.0 LIBOR+1.375% Variable
Asset backed securitization 555.0 3.43% Variable
Revolving credit facility - LIBOR+.75% Variable
Other 13.9 5.50% Fixed
Total $1,593.9
*The fair value of these notes is higher than the principal amount and will be reflected on our balance sheet at fair value in accordance with accounting standards; the balances above reflect the principal amount to be repaid.
6
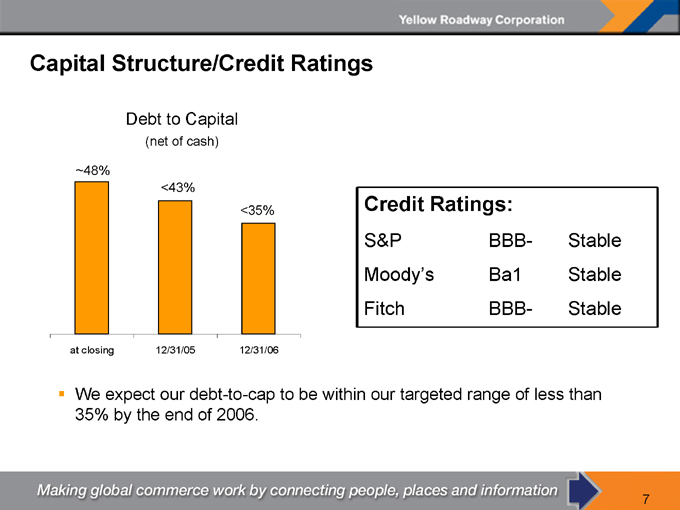
Capital Structure/Credit Ratings
Debt to Capital
(net of cash)
~48%
<43%
<35% at closing
12/31/05
12/31/06
Credit Ratings:
S&P BBB- Stable
Moody’s Ba1 Stable
Fitch BBB- Stable
We expect our debt-to-cap to be within our targeted range of less than 35% by the end of 2006.
7
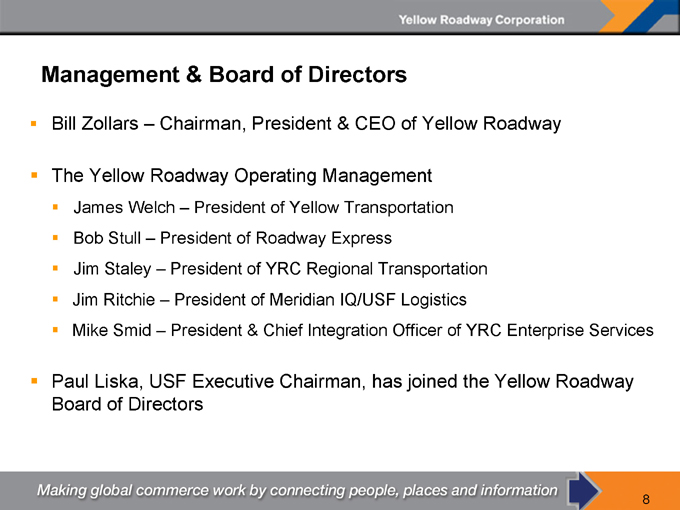
Management & Board of Directors
Bill Zollars – Chairman, President & CEO of Yellow Roadway
The Yellow Roadway Operating Management
James Welch – President of Yellow Transportation Bob Stull – President of Roadway Express Jim Staley – President of YRC Regional Transportation Jim Ritchie – President of Meridian IQ/USF Logistics
Mike Smid – President & Chief Integration Officer of YRC Enterprise Services
Paul Liska, USF Executive Chairman, has joined the Yellow Roadway Board of Directors
8
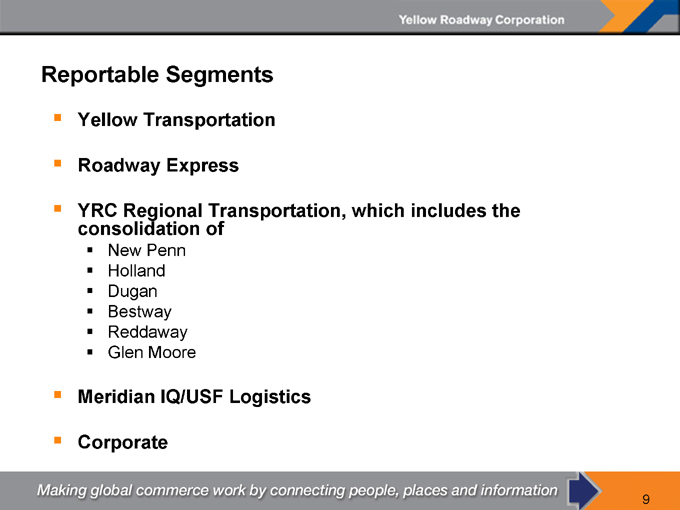
Reportable Segments
Yellow Transportation
Roadway Express
YRC Regional Transportation, which includes the consolidation of
New Penn Holland Dugan Bestway Reddaway Glen Moore
Meridian IQ/USF Logistics
Corporate
9
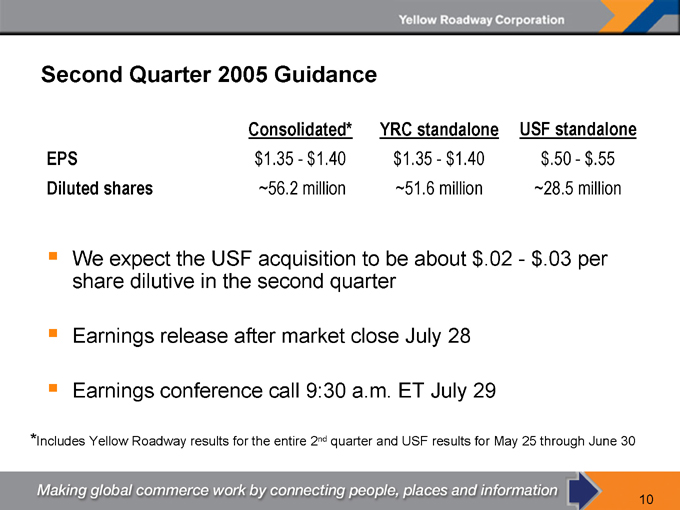
Second Quarter 2005 Guidance
Consolidated* YRC standalone USF standalone
EPS $1.35 - $1.40 $1.35 - $1.40 $.50 - $.55
Diluted shares 56.2 million 51.6 million 28.5 million
We expect the USF acquisition to be about $.02 - $.03 per share dilutive in the second quarter
Earnings release after market close July 28
Earnings conference call 9:30 a.m. ET July 29
*Includes Yellow Roadway results for the entire 2nd quarter and USF results for May 25 through June 30
10
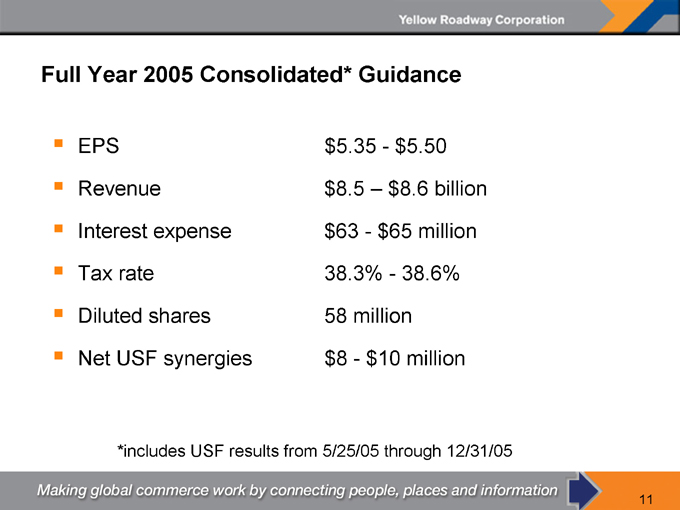
Full Year 2005 Consolidated* Guidance
EPS $5.35 - $5.50
Revenue $8.5 – $8.6 billion
Interest expense $63 - $65 million
Tax rate 38.3% - 38.6%
Diluted shares 58 million
Net USF synergies $8 - $10 million
*includes USF results from 5/25/05 through 12/31/05
11
Forward-Looking Statements
This presentation (and oral statements made regarding the subjects of this presentation contain forward-looking statements within the meaning of Section 27A of the Securities Act of 1933, as amended, and Section 21E of the Securities Exchange Act of 1934, as amended. Words such as “expect(s)”, “feel(s)”, “believe(s)”, “will”, “may”, “could”, “anticipate(s)” and similar expressions are intended to identify forward-looking statements. These statements include, but are not limited to, statements regarding plans, objectives and expectations with respect to future operations, products and services; and statements regarding future performance. Such statements are subject to certain risks and uncertainties, many of which are difficult to predict and generally beyond the control of Yellow Roadway and USF, that could cause actual results to differ materially from those expressed in, or implied or projected by, the forward-looking information and statements. These risks and uncertainties include: those discussed and identified in public filings with the SEC by Yellow Roadway and USF; the parties’ ability to consummate the proposed merger with, to achieve expected synergies and operating efficiencies in the merger within the expected time-frames or at all and to successfully integrate USF’s operations into Yellow Roadway’s operations; such integration may be more difficult, time-consuming or costly than expected; revenues following the transaction may be lower than expected; operating costs, customer loss and business disruption, including, without limitation, difficulties in maintaining relationships with employees, customers, clients or suppliers, may be greater than expected following the transaction; the regulatory approvals required for the transaction may not be obtained on the terms expected or on the anticipated schedule; the parties’ ability to meet expectations regarding the timing, completion and accounting and tax treatments of the transaction and the value of the transaction consideration; changes in federal or state regulation concerning or affecting the transportation industry; inflation, inclement weather, price and availability of fuel, competitor pricing activity, expense volatility, a downturn in general or regional economic activity, changes in equity and debt markets, the state of the economy; the parties’ obligations to contribute to union-sponsored multi-employer pension plans may be higher than expected; the impact of work rules, any obligations to multi-employer health, welfare and pension plans, wage requirements, potential efforts to unionize previously non-union operations of the company and employee satisfaction, labor shortages, disruptions, stoppages or any other deterioration in the parties’ relationships with employees may impair the parties’ businesses and any future acts or threats of terrorism or war. In particular, the expectations set forth in this news release regarding accretion and achievement of annual savings and synergies are only the parties’ expectations regarding these matters. Actual results could differ materially from these expectations depending on factors such as the combined company’s cost of capital, the ability of the combined company to identify and implement cost savings, synergies and efficiencies in the time frame needed to achieve these expectations, prior contractual commitments of the combined companies and their ability to terminate these commitments or amend, renegotiate or settle the same, the combined company’s actual capital needs, the absence of any material incident of property damage or other unforeseen merger or acquisition opportunities that could affect capital needs, the costs incurred in implementing synergies and the factors that generally affect the respective businesses of Yellow Roadway and USF as further outlined in “Management’s Discussion and Analysis of Financial Condition and Results of Operations” in each of the companies’ respective Annual Reports on Form 10-K. Readers are cautioned not to place undue reliance on these forward-looking statements that speak only as of the date hereof. Neither Yellow Roadway nor USF undertakes any obligation to republish revised forward-looking statements to reflect events or circumstances after the date hereof or to reflect the occurrence of unanticipated events. Readers are also urged to carefully review and consider the various disclosures in Yellow Roadway’s and USF’s various SEC reports, including, but not limited to, each party’s Annual Report on Form 10-K for the year ended December 31, 2004 and Quarterly Report on Form 10-Q for the first quarter of 2005.
12