Bear Stearns Global Transportation Conference May 9, 2006 Exhibit 99.1 * * |
2 What We Do YRC Worldwide provides global transportation services, transportation management solutions, and logistics management through a portfolio of successful brands. We can handle any shipment, any where at any speed. |
3 Company Facts 41.3 million Annual shipments 2.0 billion Annual highway miles 26.6 million Annual tons 90,000 Trailers 27,000 Trucks 1,000 worldwide Locations 70,000 Employees $10 billion Revenue |
4 • September 2002 Spin-off of SCS Transportation (nonunion Saia and Jevic) • December 2003 Acquisition of Roadway Corporation ($1.2 billion, 50% cash / 50% stock) • May 2005 Acquisition of USF Corporation ($1.5 billion, 65% cash / 35% stock) • September 2005 Finalized China-based freight forwarding joint venture • January 2006 Yellow Roadway changes name to YRC Worldwide • January 2006 Formed China-based logistics joint venture Strategic Actions |
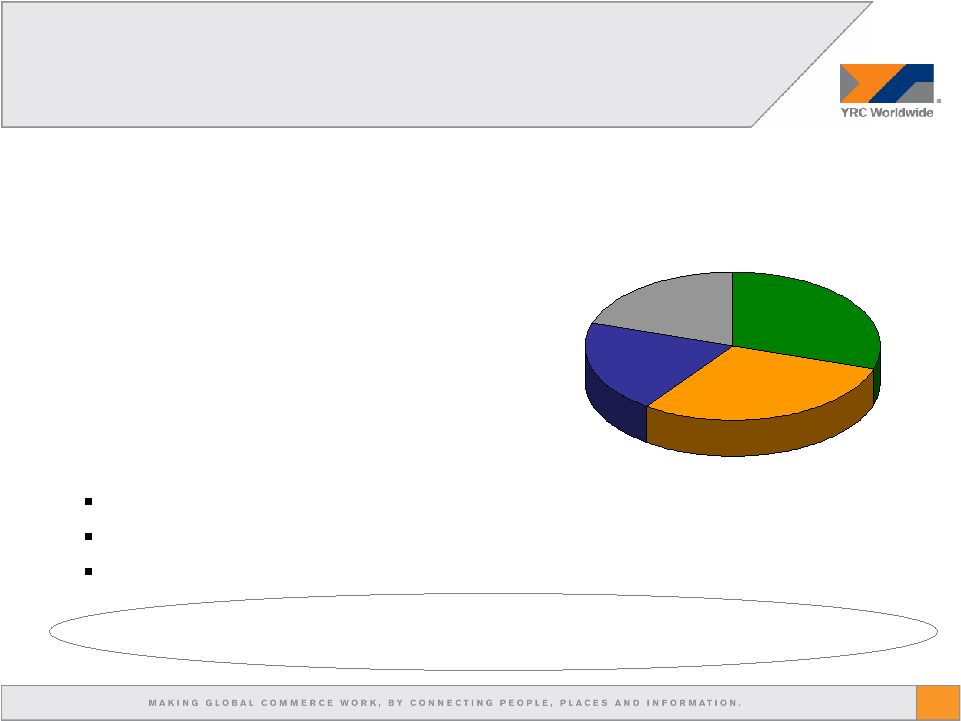
5 • Comprehensive next-day nationwide • Extensive national networks • Truckload • Premium services Expedited Time Definite Exhibit Based on shipments Asset-Based Service Portfolio Well balanced North American portfolio of services. 3 Days 20% 4+ Days 20% 2 Days 30% Next Day 30% |
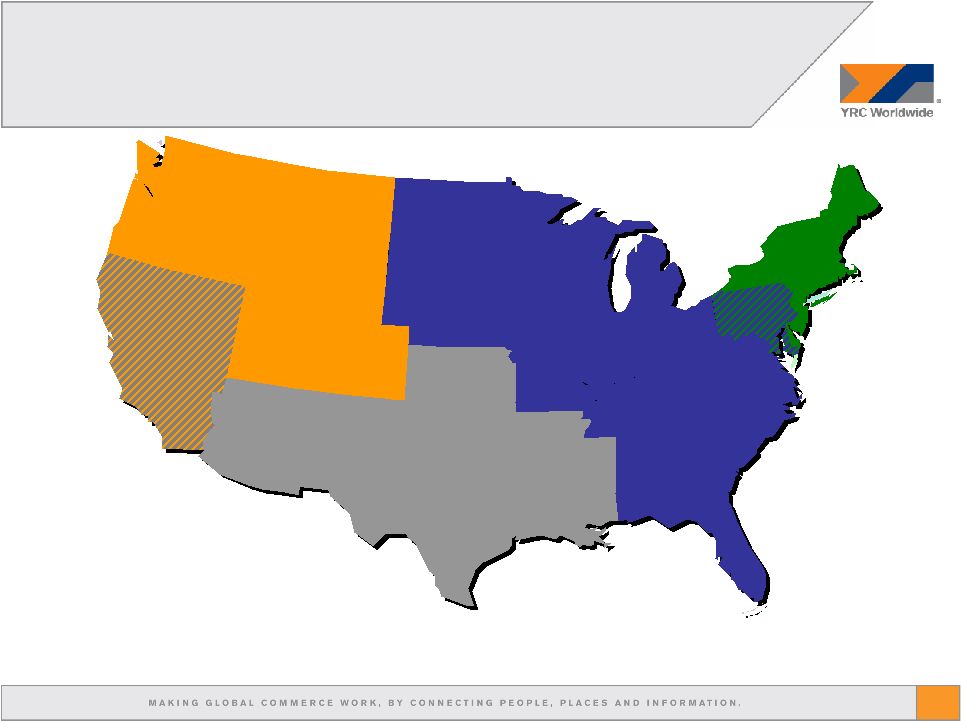
6 USF Reddaway USF Bestway USF Holland New Penn Motor Express Note: USF Holland does not have direct coverage or facility locations in Florida, North Dakota, or South Dakota. Those states are served through interline carriers. YRC Regional Transportation Primary Service Coverage |
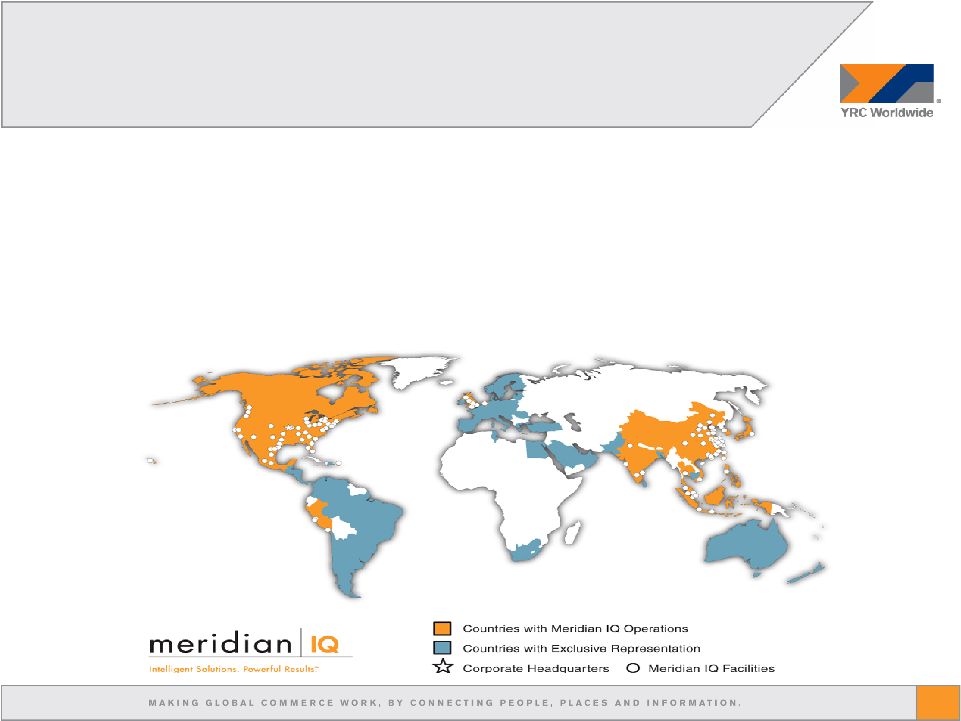
7 Non-Asset-Based Service Portfolio • Contract logistics • Truckload brokerage • Global shipment management in over 70 countries |
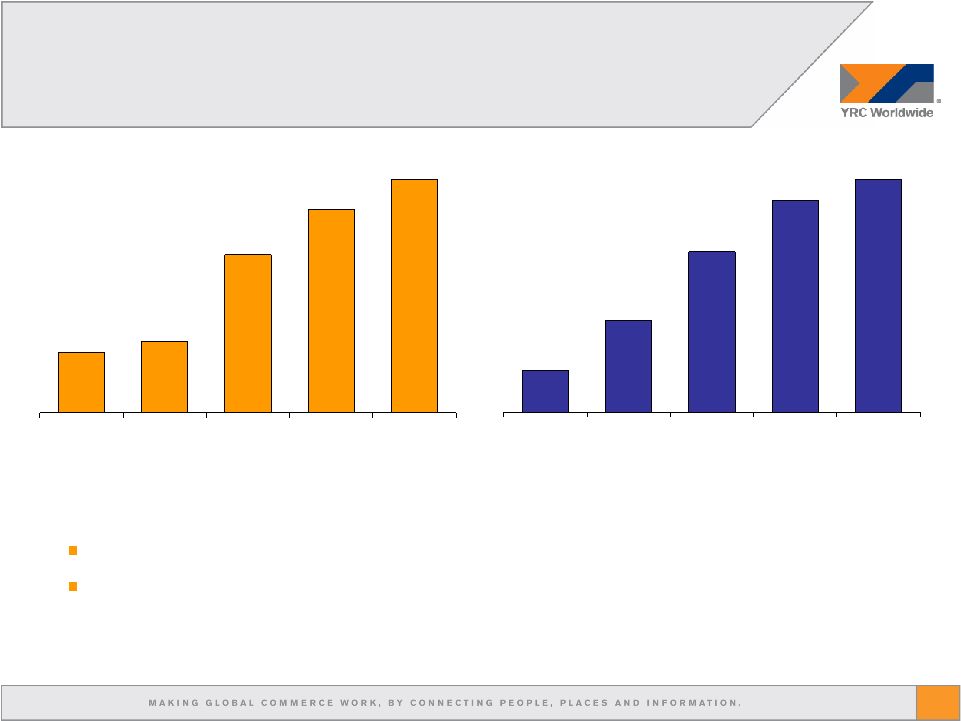
8 Reported Revenue (in billions) Adjusted EPS* 2002 2003 2004 2005 2006E 2002 2003 2004 2005 2006E $2.27 2006 is expected to be our 3 rd straight year of record revenue and EPS 2005 record EPS is greater than 5 times 2002, with more than double the number of shares $3.1 $6.8 $8.7 $3.96 $5.25 *Adjustments primarily related to property gains/losses, acquisition, spin-off, severance charges, and in 2005, an unexpected increase in the effective tax rate. Management does not consider these when evaluating core operations. Record Results $2.6 $1.03 $10 $5.65-$5.85 |
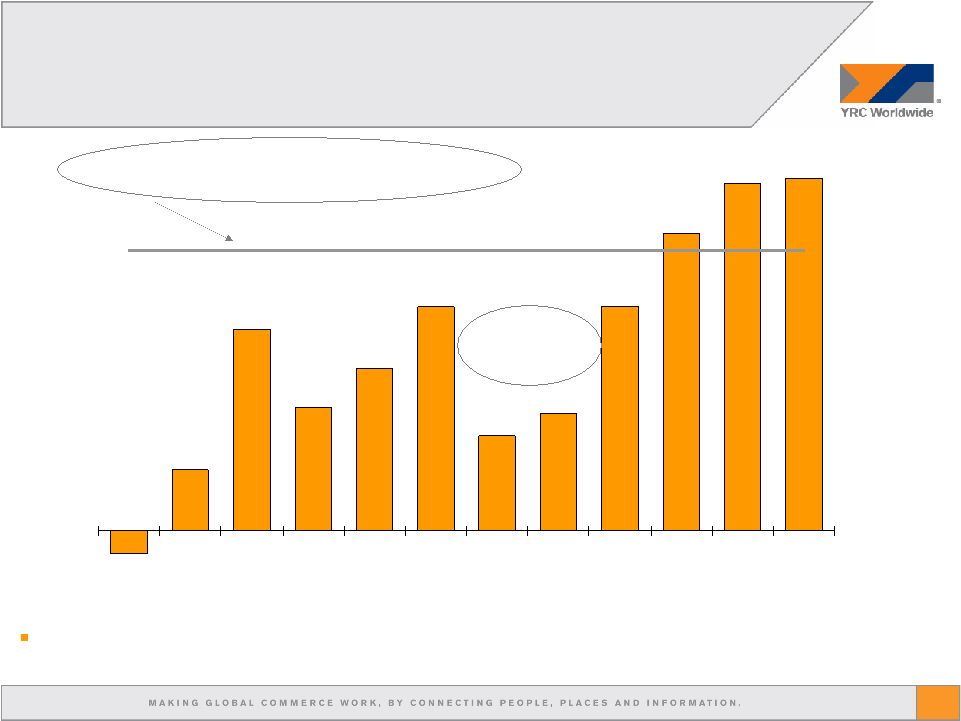
9 In 2005 we posted a 93.8% operating ratio; a 90 basis point improvement over 2004. 3.6% 2.2% 2.9% 4.0% 1.7% 2.1% 4.0% 5.3% 6.2% 6.3% -0.4% 1.1% 1995 1996 1997 1998 1999 2000 2001 2002 2003 2004 2005 2006E A 5% margin was once considered unattainable by a national carrier YRCW Margin Trends recession- still solidly profitable |
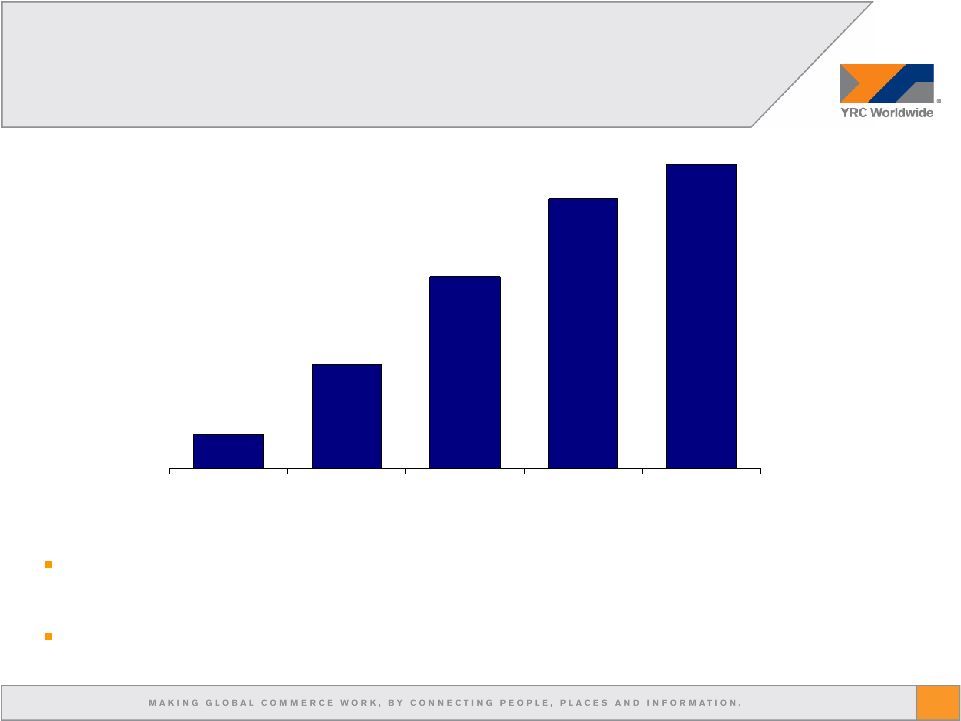
10 $50 $155 $285 $400 $450 2004A 2005A 2006E 2007E 2008E Calendar Year Benefit (in millions) Early cost reductions primarily related to consolidation of back-office functions, optimization of technology and purchasing leverage. Future periods focus on optimizing operations and improving efficiencies, making segregation of the actual dollars more difficult. Note: 2006 through 2008 are current company estimates Planned Cost Reductions |
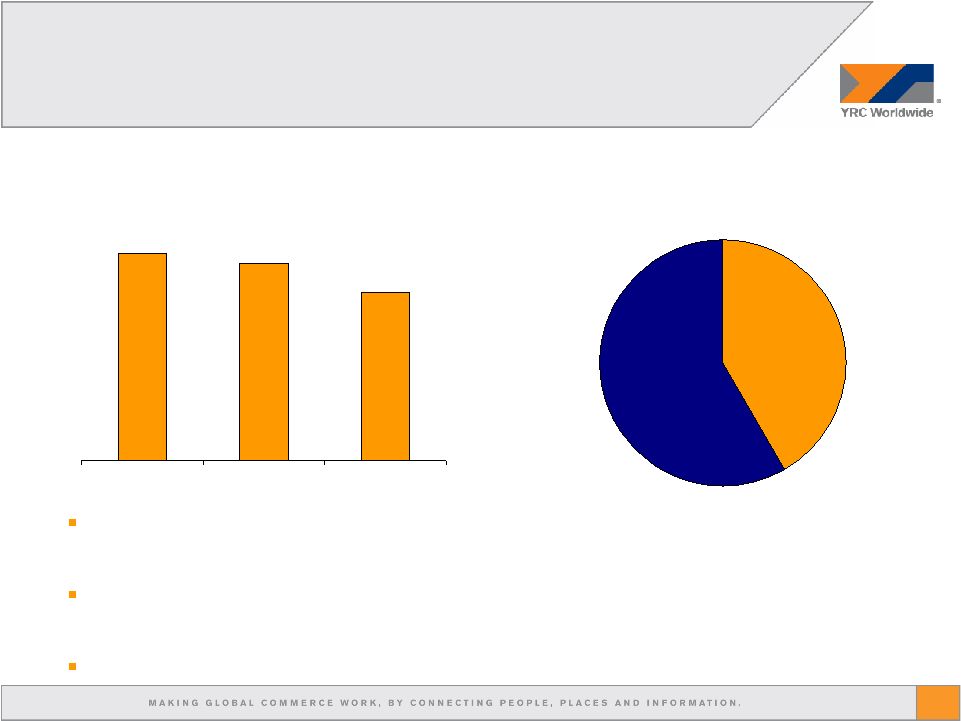
11 Debt to Capital (net of cash) We expect to reduce debt by $100 million in 2006, with our debt-to-cap near our targeted range of 35% by the end of the year. $100 million stock repurchase announced in April; balanced with $100 million debt pay down Investment grade ratings at S&P and Fitch; one notch below at Moody’s. Capital Structure 6/30/05 3/31/06 12/31/06 45.5% 43.3% ~37% Variable 42% Fixed 58% Debt Composition at 3/31/06 |
12 59 million Diluted shares $425 - $450 million Gross cap ex $300 million Depreciation/amortization 38.1% Effective tax rate $85 million Interest expense $10 billion Revenue $5.65 - $5.85 per share EPS 2006 Guidance We expect record results to continue in 2006 with double-digit revenue and solid EPS growth. For the 4 th straight year, we expect our NOPAT/ROCC to exceed our cost of capital of around 10%. |
13 This presentation, and oral statements made regarding the subjects of this presentation, contains forward-looking statements within the meaning of Section 27A of the Securities Act of 1933, as amended, and Section 21E of the Securities Exchange Act of 1934, as amended. The words "expect," “projected," “estimated,” “anticipated,” “forecasted” and similar expressions are intended to identify forward-looking statements. It is important to note that the company’s actual future results could differ materially from those projected in such forward-looking statements because of a number of factors, including (without limitation), inflation, inclement weather, price and availability of fuel, sudden changes in the cost of fuel or the index upon which the company bases its fuel surcharge, competitor pricing activity, expense volatility, including (without limitation) expense volatility due to changes in rail service or pricing for rail service, ability to capture cost reductions, including (without limitation) those cost reduction opportunities arising from acquisitions, the company’s ability to improve productivity results at its Roadway Express subsidiary and its resulting effects on efficiencies, service and yield, a downturn in general or regional economic activity, changes in equity and debt markets, effects of a terrorist attack, and labor relations, including (without limitation), the impact of work rules, any obligations to multi- employer health, welfare and pension plans, wage requirements and employee satisfaction. The format of this presentation does not allow us to fully disclose all of these risk factors. For a full discussion please refer to our Form 10-K filed with the SEC. This presentation includes references to adjusted EPS. Adjusted EPS excludes property gains/losses, one-time charges related to acquisitions, spin-off and executive severance charges. Refer to the company’s Form 10-K filed with the SEC for a complete reconciliation of reported EPS to adjusted EPS. Forward-Looking Statements |