- YELLQ Dashboard
- Financials
- Filings
-
Holdings
- Transcripts
- ETFs
- Insider
- Institutional
- Shorts
-
8-K Filing
Yellow (YELLQ) 8-KRegulation FD Disclosure
Filed: 10 Nov 08, 12:00am
 Bill Zollars Chairman, President & CEO Baird Industrial Conference Bill Zollars Chairman, President & CEO Baird Industrial Conference November 11, 2008 Exhibit 99.1 |
 2 Brand Recognition Brand Recognition YRC Worldwide generates more than $9 billion of revenue through global transportation services, transportation management solutions, and logistics management under a portfolio of successful brands. |
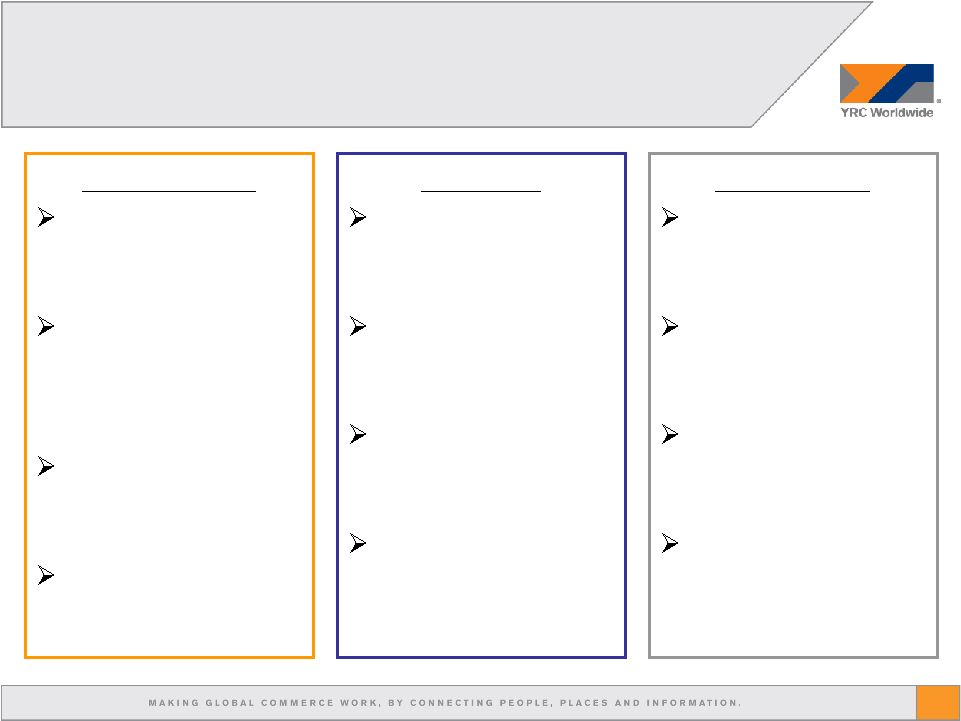
 3 YRC Worldwide Strategy YRC Worldwide Strategy One operating company with a combined national network Further opportunities for growth Teamster collaboration Competitive opportunity to leverage scale for broader array of services Accelerating Our National Integration De-levering & Liquidity Initiatives Early note redemptions Sale-leaseback strategies for core operating facilities Cash proceeds from sales of excess facilities Additional debt reduction opportunities Strategic Global Growth YRC Regional Network Optimization Further network optimization Continued focus on YRC Regional opportunities to improve efficiencies Additional phases planned at Holland to improve growth and further efficiencies Reddaway has made significant progress since realigning its territory One integrated global network China is the world’s fastest growing economy for three decades Completed acquisition of Shanghai Jiayu Logistics Global shipment visibility via technology solution |
 4 Accelerating Our Integration Accelerating Our Integration • What does it mean? Yellow and Roadway networks will be combined, significantly reducing fixed costs and enhancing service performance Local sales teams join forces to sell services of both brands • Why now? Economic downturn has created enough capacity in the networks to integrate without interrupting our customers’ supply chains Positive customer response from combined corporate sales • What are the benefits? Increased network scale and efficiencies Improved reliability, enhanced service and simplified customer experience Projected annual operating income improvement in excess of $200 million |
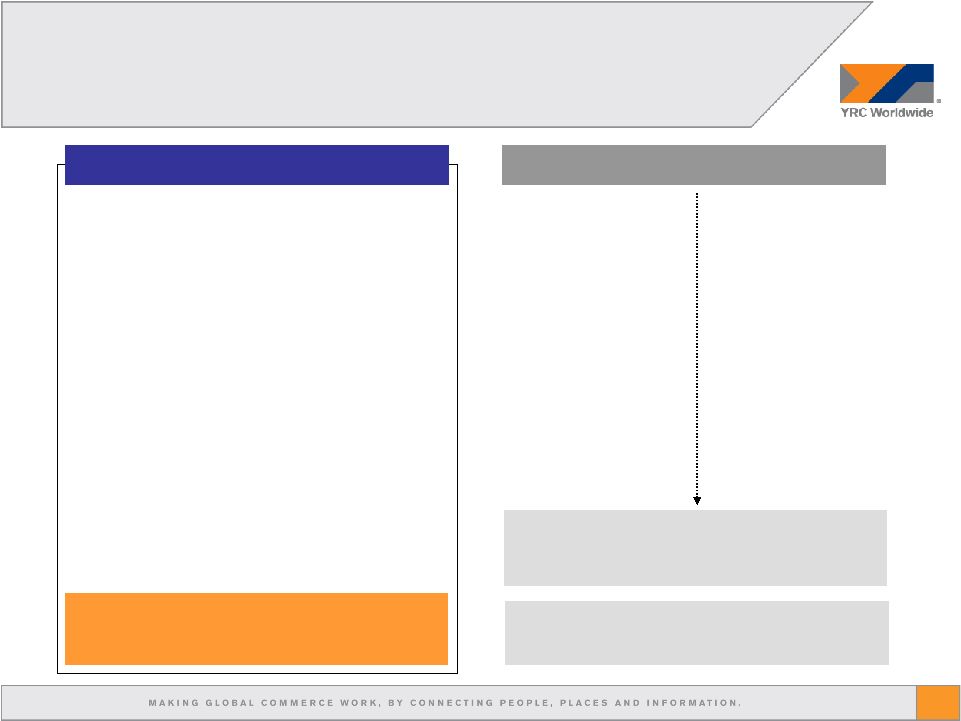
 5 Integration Approach Integration Approach Planning Stage Combined numerous physical locations Dedicated team working on data conversion for 2 years Formed one National leadership team Pilot consolidations in Canada First Wave Smaller end-of-line facilities Focus on P&D and dock functions Full process complete within two weeks Lower risk and smaller portion of savings Second Wave Larger facilities & distribution centers Focus on P&D and linehaul functions Learning curve benefit lowers risk Larger portion of expected savings |
       6 What Makes Our Integration Different? What Makes Our Integration Different? Combined back-offices, exchanged technology & best practices Immediately combined networks and migrated technology into one Previous LTL Integrations Yellow + Roadway Reduced significant headcount & encountered union resistance Combined corporate sales team Negotiated key labor flexibilities & aligned National networks Phased-in approach to integrate operations and local sales teams Teamster collaboration and customer support Created a common management team |
 7 National Networks National Networks Yellow Terminals Roadway Terminals YRC Inc. Terminals Yellow and Roadway networks before integration National network after integration |
 8 Customer Support for Integration Customer Support for Integration • Many of our larger customers have expressed support for the benefits of the integration, including among others: Wal-Mart Tomkins Hallmark Levitron General Electric L’Oreal Siemens Embarq Wolseley-Ferguson |
 9 Integration Financial Targets Integration Financial Targets • As of now, we have over 60 consolidations either done or in process • At the time of the acquisition, total facilities between Yellow and Roadway were 704. After integration and upon further optimization, we expect around 400 facilities. • Annual cost base of Yellow and Roadway is $6.5 billion; $200 million of savings is 3% Amounts are cumulative 4Q08 1Q09 2Q09 3Q09 4Q09 Consolidated Operations 80 120 150 330 450 Facilities Eliminated (30) (70) (90) (130) (150) * Annual Run Rate Savings (millions) - $ 10 $ 50 $ 120 $ 200 $ * After initial integration is complete, we will continue to optimize the network and remove additional facilities. |
 10 Integration Example Wichita, KS Integration Example Wichita, KS KANSAS KANSAS Before Integration (2 Facilities, 2 Operations) After Integration (1 Facility, 1 Operation) Y R YRC Kansas City Kansas City • Current labor cost opportunity for P&D, dock and linehaul is around $3 billion annually Linehaul Linehaul |
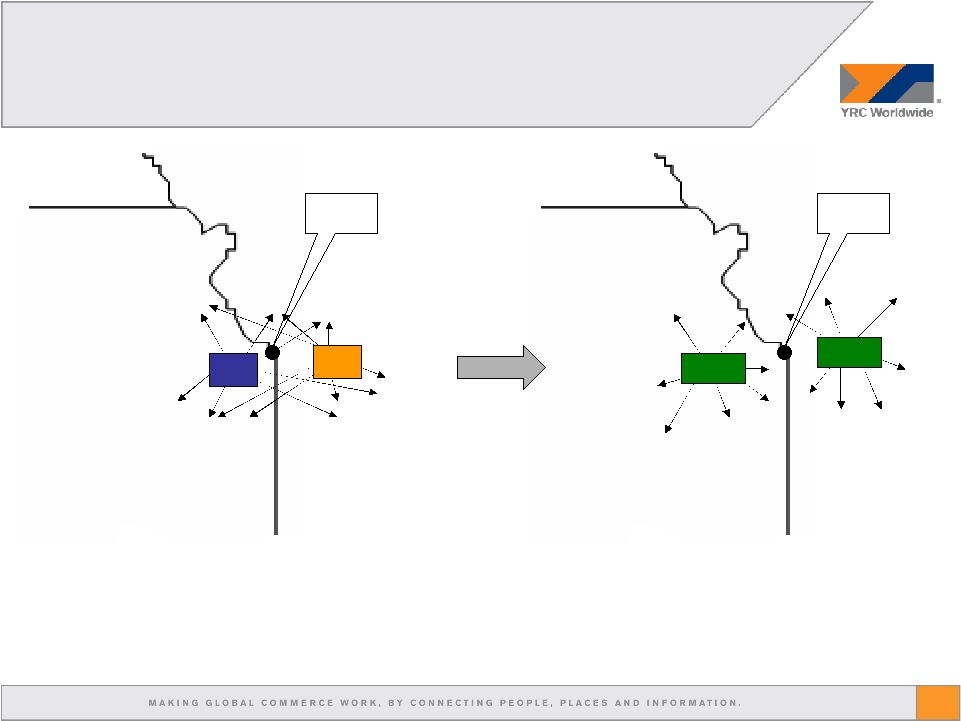 11 MISSOURI Integration Example Kansas City Metro Integration Example Kansas City Metro KANSAS Kansas City R Y YRC Kansas City KANSAS MISSOURI YRC Before Integration (Large, overlapping coverage areas) After Integration (Condensed, strategic coverage areas) |
 12 Other Cost Savings Initiatives Other Cost Savings Initiatives • $50 million improvement at the Regional companies 3Q08 operating income improved by $23 million compared to 1Q08 When accounting for contractual rate increases of $15 million and volume/yield reductions of $12 million, the Regional companies improved by at least $50 million • $50 million savings in the remainder of the organization Well exceeded the goal, though further decline in the economy has masked the significant savings Reduction of more than 500 nonunion positions and alignment of retirement benefits have yielded an annual run rate savings of more than $70 million Reduced nearly $10 million in costs related to marketing sponsorships and other employee related expenses |
 13 De-Levering Initiatives De-Levering Initiatives 12/31/2005 12/31/2006 12/31/2007 9/30/2008 12/31/08E • Continual reduction in debt • Reduced net debt by $95 million since year end • Expect at least an additional $100 million in fourth quarter • Evaluating other opportunities • Sale/leaseback packages • Debt-for-debt exchanges • Debt-for-equity exchanges • No significant debt maturities until April 2010 $1.49 $1.28 $1.23 $1.18 <$1.08 Total debt (in billions) |
 14 Leverage Ratio Leverage Ratio Leverage Ratio 4Q07 1Q08 2Q08 3Q08 2.50x 2.79x 2.99x 3.18x Bank Limit • Bank limit drops to 3.5x as of December 31 and we expect to remain within that limit • Non-cash impairment charges are excluded from EBITDA and do not impact liquidity a Amortization of debt issuance costs, imputed interest for sale/leasebacks and 4Q07 executive stock comp; b Unamortized debt premium and NPV of sale/leasebacks 3.75x LTM as of 9/30/08 (in millions) Book EBITDA* (420.5) $ Adjustments: Impairment 781.9 Reorganization** 20.0 Property gains (16.3) Other 7.5 a Bank EBITDA 372.6 Total Book Debt 1,183.7 Adjustments 2.1 b Bank Debt 1,185.8 $ Bank Debt/Bank EBITDA 3.18 *Non-GAAP measure; refer to 8K filing for reconciliation **maximum $20 million on a LTM basis |
 15 Summary Summary • Despite the downturn in the economy, YRC has unique levers to enhance its market position and improve its financial condition • National integration is underway and proceeding very well We continually evaluate the timeline and accelerate where it makes sense Customer response has been very favorable Teamster collaboration has been unprecedented • Balance sheet remains solid and opportunities exist to improve Significant debt reduction Remain in compliance with bank covenants |
 16 Forward-Looking Statements Forward-Looking Statements • This presentation contains forward-looking statements within the meaning of Section 27A of the Securities Act of 1933, as amended, and Section 21E of the Securities Exchange Act of 1934, as amended. The words "expect," “expected,“ "will,“ “projected,” and similar expressions are intended to identify forward-looking statements. It is important to note that the company's actual future results could differ materially from those projected in such forward-looking statements because of a number of factors, including (among others) inflation, inclement weather, price and availability of fuel, sudden changes in the cost of fuel or the index upon which the company bases its fuel surcharge, competitor pricing activity, expense volatility, including (without limitation) expense volatility due to changes in rail service or pricing for rail service, ability to capture cost reductions, including (without limitation) those cost reduction opportunities arising from the combination of sales, operations and networks of Yellow Transportation and Roadway, changes in equity and debt markets, a downturn in general or regional economic activity, effects of a terrorist attack, labor relations, including (without limitation), the impact of work rules, work stoppages, strikes or other disruptions, any obligations to multi-employer health, welfare and pension plans, wage requirements and employee satisfaction, and the risk factors that are from time to time included in the company's reports filed with the Securities and Exchange Commission (the "SEC"), including the company's Annual Report on Form 10-K for the year ended December 31, 2007. • The company's expectations regarding the impact of, and its operating income improvement due to, the integration of Yellow Transportation and Roadway and the timing of achieving that improvement could differ materially from those projected in forward-looking statements based on a number of factors, including (among others) the factors identified in the immediately preceding paragraphs, the ability to identify and implement cost reductions in the time frame needed to achieve these expectations, the success of the company's operating plans, the need to spend additional capital to implement cost reduction opportunities, including (without limitation) to terminate, amend or renegotiate prior contractual commitments, the accuracy of the company's estimates of its spending requirements, changes in the company's strategic direction and the need to replace any unanticipated losses in capital assets. • The company's expectations regarding its debt reduction, liquidity, and leverage ratio are only the company's expectations regarding these items. The company's actual debt reduction, liquidity and leverage ratio could be affected by a number of factors, including (among others) the factors identified in the preceding paragraphs, the accuracy of the company’s forecasts, the company’s ability to further reduce costs, the timing of the company's cash receipts and expenditures, the lack of any unanticipated liabilities maturing, contingent or otherwise, the company's retirement of existing debt obligations at less than par, the ability of the company to timely sell and receive the proceeds from sales of assets (in particular and without limitation) sales of real property and sale leaseback arrangements for real property, and the ability of the company to sell equity, exchange equity for debt, or enter into other capital market transactions and the availability of markets for these kinds of transactions. If the company does not execute one or more of the above, some of which are not entirely within the company’s control, the risk exists that the company would not be in compliance with the covenants in the credit and ABS facilities. • The company's expectations regarding its asset sales are only its expectations regarding asset sales. Actual asset sales could differ materially based on a number of factors, including (among others) the factors identified in the preceding paragraphs. |