|
Exhibit 99.1 
|
Exhibit 99.1
Analyst Presentation
Disclaimer
Forward-Looking Statements—This presentation contains forward-looking statements within the meaning of Section 27A of the Securities Act and Section 21E of the Exchange Act. Forward-looking statements are inherently uncertain and are subject to numerous business, economic, competitive, financial, regulatory and other risks, uncertainties and contingencies, known and unknown, many of which are beyond our control. Our future financial condition and results could vary materially from such forward-looking statements because of a number of factors, including those described in our quarterly reports on Form 10-Q and annual reports on Form 10-K filed with the
SEC. No representation or warranty is made as to the accuracy or completeness of any forward-looking statements. This does not constitute an offer to sell or the solicitation of an offer to purchase any security.
Non-GAAP Financial Measures. This presentation includes certain non-GAAP financial measures, including
Adjusted EBITDA. These non-GAAP financial measures are not measures of financial performance in accordance with generally accepted accounting principles and may exclude items that are significant in understanding and assessing the Company’s financial results. Therefore, these measures should not be considered in isolation or as an alternative to net income from operations, cash flows from operations, earnings per fully-diluted share or other measures of profitability, liquidity or performance under generally accepted accounting principles. You should be aware that this presentation of these measures may not be comparable to similarly-titled measures used by other companies. A reconciliation of these measures to the most comparable measures presented in accordance with generally accepted accounting principles has been included in the Company’s Current Report on Form 8-K filed
February 5, 2015 as well as certain other reports the Company files with the SEC.
Introduction
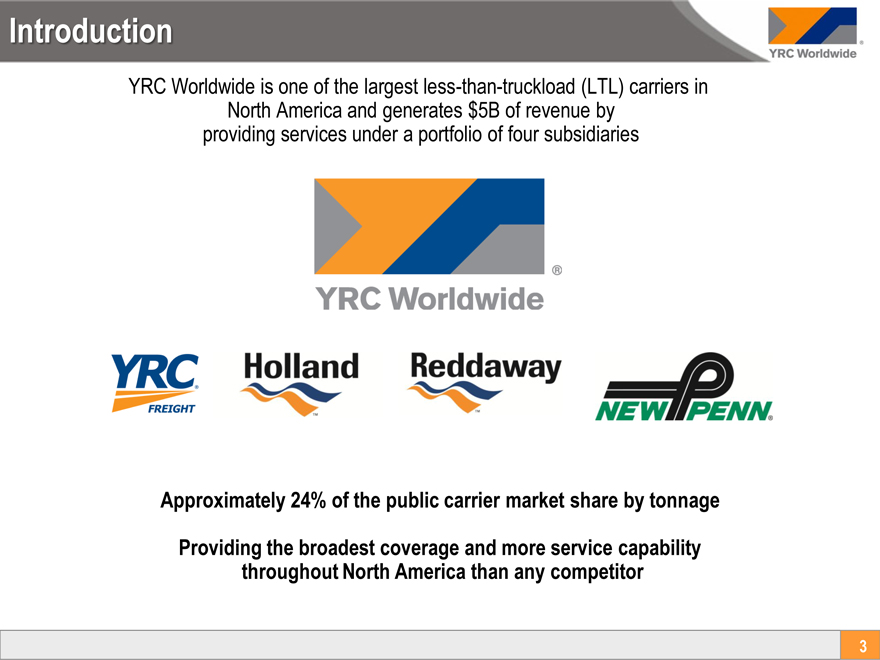
YRC Worldwide is one of the largest less-than-truckload (LTL) carriers in North America and generates $5B of revenue by providing services under a portfolio of four subsidiaries
Approximately 24% of the public carrier market share by tonnage
Providing the broadest coverage and more service capability throughout North America than any competitor
2014 Review – A Tale of Two Halves
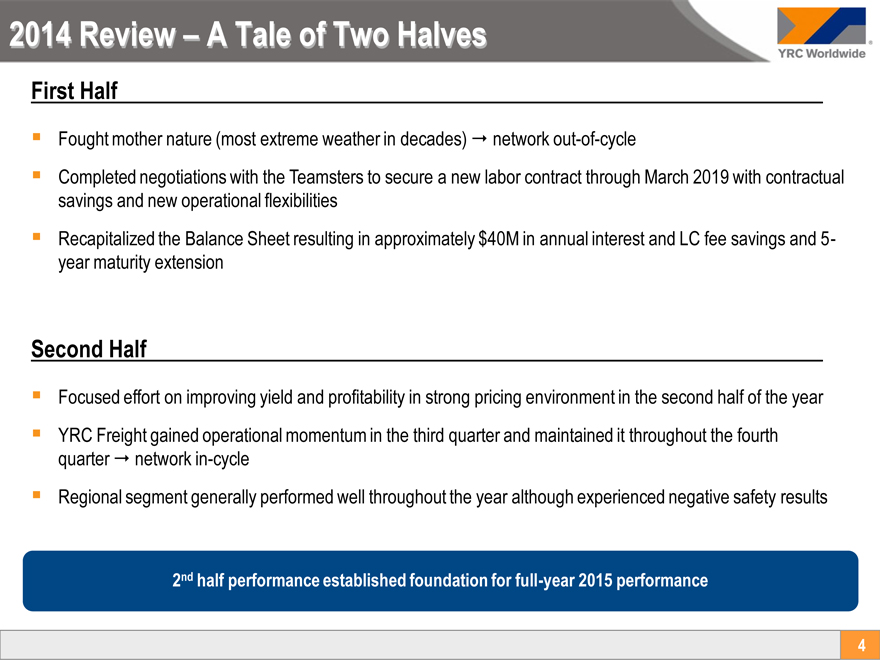
First Half
Fought mother nature (most extreme weather in decades) network out-of-cycle
Completed negotiations with the Teamsters to secure a new labor contract through March 2019 with contractual savings and new operational flexibilities Recapitalized the Balance Sheet resulting in approximately $40M in annual interest and LC fee savings and 5-year maturity extension
Second Half
Focused effort on improving yield and profitability in strong pricing environment in the second half of the year YRC Freight gained operational momentum in the third quarter and maintained it throughout the fourth quarter network in-cycle Regional segment generally performed well throughout the year although experienced negative safety results
2nd half performance established foundation for full-year 2015 performance
YOY Revenue Per Shipment
YRCF Revenue per Shipment
(x-FSC)
$ 250 $ 246
Quarter +7.4%
$ 240
$ 229
$ 230
Fourth $ 220
4Q13 4Q14
Regional
Revenue per Shipment (x-FSC)
$ 150 $ 148
+5.0%
$ 145
$ 141
$ 140
$ 135
4Q13 4Q14
YRCF Revenue per Shipment
(x-FSC)
$ 234
Year $ 235 +3.2%
$ 230 $ 227
Full $ 225
$ 220
2013 2014
Regional
Revenue per Shipment (x-FSC)
$ 150
$ 144
$ 145 +3.4%
$ 139
$ 140
$ 135
$ 130
2013 2014
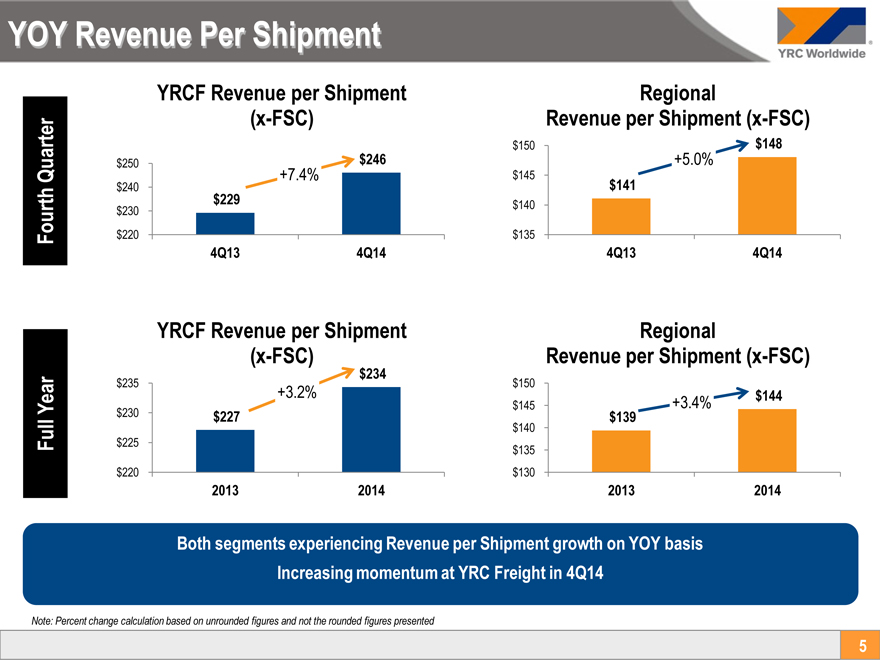
Both segments experiencing Revenue per Shipment growth on YOY basis Increasing momentum at YRC Freight in 4Q14
Note: Percent change calculation based on unrounded figures and not the rounded figures presented
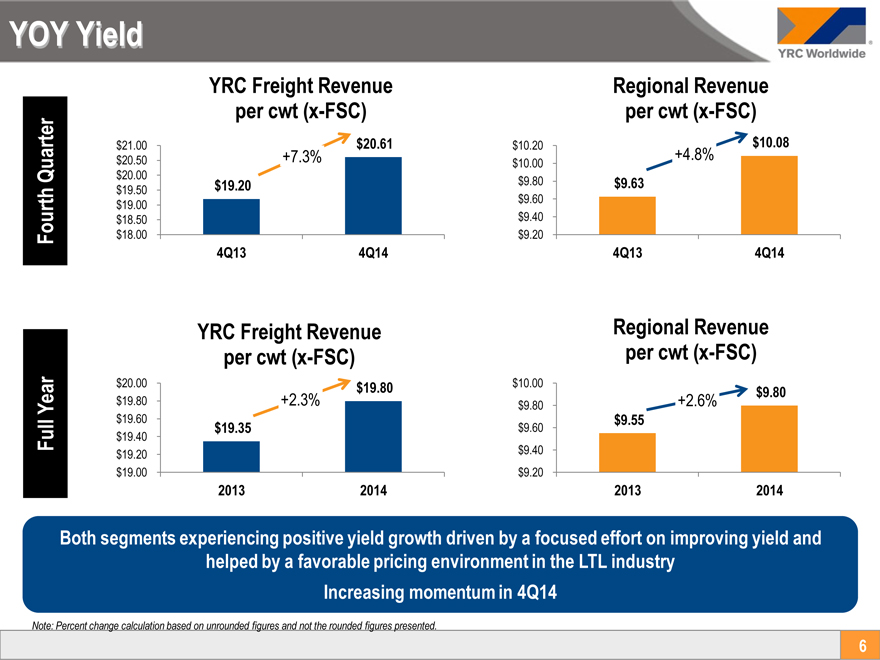
YOY Yield
YRC Freight Revenue
per cwt (x-FSC)
$21.00 $ 20.61
$20.50 +7.3%
Quarter $20.00
$19.50 $ 19.20
$19.00
$18.50
Fourth $18.00
4Q13 4Q14
Regional Revenue
per cwt (x-FSC)
$10.20 $10.08
$10.00 +4.8%
$9.80 $9.63
$9.60
$9.40
$9.20
4Q13 4Q14
YRC Freight Revenue
per cwt (x-FSC)
$20.00 $ 19.80
Year $19.80 +2.3%
$19.60
Full $19.40 $ 19.35
$19.20
$19.00
2013 2014
Regional Revenue
per cwt (x-FSC)
$10.00
$9.80 +2.6% $9.80
$9.60 $9.55
$9.40
$9.20
2013 2014
Both segments experiencing positive yield growth driven by a focused effort on improving yield and helped by a favorable pricing environment in the LTL industry Increasing momentum in 4Q14
Note: Percent change calculation based on unrounded figures and not the rounded figures presented.
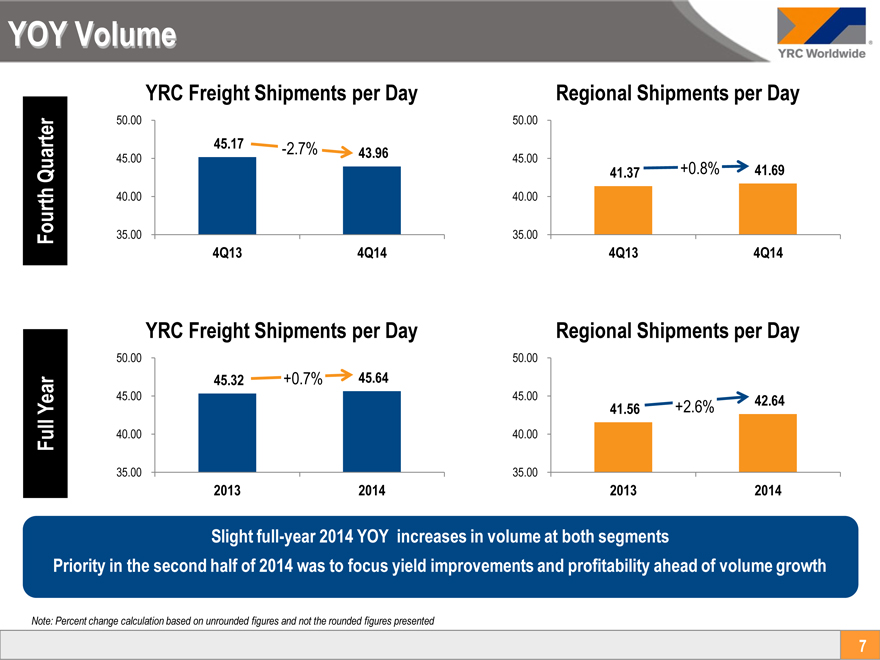
YOY Volume
YRC Freight Shipments per Day
50.00
45.17
Quarter 45.00 -2.7% 43.96
40.00
Fourth 35.00
4Q13 4Q14
Regional Shipments per Day
50.00
45.00
41.37 +0.8% 41.69
40.00
35.00
4Q13 4Q14
YRC Freight Shipments per Day
50.00
45.32 +0.7% 45.64
Year 45.00
Full 40.00
35.00
2013 2014
Regional Shipments per Day
50.00
45.00 41.56 +2.6% 42.64
40.00
35.00
2013 2014
Slight full-year 2014 YOY increases in volume at both segments
Priority in the second half of 2014 was to focus yield improvements and profitability ahead of volume growth
Note: Percent change calculation based on unrounded figures and not the rounded figures presented
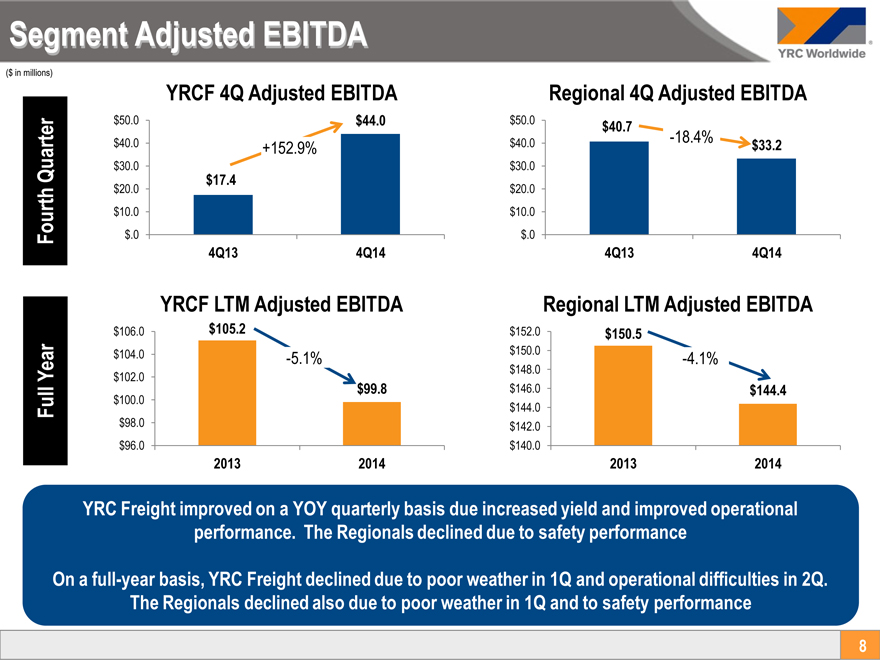
Segment Adjusted EBITDA
($ in millions)
YRCF 4Q Adjusted EBITDA
$50.0 $44.0
$40.0 +152.9%
Quarter $30.0
$20.0 $17.4
$10.0
Fourth $.0
4Q13 4Q14
Regional 4Q Adjusted EBITDA
$50.0 $40.7
-18.4%
$40.0 $33.2
$30.0
$20.0
$10.0
$.0
4Q13 4Q14
YRCF LTM Adjusted EBITDA
$106.0 $105.2
$104.0 -5.1%
Year $102.0
$99.8
Full $100.0
$98.0
$96.0
2013 2014
Regional LTM Adjusted EBITDA
$152.0 $ 150.5
$150.0 -4.1%
$148.0
$146.0 $ 144.4
$144.0
$142.0
$140.0
2013 2014
YRC Freight improved on a YOY quarterly basis due increased yield and improved operational performance. The Regionals declined due to safety performance
On a full-year basis, YRC Freight declined due to poor weather in 1Q and operational difficulties in 2Q. The Regionals declined also due to poor weather in 1Q and to safety performance
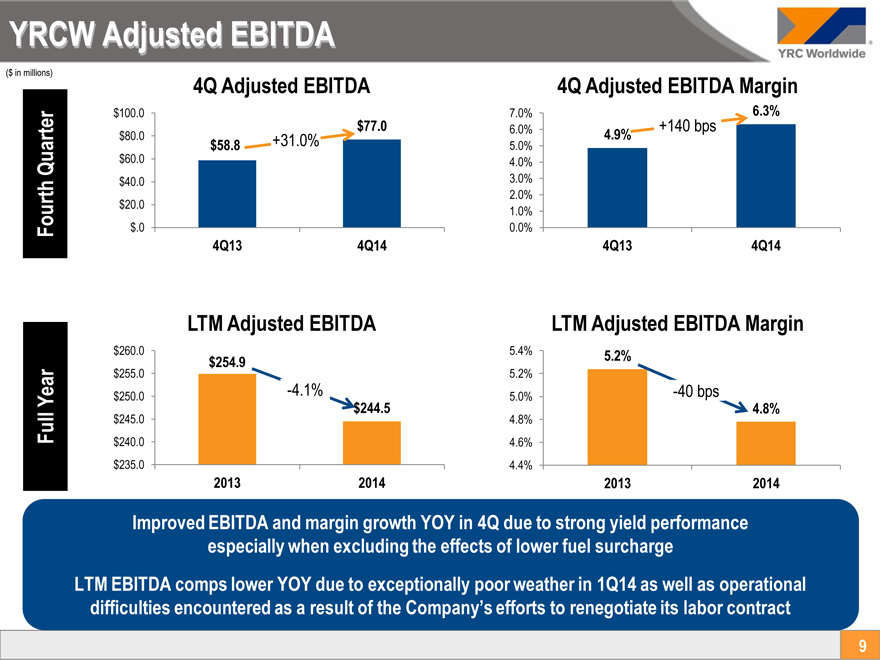
YRCW Adjusted EBITDA
($ in millions)
4Q Adjusted EBITDA
$100.0
$77.0
$80.0 +31.0%
$58.8
Quarter $60.0
$40.0
$20.0
Fourth $.0
4Q13 4Q14
4Q Adjusted EBITDA Margin
7.0% 6.3%
6.0% 4.9% +140 bps
5.0%
4.0%
3.0%
2.0%
1.0%
0.0%
4Q13 4Q14
LTM Adjusted EBITDA
$260.0
$ 254.9
$255.0
Year $250.0 -4.1%
$ 244.5
Full $245.0
$240.0
$235.0
2013 2014
LTM Adjusted EBITDA Margin
5.4% 5.2%
5.2%
5.0% -40 bps
4.8%
4.8%
4.6%
4.4%
2013 2014
Improved EBITDA and margin growth YOY in 4Q due to strong yield performance especially when excluding the effects of lower fuel surcharge
LTM EBITDA comps lower YOY due to exceptionally poor weather in 1Q14 as well as operational difficulties encountered as a result of the Company’s efforts to renegotiate its labor contract
9
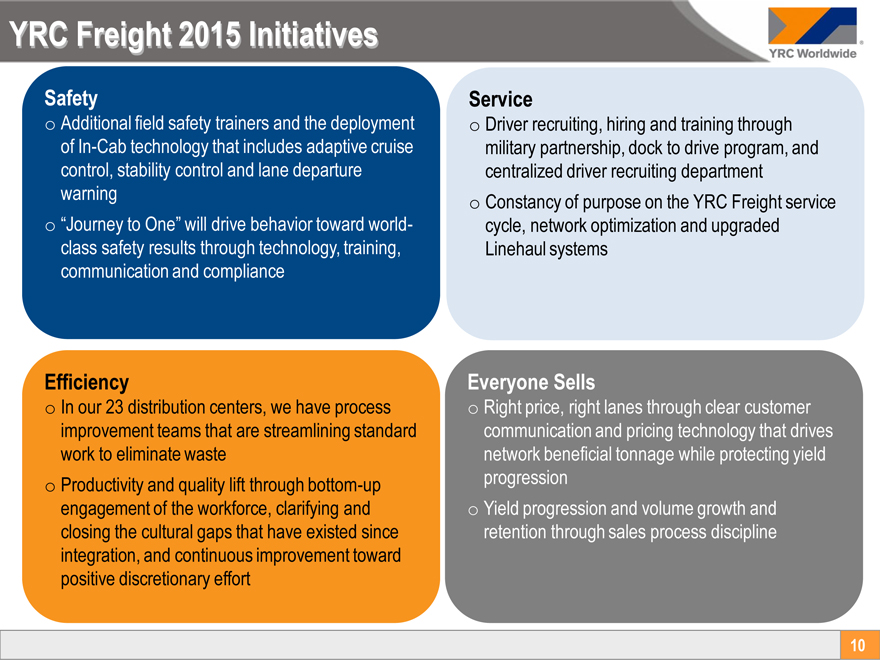
YRC Freight 2015 Initiatives
Safety o Additional field safety trainers and the deployment of In-Cab technology that includes adaptive cruise control, stability control and lane departure warning o “Journey to One” will drive behavior toward world- class safety results through technology, training, communication and compliance
Service o Driver recruiting, hiring and training through military partnership, dock to drive program, and centralized driver recruiting department o Constancy of purpose on the YRC Freight service cycle, network optimization and upgraded Linehaul systems
Efficiency o In our 23 distribution centers, we have process improvement teams that are streamlining standard work to eliminate waste o Productivity and quality lift through bottom-up engagement of the workforce, clarifying and closing the cultural gaps that have existed since integration, and continuous improvement toward positive discretionary effort
Everyone Sells o Right price, right lanes through clear customer communication and pricing technology that drives network beneficial tonnage while protecting yield progression o Yield progression and volume growth and retention through sales process discipline
10
Analyst Presentation
11