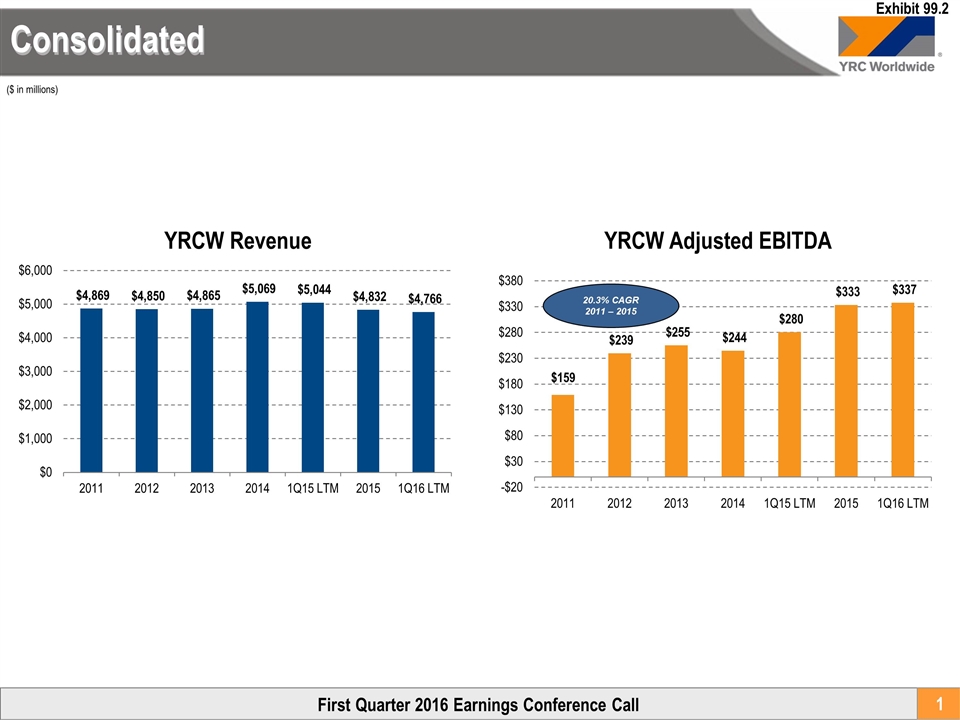
Consolidated First Quarter 2016 Earnings Conference Call 20.3% CAGR 2011 – 2015 ($ in millions) Exhibit 99.2
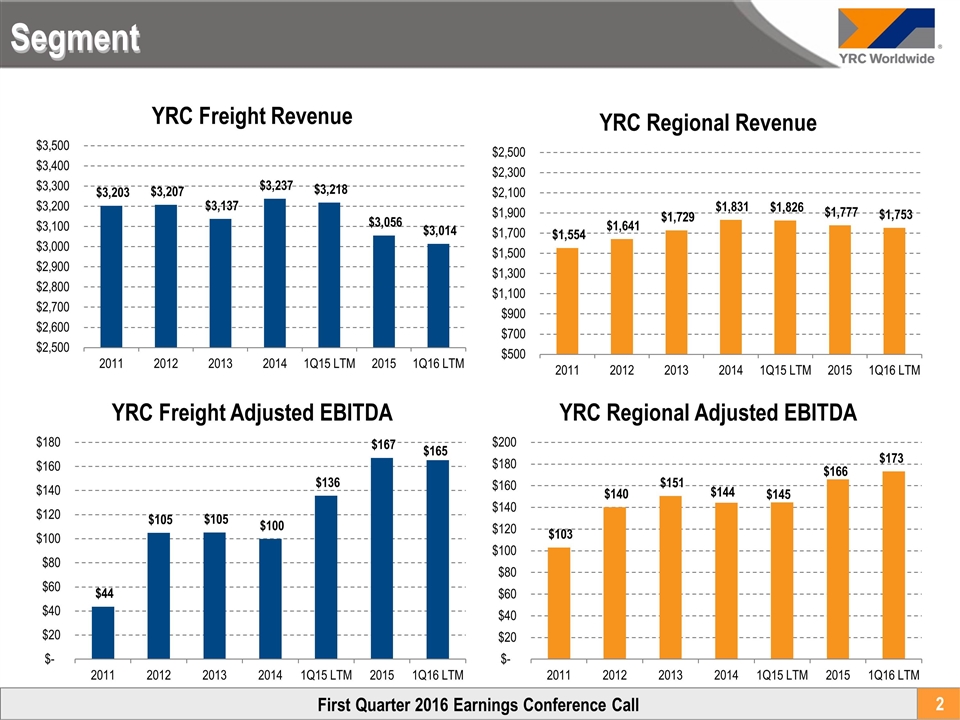
Segment First Quarter 2016 Earnings Conference Call
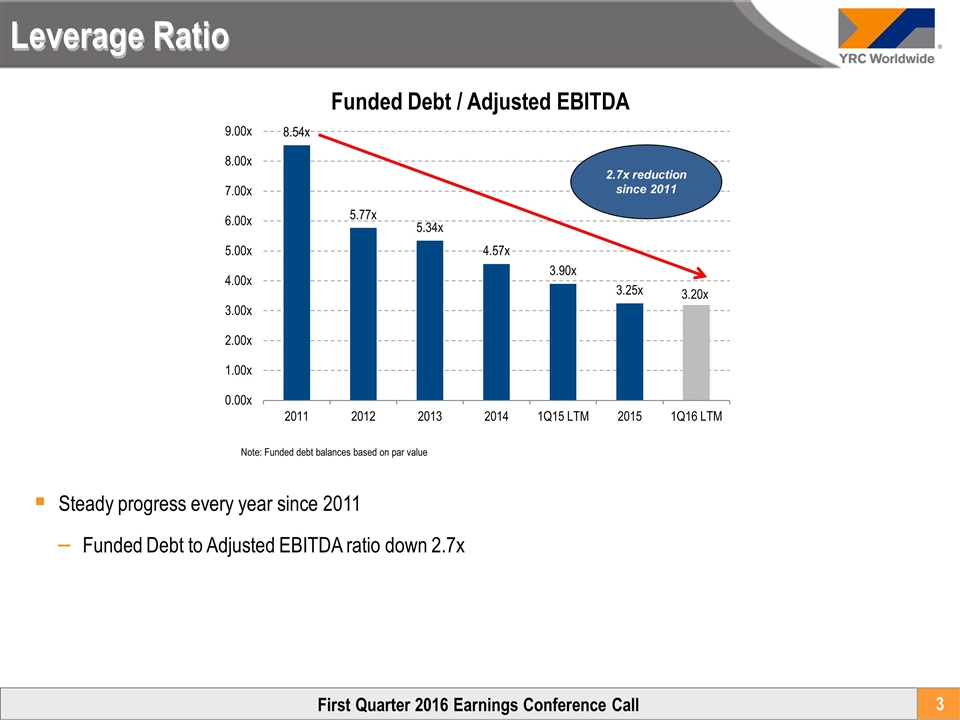
Leverage Ratio Steady progress every year since 2011 Funded Debt to Adjusted EBITDA ratio down 2.7x 2.7x reduction since 2011 Note: Funded debt balances based on par value First Quarter 2016 Earnings Conference Call
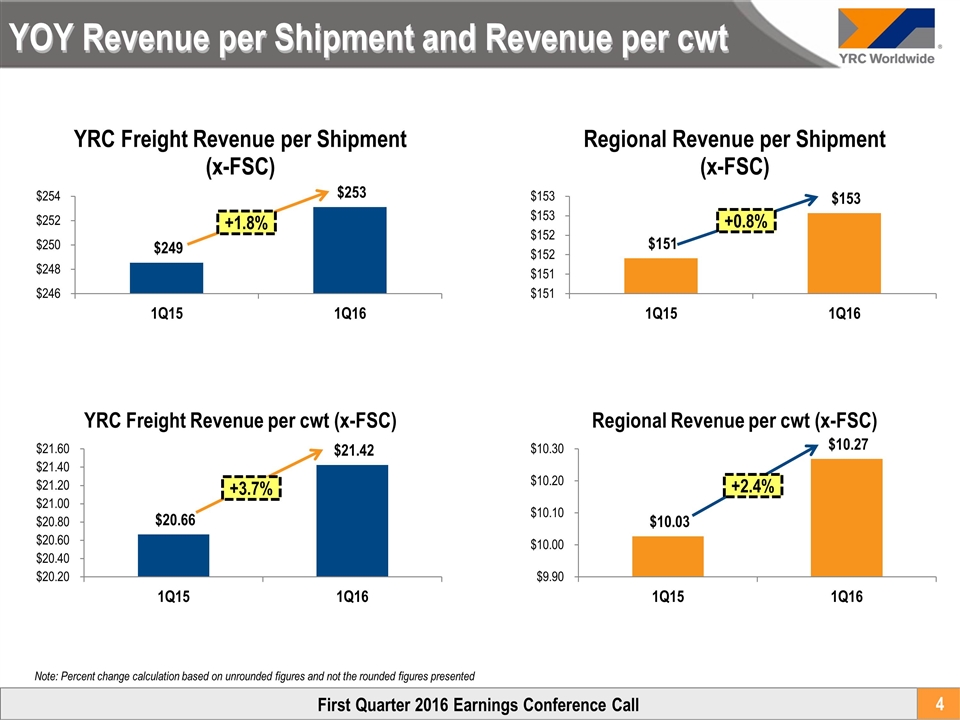
YOY Revenue per Shipment and Revenue per cwt Note: Percent change calculation based on unrounded figures and not the rounded figures presented +3.7% +1.8% +0.8% +2.4% First Quarter 2016 Earnings Conference Call
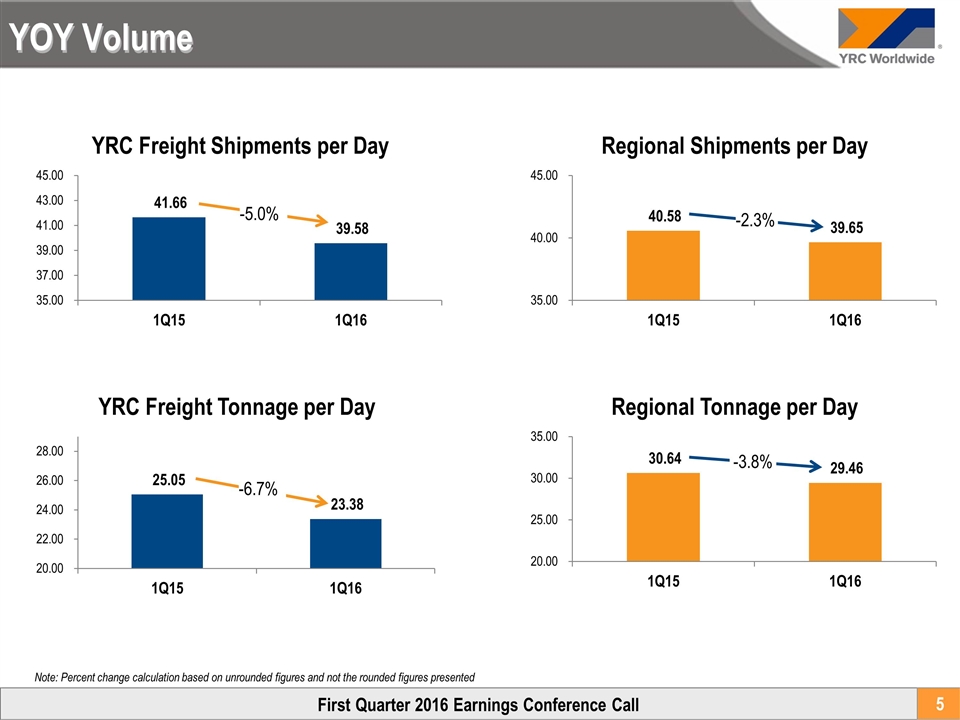
YOY Volume Note: Percent change calculation based on unrounded figures and not the rounded figures presented -5.0% -6.7% -2.3% -3.8% First Quarter 2016 Earnings Conference Call
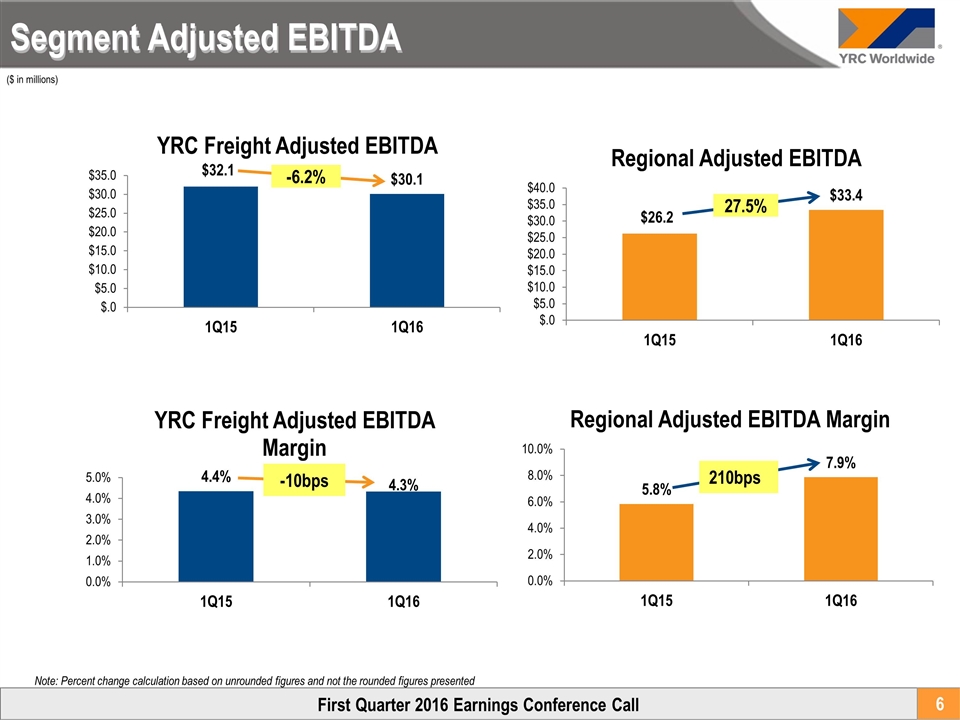
Segment Adjusted EBITDA ($ in millions) Note: Percent change calculation based on unrounded figures and not the rounded figures presented -6.2% 27.5% First Quarter 2016 Earnings Conference Call -10bps
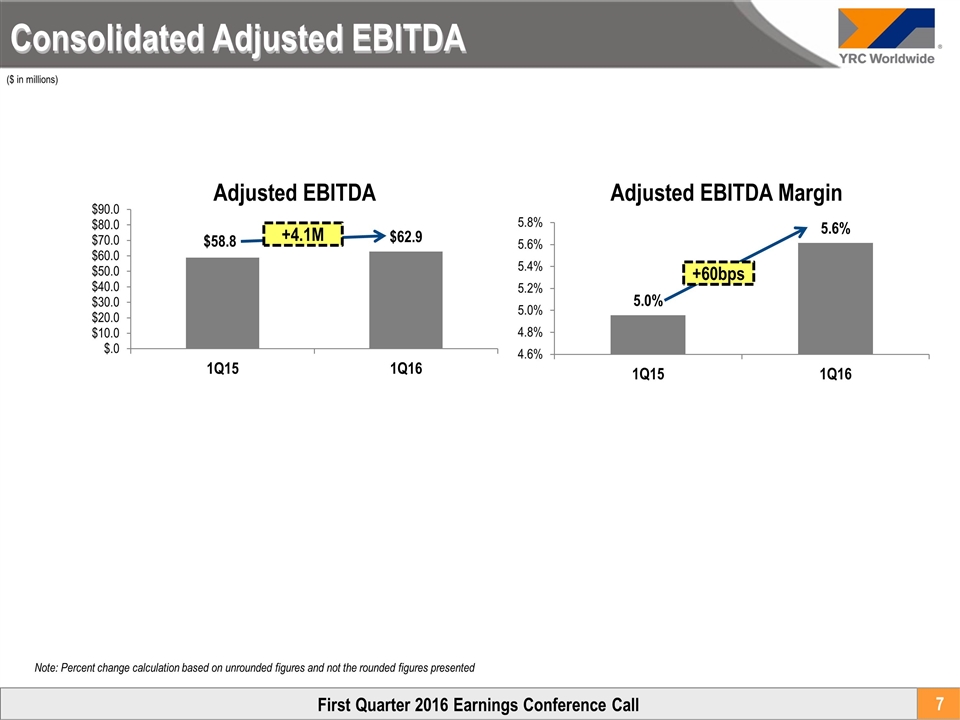
Consolidated Adjusted EBITDA ($ in millions) Note: Percent change calculation based on unrounded figures and not the rounded figures presented +4.1M +60bps First Quarter 2016 Earnings Conference Call
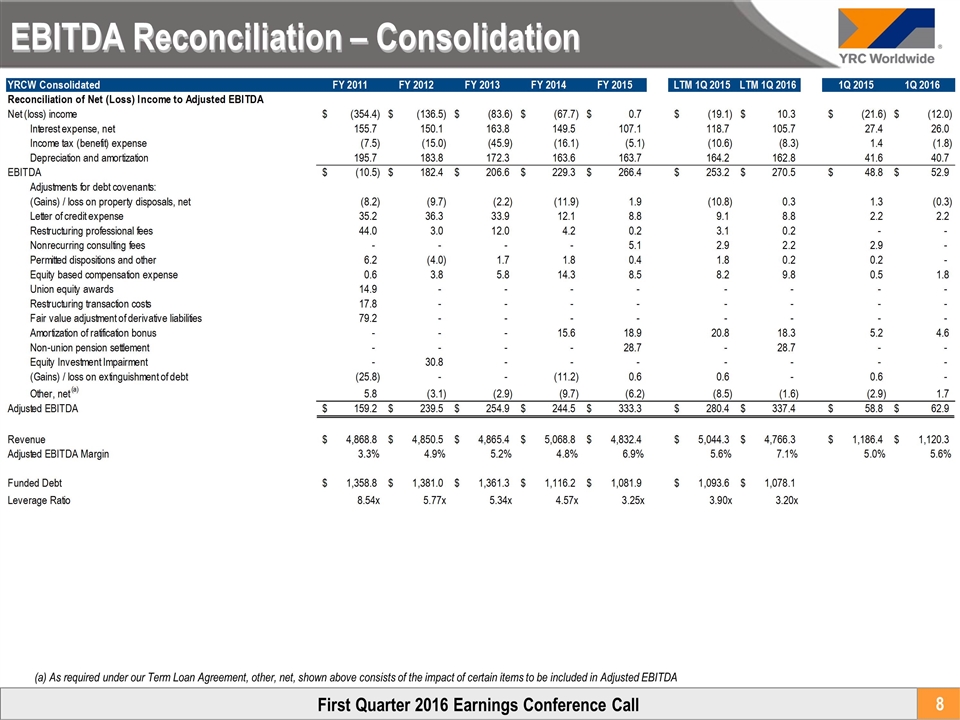
(a) As required under our Term Loan Agreement, other, net, shown above consists of the impact of certain items to be included in Adjusted EBITDA EBITDA Reconciliation – Consolidation First Quarter 2016 Earnings Conference Call

(a) As required under our Term Loan, other nonoperating, net, shown above does not include the impact of non-cash foreign currency gains or losses. EBITDA Reconciliation – Segment First Quarter 2016 Earnings Conference Call


