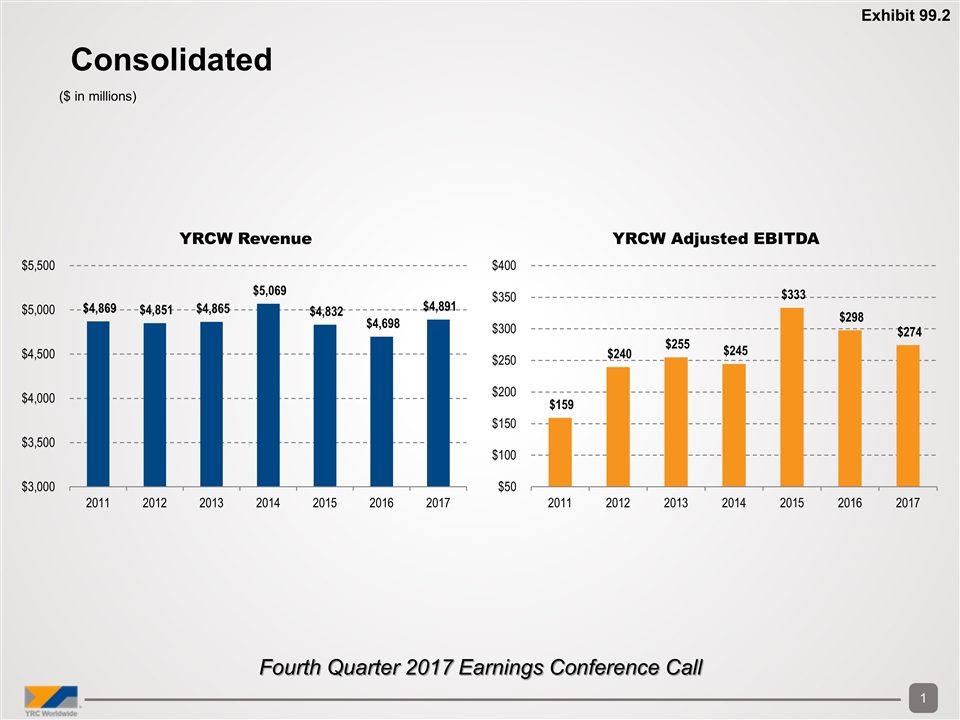
Fourth Quarter 2017 Earnings Conference Call Consolidated ($ in millions) Exhibit 99.2
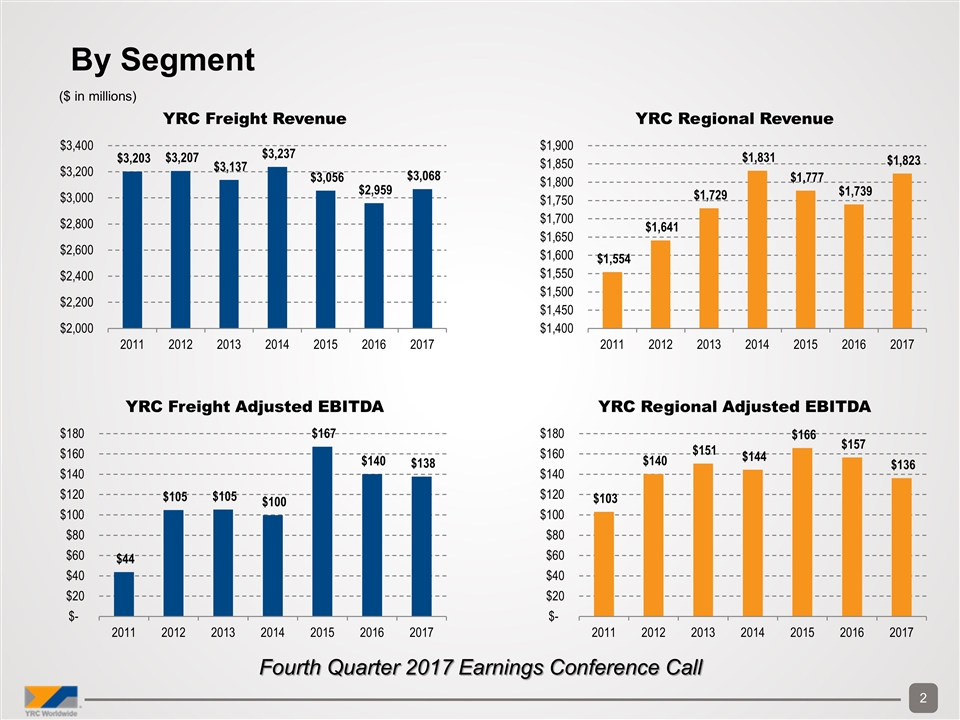
($ in millions) By Segment Fourth Quarter 2017 Earnings Conference Call
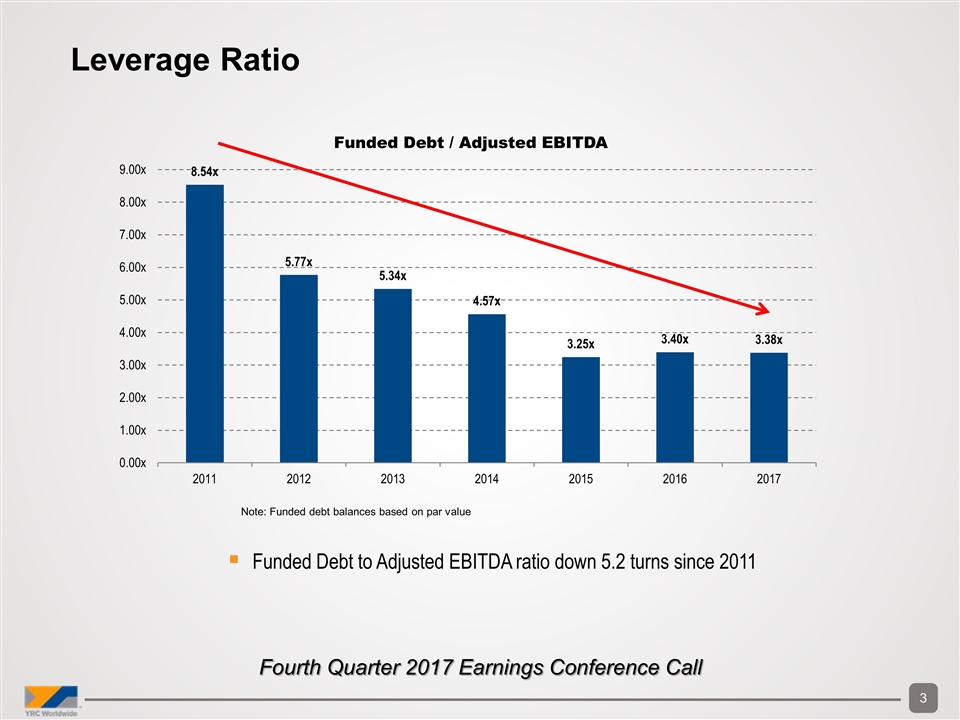
Funded Debt to Adjusted EBITDA ratio down 5.2 turns since 2011 Note: Funded debt balances based on par value Leverage Ratio Fourth Quarter 2017 Earnings Conference Call
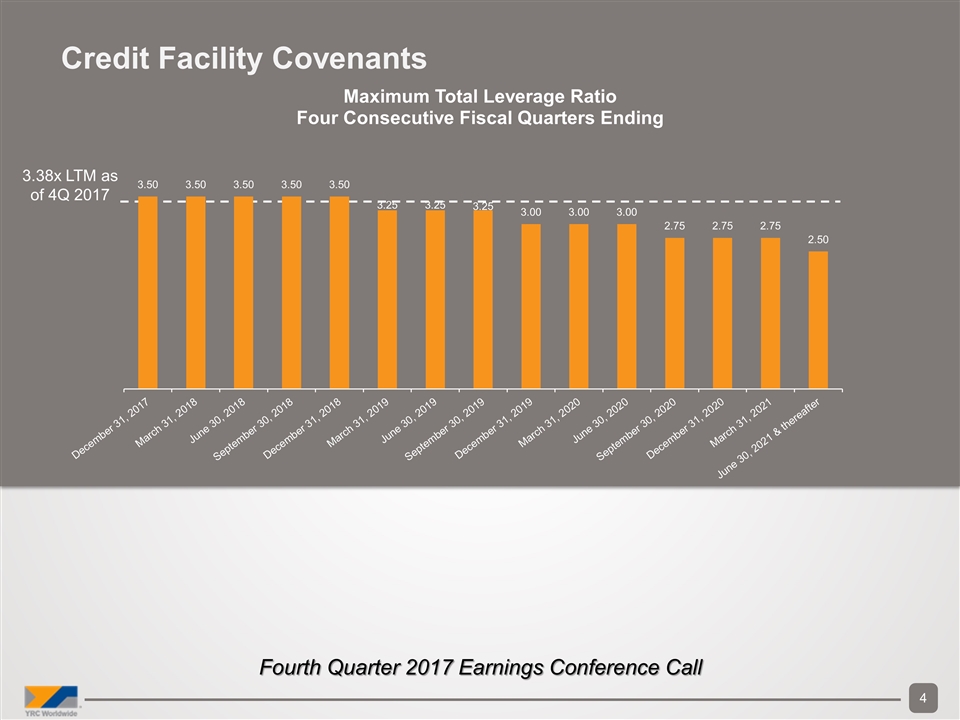
Credit Facility Covenants 3.38x LTM as of 4Q 2017 Fourth Quarter 2017 Earnings Conference Call
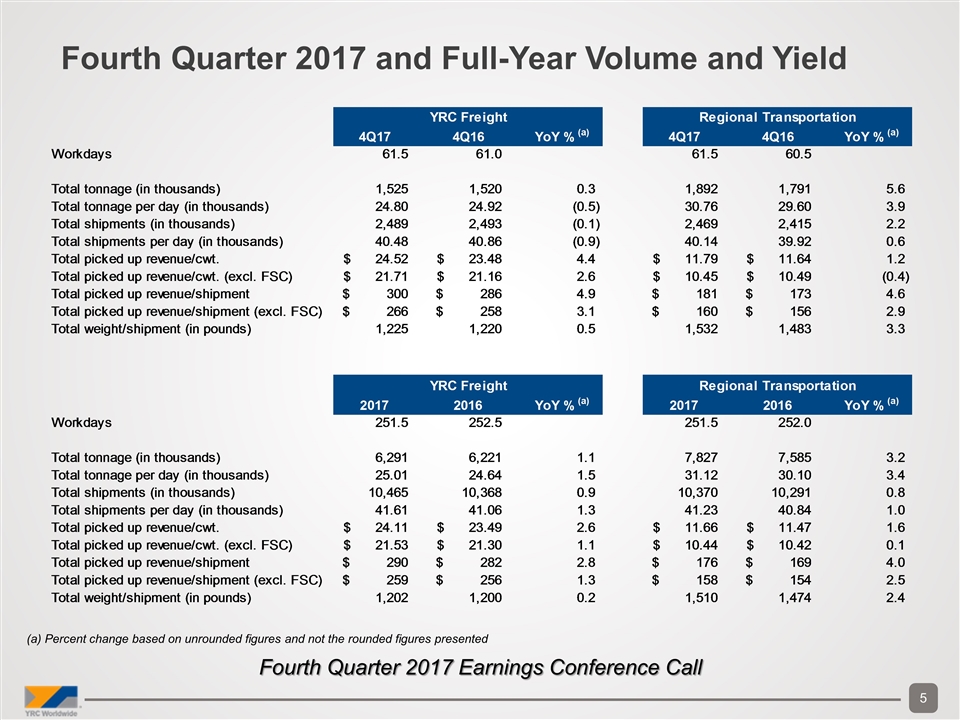
Fourth Quarter 2017 and Full-Year Volume and Yield Fourth Quarter 2017 Earnings Conference Call (a) Percent change based on unrounded figures and not the rounded figures presented
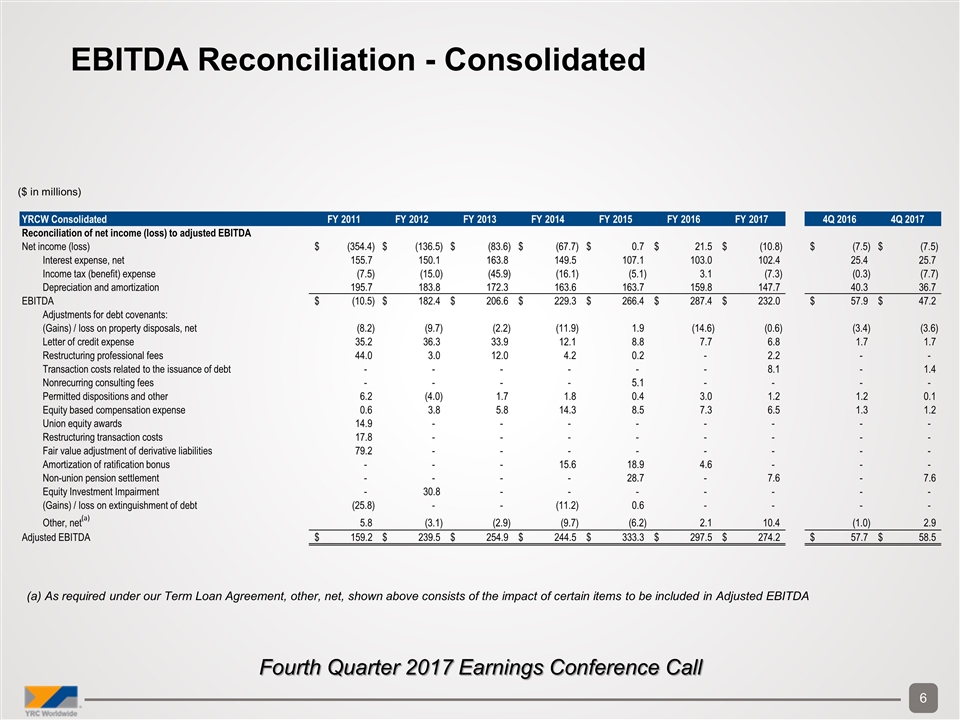
(a) As required under our Term Loan Agreement, other, net, shown above consists of the impact of certain items to be included in Adjusted EBITDA EBITDA Reconciliation - Consolidated ($ in millions) Fourth Quarter 2017 Earnings Conference Call YRCW Consolidated FY 2011 FY 2012 FY 2013 FY 2014 FY 2015 FY 2016 FY 2017 4Q 2016 4Q 2017 Reconciliation of net income (loss) to adjusted EBITDA Net income (loss) (354.4) $ (136.5) $ (83.6) $ (67.7) $ 0.7 $ 21.5 $ (10.8) $ (7.5) $ (7.5) $ Interest expense, net 155.7 150.1 163.8 149.5 107.1 103.0 102.4 25.4 25.7 Income tax (benefit) expense (7.5) (15.0) (45.9) (16.1) (5.1) 3.1 (7.3) (0.3) (7.7) Depreciation and amortization 195.7 183.8 172.3 163.6 163.7 159.8 147.7 40.3 36.7 EBITDA (10.5) $ 182.4 $ 206.6 $ 229.3 $ 266.4 $ 287.4 $ 232.0 $ 57.9 $ 47.2 $ Adjustments for debt covenants: (Gains) / loss on property disposals, net (8.2) (9.7) (2.2) (11.9) 1.9 (14.6) (0.6) (3.4) (3.6) Letter of credit expense 35.2 36.3 33.9 12.1 8.8 7.7 6.8 1.7 1.7 Restructuring professional fees 44.0 3.0 12.0 4.2 0.2 - 2.2 - - Transaction costs related to the issuance of debt - - - - - - 8.1 - 1.4 Nonrecurring consulting fees - - - - 5.1 - - - - Permitted dispositions and other 6.2 (4.0) 1.7 1.8 0.4 3.0 1.2 1.2 0.1 Equity based compensation expense 0.6 3.8 5.8 14.3 8.5 7.3 6.5 1.3 1.2 Union equity awards 14.9 - - - - - - - - Restructuring transaction costs 17.8 - - - - - - - - Fair value adjustment of derivative liabilities 79.2 - - - - - - - - Amortization of ratification bonus - - - 15.6 18.9 4.6 - - - Non-union pension settlement - - - - 28.7 - 7.6 - 7.6 Equity Investment Impairment - 30.8 - - - - - - - (Gains) / loss on extinguishment of debt (25.8) - - (11.2) 0.6 - - - - Other, net (a) 5.8 (3.1) (2.9) (9.7) (6.2) 2.1 10.4 (1.0) 2.9 Adjusted EBITDA 159.2 $ 239.5 $ 254.9 $ 244.5 $ 333.3 $ 297.5 $ 274.2 $ 57.7 $ 58.5 $
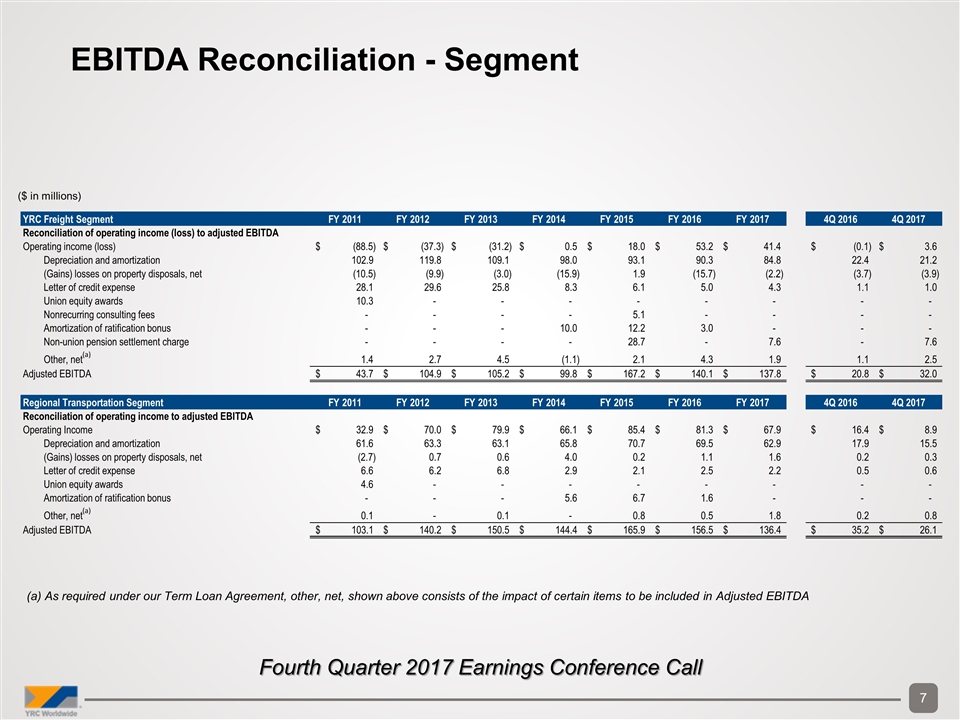
EBITDA Reconciliation - Segment (a) As required under our Term Loan Agreement, other, net, shown above consists of the impact of certain items to be included in Adjusted EBITDA ($ in millions) Fourth Quarter 2017 Earnings Conference Call YRC Freight Segment FY 2011 FY 2012 FY 2013 FY 2014 FY 2015 FY 2016 FY 2017 4Q 2016 4Q 2017 Reconciliation of operating income (loss) to adjusted EBITDA Operating income (loss) (88.5) $ (37.3) $ (31.2) $ 0.5 $ 18.0 $ 53.2 $ 41.4 $ (0.1) $ 3.6 $ Depreciation and amortization 102.9 119.8 109.1 98.0 93.1 90.3 84.8 22.4 21.2 (Gains) losses on property disposals, net (10.5) (9.9) (3.0) (15.9) 1.9 (15.7) (2.2) (3.7) (3.9) Letter of credit expense 28.1 29.6 25.8 8.3 6.1 5.0 4.3 1.1 1.0 Union equity awards 10.3 - - - - - - - - Nonrecurring consulting fees - - - - 5.1 - - - - Amortization of ratification bonus - - - 10.0 12.2 3.0 - - - Non-union pension settlement charge - - - - 28.7 - 7.6 - 7.6 Other, net (a) 1.4 2.7 4.5 (1.1) 2.1 4.3 1.9 1.1 2.5 Adjusted EBITDA 43.7 $ 104.9 $ 105.2 $ 99.8 $ 167.2 $ 140.1 $ 137.8 $ 20.8 $ 32.0 $ Regional Transportation Segment FY 2011 FY 2012 FY 2013 FY 2014 FY 2015 FY 2016 FY 2017 4Q 2016 4Q 2017 Reconciliation of operating income to adjusted EBITDA Operating Income 32.9 $ 70.0 $ 79.9 $ 66.1 $ 85.4 $ 81.3 $ 67.9 $ 16.4 $ 8.9 $ Depreciation and amortization 61.6 63.3 63.1 65.8 70.7 69.5 62.9 17.9 15.5 (Gains) losses on property disposals, net (2.7) 0.7 0.6 4.0 0.2 1.1 1.6 0.2 0.3 Letter of credit expense 6.6 6.2 6.8 2.9 2.1 2.5 2.2 0.5 0.6 Union equity awards 4.6 - - - - - - - - Amortization of ratification bonus - - - 5.6 6.7 1.6 - - - Other, net (a) 0.1 - 0.1 - 0.8 0.5 1.8 0.2 0.8 Adjusted EBITDA 103.1 $ 140.2 $ 150.5 $ 144.4 $ 165.9 $ 156.5 $ 136.4 $ 35.2 $ 26.1 $


