
Yellow Corporation Second Quarter 2021 Earnings Conference Call Exhibit 99.2 YELLOW
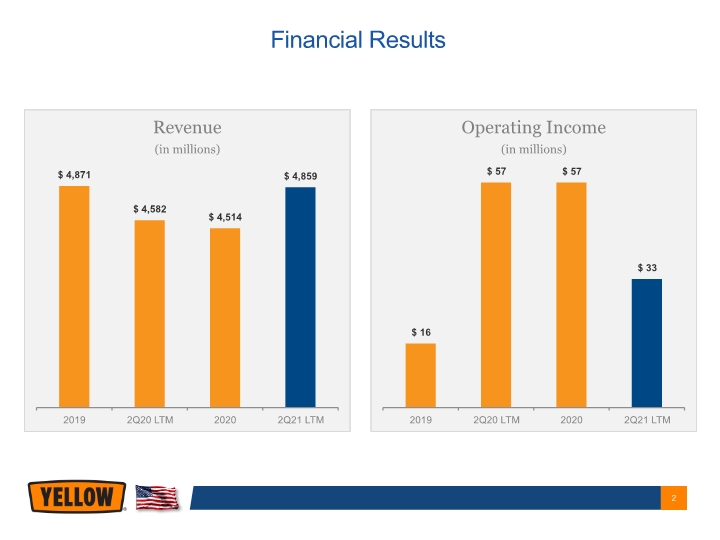
Financial Results Revenue (in millions) $4,871 $4,582 $4,514 $4,859 2019 2020 LTM 2020 2021 LTM Operating Income (in millions) $16 2019 $57 $57 $33 2019 2Q20 LTM 2020 2Q21 LTM YELLOW 2
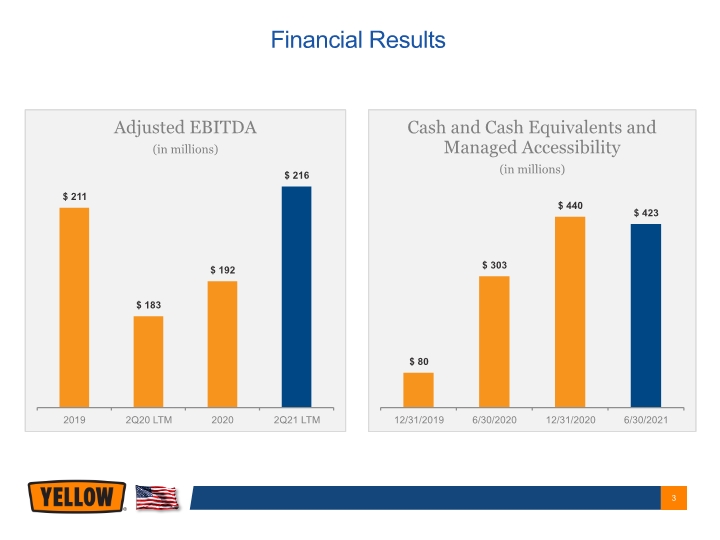
Financial Results Adjusted EBITDA (in millions) $211 $183 $192 $ 216 2019 2Q20 LTM 2020 2Q21 LTM Cash and Cash Equivalents and Managed Accessibility (in millions) $80 $303 $440 $423 12/31/2019 6/30/2020 12/31/2020 6/30/2021 YELLOW 3
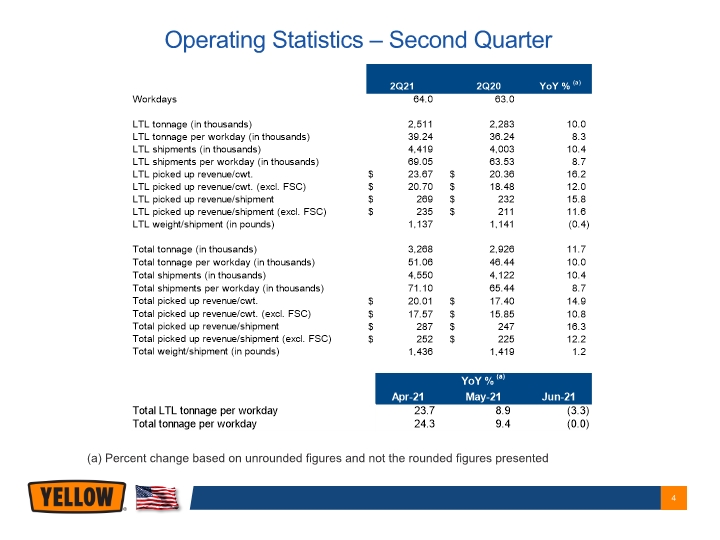
(a) Percent change based on unrounded figures and not the rounded figures presented Operating Statistics – Second Quarter 2Q21 2Q20 YoY % (a) Workdays 64.0 63.0 LTL tonnage (in thousands) 2,511 2,283 10.0 LTL tonnage per workday (in thousands) 39.24 36.24 8.3 LTL shipments (in thousands) 4,419 4,003 10.4 LTL shipments per workday (in thousands) 69.05 63.53 8.7 LTL picked up revenue/cwt. $ 23.67 $ 20.36 16.2 LTL picked up revenue/cwt. (excl. FSC) $ 20.70 $ 18.48 12.0 LTL picked up revenue/shipment $ 269 $ 232 15.8 LTL picked up revenue/shipment (excl. FSC) $ 235 $ 211 11.6 LTL weight/shipment (in pounds) 1,137 1,141 (0.4) Total tonnage (in thousands) 3,268 2,926 11.7 Total tonnage per workday (in thousands) 51.06 46.44 10.0 Total shipments (in thousands) 4,550 4,122 10.4 Total shipments per workday (in thousands) 71.10 65.44 8.7 Total picked up revenue/cwt. $ 20.01 $ 17.40 14.9 Total picked up revenue/cwt. (excl. FSC) $ 17.57 $ 15.85 10.8 Total picked up revenue/shipment $ 287 $ 247 16.3 Total picked up revenue/shipment (excl. FSC) $ 252 $ 225 12.2 Total weight/shipment (in pounds) 1,436 1,419 1.2 YoY % (a) Apr-21 May-21 Jun-21 Total LTL tonnage per workday 23.7 8.9 (3.3) Total tonnage per workday 24.3 9.4 (0.0) YELLOW 4
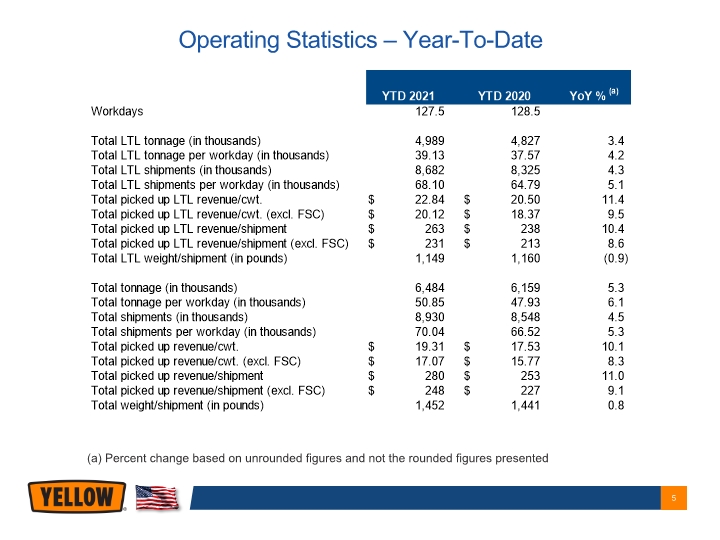
(a) Percent change based on unrounded figures and not the rounded figures presented Operating Statistics – Year-To-Date YTD 2021 YTD 2020 YoY % (a) Workdays 127.5 128.5 Total LTL tonnage (in thousands) 4,989 4,827 3.4 Total LTL tonnage per workday (in thousands) 39.13 37.57 4.2 Total LTL shipments (in thousands) 8,682 8,325 4.3 Total LTL shipments per workday (in thousands) 68.10 64.79 5.1 Total picked up LTL revenue/cwt. $ 22.84 $ 20.50 11.4 Total picked up LTL revenue/cwt. (excl. FSC) $ 20.12 $ 18.37 9.5 Total picked up LTL revenue/shipment $ 263 $ 238 10.4 Total picked up LTL revenue/shipment (excl. FSC) $ 231 $ 213 8.6 Total LTL weight/shipment (in pounds) 1,149 1,160 (0.9) Total tonnage (in thousands) 6,484 6,159 5.3 Total tonnage per workday (in thousands) 50.85 47.93 6.1 Total shipments (in thousands) 8,930 8,548 4.5 Total shipments per workday (in thousands) 70.04 66.52 5.3 Total picked up revenue/cwt. $ 19.31 $ 17.53 10.1 Total picked up revenue/cwt. (excl. FSC) $ 17.07 $ 15.77 8.3 Total picked up revenue/shipment $ 280 $ 253 11.0 Total picked up revenue/shipment (excl. FSC) $ 248 $ 227 9.1 Total weight/shipment (in pounds) 1,452 1,441 0.8 YELLOW 5
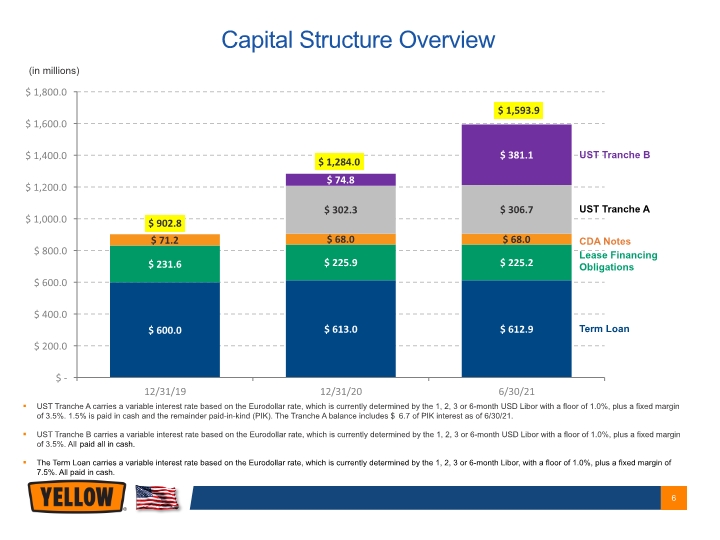
6 Term Loan Lease Financing Obligations CDA Notes UST Tranche A UST Tranche B (in millions) UST Tranche A carries a variable interest rate based on the Eurodollar rate, which is currently determined by the 1, 2, 3 or 6-month USD Libor with a floor of 1.0%, plus a fixed margin of 3.5%. 1.5% is paid in cash and the remainder paid-in-kind (PIK). The Tranche A balance includes $6.7 of PIK interest as of 6/30/21. UST Tranche B carries a variable interest rate based on the Eurodollar rate, which is currently determined by the 1, 2, 3 or 6-month USD Libor with a floor of 1.0%, plus a fixed margin of 3.5%. All paid all in cash. The Term Loan carries a variable interest rate based on the Eurodollar rate, which is currently determined by the 1, 2, 3 or 6-month Libor, with a floor of 1.0%, plus a fixed margin of 7.5%. All paid in cash. Capital Structure Overview $1,800.0 $1,593.9 $1,600.0 $1,400.0 $381.1 $1,284.0 $74.8 $1,200.0 $1,000.0 $302.3 $306.7 $902.8 $71.2 $68.0 $68.0 $800.0 $231.6 $225.9 $225.2 $600.0 $400.0 $600.0 $613.0 $612.9 $200.0 $- 12/31/19 12/31/20 6/30/21 YELLOW 6
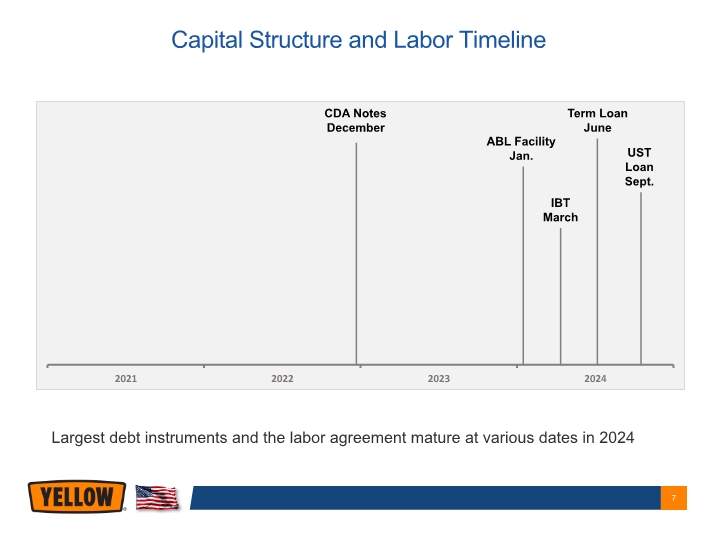
7 Largest debt instruments and the labor agreement mature at various dates in 2024 IBT March ABL Facility Jan. Term Loan June CDA Notes December UST Loan Sept. Capital Structure and Labor Timeline 2021 2022 2023 2024 YELLOW
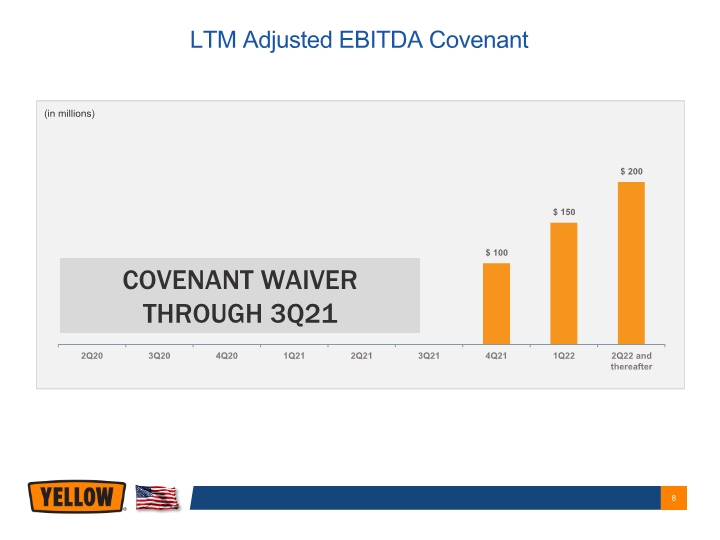
(in millions) LTM Adjusted EBITDA Covenant $200 $150 $100 COVENANT WAIVER THROUGH 3Q21 2Q20 3Q20 4Q20 1Q21 2Q21 3Q21 4Q21 1Q22 2Q22 and thereafter YELLOW 8
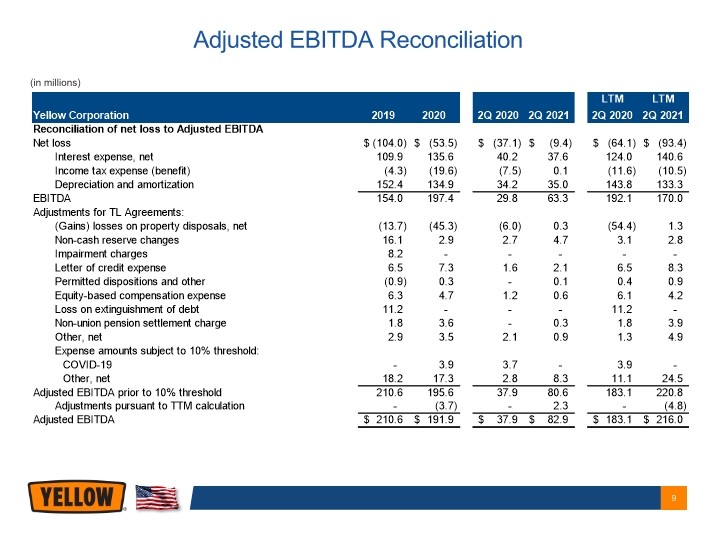
(in millions) Adjusted EBITDA Reconciliation Yellow Corporation 2019 2020 2Q 2020 2Q 2021 LTM 2Q 2020 LTM 2Q 2021 Reconciliation of net loss to Adjusted EBITDA Net loss $ (104.0) $(53.5) $(37.1) $ (9.4) $ (64.1) $ (93.4) Interest expense, net 109.9 135.6 40.2 37.6 124.0 140.6 Income tax expense (benefit) (4.3) (19.6) (7.5) 0.1 (11.6) (10.5) Depreciation and amortization 152.4 134.9 34.2 35.0 143.8 133.3 EBITDA 154.0 197.4 29.8 63.3 192.1 170.0 Adjustments for TL Agreements: (Gains) losses on property disposals, net (13.7) (45.3) (6.0) 0.3 (54.4) 1.3 Non-cash reserve changes 16.1 2.9 2.7 4.7 3.1 2.8 Impairment charges 8.2 - - - - -Letter of credit expense 6.5 7.3 1.6 2.1 6.5 8.3 Permitted dispositions and other (0.9) 0.3 - 0.1 0.4 0.9 Equity-based compensation expense 6.3 4.7 1.2 0.6 6.1 4.2 Loss on extinguishment of debt 11.2 - - - 11.2 -Non-union pension settlement charge 1.8 3.6 - 0.3 1.8 3.9 Other, net 2.9 3.5 2.1 0.9 1.3 4.9 Expense amounts subject to 10% threshold: COVID -19 - 3.9 3.7 - 3.9 -Other, net 18.2 17.3 2.8 8.3 11.1 24.5 Adjusted EBITDA prior to 10% threshold 210.6 195.6 37.9 80.6 183.1 220.8 Adjustments pursuant to TTM calculation - (3.7) - 2.3 - (4.8) Adjusted EBITDA $ 210.6 $191.9 $ 37.9 $82.9 $ 183.1 $ 216.0 YELLOW 9


