
Cincinnati Bell Fourth Quarter 2012 Results February 27, 2013
2 Today’s Agenda 2 2013 Outlook – The Next Chapter Ted Torbeck, Chief Executive Officer 2012 Highlights and Segment Results Kurt Freyberger, Chief Financial Officer 2013 Guidance Kurt Freyberger, Chief Financial Officer Question & Answer

3 Safe Harbor 3 This presentation and the documents incorporated by reference herein contain forward- looking statements regarding future events and our future results that are subject to the “safe harbor” provisions of the Private Securities Litigation Reform Act of 1995. All statements, other than statements of historical facts, are statements that could be deemed forward-looking statements. These statements are based on current expectations, estimates, forecasts, and projections about the industries in which we operate and the beliefs and assumptions of our management. Words such as “expects,” “anticipates,” “predicts,” “projects,” “intends,” “plans,” “believes,” “seeks,” “estimates,” “continues,” “endeavors,” “strives,” “may,” variations of such words and similar expressions are intended to identify such forward-looking statements. In addition, any statements that refer to projections of our future financial performance, our anticipated growth and trends in our businesses, and other characterizations of future events or circumstances are forward- looking statements. Readers are cautioned these forward-looking statements are based on current expectations and assumptions that are subject to risks and uncertainties, which could cause our actual results to differ materially and adversely from those reflected in the forward-looking statements. Factors that could cause or contribute to such differences include, but are not limited to, those discussed in this release and those discussed in other documents we file with the Securities and Exchange Commission (SEC). More information on potential risks and uncertainties is available in our recent filings with the SEC, including Cincinnati Bell’s Form 10-K report, Form 10-Q reports and Form 8-K reports. Actual results may differ materially and adversely from those expressed in any forward-looking statements. We undertake no obligation to revise or update any forward-looking statements for any reason.
4 Non GAAP Financial Measures 4 This presentation contains information about adjusted earnings before interest, taxes, depreciation and amortization (Adjusted EBITDA), Adjusted EBITDA margin, net debt and free cash flow. These are non-GAAP financial measures used by Cincinnati Bell management when evaluating results of operations and cash flow. Management believes these measures also provide users of the financial statements with additional and useful comparisons of current results of operations and cash flows with past and future periods. Non-GAAP financial measures should not be construed as being more important than comparable GAAP measures. Detailed reconciliations of Adjusted EBITDA, net debt and free cash flow (including the Company’s definition of these terms) to comparable GAAP financial measures can be found in the earnings release on our website at www.cincinnatibell.com within the Investor Relations section.
Ted Torbeck Chief Executive Officer
6 6 Current State Well positioned Wireline operations Opportunity to invest in Fiber growth Financial investment in growing data center business • Monetization of investment will be used over time to repay debt to appropriate levels Wireless faces intense competitive pressures • Postpaid subscriber losses expected to continue • EBITDA expected to decline approximately $20 million in 2013
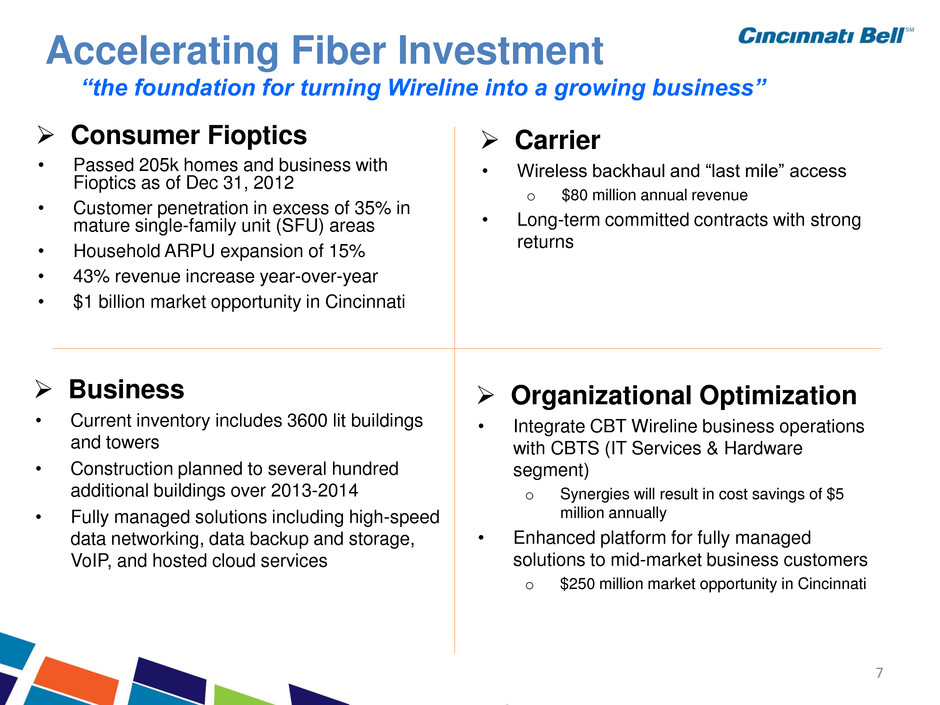
7 7 Accelerating Fiber Investment “the foundation for turning Wireline into a growing business” Consumer Fioptics • Passed 205k homes and business with Fioptics as of Dec 31, 2012 • Customer penetration in excess of 35% in mature single-family unit (SFU) areas • Household ARPU expansion of 15% • 43% revenue increase year-over-year • $1 billion market opportunity in Cincinnati Business • Current inventory includes 3600 lit buildings and towers • Construction planned to several hundred additional buildings over 2013-2014 • Fully managed solutions including high-speed data networking, data backup and storage, VoIP, and hosted cloud services Organizational Optimization • Integrate CBT Wireline business operations with CBTS (IT Services & Hardware segment) o Synergies will result in cost savings of $5 million annually • Enhanced platform for fully managed solutions to mid-market business customers o $250 million market opportunity in Cincinnati Carrier • Wireless backhaul and “last mile” access o $80 million annual revenue • Long-term committed contracts with strong returns
Kurt Freyberger Chief Financial Officer
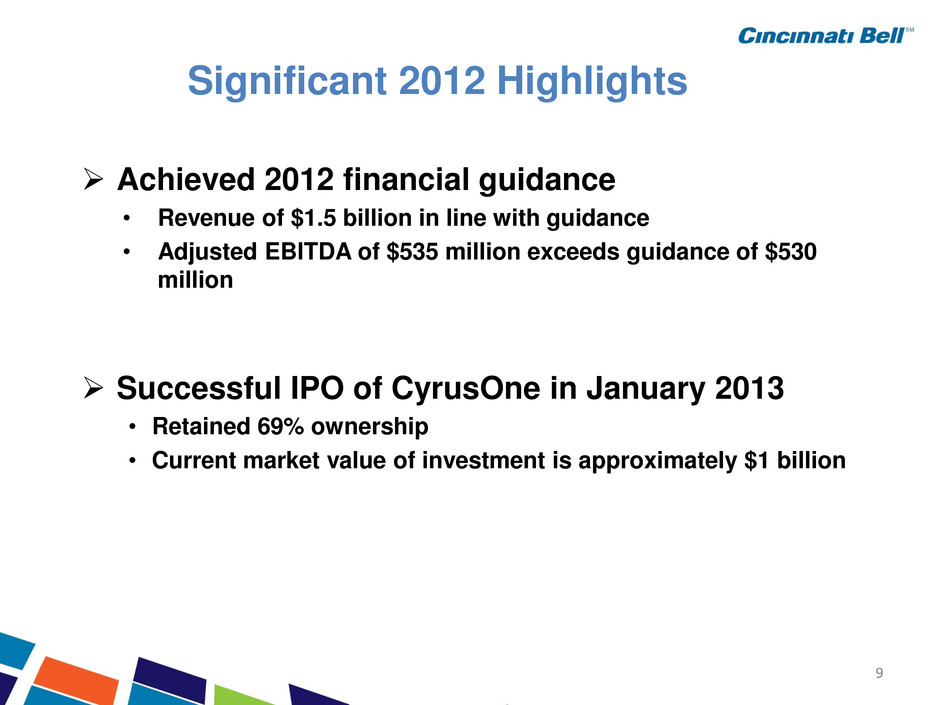
9 9 Significant 2012 Highlights Achieved 2012 financial guidance • Revenue of $1.5 billion in line with guidance • Adjusted EBITDA of $535 million exceeds guidance of $530 million Successful IPO of CyrusOne in January 2013 • Retained 69% ownership • Current market value of investment is approximately $1 billion
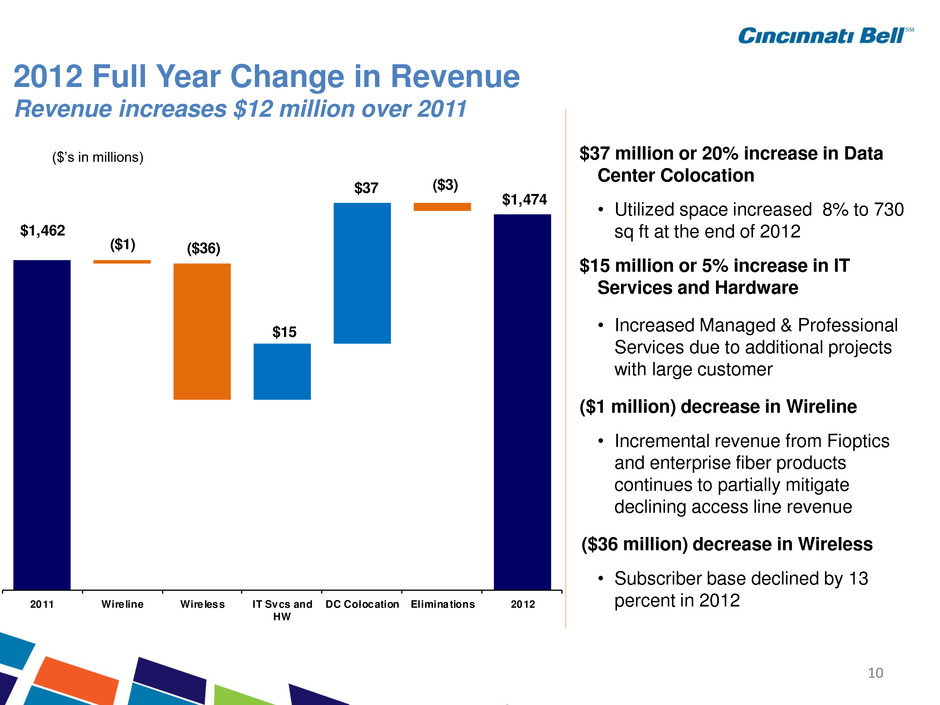
10 10 2012 Full Year Change in Revenue Revenue increases $12 million over 2011 $37 million or 20% increase in Data Center Colocation • Utilized space increased 8% to 730 sq ft at the end of 2012 $15 million or 5% increase in IT Services and Hardware • Increased Managed & Professional Services due to additional projects with large customer ($1 million) decrease in Wireline • Incremental revenue from Fioptics and enterprise fiber products continues to partially mitigate declining access line revenue ($36 million) decrease in Wireless • Subscriber base declined by 13 percent in 2012 ($’s in millions) $1,462 $1,474 ($1) ($36) $15 $37 ($3) 2011 Wireline Wireless IT Svcs and HW DC Colocation Eliminations 2012
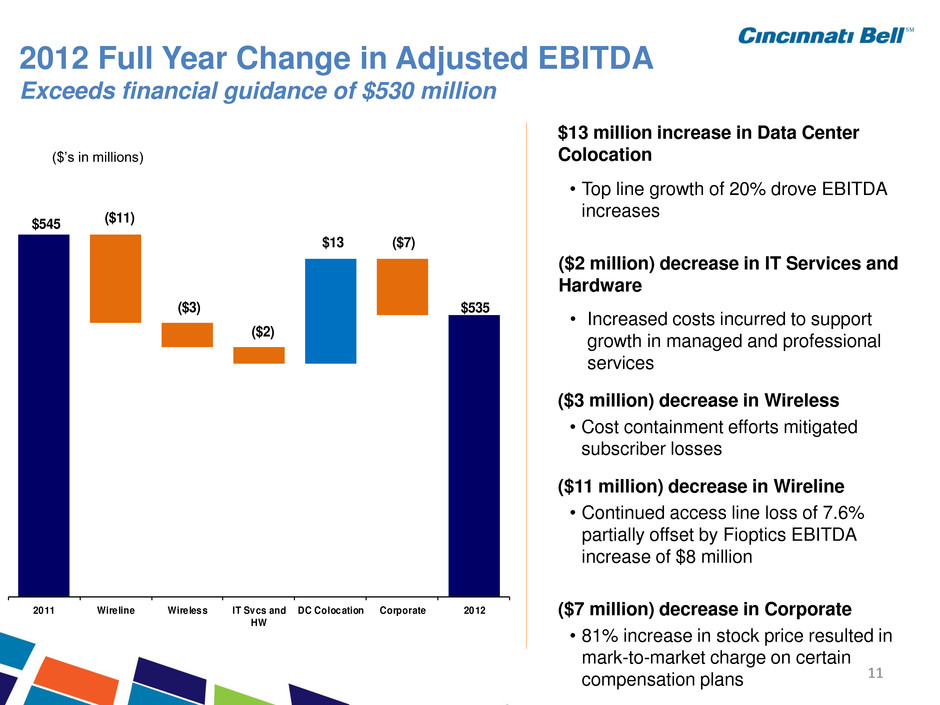
11 11 2012 Full Year Change in Adjusted EBITDA Exceeds financial guidance of $530 million $13 million increase in Data Center Colocation • Top line growth of 20% drove EBITDA increases ($2 million) decrease in IT Services and Hardware • Increased costs incurred to support growth in managed and professional services ($3 million) decrease in Wireless • Cost containment efforts mitigated subscriber losses ($11 million) decrease in Wireline • Continued access line loss of 7.6% partially offset by Fioptics EBITDA increase of $8 million ($7 million) decrease in Corporate • 81% increase in stock price resulted in mark-to-market charge on certain compensation plans ($’s in millions) $545 $535 ($11) ($3) ($2) $13 ($7) 2011 Wireline Wireless IT Svcs and HW DC Colocation Corporate 2012
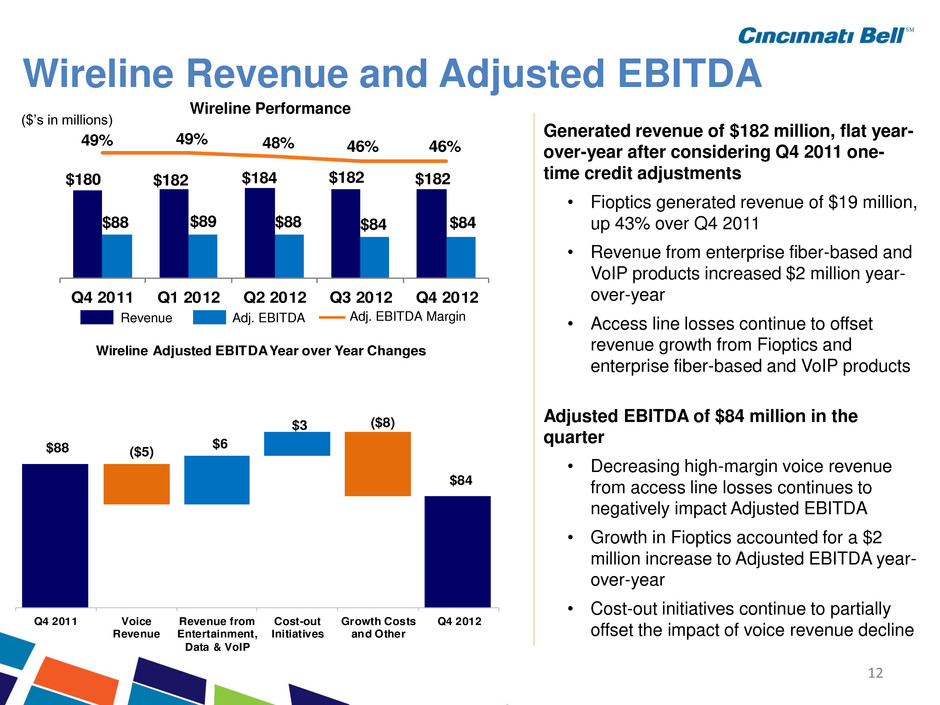
12 12 Wireline Performance ($’s in millions) Revenue Adj. EBITDA Adj. EBITDA Margin Wireline Revenue and Adjusted EBITDA Generated revenue of $182 million, flat year- over-year after considering Q4 2011 one- time credit adjustments • Fioptics generated revenue of $19 million, up 43% over Q4 2011 • Revenue from enterprise fiber-based and VoIP products increased $2 million year- over-year • Access line losses continue to offset revenue growth from Fioptics and enterprise fiber-based and VoIP products Adjusted EBITDA of $84 million in the quarter • Decreasing high-margin voice revenue from access line losses continues to negatively impact Adjusted EBITDA • Growth in Fioptics accounted for a $2 million increase to Adjusted EBITDA year- over-year • Cost-out initiatives continue to partially offset the impact of voice revenue decline $180 $182 $184 $182 $182 $88 $89 $88 $84 $84 49% 49% 48% 46% 46% Q4 2011 Q1 2012 Q2 2012 Q3 2012 Q4 2012 $88 $84 ($5) $6 $3 ($8) Q4 2011 Voice Revenue Revenue from Entertainment, Data & VoIP Cost-out Initiatives Growth Costs and Other Q4 2012 Wireline Adjusted EBITDA Year over Year Changes
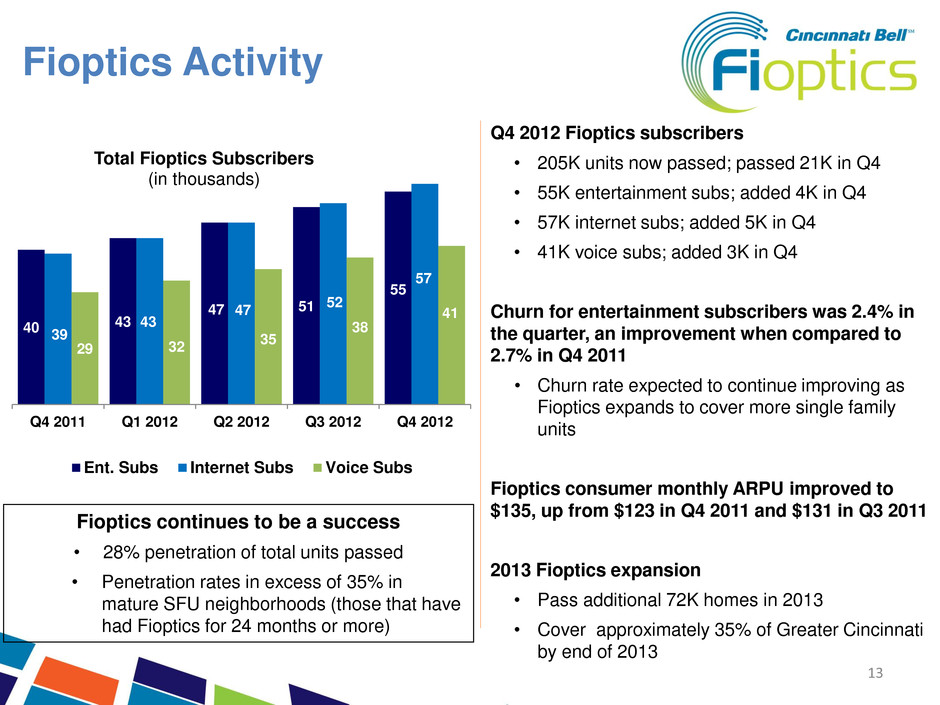
13 Q4 2012 Fioptics subscribers • 205K units now passed; passed 21K in Q4 • 55K entertainment subs; added 4K in Q4 • 57K internet subs; added 5K in Q4 • 41K voice subs; added 3K in Q4 Churn for entertainment subscribers was 2.4% in the quarter, an improvement when compared to 2.7% in Q4 2011 • Churn rate expected to continue improving as Fioptics expands to cover more single family units Fioptics consumer monthly ARPU improved to $135, up from $123 in Q4 2011 and $131 in Q3 2011 2013 Fioptics expansion • Pass additional 72K homes in 2013 • Cover approximately 35% of Greater Cincinnati by end of 2013 13 Fioptics continues to be a success • 28% penetration of total units passed • Penetration rates in excess of 35% in mature SFU neighborhoods (those that have had Fioptics for 24 months or more) Fioptics Activity 40 43 47 51 55 39 43 47 52 57 29 32 35 38 41 Q4 2011 Q1 2012 Q2 2012 Q3 2012 Q4 2012 Total Fioptics Subscribers (in thousands) Ent. Subs Internet Subs Voice Subs
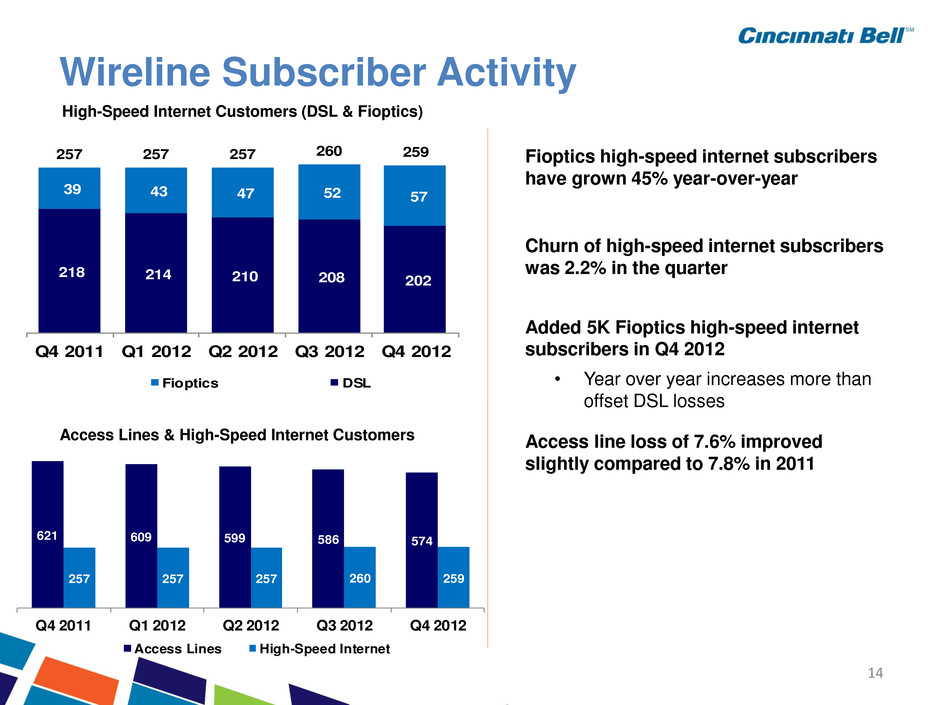
14 218 214 210 208 202 39 43 47 52 57 257 257 257 260 259 Q4 2011 Q1 2012 Q2 2012 Q3 2012 Q4 2012 Fioptics DSL 621 609 599 586 574 257 257 257 260 259 Q4 2011 Q1 2012 Q2 2012 Q3 2012 Q4 2012 Access Lines High-Speed Internet 14 Wireline Subscriber Activity Fioptics high-speed internet subscribers have grown 45% year-over-year Churn of high-speed internet subscribers was 2.2% in the quarter Added 5K Fioptics high-speed internet subscribers in Q4 2012 • Year over year increases more than offset DSL losses Access line loss of 7.6% improved slightly compared to 7.8% in 2011 High-Speed Internet Customers (DSL & Fioptics) Access Lines & High-Speed Internet Customers
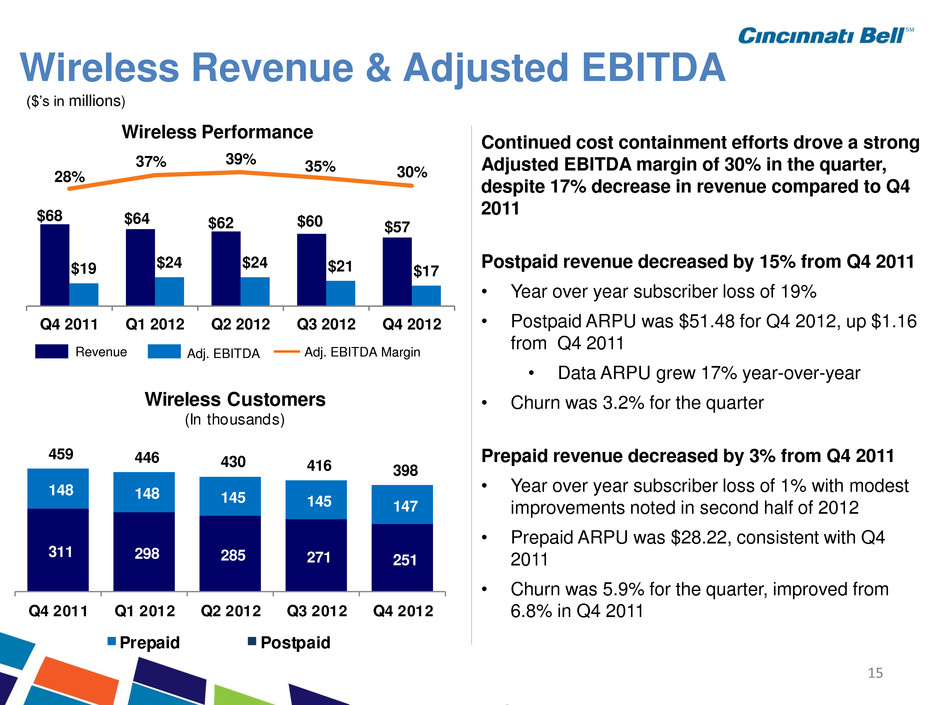
15 15 Wireless Performance Revenue Adj. EBITDA Adj. EBITDA Margin Wireless Revenue & Adjusted EBITDA Continued cost containment efforts drove a strong Adjusted EBITDA margin of 30% in the quarter, despite 17% decrease in revenue compared to Q4 2011 Postpaid revenue decreased by 15% from Q4 2011 • Year over year subscriber loss of 19% • Postpaid ARPU was $51.48 for Q4 2012, up $1.16 from Q4 2011 • Data ARPU grew 17% year-over-year • Churn was 3.2% for the quarter Prepaid revenue decreased by 3% from Q4 2011 • Year over year subscriber loss of 1% with modest improvements noted in second half of 2012 • Prepaid ARPU was $28.22, consistent with Q4 2011 • Churn was 5.9% for the quarter, improved from 6.8% in Q4 2011 ($’s in millions) $68 $64 $62 $60 $57 $19 $24 $24 $21 $17 28% 37% 39% 35% 30% Q4 2011 Q1 2012 Q2 2012 Q3 2012 Q4 2012 311 298 285 271 251 148 148 145 145 147 459 446 430 416 398 Q4 2011 Q1 2012 2 2012 Q3 2012 Q4 2012 Prepaid Postpaid Wireless Customers (In thousands)

16 16 ($’s in millions) IT Services and Hardware Strong revenue of $87 million in Q4 2012 • Telecom & IT Equipment revenue of $60 million was up 19% compared to Q4 2011 • Revenue from Managed and Professional Services increased by $2 million, or 6%, from Q4 2011 Adjusted EBITDA and margin of $4 million and 5%, respectively, during the quarter $76 $73 $77 $78 $87 Q4 2011 Q1 2012 Q2 2012 Q3 2012 Q4 2012 Revenue $5 $4 $3 $6 $4 6% 6% 4% 8% 5% Q4 2011 Q1 2012 Q2 2012 Q3 2012 Q4 2012 Adjusted EBITDA Adj. EBITDA Adj. EBITDA Margin
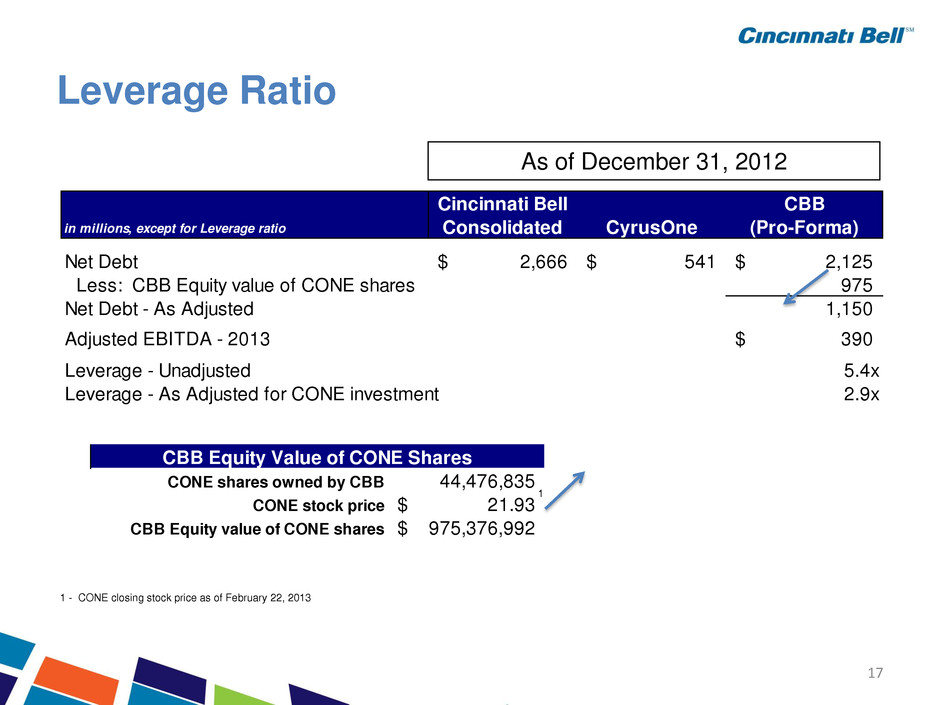
17 Leverage Ratio 17 in millions, except for Leverage ratio Cincinnati Bell Consolidated CyrusOne CBB (Pro-Forma) Net Debt 2,666$ 541$ 2,125$ Less: CBB Equity value of CONE shares 975 Net Debt - As Adjusted 1,150 Adjusted EBITDA - 2013 390$ Leverage - Unadjusted 5.4x Leverage - As Adjusted for CONE investment 2.9x CONE shares owned by CBB 44,476,835 CONE stock price 21.93$ CBB Equity value of CONE shares 975,376,992$ CBB Equity Value of CONE Shares 1 1 - CONE closing stock price as of February 22, 2013 As of December 31, 2012
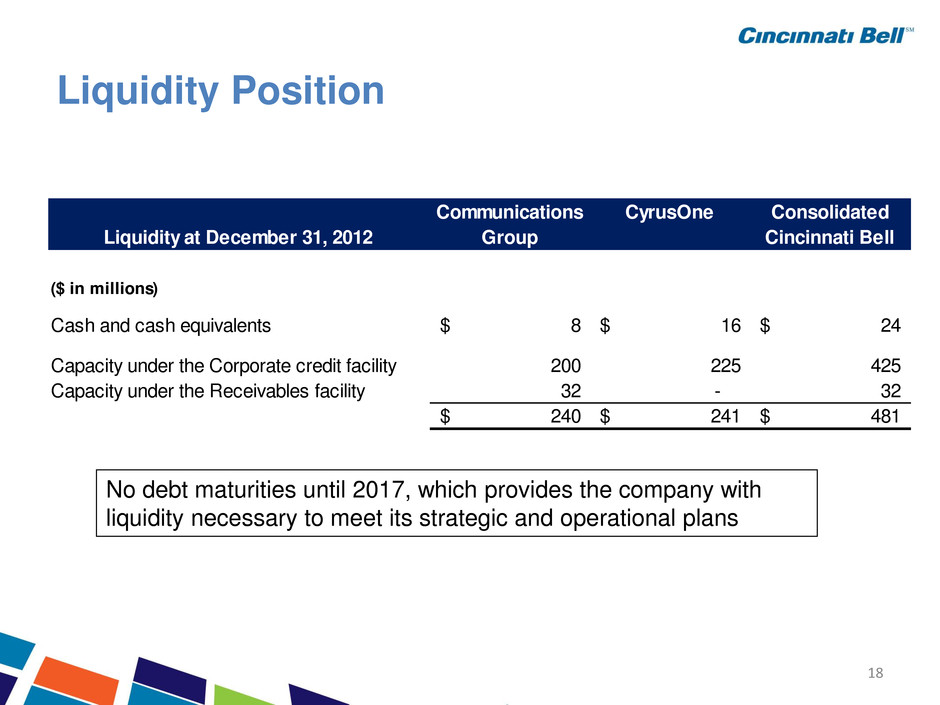
18 Liquidity Position 18 Communications Group CyrusOne Consolidated Cincinnati Bell ($ in millions) Cash and cash equivalents 8$ 16$ 24$ Capacity under the Corporate credit facility 200 225 425 Capacity under the Receivables facility 32 - 32 240$ 241$ 481$ Liquidity at December 31, 2012 No debt maturities until 2017, which provides the company with liquidity necessary to meet its strategic and operational plans
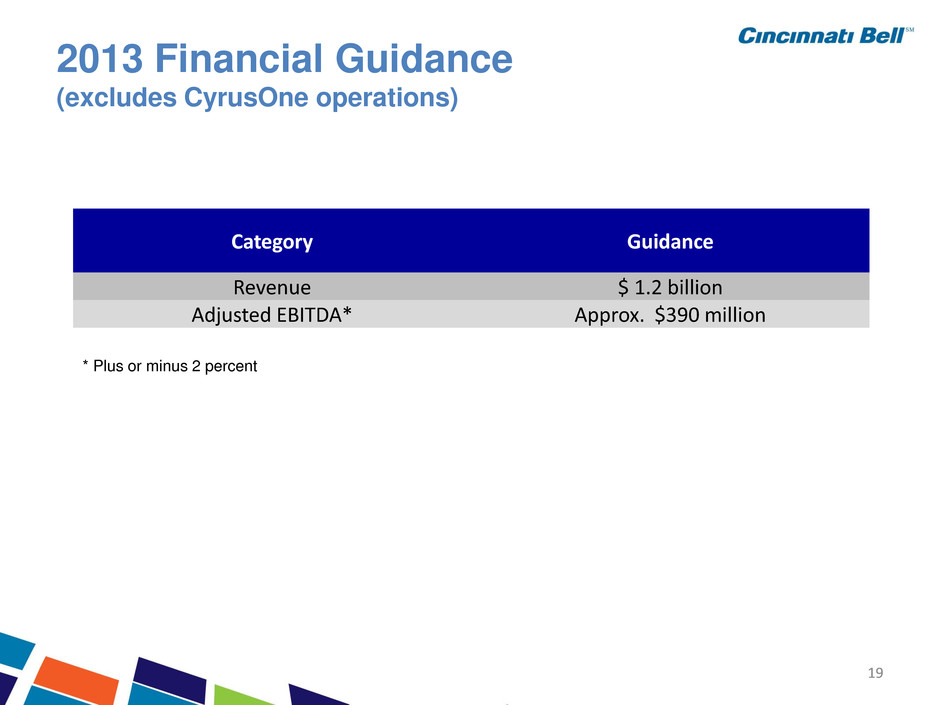
19 2013 Financial Guidance (excludes CyrusOne operations) 19 * Plus or minus 2 percent Category Guidance Rev nue $ 1.2 billion Adjusted EBITDA* Approx. $390 million * Plus or minus 2 percent
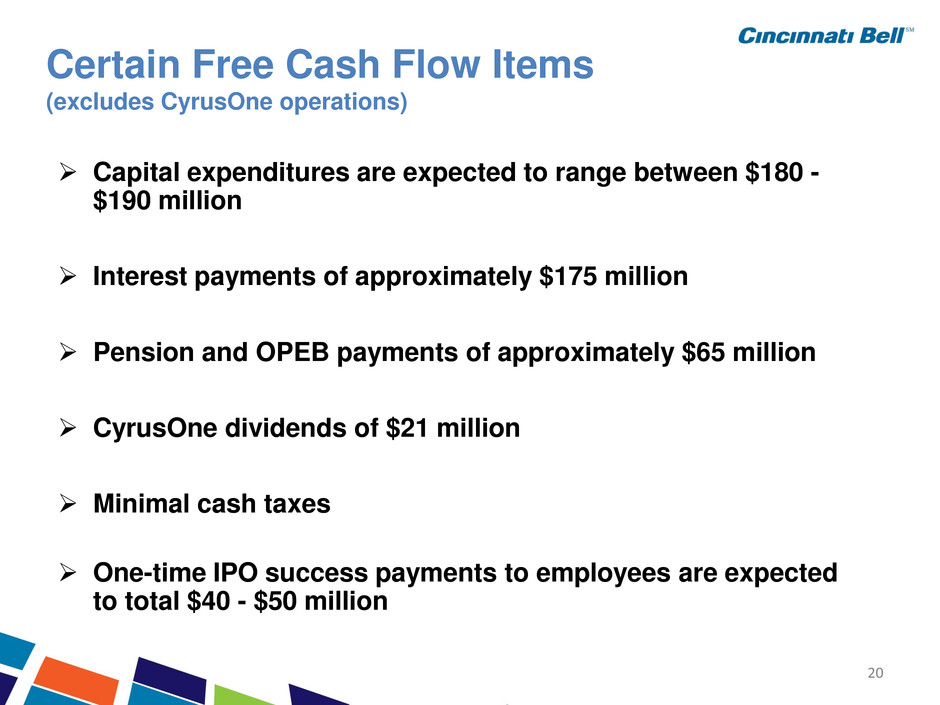
20 20 Certain Free Cash Flow Items (excludes CyrusOne operations) Capital expenditures are expected to range between $180 - $190 million Interest payments of approximately $175 million Pension and OPEB payments of approximately $65 million CyrusOne dividends of $21 million Minimal cash taxes One-time IPO success payments to employees are expected to total $40 - $50 million


