Cincinnati Bell 3rd Quarter 2007 Review SubTitle: November 2, 2007
Agenda Performance Highlights Jack Cassidy, President & CEO 2. Operational & Financial Overview Brian Ross, Chief Financial Officer 3. Q & A

Safe Harbor Certain of the statements and predictions contained in this presentation constitute forward-looking statements within the meaning of the Private Securities Litigation Reform Act. In particular, any statements, projections or estimates that include or reference the words “believes,” “anticipates,” “plans,” “intends,” “expects,” “will,” or any similar expression fall within the safe harbor for forward-looking statements contained in the Reform Act. Actual results or outcomes may differ materially from those indicated or suggested by any such forward-looking statement for a variety of reasons, including but not limited to, Cincinnati Bell’s ability to maintain its market position in communications services, including wireless, wireline and internet services; general economic trends affecting the purchase or supply of communication services; world and national events that may affect the ability to provide services; changes in the regulatory environment; any rulings, orders or decrees that may be issued by any court or arbitrator; restrictions imposed under various credit facilities and debt instruments; work stoppages caused by labor disputes; adjustments resulting from year-end audit procedures; and Cincinnati Bell’s ability to develop and launch new products and services. More information on potential risks and uncertainties is available in recent filings with the Securities and Exchange Commission, including Cincinnati Bell’s Form 10-K report, Form 10-Q reports and Forms 8-K. The forward-looking statements included in this presentation represent estimates as of the date on the first slide. It is anticipated that subsequent events and developments will cause estimates to change.
Performance Highlights Jack Cassidy President & CEO
3Q 2007 Accomplishments Eighth consecutive quarter of Revenue growth and fifth straight quarter of EBITDA growth from core operations 15% wireless service revenue growth contributing to a 35% increase in EBITDA 29% revenue growth and 25% EBITDA growth in Technology Solutions Wireline Revenue and EBITDA flat year-over-year
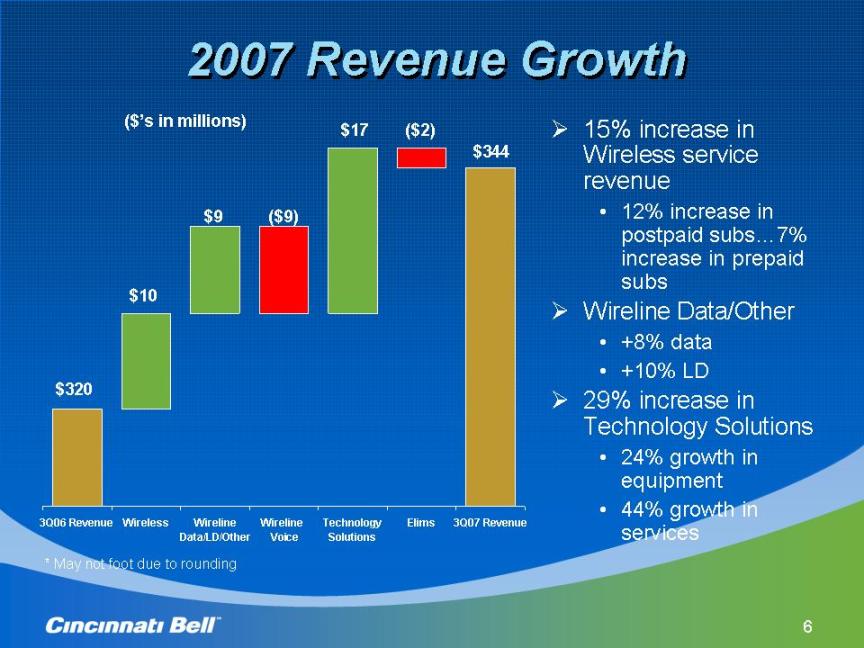
2007 Revenue Growth 15% increase in Wireless service revenue 12% increase in postpaid subs…7% increase in prepaid subs Wireline Data/Other +8% data +10% LD 29% increase in Technology Solutions 24% growth in equipment 44% growth in services ($’s in millions) $320 ($9) $10 $9 ($2) $344 * May not foot due to rounding $17
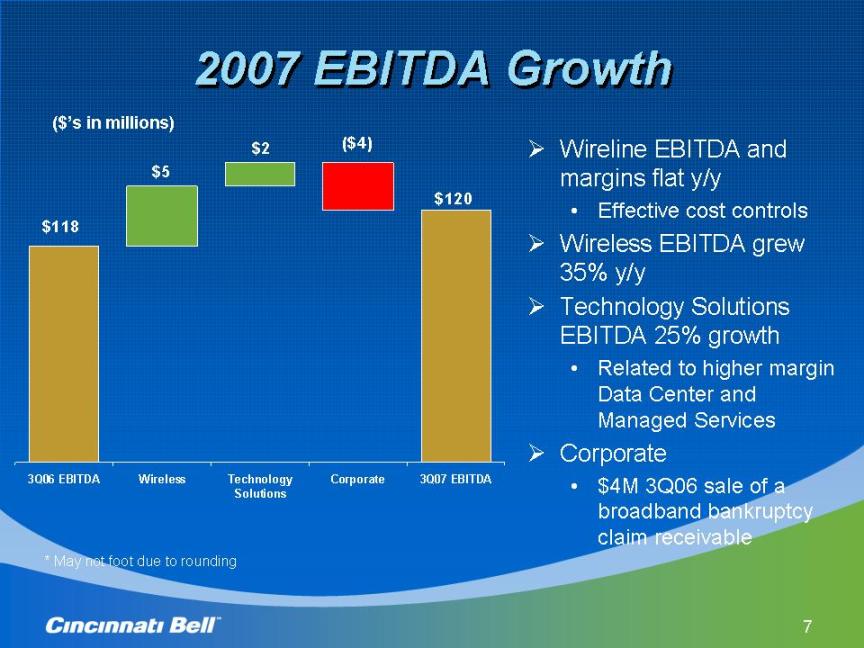
2007 EBITDA Growth Wireline EBITDA and margins flat y/y Effective cost controls Wireless EBITDA grew 35% y/y Technology Solutions EBITDA 25% growth Related to higher margin Data Center and Managed Services Corporate $4M 3Q06 sale of a broadband bankruptcy claim receivable ($’s in millions) * May not foot due to rounding
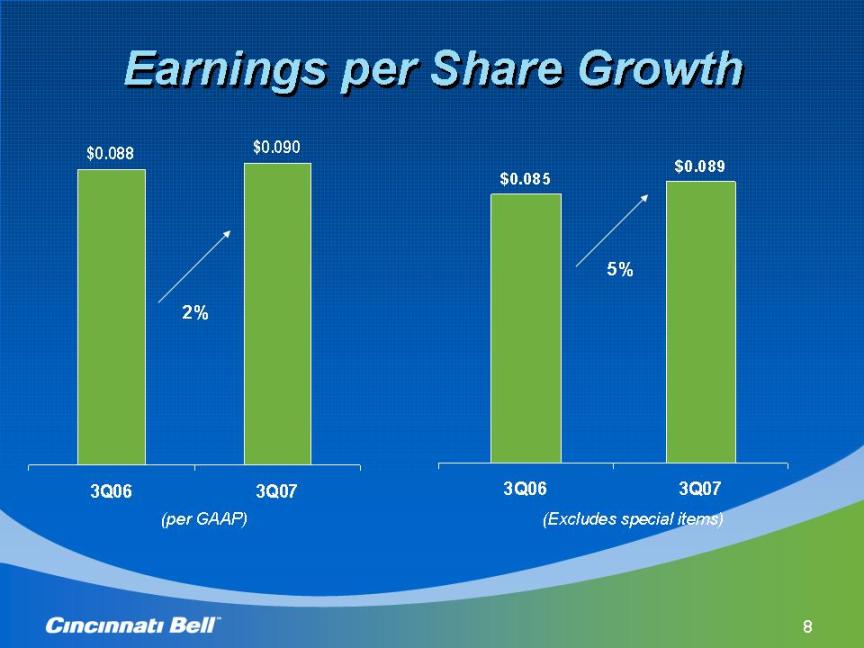
Earnings per Share Growth (Excludes special items) (per GAAP) 5% 2%
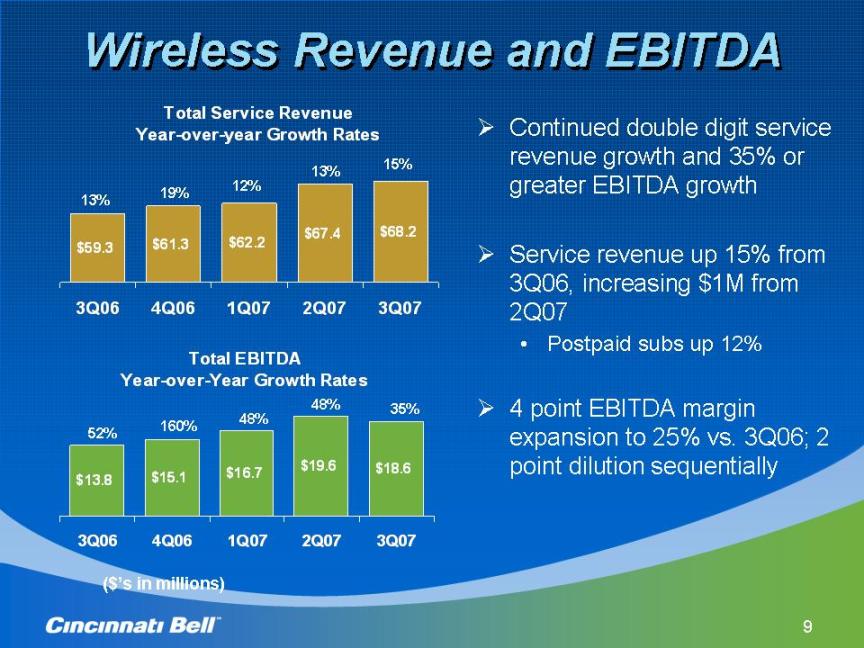
Wireless Revenue and EBITDA Continued double digit service revenue growth and 35% or greater EBITDA growth Service revenue up 15% from 3Q06, increasing $1M from 2Q07 Postpaid subs up 12% 4 point EBITDA margin expansion to 25% vs. 3Q06; 2 point dilution sequentially 13% 13% 19% 12% ($’s in millions) 15% 52% 160% 48% 49% 35%
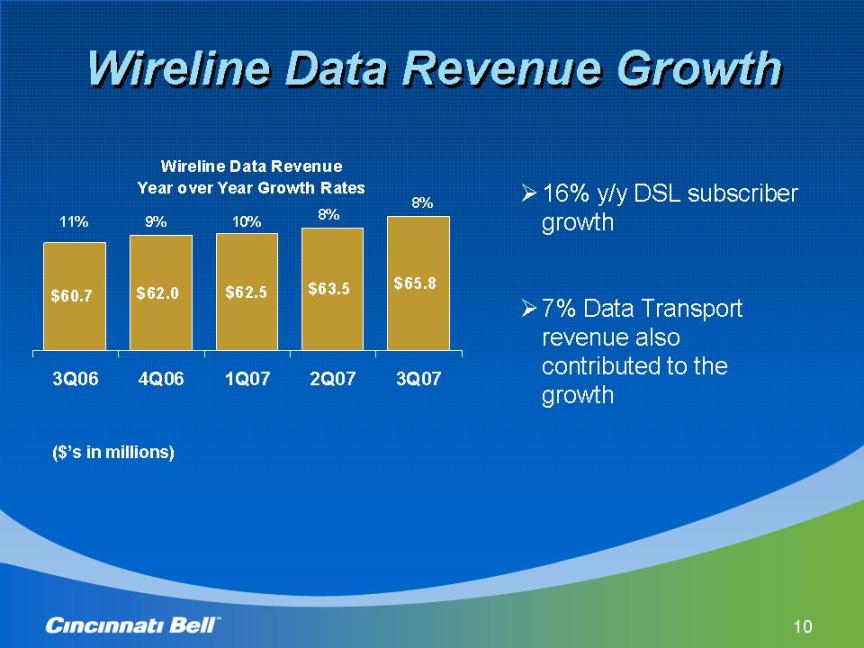
Wireline Data Revenue Growth 11% 9% 10% 8% 16% y/y DSL subscriber growth 7% Data Transport revenue also contributed to the growth ($’s in millions) 8%
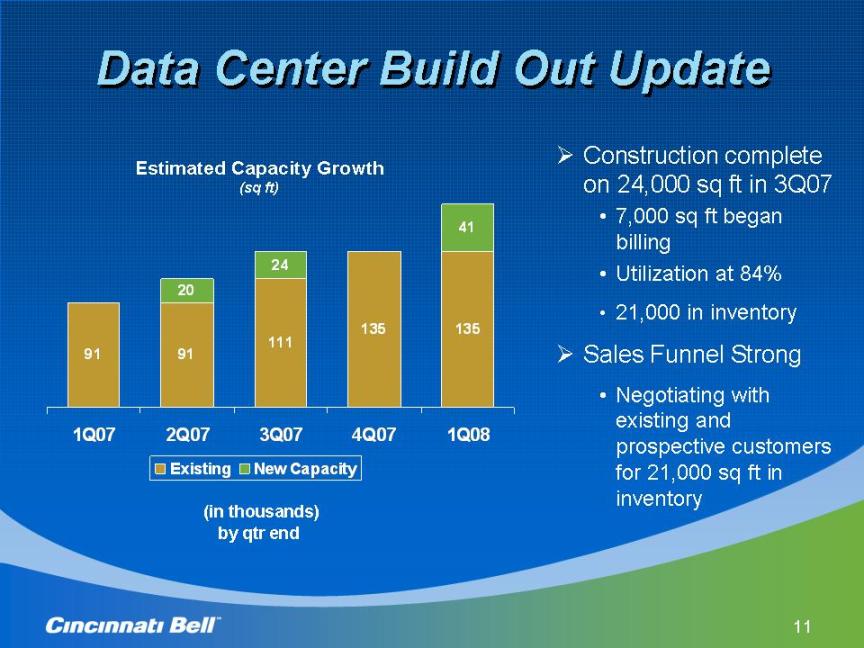
Data Center Build Out Update Estimated Capacity Growth (sq ft) (in thousands) by qtr end Construction complete on 24,000 sq ft in 3Q07 7,000 sq ft began billing Utilization at 84% 21,000 in inventory Sales Funnel Strong Negotiating with existing and prospective customers for 21,000 sq ft in inventory 25,000 square feet Kroger commitment
3Q07 Revenue by Market. Increasing business % of total (before intercompany eliminations) Consumer 41% Business 59% Body: Revenue growth from business customers 59% in 3Q07 Up 3pts from 3Q06 Business y/y revenue growth of 13% 19% growth in wireless service revenue Consumer y/y revenue growth of 2%
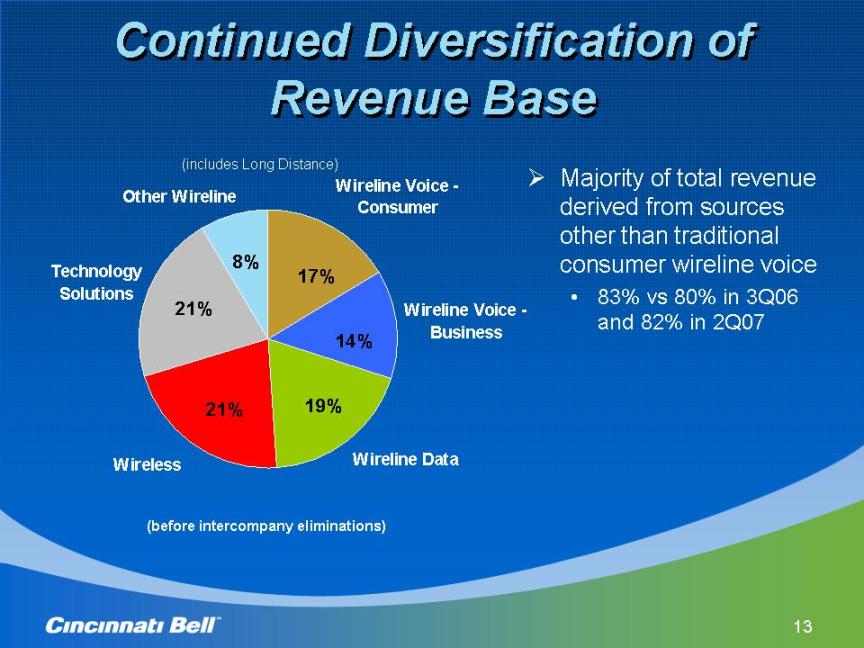
Continued Diversification of Revenue Base Majority of total revenue derived from sources other than traditional consumer wireline voice 83% vs 80% in 3Q06 and 82% in 2Q07 (before intercompany eliminations) (includes Long Distance) 17% 19% 21% 21% 8% 14%
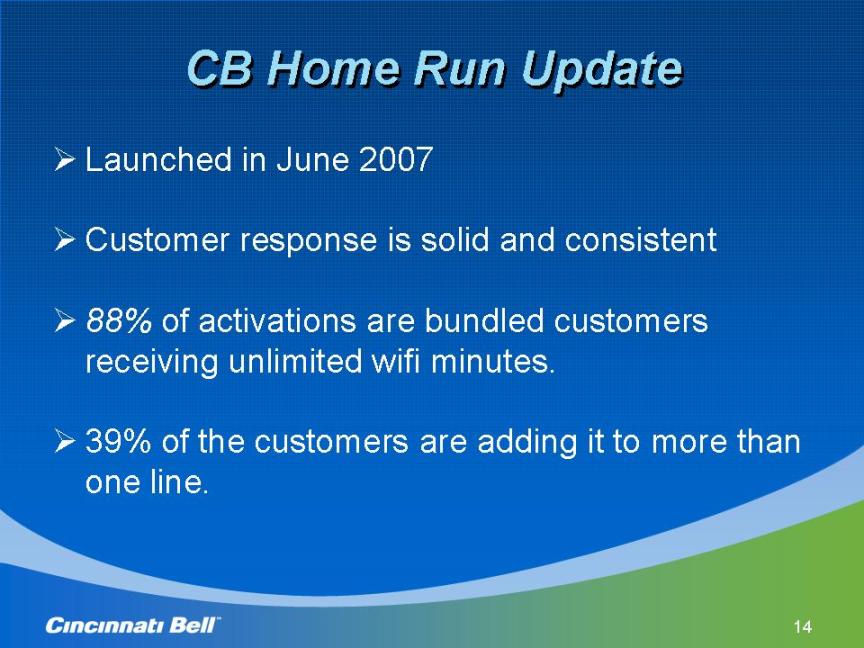
CB Home Run Update Launched in June 2007 Customer response is solid and consistent 88% of activations are bundled customers receiving unlimited wifi minutes. 39% of the customers are adding it to more than one line.
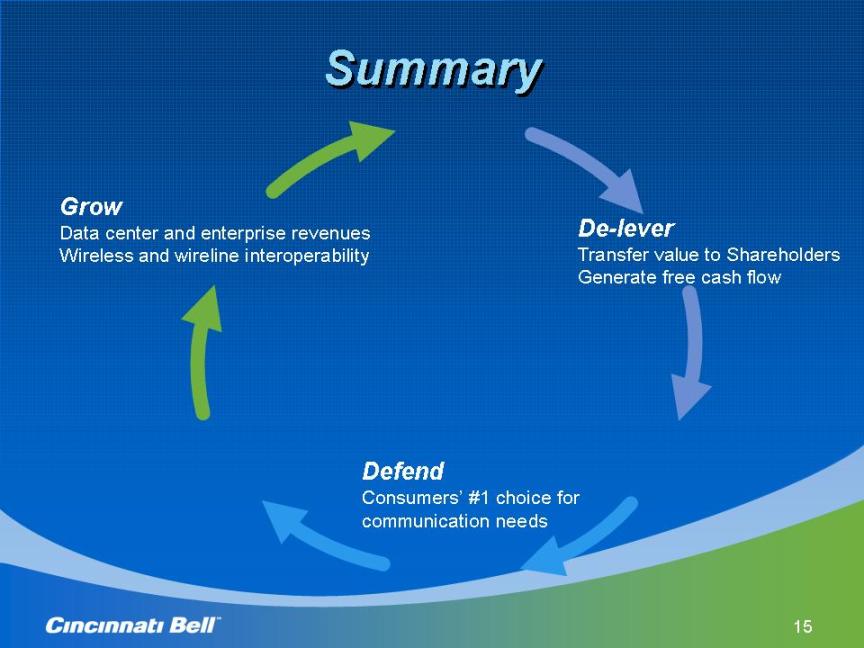
Summary Grow Data center and enterprise revenues Wireless and wireline interoperability De-lever Transfer value to Shareholders Generate free cash flow Defend Consumers’ #1 choice for communication needs
Operational & Financial Overview Brian Ross Chief Financial Officer
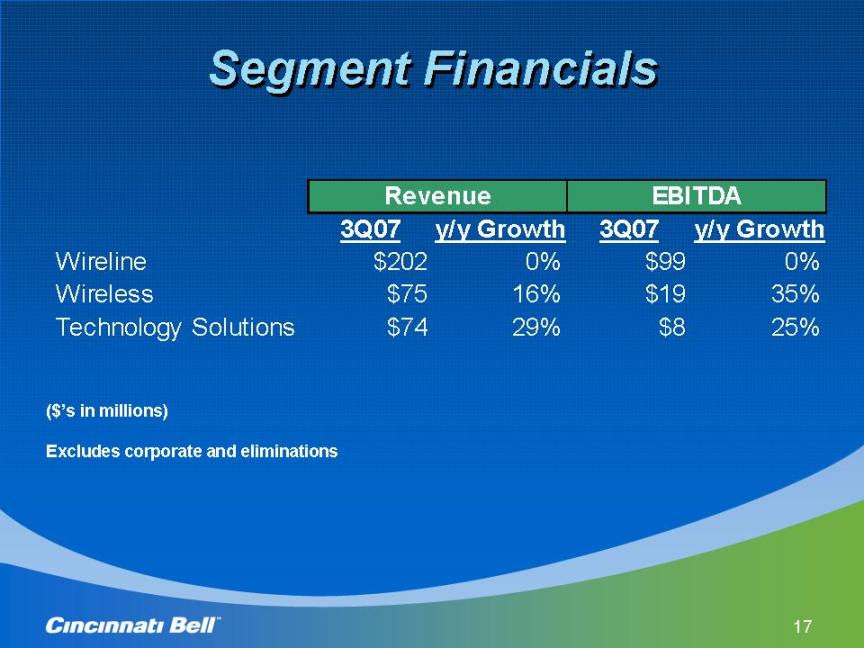
Segment Financials ($’s in millions) Excludes corporate and eliminations
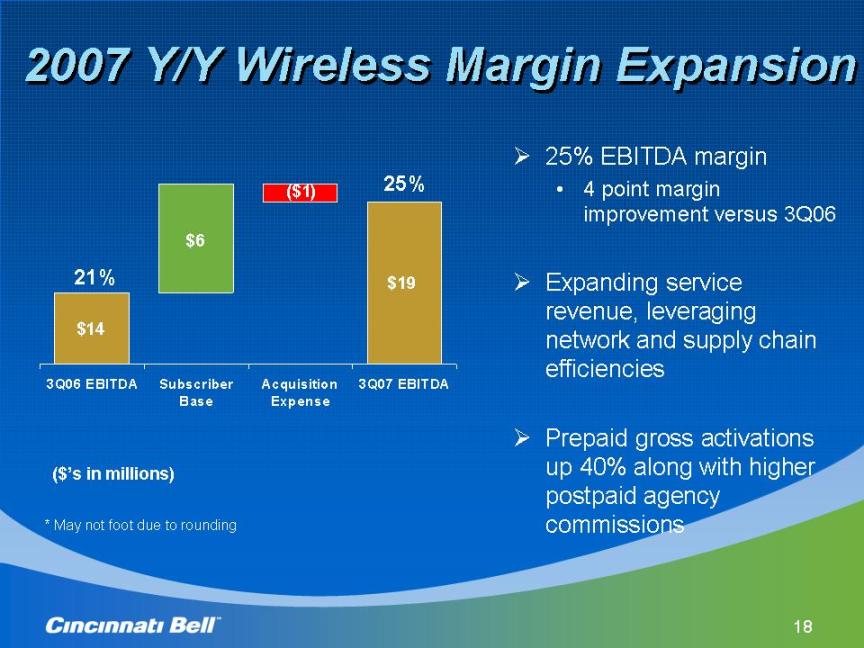
2007 Y/Y Wireless Margin Expansion 25% EBITDA margin 4 point margin improvement versus 3Q06 Expanding service revenue, leveraging network and supply chain efficiencies Prepaid gross activations up 40% along with higher postpaid agency commissions ($’s in millions) * May not foot due to rounding 25% 21%
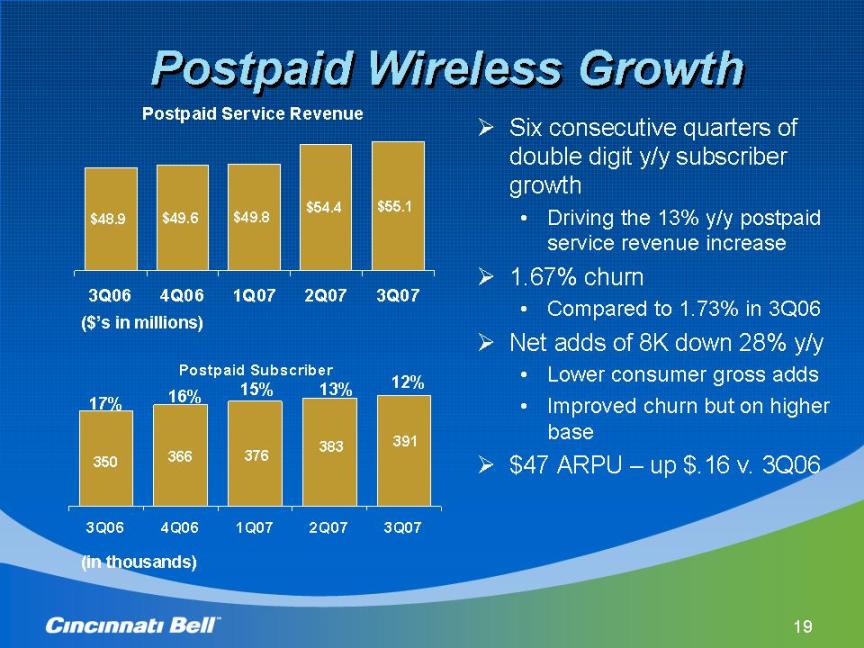
Postpaid Wireless Growth Six consecutive quarters of double digit y/y subscriber growth Driving the 13% y/y postpaid service revenue increase 1.67% churn Compared to 1.73% in 3Q06 Net adds of 8K down 28% y/y Lower consumer gross adds Improved churn but on higher base $47 ARPU – up $.16 v. 3Q06 ($’s in millions) (in thousands) 13% 17% 16% 15% 12%
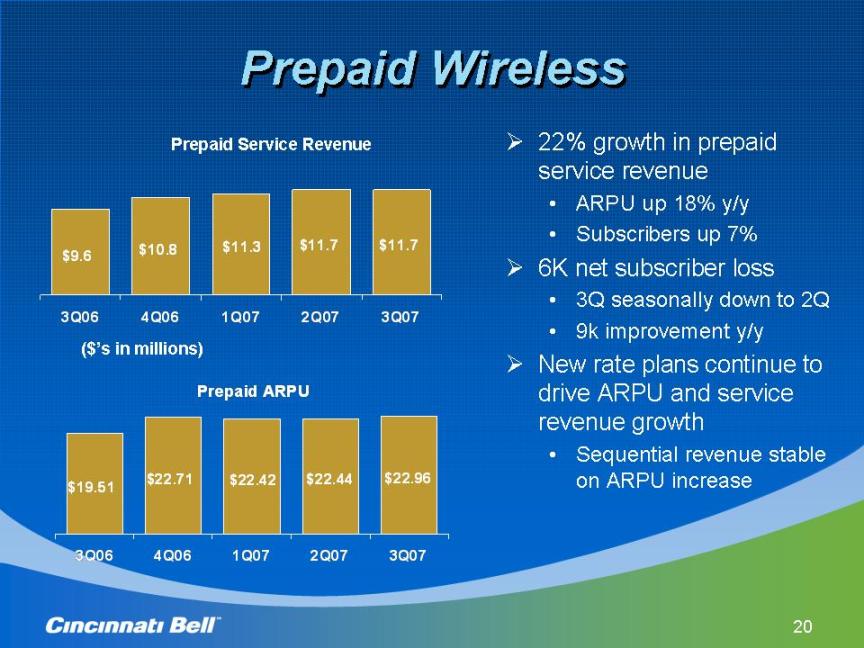
20 Prepaid Wireless Prepaid Wireless .. 22% growth in prepaid service revenue • ARPU up 18% y/y • Subscribers up 7% .. 6K net subscriber loss • 3Q seasonally down to 2Q • 9k improvement y/y .. New rate plans continue to drive ARPU and service revenue growth • Sequential revenue stable on ARPU increase Prepaid Service Revenue Prepaid ARPU $19.51 $22.71 $22.96 $22.44 $22.42 3Q06 4Q06 1Q07 2Q07 3Q07 $9.6 $10.8 $11.7 $11.7 $11.3 3Q06 4Q06 1Q07 2Q07 3Q07 ($’s in millions)
Prepaid Wireless 22% growth in prepaid service revenue ARPU up 18% y/y Subscribers up 7% 6K net add loss 3Q seasonally down to 2Q 9k improvement y/y New rate plans continue to drive ARPU and service revenue growth Sequential revenue stable on ARPU increase Prepaid Service Revenue ($’s in millions)
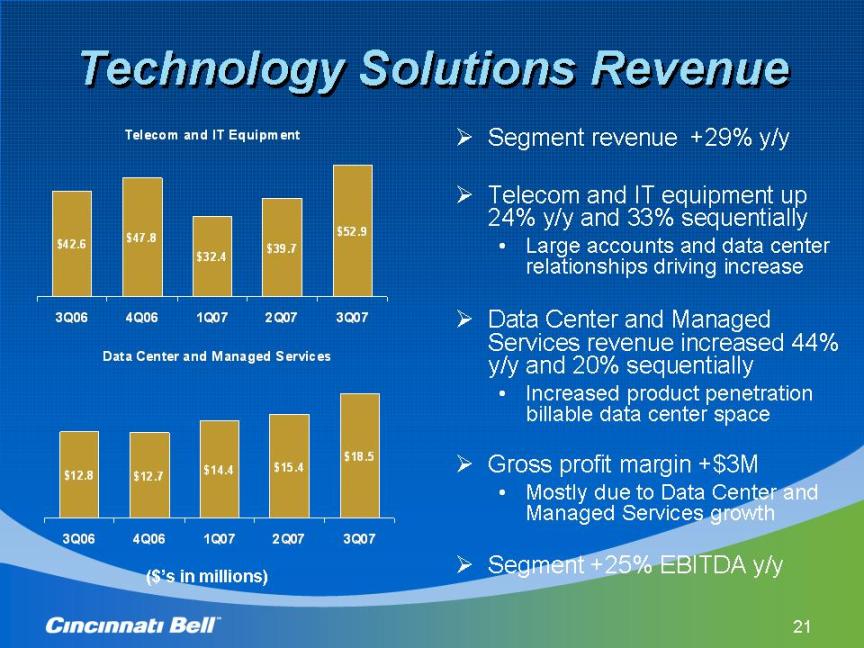
21 Technology Solutions Revenue Technology Solutions Revenue Telecom and IT Equipment $42.6 $32.4 $39.7 $52.9 $47.8 3Q06 4Q06 1Q07 2Q07 3Q07 Data Center and Managed Services $12.8 $14.4 $15.4 $18.5 $12.7 3Q06 4Q06 1Q07 2Q07 3Q07 .. Segment revenue +29% y/y .. Telecom and IT equipment up 24% y/y and 33% sequentially • Large accounts and data center relationships driving increase .. Data Center and Managed Services revenue increased 44% y/y and 20% sequentially • Increased product penetration billable data center space .. Gross profit margin +$3M • Mostly due to Data Center and Managed Services growth .. Segment +25% EBITDA y/y ($’s in millions)
Technology Solutions Revenue Segment revenue +29% y/y Telecom and IT equipment up 24% y/y and 33% sequentially Large accounts and data center relationships driving increase Data Center and Managed Services revenue increased 44% y/y and 20% sequentially Increased product penetration billable data center space Gross profit margin +$3M Segment +25% EBITDA y/y ($’s in millions)
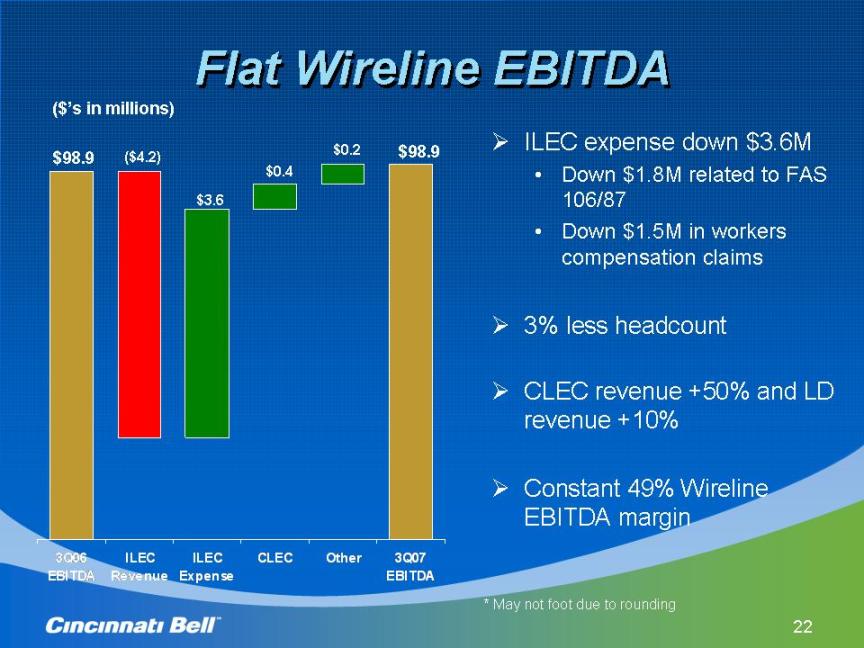
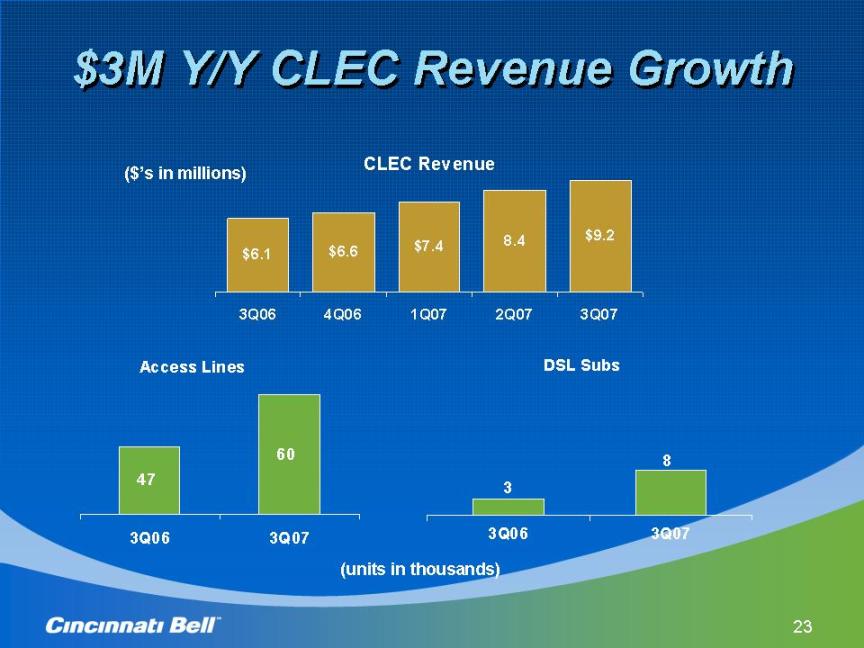
22 Flat Wireline EBITDA Flat Wireline EBITDA 3Q06 EBITDA ILEC Revenue ILEC Expense CLEC Other 3Q07 EBITDA .. ILEC expense down $3.6M • Down $1.8M related to FAS 106/87 • Down $1.5M in workers compensation claims .. 3% less headcount .. CLEC revenue +50% and LD revenue +10% .. Constant 49% Wireline EBITDA margin $98.9 ($’s in millions) ($4.2) $3.6 $0.4 $0.2 $98.9 * May not foot due to roundingFlat Wireline EBITDA ILEC expense down $3.6M Down $1.8M related to FAS 106/87 Down $1.5M in workers compensation claims 3% less headcount CLEC revenue +50% and LD revenue +10% Constant 49% Wireline EBITDA margin $98.9 ($’s in millions) ($4.2) $3.6 $.4 $.2 $98.9 * May not foot due to rounding
$3M Y/Y CLEC Revenue Growth ($’s in millions) (units in thousands)
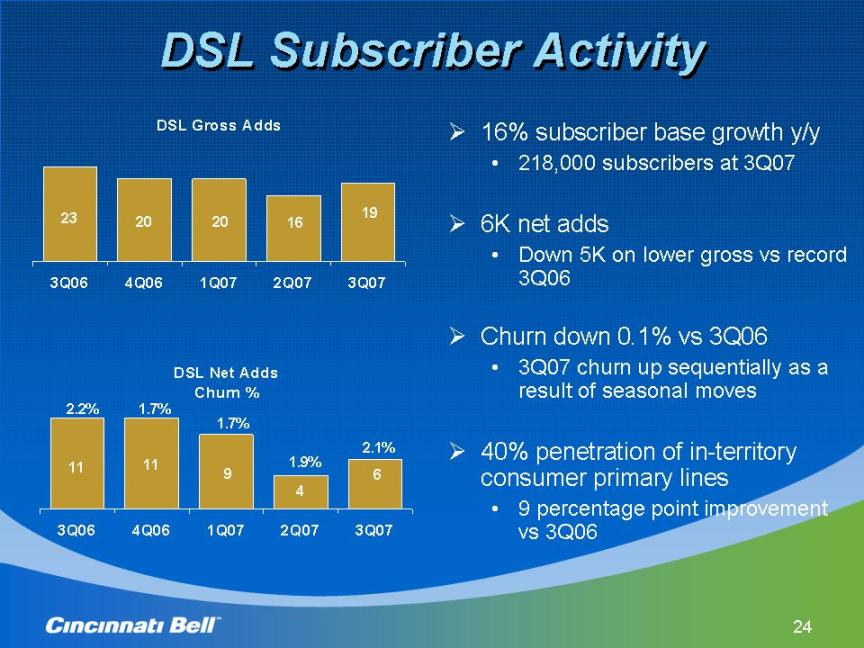
DSL Subscriber Activity 16% subscriber base growth y/y 218,000 subscribers at 3Q07 6K net adds Down 5K on lower gross vs record 3Q06 Churn down 0.1% vs 3Q06 3Q07 churn up sequentially as a result of seasonal moves 40% penetration of in-territory consumer primary lines 9 percentage point improvement vs 3Q06 2.2% 1.7% 1.7% 1.9% 2.1%
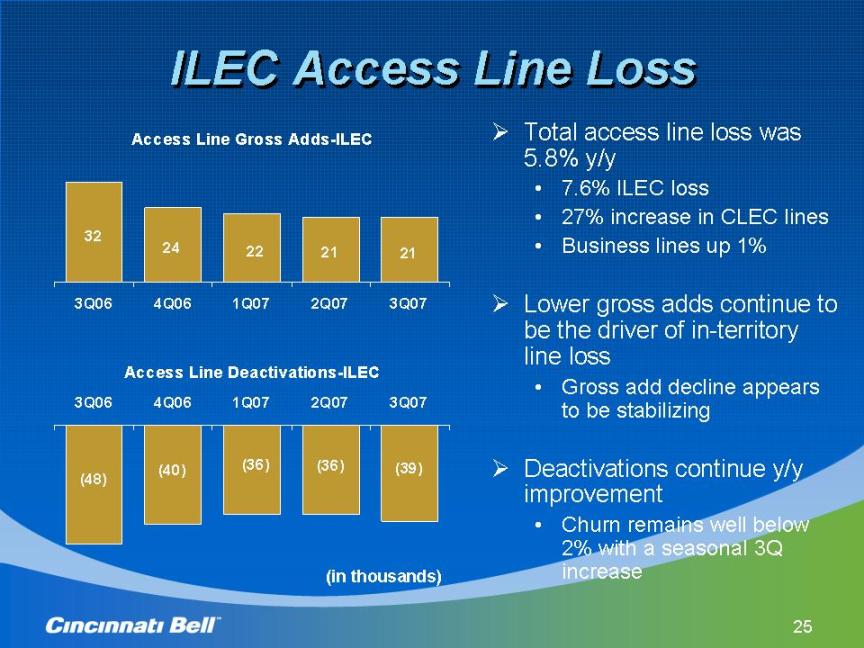
ILEC Access Line Loss Total access line loss was 5.8% y/y 7.6% ILEC loss 27% increase in CLEC lines Business lines up 1% Lower gross adds continue to be the driver of in-territory line loss Gross add decline appears to be stabilizing Deactivations continue y/y improvement Churn remains well below 2% with a seasonal 3Q increase (in thousands)
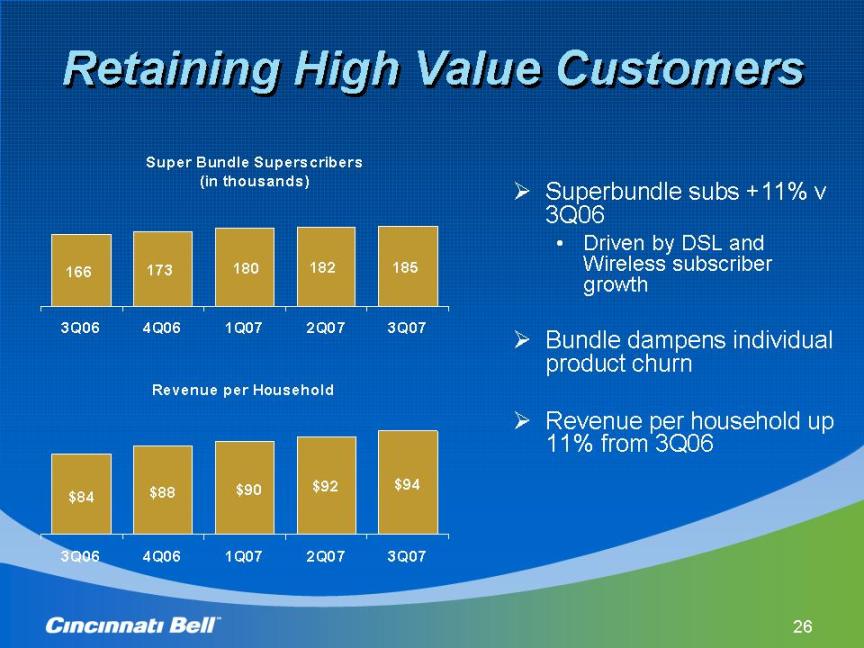
Retaining High Value Customers Superbundle subs +11% v 3Q06 Driven by DSL and Wireless subscriber growth Bundle dampens individual product churn Revenue per household up 11% from 3Q06
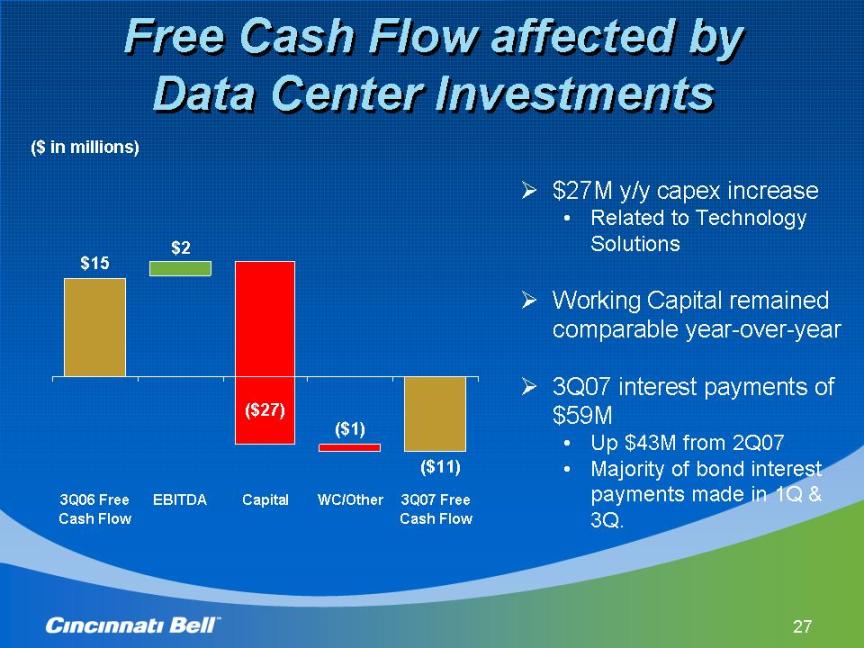
Free Cash Flow affected by Data Center Investments ($ in millions) $27M y/y capex increase Related to Technology Solutions Working Capital remained comparable year-over-year 3Q07 interest payments of $59M Up $43M from 2Q07 Majority of bond interest payments made in 1Q & 3Q.
Capital Expenditures Combined Wireline and Wireless spending comparable to 3Q06 Technology Solutions up $27M Data Center investment ($ in millions) * May not foot due to rounding
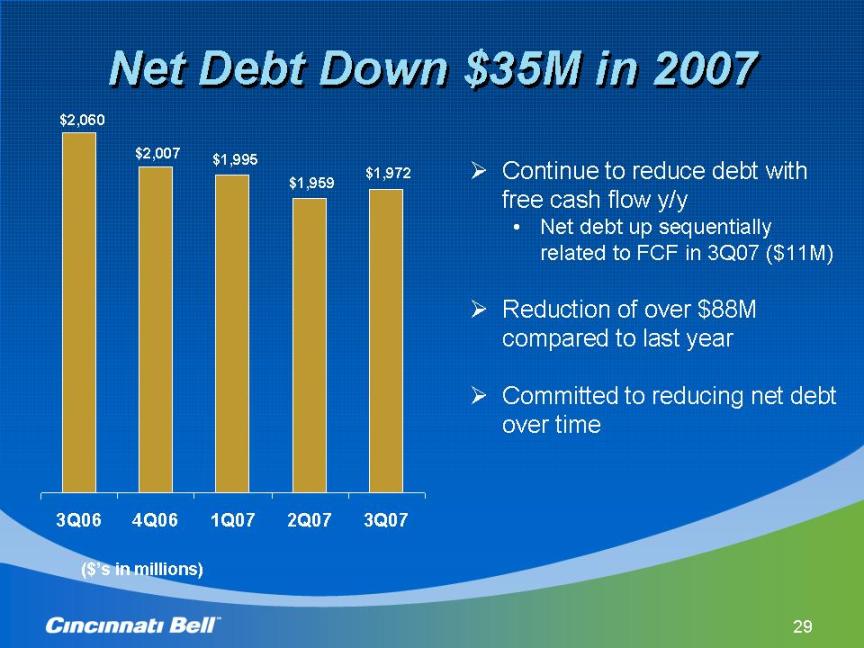
Net Debt Down $35M in 2007 Continue to reduce debt with free cash flow y/y Net debt up sequentially related to FCF in 3Q07 ($11M) Reduction of over $88M compared to last year Committed to reducing net debt over time ($’s in millions)
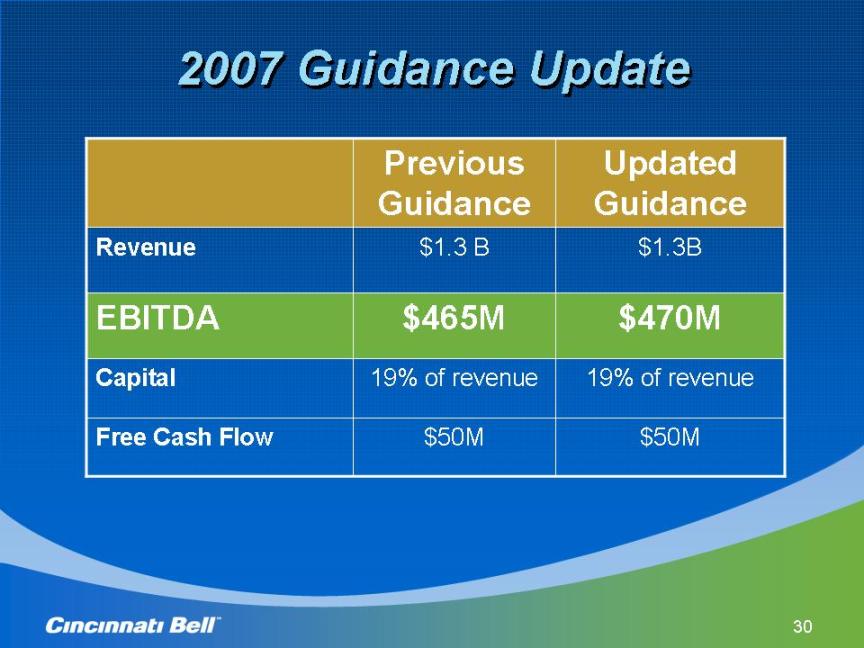
2007 Guidance Update previous guidance updated guidance revenue edbita capital free cash flow $1.3 B $1.3B $465M $470M 19% of revenue 19% of revenue $50M $50M
Non-GAAP Reconciliations (please refer to the Earnings Financials)