Exhibit 99.2
1 Cincinnati Bell 2nd Quarter 2008 Review July 31, 2008
2 Agenda Performance Highlights Jack Cassidy, President & CEO 2. Operational & Financial Overview Brian Ross, Chief Operating Officer 3. Q & A

3 Safe Harbor Certain of the statements and predictions contained in this presentation constitute forward-looking statements within the meaning of the Private Securities Litigation Reform Act. In particular, any statements, projections or estimates that include or reference the words “believes,” “anticipates,” “plans,” “intends,” “expects,” “will,” or any similar expression fall within the safe harbor for forward-looking statements contained in the Reform Act. Actual results or outcomes may differ materially from those indicated or suggested by any such forward-looking statement for a variety of reasons, including but not limited to, Cincinnati Bell’s ability to maintain its market position in communications services, including wireless, wireline and internet services; general economic trends affecting the purchase or supply of communication services; world and national events that may affect the ability to provide services; changes in the regulatory environment; any rulings, orders or decrees that may be issued by any court or arbitrator; restrictions imposed under various credit facilities and debt instruments; work stoppages caused by labor disputes; adjustments resulting from year-end audit procedures; and Cincinnati Bell’s ability to develop and launch new products and services. More information on potential risks and uncertainties is available in recent filings with the Securities and Exchange Commission, including Cincinnati Bell’s Form 10-K report, Form 10-Q reports and Forms 8-K. The forward-looking statements included in this presentation represent estimates as of the date on the first slide. It is anticipated that subsequent events and developments will cause estimates to change.
4 Performance Highlights Jack Cassidy President & CEO
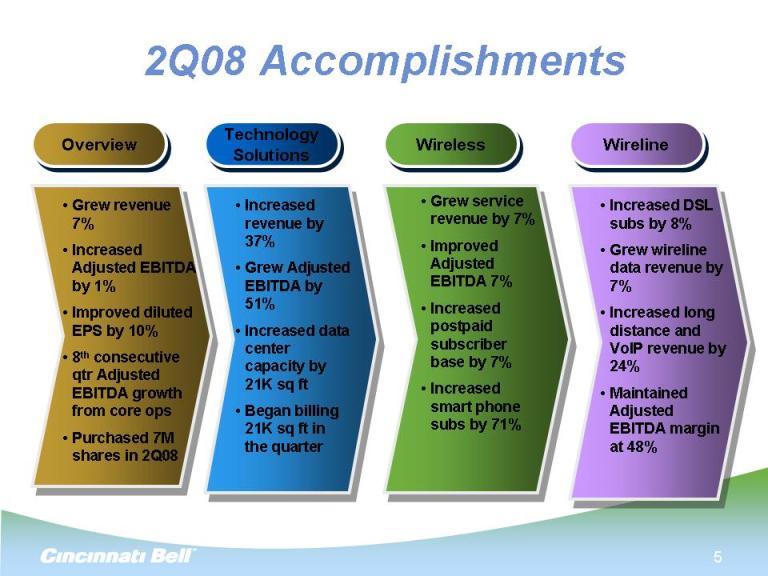
2Q08 Accomplishments Overview Technology Solutions Wireless Wireline Grew revenue 7% Increased Adjusted EBITDA by 1% Improved diluted EPS by 10% 8th consecutive qtr Adjusted EBITDA growth from core ops Purchased 7M shares in 2Q08 Grew service revenue by 7% Improved Adjusted EBITDA 7% Increased postpaid subscriber base by 7% Increased smart phone subs by 71% Increased DSL subs by 8% Grew wireline data revenue by 7% Increased long distance and VoIP revenue by 24% Maintained Adjusted EBITDA margin at 48% Increased revenue by 37% Grew Adjusted EBITDA by 51% Increased data center capacity by 21K sq ft Began billing 21K sq ft in the quarter
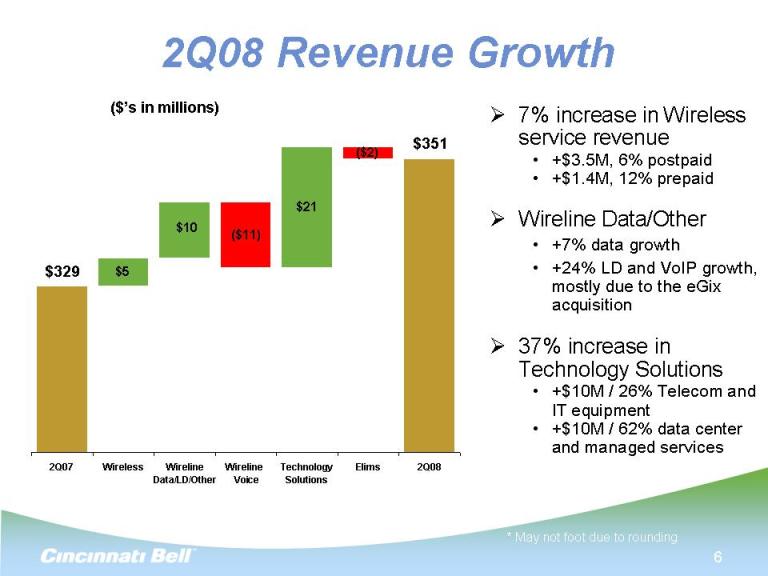
6 2Q08 Revenue Growth 7% increase in Wireless service revenue +$3.5M, 6% postpaid +$1.4M, 12% prepaid Wireline Data/Other +7% data growth +24% LD and VoIP growth, mostly due to the eGix acquisition 37% increase in Technology Solutions +$10M / 26% Telecom and IT equipment +$10M / 62% data center and managed services ($’s in millions) * May not foot due to rounding
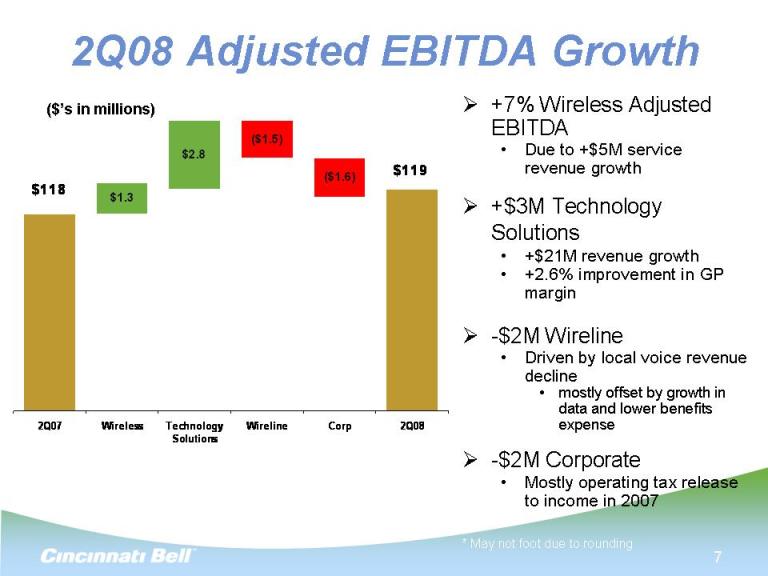
2Q08 Adjusted EBITDA Growth +7% Wireless Adjusted EBITDA Due to +$5M service revenue growth +$3M Technology Solutions +$21M revenue growth +2.6% improvement in GP margin -$2M Wireline Driven by local voice revenue decline mostly offset by growth in data and lower benefits expense -$2M Corporate Mostly operating tax release to income in 2007 ($’s in millions) * May not foot due to rounding
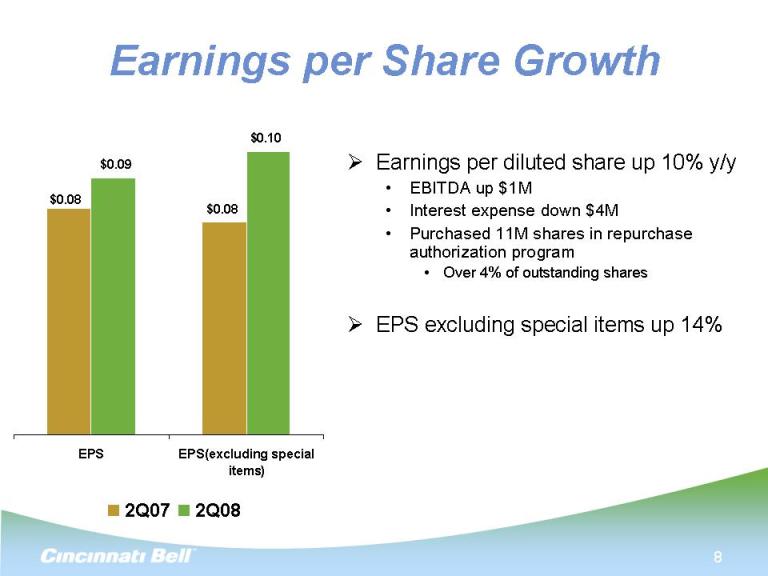
8 Earnings per Share Growth Earnings per diluted share up 10% y/y EBITDA up $1M Interest expense down $4M Purchased 11M shares in repurchase authorization program Over 4% of outstanding shares EPS excluding special items up 14%
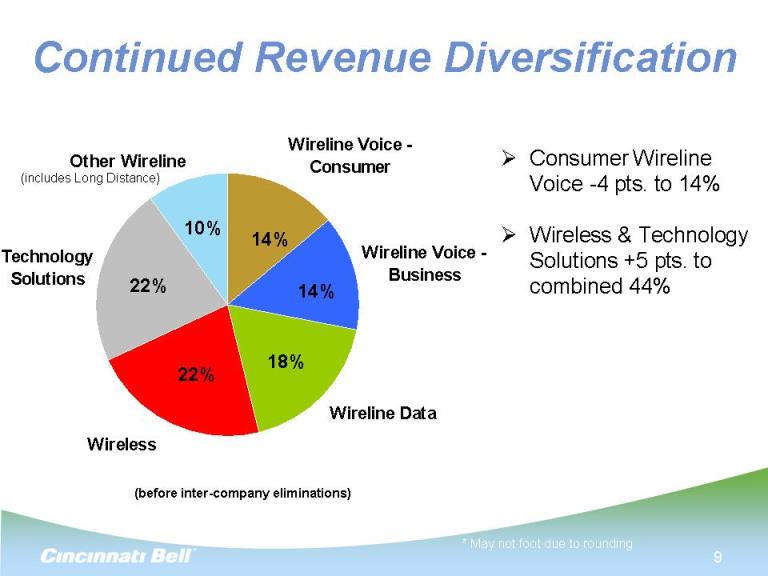
9 Continued Revenue Diversification Consumer Wireline Voice -4 pts. to 14% Wireless & Technology Solutions +5 pts. to combined 44% (before inter-company eliminations) (includes Long Distance) 14% 18% 22% 22% 10% 14% * May not foot due to rounding
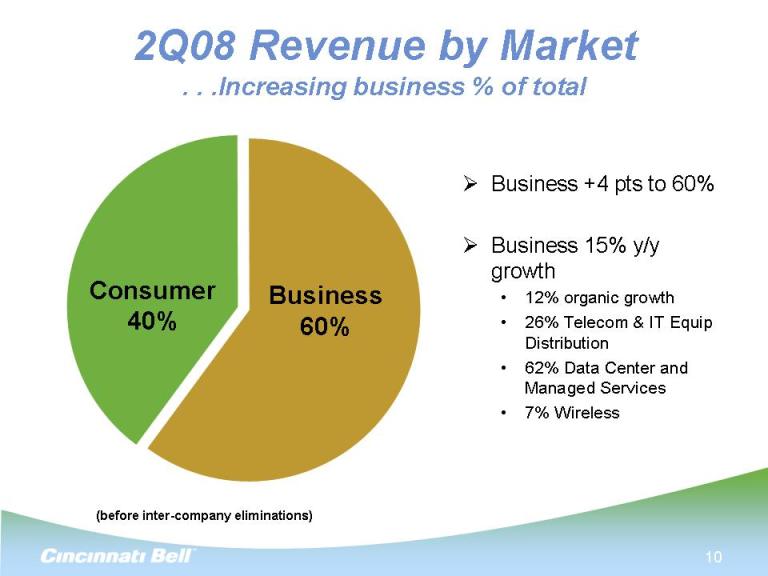
10 2Q08 Revenue by Market . . .Increasing business % of total (before inter-company eliminations) Consumer 40% Business 60% Business +4 pts to 60% Business 15% y/y growth 12% organic growth 26% Telecom & IT Equip Distribution 62% Data Center and Managed Services 7% Wireless
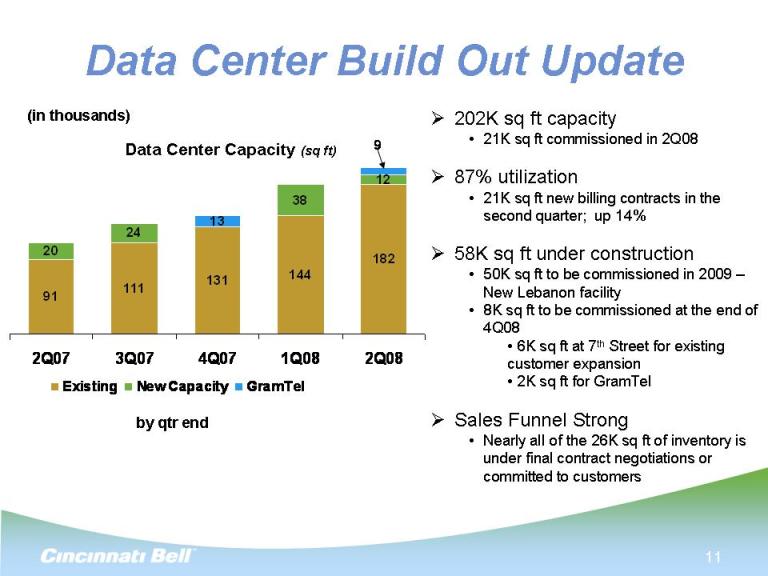
Data Center Build Out Update Data Center Capacity (sq ft) (in thousands) by qtr end 202K sq ft capacity 21K sq ft commissioned in 2Q08 87% utilization 21K sq ft new billing contracts in the second quarter; up 14% 58K sq ft under construction 50K sq ft to be commissioned in 2009 – New Lebanon facility 8K sq ft to be commissioned at the end of 4Q08 6K sq ft at 7th Street for existing customer expansion 2K sq ft for GramTel Sales Funnel Strong Nearly all of the 26K sq ft of inventory is under final contract negotiations or committed to customers (in thousands)
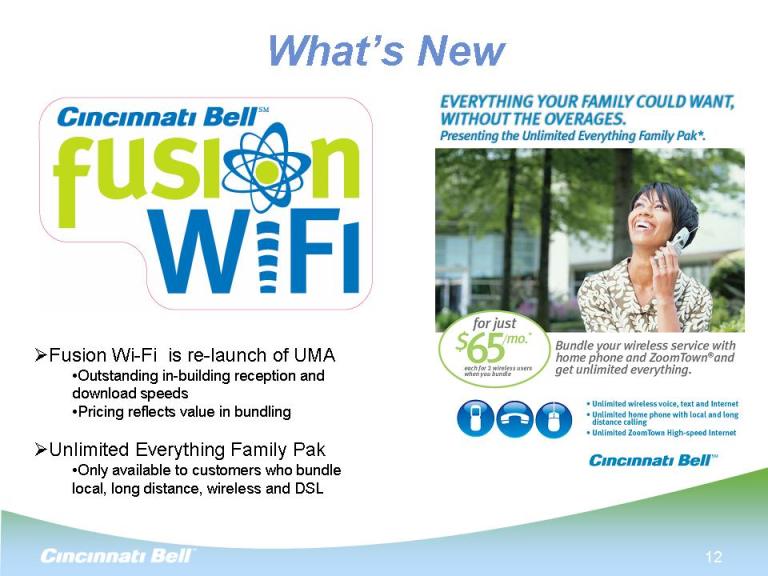
12 What’s New Fusion Wi-Fi is re-launch of UMA Outstanding in-building reception and download speeds Pricing reflects value in bundling Unlimited Everything Family Pak Only available to customers who bundle local, long distance, wireless and DSL
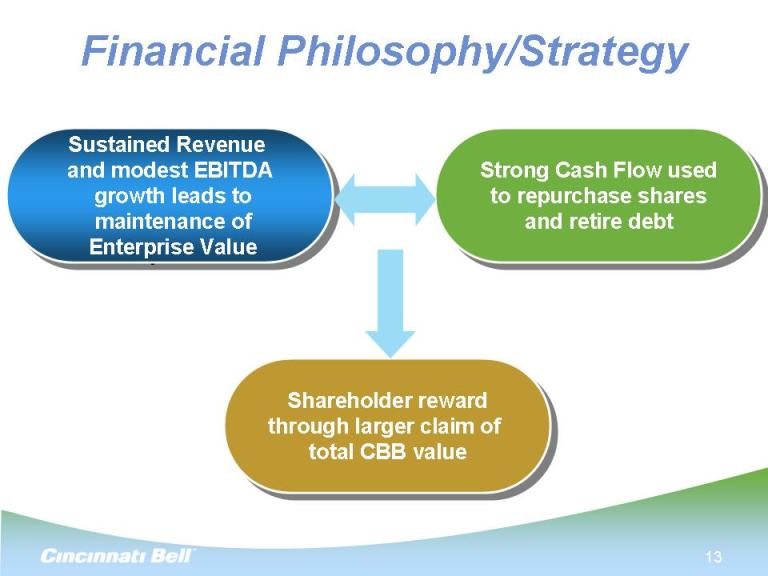
13 Financial Philosophy/Strategy Strong Cash Flow used to repurchase shares and retire debt Shareholder reward through larger claim of total CBB value Sustained Revenue and modest EBITDA growth leads to maintenance of Enterprise Value
14 Operational & Financial Overview Brian Ross Chief Operating Officer
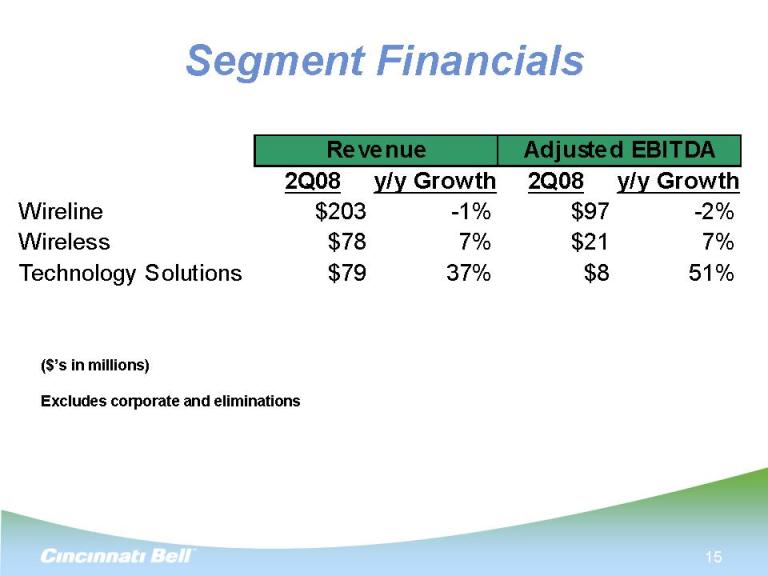
15 Segment Financials ($’s in millions) Excludes corporate and eliminations
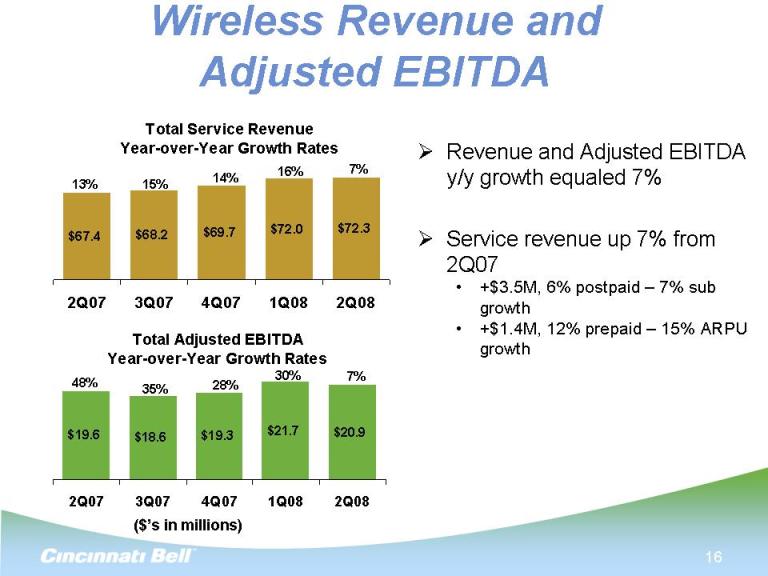
16 Wireless Revenue and Adjusted EBITDA Revenue and Adjusted EBITDA y/y growth equaled 7% Service revenue up 7% from 2Q07 +$3.5M, 6% postpaid – 7% sub growth +$1.4M, 12% prepaid – 15% ARPU growth 13% 14% ($’s in millions) 15% 28% 7% 48% 35% 16% 30% 7%
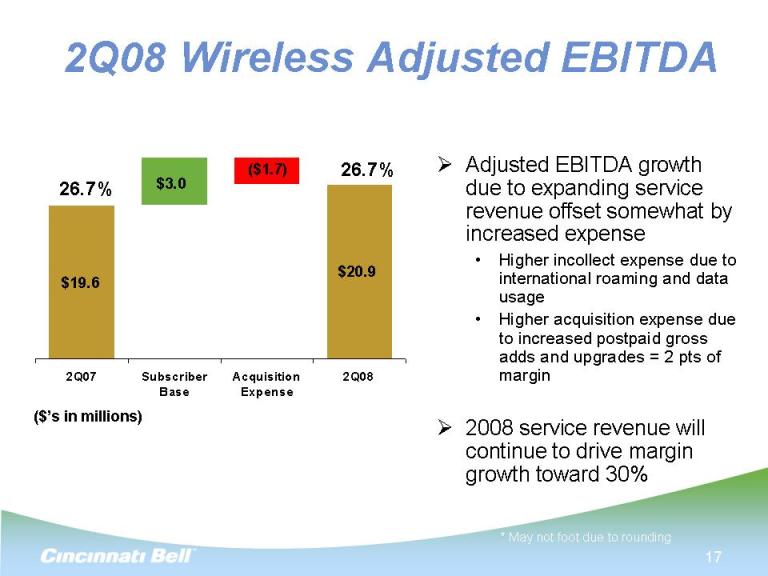
17 2Q08 Wireless Adjusted EBITDA Adjusted EBITDA growth due to expanding service revenue offset somewhat by increased expense Higher incollect expense due to international roaming and data usage Higher acquisition expense due to increased postpaid gross adds and upgrades = 2 pts of margin 2008 service revenue will continue to drive margin growth toward 30% ($’s in millions) * May not foot due to rounding 26.7% 26.7%
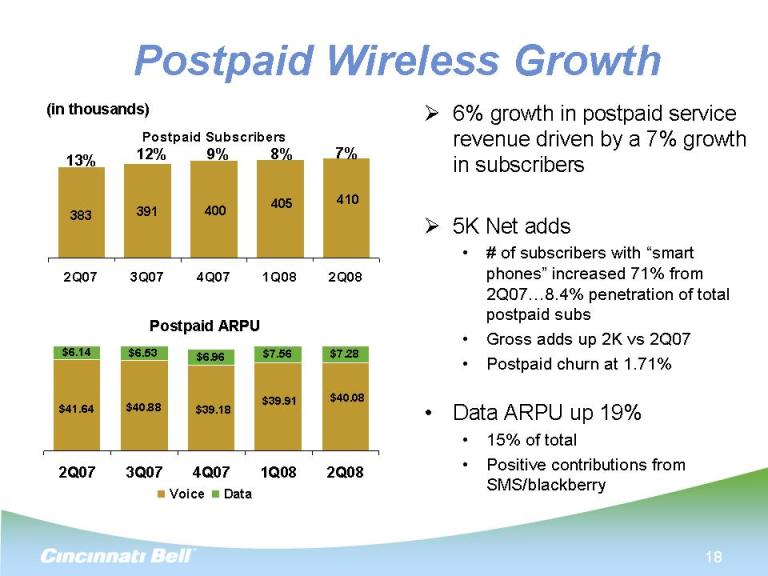
18 Postpaid Wireless Growth 6% growth in postpaid service revenue driven by a 7% growth in subscribers 5K Net adds # of subscribers with “smart phones” increased 71% from 2Q07…8.4% penetration of total postpaid subs Gross adds up 2K vs 2Q07 Postpaid churn at 1.71% Data ARPU up 19% 15% of total Positive contributions from SMS/blackberry (in thousands) 13% 9% 7% 12% 8%
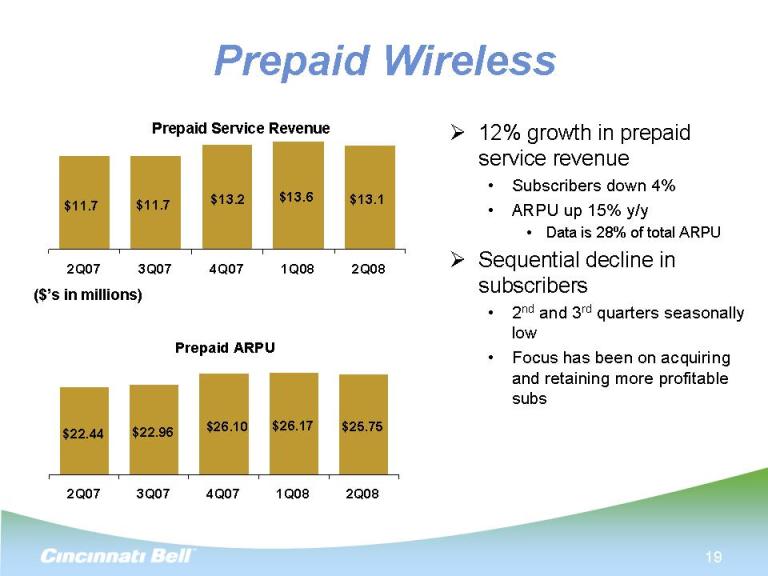
19 Prepaid Wireless 12% growth in prepaid service revenue Subscribers down 4% ARPU up 15% y/y Data is 28% of total ARPU Sequential decline in subscribers 2nd and 3rd quarters seasonally low Focus has been on acquiring and retaining more profitable subs Prepaid Service Revenue ($’s in millions)
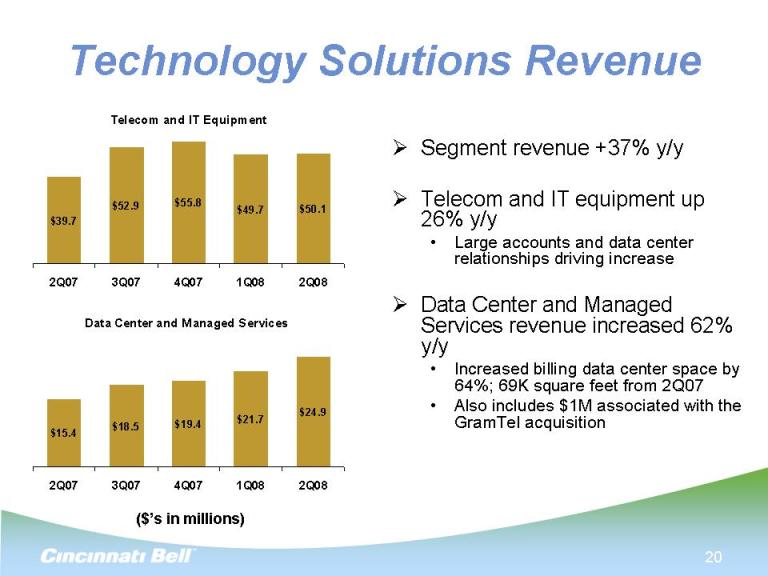
20 Technology Solutions Revenue Segment revenue +37% y/y Telecom and IT equipment up 26% y/y Large accounts and data center relationships driving increase Data Center and Managed Services revenue increased 62% y/y Increased billing data center space by 64%; 69K square feet from 2Q07 Also includes $1M associated with the GramTel acquisition ($’s in millions)
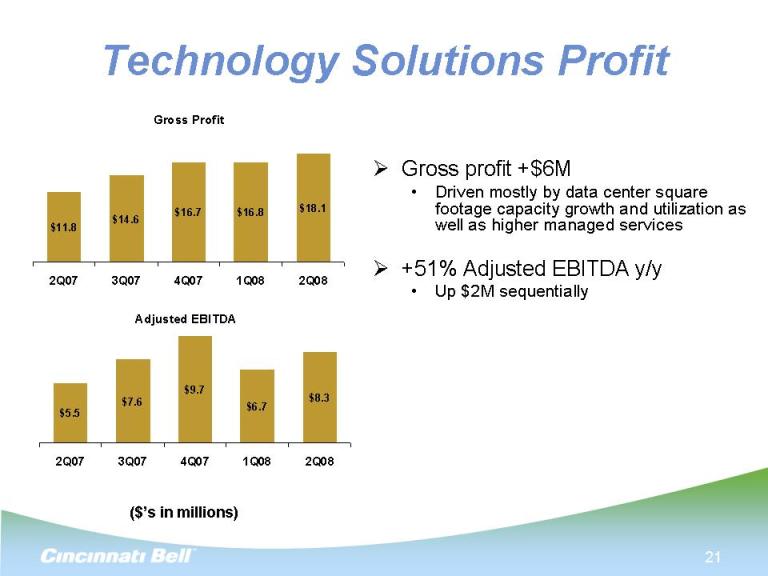
21 Technology Solutions Profit Gross profit +$6M Driven mostly by data center square footage capacity growth and utilization as well as higher managed services +51% Adjusted EBITDA y/y Up $2M sequentially ($’s in millions)
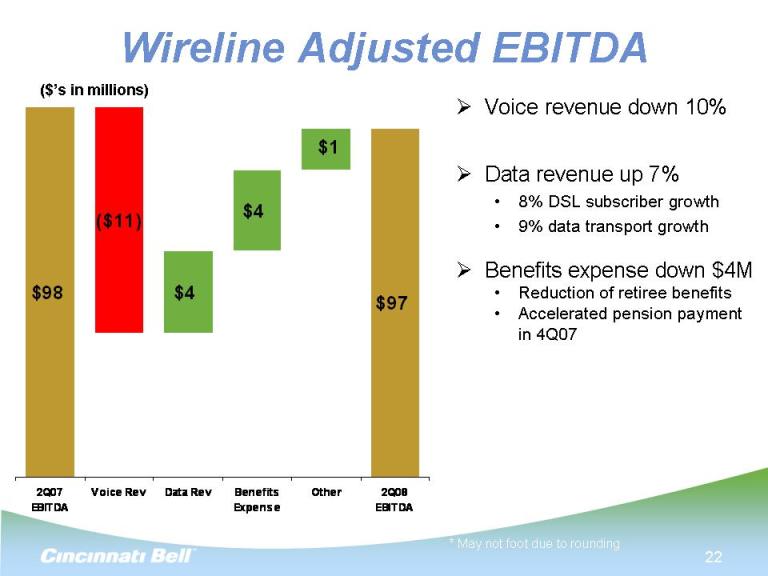
Wireline Adjusted EBITDA Voice revenue down 10% Data revenue up 7% 8% DSL subscriber growth 9% data transport growth Benefits expense down $4M Reduction of retiree benefits Accelerated pension payment in 4Q07 ($’s in millions) * May not foot due to rounding
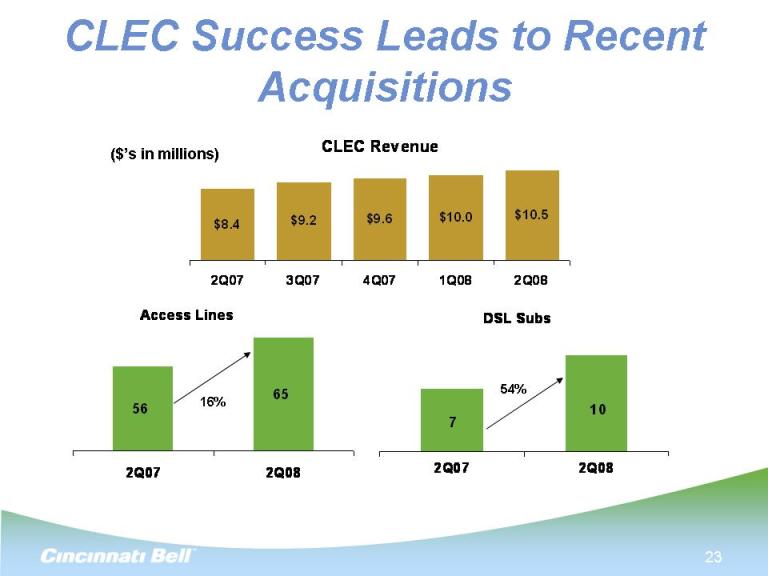
CLEC Success Leads to Recent Acquisitions ($’s in millions) (units in thousands) 54% 16%
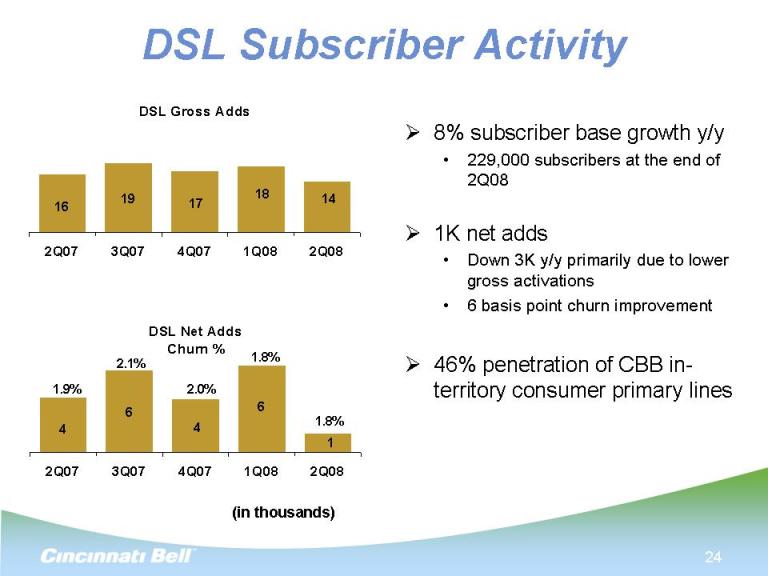
24 DSL Subscriber Activity 8% subscriber base growth y/y 229,000 subscribers at the end of 2Q08 1K net adds Down 3K y/y primarily due to lower gross activations 6 basis point churn improvement 46% penetration of CBB in-territory consumer primary lines 1.8% 1.9% 2.1% 2.0% (in thousands) 1.8%
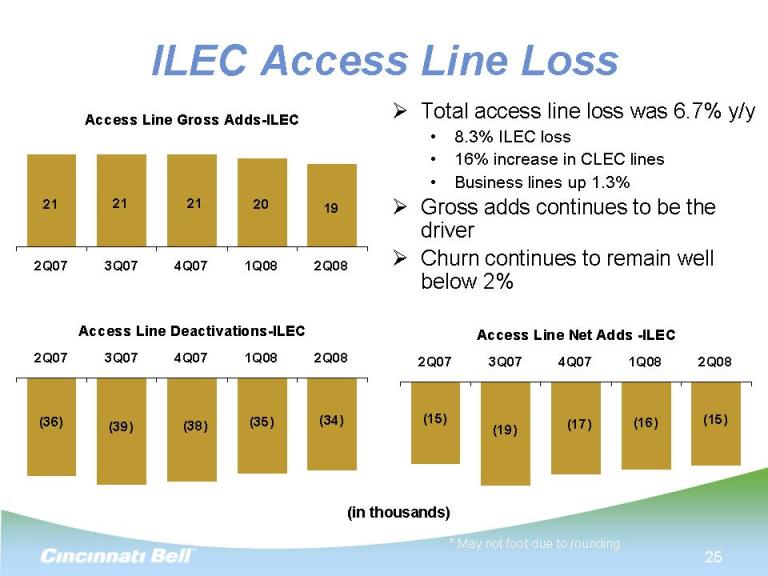
25 ILEC Access Line Loss Total access line loss was 6.7% y/y 8.3% ILEC loss 16% increase in CLEC lines Business lines up 1.3% Gross adds continues to be the driver Churn continues to remain well below 2% (in thousands) * May not foot due to rounding
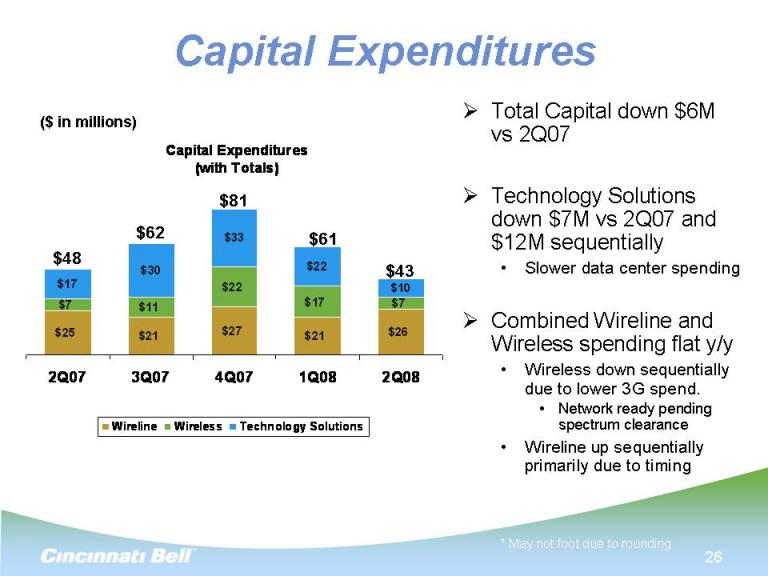
Capital Expenditures Total Capital down $6M vs 2Q07 Technology Solutions down $7M vs 2Q07 and $12M sequentially Slower data center spending Combined Wireline and Wireless spending flat y/y Wireless down sequentially due to lower 3G spend. Network ready pending spectrum clearance Wireline up sequentially primarily due to timing ($ in millions) * May not foot due to rounding $48 $62 $81 $61 $43
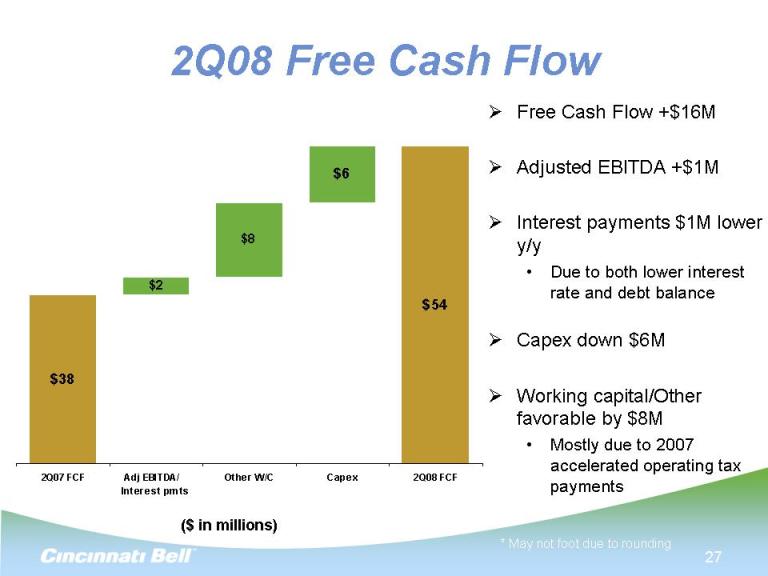
27 2Q08 Free Cash Flow ($ in millions) * May not foot due to rounding Free Cash Flow +$16M Adjusted EBITDA +$1M Interest payments $1M lower y/y Due to both lower interest rate and debt balance Capex down $6M Working capital/Other favorable by $8M Mostly due to 2007 accelerated operating tax payments
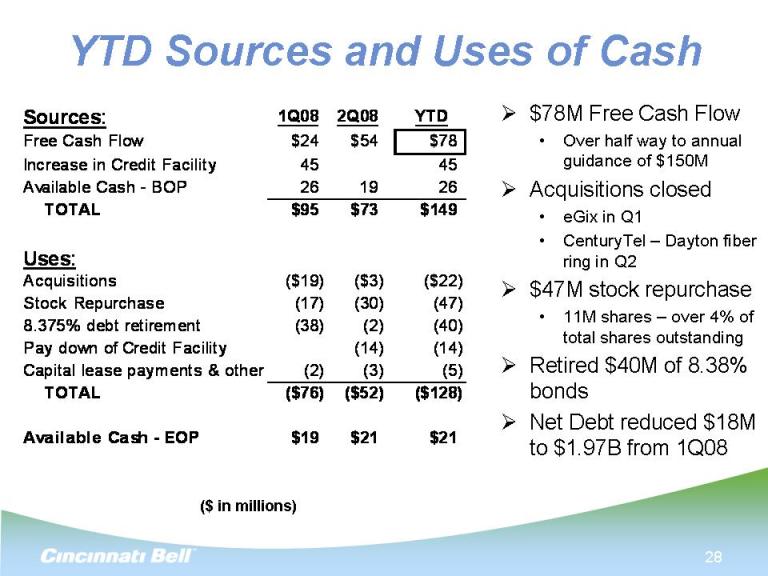
YTD Sources and Uses of Cash $78M Free Cash Flow Over half way to annual guidance of $150M Acquisitions closed eGix in Q1 CenturyTel – Dayton fiber ring in Q2 $47M stock repurchase 11M shares – over 4% of total shares outstanding Retired $40M of 8.38% bonds Net Debt reduced $18M to $1.97B from 1Q08 ($ in millions)
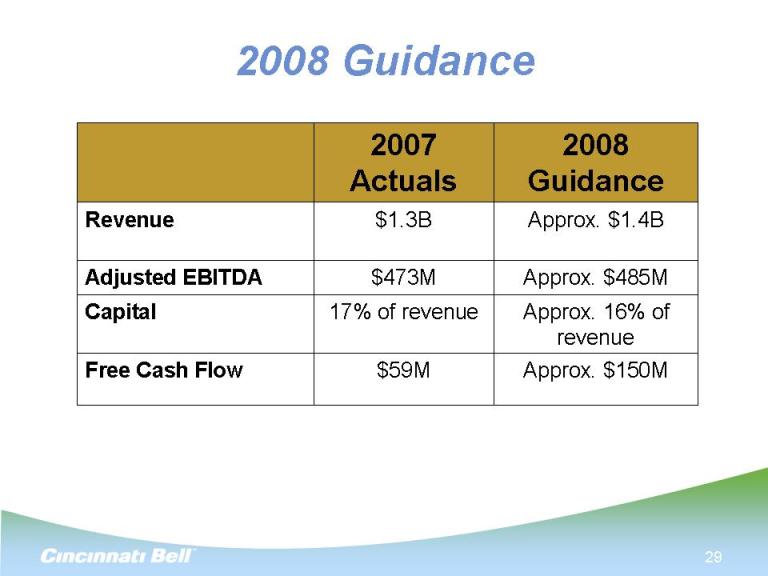
29 2008 Guidance
30 Non-GAAP Reconciliations (please refer to the Earnings Financials)