Exhibit 99.2

Cincinnati Bell 1st Quarter 2009 Review May 5, 2009
Agenda Performance Highlights Jack Cassidy, President & CEO 2. Operational Overview Brian Ross, Chief Operating Officer 4. Q & A 3. Financial Overview Gary Wojtaszek, Chief Financial Officer
Safe Harbor Certain of the statements and predictions contained in this presentation constitute forward-looking statements within the meaning of the Private Securities Litigation Reform Act. In particular, any statements, projections or estimates that include or reference the words “believes,” “anticipates,” “plans,” “intends,” “expects,” “will,” or any similar expression fall within the safe harbor for forward-looking statements contained in the Reform Act. Actual results or outcomes may differ materially from those indicated or suggested by any such forward-looking statement for a variety of reasons, including but not limited to, Cincinnati Bell’s ability to maintain its market position in communications services, including wireless, wireline and internet services; general economic trends affecting the purchase or supply of communication services; world and national events that may affect the ability to provide services; changes in the regulatory environment; any rulings, orders or decrees that may be issued by any court or arbitrator; restrictions imposed under various credit facilities and debt instruments; work stoppages caused by labor disputes; adjustments resulting from year-end audit procedures; and Cincinnati Bell’s ability to develop and launch new products and services. More information on potential risks and uncertainties is available in recent filings with the Securities and Exchange Commission, including Cincinnati Bell’s Form 10-K report, Form 10-Q reports and Form 8-K reports. The forward-looking statements included in this presentation represent estimates as of May 5, 2009. It is anticipated that subsequent events and developments will cause estimates to change.
Performance Highlights Jack Cassidy President & CEO
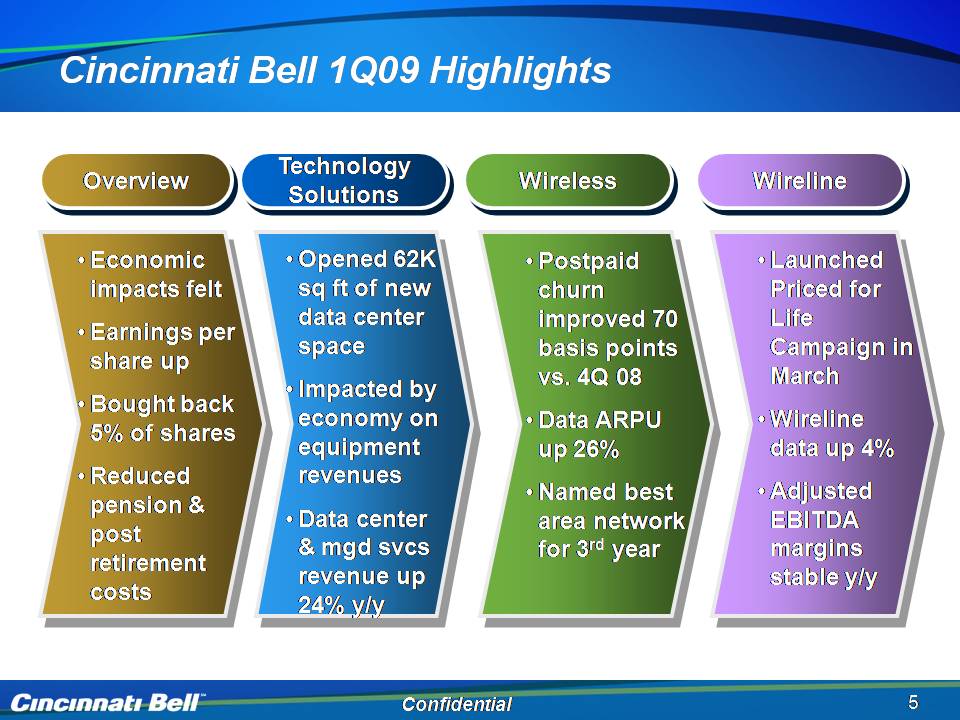
Cincinnati Bell 1Q09 Highlights Overview Technology Solutions Wireless Wireline Economic impacts felt Earnings per share up Bought back 5% of shares Reduced pension & post retirement costs Postpaid churn improved 70 basis points vs. 4Q 08 Data ARPU up 26% Named best area network for 3rd year Launched Priced for Life Campaign in March Wireline data up 4% Adjusted EBITDA margins stable y/y Opened 62K sq ft of new data center space Impacted by economy on equipment revenues Data center & mgd svcs revenue up 24% y/y
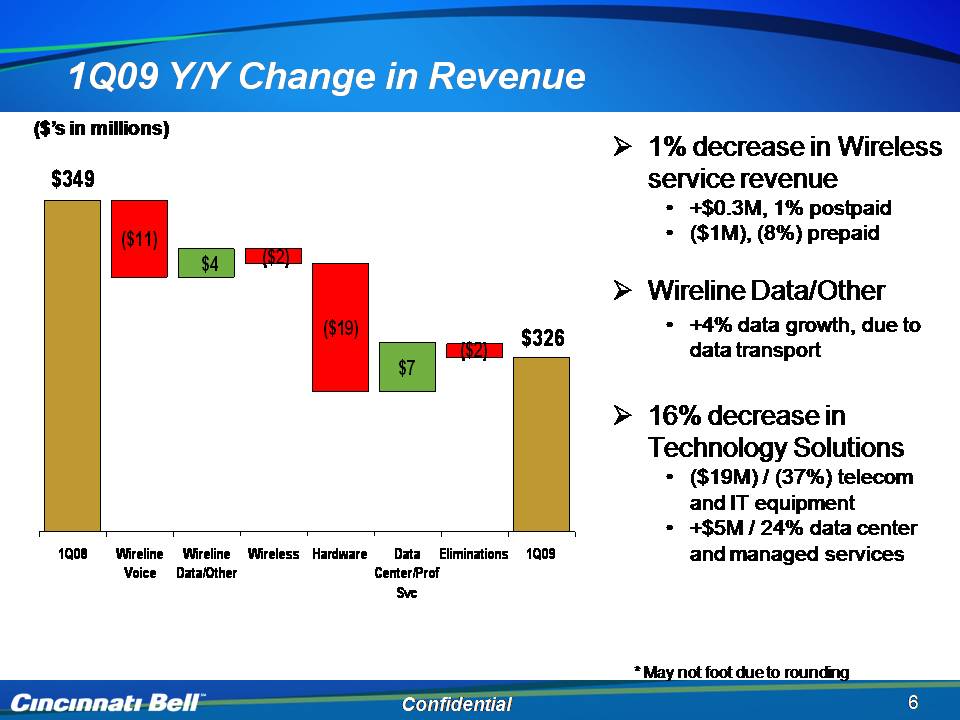
$349 1% decrease in Wireless service revenue • 0 3M ($’s in millions) $4 ($2) ($11) +$0.3M, 1% postpaid • ($1M), (8%) prepaid Wireline Data/Other $326 ($2) $7 ($19) • +4% data growth, due to data transport 16% decrease in Technology Solutions • ($19M) / (37%) telecom and IT equipment 1Q08 Wireline Voice Wireline Data/Other Wireless Hardware Data Center/Prof Svc Eliminations 1Q09 • +$5M / 24% data center and managed services Confidential 6 * May not foot due to rounding
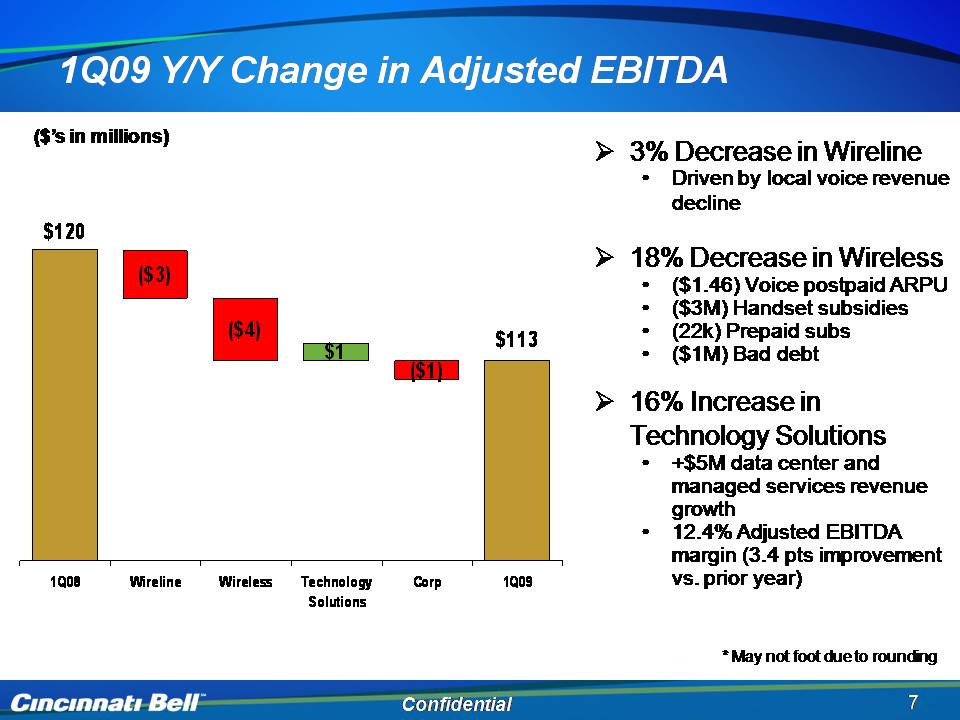
1Q09 Y/Y Change in Adjusted EBITDA 3% Decrease in Wireline • Driven by local voice revenue decline ($’s in millions) 18% Decrease in Wireless • ($1.46) Voice postpaid ARPU • ($3M) Handset $120 ($3) subsidies • (22k) Prepaid subs • ($1M) Bad debt 16% Increase in $113 ($1) ($4) $1 6% Technology Solutions • +$5M data center and managed services revenue growth • 12.4% Adjusted EBITDA margin (3.4 pts improvement vs. prior year) 1Q08 Wireline Wireless Technology Solutions Corp 1Q09 Confidential 7 * May not foot due to rounding.
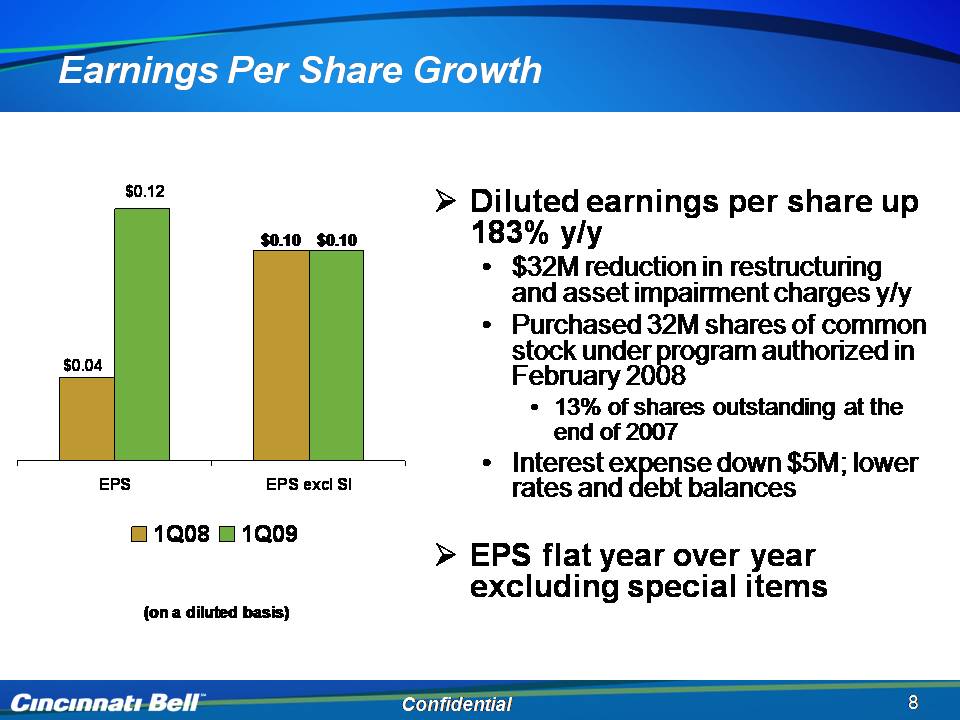
Earnings Per Share Growth Diluted earnings per share up $0.12 183% y/y • $32M reduction in restructuring and asset impairment charges y/y $0.10 $0.10 • Purchased 32M shares of common stock under program authorized in February 2008 • $0.04 13% of shares outstanding at the end of 2007 • Interest expense down $5M; lower rates and debt balances EPS EPS excl SI EPS flat year over year excluding special items 1Q08 1Q09 (basis) Confidential 8 on a diluted 8
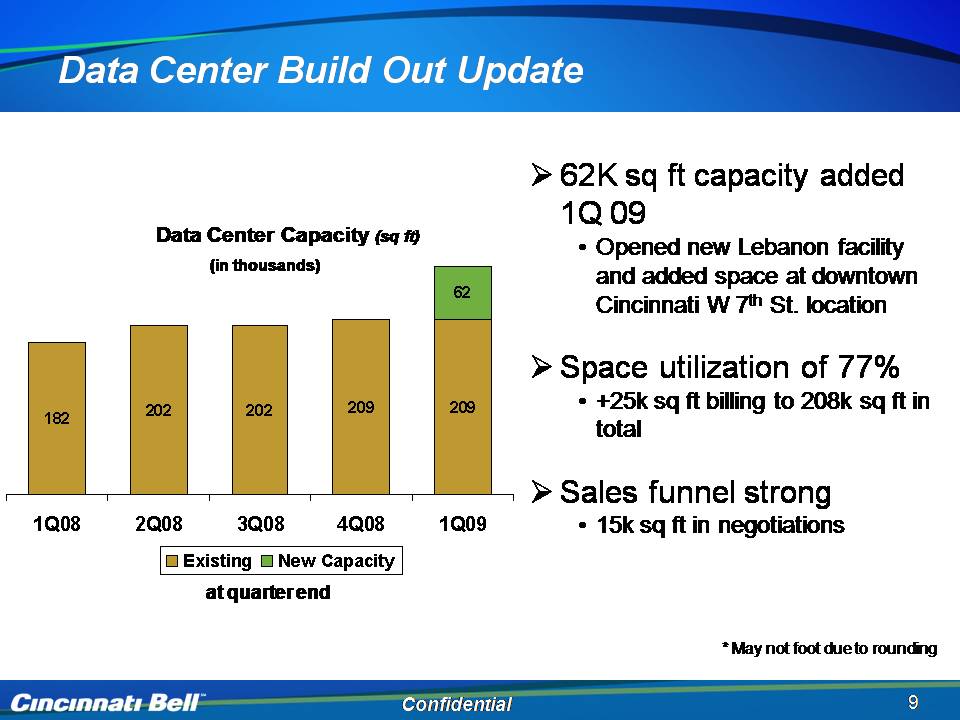
Other Placeholder: Confidential Other Placeholder: 9 Title: Data Center Build Out Update Data Center Capacity (sq ft) at quarter end 62K sq ft capacity added 1Q 09 Opened new Lebanon facility and added space at downtown Cincinnati W 7th St. location Space utilization of 77% +25k sq ft billing to 208k sq ft in total Sales funnel strong 15k sq ft in negotiations (in thousands) * May not foot due to rounding 1Q08 2Q08 3Q08 4Q08 1Q09 Existing 182 202 202 209 209 New Capacity 62
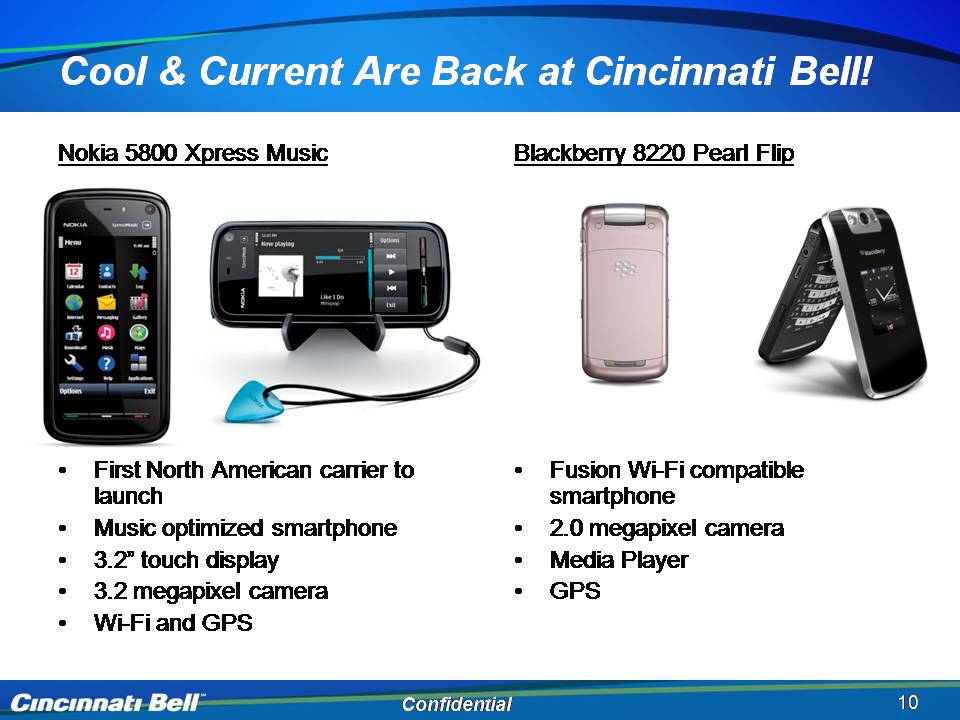
Cool & Current Are Back at Cincinnati Bell! Nokia 5800 Xpress Music Blackberry 8220 Pearl Flip • First North American carrier to launch • Fusion Wi-Fi compatible smartphone • Music optimized smartphone • 3.2” touch display • 3.2 megapixel camera Wi Fi d • 2.0 megapixel camera • Media Player • GPS Confidential 10 • Wi-and GPS 10
Operational Overview Brian Ross Chief Operating Officer
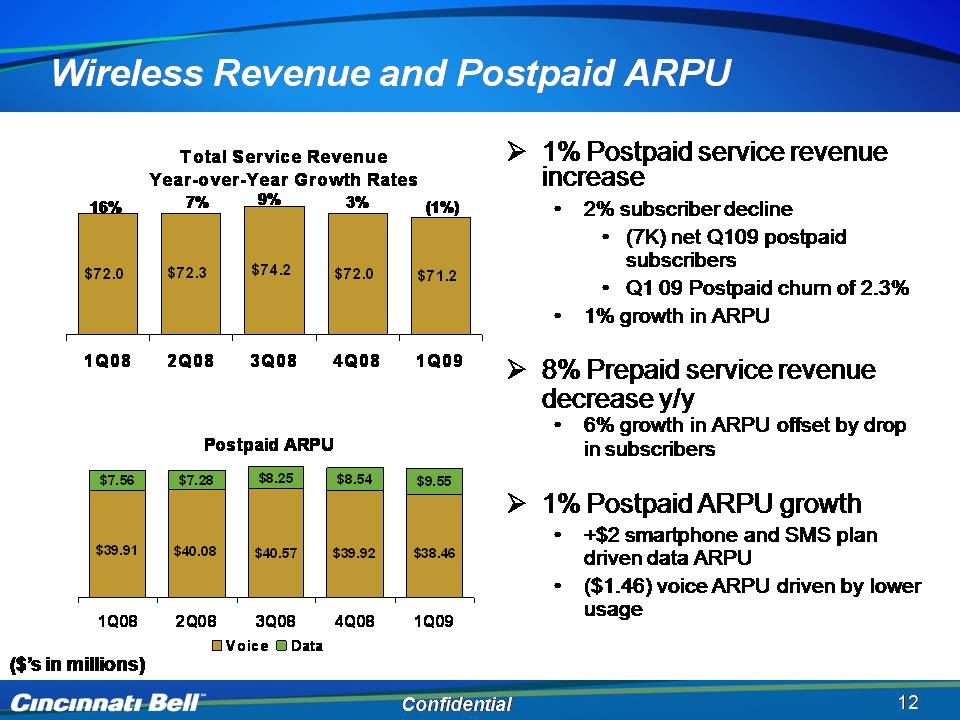
Wireless Revenue and Postpaid ARPU Total Service Revenue Year-over-Year Growth Rates 1% Postpaid service revenue increase • 2% 3% 16% 7% 9% (1%) $72.0 $72.3 $74.2 $72.0 $71.2 subscriber decline • (7K) net Q109 postpaid subscribers • Q1 09 Postpaid churn of 2.3% 1% th i 1Q08 2Q08 3Q08 4Q08 1Q09 • growth in ARPU 8% Prepaid service revenue decrease y/y y • 6% growth in ARPU offset by drop in subscribers 1% Postpaid ARPU growth Postpaid ARPU $7.56 $7.28 $8.25 $8.54 $9.55 p g • +$2 smartphone and SMS plan driven data ARPU • ($1.46) voice ARPU driven by lower usage $39.91 $40.08 $38.46 $39.92 $40.57 1Q08 2Q08 3Q08 4Q08 1Q09 Confidential 12 g ($’s in millions) Voice Data 12
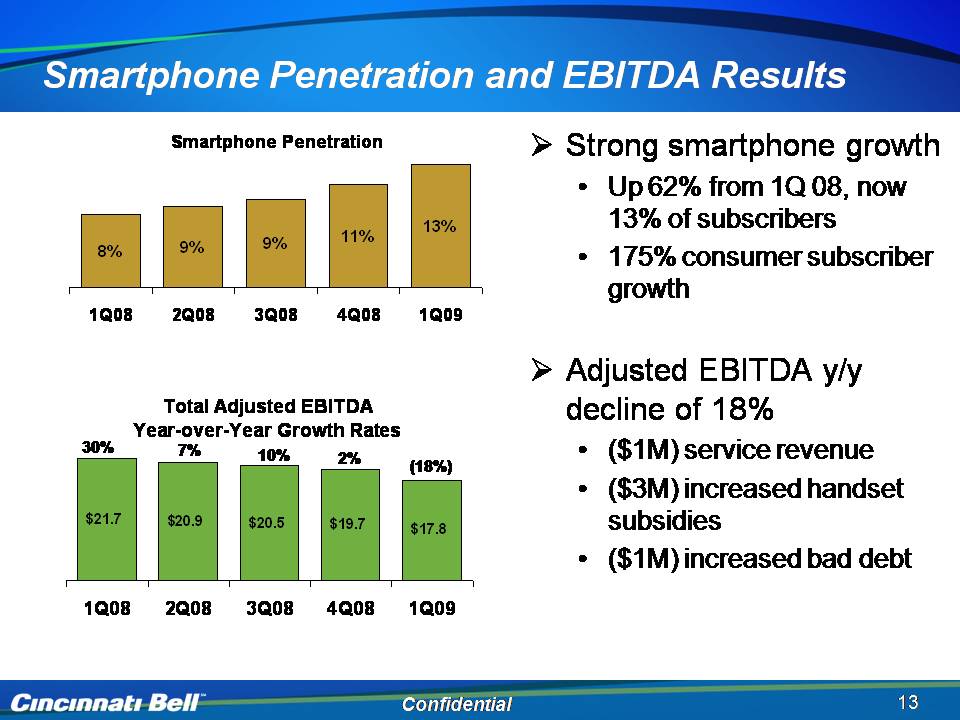
Smartphone Penetration and EBITDA Results Smartphone Penetration Strong smartphone growth • Up 62% from 1Q 08, now 8% 9% 9% 11% 13% 13% of subscribers • 175% consumer subscriber growth 1Q08 2Q08 3Q08 4Q08 1Q09 Adjusted EBITDA y/y Total Adjusted decline of 18% • ($1M) service revenue • ($3M) increased handset b idi EBITDA Year-over-Year Growth Rates $21 7 $ 7% 2% 30% 10% (18%) subsidies • ($1M) increased bad debt 21.7 20.9 $20.5 $19.7 $17.8 1Q08 2Q08 3Q08 4Q08 1Q09 Confidential 13
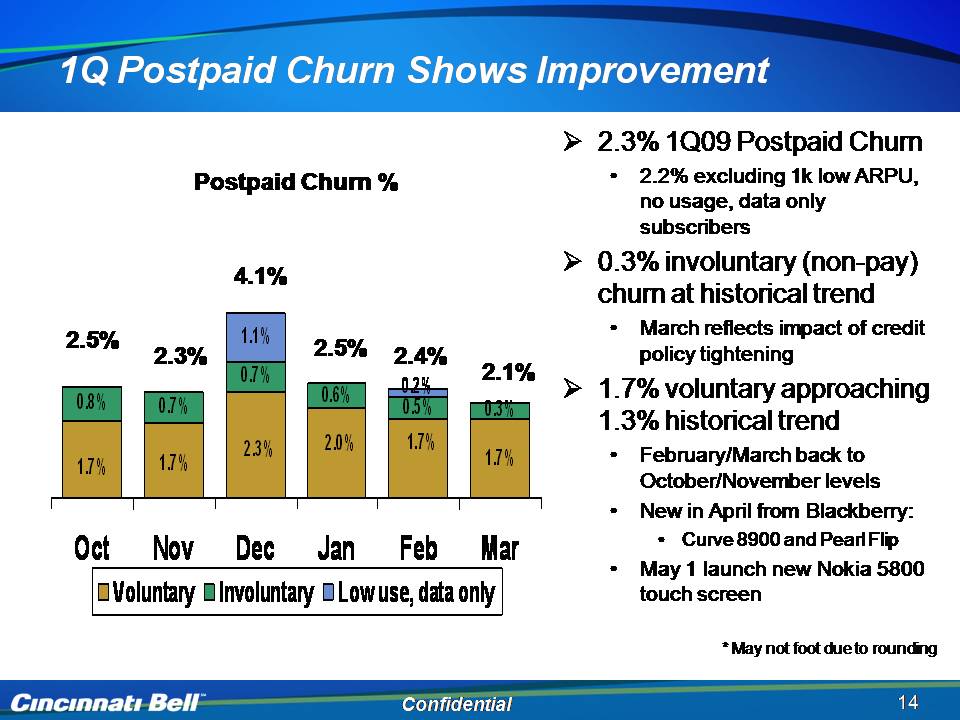
1Q Postpaid Churn Shows Improvement �� 2.3% 1Q09 Postpaid Churn • 2.2% excluding 1k low ARPU, no usage Postpaid Churn % usage, data only subscribers �� 0.3% involuntary (non-pay) churn at historical trend 4.1% 0.8% 0.7% 0.7% 0.6% 0.5% 0 3% 1.1% 0.2% • March reflects impact of credit policy tightening 1.7% voluntary approaching 1 3%hi t i l t d 2.5% 2.3% 2.5% 2.1% 2.4% 1.7% 0.3% 2.3% 2.0% 1.7% 1.7% 1.7% 1.3% historical trend • February/March back to October/November levels • New April from Oct Nov Dec Jan Feb Mar Voluntary Involuntary Low use, data only in Blackberry: • Curve 8900 and Pearl Flip • May 1 launch new Nokia 5800 touch screen Confidential 14
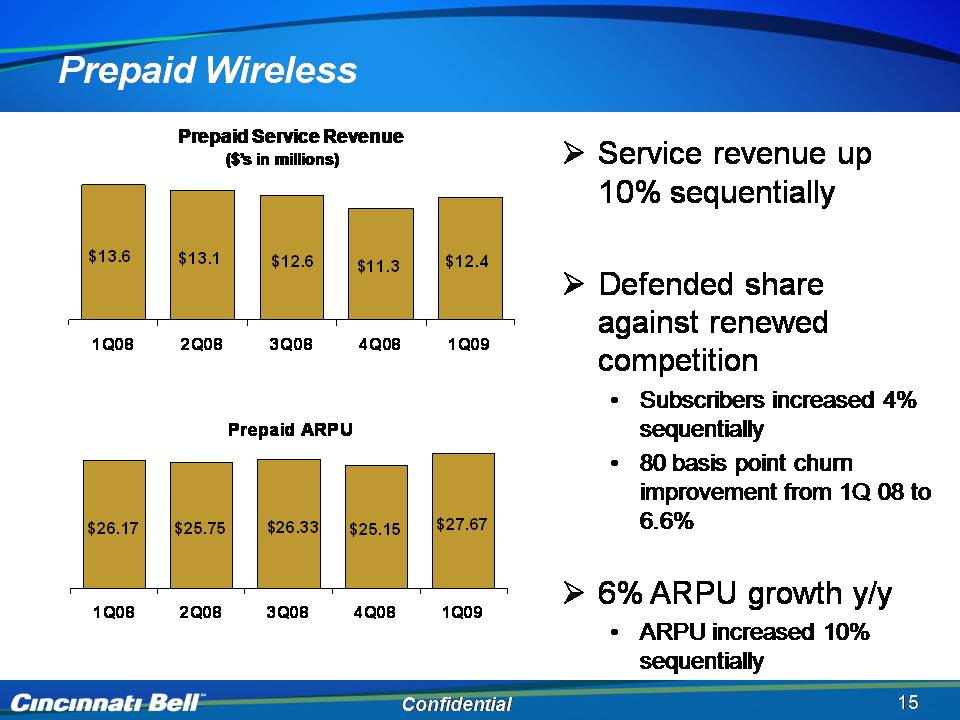
Prepaid Wireless Prepaid Service Revenue ($’s in millions) Service revenue up 10% $13.6 $13.1 $12.4 $11.3 $12.6 sequentially 1Q08 2Q08 3Q08 4Q08 1Q09 Defended share against renewed competition Subscribers increased 4% sequentially Prepaid ARPU • Subscribers 4% sequentially • 80 basis point churn improvement from 1Q 08 to 6.6% to $26.17 $25.75 $27.67 $25.15 $26.33 1Q08 2Q08 3Q08 4Q08 1Q09 1Q 08 6.6% 6% ARPU growth y/y • ARPU increased Confidential Service revenue up 10% sequentially 15
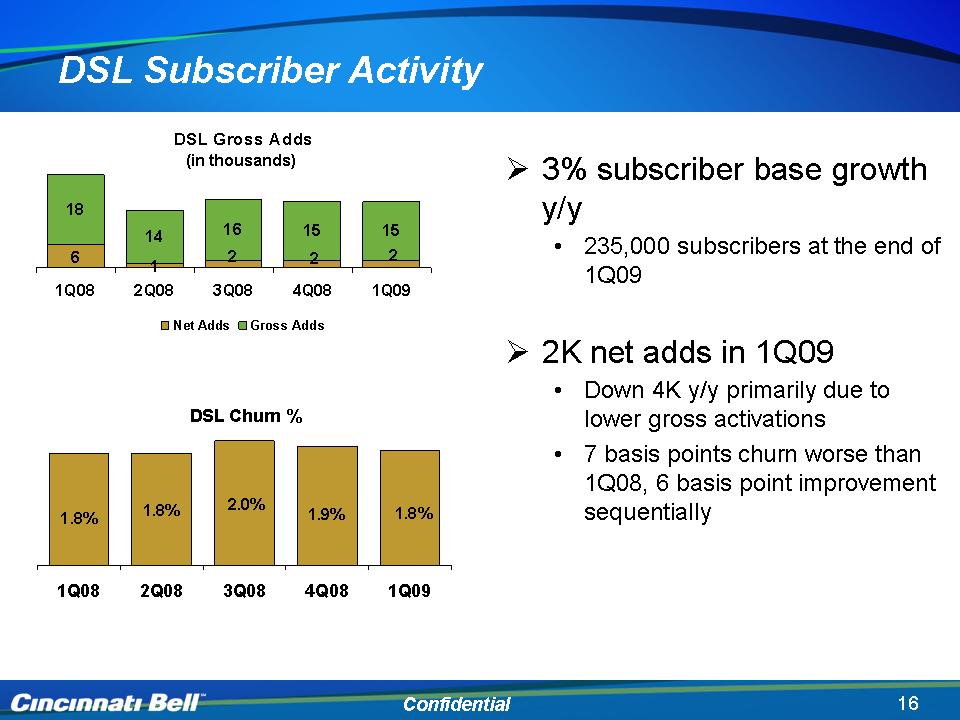
3% subscriber base growth y/y 235,000 subscribers at the end of 1Q09 2K net adds in 1Q09 Down 4K y/y primarily due to lower gross activations 7 basis points churn worse than 1Q08, 6 basis point improvement sequentially (in thousands) DSL Subscriber Activity 1Q08 2Q08 3Q08 4Q08 1Q09 Net Adds 6 1 2 2 2 Gross Adds 18.1 13.8 15.6 15.3 15.1 DSL Churn % 1Q08 2Q08 3Q08 4Q08 1Q09 Churn 0.018 0.018 0.02 0.019 0.0184
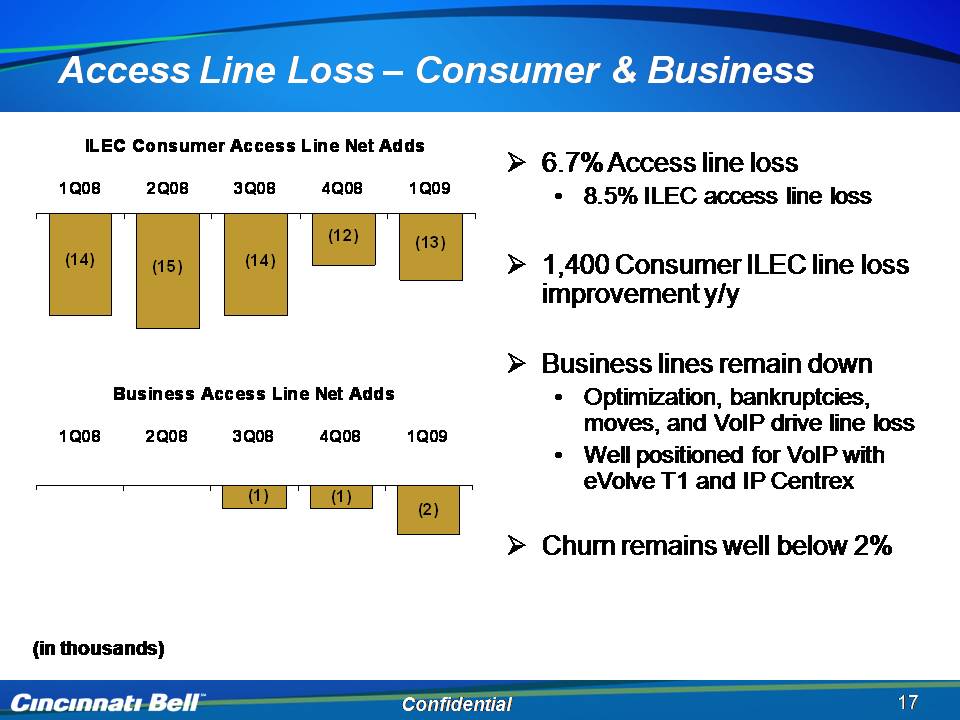
Access Line Loss – Consumer & Business 6.7% Access line loss • 8.5% ILEC access line loss ILEC Consumer Access Line Net Adds 1Q08 2Q08 3Q08 4Q08 1Q09 1,400 Consumer ILEC line loss improvement y/y (14) (12) (13) (15) (14) Business lines remain down • Optimization, bankruptcies, Business Access Line Net Adds moves, and VoIP drive line loss • Well positioned for VoIP with eVolve T1 and IP Centrex (2) (1) (1) 1Q08 2Q08 3Q08 4Q08 1Q09 Churn remains well below 2% Confidential 17 (in thousands) 17
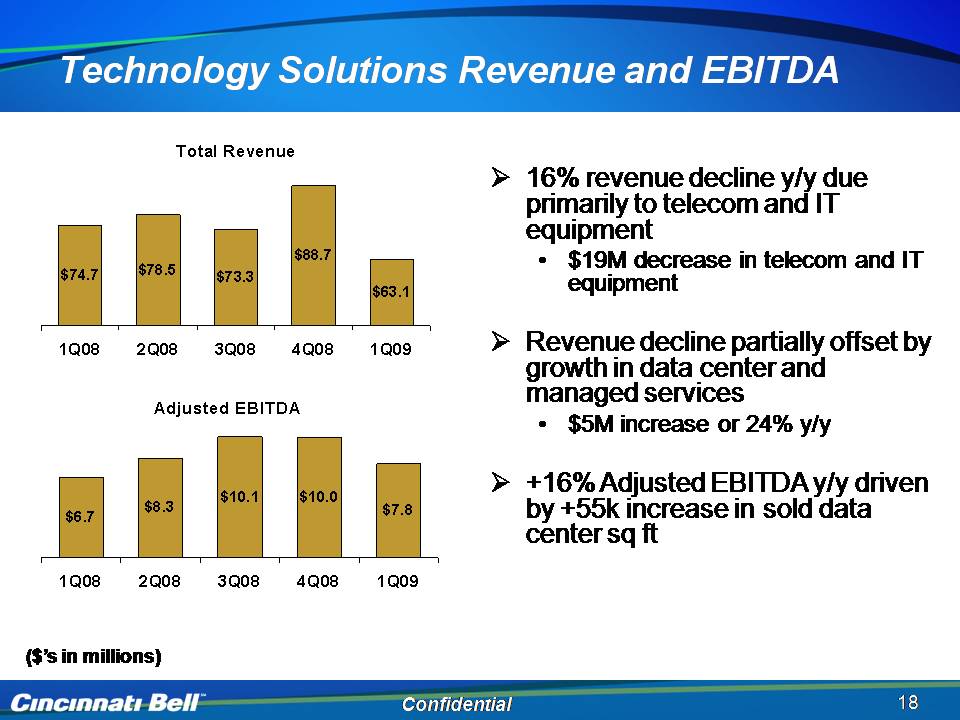
Technology Solutions Revenue and EBITDA ($’s in millions) 16% revenue decline y/y due primarily to telecom and IT equipment $19M decrease in telecom and IT equipment Revenue decline partially offset by growth in data center and managed services $5M increase or 24% y/y +16% Adjusted EBITDA y/y driven by +55k increase in sold data center sq ft Adjusted EBITDA 1Q08 2Q08 3Q08 4Q08 1Q09 DC 6.7 8.3 10.1 10 7.795 Total Revenue 1Q08 2Q08 3Q08 4Q08 1Q09 74.7 78.5 73.3 88.7 63.1
Financial Overview Gary Wojtaszek Chief Financial Officer
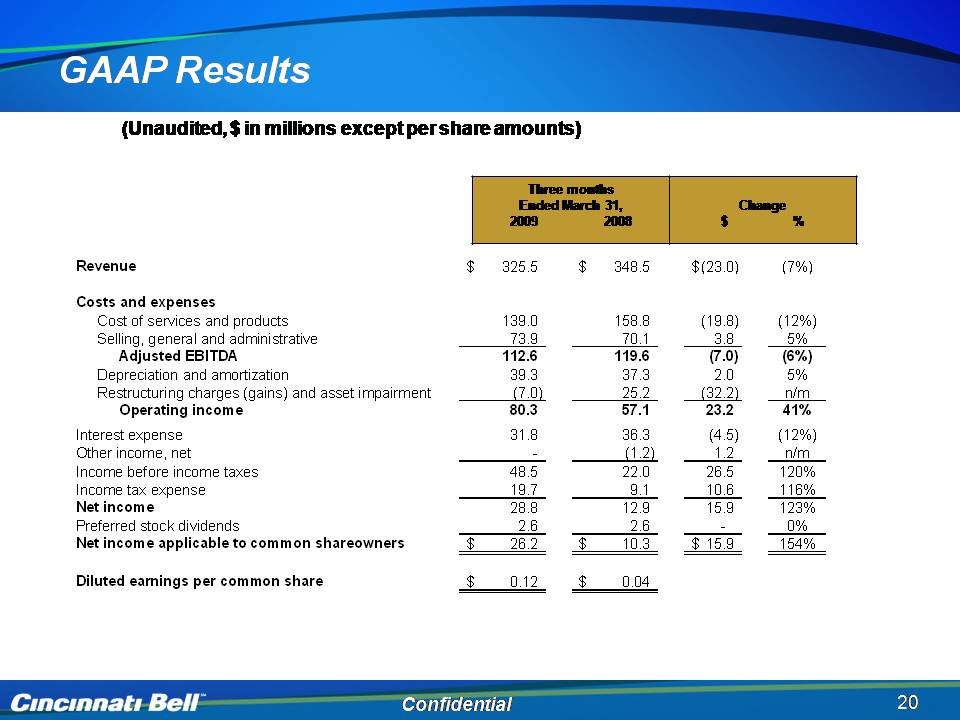
GAAP Results (Unaudited, $ in millions except per share amounts) Three months Ended March 31 Change Revenue 325.5 $ 348.5 $ (23.0) $ (7%) Costs and expenses 31, 2009 2008 $ % p Cost of services and products 139.0 158.8 (19.8) (12%) Selling, general and administrative 73.9 70.1 3.8 5% Adjusted EBITDA 112.6 119.6 (7.0) (6%) Depreciation and amortization 39.3 37.3 2.0 5% Restructuring charges (gains) and asset impairment (7.0) 25.2 (32.2) n/m income 80 3 57 1 23 2 41% Operating 80.3 57.1 23.2 Interest expense 31.8 36.3 (4.5) (12%) Other income, net - (1.2) 1.2 n/m Income before income taxes 48.5 22.0 26.5 120% Income tax expense 19.7 9.1 10.6 116% Net income 28.8 12.9 15.9 123% Preferred stock dividends 2.6 2.6 - 0% Net income applicable to common shareowners 26.2 $ 10.3 $ 15.9 $ 154% Diluted earnings per common share 0.12 $ 0.04 $ Confidential 20
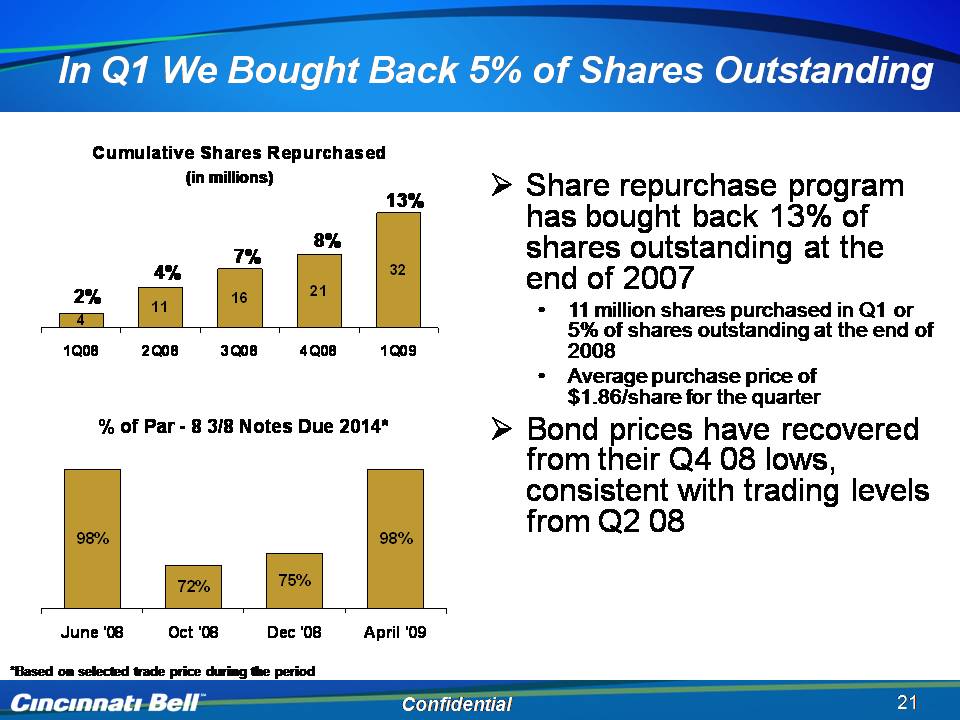
In Q1 We Bought Back 5% of Shares Outstanding (in millions) Share repurchase program h b ht b k f Cumulative Shares Repurchased 13% has bought back 13% of shares outstanding at the end of 2007 • million shares 16 21 32 11 2% 4% 7% 8% 11 purchased in Q1 or 5% of shares outstanding at the end of 2008 • Average purchase price of $1.86/share for the quarter 4 1Q08 2Q08 3Q08 4Q08 1Q09 % of Par - 8 3/8 Notes Due 2014* Bond prices have recovered from their Q4 08 lows, consistent with trading levels f Q208 98% 75% 98% 72% from Q2 08 Confidential 21 June '08 Oct '08 Dec '08 April '09 *Based on selected trade price during the period 21
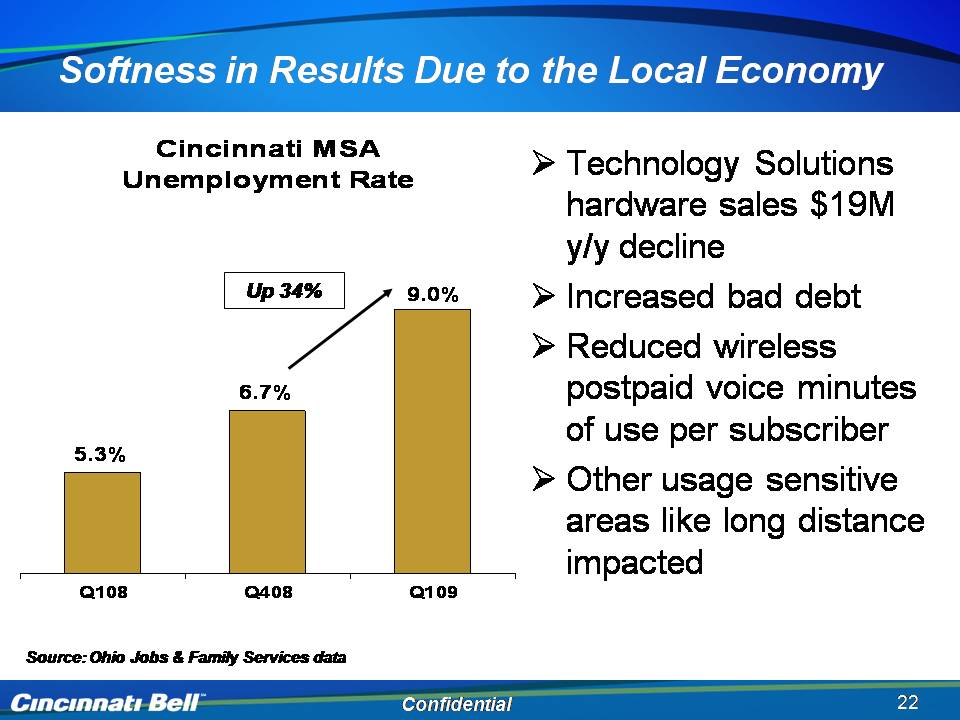
Softness in Results Due to the Local Economy Technology Solutions hardware sales Cincinnati MSA Unemployment Rate $19M y/y decline Increased bad debt 9.0% Up 34% Reduced wireless postpaid voice minutes 6.7% of use per subscriber Other usage sensitive areas like 5.3% long distance impacted Q108 Q408 Q109 Confidential 22 Source: Ohio Jobs & Family Services data 22
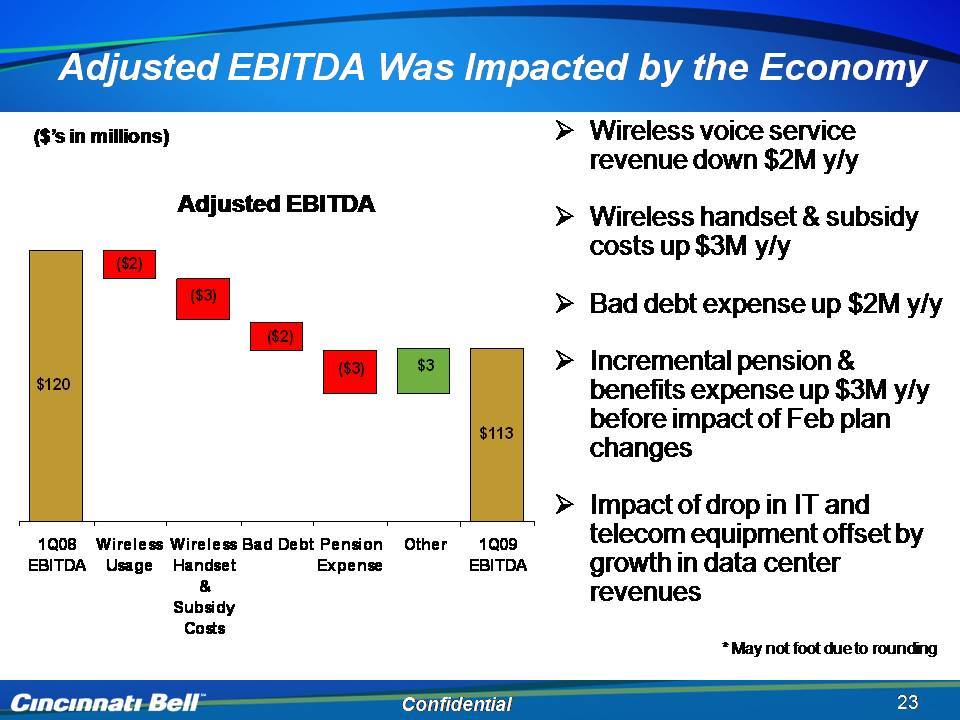
Adjusted EBITDA Was Impacted by the Economy Wireless voice service revenue down $2M y/y ($’s in millions) Adjusted EBITDA ($2) ($3) Wireless handset & subsidy costs up $3M y/y Bad debt expense 2M $120 $3 ($2) ($3) up $y/y Incremental pension & benefits expense up $3M y/y $113 before impact of Feb plan changes Impact of drop in IT and 1Q08 EBITDA Wireless Usage Wireless Handset & Subsidy Bad Debt Pension Expense Other 1Q09 EBITDA telecom equipment offset by growth in data center revenues Confidential 23
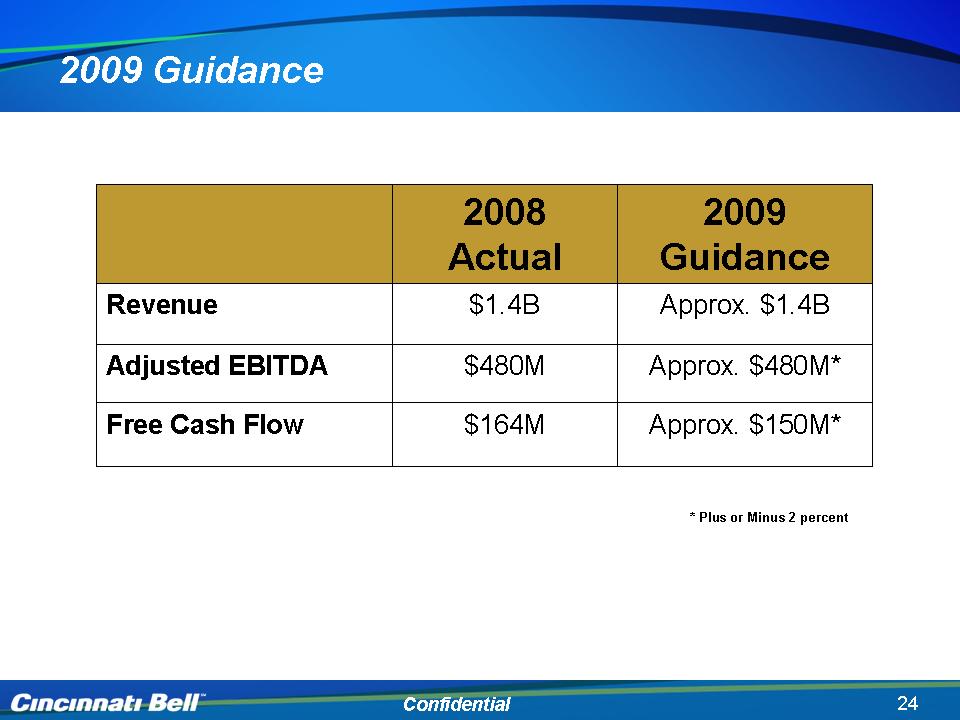
2009 Guidance * Plus or Minus 2 percent 2008 Actual 2009 Guidance Revenue $1.4B Approx. $1.4B Adjusted EBITDA $480M Approx. $480M* Free Cash Flow $164M Approx. $150M*

Cincinnati Bell 1st Quarter 2009 Review May 5, 2009
Non-GAAP Reconciliations (please refer to the Earnings Financials)