| 1 Creating Success by Delivering Solutions Penns Woods Bancorp, Inc. December 2022 |

| 2 Forward - Looking Information Certain statements contained in this presentation are forward - looking in nature .. These include all statements about PWB’s plans, objectives, expectations and other statements that are not historical facts, and usually use words such as "expect," "anticipate," "believe" and similar expressions .. Such statements represent management's current beliefs, based upon information available at the time the statements are made, with regard to the matters addressed .. All forward - looking statements are subject to risks and uncertainties that could cause PWB’s actual results or financial condition to differ materially from those expressed in or implied by such statements .. Factors of particular importance to PWB include, but are not limited to : ( 1 ) changes in general, national or regional economic conditions ; ( 2 ) changes in interest rates ; ( 3 ) changes in loan default and charge - off rates ; ( 4 ) changes in deposit levels ; ( 5 ) changes in levels of income and expense in non - interest income and expense related activities ; ( 6 ) residential mortgage and secondary market activity ; ( 7 ) changes in accounting and regulatory guidance applicable to banks ; ( 8 ) price levels and conditions in the public securities markets generally ; ( 9 ) competition and its effect on pricing, spending, third - party relationships and revenues ; ( 10 ) changes in regulation resulting from or relating to financial reform legislation ; and ( 11 ) the risk factors identified in PWB’s Annual Report on Form 10 - K for the year ended December 31 , 2021 and in other filings made by PWB under the Securities Exchange Act of 1934 .. PWB does not undertake any obligation to update or revise any forward - looking statements, whether as a result of new information, future events or otherwise .. Penns Woods Bancorp, Inc. |
| 3 Non - GAAP Financial Measures This presentation contains financial information determined by methods other than in accordance with generally accepted accounting principles in the United States (“GAAP”) .. These non - GAAP measures include tangible book value per share and return on average tangible common equity .. Management uses these non - GAAP financial measures because this information is commonly utilized by regulators and investors to evaluate financial condition, and is therefore useful to investors .. These disclosures should not be viewed as a substitute for operating results determined in accordance with GAAP, nor are they necessarily comparable to non - GAAP performance measures that may be presented by other companies .. A reconciliation of the non - GAAP measures, tangible book value per share and return on average tangible common equity, used in this presentation to the related GAAP measure is included in the appendix to this presentation .. Penns Woods Bancorp, Inc. |
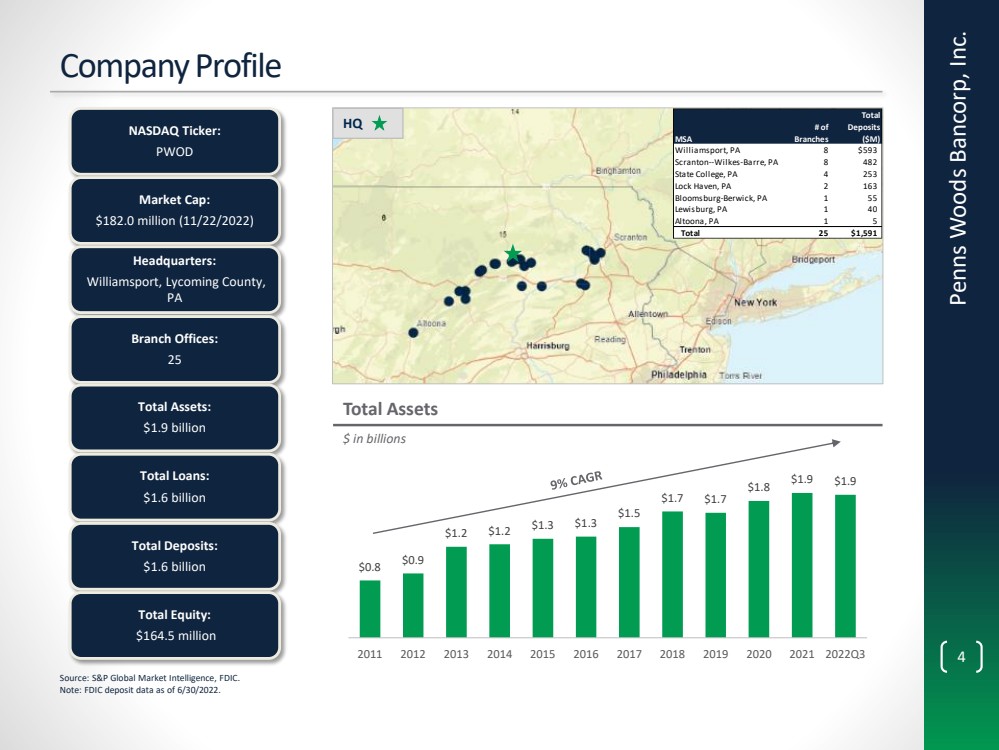
| 4 $0.8 $0.9 $1.2 $1.2 $1.3 $1.3 $1.5 $1.7 $1.7 $1.8 $1.9 $1.9 2011 2012 2013 2014 2015 2016 2017 2018 2019 2020 2021 2022Q3 Company Profile Penns Woods Bancorp, Inc. NASDAQ Ticker: PWOD Market Cap: $182.0 million (11/22/2022) Headquarters : Williamsport, Lycoming County, PA Branch Offices: 25 Total Assets: $1.9 billion Total Loans: $1.6 billion Total Deposits: $1.6 billion Total Equity : $ 164.5 million Total Assets $ in billions HQ MSA # of Branches Total Deposits ($M) Williamsport, PA 8 $593 Scranton--Wilkes-Barre, PA 8 482 State College, PA 4 253 Lock Haven, PA 2 163 Bloomsburg-Berwick, PA 1 55 Lewisburg, PA 1 40 Altoona, PA 1 5 Total 25 $1,591 Source: S&P Global Market Intelligence, FDIC. Note: FDIC deposit data as of 6/30/2022. |
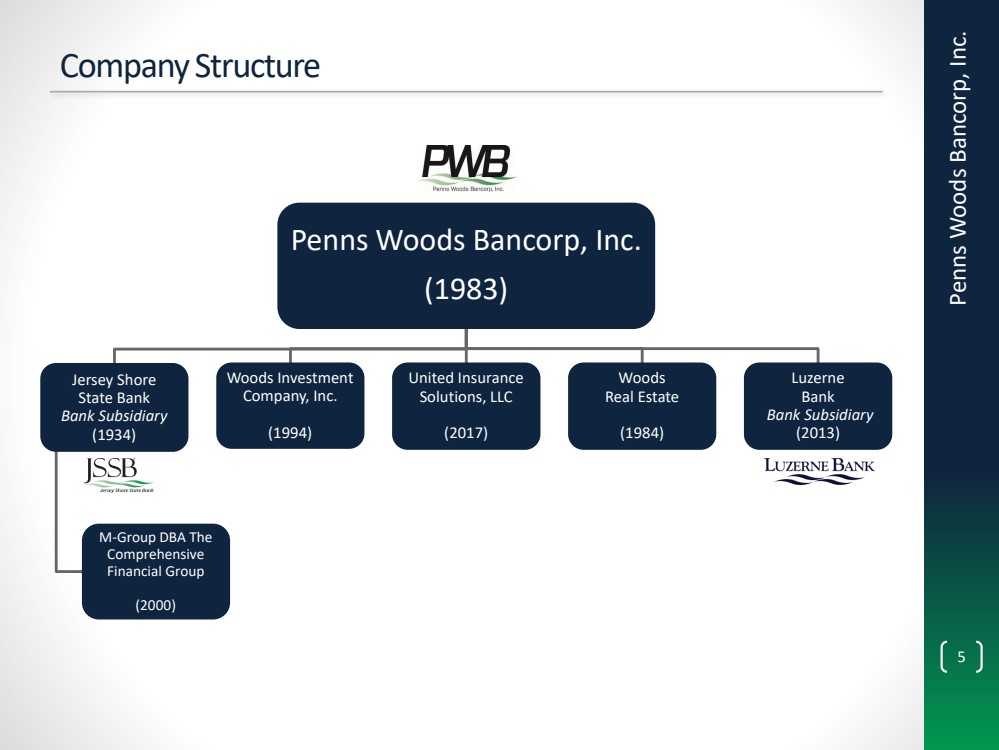
| 5 Company Structure Penns Woods Bancorp, Inc. (1983) Jersey Shore State Bank Bank Subsidiary (1934) M - Group DBA The Comprehensive Financial Group (2000) Woods Investment Company, Inc .. (1994 ) United Insurance Solutions, LLC (2017 ) Woods Real Estate (1984) Luzerne Bank Bank Subsidiary (2013) Penns Woods Bancorp, Inc. |
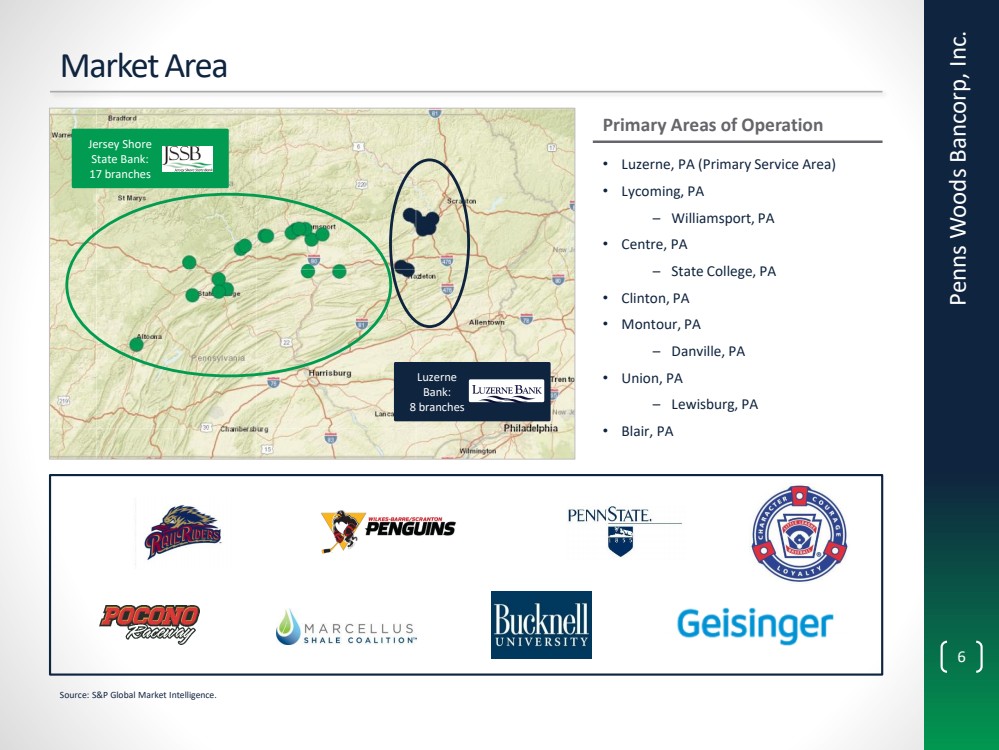
| 6 Market Area Penns Woods Bancorp, Inc. Jersey Shore State Bank: 17 branches Luzerne Bank: 8 branches Primary Areas of Operation • Luzerne, PA (Primary Service Area) • Lycoming, PA – Williamsport, PA • Centre, PA – State College, PA • Clinton, PA • Montour, PA – Danville, PA • Union, PA – Lewisburg, PA • Blair, PA Source: S&P Global Market Intelligence. |
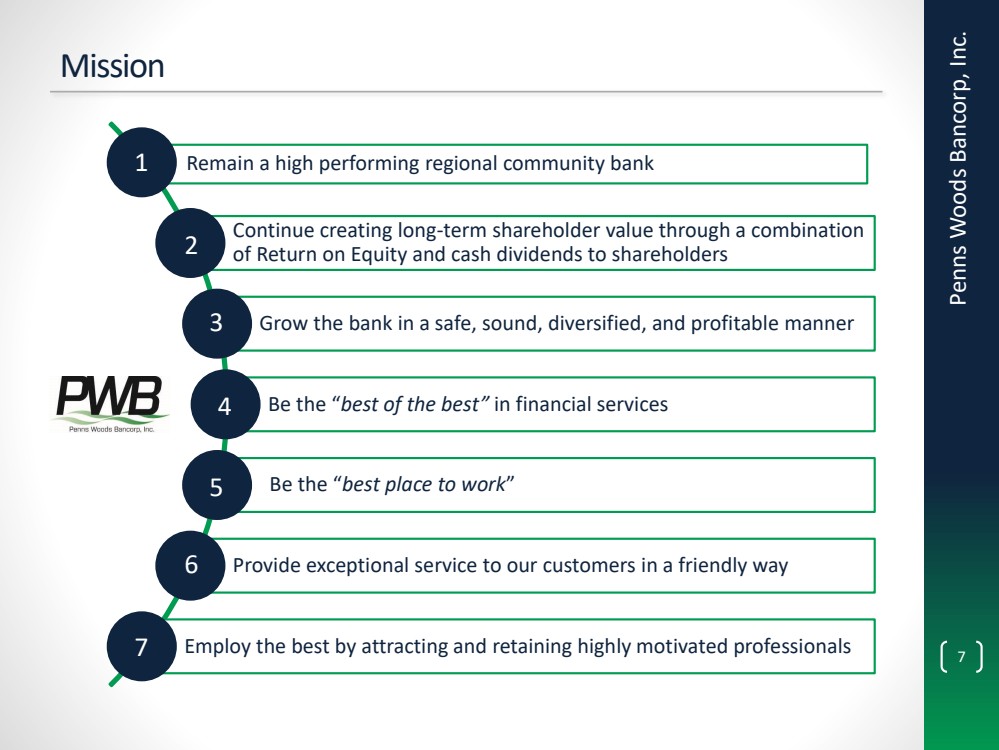
| 7 Mission Remain a high performing regional community bank Continue creating long - term shareholder value through a combination of Return on Equity and cash dividends to shareholders Grow the bank in a safe, sound, diversified, and profitable manner Be the “ best of the best” in financial services Be the “ best place to work ” Provide exceptional service to our customers in a friendly way Employ the best by attracting and retaining highly motivated professionals Penns Woods Bancorp, Inc. 1 2 3 4 5 6 7 |
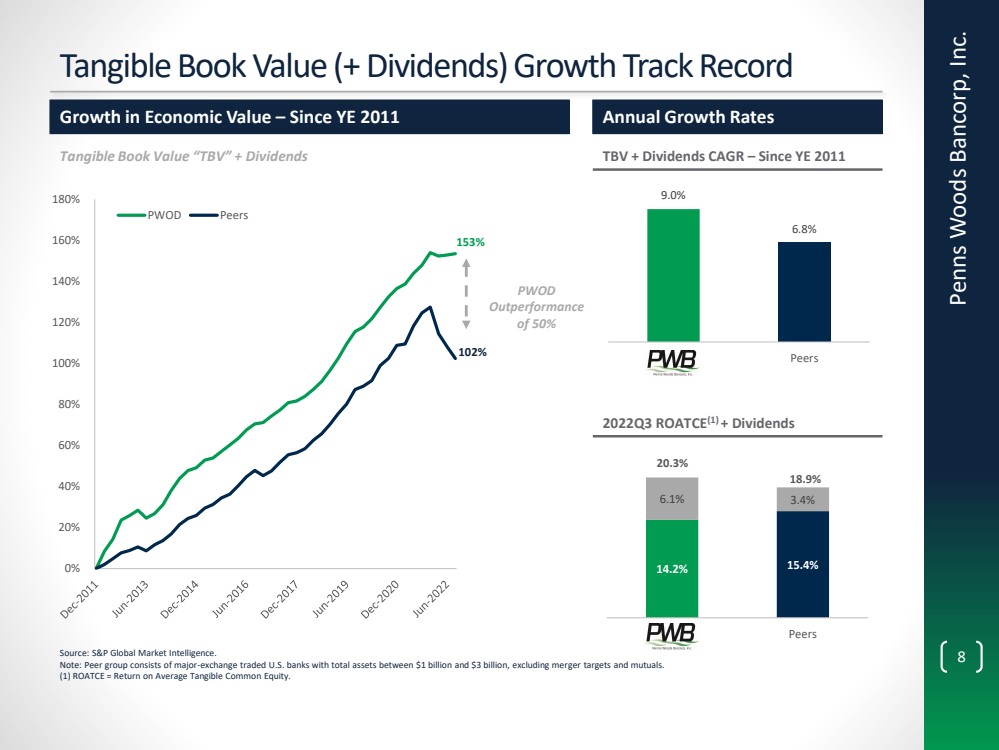
| 8 Tangible Book Value (+ Dividends) Growth Track Record Penns Woods Bancorp, Inc. Growth in Economic Value – Since YE 2011 Tangible Book Value “TBV” + Dividends Annual Growth Rates TBV + Dividends CAGR – Since YE 2011 2022Q3 ROATCE (1) + Dividends Source: S&P Global Market Intelligence. Note: Peer group consists of major - exchange traded U.S. banks with total assets between $1 billion and $3 billion, excluding mer ger targets and mutuals. (1) ROATCE = Return on Average Tangible Common Equity. 153% 102% 0% 20% 40% 60% 80% 100% 120% 140% 160% 180% PWOD Peers PWOD Outperformance of 50 % 9.0% 6.8% PWOD Peers 14.2% 15.4% 6.1% 3.4% PWOD Peers 20.3% 18.9% |
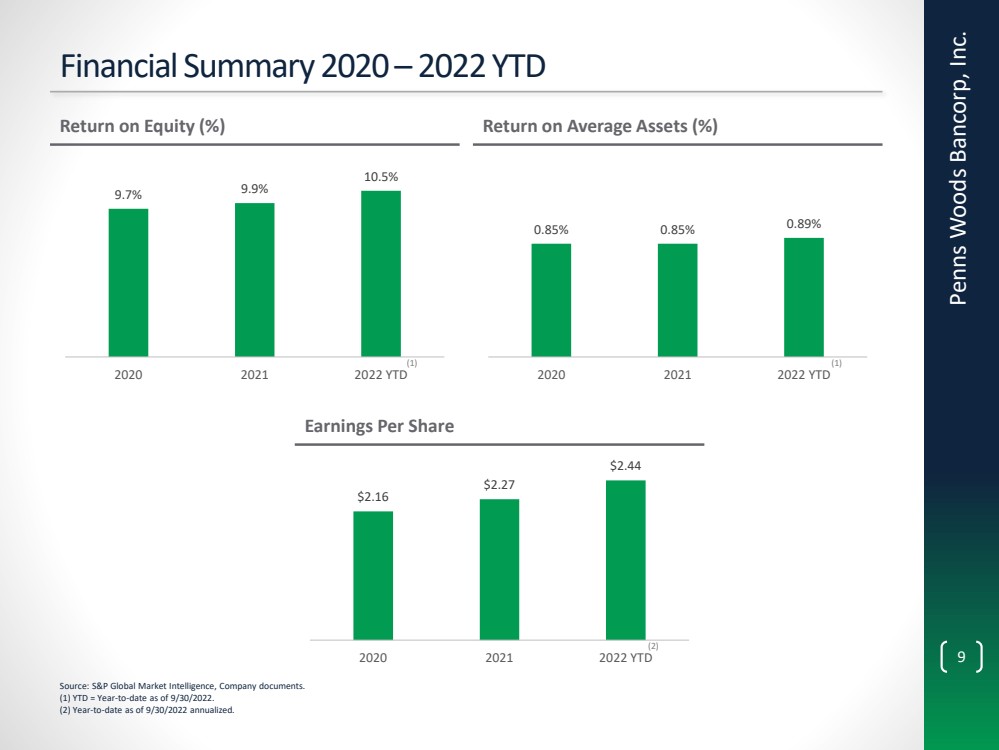
| 9 Financial Summary 2020 – 2022 YTD Penns Woods Bancorp, Inc. Return on Equity (%) Return on Average Assets (%) 9.7% 9.9% 10.5% 2020 2021 2022 YTD 0.85% 0.85% 0.89% 2020 2021 2022 YTD Earnings Per Share $2.16 $2.27 $2.44 2020 2021 2022 YTD Source: S&P Global Market Intelligence, Company documents. (1) YTD = Year - to - date as of 9/30/2022. (2) Year - to - date as of 9/30/2022 annualized. (1) (1) (2) |
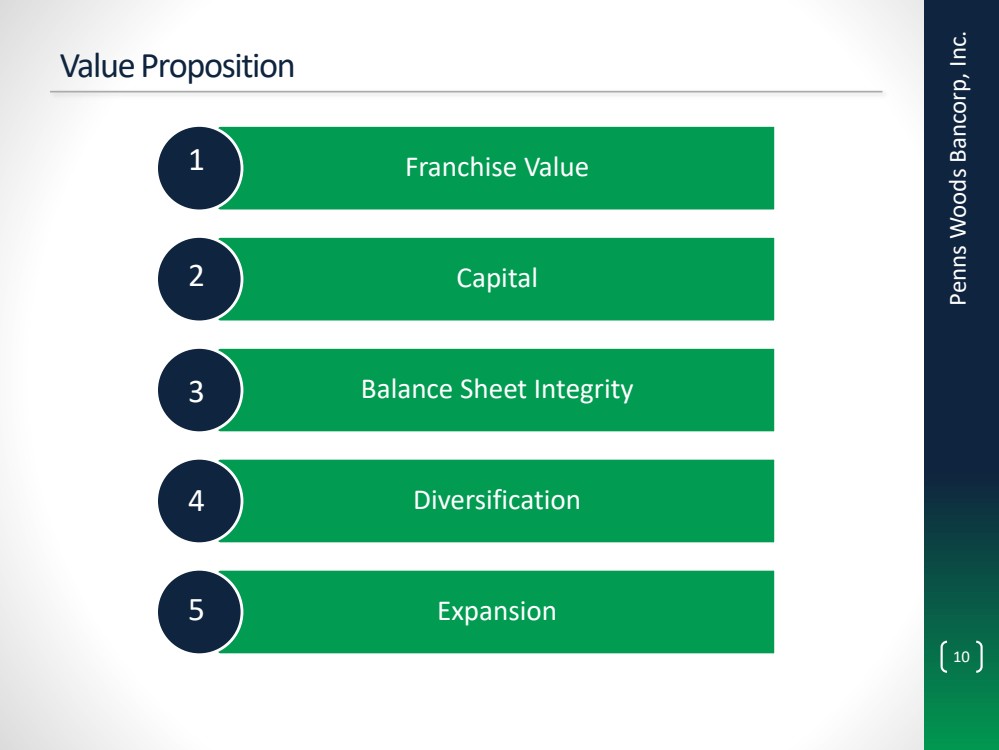
| 10 Value Proposition Franchise Value Capital Balance Sheet Integrity Diversification Expansion Penns Woods Bancorp, Inc. 1 2 3 4 5 |
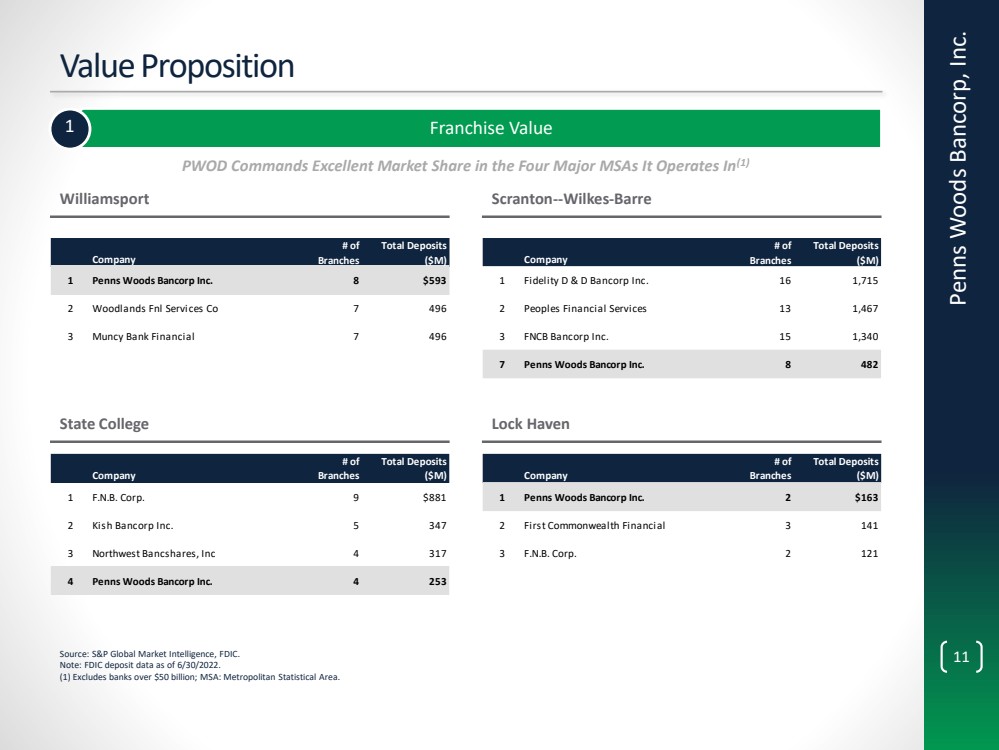
| 11 Value Proposition Franchise Value 1 Source: S&P Global Market Intelligence, FDIC. Note: FDIC deposit data as of 6/30/2022. (1) Excludes banks over $50 billion; MSA: Metropolitan Statistical Area. PWOD Commands Excellent Market Share in the Four Major MSAs It Operates In (1) Williamsport Scranton -- Wilkes - Barre State College Lock Haven Company # of Branches Total Deposits ($M) 1 Penns Woods Bancorp Inc. 8 $593 2 Woodlands Fnl Services Co 7 496 3 Muncy Bank Financial 7 496 Company # of Branches Total Deposits ($M) 1 Fidelity D & D Bancorp Inc. 16 1,715 2 Peoples Financial Services 13 1,467 3 FNCB Bancorp Inc. 15 1,340 7 Penns Woods Bancorp Inc. 8 482 Company # of Branches Total Deposits ($M) 1 F.N.B. Corp. 9 $881 2 Kish Bancorp Inc. 5 347 3 Northwest Bancshares, Inc 4 317 4 Penns Woods Bancorp Inc. 4 253 Company # of Branches Total Deposits ($M) 1 Penns Woods Bancorp Inc. 2 $163 2 First Commonwealth Financial 3 141 3 F.N.B. Corp. 2 121 Penns Woods Bancorp, Inc. |
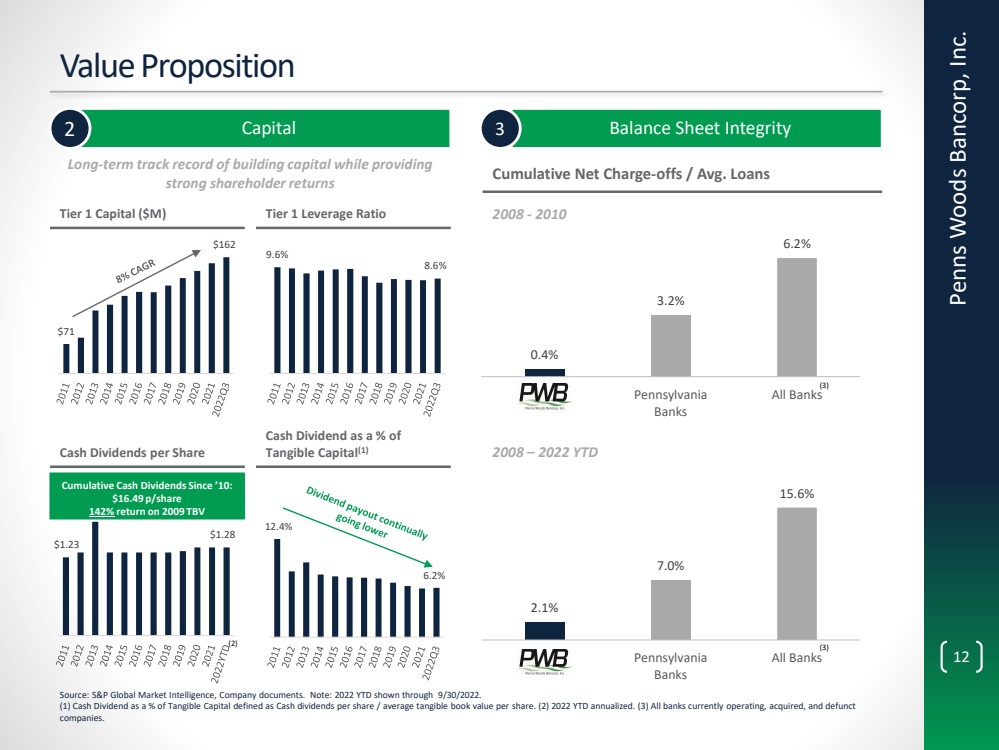
| 12 Value Proposition Balance Sheet Integrity 3 Cumulative Net Charge - offs / Avg. Loans Capital 2 Long - term track record of building capital while providing strong shareholder returns Tier 1 Capital ($M) Tier 1 Leverage Ratio Cash Dividends per Share Cash Dividend as a % of Tangible Capital (1) $71 $162 9.6% 8.6% $1.23 $1.28 12.4% 6.2% 0.4% 3.2% 6.2% PWOD Pennsylvania Banks All Banks 2.1% 7.0% 15.6% PWOD Pennsylvania Banks All Banks 2008 - 2010 2008 – 2022 YTD Source: S&P Global Market Intelligence, Company documents. Note: 2022 YTD shown through 9/30/2022. (1) Cash Dividend as a % of Tangible Capital defined as Cash dividends per share / average tangible book value per share. (2) 2022 YTD annualized. (3) All banks currently operating, acquired, and defunct companies. (3) (3) Cumulative Cash Dividends Since ’10: $16.49 p/share 142% return on 2009 TBV Penns Woods Bancorp, Inc. (2) |
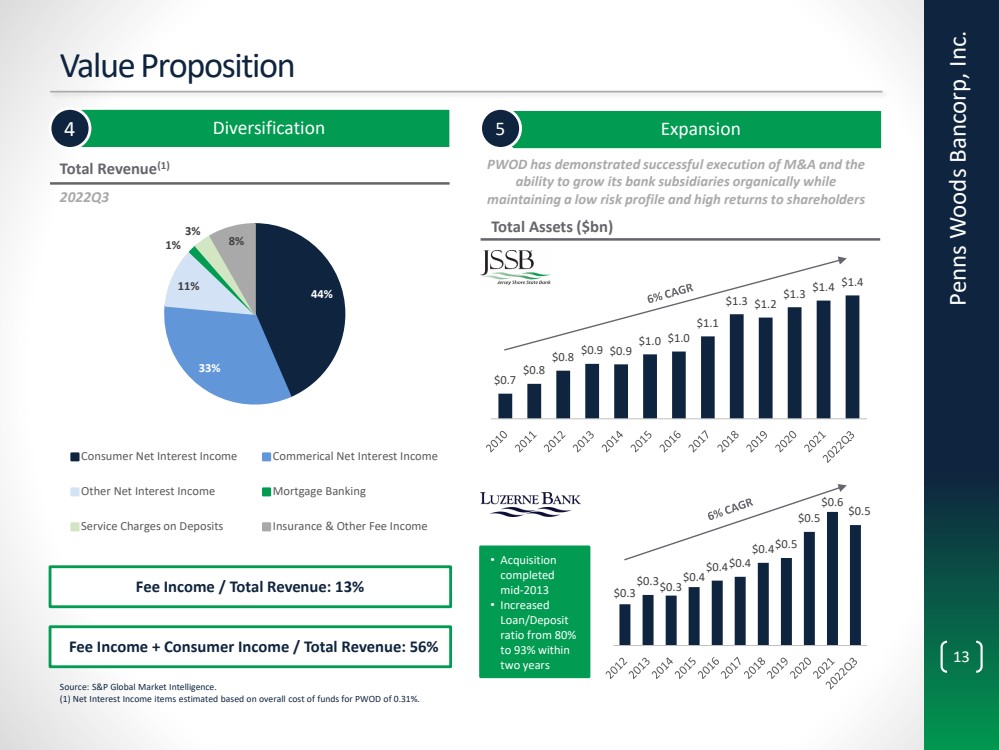
| 13 44% 33% 11% 1% 3% 8% Consumer Net Interest Income Commerical Net Interest Income Other Net Interest Income Mortgage Banking Service Charges on Deposits Insurance & Other Fee Income Value Proposition Diversification 4 Total Revenue (1) 2022Q3 Source: S&P Global Market Intelligence. (1) Net Interest Income items estimated based on overall cost of funds for PWOD of 0.31%. Expansion 5 $0.3 $0.3 $0.3 $0.4 $0.4 $0.4 $0.4 $0.5 $0.5 $0.6 $0.5 $0.7 $0.8 $0.8 $0.9 $0.9 $1.0 $1.0 $1.1 $1.3 $1.2 $1.3 $1.4 $1.4 • Acquisition completed mid - 2013 • Increased Loan/Deposit ratio from 80% to 93% within two years Total Assets ($bn) Fee Income / Total Revenue: 13% PWOD has demonstrated successful execution of M&A and the ability to grow its bank subsidiaries organically while maintaining a low risk profile and high returns to shareholders Fee Income + Consumer Income / Total Revenue: 56% Penns Woods Bancorp, Inc. |
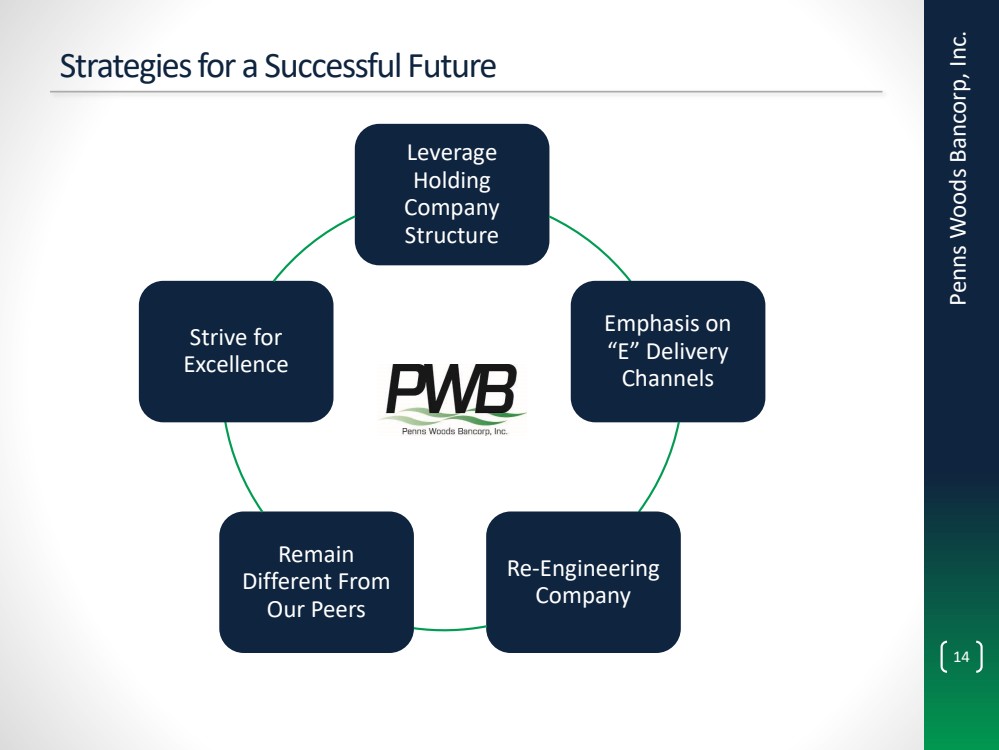
| 14 Penns Woods Bancorp, Inc. Strategies for a Successful Future Leverage Holding Company Structure Emphasis on “E” Delivery Channels Re - Engineering Company Remain Different From Our Peers Strive for Excellence |
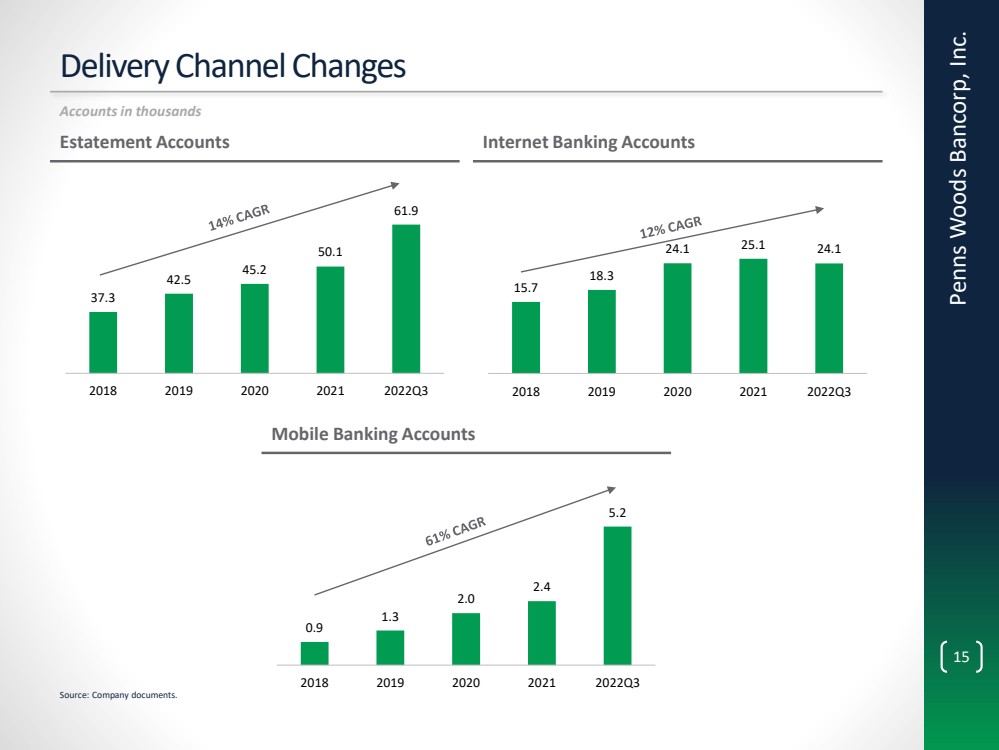
| 15 Delivery Channel Changes Penns Woods Bancorp, Inc. Estatement Accounts Internet Banking Accounts Mobile Banking Accounts 37.3 42.5 45.2 50.1 61.9 2018 2019 2020 2021 2022Q3 15.7 18.3 24.1 25.1 24.1 2018 2019 2020 2021 2022Q3 0.9 1.3 2.0 2.4 5.2 2018 2019 2020 2021 2022Q3 Accounts in thousands Source: Company documents. |
| 16 Penns Woods Bancorp, Inc. Future Holding Company Structure Penns Woods Bancorp, Inc. Holding Company Western Region (Brand to be Determined) Blair, Cambria, Clearfield and Huntingdon Counties Jersey Shore State Bank Lycoming, Clinton, Centre, Montour, Union, Columbia, Snyder and Northumberland Counties Luzerne Bank Luzerne, Lackawanna and Wyoming Counties Northern Region (Brand to be Determined) Bradford, Tioga and Susquehanna Counties Southern Region (Brand to be Determined) Lehigh, Lebanon, Dauphin and Perry Counties |

| 17 Appendix Penns Woods Bancorp, Inc. |

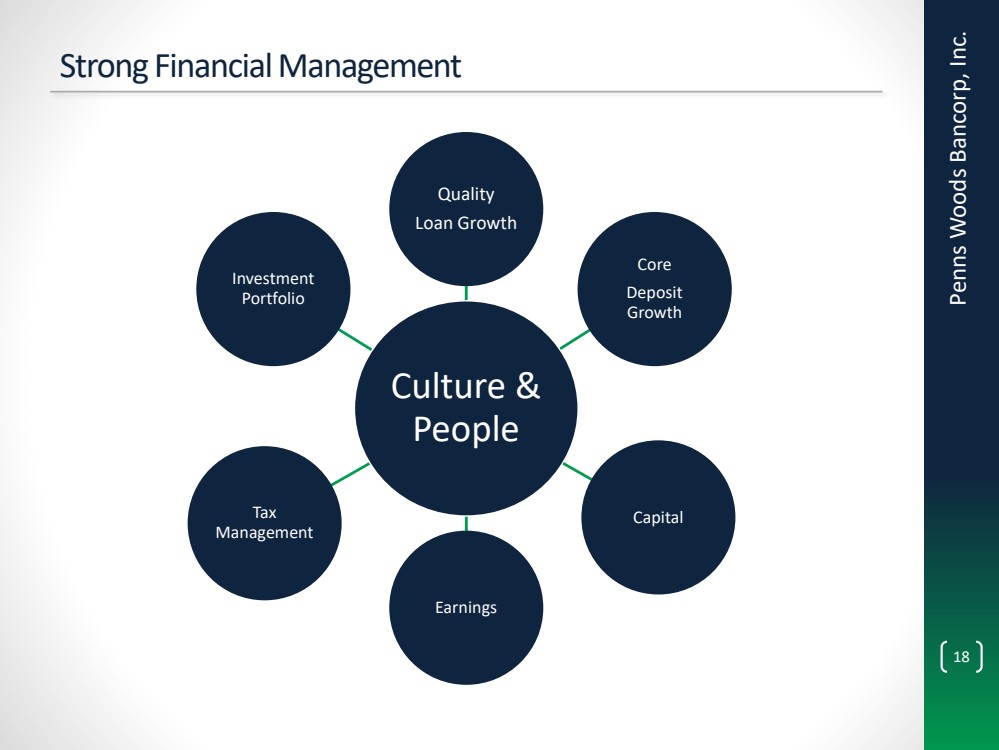
| 18 Strong Financial Management Penns Woods Bancorp, Inc. Culture & People Quality Loan Growth Core Deposit Growth Capital Earnings Tax Management Investment Portfolio |
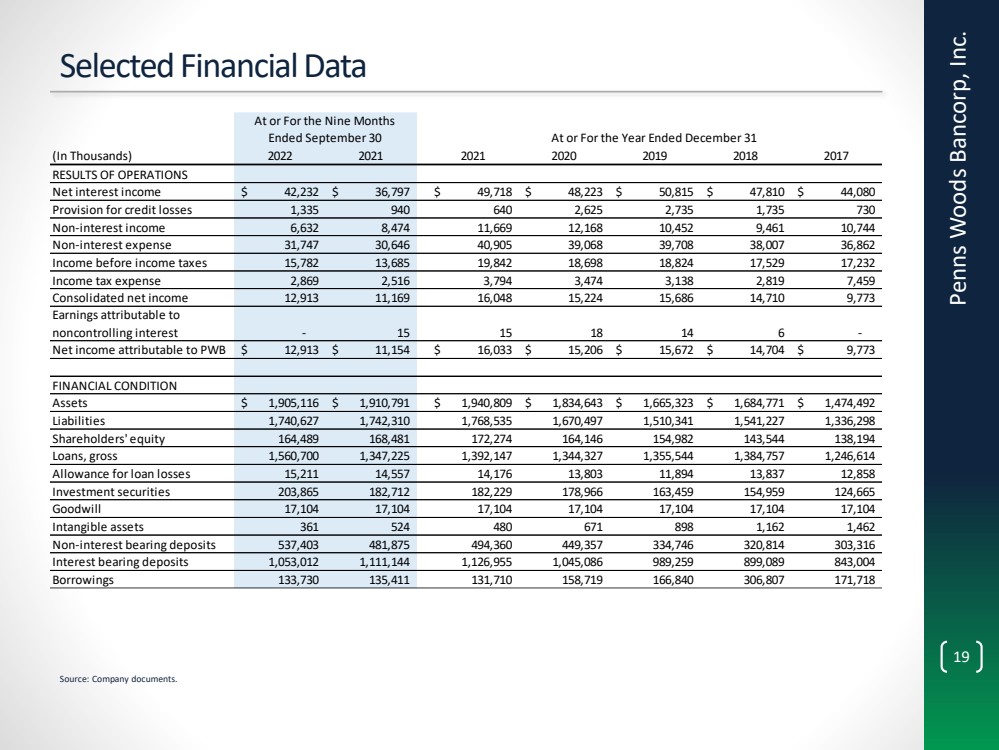
| 19 Selected Financial Data Penns Woods Bancorp, Inc. At or For the Nine Months Ended September 30 (In Thousands) 2022 2021 2021 2020 2019 2018 2017 RESULTS OF OPERATIONS Net interest income 42,232 $ 36,797 $ 49,718 $ 48,223 $ 50,815 $ 47,810 $ 44,080 $ Provision for credit losses 1,335 940 640 2,625 2,735 1,735 730 Non-interest income 6,632 8,474 11,669 12,168 10,452 9,461 10,744 Non-interest expense 31,747 30,646 40,905 39,068 39,708 38,007 36,862 Income before income taxes 15,782 13,685 19,842 18,698 18,824 17,529 17,232 Income tax expense 2,869 2,516 3,794 3,474 3,138 2,819 7,459 Consolidated net income 12,913 11,169 16,048 15,224 15,686 14,710 9,773 Earnings attributable to noncontrolling interest - 15 15 18 14 6 - Net income attributable to PWB 12,913 $ 11,154 $ 16,033 $ 15,206 $ 15,672 $ 14,704 $ 9,773 $ FINANCIAL CONDITION Assets 1,905,116 $ 1,910,791 $ 1,940,809 $ 1,834,643 $ 1,665,323 $ 1,684,771 $ 1,474,492 $ Liabilities 1,740,627 1,742,310 1,768,535 1,670,497 1,510,341 1,541,227 1,336,298 Shareholders' equity 164,489 168,481 172,274 164,146 154,982 143,544 138,194 Loans, gross 1,560,700 1,347,225 1,392,147 1,344,327 1,355,544 1,384,757 1,246,614 Allowance for loan losses 15,211 14,557 14,176 13,803 11,894 13,837 12,858 Investment securities 203,865 182,712 182,229 178,966 163,459 154,959 124,665 Goodwill 17,104 17,104 17,104 17,104 17,104 17,104 17,104 Intangible assets 361 524 480 671 898 1,162 1,462 Non-interest bearing deposits 537,403 481,875 494,360 449,357 334,746 320,814 303,316 Interest bearing deposits 1,053,012 1,111,144 1,126,955 1,045,086 989,259 899,089 843,004 Borrowings 133,730 135,411 131,710 158,719 166,840 306,807 171,718 At or For the Year Ended December 31 Source: Company documents. |
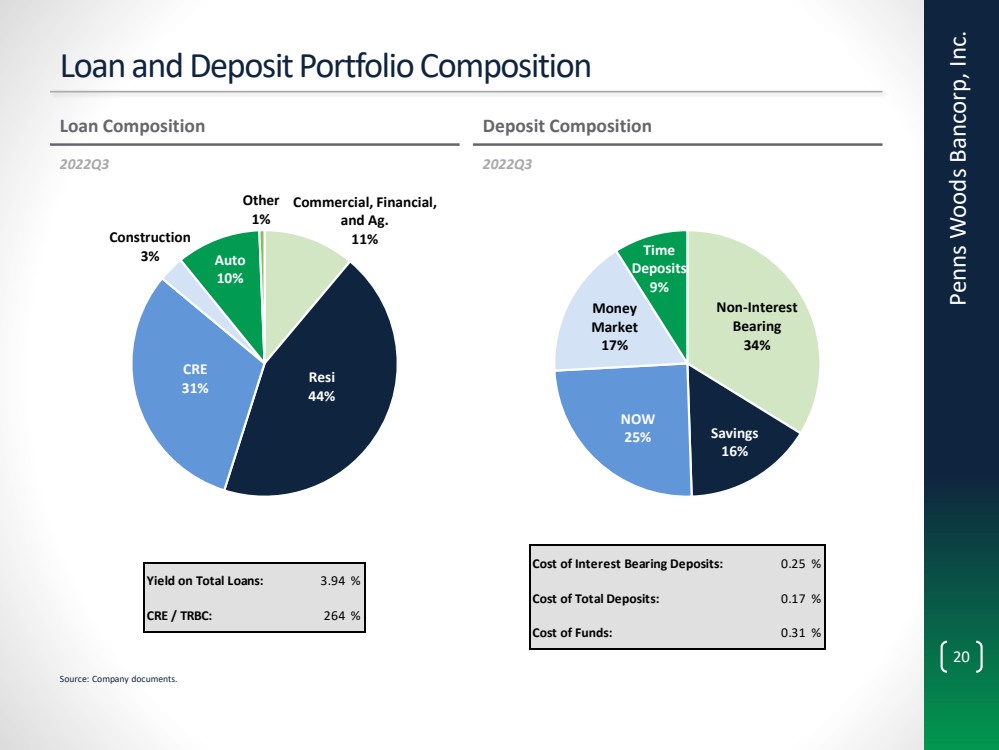
| 20 Loan and Deposit Portfolio Composition Penns Woods Bancorp, Inc. Loan Composition Deposit Composition Commercial, Financial, and Ag. 11% Resi 44% CRE 31% Construction 3% Auto 10% Other 1% Non - Interest Bearing 34% Savings 16% NOW 25% Money Market 17% Time Deposits 9% Yield on Total Loans: 3.94 % CRE / TRBC: 264 % Cost of Interest Bearing Deposits: 0.25 % Cost of Total Deposits: 0.17 % Cost of Funds: 0.31 % 2022Q3 2022Q3 Source: Company documents. |
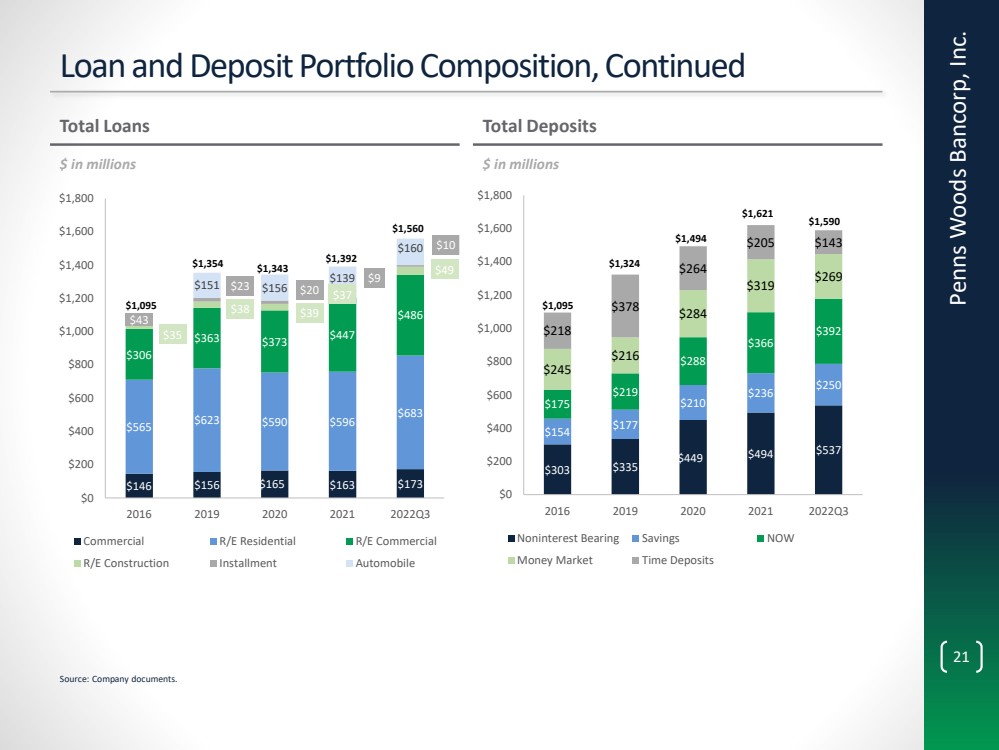
| 21 Loan and Deposit Portfolio Composition, Continued Penns Woods Bancorp, Inc. Total Loans Total Deposits $146 $156 $165 $163 $173 $565 $623 $590 $596 $683 $306 $363 $373 $447 $486 $35 $38 $39 $37 $49 $43 $23 $20 $9 $10 $151 $156 $139 $160 $0 $200 $400 $600 $800 $1,000 $1,200 $1,400 $1,600 $1,800 2016 2019 2020 2021 2022Q3 Commercial R/E Residential R/E Commercial R/E Construction Installment Automobile $1,095 $1,354 $ 1,343 $ in millions $ in millions $303 $335 $449 $494 $537 $154 $177 $210 $236 $250 $175 $219 $288 $366 $392 $245 $216 $284 $319 $269 $218 $378 $264 $205 $143 $0 $200 $400 $600 $800 $1,000 $1,200 $1,400 $1,600 $1,800 2016 2019 2020 2021 2022Q3 Noninterest Bearing Savings NOW Money Market Time Deposits $1,095 $1,324 $1,621 Source: Company documents. $ 1,392 $ 1,560 $ 1,494 $1,590 |
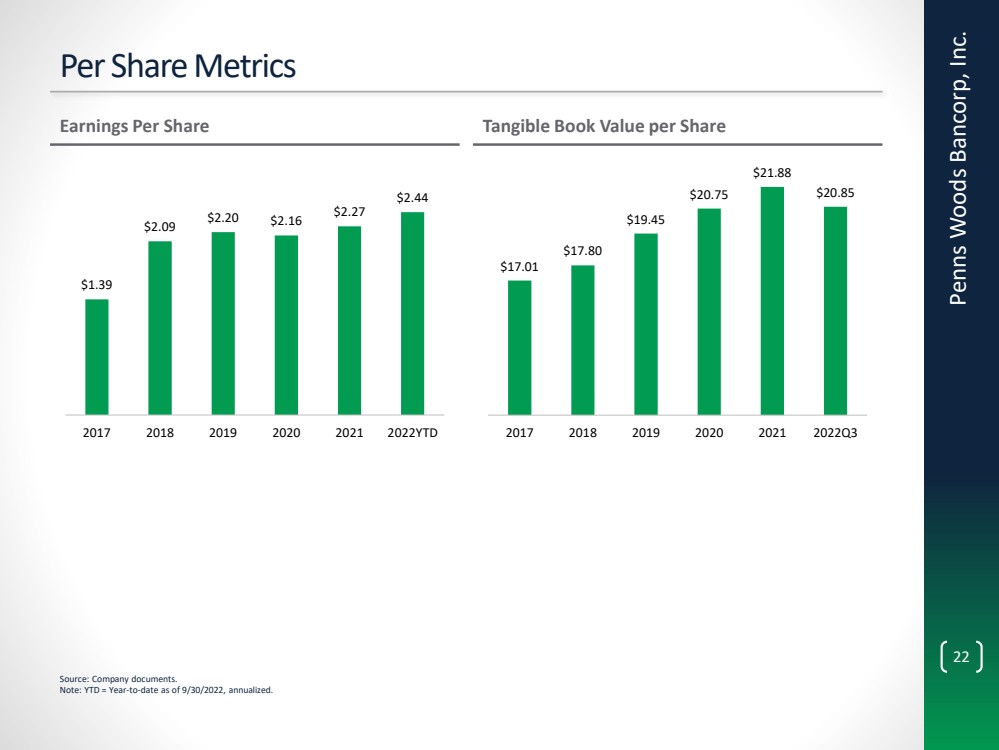
| 22 Per Share Metrics Penns Woods Bancorp, Inc. $1.39 $2.09 $2.20 $2.16 $2.27 $2.44 2017 2018 2019 2020 2021 2022YTD Earnings Per Share Tangible Book Value per Share $17.01 $17.80 $19.45 $20.75 $21.88 $20.85 2017 2018 2019 2020 2021 2022Q3 Source: Company documents. Note: YTD = Year - to - date as of 9/30/2022, annualized. |
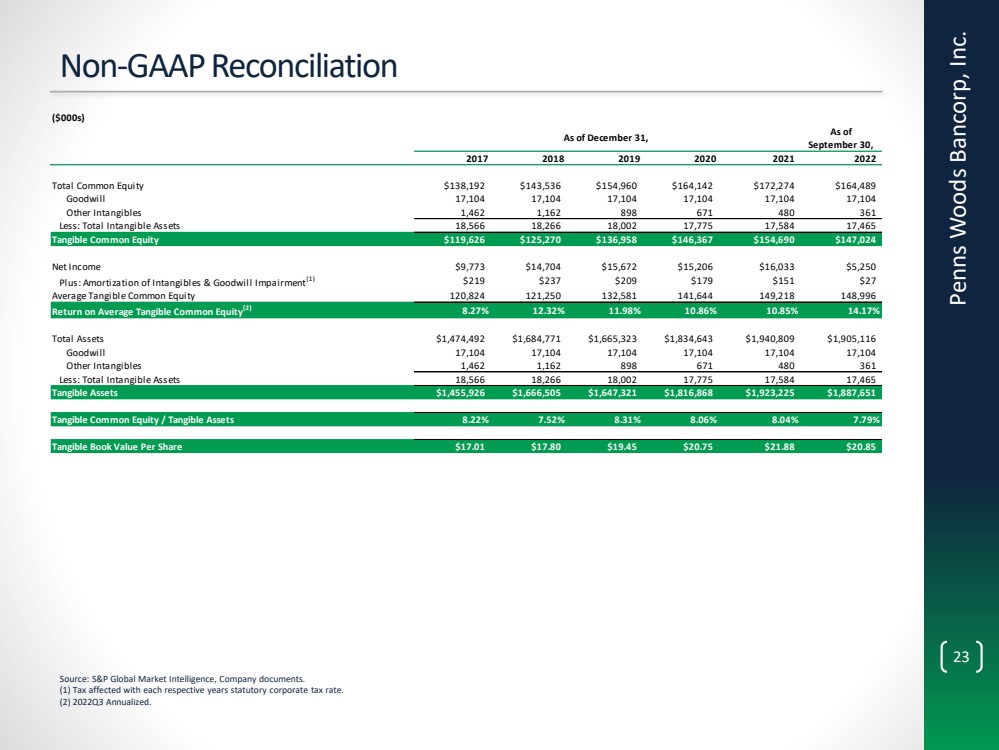
| 23 Non - GAAP Reconciliation Penns Woods Bancorp, Inc. Source: S&P Global Market Intelligence, Company documents. (1) Tax affected with each respective years statutory corporate tax rate. (2) 2022Q3 Annualized. ($000s) As of December 31, As of September 30, 2017 2018 2019 2020 2021 2022 Total Common Equity $138,192 $143,536 $154,960 $164,142 $172,274 $164,489 Goodwill 17,104 17,104 17,104 17,104 17,104 17,104 Other Intangibles 1,462 1,162 898 671 480 361 Less: Total Intangible Assets 18,566 18,266 18,002 17,775 17,584 17,465 Tangible Common Equity $119,626 $125,270 $136,958 $146,367 $154,690 $147,024 Net Income $9,773 $14,704 $15,672 $15,206 $16,033 $5,250 Plus: Amortization of Intangibles & Goodwill Impairment (1) $219 $237 $209 $179 $151 $27 Average Tangible Common Equity 120,824 121,250 132,581 141,644 149,218 148,996 Return on Average Tangible Common Equity (2) 8.27% 12.32% 11.98% 10.86% 10.85% 14.17% Total Assets $1,474,492 $1,684,771 $1,665,323 $1,834,643 $1,940,809 $1,905,116 Goodwill 17,104 17,104 17,104 17,104 17,104 17,104 Other Intangibles 1,462 1,162 898 671 480 361 Less: Total Intangible Assets 18,566 18,266 18,002 17,775 17,584 17,465 Tangible Assets $1,455,926 $1,666,505 $1,647,321 $1,816,868 $1,923,225 $1,887,651 Tangible Common Equity / Tangible Assets 8.22% 7.52% 8.31% 8.06% 8.04% 7.79% Tangible Book Value Per Share $17.01 $17.80 $19.45 $20.75 $21.88 $20.85 |