2 0 1 7 A N N U A L S T O C K H O L D E R S M E E T I N G November 7, 2017
Our comments today may contain forward - looking statements and management may make additional forward - looking statements in response to your questions . Such written and oral disclosures are made pursuant to the Safe Harbor provision of the Private Securities Litigation Reform Act of 1995 . Although we believe our expectations expressed in such forward looking statements are reasonable, we cannot assure you that they will be realized . Investors are cautioned that such forward - looking statements involve risks and uncertainties that could cause actual results to differ materially from the anticipated results, and therefore we refer you to a more detailed discussion of the risks and uncertainties in the Company’ s filings with the Securities & Exchange Commission . SAFE HARBOR STATEMENT 2
We use EBITDA in the evaluation of our Company’s performance since we believe that EBITDA provides a useful measure of financial performance and value . We believe this principally for the following reasons : We believe that EBITDA is an accepted industry - wide comparative measure of financial performance . It is, in our experience, a measure commonly adopted by analysts and financial commentators who report upon the cinema exhibition and real estate industries, and it is also a measure used by financial institutions in underwriting the creditworthiness of companies in these industries . Accordingly, our management monitors this calculation as a method of judging our performance against our peers, market expectations and our creditworthiness . It is widely accepted that analysts, financial commentators and persons active in the cinema exhibition and real estate industries typically value enterprises engaged in these businesses at various multiples of EBITDA . Accordingly, we find EBITDA valuable as an indicator of the underlying value of our businesses . We expect that investors may use EBITDA to judge our ability to generate cash, as a basis of comparison to other companies engaged in the cinema exhibition and real estate businesses and as a basis to value our company against such other companies . EBITDA is not a measurement of financial performance under generally accepted accounting principles in the United States of America and it should not be considered in isolation or construed as a substitute for net income or other operations data or cash flow data prepared in accordance with generally accepted accounting principles in the United States for purposes of analyzing our profitability . The exclusion of various components, such as interest, taxes, depreciation and amortization, limits the usefulness of these measures when assessing our financial performance, as not all funds depicted by EBITDA are available for management’ s discretionary use . For example, a substantial portion of such funds may be subject to contractual restrictions and functional requirements to service debt, to fund necessary capital expenditures and to meet other commitments from time to time . EBIT and EBITDA also fail to take into account the cost of interest and taxes . Interest is clearly a real cost that for us is paid periodically as accrued . Taxes may or may not be a current cash item but are nevertheless real costs that, in most situations, must eventually be paid . A company that realizes taxable earnings in high tax jurisdictions may, ultimately, be less valuable than a company that realizes the same amount of taxable earnings in a low tax jurisdiction . EBITDA fails to take into account the cost of depreciation and amortization and the fact that assets will eventually wear out and have to be replaced . In this presentation, we also use an industry accepted financial measure called Theater Level Cash Flow, which is theater level revenues less direct theater level expenses . FINANCIAL RECONCILIATIONS 3
B U S I N E S S R E V I E W Ellen Cotter, President & CEO This presentation is intended to summarize the projects on which management is currently working and management's plan for mo vin g our Company forward. Many of the projects are in their early stages and will be subject to various Governmental and Board approvals. Accordingly, no assurances can be given that the plans discussed herein will be achieved. Further, some of the design concepts included in this presentation include proposed architectural renderings that represent w ork s in progress. 4
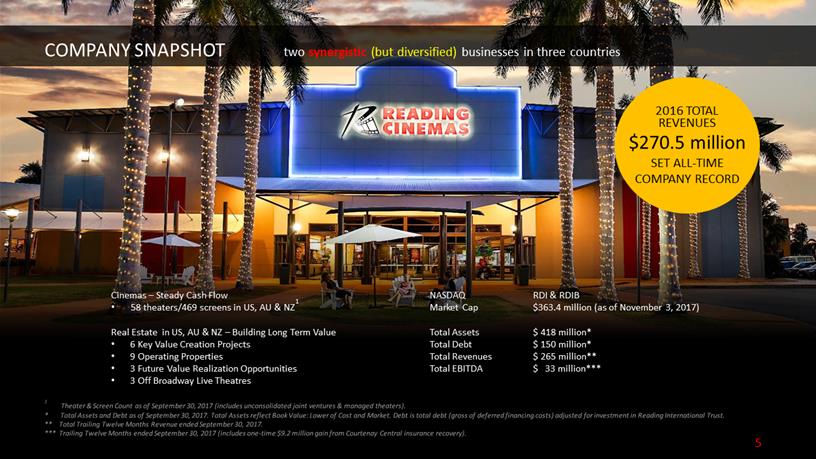
NASDAQ RDI & RDIB Market Cap $363.4 million (as of November 3, 2017) Total Assets $ 418 million* Total Debt $ 150 million* Total Revenues $ 265 million** Total EBITDA $ 33 million*** 5 Cinemas – Steady Cash Flow • 58 theaters/469 screens in US, AU & NZ 1 Real Estate in US, AU & NZ – Building Long Term Value • 6 Key Value Creation Projects • 9 Operating Properties • 3 Future Value Realization Opportunities • 3 Off Broadway Live Theatres 1 Theater & Screen Count as of September 30, 2017 (includes unconsolidated joint ventures & managed theaters). * Total Assets and Debt as of September 30, 2017. Total Assets reflect Book Value: Lower of Cost and Market. Debt is to tal debt (gross of deferred financing costs) adjusted for investment in Reading International Trust. ** Total Trailing Twelve Months Revenue ended September 30, 2017. *** Trailing Twelve Months ended September 30, 2017 (includes one - time $9.2 million gain from Courtenay Central insurance recov ery). 2016 TOTAL REVENUES $270.5 million SET ALL - TIME COMPANY RECORD COMPANY SNAPSHOT two synergistic (but diversified) businesses in three countries
We create long - term stockholder value through the opportunistic and synergistic development of entertainment and real estate assets . This value creation comes from the complementary nature of our existing entertainment and real estate portfolio and the pursuit of new opportunities meeting our investment criteria . Cinemas provide steady cash flow to support our real estate development, while our real estate work allows us to create a strong property portfolio that will withstand the test of time . As an anchor tenant in our own Entertainment Themed Centers, we control the entire property and can effectively leverage, not only operational strategies, but also marketing strategies anchored by engaging social/digital media content . These synergies allow us to drive growth, thereby creating a win - win for Reading (as both landlord and tenant), for our third party tenants, and ultimately, for our stockholders . Our synergistic mission provides investors diversification through two businesses operating in three stable economies . OUR SYNERGISTIC MISSION we’re in SYNC
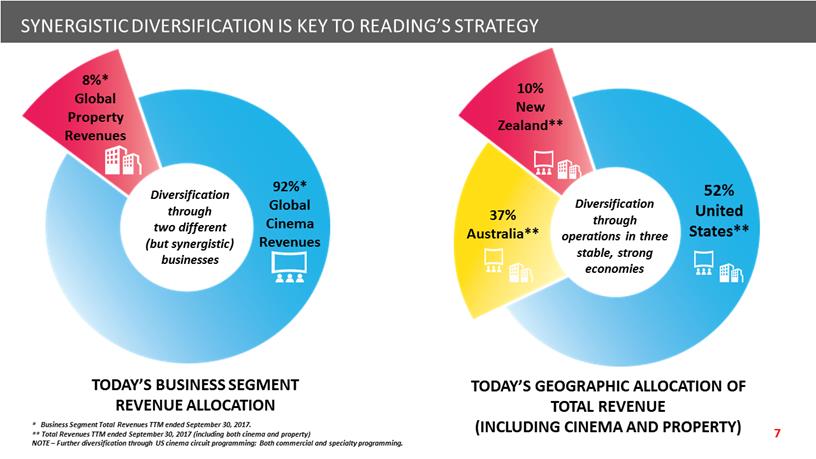
TODAY’S BUSINESS SEGMENT REVENUE ALLOCATION TODAY’S GEOGRAPHIC ALLOCATION OF TOTAL REVENUE (INCLUDING CINEMA AND PROPERTY) 8%* Global Property Revenues 92%* Global Cinema Revenues Diversification through two different (but synergistic) businesses 10% New Zealand** 52% United States** 37% Australia** Diversification through operations in three stable, strong economies SYNERGISTIC DIVERSIFICATION IS KEY TO READING’S STRATEGY * Business Segment Total Revenues TTM ended September 30, 2017. ** Total Revenues TTM ended September 30, 2017 (including both cinema and property) NOTE – Further diversification through US cinema circuit programming: Both commercial and specialty programming.
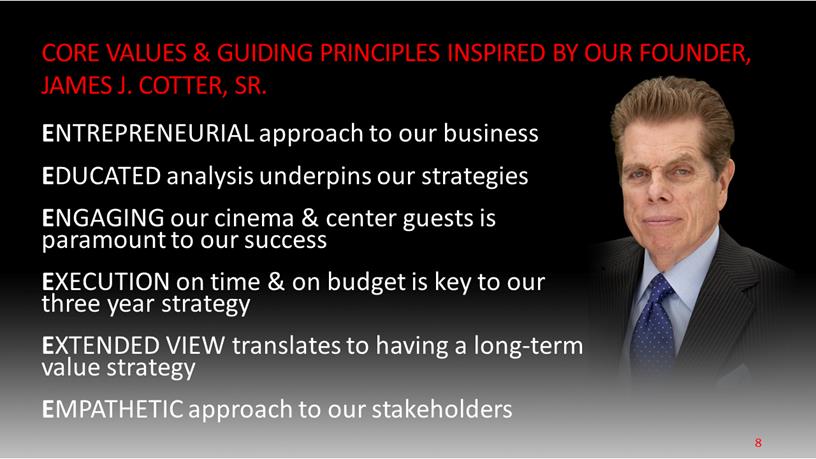
ENTREPRENEURIAL approach to our business EDUCATED analysis underpins our strategies ENGAGING our cinema & center guests is paramount to our success EXECUTION on time & on budget is key to our three year strategy EXTENDED VIEW translates to having a long - term value strategy EMPATHETIC approach to our stakeholders CORE VALUES & GUIDING PRINCIPLES INSPIRED BY OUR FOUNDER, JAMES J. COTTER, SR. 8
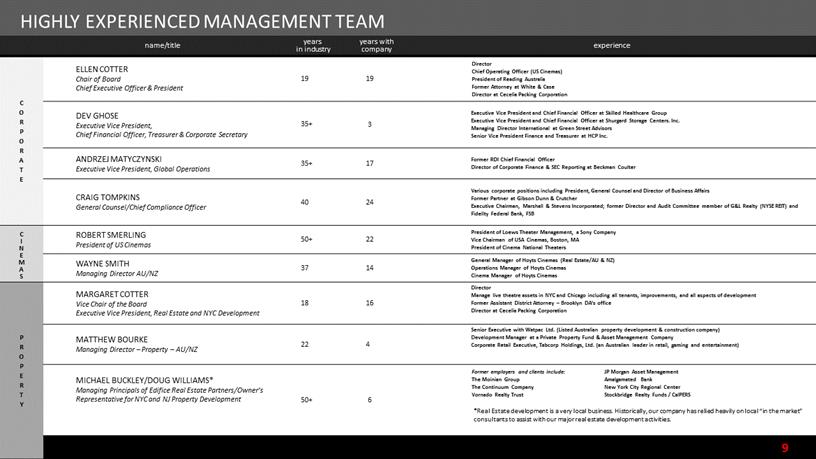
name/title years in industry years with company experience C O R P O R A T E ELLEN COTTER Chair of Board Chief Executive Officer & President 19 19 DEV GHOSE Executive Vice President, Chief Financial Officer, Treasurer & Corporate Secretary 35+ 3 Executive Vice President and Chief Financial Officer at Skilled Healthcare Group Executive Vice President and Chief Financial Officer at Shurgard Storage Centers. Inc. Managing Director International at Green Street Advisors Senior Vice President Finance and Treasurer at HCP Inc. ANDRZEJ MATYCZYNSKI Executive Vice President, Global Operations 35+ 17 Former RDI Chief Financial Officer Director of Corporate Finance & SEC Reporting at Beckman Coulter CRAIG TOMPKINS General Counsel/Chief Compliance Officer 40 24 Various corporate positions including President, General Counsel and Director of Business Affairs Former Partner at Gibson Dunn & Crutcher Executive Chairman, Marshall & Stevens Incorporated; former Director and Audit Committee member of G&L Realty (NYSE REIT) and Fidelity Federal Bank, FSB C I N E M A S ROBERT SMERLING President of US Cinemas 50+ 22 President of Loews Theater Management, a Sony Company Vice Chairman of USA Cinemas, Boston, MA President of Cinema National Theaters WAYNE SMITH Managing Director AU/NZ 37 14 General Manager of Hoyts Cinemas (Real Estate/AU & NZ) Operations Manager of Hoyts Cinemas Cinema Manager of Hoyts Cinemas P R O P E R T Y MARGARET COTTER Vice Chair of the Board Executive Vice President, Real Estate and NYC Development 18 16 Director Manage live theatre assets in NYC and Chicago including all tenants, improvements, and all aspects of development Former Assistant District Attorney – Brooklyn DA’s office Director at Cecelia Packing Corporation MATTHEW BOURKE Managing Director – Property – AU/NZ 22 4 Senior Executive with Watpac Ltd. (Listed Australian property development & construction company) Development Manager at a Private Property Fund & Asset Management Company Corporate Retail Executive, Tabcorp Holdings, Ltd. (an Australian leader in retail, gaming and entertainment ) MICHAEL BUCKLEY/DOUG WILLIAMS* Managing Principals of Edifice Real Estate Partners/Owner’s Representative for NYC and NJ Property Development 50+ 6 Former employers and clients include: The Moinian Group The Continuum Company Vornado Realty Trust JP Morgan Asset Management Amalgamated Bank New York City Regional Center Stockbridge Realty Funds / CalPERS Director Chief Operating Officer (US Cinemas) President of Reading Australia Former Attorney at White & Case Director at Cecelia Packing Corporation *Real Estate development is a very local business. Historically, our company has relied heavily on local “in the market” consultants to assist with our major real estate development activities. HIGHLY EXPERIENCED MANAGEMENT TEAM
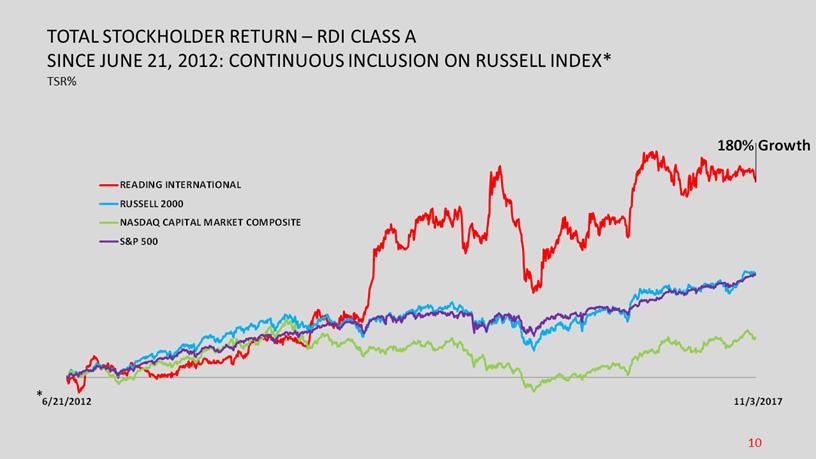
READING INTERNATIONAL RUSSELL 2000NASDAQ CAPITAL MARKET COMPOSITE S&P 500 180% Growth 6/21/2012 11/3/2017 TOTAL STOCKHOLDER RETURN – RDI CLASS A SINCE JUNE 21, 2012: CONTINUOUS INCLUSION ON RUSSELL INDEX* TSR% * 10
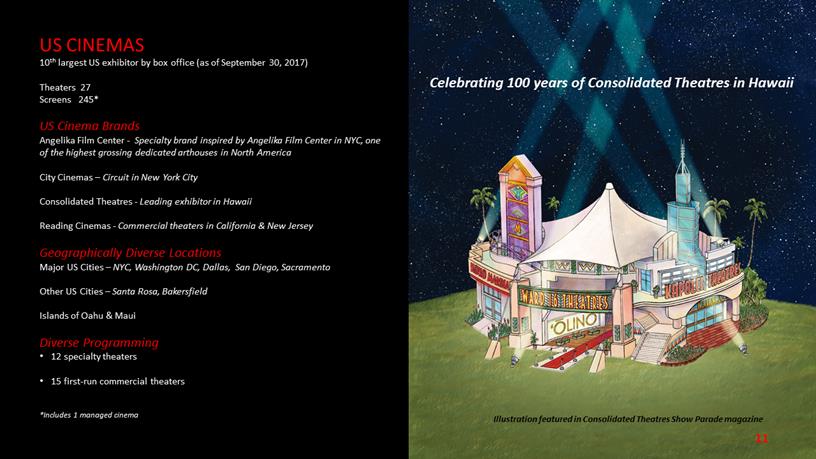
US CINEMAS 10 th largest US exhibitor by box office (as of September 30, 2017) Theaters 27 Screens 245* US Cinema Brands Angelika Film Center - Specialty brand inspired by Angelika Film Center in NYC, one of the highest grossing dedicated arthouses in North America City Cinemas – Circuit in New York City Consolidated Theatres - Leading exhibitor in Hawaii Reading Cinemas - Commercial theaters in California & New Jersey Geographically Diverse Locations Major US Cities – NYC, Washington DC, Dallas, San Diego, Sacramento Other US Cities – Santa Rosa, Bakersfield Islands of Oahu & Maui Diverse Programming • 12 specialty theaters • 15 first - run commercial theaters *Includes 1 managed cinema Illustration featured in Consolidated Theatres Show Parade magazine Celebrating 100 years of Consolidated Theatres in Hawaii
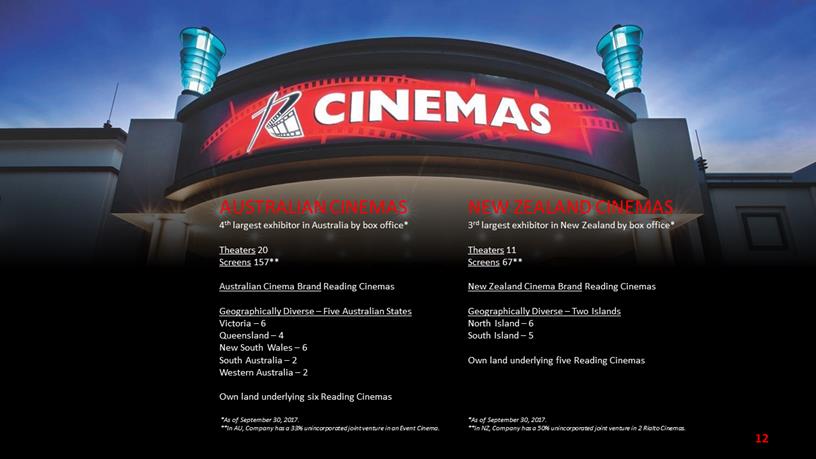
AUSTRALIAN CINEMAS 4 th largest exhibitor in Australia by box office* Theaters 20 Screens 157 ** Australian Cinema Brand Reading Cinemas Geographically Diverse – Five Australian States Victoria – 6 Queensland – 4 New South Wales – 6 South Australia – 2 Western Australia – 2 Own land underlying six Reading Cinemas NEW ZEALAND CINEMAS 3 rd largest exhibitor in New Zealand by box office* Theaters 11 Screens 67 ** New Zealand Cinema Brand Reading Cinemas Geographically Diverse – Two Islands North Island – 6 South Island – 5 Own land underlying five Reading Cinemas *As of September 30, 2017. **In NZ, Company has a 50% unincorporated joint venture in 2 Rialto Cinemas. *As of September 30, 2017. **In AU, Company has a 33% unincorporated joint venture in an Event Cinema.
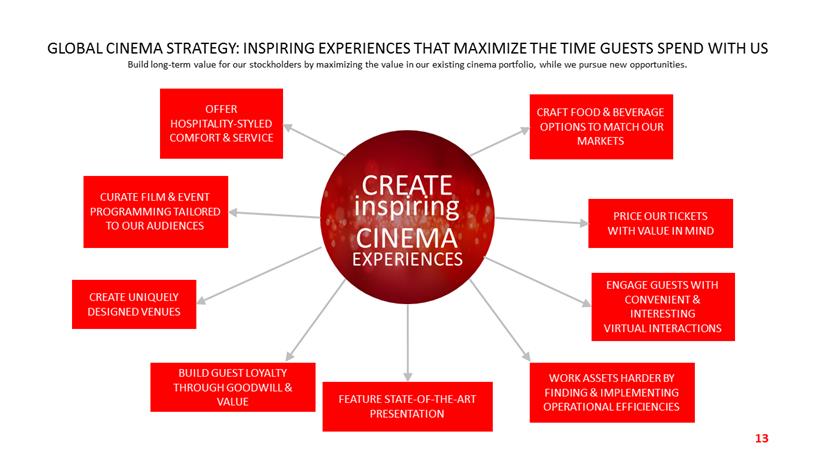
GLOBAL CINEMA STRATEGY: INSPIRING EXPERIENCES THAT MAXIMIZE THE TIME GUESTS SPEND WITH US Build long - term value for our stockholders by maximizing the value in our existing cinema portfolio, while we pursue new opportunities. CREATE inspiring CINEMA EXPERIENCES FEATURE STATE - OF - THE - ART PRESENTATION CRAFT FOOD & BEVERAGE OPTIONS TO MATCH OUR MARKETS PRICE OUR TICKETS WITH VALUE IN MIND CREATE UNIQUELY DESIGNED VENUES ENGAGE GUESTS WITH CONVENIENT & INTERESTING VIRTUAL INTERACTIONS CURATE FILM & EVENT PROGRAMMING TAILORED TO OUR AUDIENCES OFFER HOSPITALITY - STYLED COMFORT & SERVICE BUILD GUEST LOYALTY THROUGH GOODWILL & VALUE WORK ASSETS HARDER BY FINDING & IMPLEMENTING OPERATIONAL EFFICIENCIES
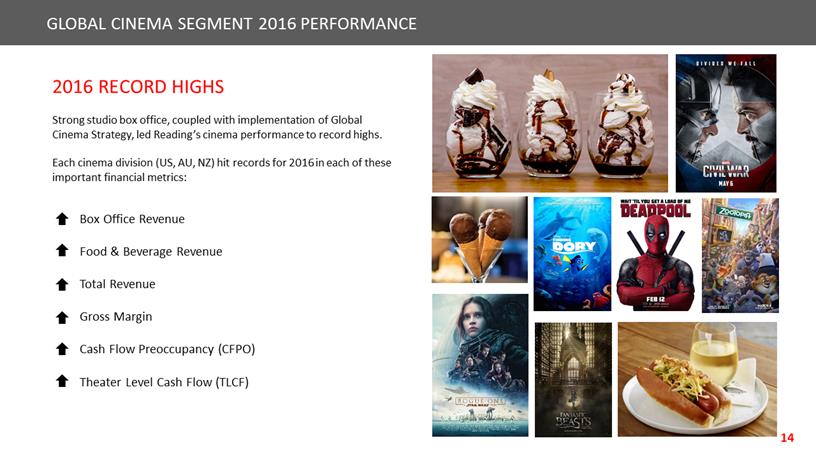
2016 RECORD HIGHS Strong studio box office, coupled with implementation of Global Cinema Strategy, led Reading’s cinema performance to record highs. Each cinema division (US, AU, NZ) hit records for 2016 in each of these important financial metrics: Box Office Revenue Food & Beverage Revenue Total Revenue Gross Margin Cash Flow Preoccupancy (CFPO) Theater Level Cash Flow (TLCF) GLOBAL CINEMA SEGMENT 2016 PERFORMANCE
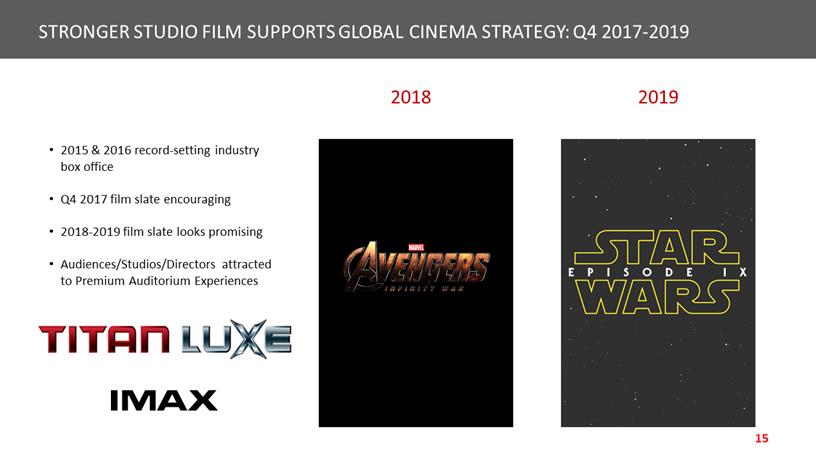
• 2015 & 2016 record - setting industry box office • Q4 2017 film slate encouraging • 2018 - 2019 film slate looks promising • Audiences/Studios/Directors attracted to Premium Auditorium Experiences STRONGER STUDIO FILM SUPPORTS GLOBAL CINEMA STRATEGY: Q4 2017 - 2019 2019 2018
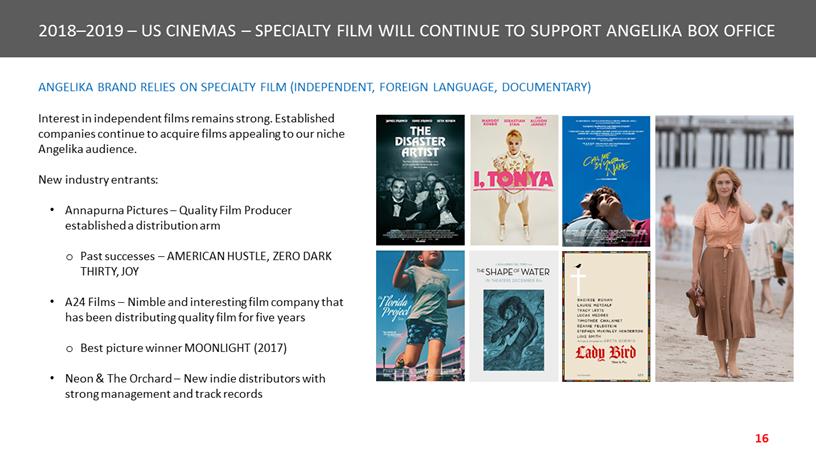
ANGELIKA BRAND RELIES ON SPECIALTY FILM (INDEPENDENT, FOREIGN LA NGUAGE, DOCUMENTARY) 2018 – 2019 – US CINEMAS – SPECIALTY FILM WILL CONTINUE TO SUPPORT ANGELIKA BOX OFFICE Interest in independent films remains strong. Established companies continue to acquire films appealing to our niche Angelika audience. New industry entrants: • Annapurna Pictures – Quality Film Producer established a distribution arm o Past successes – AMERICAN HUSTLE, ZERO DARK THIRTY, JOY • A24 Films – Nimble and interesting film company that has been distributing quality film for five years o Best picture winner MOONLIGHT (2017) • Neon & The Orchard – New indie distributors with strong management and track records
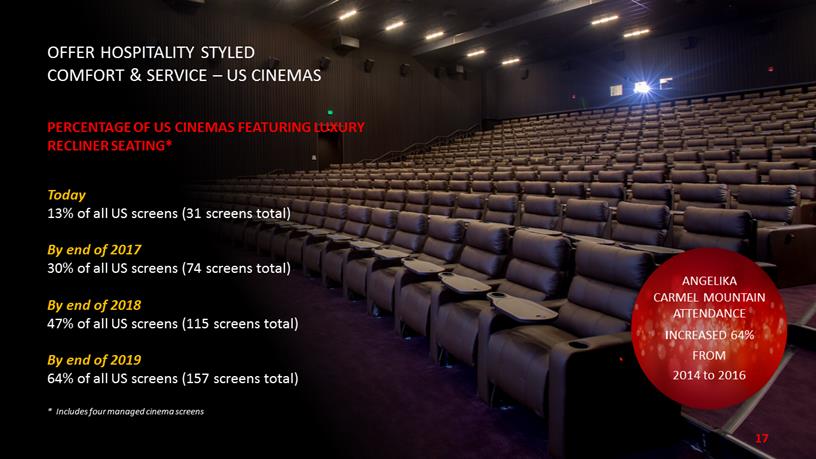
OFFER HOSPITALITY STYLED COMFORT & SERVICE – US CINEMAS PERCENTAGE OF US CINEMAS FEATURING LUXURY RECLINER SEATING* Today 13% of all US screens (31 screens total) By end of 2017 30% of all US screens (74 screens total) By end of 2018 47% of all US screens (115 screens total) By end of 2019 64% of all US screens (157 screens total) * Includes four managed cinema screens ANGELIKA CARMEL MOUNTAIN ATTENDANCE INCREASED 64% FROM 2014 to 2016
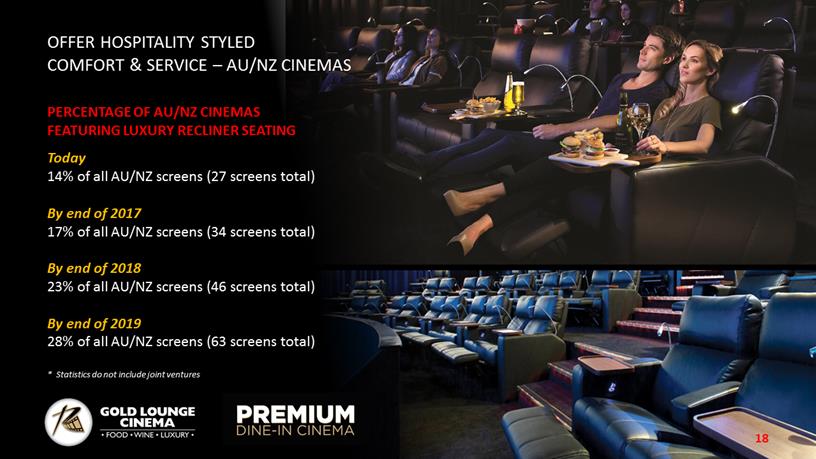
OFFER HOSPITALITY STYLED COMFORT & SERVICE – AU/NZ CINEMAS Today 14% of all AU/NZ screens (27 screens total) By end of 2017 17% of all AU/NZ screens (34 screens total) By end of 2018 23% of all AU/NZ screens (46 screens total) By end of 2019 28% of all AU/NZ screens (63 screens total) * Statistics do not include joint ventures PERCENTAGE OF AU/NZ CINEMAS FEATURING LUXURY RECLINER SEATING

STATE - OF - THE - ART PRESENTATION DRIVES READING BOX OFFICE % of Cinemas with at least one Premium Screen Today 24% of all cinemas* 15% in US 32% in AU/NZ By end of 2017 29% of all cinemas* 22% in US 34% in AU/NZ By end of 2018 36% of all cinemas* 30% in US 41% in AU/NZ By end of 2019 41% of all cinemas* 33% in US 47% in AU/NZ Today, one US cinema features IMAX. Exploring other US locations. * US Cinemas statistics includes one managed cinema; AU and NZ statistics do not include joint ventures
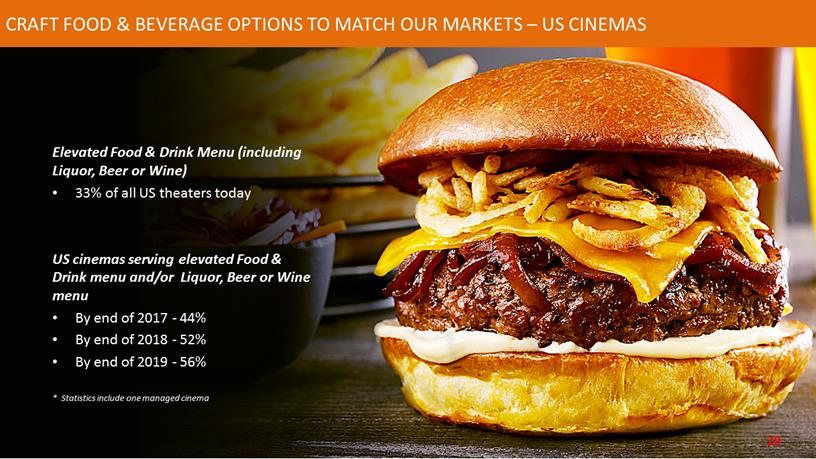
Elevated Food & Drink Menu (including Liquor, Beer or Wine) • 33% of all US theaters today US cinemas serving elevated Food & Drink menu and/or Liquor, Beer or Wine menu • By end of 2017 - 44% • By end of 2018 - 52% • By end of 2019 - 56% * Statistics include one managed cinema CRAFT FOOD & BEVERAGE OPTIONS TO MATCH OUR MARKETS – US CINEMAS
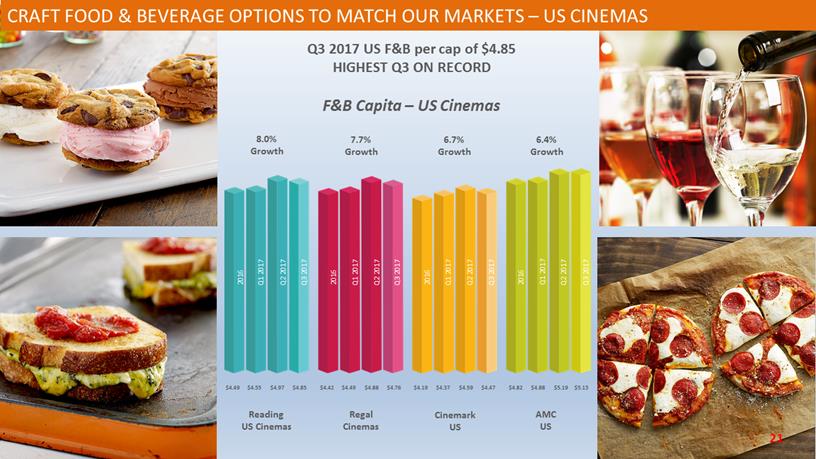
CRAFT FOOD & BEVERAGE OPTIONS TO MATCH OUR MARKETS – US CINEMAS F&B Capita – US Cinemas 8.0% Growth 7.7% Growth 6.7% Growth 6.4% Growth Reading US Cinemas Regal Cinemas Cinemark US AMC US Q3 2017 Q2 2017 Q1 2017 2016 Q3 2017 Q2 2017 Q1 2017 2016 Q3 2017 Q2 2017 Q1 2017 2016 Q2 2017 Q1 2017 2016 $4.49 $4.55 $4.97 $4.85 $4.42 $4.49 $4.88 $4.76 $4.19 $4.37 $4.59 $4.47 $4.82 $4.88 $5.19 $5.13 Q3 2017 Q3 2017 US F&B per cap of $4.85 HIGHEST Q3 ON RECORD
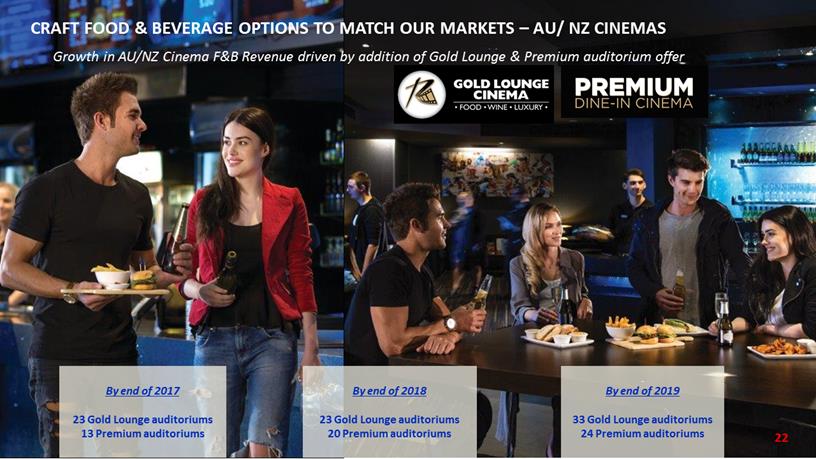
CRAFT FOOD & BEVERAGE OPTIONS TO MATCH OUR MARKETS – AU/ NZ CINEMAS By end of 2017 23 Gold Lounge auditoriums 13 Premium auditoriums By end of 2019 33 Gold Lounge auditoriums 24 Premium auditoriums By end of 2018 23 Gold Lounge auditoriums 20 Premium auditoriums Growth in AU/NZ Cinema F&B Revenue driven by addition of Gold Lounge & Premium auditorium offer
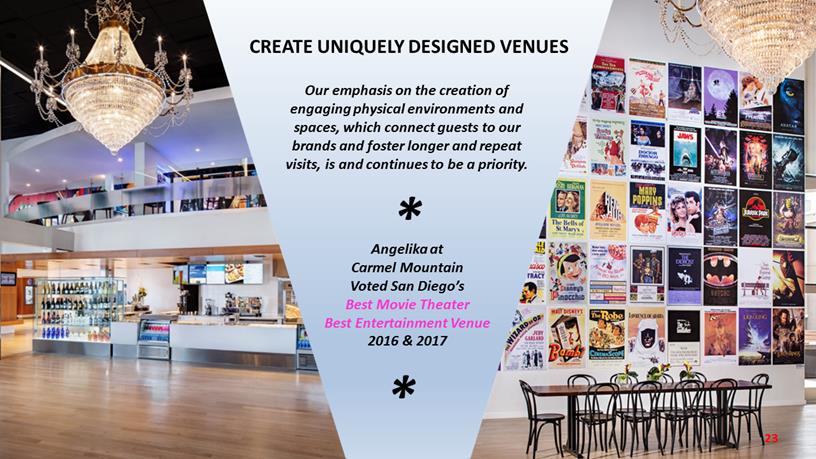
CREATE UNIQUELY DESIGNED VENUES Angelika at Carmel Mountain Voted San Diego’s Best Movie Theater Best Entertainment Venue 2016 & 2017 Our emphasis on the creation of engaging physical environments and spaces, which connect guests to our brands and foster longer and repeat visits, is and continues to be a priority.
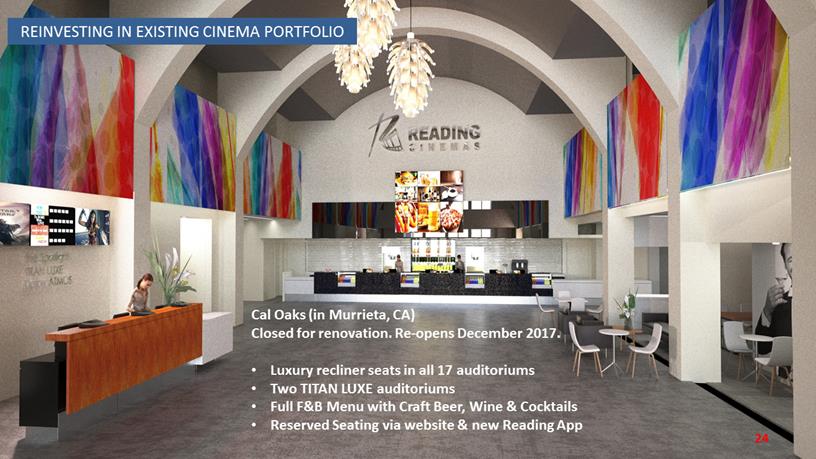
REINVESTING IN EXISTING CINEMA PORTFOLIO Cal Oaks (in Murrieta, CA) Closed for renovation. Re - opens December 2017. • Luxury recliner seats in all 17 auditoriums • Two TITAN LUXE auditoriums • Full F&B Menu with Craft Beer, Wine & Cocktails • Reserved Seating via website & new Reading App
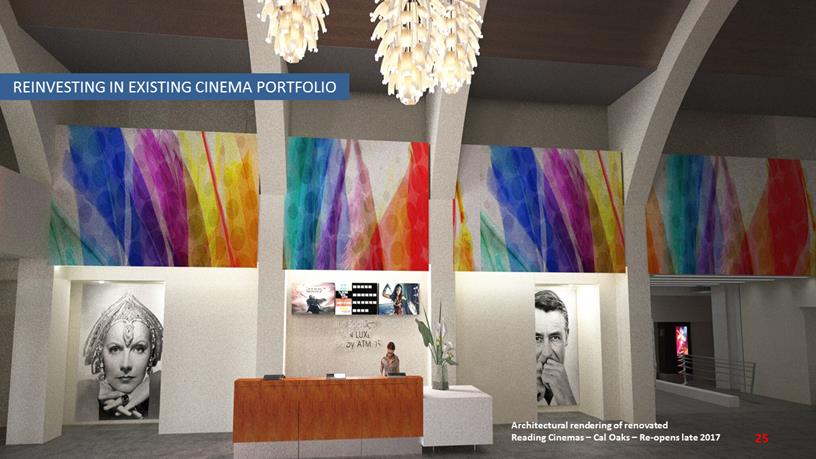
Architectural rendering of renovated Reading Cinemas – Cal Oaks – Re - opens late 2017 REINVESTING IN EXISTING CINEMA PORTFOLIO
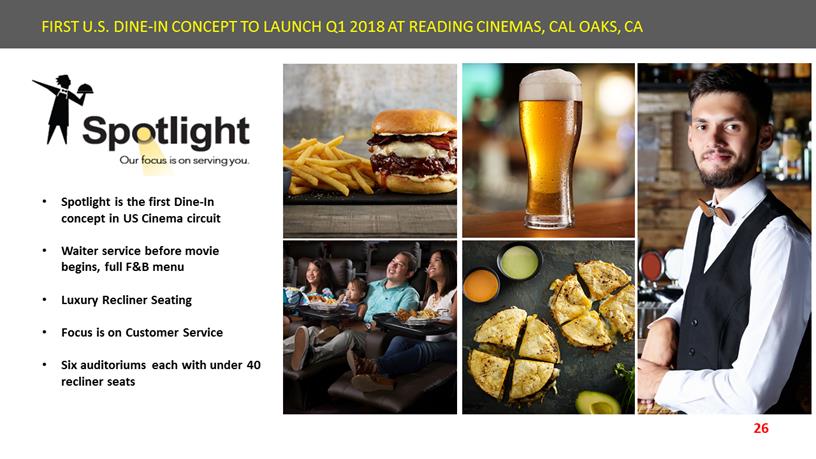
26 • Spotlight is the first Dine - In concept in US Cinema circuit • Waiter service before movie begins, full F&B menu • Luxury Recliner Seating • Focus is on Customer Service • Six auditoriums each with under 40 recliner seats FIRST U.S. DINE - IN CONCEPT TO LAUNCH Q1 2018 AT READING CINEMAS, CAL OAKS, CA 44A5BF75-D41E-48AB-A035-AF32F0B36C2B@kino
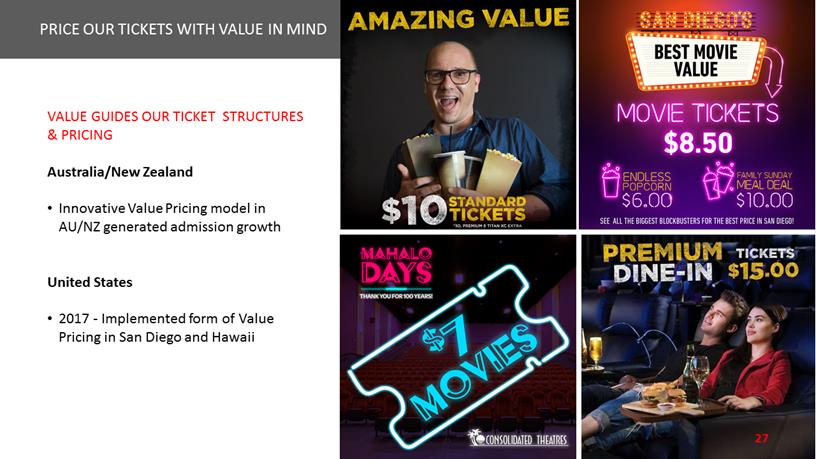
PRICE OUR TICKETS WITH VALUE IN MIND VALUE GUIDES OUR TICKET STRUCTURES & PRICING Australia/New Zealand • Innovative Value Pricing model in AU/NZ generated admission growth United States • 2017 - Implemented form of Value Pricing in San Diego and Hawaii

ENGAGE GUESTS WITH CONVENIENT DIGITAL CHANNELS • Increase Online Convenience Fee Revenue o 2016 – Generated US$1.9 million globally o TTM 2017 – Online convenience fee revenue – US$2.6 million • Ticketing Apps o Consolidated Theatres ticketing app launched Q3 2017 o Other US branded ticketing apps to launch by end Q4 2017 o Angelika Film Center o City Cinemas o Reading Cinemas o Launch AU/NZ branded ticketing apps by Q2 2018 • Increase Sales of Gift Cards online o Implement sales of online Gift Cards in US by Q4 2017
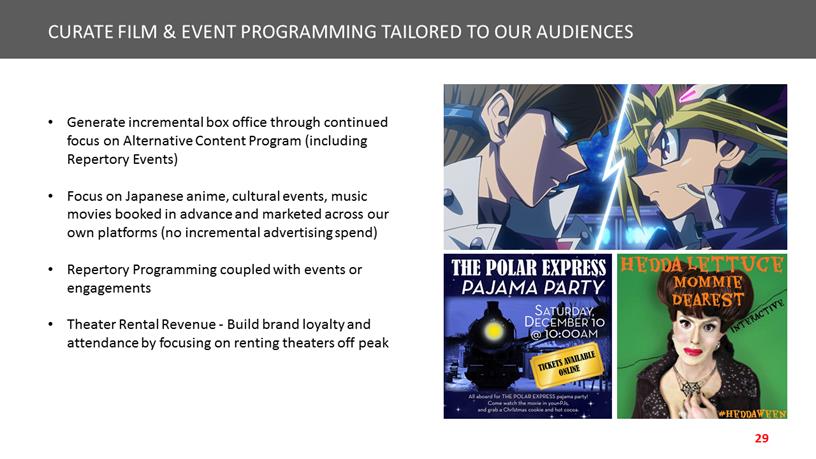
• Generate incremental box office through continued focus on Alternative Content Program (including Repertory Events) • Focus on Japanese anime, cultural events, music movies booked in advance and marketed across our own platforms (no incremental advertising spend) • Repertory Programming coupled with events or engagements • Theater Rental Revenue - Build brand loyalty and attendance by focusing on renting theaters off peak CURATE FILM & EVENT PROGRAMMING TAILORED TO OUR AUDIENCES

CONTINUE DISCIPLINED APPROACH TO PURSUING NEW OPPORTUNITIES Today, our Board of Directors has approved five new Reading Cinemas (34 new screens) to be built in AU/NZ. And, we continue to explore new build opportunities in AU/NZ. • Newmarket Village (8 screens, 2 Gold Lounge auditoriums, TITAN LUXE) – Opens December 2017 • Traralgon, outside of Melbourne (5 screens with 2 Premium auditoriums) – Expected to open 2019 • South City, Brisbane (8 screens with 3 Gold Lounge auditoriums) – Expected to open 2020 • Two additional Reading Cinemas in AU and NZ with 14 screens – Expected to open 2019/2020 Expansion of Angelika Film Center brand is current focus in the US.
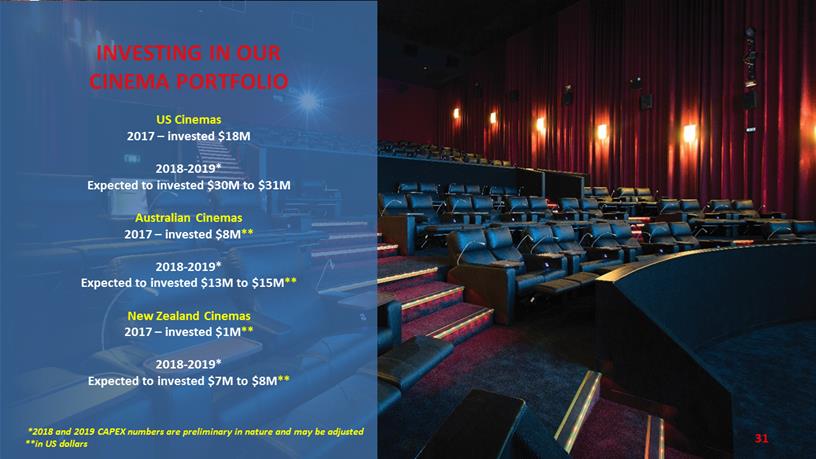
INVESTING IN OUR CINEMA PORTFOLIO US Cinemas 2017 – invested $18M 2018 - 2019* Expected to invested $30M to $31M Australian Cinemas 2017 – invested $8M ** 2018 - 2019* Expected to invested $13M to $15M ** New Zealand Cinemas 2017 – invested $1M ** 2018 - 2019* Expected to invested $7M to $8M ** *2018 and 2019 CAPEX numbers are preliminary in nature and may be adjusted **in US dollars

32 READING PROPERTY READING INTERNATIONAL INC
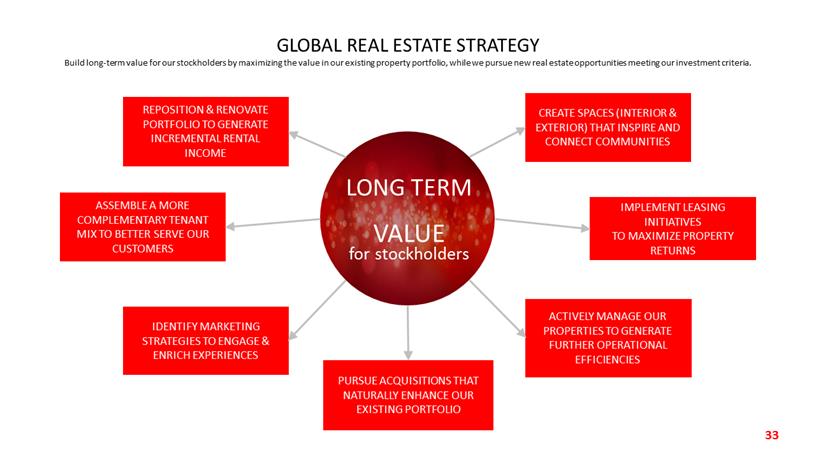
GLOBAL REAL ESTATE STRATEGY Build long - term value for our stockholders by maximizing the value in our existing property portfolio, while we pursue new real estate opportunities meeting our investment criteria. CREATE SPACES (INTERIOR & EXTERIOR) THAT INSPIRE AND CONNECT COMMUNITIES REPOSITION & RENOVATE PORTFOLIO TO GENERATE INCREMENTAL RENTAL INCOME LONG TERM VALUE for stockholders ASSEMBLE A MORE COMPLEMENTARY TENANT MIX TO BETTER SERVE OUR CUSTOMERS IMPLEMENT LEASING INITIATIVES TO MAXIMIZE PROPERTY RETURNS IDENTIFY MARKETING STRATEGIES TO ENGAGE & ENRICH EXPERIENCES ACTIVELY MANAGE OUR PROPERTIES TO GENERATE FURTHER OPERATIONAL EFFICIENCIES PURSUE ACQUISITIONS THAT NATURALLY ENHANCE OUR EXISTING PORTFOLIO
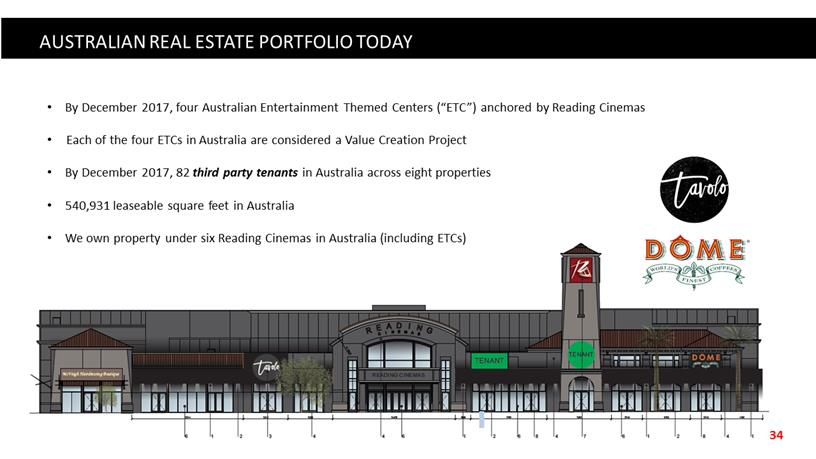
• By December 2017, four Australian Entertainment Themed Centers (“ETC”) anchored by Reading Cinemas • Each of the four ETCs in Australia are considered a Value Creation Project • By December 2017, 82 third party tenants in Australia across eight properties • 540,931 leaseable square feet in Australia • We own property under six Reading Cinemas in Australia (including ETCs) AUSTRALIAN REAL ESTATE PORTFOLIO TODAY
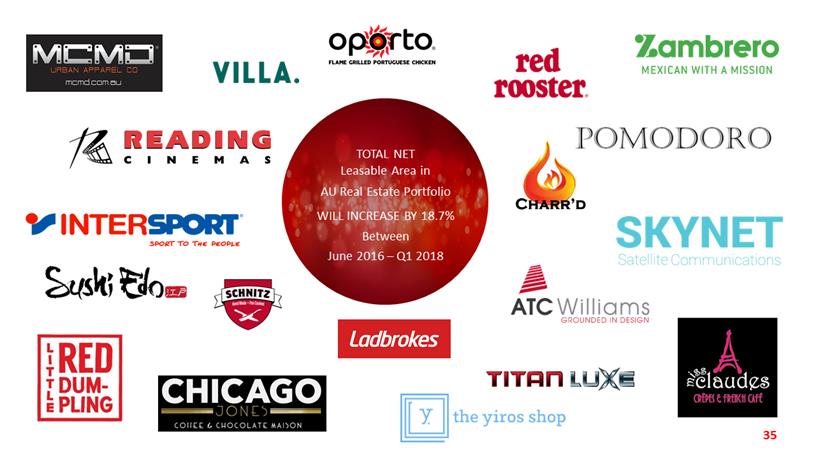
TOTAL NET Leasable Area in AU Real Estate Portfolio WILL INCREASE BY 18.7% Between June 2016 – Q1 2018
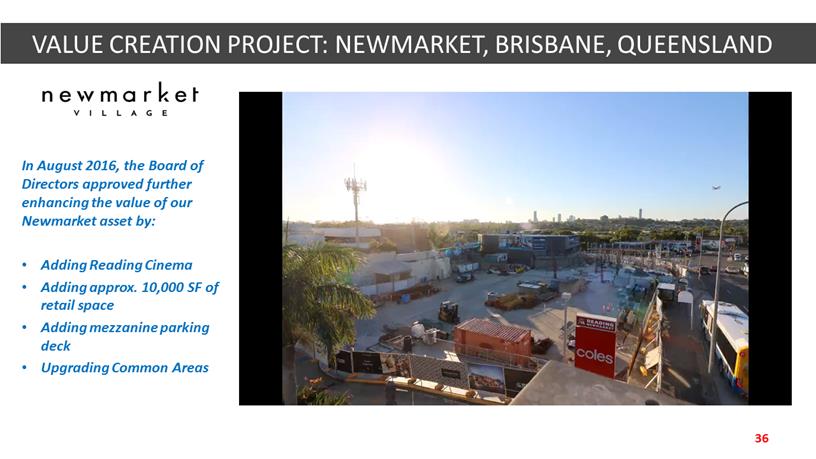
VALUE CREATION PROJECT: NEWMARKET, BRISBANE, QUEENSLAND In August 2016, the Board of Directors approved further enhancing the value of our Newmarket asset by: • Adding Reading Cinema • Adding approx. 10,000 SF of retail space • Adding mezzanine parking deck • Upgrading Common Areas
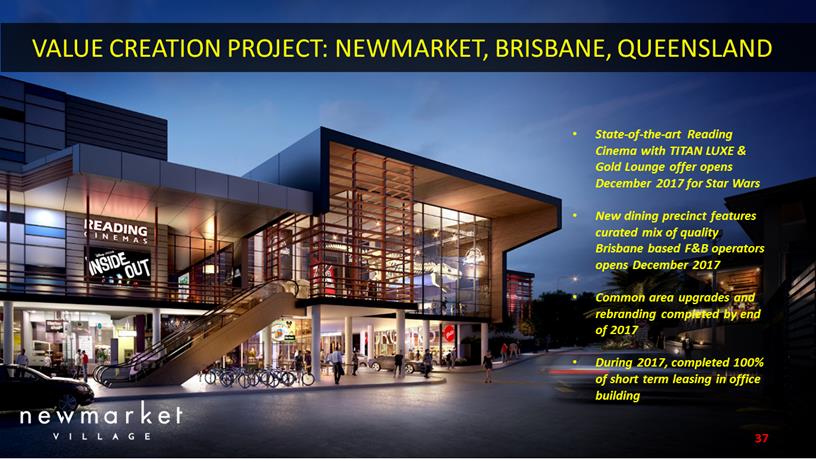
• State - of - the - art Reading Cinema with TITAN LUXE & Gold Lounge offer opens December 2017 for Star Wars • New dining precinct features curated mix of quality Brisbane based F&B operators opens December 2017 • Common area upgrades and rebranding completed by end of 2017 • During 2017, completed 100% of short term leasing in office building VALUE CREATION PROJECT: NEWMARKET, BRISBANE, QUEENSLAND
• Integrated Community - based marketing impactful to date • Recent Fitness Festival included free children’s Yoga Classes and wellness workshops • Newmarket Village improvements lead to stronger lease renewals • Future Growth Opportunity – Office Building at 16 - 20 Edmonstone Street
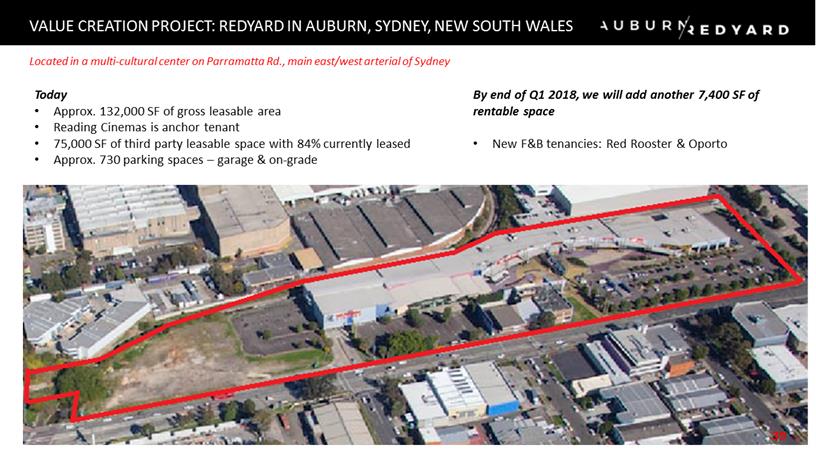
Today • Approx. 132,000 SF of gross leasable area • Reading Cinemas is anchor tenant • 75,000 SF of third party leasable space with 84% currently leased • Approx. 730 parking spaces – garage & on - grade VALUE CREATION PROJECT: REDYARD IN AUBURN, SYDNEY, NEW SOUTH WALES Located in a multi - cultural center on Parramatta Rd., main east/west arterial of Sydney By end of Q1 2018, we will add another 7,400 SF of rentable space • New F&B tenancies: Red Rooster & Oporto
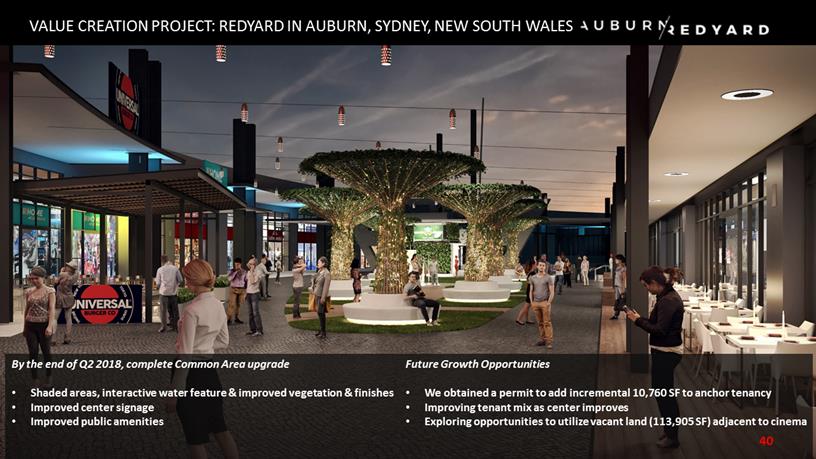
VALUE CREATION PROJECT: REDYARD IN AUBURN, SYDNEY, NEW SOUTH WALES By the end of Q2 2018, complete Common Area upgrade • Shaded areas, interactive water feature & improved vegetation & finishes • Improved center signage • Improved public amenities Future Growth Opportunities • We obtained a permit to add incremental 10,760 SF to anchor tenancy • Improving tenant mix as center improves • Exploring opportunities to utilize vacant land (113,905 SF) adjacent to cinema
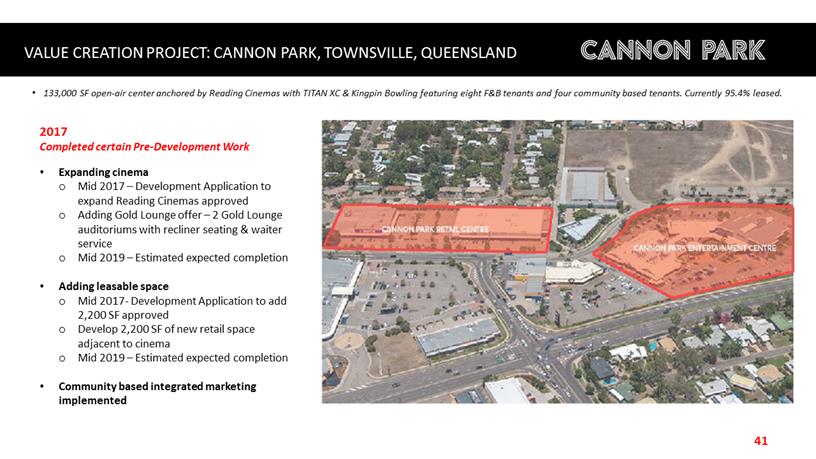
VALUE CREATION PROJECT: CANNON PARK, TOWNSVILLE, QUEENSLAND 2017 Completed certain Pre - Development Work • Expanding cinema o Mid 2017 – Development Application to expand Reading Cinemas approved o Adding Gold Lounge offer – 2 Gold Lounge auditoriums with recliner seating & waiter service o Mid 2019 – Estimated expected completion • Adding leasable space o Mid 2017 - Development Application to add 2,200 SF approved o Develop 2,200 SF of new retail space adjacent to cinema o Mid 2019 – Estimated expected completion • Community based integrated marketing implemented • 133,000 SF open - air center anchored by Reading Cinemas with TITAN XC & Kingpin Bowling featuring eight F&B tenants and four comm unity based tenants. Currently 95.4% leased.
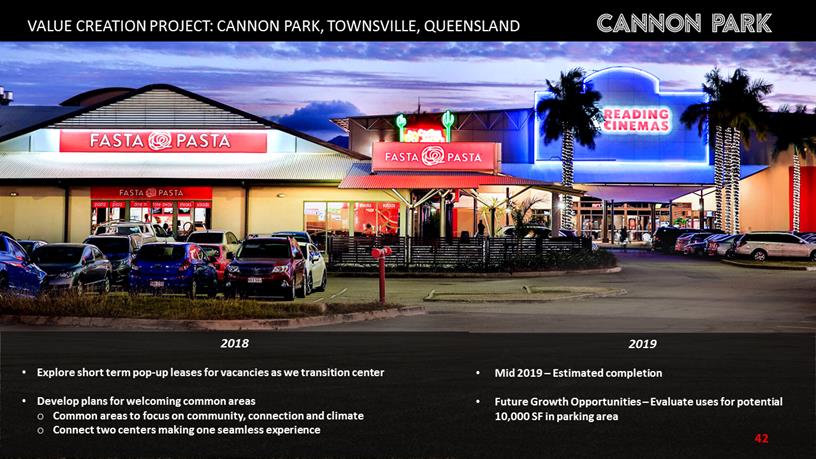
VALUE CREATION PROJECT: CANNON PARK, TOWNSVILLE, QUEENSLAND 2018 • Explore short term pop - up leases for vacancies as we transition center • Develop plans for welcoming common areas o Common areas to focus on community, connection and climate o Connect two centers making one seamless experience 2019 • Mid 2019 – Estimated completion • Future Growth Opportunities – Evaluate uses for potential 10,000 SF in parking area
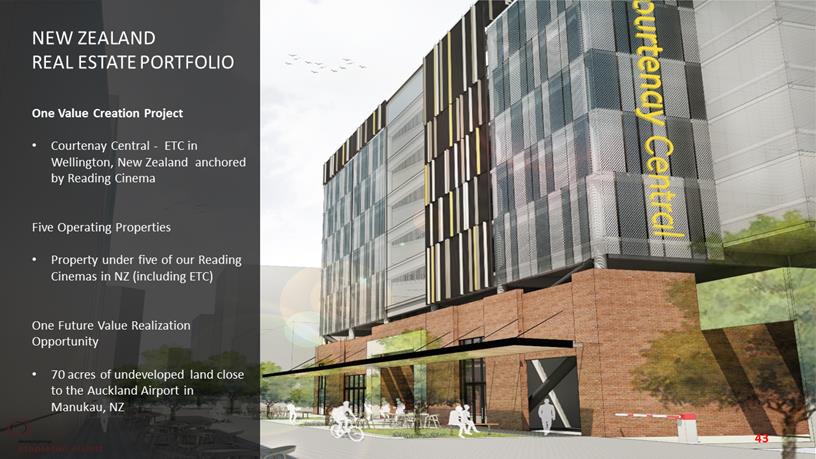
NEW ZEALAND REAL ESTATE PORTFOLIO One Value Creation Project • Courtenay Central - ETC in Wellington, New Zealand anchored by Reading Cinema Five Operating Properties • Property under five of our Reading Cinemas in NZ (including ETC) One Future Value Realization Opportunity • 70 acres of undeveloped land close to the Auckland Airport in Manukau, NZ
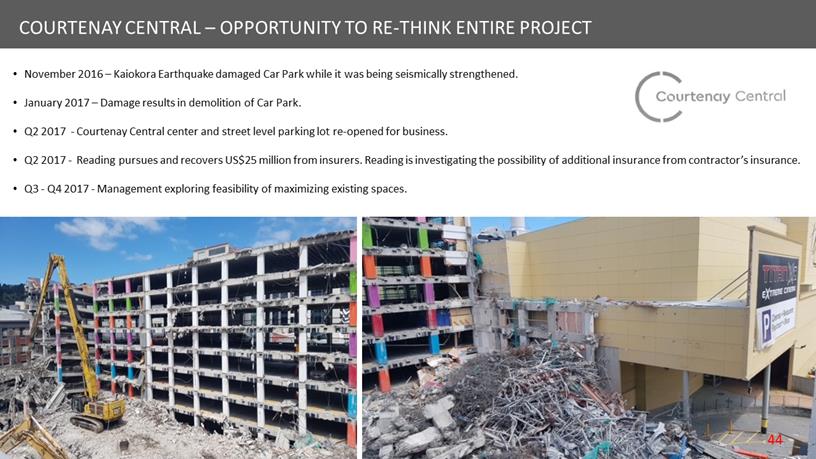
COURTENAY CENTRAL – OPPORTUNITY TO RE - THINK ENTIRE PROJECT • November 2016 – Kaiokora Earthquake damaged Car Park while it was being seismically strengthened. • January 2017 – Damage results in demolition of Car Park. • Q2 2017 - Courtenay Central center and street level parking lot re - opened for business. • Q2 2017 - Reading pursues and recovers US$25 million from insurers. Reading is investigating the possibility of additional insu rance from contractor’s insurance. • Q3 - Q4 2017 - Management exploring feasibility of maximizing existing spaces. 44
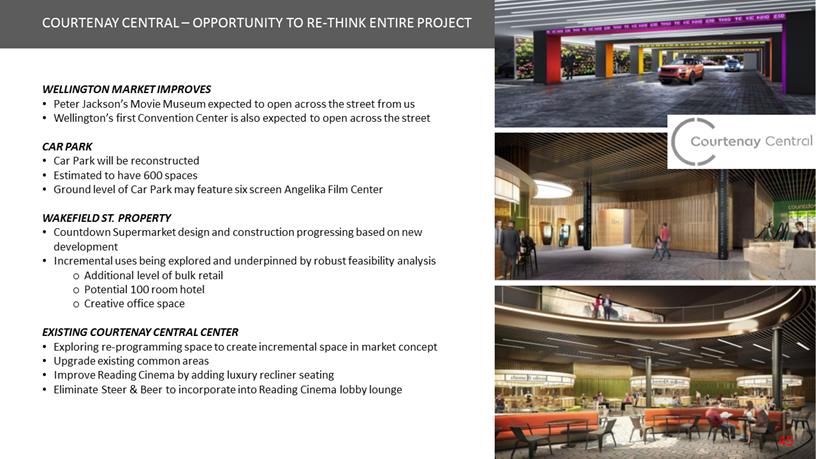
COURTENAY CENTRAL – OPPORTUNITY TO RE - THINK ENTIRE PROJECT WELLINGTON MARKET IMPROVES • Peter Jackson’s Movie Museum expected to open across the street from us • Wellington’s first Convention Center is also expected to open across the street CAR PARK • Car Park will be reconstructed • Estimated to have 600 spaces • Ground level of Car Park may feature six screen Angelika Film Center WAKEFIELD ST. PROPERTY • Countdown Supermarket design and construction progressing based on new development • Incremental uses being explored and underpinned by robust feasibility analysis o Additional level of bulk retail o Potential 100 room hotel o Creative office space EXISTING COURTENAY CENTRAL CENTER • Exploring re - programming space to create incremental space in market concept • Upgrade existing common areas • Improve Reading Cinema by adding luxury recliner seating • Eliminate Steer & Beer to incorporate into Reading Cinema lobby lounge
• Curated mix of local F&B operators – Street food, craft beer & cocktails in pop up environment • Features Wellington's first ever venue dedicated to improv • Features creative pop up retail & community based entertainment • Minimal investment covered by pop up rental income • Keeps space compelling during transition • Generating incremental visits for cinema and parking THE COURTYARD – POP UP CONCEPT KEEPING COURTENAY CENTRAL COMPELLING DURING TRANSITION
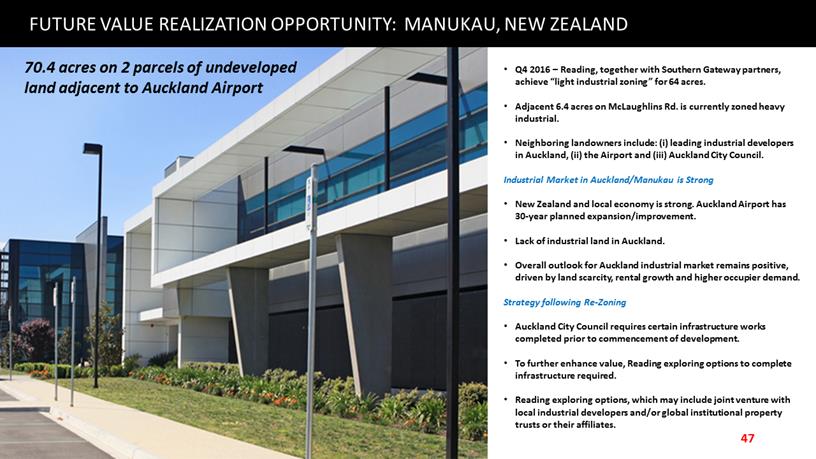
• Q4 2016 – Reading, together with Southern Gateway partners, achieve “light industrial zoning” for 64 acres. • Adjacent 6.4 acres on McLaughlins Rd. is currently zoned heavy industrial. • Neighboring landowners include: (i) leading industrial developers in Auckland, (ii) the Airport and (iii) Auckland City Council. Industrial Market in Auckland/Manukau is Strong • New Zealand and local economy is strong. Auckland Airport has 30 - year planned expansion/improvement. • Lack of industrial land in Auckland. • Overall outlook for Auckland industrial market remains positive, driven by land scarcity, rental growth and higher occupier demand. Strategy following Re - Zoning • Auckland City Council requires certain infrastructure works completed prior to commencement of development. • To further enhance value, Reading exploring options to complete infrastructure required. • Reading exploring options, which may include joint venture with local industrial developers and/or global institutional property trusts or their affiliates. 70.4 acres on 2 parcels of undeveloped land adjacent to Auckland Airport FUTURE VALUE REALIZATION OPPORTUNITY: MANUKAU, NEW ZEALAND
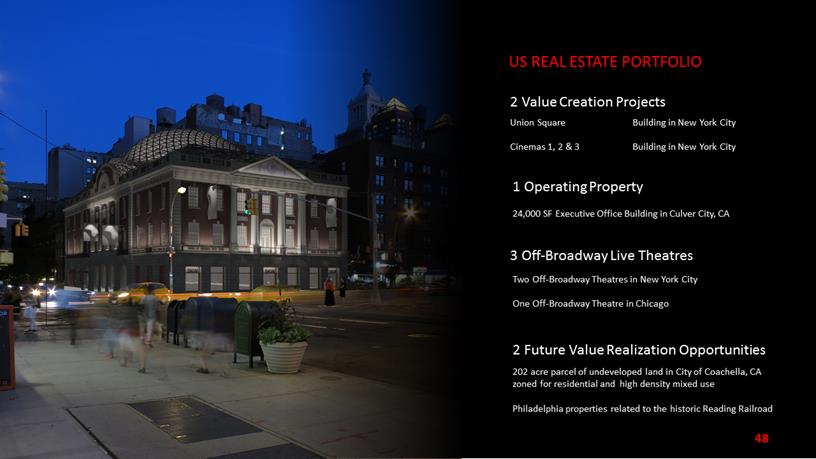
US REAL ESTATE PORTFOLIO Union Square Building in New York City Cinemas 1, 2 & 3 Building in New York City 2 Value Creation Projects 24,000 SF Executive Office Building in Culver City, CA 1 Operating Property 202 acre parcel of undeveloped land in City of Coachella, CA zoned for residential and high density mixed use Philadelphia properties related to the historic Reading Railroad 2 Future Value Realization Opportunities Two Off - Broadway Theatres in New York City One Off - Broadway Theatre in Chicago 3 Off - Broadway Live Theatres
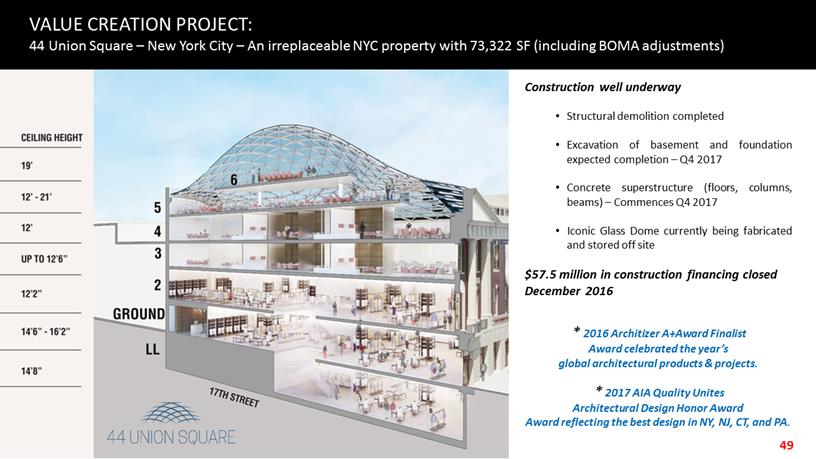
Construction well underway • Structural demolition completed • Excavation of basement and foundation expected completion – Q 4 2017 • Concrete superstructure (floors, columns, beams) – Commences Q 4 2017 • Iconic Glass Dome currently being fabricated and stored off site $57.5 million in construction financing closed December 2016 * 2016 Architizer A+Award Finalist Award celebrated the year’s global architectural products & projects. * 2017 AIA Quality Unites Architectural Design Honor Award Award reflecting the best design in NY, NJ, CT, and PA. VALUE CREATION PROJECT: 44 Union Square – New York City – An irreplaceable NYC property with 73,322 SF (including BOMA adjustments) *
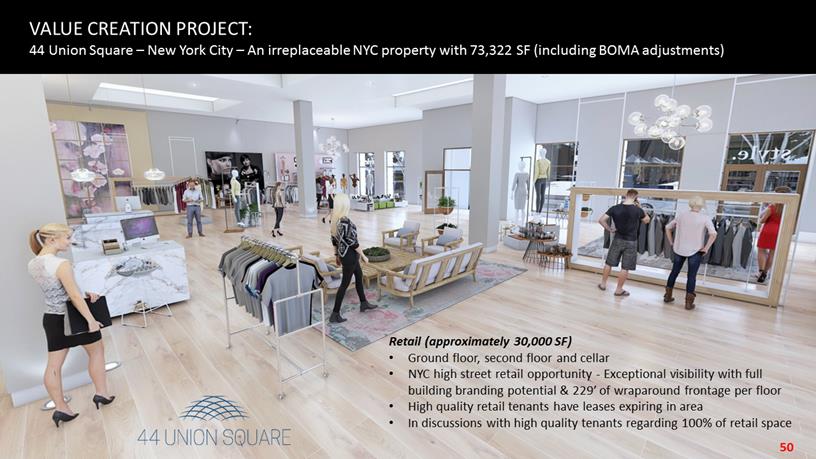
Retail (approximately 30,000 SF) • Ground floor, second floor and cellar • NYC high street retail opportunity - Exceptional visibility with full building branding potential & 229’ of wraparound frontage per floor • High quality retail tenants have leases expiring in area • In discussions with high quality tenants regarding 100% of retail space VALUE CREATION PROJECT: 44 Union Square – New York City – An irreplaceable NYC property with 73,322 SF (including BOMA adjustments)
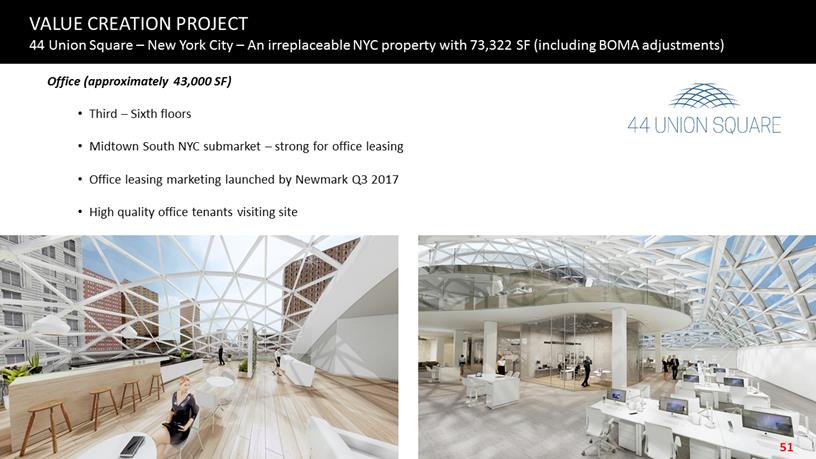
Office (approximately 43,000 SF) • Third – Sixth floors • Midtown South NYC submarket – strong for office leasing • Office leasing marketing launched by Newmark Q3 2017 • High quality office tenants visiting site VALUE CREATION PROJECT 44 Union Square – New York City – An irreplaceable NYC property with 73,322 SF (including BOMA adjustments)
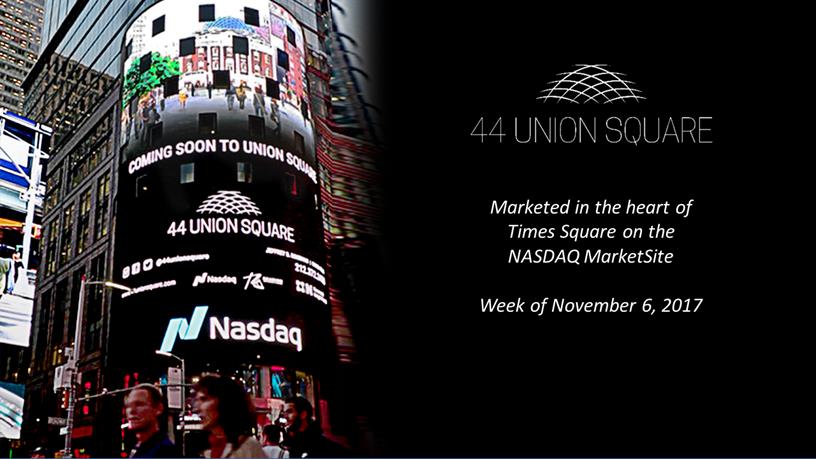
Marketed in the heart of Times Square on the NASDAQ MarketSite Week of November 6, 2017
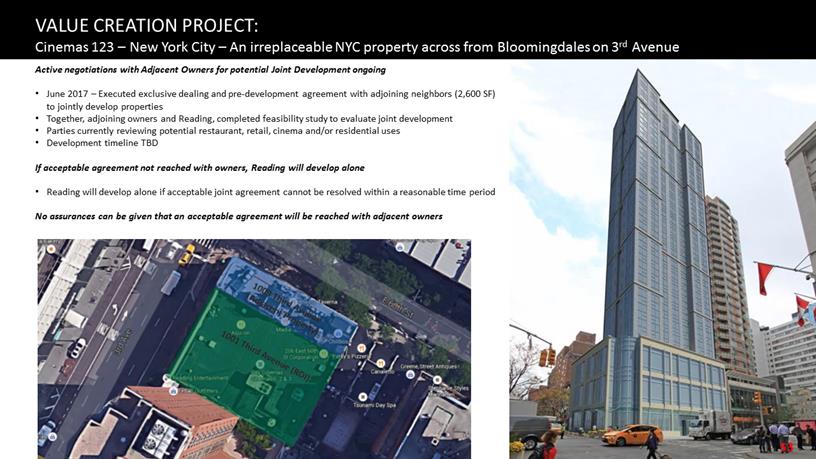
• This development in the heart of midtown Manhattan is in the early stages of development • Company’s minority partner approved re - development of the property • Adjacent property owners (corner of 60 th & 3 rd ) and Company are conducting a joint feasibility study of the combined properties • Evaluating opportunities for mixed use development: retail, residential and/or hotel uses VALUE CREATION PROJECT: Cinemas 123 – New York City – An irreplaceable NYC property across from Bloomingdales on 3 rd Avenue Active negotiations with Adjacent Owners for potential Joint Development ongoing • June 2017 – Executed exclusive dealing and pre - development agreement with adjoining neighbors (2,600 SF) to jointly develop properties • Together, adjoining owners and Reading, completed feasibility study to evaluate joint development • Parties currently reviewing potential restaurant, retail, cinema and/or residential uses • Development timeline TBD If acceptable agreement not reached with owners, Reading will develop alone • Reading will develop alone if acceptable joint agreement cannot be resolved within a reasonable time period No assurances can be given that an acceptable agreement will be reached with adjacent owners
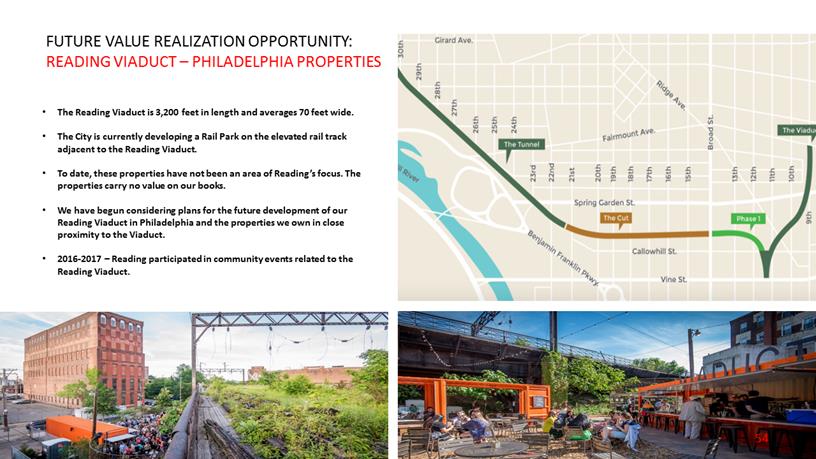
FUTURE VALUE REALIZATION OPPORTUNITY: READING VIADUCT – PHILADELPHIA PROPERTIES • The Reading Viaduct is 3,200 feet in length and averages 70 feet wide. • The City is currently developing a Rail Park on the elevated rail track adjacent to the Reading Viaduct. • To date, these properties have not been an area of Reading’s focus. The properties carry no value on our books. • We have begun considering plans for the future development of our Reading Viaduct in Philadelphia and the properties we own in close proximity to the Viaduct. • 2016 - 2017 – Reading participated in community events related to the Reading Viaduct.
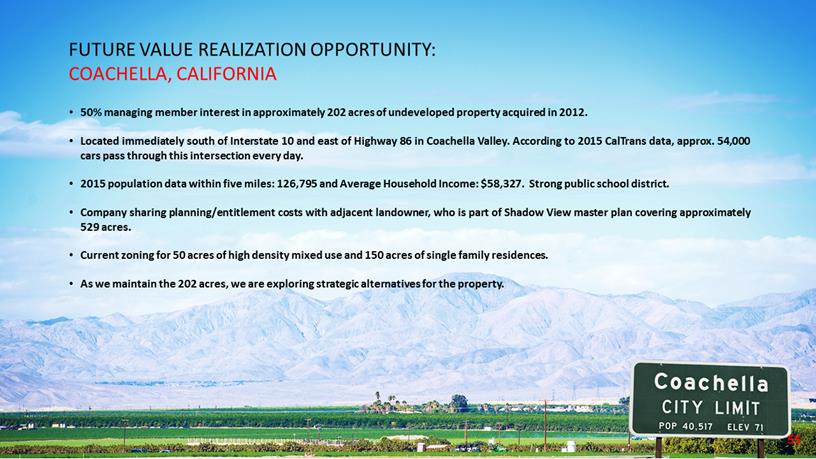
FUTURE VALUE REALIZATION OPPORTUNITY: COACHELLA, CALIFORNIA • 50 % managing member interest in approximately 202 acres of undeveloped property acquired in 2012 . • Located immediately south of Interstate 10 and east of Highway 86 in Coachella Valley . According to 2015 CalTrans data, approx . 54 , 000 cars pass through this intersection every day . • 2015 population data within five miles : 126 , 795 and Average Household Income : $ 58 , 327 . Strong public school district . • Company sharing planning/entitlement costs with adjacent landowner, who is part of Shadow View master plan covering approximately 529 acres . • Current zoning for 50 acres of high density mixed use and 150 acres of single family residences. • As we maintain the 202 acres, we are exploring strategic alternatives for the property.

CORPORATE GOVERNANCE ENHANCEMENT Third Quarter 2016 • Adopted improved Amended & Restated Whistleblower Policy & Procedures • Adopted first ever Insider Trading Policy and Supplemental Policy Concerning Trading in Company securities by certain designated persons Fourth Quarter 2016 • Adopted more comprehensive Code of Conduct of Business Conduct & Ethics • Board recommended to stockholders having an annual “Say on Pay” • Established third party “whistleblower” hotline to be used in Code of Conduct & Whistleblower Policy Independent Stockholder Derivative Suit – 2016 • Independent stockholder plaintiffs dismissed with prejudice all claims against our Company’s directors without the payment of any compensation or reimbursement of attorney fees. After spending more than $400,000, they found no wrongdoing. Corporate social responsibility includes supporting the Boys & Girls Club of Hawaii
OTHER CORPORATE GOVERNANCE ENHANCEMENT AND IMPROVED INVESTOR RELATIONS Enhanced Corporate Governance and Alignment with Stockholders • March 2016 – Adopted a charter for our Compensations Committee requiring all members to satisfy NASD “Independent Standards” and overhauled Director and Executive compensation philosophy and structure. • November – December 2016 – Completed remainder of then outstanding Stock Buy Back Program , buying back $2.8M of RDI Class A stock in the market at an average price per share of $15.64. • March 2017 – Board of Directors authorized additional $25 million Stock Buy Back Program for RDI Class A stock. As of September 30, 2017, we have deployed $6.4 million to repurchase of RDI Class A stock in the market at an average price per share of $15.92. • August 2017 – Established Special Independent Committee • October 2017 - ISS and Glass Lewis recommend stockholders vote in favor of Executive Compensation proposal, with ISS ranking Rea ding on “Absolute alignment” of “Pay for Performance” as “Better than 99% of Companies” Improved Investor Communication • Since May 2016, we have continued posting quarterly webcasts responding to stockholder and analyst questions • Since May 2016, we have attended nine investor conferences and Non - Deal Roadshows • September 2016 – We secured sell - side analyst coverage for first time in Reading’s history from Eric Wold of B. Riley o “Buy” rating and price target of $26.50 per share
F I N A N C I A L R E V I E W presented by Dev Ghose Executive Vice President & Chief Financial Officer Architectural rendering of South City Square, major mixed use development in Brisbane. RDI leasing an 8 screen Reading Cinema, expected to open 2020.
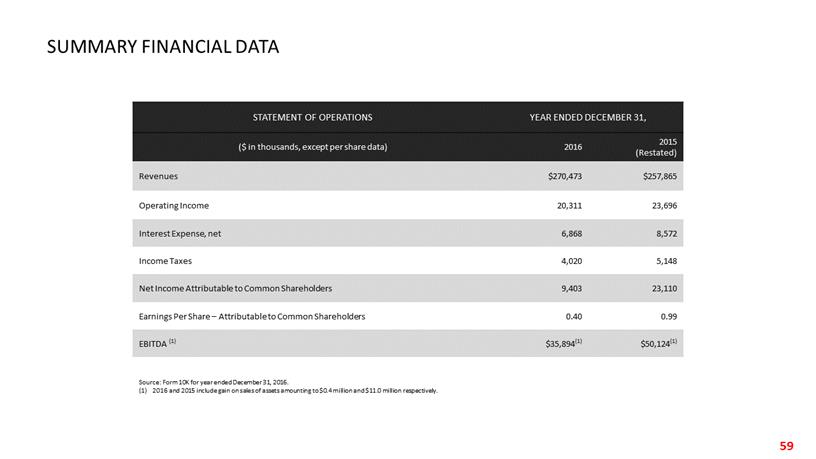
STATEMENT OF OPERATIONS YEAR ENDED DECEMBER 31, ($ in thousands, except per share data) 2016 2015 (Restated) Revenues $270,473 $257,865 Operating Income 20,311 23,696 Interest Expense, net 6,868 8,572 Income Taxes 4,020 5,148 Net Income Attributable to Common Shareholders 9,403 23,110 Earnings Per Share – Attributable to Common Shareholders 0.40 0.99 EBITDA (1) $35,894 (1) $50,124 (1) Source: Form 10K for year ended December 31, 2016. (1) 2016 and 2015 include gain on sales of assets amounting to $0.4 million and $11.0 million respectively. SUMMARY FINANCIAL DATA
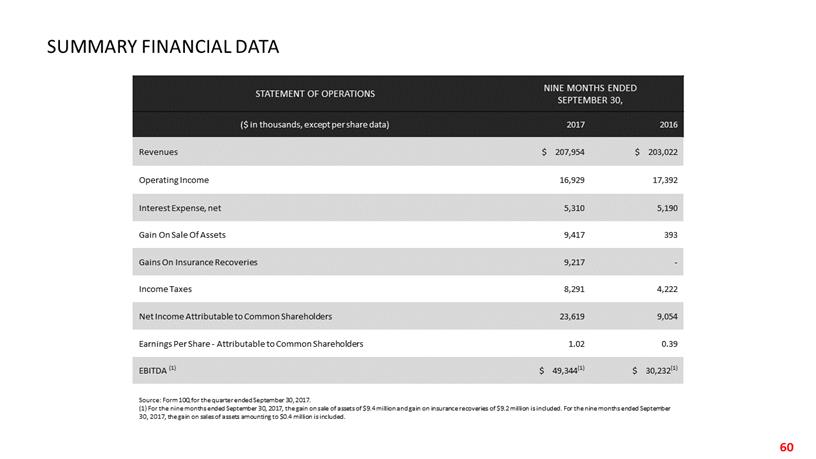
STATEMENT OF OPERATIONS NINE MONTHS ENDED SEPTEMBER 30, ($ in thousands, except per share data) 2017 2016 Revenues $ 207,954 $ 203,022 Operating Income 16,929 17,392 Interest Expense, net 5,310 5,190 Gain On Sale Of Assets 9,417 393 Gains On Insurance Recoveries 9,217 - Income Taxes 8,291 4,222 Net Income Attributable to Common Shareholders 23,619 9,054 Earnings Per Share - Attributable to Common Shareholders 1.02 0.39 EBITDA (1) $ 49,344 (1) $ 30,232 (1) Source: Form 10Q for the quarter ended September 30, 2017. (1) For the nine months ended September 30, 2017, the gain on sale of assets of $9.4 million and gain on insurance recoveries of $9.2 million is included. For the nine months ended September 30, 2017, the gain on sales of assets amounting to $0.4 million is included. SUMMARY FINANCIAL DATA
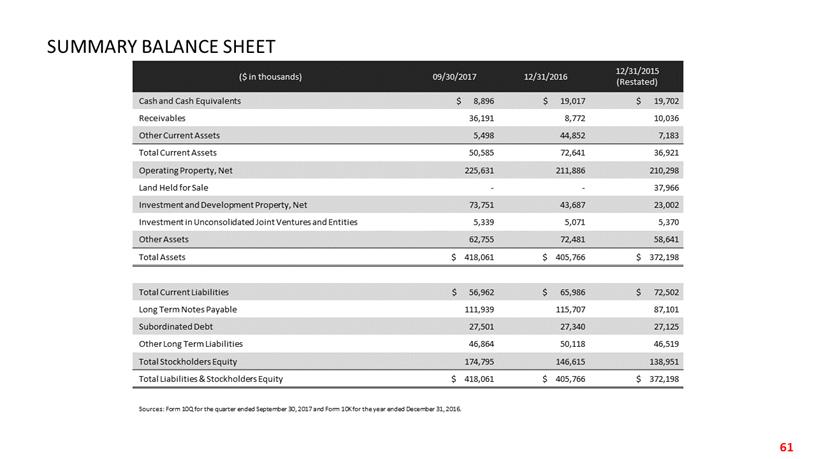
($ in thousands) 09/30/2017 12/31/2016 12/31/2015 (Restated) Cash and Cash Equivalents $ 8,896 $ 19,017 $ 19,702 Receivables 36,191 8,772 10,036 Other Current Assets 5,498 44,852 7,183 Total Current Assets 50,585 72,641 36,921 Operating Property, Net 225,631 211,886 210,298 Land Held for Sale - - 37,966 Investment and Development Property, Net 73,751 43,687 23,002 Investment in Unconsolidated Joint Ventures and Entities 5,339 5,071 5,370 Other Assets 62,755 72,481 58,641 Total Assets $ 418,061 $ 405,766 $ 372,198 Total Current Liabilities $ 56,962 $ 65,986 $ 72,502 Long Term Notes Payable 111,939 115,707 87,101 Subordinated Debt 27,501 27,340 27,125 Other Long Term Liabilities 46,864 50,118 46,519 Total Stockholders Equity 174,795 146,615 138,951 Total Liabilities & Stockholders Equity $ 418,061 $ 405,766 $ 372,198 Sources: Form 10Q for the quarter ended September 30, 2017 and Form 10K for the year ended December 31, 2016. SUMMARY BALANCE SHEET
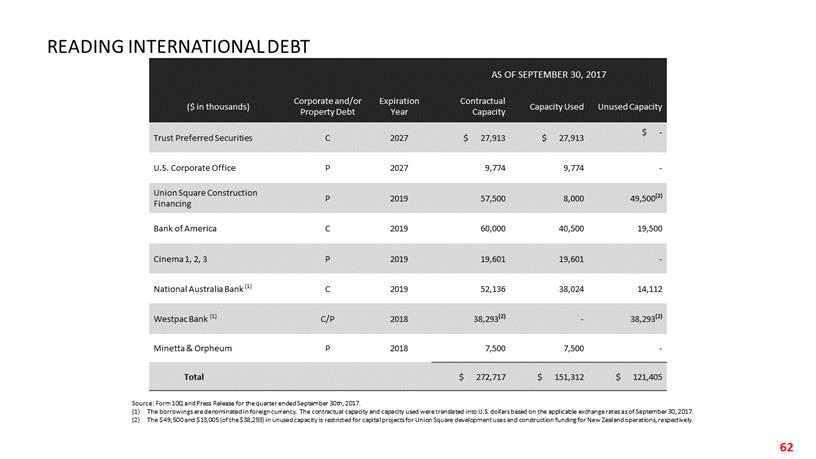
Reconciliation of EBITDA to Net Loss READING INTERNATIONAL DEBT Source: Form 10Q and Press Release for the quarter ended September 30th, 2017. (1) The borrowings are denominated in foreign currency. The contractual capacity and capacity used were translated into U.S. dol lar s based on the applicable exchange rates as of September 30, 2017. (2) The $49,500 and $13,005 (of the $38,293) in unused capacity is restricted for capital projects for Union Square development u ses and construction funding for New Zealand operations, respectively. AS OF SEPTEMBER 30, 2017 ($ in thousands) Corporate and/or Property Debt Expiration Year Contractual Capacity Capacity Used Unused Capacity Trust Preferred Securities C 2027 $ 27,913 $ 27,913 $ - U.S. Corporate Office P 2027 9,774 9,774 - Union Square Construction Financing P 2019 57,500 8,000 49,500 (2) Bank of America C 2019 60,000 40,500 19,500 Cinema 1, 2, 3 P 2019 19,601 19,601 - National Australia Bank (1) C 2019 52,136 38,024 14,112 Westpac Bank (1) C/P 2018 38,293 (2) - 38,293 (2) Minetta & Orpheum P 2018 7,500 7,500 - Total $ 272,717 $ 151,312 $ 121,405
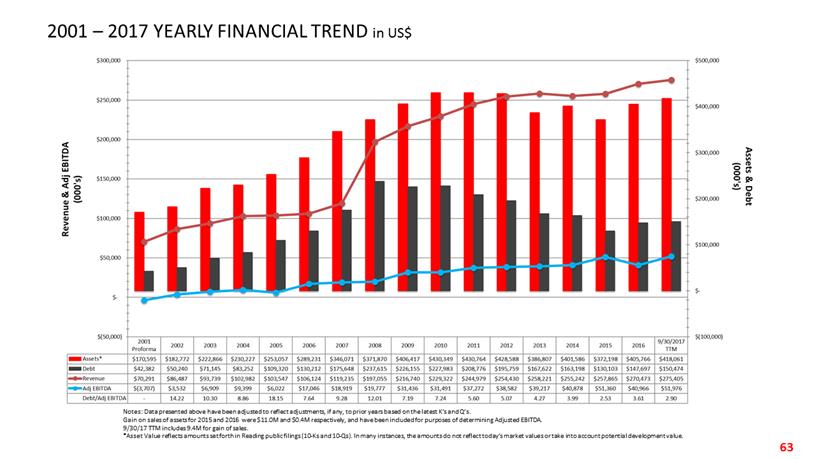
2001 – 2017 YEARLY FINANCIAL TREND in US$ Notes: Data presented above have been adjusted to reflect adjustments, if any, to prior years based on the latest K’s and Q’s . Gain on sales of assets for 2015 and 2016 were $11.0M and $0.4M respectively, and have been included for purposes of determining Adjusted EBITDA. 9/30/17 TTM includes 9.4M for gain of sales. *Asset Value reflects amounts set forth in Reading public filings (10 - Ks and 10 - Qs). In many instances, the amounts do not reflect today’s market values or take into account potential development value.
| 2001 Proforma | 2002 | 2003 | 2004 | 2005 | 2006 | 2007 | 2008 | 2009 | 2010 | 2011 | 2012 | 2013 | 2014 | 2015 | 2016 | 9/30/2017 TTM |
Assets* | $ 170,595 | $ 182,772 | $ 222,866 | $ 230,227 | $ 253,057 | $ 289,231 | $ 346,071 | $ 371,870 | $ 406,417 | $ 430,349 | $ 430,764 | $ 428,588 | $ 386,807 | $ 401,586 | $ 372,198 | $ 405,766 | $ 418,061 |
Debt | $ 42,382 | $ 50,240 | $ 71,145 | $ 83,252 | $ 109,320 | $ 130,212 | $ 175,648 | $ 237,615 | $ 226,155 | $ 227,983 | $ 208,776 | $ 195,759 | $ 167,622 | $ 163,198 | $ 130,103 | $ 147,697 | $ 150,474 |
Revenue | $ 70,291 | $ 86,487 | $ 93,739 | $ 102,982 | $ 103,547 | $ 106,124 | $ 119,235 | $ 197,055 | $ 216,740 | $ 229,322 | $ 244,979 | $ 254,430 | $ 258,221 | $ 255,242 | $ 257,865 | $ 270,473 | $ 275,405 |
Adj EBITDA | $ (3,707) | $ 3,532 | $ 6,909 | $ 9,399 | $ 6,022 | $ 17,046 | $ 18,919 | $ 19,777 | $ 31,436 | $ 31,491 | $ 37,272 | $ 38,582 | $ 39,217 | $ 40,878 | $ 51,360 | $ 40,966 | $ 51,976 |
Debt/Adj EBITDA | - | 14.22 | 10.30 | 8.86 | 18.15 | 7.64 | 9.28 | 12.01 | 7.19 | 7.24 | 5.60 | 5.07 | 4.27 | 3.99 | 2.53 | 3.61 | 2.90 |
We create long - term stockholder value through the opportunistic and synergistic development of entertainment and real estate assets. Our cinema business offers a stable cash flow . . We are re - investing in our existing cinema portfolio by implementing our Global Cinema Strategy . . We are improving our operating income by implementing our Global Cinema Strategy . . We continue to pursue new opportunities that meet our investment criteria through acquisition or new builds . We have built and continue to develop a strong real estate portfolio . . We are creating incremental value through the implementation of our Global Real Estate Strategy . . Our goal is to drive long - term value for stockholders and being an anchor tenant in our own ETCs provides us the ability to leverage operational and marketing strategies across our centers to drive growth and profitability . IN CONCLUSION

T H A N K Y O U