UNITED STATES
SECURITIES AND EXCHANGE COMMISSION
Washington, D.C. 20549
FORM N-CSR
CERTIFIED SHAREHOLDER REPORT OF REGISTERED
MANAGEMENT INVESTMENT COMPANIES
Investment Company Act file number | 811-03692 | |||||||
| ||||||||
Morgan Stanley Variable Investment Series | ||||||||
(Exact name of registrant as specified in charter) | ||||||||
| ||||||||
522 Fifth Avenue, New York, New York |
| 10036 | ||||||
(Address of principal executive offices) |
| (Zip code) | ||||||
| ||||||||
John H. Gernon 522 Fifth Avenue, New York, New York 10036 | ||||||||
(Name and address of agent for service) | ||||||||
| ||||||||
Registrant’s telephone number, including area code: | 212-296-0289 |
| ||||||
| ||||||||
Date of fiscal year end: | December 31, |
| ||||||
| ||||||||
Date of reporting period: | December 31, 2018 |
| ||||||
Item 1 - Report to Shareholders
MORGAN STANLEY
VARIABLE INVESTMENT SERIES
Annual Report
DECEMBER 31, 2018
The Funds are intended to be a funding vehicle for variable annuity contracts and variable life insurance policies offered by the separate accounts of certain life insurance companies.
Morgan Stanley Variable Investment Series
Table of Contents
Letter to the Shareholders | 1 | ||||||
Expense Examples | 8 | ||||||
Portfolio of Investments: | |||||||
Income Plus | 10 | ||||||
Multi Cap Growth | 20 | ||||||
Financial Statements: | |||||||
Statements of Assets and Liabilities | 24 | ||||||
Statements of Operations | 25 | ||||||
Statements of Changes in Net Assets | 26 | ||||||
Notes to Financial Statements | 28 | ||||||
Financial Highlights | 54 | ||||||
Report of Independent Registered Public Accounting Firm | 57 | ||||||
Trustee and Officer Information | 58 | ||||||
| Federal Tax Notice | 65 | ||||||
Morgan Stanley Variable Investment Series
Letter to the Shareholders n December 31, 2018 (unaudited)
Dear Shareholder:
Investment conditions were challenging in 2018. Growth momentum dissipated in key economies, financial conditions were tightening and a variety of geopolitical and local domestic political concerns increased uncertainty about the future. Financial markets responded with volatility, driving losses across most risky assets. Equities, especially those outside the U.S., and commodities, led by crude oil, were among the worst-performing asset classes for the year. Fixed income markets provided some defensiveness against equity weakness, but returns across non-government segments such as corporate bonds were negative nevertheless.
Domestic Equity Overview
U.S. stocks ended the year with a loss, as anxiety over rising downside risks overwhelmed positive fundamental data. While most other major world economies were slowing, the U.S. economy accelerated in 2018. A tight labor market and rising wages supported consumer spending and confidence. Corporate earnings and revenues were robust, aided by tailwinds from tax cuts and deregulation. However, looming risks from geopolitical uncertainties, especially U.S.-China trade relations, and tightening financial conditions began to take a toll on investor sentiment and corporate earnings outlooks. Market volatility increased markedly from 2017's historically low levels, with especially sharp price swings in February, October and December 2018. Among the 11 sectors in the broad market S&P 500® Index, only two delivered positive performance for the year, health care and utilities. The energy sector was the worst performer following a sharp drop in crude oil prices during the fourth quarter of 2018.
Fixed Income Overview
Over 2018, U.S. Treasury yields rose and the curve flattened. Short maturity yields were driven higher by the four Federal Reserve rate increases. Longer maturities lagged, primarily due to uncertainties about the outlook for global growth and inflation. Over the year, 10-year U.S. Treasury yields rose 28 basis points, ending the year at 2.68%.i
Equity and credit markets underperformed in 2018, with much of the damage occurring in the fourth quarter. Investment grade corporate index spreads widened 60 basis points over the year to levels that at the end of the year were above its post-crisis average.ii
i Source: Bloomberg L.P. Data as of December 31, 2018.
ii Source: Bloomberg Barclays. Data represented by the Bloomberg Barclays U.S. Corporate Index, as of December 31, 2018.
Morgan Stanley Variable Investment Series
Letter to the Shareholders n December 31, 2018 (unaudited) continued
In both the corporate and securitized sectors, higher quality bonds outperformed their lower quality counterparts. The highest quality sectors, such as agency mortgage-backed securities (MBS), taxable municipals and most securitized credit, had performance either similar to or only slightly below similar duration Treasuries. High yield corporate bonds ended the year in negative territory amid sharp oil and equity sell-offs in the fourth quarter, unresolved trade issues and an uptick in slowing global growth indicators.
2
Morgan Stanley Variable Investment Series
Letter to the Shareholders n December 31, 2018 (unaudited) continued
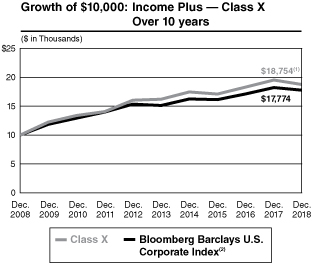
Income Plus Portfolio
For the 12-month period ended December 31, 2018, Variable Investment Series — Income Plus Portfolio Class X shares produced a total return of -4.01%, underperforming the Bloomberg Barclays U.S. Corporate Index (the "Index"), which returned -2.51%. For the same period, the Fund's Class Y shares returned -4.31%. Past performance is no guarantee of future results.
The performance of the Fund's two share classes varies because each has different expenses. The Fund's total returns assume the reinvestment of all distributions but do not reflect the deduction of any charges by your insurance company. Such costs would lower performance.
The 12-month reporting period was characterized by a widening in corporate credit spreads. Global growth, monetary policy and geopolitical tensions continued to infiltrate market rhetoric over the period. Economic data, especially in developed economies, generally surprised to the downside in the fourth quarter of 2018. While company earnings generally held up well through the year, expectations for 2019 have been revised steadily lower. In addition, many of the main macro risks — trade tensions between the U.S. and China, populist politics in Europe, concerns about the slowing Chinese economy — remain unresolved.
Performance data quoted represents past performance, which is no guarantee of future results and current performance may be lower or higher than the figures shown. For most recent month-end performance figures, please contact the issuing insurance company or speak with your Financial Advisor. Investment return and principal value will fluctuate. When you sell Fund shares, they may be worth less than their original cost. Total returns do not reflect the deduction of taxes that a shareholder would pay on Fund distributions or the redemption of Fund shares. Performance for Class Y shares will vary from the performance of Class X shares due to differences in expenses. Performance assumes reinvestment of all distributions for the underlying portfolio based on net asset value (NAV). It does not reflect the deduction of insurance expenses, an annual contract maintenance fee, or surrender charges. If performance information included the effect of these additional charges, the total returns would be lower.
Average Annual Total Returns as of December 31, 2018
1 Year | 5 Years | 10 Years | Since Inception* | ||||||||||||||||
Class X | -4.01 | % | 2.96 | % | 6.49 | % | 6.58 | % | |||||||||||
Class Y | -4.31 | % | 2.68 | % | 6.22 | % | 5.49 | % | |||||||||||
(1) Ending value on December 31, 2018 for the underlying portfolio. This figure does not reflect the deduction of any account fees or sales charges.
(2) The Bloomberg Barclays U.S. Corporate Index is a broad-based benchmark that measures the investment grade, U.S. dollar-denominated, fixed rate, taxable corporate bond market. It includes USD-denominated securities publicly issued by U.S. and non-U.S. industrial, utility and financial issuers that meet specified maturity, liquidity and quality requirements. The Index is unmanaged and its returns do not include any sales charges or fees. Such costs would lower performance. It is not possible to invest directly in an index.
* Inception dates of March 1, 1987 for Class X and June 5, 2000 for Class Y.
3
Morgan Stanley Variable Investment Series
Letter to the Shareholders n December 31, 2018 (unaudited) continued
The Fund's investment grade exposure detracted from the Fund's returns over the period. Weakness in the credit market resulted in wider spreads across all major segments of the investment grade market. The Fund's emphasis on financial institutions, specifically the banking sector, was particularly disadvantageous for performance over the reporting period. The Fund had an underweight to industrials, attributable to relatively weaker fundamentals and less favorable relative value within the industrials segment of the market. Industrials positioning positively impacted performance over the period, driven mainly by underweight positioning in consumer non-cyclicals.
Conversely, positioning in the energy and basic industry sectors adversely affected performance during the period. An opportunistic allocation to below investment grade (or high yield) credits also detracted from performance. While high yield saw some resilience during the first three quarters of the year, by October high yield spreads were pushed meaningful wider amid sharp oil and equity sell-offs.
Entering 2019 our outlook remains broadly unchanged. Spreads are now back to early-mid 2016 levels and pricing in an elevated risk of a material economic slowdown or recession. We believe an awful lot is currently baked into valuations, and hence we see value in both investment grade and high yield credit spreads. The economy is certainly slowing in comparison to early 2018 when U.S. fiscal reform and elevated confidence in Europe helped combine to boost global growth. Since then trade negotiations, geopolitical concerns, less central bank accommodation and emerging market sovereign idiosyncratic events have weighed on growth. It is understandable that this confluence of factors has stoked market fears of a "hard landing" and imminent recession, but our base case remains that many of the market's worst fears are not met. We continue to expect U.S. growth to be close to consensus at 2.5%, China to respond to any negative effects from trade tariffs with more stimulus, U.S. monetary policy not to cause a "hard landing" and populist politics to be diluted by the checks and balances from both international rules as well as the markets. If this occurs, we would expect tighter credit spreads across all markets as the confirmation that the expansionary period continues. In this scenario the increased systemic risk premium is unjustified as default rates stay low, company earnings continue to grow and confidence in the market increases liquidity. Sector and issuer selection will be key decisions in 2019 as technology and behavioral change are both fast-moving and disruptive for many traditional industry business models. While December's underperformance adds ammunition to some commentators' view that credit markets are in "crisis," we see dangers that are known and reflected in the price, as well as opportunity for yield advantages and limited capital gains through both owning the asset class and from active positioning.
The Fund is positioned to be modestly overweight credit risk as a whole. Specifically, the Fund is overweight financials and underweight industrials. We have started to let our financials overweight wind
4
Morgan Stanley Variable Investment Series
Letter to the Shareholders n December 31, 2018 (unaudited) continued
down and have added selective BBB-rated non-financials. The Fund continues to hold small allocations to high yield bonds, as we believe that both fundamentals and valuations may well compensate investors for bearing risk.
There is no guarantee that any sectors mentioned will continue to perform as discussed above or that securities in such sectors will be held by the Fund in the future.
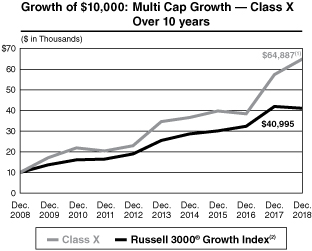
Multi Cap Growth Portfolio
For the 12-month period ended December 31, 2018, Variable Investment Series — Multi Cap Growth Portfolio Class X shares produced a total return of 13.27%, outperforming the Russell 3000® Growth Index (the "Index"), which returned -2.12%. For the same period, the Fund's Class Y shares returned 13.00%. Past performance is no guarantee of future results.
The performance of the Fund's two share classes varies because each has different expenses. The Fund's total returns assume the reinvestment of all distributions but do not reflect the deduction of any charges by your insurance company. Such costs would lower performance.
Performance data quoted represents past performance, which is no guarantee of future results and current performance may be lower or higher than the figures shown. For most recent month-end performance figures, please contact the issuing insurance company or speak with your Financial Advisor. Investment return and principal value will fluctuate. When you sell Fund shares, they may be worth less than their original cost. Total returns do not reflect the deduction of taxes that a shareholder would pay on Fund distributions or the redemption of Fund shares. Performance for Class Y shares will vary from the performance of Class X shares due to differences in expenses. Performance assumes reinvestment of all distributions for the underlying portfolio based on net asset value (NAV). It does not reflect the deduction of insurance expenses, an annual contract maintenance fee, or surrender charges. If performance information included the effect of these additional charges, the total returns would be lower.
Average Annual Total Returns as of December 31, 2018
1 Year | 5 Years | 10 Years | Since Inception* | ||||||||||||||||
Class X | 13.27 | % | 13.42 | % | 20.56 | % | 12.14 | % | |||||||||||
Class Y | 13.00 | % | 13.13 | % | 20.26 | % | 7.15 | % | |||||||||||
(1) Ending value on December 31, 2018 for the underlying portfolio. This figure does not reflect the deduction of any account fees or sales charges.
(2) The Russell 3000® Growth Index measures the performance of the broad growth segment of the U.S. equity universe. It includes those Russell 3000® Index companies with higher price-to-book ratios and higher forecasted growth values. The Russell 3000® Index measures the performance of the largest 3000 U.S. companies representing approximately 98% of the investable U.S. equity market. The Index is unmanaged and its returns do not include any sales charges or fees. Such costs would lower performance. It is not possible to invest directly in an index.
* Inception dates of March 9, 1984 for Class X and June 5, 2000 for Class Y.
5
Morgan Stanley Variable Investment Series
Letter to the Shareholders n December 31, 2018 (unaudited) continued
The long-term investment horizon and conviction-weighted investment approach embraced by the team since 1998 can result in periods of performance deviation from the benchmark and peers. The Fund's outperformance relative to the Index in this reporting period was almost entirely due to favorable stock selection and a small positive contribution from sector allocation.
Our stock selection in the health care and information technology sectors delivered much of the Fund's outperformance, led by several software-as-a-service companies. In the health care sector, a provider of cloud-based software solutions to life sciences companies was a top contributor, as was a leader in genetic testing and analysis. In the information technology sector, performance was led by two cloud-based software makers. One provides software solutions to help enterprises optimize their spending budget, and the other provides human resources and financial management software.
Stock selection in consumer discretionary was the largest detractor from relative performance. Underperformance within the sector was led by holdings in an online home goods and apparel seller and a global online marketplace for luxury goods. An overweight allocation to the communication services sector and an underweight allocation to the information technology sector were also modestly disadvantageous to relative results.
There is no guarantee that any sectors mentioned will continue to perform as discussed above or that securities in such sectors will be held by the Fund in the future.
We appreciate your ongoing support of Morgan Stanley Variable Investment Series and look forward to continuing to serve your investment needs.
Very truly yours,

John H. Gernon
President and Principal Executive Officer
6
Morgan Stanley Variable Investment Series
Letter to the Shareholders n December 31, 2018 (unaudited) continued
For More Information About Portfolio Holdings
Each Morgan Stanley fund provides a complete schedule of portfolio holdings in its semi-annual and annual reports within 60 days of the end of the fund's second and fourth fiscal quarters. The semi-annual reports and the annual reports are filed electronically with the Securities and Exchange Commission ("SEC") on Form N-CSRS and Form N-CSR, respectively. Morgan Stanley also delivers the semi-annual and annual reports to fund shareholders and makes these reports available on its public web site, www.morganstanley.com/im/shareholderreports. Each Morgan Stanley fund also files a complete schedule of portfolio holdings with the SEC for the fund's first and third fiscal quarters on Form N-Q. Morgan Stanley does not deliver the reports for the first and third fiscal quarters to shareholders, nor are the reports posted to the Morgan Stanley public web site. You may, however, obtain the Form N-Q filings (as well as the Form N-CSR and N-CSRS filings) by accessing the SEC's web site, http://www.sec.gov. You can also request copies of these materials, upon payment of a duplicating fee, by electronic request at the SEC's e-mail address (publicinfo@sec.gov).
Proxy Voting Policy and Procedures and Proxy Voting Record
You may obtain a copy of the Funds' Proxy Voting Policy and Procedures without charge, upon request, by calling toll free (800) 548-7786 or by visiting our web site at www.morganstanley.com/im/shareholderreports. It is also available on the SEC's web site at http://www.sec.gov.
You may obtain information regarding how the Funds voted proxies relating to portfolio securities during the most recent twelve-month period ended June 30 without charge by visiting our web site at www.morganstanley.com/im/shareholderreports. This information is also available on the SEC's web site at http://www.sec.gov.
7
Morgan Stanley Variable Investment Series
Expense Examples n December 31, 2018 (unaudited)
As a shareholder of a Fund, you incur two types of costs: (1) insurance company charges; and (2) ongoing costs, which may include advisory fees, administration fees, distribution and services (12b-1) fees and other Fund expenses. These examples are intended to help you understand your ongoing costs (in dollars) of investing in each Fund and to compare these costs with the ongoing costs of investing in other mutual funds.
These examples are based on an investment of $1,000 invested at the beginning of the period and held for the entire period 07/01/18 – 12/31/18.
Actual Expenses
The first line of the tables on the following page provides information about actual account values and actual expenses. You may use the information in this line, together with the amount you invested, to estimate the expenses that you paid over the period. Simply divide your account value by $1,000 (for example, an $8,600 account value divided by $1,000 = 8.6), then multiply the result by the number in the first line under the heading entitled "Expenses Paid During Period" to estimate the expenses you paid on your account during this period.
Hypothetical Example for Comparison Purposes
The second line of the tables on the following page provides information about hypothetical expenses based on the Fund's actual expense ratio and an assumed rate of return of 5% per year before expenses, which is not the Fund's actual return. The hypothetical account values and expenses may not be used to estimate the actual ending account balance or expenses you paid for the period. You may use this information to compare the ongoing cost of investing in the Fund and other funds. To do so, compare this 5% hypothetical example with the 5% hypothetical examples that appear in the shareholder reports of the other funds.
Please note that the expenses shown in the tables are meant to highlight your ongoing costs only and do not reflect any insurance company charges. Therefore, the second line of the tables is useful in comparing ongoing costs, and will not help you determine the relative total cost of owning different funds. In addition, if these insurance company charges were included, your costs would have been higher.
8
Morgan Stanley Variable Investment Series
Expense Examples n December 31, 2018 (unaudited) continued
Income Plus
| Beginning Account Value | Ending Account Value | Expenses Paid During Period(1) | |||||||||||||
07/01/18 | 12/31/18 | 07/01/18 – 12/31/18 | |||||||||||||
Class X | |||||||||||||||
| Actual (-0.29% return) | $ | 1,000.00 | $ | 997.10 | $ | 3.93 | |||||||||
| Hypothetical (5% annual return before expenses) | $ | 1,000.00 | $ | 1,021.27 | $ | 3.97 | |||||||||
Class Y | |||||||||||||||
| Actual (-0.41% return) | $ | 1,000.00 | $ | 995.90 | $ | 5.18 | |||||||||
| Hypothetical (5% annual return before expenses) | $ | 1,000.00 | $ | 1,020.01 | $ | 5.24 | |||||||||
(1) Expenses are equal to the Fund's annualized expense ratios of 0.78% and 1.03% for Class X and Class Y shares, respectively, multiplied by the average account value over the period and multiplied by 184/365 (to reflect the one-half year period).
Multi Cap Growth
| Beginning Account Value | Ending Account Value | Expenses Paid During Period(1) | |||||||||||||
07/01/18 | 12/31/18 | 07/01/18 – 12/31/18 | |||||||||||||
Class X | |||||||||||||||
| Actual (-7.51% return) | $ | 1,000.00 | $ | 924.90 | $ | 2.72 | |||||||||
| Hypothetical (5% annual return before expenses) | $ | 1,000.00 | $ | 1,022.38 | $ | 2.85 | |||||||||
Class Y | |||||||||||||||
| Actual (-7.63% return) | $ | 1,000.00 | $ | 923.70 | $ | 3.93 | |||||||||
| Hypothetical (5% annual return before expenses) | $ | 1,000.00 | $ | 1,021.12 | $ | 4.13 | |||||||||
(1) Expenses are equal to the Fund's annualized expense ratios of 0.56% and 0.81% for Class X and Class Y shares, respectively, multiplied by the average account value over the period and multiplied by 184/365 (to reflect the one-half year period). If the Fund had borne all of its expenses, the annualized expense ratios would have been 0.58% and 0.83% for Class X and Class Y shares, respectively.
9
Morgan Stanley Variable Investment Series - Income Plus
Portfolio of Investments n December 31, 2018
| PRINCIPAL AMOUNT (000) | COUPON RATE | MATURITY DATE | VALUE | ||||||||||||||||
Corporate Bonds (99.1%) | |||||||||||||||||||
Basic Materials (4.7%) | |||||||||||||||||||
$ | 350 | Dow Chemical Co. (The) (a) | 5.55 | % | 11/30/48 | $ | 356,175 | ||||||||||||
190 | Eldorado Gold Corp. (Canada) (a) | 6.125 | 12/15/20 | 173,375 | |||||||||||||||
475 | Glencore Funding LLC (Switzerland) (a) | 3.875 | 10/27/27 | 428,835 | |||||||||||||||
175 | Goldcorp, Inc. (Canada) | 5.45 | 06/09/44 | 173,509 | |||||||||||||||
225 | International Paper Co. | 4.35 | 08/15/48 | 193,250 | |||||||||||||||
100 | LyondellBasell Industries N.V. | 4.625 | 02/26/55 | 84,558 | |||||||||||||||
500 | Newcastle Coal Infrastructure Group Pty Ltd. (Australia) (a) | 4.40 | 09/29/27 | 453,149 | |||||||||||||||
470 | NOVA Chemicals Corp. (Canada) (a) | 5.25 | 08/01/23 | 445,912 | |||||||||||||||
150 | Nucor Corp. | 3.95 | 05/01/28 | 148,496 | |||||||||||||||
200 | POSCO (Korea, Republic of) (a) | 4.00 | 08/01/23 | 201,994 | |||||||||||||||
315 | Southern Copper Corp. (Mexico) | 7.50 | 07/27/35 | 369,337 | |||||||||||||||
425 | Syngenta Finance N.V. (China) (a) | 4.892 | 04/24/25 | 402,393 | |||||||||||||||
46 | Vale Overseas Ltd. (Brazil) | 6.875 | 11/21/36 | 52,831 | |||||||||||||||
175 | Westlake Chemical Corp. | 4.375 | 11/15/47 | 147,206 | |||||||||||||||
3,631,020 | |||||||||||||||||||
Communications (12.2%) | |||||||||||||||||||
225 | 21st Century Fox America, Inc. | 4.75 | 09/15/44 | 240,503 | |||||||||||||||
100 | 21st Century Fox America, Inc. | 4.95 | 10/15/45 | 110,060 | |||||||||||||||
300 | Amazon.com, Inc. | 4.25 | 08/22/57 | 292,308 | |||||||||||||||
200 | AT&T, Inc. | 4.25 | 03/01/27 | 196,005 | |||||||||||||||
251 | AT&T, Inc. | 4.50 | 03/09/48 | 215,594 | |||||||||||||||
350 | AT&T, Inc. | 4.90 | 08/15/37 | 327,305 | |||||||||||||||
500 | AT&T, Inc. | 5.15 | 02/15/50 | 464,927 | |||||||||||||||
220 | Baidu, Inc. (China) | 2.875 | 07/06/22 | 213,940 | |||||||||||||||
200 | Bharti Airtel International Netherlands BV (India) (a) | 5.35 | 05/20/24 | 196,923 | |||||||||||||||
150 | Booking Holdings, Inc. | 0.90 | 09/15/21 | 165,906 | |||||||||||||||
425 | Charter Communications Operating LLC/Charter Communications Operating Capital | 4.20 | 03/15/28 | 401,100 | |||||||||||||||
400 | Charter Communications Operating LLC/Charter Communications Operating Capital | 6.484 | 10/23/45 | 412,487 | |||||||||||||||
350 | Comcast Corp. | 3.55 | 05/01/28 | 338,234 | |||||||||||||||
500 | Comcast Corp. | 4.049 | 11/01/52 | 449,921 | |||||||||||||||
325 | Comcast Corp. | 4.15 | 10/15/28 | 330,403 | |||||||||||||||
225 | CSC Holdings LLC (a) | 5.50 | 04/15/27 | 209,813 | |||||||||||||||
175 | Ctrip.com International Ltd. (China) | 1.25 | 09/15/22 | 169,644 | |||||||||||||||
275 | Finisar Corp. | 0.50 | 12/15/36 | 261,723 | |||||||||||||||
900 | Ooredoo International Finance Ltd. (Qatar) (a) | 3.25 | 02/21/23 | 871,033 | |||||||||||||||
See Notes to Financial Statements
10
Morgan Stanley Variable Investment Series - Income Plus
Portfolio of Investments n December 31, 2018 continued
| PRINCIPAL AMOUNT (000) | COUPON RATE | MATURITY DATE | VALUE | ||||||||||||||||
$ | 567 | Sprint Spectrum Co., LLC/Sprint Spectrum Co., II LLC/Sprint Spectrum Co., III LLC (a) | 3.36 | % | 03/20/23 | $ | 561,516 | ||||||||||||
200 | Sprint Spectrum Co., LLC/Sprint Spectrum Co., II LLC/Sprint Spectrum Co., III LLC (a) | 4.738 | 09/20/29 | 196,750 | |||||||||||||||
175 | Telefonica Emisiones SA (Spain) | 4.103 | 03/08/27 | 168,393 | |||||||||||||||
330 | Telefonica Europe BV (Spain) | 8.25 | 09/15/30 | 420,808 | |||||||||||||||
200 | Telenor East Holding II AS, Series VIP (Norway) | 0.25 | 09/20/19 | 195,012 | |||||||||||||||
375 | Tencent Holdings Ltd. (China) (a) | 3.595 | 01/19/28 | 352,737 | |||||||||||||||
75 | Verizon Communications, Inc. | 4.125 | 03/16/27 | 75,188 | |||||||||||||||
375 | Verizon Communications, Inc. | 4.272 | 01/15/36 | 351,237 | |||||||||||||||
390 | Verizon Communications, Inc. | 4.672 | 03/15/55 | 359,628 | |||||||||||||||
125 | Viacom, Inc. | 5.85 | 09/01/43 | 122,998 | |||||||||||||||
200 | Vodafone Group PLC (United Kingdom) | 4.375 | 02/19/43 | 170,786 | |||||||||||||||
400 | Warner Media LLC | 3.80 | 02/15/27 | 375,965 | |||||||||||||||
225 | Zillow Group, Inc. | 2.00 | 12/01/21 | 219,764 | |||||||||||||||
9,438,611 | |||||||||||||||||||
Consumer, Cyclical (10.4%) | |||||||||||||||||||
275 | Alimentation Couche-Tard, Inc. (Canada) (a) | 3.55 | 07/26/27 | 257,226 | |||||||||||||||
319 | American Airlines Pass-Through Trust | 4.00 | 01/15/27 | 317,013 | |||||||||||||||
507 | British Airways Pass-Through Trust (United Kingdom) (a) | 4.625 | 12/20/25 | 519,745 | |||||||||||||||
625 | CVS Health Corp. | 4.30 | 03/25/28 | 612,156 | |||||||||||||||
525 | CVS Health Corp. | 4.78 | 03/25/38 | 504,636 | |||||||||||||||
325 | Darden Restaurants, Inc. | 3.85 | 05/01/27 | 313,201 | |||||||||||||||
25 | Darden Restaurants, Inc. | 4.55 | 02/15/48 | 23,065 | |||||||||||||||
475 | Delta Air Lines, Inc. | 3.625 | 03/15/22 | 465,177 | |||||||||||||||
525 | Dollar Tree, Inc. | 4.00 | 05/15/25 | 505,410 | |||||||||||||||
110 | Dollar Tree, Inc. | 4.20 | 05/15/28 | 104,390 | |||||||||||||||
300 | Ferguson Finance PLC (United Kingdom) (a) | 4.50 | 10/24/28 | 300,289 | |||||||||||||||
175 | Ford Motor Co. | 4.75 | 01/15/43 | 135,389 | |||||||||||||||
300 | Ford Motor Credit Co., LLC | 3.096 | 05/04/23 | 271,463 | |||||||||||||||
300 | General Motors Co. | 6.60 | 04/01/36 | 292,790 | |||||||||||||||
125 | Home Depot, Inc. (The) | 4.50 | 12/06/48 | 129,368 | |||||||||||||||
125 | Home Depot, Inc. (The) | 4.875 | 02/15/44 | 133,708 | |||||||||||||||
175 | Home Depot, Inc. (The) | 5.875 | 12/16/36 | 210,624 | |||||||||||||||
225 | Jaguar Land Rover Automotive PLC (United Kingdom) (a) | 4.50 | 10/01/27 | 168,750 | |||||||||||||||
150 | Kohl's Corp. | 5.55 | 07/17/45 | 140,743 | |||||||||||||||
400 | Lowe's Cos., Inc. | 2.50 | 04/15/26 | 356,126 | |||||||||||||||
50 | Newell Brands, Inc. | 3.85 | 04/01/23 | 49,315 | |||||||||||||||
325 | Newell Brands, Inc. | 4.20 | 04/01/26 | 317,923 | |||||||||||||||
See Notes to Financial Statements
11
Morgan Stanley Variable Investment Series - Income Plus
Portfolio of Investments n December 31, 2018 continued
| PRINCIPAL AMOUNT (000) | COUPON RATE | MATURITY DATE | VALUE | ||||||||||||||||
$ | 550 | Sands China Ltd. (China) (a) | 5.40 | % | 08/08/28 | $ | 532,155 | ||||||||||||
225 | Starbucks Corp. | 4.00 | 11/15/28 | 223,629 | |||||||||||||||
221 | United Airlines Pass-Through Trust, Class A | 4.30 | 02/15/27 | 225,851 | |||||||||||||||
200 | Valeo SA, Series FRT (France) | 0.00 | (b) | 06/16/21 | 179,800 | ||||||||||||||
275 | Volkswagen Group of America Finance LLC (Germany) (a) | 4.75 | 11/13/28 | 266,853 | |||||||||||||||
200 | Walmart, Inc. | 3.625 | 12/15/47 | 184,600 | |||||||||||||||
300 | Wyndham Destinations, Inc. | 5.40 | 04/01/24 | 287,250 | |||||||||||||||
8,028,645 | |||||||||||||||||||
Consumer, Non-Cyclical (9.0%) | |||||||||||||||||||
600 | Anheuser-Busch Cos. LLC / Anheuser-Busch InBev Worldwide, Inc. (Belgium) (a) | 4.90 | 02/01/46 | 557,637 | |||||||||||||||
300 | Ashtead Capital, Inc. (United Kingdom) (a) | 4.125 | 08/15/25 | 276,000 | |||||||||||||||
200 | Ashtead Capital, Inc. (United Kingdom) (a) | 5.25 | 08/01/26 | 194,000 | |||||||||||||||
200 | Bayer US Finance II LLC (Germany) (a) | 4.375 | 12/15/28 | 191,329 | |||||||||||||||
350 | Celgene Corp. | 4.55 | 02/20/48 | 304,452 | |||||||||||||||
250 | Cencosud SA (Chile) (a) | 6.625 | 02/12/45 | 233,623 | |||||||||||||||
499 | Cigna Corp. (a) | 4.375 | 10/15/28 | 502,757 | |||||||||||||||
175 | Cigna Holding Co. | 3.875 | 10/15/47 | 146,709 | |||||||||||||||
225 | Conagra Brands, Inc. | 4.85 | 11/01/28 | 221,686 | |||||||||||||||
225 | Conagra Brands, Inc. | 5.40 | 11/01/48 | 207,952 | |||||||||||||||
275 | Constellation Brands, Inc. | 4.40 | 11/15/25 | 275,941 | |||||||||||||||
225 | DP World Ltd. (United Arab Emirates) (a) | 5.625 | 09/25/48 | 212,400 | |||||||||||||||
312 | EMD Finance LLC (Germany) (a) | 3.25 | 03/19/25 | 299,651 | |||||||||||||||
100 | Express Scripts Holding Co. | 4.50 | 02/25/26 | 101,503 | |||||||||||||||
225 | Gilead Sciences, Inc. | 4.80 | 04/01/44 | 226,156 | |||||||||||||||
275 | Grupo Bimbo SAB de CV (Mexico) (a) | 3.875 | 06/27/24 | 270,752 | |||||||||||||||
215 | HCA, Inc. | 4.50 | 02/15/27 | 203,712 | |||||||||||||||
250 | Humana, Inc. | 3.95 | 03/15/27 | 244,669 | |||||||||||||||
125 | Keurig Dr Pepper, Inc. (a) | 5.085 | 05/25/48 | 119,310 | |||||||||||||||
200 | Medtronic, Inc. | 4.625 | 03/15/45 | 210,173 | |||||||||||||||
150 | Novartis Capital Corp. (Switzerland) | 4.40 | 05/06/44 | 160,613 | |||||||||||||||
600 | Takeda Pharmaceutical Co. Ltd. (Japan) (a) | 5.00 | 11/26/28 | 613,984 | |||||||||||||||
75 | Teva Pharmaceutical Finance Netherlands III BV (Israel) | 2.80 | 07/21/23 | 64,660 | |||||||||||||||
325 | Teva Pharmaceutical Finance Netherlands III BV (Israel) | 6.75 | 03/01/28 | 315,434 | |||||||||||||||
325 | Thermo Fisher Scientific, Inc. | 2.95 | 09/19/26 | 300,434 | |||||||||||||||
175 | Transurban Finance Co., Pty Ltd. (Australia) (a) | 3.375 | 03/22/27 | 160,807 | |||||||||||||||
300 | Transurban Finance Co., Pty Ltd. (Australia) (a) | 4.125 | 02/02/26 | 293,024 | |||||||||||||||
6,909,368 | |||||||||||||||||||
See Notes to Financial Statements
12
Morgan Stanley Variable Investment Series - Income Plus
Portfolio of Investments n December 31, 2018 continued
| PRINCIPAL AMOUNT (000) | COUPON RATE | MATURITY DATE | VALUE | ||||||||||||||||
Diversified (0.3%) | |||||||||||||||||||
$ | 200 | Alfa SAB de CV (Mexico) (a) | 5.25 | % | 03/25/24 | $ | 199,502 | ||||||||||||
Energy (9.0%) | |||||||||||||||||||
175 | Andeavor Logistics LP/Tesoro Logistics Finance Corp. | 5.20 | 12/01/47 | 158,107 | |||||||||||||||
200 | APT Pipelines Ltd. (Australia) (a) | 4.20 | 03/23/25 | 195,043 | |||||||||||||||
200 | BG Energy Capital PLC (United Kingdom) (a) | 5.125 | 10/15/41 | 206,811 | |||||||||||||||
500 | BP Capital Markets America, Inc. | 3.119 | 05/04/26 | 470,621 | |||||||||||||||
225 | Buckeye Partners LP | 4.125 | 12/01/27 | 202,682 | |||||||||||||||
300 | Cenovus Energy, Inc. (Canada) | 4.25 | 04/15/27 | 273,712 | |||||||||||||||
250 | Cimarex Energy Co. | 3.90 | 05/15/27 | 232,391 | |||||||||||||||
650 | Columbia Pipeline Group, Inc. | 4.50 | 06/01/25 | 655,555 | |||||||||||||||
375 | Concho Resources, Inc. | 3.75 | 10/01/27 | 353,658 | |||||||||||||||
125 | Concho Resources, Inc. | 4.85 | 08/15/48 | 120,063 | |||||||||||||||
325 | ConocoPhillips Co. | 4.95 | 03/15/26 | 348,104 | |||||||||||||||
50 | Energy Transfer Operating L.P. | 5.15 | 03/15/45 | 43,400 | |||||||||||||||
300 | Energy Transfer Operating L.P. | 5.30 | 04/15/47 | 265,320 | |||||||||||||||
175 | Enterprise Products Operating LLC | 5.95 | 02/01/41 | 191,882 | |||||||||||||||
250 | Exxon Mobil Corp. | 4.114 | 03/01/46 | 254,405 | |||||||||||||||
125 | Halliburton Co. | 5.00 | 11/15/45 | 123,178 | |||||||||||||||
175 | Hilcorp Energy I LP/Hilcorp Finance Co. (a) | 6.25 | 11/01/28 | 154,656 | |||||||||||||||
200 | Kinder Morgan, Inc. | 5.55 | 06/01/45 | 198,755 | |||||||||||||||
450 | Marathon Petroleum Corp. (a) | 4.75 | 12/15/23 | 462,234 | |||||||||||||||
325 | MPLX LP | 4.00 | 02/15/25 | 316,064 | |||||||||||||||
25 | MPLX LP | 4.875 | 06/01/25 | 25,262 | |||||||||||||||
150 | MPLX LP | 5.20 | 03/01/47 | 138,564 | |||||||||||||||
200 | Patterson-UTI Energy, Inc. | 3.95 | 02/01/28 | 183,741 | |||||||||||||||
175 | Plains All American Pipeline LP/PAA Finance Corp. | 4.50 | 12/15/26 | 168,838 | |||||||||||||||
200 | Rockies Express Pipeline LLC (a) | 6.875 | 04/15/40 | 210,000 | |||||||||||||||
450 | Santos Finance Ltd. (Australia) | 4.125 | 09/14/27 | 402,704 | |||||||||||||||
200 | Transportadora de Gas Internacional SA ESP (Colombia) (a) | 5.55 | 11/01/28 | 202,750 | |||||||||||||||
450 | Woodside Finance Ltd. (Australia) (a) | 3.70 | 09/15/26 | 415,348 | |||||||||||||||
6,973,848 | |||||||||||||||||||
Finance (35.0%) | |||||||||||||||||||
600 | ABN AMRO Bank N.V. (Netherlands) (a) | 4.75 | 07/28/25 | 598,165 | |||||||||||||||
150 | AerCap Ireland Capital DAC/AerCap Global Aviation Trust (Ireland) | 3.50 | 05/26/22 | 145,549 | |||||||||||||||
See Notes to Financial Statements
13
Morgan Stanley Variable Investment Series - Income Plus
Portfolio of Investments n December 31, 2018 continued
| PRINCIPAL AMOUNT (000) | COUPON RATE | MATURITY DATE | VALUE | ||||||||||||||||
$ | 350 | AerCap Ireland Capital DAC/AerCap Global Aviation Trust (Ireland) | 4.125 | % | 07/03/23 | $ | 341,790 | ||||||||||||
225 | Air Lease Corp. | 2.625 | 07/01/22 | 213,454 | |||||||||||||||
275 | Alexandria Real Estate Equities, Inc. | 3.95 | 01/15/27 | 267,293 | |||||||||||||||
175 | American Express Co. | 4.20 | 11/06/25 | 178,654 | |||||||||||||||
300 | American International Group, Inc. | 4.50 | 07/16/44 | 268,696 | |||||||||||||||
625 | Bank of America Corp. | 4.244 | 04/24/38 | 595,673 | |||||||||||||||
205 | Bank of America Corp. | 7.75 | 05/14/38 | 265,861 | |||||||||||||||
625 | Bank of America Corp., MTN | 4.25 | 10/22/26 | 608,472 | |||||||||||||||
550 | BNP Paribas SA (France) (a) | 4.40 | 08/14/28 | 537,862 | |||||||||||||||
400 | Boston Properties LP | 3.65 | 02/01/26 | 387,660 | |||||||||||||||
250 | BPCE SA (France) (a) | 4.00 | 09/12/23 | 246,226 | |||||||||||||||
625 | BPCE SA (France) (a) | 5.15 | 07/21/24 | 628,340 | |||||||||||||||
450 | Brighthouse Financial, Inc., Series WI | 3.70 | 06/22/27 | 380,905 | |||||||||||||||
450 | Brixmor Operating Partnership LP | 4.125 | 06/15/26 | 436,438 | |||||||||||||||
400 | Brookfield Finance, Inc. (Canada) | 4.25 | 06/02/26 | 392,474 | |||||||||||||||
275 | Capital One Financial Corp. | 3.30 | 10/30/24 | 260,420 | |||||||||||||||
625 | Capital One Financial Corp. | 3.75 | 03/09/27 | 581,500 | |||||||||||||||
425 | Citigroup, Inc. | 4.45 | 09/29/27 | 410,060 | |||||||||||||||
225 | Citigroup, Inc. | 4.75 | 05/18/46 | 208,771 | |||||||||||||||
350 | Citigroup, Inc. | 8.125 | 07/15/39 | 486,975 | |||||||||||||||
200 | Commerzbank AG (Germany) (a) | 8.125 | 09/19/23 | 219,617 | |||||||||||||||
400 | Compass Bank | 3.50 | 06/11/21 | 399,116 | |||||||||||||||
575 | Credit Agricole SA (France) (a) | 3.75 | 04/24/23 | 563,214 | |||||||||||||||
250 | Credit Agricole SA (France) (a) | 4.125 | 01/10/27 | 241,481 | |||||||||||||||
250 | Credit Suisse Group AG (Switzerland) (a) | 3.574 | 01/09/23 | 244,108 | |||||||||||||||
400 | Crown Castle International Corp. | 3.80 | 02/15/28 | 379,234 | |||||||||||||||
150 | CubeSmart LP | 3.125 | 09/01/26 | 137,788 | |||||||||||||||
450 | Deutsche Bank AG (Germany) | 2.70 | 07/13/20 | 437,848 | |||||||||||||||
225 | Deutsche Bank AG (Germany) | 3.15 | 01/22/21 | 217,542 | |||||||||||||||
425 | Discover Bank | 7.00 | 04/15/20 | 442,600 | |||||||||||||||
300 | Discover Financial Services | 3.95 | 11/06/24 | 296,391 | |||||||||||||||
175 | Extra Space Storage LP (a) | 3.125 | 10/01/35 | 189,695 | |||||||||||||||
450 | Five Corners Funding Trust (a) | 4.419 | 11/15/23 | 463,455 | |||||||||||||||
500 | GE Capital International Funding Co., Unlimited Co. | 4.418 | 11/15/35 | 419,960 | |||||||||||||||
275 | Goldman Sachs Group, Inc. (The) | 4.223 | 05/01/29 | 265,160 | |||||||||||||||
375 | Goldman Sachs Group, Inc. (The) | 6.25 | 02/01/41 | 428,516 | |||||||||||||||
525 | Goldman Sachs Group, Inc. (The) | 6.75 | 10/01/37 | 593,860 | |||||||||||||||
150 | Great-West Lifeco Finance 2018 LP (Canada) (a) | 4.581 | 05/17/48 | 151,215 | |||||||||||||||
See Notes to Financial Statements
14
Morgan Stanley Variable Investment Series - Income Plus
Portfolio of Investments n December 31, 2018 continued
| PRINCIPAL AMOUNT (000) | COUPON RATE | MATURITY DATE | VALUE | ||||||||||||||||
$ | 250 | Guardian Life Insurance Co. of America (The) (a) | 4.85 | % | 01/24/77 | $ | 246,730 | ||||||||||||
400 | Healthcare Trust of America Holdings LP | 3.70 | 04/15/23 | 394,236 | |||||||||||||||
375 | High Street Funding Trust I (a) | 4.111 | 02/15/28 | 369,202 | |||||||||||||||
525 | HSBC Holdings PLC (United Kingdom) | 3.90 | 05/25/26 | 503,535 | |||||||||||||||
425 | HSBC Holdings PLC (United Kingdom) | 3.95 | 05/18/24 | 422,957 | |||||||||||||||
250 | HSBC Holdings PLC (United Kingdom) | 4.375 | 11/23/26 | 242,428 | |||||||||||||||
250 | ING Groep N.V. (Netherlands) (a) | 4.625 | 01/06/26 | 252,062 | |||||||||||||||
250 | iStar, Inc. | 5.25 | 09/15/22 | 234,350 | |||||||||||||||
200 | JPMorgan Chase & Co. | 3.897 | 01/23/49 | 175,848 | |||||||||||||||
480 | JPMorgan Chase & Co. | 4.95 | 06/01/45 | 487,864 | |||||||||||||||
200 | JPMorgan Chase Bank NA | 0.00 | (b) | 12/30/20 | 205,596 | ||||||||||||||
575 | LeasePlan Corp. N.V. (Netherlands) (a) | 2.875 | 01/22/19 | 574,793 | |||||||||||||||
275 | Lincoln National Corp. | 7.00 | 06/15/40 | 346,845 | |||||||||||||||
275 | Lloyds Banking Group PLC (United Kingdom) | 3.574 | 11/07/28 | 245,071 | |||||||||||||||
400 | Lloyds Banking Group PLC (United Kingdom) | 3.75 | 01/11/27 | 368,102 | |||||||||||||||
250 | Lloyds Banking Group PLC (United Kingdom) | 4.375 | 03/22/28 | 237,614 | |||||||||||||||
450 | Macquarie Group Ltd. (Australia) (a) | 4.15 | 03/27/24 | 450,485 | |||||||||||||||
125 | Massachusetts Mutual Life Insurance Co. (a) | 4.50 | 04/15/65 | 116,847 | |||||||||||||||
200 | MDC GMTN B.V. (United Arab Emirates) (a) | 4.50 | 11/07/28 | 205,375 | |||||||||||||||
250 | MetLife, Inc. (See Note 8) | 5.70 | 06/15/35 | 282,093 | |||||||||||||||
250 | MPT Operating Partnership LP/MPT Finance Corp. | 5.00 | 10/15/27 | 229,219 | |||||||||||||||
300 | Nationwide Building Society (United Kingdom) (a) | 4.302 | 03/08/29 | 282,420 | |||||||||||||||
425 | Nationwide Building Society (United Kingdom) (a) | 4.363 | 08/01/24 | 416,811 | |||||||||||||||
360 | Power Finance Corp. Ltd. (India) (a) | 6.15 | 12/06/28 | 354,093 | |||||||||||||||
150 | Prologis LP | 3.875 | 09/15/28 | 153,008 | |||||||||||||||
575 | Realty Income Corp. | 3.25 | 10/15/22 | 569,900 | |||||||||||||||
575 | Royal Bank of Scotland Group PLC (United Kingdom) | 3.875 | 09/12/23 | 551,828 | |||||||||||||||
750 | Santander UK Group Holdings PLC (United Kingdom) | 3.571 | 01/10/23 | 718,552 | |||||||||||||||
300 | Santander UK Group Holdings PLC (United Kingdom) | 4.796 | 11/15/24 | 298,202 | |||||||||||||||
325 | Santander UK PLC (United Kingdom) (a) | 5.00 | 11/07/23 | 318,056 | |||||||||||||||
125 | Spirit Realty Capital, Inc. | 3.75 | 05/15/21 | 122,584 | |||||||||||||||
50 | Synchrony Financial | 3.70 | 08/04/26 | 42,480 | |||||||||||||||
425 | Synchrony Financial | 3.95 | 12/01/27 | 358,616 | |||||||||||||||
125 | TD Ameritrade Holding Corp. | 3.30 | 04/01/27 | 119,685 | |||||||||||||||
350 | TD Ameritrade Holding Corp. | 3.625 | 04/01/25 | 347,047 | |||||||||||||||
525 | UBS Group Funding Switzerland AG (Switzerland) (a) | 3.491 | 05/23/23 | 512,305 | |||||||||||||||
See Notes to Financial Statements
15
Morgan Stanley Variable Investment Series - Income Plus
Portfolio of Investments n December 31, 2018 continued
| PRINCIPAL AMOUNT (000) | COUPON RATE | MATURITY DATE | VALUE | ||||||||||||||||
$ | 325 | WEA Finance LLC/Westfield UK & Europe Finance PLC (a) | 3.25 | % | 10/05/20 | $ | 324,631 | ||||||||||||
225 | Wells Fargo & Co. | 3.00 | 10/23/26 | 208,502 | |||||||||||||||
250 | Wells Fargo & Co., MTN | 4.10 | 06/03/26 | 244,364 | |||||||||||||||
27,066,374 | |||||||||||||||||||
Industrials (4.0%) | |||||||||||||||||||
325 | Aviation Capital Group LLC (a) | 4.375 | 01/30/24 | 325,786 | |||||||||||||||
375 | Burlington Northern Santa Fe LLC | 4.55 | 09/01/44 | 391,884 | |||||||||||||||
165 | Embraer Netherlands Finance BV (Brazil) | 5.40 | 02/01/27 | 170,983 | |||||||||||||||
350 | Fortune Brands Home & Security, Inc. | 4.00 | 09/21/23 | 346,658 | |||||||||||||||
200 | Harris Corp. | 4.854 | 04/27/35 | 198,979 | |||||||||||||||
510 | Heathrow Funding Ltd. (United Kingdom) (a) | 4.875 | 07/15/23 | 526,852 | |||||||||||||||
425 | Nvent Finance Sarl (United Kingdom) | 3.95 | 04/15/23 | 422,372 | |||||||||||||||
250 | Trimble, Inc. | 4.90 | 06/15/28 | 246,616 | |||||||||||||||
125 | Tyco Electronics Group SA (Switzerland) | 3.125 | 08/15/27 | 115,839 | |||||||||||||||
375 | Wabtec Corp. | 4.70 | 09/15/28 | 352,368 | |||||||||||||||
3,098,337 | |||||||||||||||||||
Technology (4.4%) | |||||||||||||||||||
175 | Akamai Technologies, Inc. | 0.00 | (b) | 02/15/19 | 174,348 | ||||||||||||||
425 | Apple, Inc. | 2.45 | 08/04/26 | 393,200 | |||||||||||||||
400 | Apple, Inc. | 3.85 | 08/04/46 | 372,913 | |||||||||||||||
200 | Dell International LLC/EMC Corp. (a) | 8.10 | 07/15/36 | 217,887 | |||||||||||||||
200 | Fiserv, Inc. | 4.20 | 10/01/28 | 199,995 | |||||||||||||||
525 | Microsoft Corp. | 4.45 | 11/03/45 | 558,155 | |||||||||||||||
250 | Nuance Communications, Inc. | 1.00 | 12/15/35 | 217,786 | |||||||||||||||
125 | NXP BV / NXP Funding LLC (Netherlands) (a) | 4.875 | 03/01/24 | 125,705 | |||||||||||||||
200 | NXP Semiconductors N.V. (Netherlands) | 1.00 | 12/01/19 | 200,601 | |||||||||||||||
200 | Oracle Corp. | 3.80 | 11/15/37 | 187,402 | |||||||||||||||
350 | Oracle Corp. | 4.00 | 11/15/47 | 326,907 | |||||||||||||||
200 | STMicroelectronics NV, Series B (Switzerland) | 0.25 | 07/03/24 | 201,774 | |||||||||||||||
250 | Verint Systems, Inc. | 1.50 | 06/01/21 | 243,096 | |||||||||||||||
3,419,769 | |||||||||||||||||||
Utilities (10.1%) | |||||||||||||||||||
250 | Abu Dhabi National Energy Co., PJSC (United Arab Emirates) (a) | 4.375 | 06/22/26 | 246,980 | |||||||||||||||
400 | Alabama Power Co. | 3.75 | 03/01/45 | 369,815 | |||||||||||||||
175 | Black Hills Corp. | 3.15 | 01/15/27 | 164,112 | |||||||||||||||
75 | Black Hills Corp. | 4.35 | 05/01/33 | 75,365 | |||||||||||||||
250 | Boston Gas Co. (a) | 4.487 | 02/15/42 | 252,792 | |||||||||||||||
175 | Cleveland Electric Illuminating Co. (The) (a) | 4.55 | 11/15/30 | 179,708 | |||||||||||||||
See Notes to Financial Statements
16
Morgan Stanley Variable Investment Series - Income Plus
Portfolio of Investments n December 31, 2018 continued
| PRINCIPAL AMOUNT (000) | COUPON RATE | MATURITY DATE | VALUE | ||||||||||||||||
$ | 275 | Duke Energy Carolinas LLC | 3.75 | % | 06/01/45 | $ | 254,051 | ||||||||||||
550 | EDP Finance BV (Portugal) (a) | 3.625 | 07/15/24 | 515,983 | |||||||||||||||
350 | Electricite de France SA (France) (a) | 4.50 | 09/21/28 | 339,628 | |||||||||||||||
450 | Emera US Finance LP (Canada) | 3.55 | 06/15/26 | 427,417 | |||||||||||||||
125 | Enel Chile SA (Chile) | 4.875 | 06/12/28 | 125,000 | |||||||||||||||
275 | Enel Finance International N.V. (Italy) (a) | 4.875 | 06/14/29 | 262,860 | |||||||||||||||
225 | Enel Finance International N.V. (Italy) (a) | 6.00 | 10/07/39 | 223,706 | |||||||||||||||
410 | Enel SpA (Italy) (a) | 8.75 | 09/24/73 | 420,250 | |||||||||||||||
300 | Entergy Arkansas LLC | 3.50 | 04/01/26 | 298,474 | |||||||||||||||
150 | Entergy Louisiana LLC | 3.05 | 06/01/31 | 136,750 | |||||||||||||||
300 | Fortis, Inc., Series WI (Canada) | 2.10 | 10/04/21 | 288,600 | |||||||||||||||
50 | Indiana Michigan Power Co. | 4.25 | 08/15/48 | 49,349 | |||||||||||||||
275 | Mid-Atlantic Interstate Transmission LLC (a) | 4.10 | 05/15/28 | 273,568 | |||||||||||||||
250 | Mississippi Power Co. | 3.95 | 03/30/28 | 247,187 | |||||||||||||||
450 | NextEra Energy Capital Holdings, Inc. | 3.55 | 05/01/27 | 430,174 | |||||||||||||||
225 | Oglethorpe Power Corp. (a) | 5.05 | 10/01/48 | 227,391 | |||||||||||||||
250 | South Carolina Electric & Gas Co. | 4.50 | 06/01/64 | 231,924 | |||||||||||||||
150 | Southern California Edison Co. | 4.00 | 04/01/47 | 137,848 | |||||||||||||||
525 | Trans-Allegheny Interstate Line Co. (a) | 3.85 | 06/01/25 | 523,515 | |||||||||||||||
396 | TransAlta Corp. (Canada) | 4.50 | 11/15/22 | 387,109 | |||||||||||||||
475 | Virginia Electric & Power Co., Series B | 4.20 | 05/15/45 | 462,587 | |||||||||||||||
250 | Xcel Energy, Inc. | 3.30 | 06/01/25 | 244,649 | |||||||||||||||
7,796,792 | |||||||||||||||||||
| Total Corporate Bonds (Cost $78,858,370) | 76,562,266 | ||||||||||||||||||
Short-Term Investments (1.2%) | |||||||||||||||||||
U.S. Treasury Security (1.1%) | |||||||||||||||||||
889 | U.S. Treasury Bill (c)(d) (Cost $884,464) | 2.38 | 03/21/19 | 884,500 | |||||||||||||||
See Notes to Financial Statements
17
Morgan Stanley Variable Investment Series - Income Plus
Portfolio of Investments n December 31, 2018 continued
| NUMBER OF SHARES (000) | VALUE | ||||||||||||||
Investment Company (0.1%) | |||||||||||||||
66 | Morgan Stanley Institutional Liquidity Funds - Government Portfolio - Institutional Class (See Note 8) (Cost $65,781) | $ | 65,781 | ||||||||||||
| Total Short-Term Investments (Cost $950,245) | 950,281 | ||||||||||||||
| Total Investments (Cost $79,808,615) (e)(f) | 100.3 | % | 77,512,547 | ||||||||||||
Liabilities in Excess of Other Assets | (0.3 | ) | (250,435 | ) | |||||||||||
Net Assets | 100.0 | % | $ | 77,262,112 | |||||||||||
MTN Medium Term Note.
PJSC Public Joint Stock Company.
(a) 144A security - Certain conditions for public sale may exist. Unless otherwise noted, these securities are deemed to be liquid.
(b) Capital appreciation bond.
(c) Rate shown is the yield to maturity at December 31, 2018.
(d) All or a portion of the security was pledged to cover margin requirements for futures contracts and swap agreements.
(e) Securities are available for collateral in connection with purchase of open futures contracts and swap agreements.
(f) At December 31, 2018, the aggregate cost for federal income tax purposes is $79,929,683. The aggregate gross unrealized appreciation is $620,743 and the aggregate gross unrealized depreciation is $3,018,473, resulting in net unrealized depreciation of $2,397,730.
FUTURES CONTRACTS:
The Fund had the following futures contracts open at December 31, 2018:
| NUMBER OF CONTRACTS | EXPIRATION DATE | NOTIONAL AMOUNT (000) | VALUE | UNREALIZED APPRECIATION (DEPRECIATION) | |||||||||||||||||||
Long: | |||||||||||||||||||||||
U.S. Treasury 2 yr. Note | 83 | Mar-19 | 16,600 | $ | 17,621,938 | $ | 119,312 | ||||||||||||||||
U.S. Treasury 30 yr. Bond | 13 | Mar-19 | 1,300 | 1,898,000 | 88,766 | ||||||||||||||||||
U.S. Treasury Ultra Bond | 9 | Mar-19 | 900 | 1,445,906 | 61,964 | ||||||||||||||||||
Short: | |||||||||||||||||||||||
U.S. Treasury 10 yr. Note | 7 | Mar-19 | (700 | ) | (854,109 | ) | (8,359 | ) | |||||||||||||||
U.S. Treasury 5 yr. Note | 32 | Mar-19 | (3,200 | ) | (3,670,000 | ) | (57,379 | ) | |||||||||||||||
U.S. Treasury 10 yr. Ultra Long Bond | 53 | Mar-19 | (5,300 | ) | (6,894,141 | ) | (193,656 | ) | |||||||||||||||
$ | 10,648 | ||||||||||||||||||||||
See Notes to Financial Statements
18
Morgan Stanley Variable Investment Series - Income Plus
Portfolio of Investments n December 31, 2018 continued
INTEREST RATE SWAP AGREEMENTS:
The Fund had the following interest rate swap agreements open at December 31, 2018:
| SWAP COUNTERPARTY | FLOATING RATE INDEX | PAY/RECEIVE FLOATING RATE | FIXED RATE | PAYMENT FREQUENCY PAID/RECEIVED | MATURITY DATE | NOTIONAL AMOUNT (000) | VALUE | UPFRONT PAYMENT PAID | UNREALIZED APPRECIATION (DEPRECIATION) | ||||||||||||||||||||||||||||||
| Morgan Stanley & Co., LLC* | 3 Month LIBOR | Receive | 3.21 | % | Semi-Annual/ Quarterly | 12/3/48 | $ | 1,000 | $ | (71,132 | ) | $ | — | $ | (71,132 | ) | |||||||||||||||||||||||
| Morgan Stanley & Co., LLC* | 3 Month LIBOR | Receive | 2.48 | Semi-Annual/ Quarterly | 12/21/26 | 5,897 | 79,890 | — | 79,890 | ||||||||||||||||||||||||||||||
$ | 8,758 | $ | — | $ | 8,758 | ||||||||||||||||||||||||||||||||||
* Cleared swap agreement,the broker is Morgan Stanley & Co., LLC.
LIBOR London Interbank Offered Rate.
LONG TERM CREDIT ANALYSIS+
AAA | 2.2 | % | |||||
AA | 6.2 | ||||||
A | 43.5 | ||||||
BBB | 43.9 | ||||||
BB | 2.4 | ||||||
B or Below | 0.5 | ||||||
Not Rated | 1.3 | ||||||
100.0 | %++ | ||||||
+ The ratings shown are based on the Fund's security ratings as determined by Standard & Poor's, Moody's or Fitch, each a Nationally Recognized Statistical Ratings Organization ("NRSRO").
++ Does not include open long/short futures contracts with a value of $32,384,094 and net unrealized appreciation of $10,648. Does not include open swap agreements with net unrealized appreciation of $8,758.
See Notes to Financial Statements
19
Morgan Stanley Variable Investment Series - Multi Cap Growth
Portfolio of Investments n December 31, 2018
| NUMBER OF SHARES | VALUE | ||||||||||
Common Stocks (90.5%) | |||||||||||
Biotechnology (1.0%) | |||||||||||
14,481 | Alnylam Pharmaceuticals, Inc. (a) | $ | 1,055,810 | ||||||||
2,065 | Bluebird Bio, Inc. (a) | 204,848 | |||||||||
13,350 | Editas Medicine, Inc. (a) | 303,712 | |||||||||
17,541 | Intellia Therapeutics, Inc. (a) | 239,435 | |||||||||
29,373 | Intrexon Corp. (a)(b) | 192,099 | |||||||||
33,406 | Moderna, Inc. (a)(b) | 510,110 | |||||||||
2,506,014 | |||||||||||
Entertainment (3.0%) | |||||||||||
65,665 | Spotify Technology SA (a) | 7,452,978 | |||||||||
| Health Care Equipment & Supplies (10.2%) | |||||||||||
69,106 | DexCom, Inc. (a) | 8,278,899 | |||||||||
24,305 | Intuitive Surgical, Inc. (a) | 11,640,150 | |||||||||
21,874 | LivaNova PLC (a) | 2,000,815 | |||||||||
31,469 | Penumbra, Inc. (a) | 3,845,512 | |||||||||
25,765,376 | |||||||||||
| Health Care Providers & Services (5.7%) | |||||||||||
105,457 | Guardant Health, Inc. (a) | 3,964,129 | |||||||||
176,282 | HealthEquity, Inc. (a) | 10,515,221 | |||||||||
14,479,350 | |||||||||||
| Health Care Technology (8.7%) | |||||||||||
71,069 | athenahealth, Inc. (a) | 9,376,133 | |||||||||
140,902 | Veeva Systems, Inc., Class A (a) | 12,585,367 | |||||||||
21,961,500 | |||||||||||
| Information Technology Services (14.6%) | |||||||||||
157,116 | MongoDB, Inc. (a) | 13,156,894 | |||||||||
111,805 | Okta, Inc. (a) | 7,133,159 | |||||||||
47,071 | Shopify, Inc., Class A (a) | 6,516,980 | |||||||||
59,350 | Square, Inc., Class A (a) | 3,328,941 | |||||||||
75,006 | Twilio, Inc., Class A (a) | 6,698,036 | |||||||||
36,834,010 | |||||||||||
| NUMBER OF SHARES | VALUE | ||||||||||
| Interactive Media & Services (6.5%) | |||||||||||
291,921 | Angi Homeservices, Inc., Class A (a) | $ | 4,691,170 | ||||||||
408,352 | Twitter, Inc. (a) | 11,736,037 | |||||||||
16,427,207 | |||||||||||
| Internet & Direct Marketing Retail (13.9%) | |||||||||||
12,799 | Amazon.com, Inc. (a) | 19,223,714 | |||||||||
224,821 | Farfetch Ltd., Class A (a) | 3,981,580 | |||||||||
80,533 | GrubHub, Inc. (a) | 6,185,739 | |||||||||
12,181 | MercadoLibre, Inc. | 3,567,206 | |||||||||
153,555 | Overstock.com, Inc. (a)(b) | 2,085,277 | |||||||||
35,043,516 | |||||||||||
| Life Sciences Tools & Services (4.8%) | |||||||||||
40,096 | Illumina, Inc. (a) | 12,025,993 | |||||||||
Pharmaceuticals (0.1%) | |||||||||||
4,315 | Nektar Therapeutics (a) | 141,834 | |||||||||
Software (22.0%) | |||||||||||
200,195 | Coupa Software, Inc. (a) | 12,584,257 | |||||||||
54,864 | Elastic N.V. (a) | 3,921,679 | |||||||||
86,804 | salesforce.com, Inc. (a) | 11,889,544 | |||||||||
70,879 | ServiceNow, Inc. (a) | 12,620,006 | |||||||||
89,385 | Workday, Inc., Class A (a) | 14,272,997 | |||||||||
55,288,483 | |||||||||||
| Total Common Stocks (Cost $186,511,128) | 227,926,261 | ||||||||||
Preferred Stocks (6.3%) | |||||||||||
| Electronic Equipment, Instruments & Components (0.2%) | |||||||||||
18,954 | Magic Leap, Series C (a)(c)(d)(e) (acquisition cost - $436,567; acquired 12/22/15) | 511,758 | |||||||||
See Notes to Financial Statements
20
Morgan Stanley Variable Investment Series - Multi Cap Growth
Portfolio of Investments n December 31, 2018 continued
| NUMBER OF SHARES | VALUE | ||||||||||
| Internet & Direct Marketing Retail (3.0%) | |||||||||||
50,711 | Uber Technologies, Series G (a)(c)(d)(e) (acquisition cost - $2,473,289; acquired 12/03/15) | $ | 2,339,298 | ||||||||
42,717 | Airbnb, Inc., Series D (a)(c)(d)(e) (acquisition cost - $1,739,139; acquired 04/16/14) | 5,158,078 | |||||||||
7,497,376 | |||||||||||
| Life Sciences Tools & Services (2.9%) | |||||||||||
627,809 | 10X Genomics, Inc., Series B (a)(c)(d)(e) (acquisition cost - $2,052,935; acquired 12/19/14) | 7,383,034 | |||||||||
Software (0.2%) | |||||||||||
141,612 | Lookout, Inc., Series F (a)(c)(d)(e) (acquisition cost - $1,617,648; acquired 06/17/14) | 345,533 | |||||||||
| Total Preferred Stocks (Cost $8,319,578) | 15,737,701 | ||||||||||
| NUMBER OF SHARES (000) | |||||||||||
Short-Term Investments (4.3%) | |||||||||||
| Securities held as Collateral on Loaned Securities (1.1%) | |||||||||||
Investment Company (0.9%) | |||||||||||
2,224 | Morgan Stanley Institutional Liquidity Funds - Treasury Securities Portfolio - Institutional Class (See Note 8) | 2,224,127 | |||||||||
| PRINCIPAL (000) | AMOUNT | VALUE | |||||||||
Repurchase Agreements (0.2%) | |||||||||||
$ | 168 | Barclays Capital, Inc. (2.90%, dated 12/31/18, due 01/02/19; proceeds $168,017; fully collateralized by a U.S. Government obligation; 2.50% due 05/15/24; valued at $171,351) | $ | 167,990 | |||||||
340 | HSBC Securities USA, Inc. (2.95%, dated 12/31/18, due 01/02/19; proceeds $340,483; fully collateralized by U.S. Government obligations; 0.00% - 2.75% due 01/31/19 - 02/15/42; valued at $347,236) | 340,427 | |||||||||
508,417 | |||||||||||
| Total Securities held as Collateral on Loaned Securities (Cost $2,732,544) | 2,732,544 | ||||||||||
See Notes to Financial Statements
21
Morgan Stanley Variable Investment Series - Multi Cap Growth
Portfolio of Investments n December 31, 2018 continued
| NUMBER OF SHARES (000) | VALUE | ||||||||||
Investment Company (3.2%) | |||||||||||
8,180 | Morgan Stanley Institutional Liquidity Funds - Treasury Securities Portfolio - Institutional Class (See Note 8) (Cost $8,179,938) | $ | 8,179,938 | ||||||||
| Total Short-Term Investments (Cost $10,912,482) | 10,912,482 | ||||||||||
| Total Investments Excluding Purchased Options (Cost $205,743,188) | 101.1 | % | 254,576,444 | ||||||||
| Total Purchased Options Outstanding (Cost $854,104) | 0.1 | % | 161,564 | ||||||||
| Total Investments (Cost $206,597,292) (f) | 101.2 | % | 254,738,008 | ||||||||
| Liabilities in Excess of Other Assets | (1.2 | ) | (2,945,561 | ) | |||||||
Net Assets | 100.0 | % | $ | 251,792,447 | |||||||
(a) Non-income producing security.
(b) All or a portion of this security was on loan at December 31, 2018.
(c) At December 31, 2018, the Fund held fair valued securities valued at $15,737,701, representing 6.3% of net assets. These securities have been fair valued as determined in good faith under procedures established by and under the general supervision of the Trust's Trustees.
(d) Illiquid security.
(e) Security cannot be offered for public resale without first being registered under the Securities Act of 1933 and related rules ("restricted security"). Acquisition date represents the day on which an enforceable right to acquire such security is obtained and is presented along with related cost in the security description. The Fund has registration rights for certain restricted securities. Any costs related to such registration are borne by the issuer. The aggregate value of restricted securities (excluding 144A holdings) at December 31, 2018 amounts to $15,737,701 and represents 6.3% of net assets.
(f) At December 31, 2018, the aggregate cost for federal income tax purposes is $209,980,352. The aggregate gross unrealized appreciation is $63,312,364 and the aggregate gross unrealized depreciation is $18,554,708, resulting in net unrealized appreciation of $44,757,656.
See Notes to Financial Statements
22
Morgan Stanley Variable Investment Series - Multi Cap Growth
Portfolio of Investments n December 31, 2018 continued
CALL OPTIONS PURCHASED:
The Fund had the following call options purchased open at December 31, 2018: | |||
COUNTERPARTY | DESCRIPTION | STRIKE PRICE | EXPIRATION DATE | NUMBER OF CONTRACTS | NOTIONAL AMOUNT (000) | VALUE | PREMIUMS PAID | UNREALIZED DEPRECIATION | |||||||||||||||||||||||||||
| Royal Bank of Scotland | USD/CNH | CNH | 7.16 | Jan-19 | 62,531,078 | 62,531 | $ | 6,378 | $ | 271,385 | $ | (265,007 | ) | ||||||||||||||||||||||
| Royal Bank of Scotland | USD/CNH | CNH | 7.78 | Jul-19 | 61,384,070 | 61,384 | 66,479 | 299,089 | (232,610 | ) | |||||||||||||||||||||||||
| Royal Bank of Scotland | USD/CNH | CNH | 8.00 | Oct-19 | 48,236,526 | 48,237 | 88,707 | 283,630 | (194,923 | ) | |||||||||||||||||||||||||
$ | 161,564 | $ | 854,104 | $ | (692,540 | ) | |||||||||||||||||||||||||||||
Currency Abbreviations:
CNH Chinese Yuan Renminbi Offshore.
USD United States Dollar.
SUMMARY OF INVESTMENTS
INDUSTRY | VALUE | PERCENT OF TOTAL INVESTMENTS | |||||||||
Software | $ | 55,634,016 | 22.1 | % | |||||||
Internet & Direct Marketing Retail | 42,540,892 | 16.9 | |||||||||
Information Technology Services | 36,834,010 | 14.6 | |||||||||
Health Care Equipment & Supplies | 25,765,376 | 10.2 | |||||||||
Health Care Technology | 21,961,500 | 8.7 | |||||||||
Life Sciences Tools & Services | 19,409,027 | 7.7 | |||||||||
Interactive Media & Services | 16,427,207 | 6.5 | |||||||||
Health Care Providers & Services | 14,479,350 | 5.7 | |||||||||
Investment Company | 8,179,938 | 3.2 | |||||||||
Entertainment | 7,452,978 | 3.0 | |||||||||
Biotechnology | 2,506,014 | 1.0 | |||||||||
Electronic Equipment, Instruments & Components | 511,758 | 0.2 | |||||||||
Purchased Options | 161,564 | 0.1 | |||||||||
Pharmaceuticals | 141,834 | 0.1 | |||||||||
$ | 252,005,464 | + | 100.0 | % | |||||||
+ Does not reflect the value of securities held as collateral on loaned securities.
See Notes to Financial Statements
23
Morgan Stanley Variable Investment Series
Financial Statements
Statements of Assets and Liabilities
December 31, 2018
| Income Plus | Multi Cap Growth | ||||||||||
Assets: | |||||||||||
Investments in securities, at value* | $ | 77,164,673 | $ | 244,333,943 | (1) | ||||||
Investments in affiliates, at value** | 347,874 | 10,404,065 | |||||||||
Total investments in securities, at value | 77,512,547 | 254,738,008 | |||||||||
Cash | — | 16,780 | |||||||||
Receivable for: | |||||||||||
Interest | 837,762 | — | |||||||||
Dividends | — | 176,424 | |||||||||
Shares of beneficial interest sold | — | 145,423 | |||||||||
Dividends from affiliate | 989 | 14,816 | |||||||||
Securities lending income | — | 6,123 | |||||||||
Foreign withholding taxes reclaimed | 155 | — | |||||||||
Prepaid expenses and other assets | 9,152 | 14,717 | |||||||||
Total Assets | 78,360,605 | 255,112,291 | |||||||||
Liabilities: | |||||||||||
Collateral on securities loaned, at value | — | 2,749,323 | |||||||||
Payable to bank | 6,043 | — | |||||||||
Due to broker | — | 330,000 | |||||||||
Payable for: | |||||||||||
Shares of beneficial interest redeemed | 922,751 | 28,496 | |||||||||
| Advisory fee | 27,979 | 83,103 | |||||||||
Administration fee | 5,335 | 17,675 | |||||||||
Variation margin on open swap agreements | 21,713 | — | |||||||||
Distribution fee (Class Y Shares) | 8,482 | 11,123 | |||||||||
Trustees' fees | 3,850 | 9,896 | |||||||||
Variation margin on open futures contracts | 12,278 | — | |||||||||
Transfer agent fees | 1,177 | 1,217 | |||||||||
Accrued expenses and other payables | 88,885 | 89,011 | |||||||||
| Total Liabilities | 1,098,493 | 3,319,844 | |||||||||
| Net Assets | $ | 77,262,112 | $ | 251,792,447 | |||||||
Composition of Net Assets: | |||||||||||
| Paid-in-capital | $ | 78,086,577 | $ | 134,454,350 | |||||||
| Total Distributable Earnings (Total Accumulated Loss) | (824,465 | ) | 117,338,097 | ||||||||
| Net Assets | $ | 77,262,112 | $ | 251,792,447 | |||||||
| * Cost | $ | 79,435,774 | $ | 196,193,227 | |||||||
| ** Affiliated Cost | $ | 372,841 | $ | 10,404,065 | |||||||
Class X Shares: | |||||||||||
| Net Assets | $ | 38,429,839 | $ | 201,059,798 | |||||||
| Shares Outstanding (unlimited shares authorized, $0.01 par value) | 3,685,376 | 4,336,838 | |||||||||
Net Asset Value Per Share | $ | 10.43 | $ | 46.36 | |||||||
Class Y Shares: | |||||||||||
| Net Assets | $ | 38,832,273 | $ | 50,732,649 | |||||||
| Shares Outstanding (unlimited shares authorized, $0.01 par value) | 3,730,271 | 1,151,142 | |||||||||
Net Asset Value Per Share | $ | 10.41 | $ | 44.07 | |||||||
(1) Including securities loaned at value of $2,732,544.
See Notes to Financial Statements
24
Morgan Stanley Variable Investment Series
Financial Statements continued
Statements of Operations
For the year ended December 31, 2018
| Income Plus | Multi Cap Growth | ||||||||||
Net Investment Income: | |||||||||||
Income | |||||||||||
Interest | $ | 3,464,715 | $ | — | |||||||
Dividends | — | 701,117 | |||||||||
Income from securities loaned - net | — | 415,441 | |||||||||
Interest and dividends from affiliates (Note 8) | 32,402 | 126,014 | |||||||||
Total Income | 3,497,117 | 1,242,572 | |||||||||
Expenses | |||||||||||
Advisory fee (Note 4) | 362,406 | 1,187,881 | |||||||||
Professional fees | 153,725 | 142,076 | |||||||||
Administration fee (Note 4) | 69,030 | 226,263 | |||||||||
Distribution fee (Class Y shares) (Note 5) | 108,683 | 143,704 | |||||||||
Custodian fees | 22,416 | 20,203 | |||||||||
Shareholder reports and notices | 18,079 | 23,672 | |||||||||
Trustees' fees and expenses | 5,428 | 11,880 | |||||||||
Transfer agent fees (Note 6) | 3,915 | 4,227 | |||||||||
Other | 41,362 | 29,218 | |||||||||
Total Expenses | 785,044 | 1,789,124 | |||||||||
| Less: amounts waived (Note 4) | — | (33,296 | ) | ||||||||
Less: rebate from Morgan Stanley affiliated cash sweep (Note 8) | (1,183 | ) | (14,468 | ) | |||||||
| Net Expenses | 783,861 | 1,741,360 | |||||||||
| Net Investment Income (Loss) | 2,713,256 | (498,788 | ) | ||||||||
Realized and Unrealized Gain (Loss): | |||||||||||
Realized Gain (Loss) on: | |||||||||||
Investments | (1,059,164 | ) | 71,076,687 | ||||||||
Investments in affiliates (Note 8) | (18,833 | ) | — | ||||||||
Futures contracts | (113,771 | ) | — | ||||||||
Swap agreements | 70,892 | — | |||||||||
Foreign currency translation | — | 4,576 | |||||||||
Net Realized Gain (Loss) | (1,120,876 | ) | 71,081,263 | ||||||||
Change in Unrealized Appreciation (Depreciation) on: | |||||||||||
Investments | (5,504,267 | ) | (34,586,745 | ) | |||||||
Investments in affiliates (Note 8) | (45,357 | ) | — | ||||||||
Futures contracts | (1,661 | ) | — | ||||||||
Swap agreements | 96,115 | — | |||||||||
Net Change in Unrealized Appreciation (Depreciation) | (5,455,170 | ) | (34,586,745 | ) | |||||||
Net Gain (Loss) | (6,576,046 | ) | 36,494,518 | ||||||||
| Net Increase (Decrease) | $ | (3,862,790 | ) | $ | 35,995,730 | ||||||
See Notes to Financial Statements
25
Morgan Stanley Variable Investment Series
Financial Statements continued
Statements of Changes in Net Assets
Income Plus | Multi Cap Growth | ||||||||||||||||||
| For The Year Ended December 31, 2018 | For The Year Ended December 31, 2017 | For The Year Ended December 31, 2018 | For The Year Ended December 31, 2017 | ||||||||||||||||
Increase (Decrease) in Net Assets: | |||||||||||||||||||
Operations: | |||||||||||||||||||
| Net investment income (loss) | $ | 2,713,256 | $ | 2,934,924 | $ | (498,788 | ) | $ | (338,652 | ) | |||||||||
Net realized gain (loss) | (1,120,876 | ) | 1,786,213 | 71,081,263 | 75,386,292 | ||||||||||||||
Net change in unrealized appreciation (depreciation) | (5,455,170 | ) | 1,726,026 | (34,586,745 | ) | 18,567,535 | |||||||||||||
| Net Increase (Decrease) | (3,862,790 | ) | 6,447,163 | 35,995,730 | 93,615,175 | ||||||||||||||
Dividends and Distributions to Shareholders: | |||||||||||||||||||
Class X shares | (2,386,287 | ) | (1,813,882 | )(1) | (59,355,298 | ) | (18,946,018 | )(2) | |||||||||||
Class Y shares | (2,313,184 | ) | (1,638,937 | )(1) | (15,702,288 | ) | (5,111,591 | )(2) | |||||||||||
Total Dividends and Distributions to Shareholders | (4,699,471 | ) | (3,452,819 | ) | (75,057,586 | ) | (24,057,609 | ) | |||||||||||
| Net increase (decrease) from transactions in shares of beneficial interest | (10,512,646 | ) | (12,791,774 | ) | 32,782,156 | (14,623,249 | ) | ||||||||||||
| Net Increase (Decrease) | (19,074,907 | ) | (9,797,430 | ) | (6,279,700 | ) | 54,934,317 | ||||||||||||
Net Assets: | |||||||||||||||||||
Beginning of period | 96,337,019 | 106,134,449 | 258,072,147 | 203,137,830 | |||||||||||||||
| End of Period | $ | 77,262,112 | $ | 96,337,019 | (3) | $ | 251,792,447 | $ | 258,072,147 | (4) | |||||||||
The following information was previously reported in the December 31, 2017 financial statements. The distribution information for the year ended December 31, 2017 presented on the Statements of Changes in Net Assets is presented for comparative purposes to the December 31, 2018 financial statements, which conform to the SEC Final Rule on Disclosure Update and Simplification which was effective November 5, 2018.
(1) Dividends and Distributions to Shareholders for the year ended December 31, 2017 were as follows:
Class X: | |||||||
Net Investment Income | $ | (1,813,882 | ) | ||||
Class Y: | |||||||
Net Investment Income | $ | (1,638,937 | ) | ||||
(2) Dividends and Distributions to Shareholders for the year ended December 31, 2017 were as follows:
Class X: | |||||||
Net Realized Gain | $ | (18,946,018 | ) | ||||
Class Y: | |||||||
Net Realized Gain | $ | (5,111,591 | ) | ||||
(3) Accumulated Undistributed Net Investment Income for the year ended December 31, 2017 was $2,878,020.
(4) Accumulated Undistributed Net Investment Loss for the year ended December 31, 2017 was $(25,677).
See Notes to Financial Statements
26
Morgan Stanley Variable Investment Series
Financial Statements continued
Statements of Changes in Net Assets continued
Summary of Transactions in Shares of Beneficial Interest
Income Plus | Multi Cap Growth | ||||||||||||||||||
| For The Year Ended December 31, 2018 | For The Year Ended December 31, 2017 | For The Year Ended December 31, 2018 | For The Year Ended December 31, 2017 | ||||||||||||||||
Class X Shares | |||||||||||||||||||
Shares | |||||||||||||||||||
Sold | 62,321 | 138,740 | 98,278 | 31,273 | |||||||||||||||
Reinvestment of dividends and distributions | 227,482 | 161,521 | 1,167,033 | 402,850 | |||||||||||||||
Redeemed | (778,744 | ) | (911,079 | ) | (677,771 | ) | (628,195 | ) | |||||||||||
Net Increase (Decrease) - Class X | (488,941 | ) | (610,818 | ) | 587,540 | (194,072 | ) | ||||||||||||
Amount | |||||||||||||||||||
Sold | $ | 675,522 | $ | 1,585,285 | $ | 5,384,351 | $ | 1,653,658 | |||||||||||
Reinvestment of dividends and distributions | 2,386,287 | 1,813,882 | 59,355,298 | 18,946,018 | |||||||||||||||
Redeemed | (8,424,873 | ) | (10,370,194 | ) | (37,871,009 | ) | (31,050,768 | ) | |||||||||||
Net Increase (Decrease) - Class X | $ | (5,363,064 | ) | $ | (6,971,027 | ) | $ | 26,868,640 | $ | (10,451,092 | ) | ||||||||
Class Y Shares | |||||||||||||||||||
Shares | |||||||||||||||||||
Sold | 95,323 | 88,050 | 13,795 | 5,919 | |||||||||||||||
Reinvestment of dividends and distributions | 220,513 | 146,073 | 324,360 | 112,491 | |||||||||||||||
Redeemed | (789,176 | ) | (742,127 | ) | (194,448 | ) | (198,634 | ) | |||||||||||
Net Increase (Decrease) - Class Y | (473,340 | ) | (508,004 | ) | 143,707 | (80,224 | ) | ||||||||||||
Amount | |||||||||||||||||||
Sold | $ | 1,038,199 | $ | 1,002,066 | $ | 708,564 | $ | 258,138 | |||||||||||
Reinvestment of dividends and distributions | 2,313,184 | 1,638,937 | 15,702,288 | 5,111,591 | |||||||||||||||
Redeemed | (8,500,965 | ) | (8,461,750 | ) | (10,497,336 | ) | (9,541,886 | ) | |||||||||||
Net Increase (Decrease) - Class Y | $ | (5,149,582 | ) | $ | (5,820,747 | ) | $ | 5,913,516 | $ | (4,172,157 | ) | ||||||||
See Notes to Financial Statements
27
Morgan Stanley Variable Investment Series
Notes to Financial Statements n December 31, 2018
1. Organization and Accounting Policies
Morgan Stanley Variable Investment Series (the "Trust") is registered under the Investment Company Act of 1940, as amended (the "Act"), as an open-end management investment company. The Trust is offered exclusively to life insurance companies in connection with particular life insurance and/or annuity contracts they offer. The Trust applies investment company accounting and reporting guidance.
The Trust, organized on February 25, 1983 as a Massachusetts business trust, consists of two funds ("Funds") which commenced operations as follows:
FUND | COMMENCEMENT OF OPERATIONS | ||||||
Income Plus | March 1, 1987 | ||||||
Multi Cap Growth | March 9, 1984 | ||||||
Each Fund is classified as diversified. On June 5, 2000, the Trust commenced offering one additional class of shares (Class Y shares). Each Fund currently offers two share classes — Class X shares and Class Y shares. The two classes are identical except that Class Y shares incur distribution expenses. Class X shares are generally available to holders of contracts offered before May 1, 2000. Class Y shares are available to holders of contracts offered on or after June 5, 2000.
The investment objectives of each Fund are as follows:
| FUND | INVESTMENT OBJECTIVE | ||||||
| Income Plus | Seeks, as its primary objective, to provide a high level of current income by investing primarily in U.S. government securities and other fixed-income securities. As a secondary objective, the Fund seeks capital appreciation but only when consistent with its primary objective. | ||||||
| Multi Cap Growth | Seeks, as its primary objective, growth of capital through investments in common stocks of companies believed by the "Adviser" Morgan Stanley Investment Management Inc. to have potential for superior growth. As a secondary objective, the Fund seeks income but only when consistent with its primary objective. | ||||||
28
Morgan Stanley Variable Investment Series
Notes to Financial Statements n December 31, 2018 continued
The following is a summary of significant accounting policies:
In August 2018, the Financial Accounting Standards Board ("FASB") issued Accounting Standards Update ("ASU") 2018-13, Fair Value Measurement (Topic 820) — Disclosures Framework — Changes to Disclosure Requirements of Fair Value Measurement ("ASU 2018-13") which introduces new fair value disclosure requirements as well as eliminates and modifies certain existing fair value disclosure requirements. ASU 2018-13 would be effective for fiscal years beginning after December 15, 2019 and for interim periods within those fiscal years; however, management has elected to early adopt ASU 2018-13 effective with the current reporting period as permitted by the standard. The impact of the Funds' adoption was limited to changes in the Funds' financial statement disclosures regarding fair value, primarily those disclosures related to transfers between levels of the fair value hierarchy and disclosure of the range and weighted average used to develop significant unobservable inputs for Level 3 fair value measurements, when applicable.
A. Valuation of Investments — (1) An equity portfolio security listed or traded on an exchange is valued at its latest reported sales price (or at the exchange official closing price if such exchange reports an official closing price), and if there were no sales on a given day and if there is no official exchange closing price for that day, the security is valued at the mean between the last reported bid and asked prices if such bid and asked prices are available on the relevant exchanges. Listed equity securities not traded on the valuation date with no reported bid and asked prices available on the exchange are valued at the mean between the current bid and asked prices obtained from one or more reputable brokers or dealers. In cases where a security is traded on more than one exchange, the security is valued on the exchange designated as the primary market; (2) all other equity portfolio securities for which over-the-counter ("OTC") market quotations are readily available are valued at the latest reported sales price (or at the market official closing price if such market reports an official closing price), and if there was no trading in the security on a given day and if there is no official closing price from relevant markets for that day, the security is valued at the mean between the last reported bid and asked prices if such bid and asked prices are available on the relevant markets. An unlisted equity security that does not trade on the valuation date and for which bid and asked prices from the relevant markets are unavailable is valued at the mean between the current bid and asked prices obtained from one or more reputable brokers or dealers; (3) futures are valued at the settlement price on the exchange on which they trade or, if a settlement price is unavailable, at the last sale price on the exchange; (4) listed options are valued at the last reported sales price on the exchange on which they are listed (or at the exchange official closing price if such exchange reports an official closing price). If an official closing price or last reported sales price is unavailable, the listed option should be fair valued at the mean between its latest bid and ask prices. Unlisted options are valued at the mean between their latest bid and ask prices from a
29
Morgan Stanley Variable Investment Series
Notes to Financial Statements n December 31, 2018 continued
broker/dealer or valued by a pricing service/vendor; (5) OTC swaps may be valued by an outside pricing service approved by the Trust's Board of Trustees (the "Trustees") or quotes from a broker or dealer. Swaps cleared on a clearinghouse or exchange may be valued using the closing price provided by the clearinghouse or exchange; (6) quotations of foreign portfolio securities, other assets and liabilities and forward contracts stated in foreign currency are translated into U.S. dollar equivalents at the prevailing market rates prior to the close of the New York Stock Exchange ("NYSE"); (7) certain portfolio securities may be valued by an outside pricing service/vendor approved by the Trustees. The pricing service/vendor may employ a pricing model that takes into account, among other things, bids, yield spreads and/or other market data and specific security characteristics. Alternatively, if a valuation is not available from an outside pricing service/vendor and the security trades on an exchange, the security may be valued at its latest reported sale price (or at the exchange official closing price if such exchange reports an official closing price) prior to the time when assets are valued. If there are no sales on a given day and if there is no official exchange closing price for that day, the security is valued at the mean between the last reported bid and asked prices if such bid and asked prices are available in the relevant exchanges; (8) when market quotations are not readily available, including circumstances under which the Adviser determines that the closing price, last sale price or the mean between the last reported bid and asked prices are not reflective of a security's market value, portfolio securities are valued at their fair value as determined in good faith under procedures established by and under the general supervision of the Trustees. Occasionally, developments affecting the closing prices of securities and other assets may occur between the times at which valuations of such securities are determined (that is, close of the foreign market on which the securities trade) and the close of business on the NYSE. If developments occur during such periods that are expected to materially affect the value of such securities, such valuations may be adjusted to reflect the estimated fair value of such securities as of the close of the NYSE, as determined in good faith by the Trustees or by the Adviser using a pricing service and/or procedures approved by the Trustees; and (9) investments in mutual funds, including the Morgan Stanley Institutional Liquidity Funds, are valued at the net asset value ("NAV") as of the close of each business day.
The Trustees have responsibility for determining in good faith the fair value of the investments, and the Trustees may appoint others, such as the Trust's Adviser or a valuation committee, to assist the Trustees in determining fair value and to make the actual calculations pursuant to the fair valuation methodologies previously approved by the Trustees. Under procedures approved by the Trustees, the Trust's Adviser has formed a Valuation Committee whose members are approved by the Trustees. The Valuation Committee provides administration and oversight of the Trust's valuation policies and procedures, which are reviewed at least annually by the Trustees. These procedures allow the Trust to utilize independent pricing services, quotations from securities and financial instrument dealers and other market sources to determine fair value.
30
Morgan Stanley Variable Investment Series
Notes to Financial Statements n December 31, 2018 continued
B. Accounting for Investments — Security transactions are accounted for on the trade date (date the order to buy or sell is executed). Realized gains and losses on security transactions are determined by the identified cost method. Dividend income and other distributions are recorded on the ex-dividend date, except for certain dividends on foreign securities which are recorded as soon as the Trust is informed after the ex-dividend date. Interest income is accrued daily as earned except where collection is not expected. Discounts are accreted and premiums are amortized over the life of the respective securities and are included in interest income.
C. Repurchase Agreements — Certain Funds may enter into repurchase agreements under which the Fund lends cash and takes possession of securities with an agreement that the counterparty will repurchase such securities. In connection with transactions in repurchase agreements, a bank as custodian for the Fund takes possession of the underlying securities which are held as collateral, with a market value at least equal to the amount of the repurchase transaction, including principal and accrued interest. To the extent that any repurchase transaction exceeds one business day, the value of the collateral is marked-to-market on a daily basis to determine that the value of the collateral does not decrease below the repurchase price plus accrued interest as earned. If such a decrease occurs, additional collateral will be requested and, when received, will be added to the account to maintain full collateralization. In the event of default on the obligation to repurchase, the Fund has the right to liquidate the collateral and apply the proceeds in satisfaction of the obligation. In the event of default or bankruptcy by the counterparty to the agreement, realization of the collateral proceeds may be subject to cost and delays. The Fund, along with other affiliated investment companies, may utilize a joint trading account for the purpose of entering into repurchase agreements.
D. Multiple Class Allocations — Investment income, expenses (other than distribution fees) and realized and unrealized gains and losses are allocated to each class of shares based upon the relative net asset value on the date such items are recognized. Distribution fees are charged directly to the respective class.
E. Foreign Currency Translation and Foreign Investments — The books and records of the Funds are maintained in U.S. dollars. Foreign currency amounts are translated into U.S. dollars as follows:
— investments, other assets and liabilities at the prevailing rate of exchange on the valuation date;
— investment transactions and investment income at the prevailing rates of exchange on the dates of such transactions.
Although the net assets of the Funds are presented at the foreign exchange rates and market values at the close of the period, the Funds do not isolate that portion of the results of operations arising as a result of changes in the foreign exchange rates from the fluctuations arising from changes in the market prices of
31
Morgan Stanley Variable Investment Series
Notes to Financial Statements n December 31, 2018 continued
securities held at period end. Similarly, the Funds do not isolate the effect of changes in foreign exchange rates from the fluctuations arising from changes in the market prices of securities sold during the period. Accordingly, realized and unrealized foreign currency gains (losses) on investments in securities are included in the reported net realized and unrealized gains (losses) on investment transactions and balances. However, pursuant to U.S. Federal income tax regulations, gains and losses from certain foreign currency transactions and the foreign currency portion of gains and losses realized on sales and maturities of foreign denominated debt securities are treated as ordinary income for U.S. Federal income tax purposes.
Net realized gains (losses) on foreign currency transactions represent net foreign exchange gains (losses) from foreign currency forward exchange contracts, disposition of foreign currencies, currency gains (losses) realized between the trade and settlement dates on securities transactions, and the difference between the amount of investment income and foreign withholding taxes recorded on the Funds' books and the U.S. dollar equivalent amounts actually received or paid. Net unrealized currency gains (losses) from valuing foreign currency denominated assets and liabilities at period end exchange rates are reflected as a component of unrealized appreciation (depreciation) in the Statements of Assets and Liabilities. The change in unrealized currency gains (losses) on foreign currency translations for the period is reflected in the Statements of Operations.
F. Restricted Securities — Certain Funds may invest in unregistered or otherwise restricted securities. The term "restricted securities" refers to securities that are unregistered or are held by control persons of the issuer and securities that are subject to contractual restrictions on their resale. As a result, restricted securities may be more difficult to value and the Fund may have difficulty disposing of such assets either in a timely manner or for a reasonable price. In order to dispose of an unregistered security, the Fund, where it has contractual rights to do so, may have to cause such security to be registered. A considerable period may elapse between the time the decision is made to sell the security and the time the security is registered so that the Fund can sell it. Contractual restrictions on the resale of securities vary in length and scope and are generally the result of a negotiation between the issuer and the acquirer of the securities. The Fund would, in either case, bear market risks during that period. Restricted securities, if any, are identified in the Portfolios of Investments.
G. Securities Lending — Certain Funds may lend securities to qualified financial institutions, such as broker-dealers, to earn additional income. Any increase or decrease in the fair value of the securities loaned that might occur and any interest earned or dividends declared on those securities during the term of the loan would remain in the Fund. The Fund receives cash or securities as collateral in an amount equal to or
32
Morgan Stanley Variable Investment Series
Notes to Financial Statements n December 31, 2018 continued
exceeding 100% of the current fair value of the loaned securities. The collateral is marked-to-market daily by State Street Bank and Trust Company ("State Street"), the securities lending agent, to ensure that a minimum of 100% collateral coverage is maintained.
Based on pre-established guidelines, the securities lending agent invests any cash collateral that is received in an affiliated money market portfolio and repurchase agreements. Securities lending income is generated from the earnings on the invested collateral and borrowing fees, less any rebates owed to the borrowers and compensation to the lending agent, and is recorded as "Income from Securities Loaned-Net" in the Fund's Statement of Operations.
A Fund has the right under the securities lending agreement to recover the securities from the borrower on demand.
The following table presents financial instruments that are subject to enforceable netting arrangements as of December 31, 2018:
GROSS AMOUNTS NOT OFFSET IN THE STATEMENTS OF ASSETS AND LIABILITIES | |||||||||||||||||||
FUND | GROSS ASSET AMOUNTS PRESENTED IN THE STATEMENTS OF ASSETS AND LIABILITIES | FINANCIAL INSTRUMENT | COLLATERAL RECEIVED | NET AMOUNT (NOT LESS THAN $0) | |||||||||||||||
Multi Cap Growth | $ | 2,732,544 | (a) | $ | — | $ | (2,732,544 | )(b)(c) | $ | 0 | |||||||||
(a) Represents market value of loaned securities at year end.
(b) The Fund received cash collateral of $2,749,323, of which $2,732,544 was subsequently invested in Repurchase Agreements and Morgan Stanley Institutional Liquidity Funds as reported in the Portfolio of Investments. As of December 31, 2018, there was uninvested cash of $16,779, which is not reflected in the Portfolio of Investments. In addition, the Fund received non-cash collateral of $205,611 in the form of U.S. Government obligations, which the Fund cannot sell or repledge, and accordingly are not reflected in the Portfolio of Investments.
(c) The actual collateral received is greater than the amount shown here due to overcollateralization.
33
Morgan Stanley Variable Investment Series
Notes to Financial Statements n December 31, 2018 continued
FASB Accounting Standards CodificationTM ("ASC") 860, "Transfers & Servicing: Repurchase-to-Maturity Transactions, Repurchase Financings, and Disclosures", is intended to provide increased transparency about the types of collateral pledged in securities lending transactions and other similar transactions that are accounted for as secured borrowing.
The following table displays a breakdown of transactions accounted for as secured borrowings, the gross obligations by class of collateral pledged, and the remaining contractual maturity of those transactions as of December 31, 2018:
REMAINING CONTRACTUAL MATURITY OF THE AGREEMENTS | |||||||||||||||||||||||
FUND | OVERNIGHT AND CONTINUOUS | <30 DAYS | BETWEEN 30 & 90 DAYS | >90 DAYS | TOTAL | ||||||||||||||||||
Multi Cap Growth | |||||||||||||||||||||||
Securities Lending Transactions | |||||||||||||||||||||||
Common Stocks | $ | 2,749,323 | $ | — | $ | — | $ | — | $ | 2,749,323 | |||||||||||||
Total Borrowings | $ | 2,749,323 | $ | — | $ | — | $ | — | $ | 2,749,323 | |||||||||||||
Gross amount of recognized liabilities for securities lending transactions | $ | 2,749,323 | |||||||||||||||||||||
H. Dividends and Distributions to Shareholders — Dividends and distributions to shareholders are recorded on the ex-dividend date. Dividends from net investment income, if any, are declared and paid annually. Net realized capital gains, if any, are distributed at least annually.
I. Expenses — Direct expenses are charged to the respective Fund and general Trust expenses are allocated on the basis of relative net assets or equally among the Funds.
J. Use of Estimates — The preparation of financial statements in accordance with generally accepted accounting principles in the United States ("GAAP") requires management to make estimates and assumptions that affect the reported amounts and disclosures. Actual results could differ from those estimates.
K. Indemnifications — The Trust enters into contracts that contain a variety of indemnifications. The Trust's maximum exposure under these arrangements is unknown. However, the Trust has not had prior claims or losses pursuant to these contracts and expects the risk of loss to be remote.
34
Morgan Stanley Variable Investment Series
Notes to Financial Statements n December 31, 2018 continued
2. Fair Valuation Measurements
FASB Accounting Standards CodificationTM (ASC) 820, "Fair Value Measurement" ("ASC 820"), defines fair value as the value that the Fund would receive to sell an investment or pay to transfer a liability in a timely transaction with an independent buyer in the principal market, or in the absence of a principal market, the most advantageous market for the investment or liability. ASC 820 establishes a three-tier hierarchy to distinguish between (1) inputs that reflect the assumptions market participants would use in valuing an asset or liability developed based on market data obtained from sources independent of the reporting entity (observable inputs); and (2) inputs that reflect the reporting entity's own assumptions about the assumptions market participants would use in valuing an asset or liability developed based on the best information available in the circumstances (unobservable inputs) and to establish classification of fair value measurements for disclosure purposes. Various inputs are used in determining the value of the Fund's investments. The inputs are summarized in the three broad levels listed below:
• Level 1 — unadjusted quoted prices in active markets for identical investments
• Level 2 — other significant observable inputs (including quoted prices for similar investments, interest rates, prepayment speeds, credit risk, etc.)
• Level 3 — significant unobservable inputs including the Fund's own assumptions in determining the fair value of investments. Factors considered in making this determination may include, but are not limited to, information obtained by contacting the issuer, analysts, or the appropriate stock exchange (for exchange-traded securities), analysis of the issuer's financial statements or other available documents and, if necessary, available information concerning other securities in similar circumstances
The inputs or methodology used for valuing securities are not necessarily an indication of the risk associated with investing in those securities and the determination of the significance of a particular input to the fair value measurement in its entirety requires judgment and considers factors specific to each security.
35
Morgan Stanley Variable Investment Series
Notes to Financial Statements n December 31, 2018 continued
The following is a summary of the inputs used to value each Fund's investments as of December 31, 2018:
Investment Type | Level 1 Unadjusted Quoted Prices | Level 2 Other Significant Observable Inputs | Level 3 Significant Unobservable Inputs | Total | |||||||||||||||
Income Plus | |||||||||||||||||||
Assets: | |||||||||||||||||||
Fixed Income Securities | |||||||||||||||||||
Corporate Bonds | $ | — | $ | 76,562,266 | $ | — | $ | 76,562,266 | |||||||||||
Short-Term Investments | |||||||||||||||||||
U.S. Treasury Security | — | 884,500 | — | 884,500 | |||||||||||||||
Investment Company | 65,781 | — | — | 65,781 | |||||||||||||||
Total Short-Term Investments | 65,781 | 884,500 | — | 950,281 | |||||||||||||||
Futures Contracts | 270,042 | — | — | 270,042 | |||||||||||||||
Interest Rate Swap Agreement | — | 79,890 | — | 79,890 | |||||||||||||||
Total Assets | 335,823 | 77,526,656 | — | 77,862,479 | |||||||||||||||
Liabilities: | |||||||||||||||||||
Futures Contracts | (259,394 | ) | — | — | (259,394 | ) | |||||||||||||
Interest Rate Swap Agreement | — | (71,132 | ) | — | (71,132 | ) | |||||||||||||
Total Liabilities | (259,394 | ) | (71,132 | ) | — | (330,526 | ) | ||||||||||||
Total | $ | 76,429 | $ | 77,455,524 | $ | — | $ | 77,531,953 | |||||||||||
36
Morgan Stanley Variable Investment Series
Notes to Financial Statements n December 31, 2018 continued
Investment Type | Level 1 Unadjusted Quoted Prices | Level 2 Other Significant Observable Inputs | Level 3 Significant Unobservable Inputs | Total | |||||||||||||||
Multi Cap Growth | |||||||||||||||||||
Assets: | |||||||||||||||||||
Common Stocks | |||||||||||||||||||
Biotechnology | $ | 2,506,014 | $ | — | $ | — | $ | 2,506,014 | |||||||||||
Entertainment | 7,452,978 | — | — | 7,452,978 | |||||||||||||||
| Health Care Equipment & Supplies | 25,765,376 | — | — | 25,765,376 | |||||||||||||||
| Health Care Providers & Services | 14,479,350 | — | — | 14,479,350 | |||||||||||||||
Health Care Technology | 21,961,500 | — | — | 21,961,500 | |||||||||||||||
Information Technology Services | 36,834,010 | — | — | 36,834,010 | |||||||||||||||
| Interactive Media & Services | 16,427,207 | — | — | 16,427,207 | |||||||||||||||
| Internet & Direct Marketing Retail | 35,043,516 | — | — | 35,043,516 | |||||||||||||||
| Life Sciences Tools & Services | 12,025,993 | — | — | 12,025,993 | |||||||||||||||
Pharmaceuticals | 141,834 | — | — | 141,834 | |||||||||||||||
Software | 55,288,483 | — | — | 55,288,483 | |||||||||||||||
Total Common Stocks | 227,926,261 | — | — | 227,926,261 | |||||||||||||||
Preferred Stocks | |||||||||||||||||||
| Electronic Equipment, Instruments & Components | — | — | 511,758 | 511,758 | |||||||||||||||
| Internet & Direct Marketing Retail | — | — | 7,497,376 | 7,497,376 | |||||||||||||||
| Life Sciences Tools & Services | — | — | 7,383,034 | 7,383,034 | |||||||||||||||
Software | — | — | 345,533 | 345,533 | |||||||||||||||
Total Preferred Stocks | — | — | 15,737,701 | 15,737,701 | |||||||||||||||
Call Options Purchased | — | 161,564 | — | 161,564 | |||||||||||||||
Short-Term Investments | |||||||||||||||||||
Investment Company | 10,404,065 | — | — | 10,404,065 | |||||||||||||||
Repurchase Agreements | — | 508,417 | — | 508,417 | |||||||||||||||
Total Short-Term Investments | 10,404,065 | 508,417 | — | 10,912,482 | |||||||||||||||
Total Assets | $ | 238,330,326 | $ | 669,981 | $ | 15,737,701 | $ | 254,738,008 | |||||||||||
Transfers between investment levels may occur as the markets fluctuate and/or the availability of data used in an investment's valuation changes.
37
Morgan Stanley Variable Investment Series
Notes to Financial Statements n December 31, 2018 continued
Following is a reconciliation of investments in which significant unobservable inputs (Level 3) were used in determining fair value:
Multi Cap Growth | |||||||
Preferred Stocks | |||||||
Beginning Balance | $ | 10,306,047 | |||||
Purchases | — | ||||||
Sales | — | ||||||
Amortization of discount | — | ||||||
Transfers in | — | ||||||
Transfers out | — | ||||||
Corporate actions | — | ||||||
Change in unrealized appreciation | 5,431,654 | ||||||
Realized gains | — | ||||||
Ending Balance | $ | 15,737,701 | |||||
| Net change in unrealized appreciation from investments still held as of December 31, 2018 | $ | 5,431,654 | |||||
The following table presents additional information about valuation techniques and inputs used for investments that are measured at fair value and categorized within Level 3 as of December 31, 2018. Various valuation techniques were used in the valuation of certain investments and weighted based on the level of significance. The Fund calculated the weighted averages of the unobservable inputs relative to each investment's fair value as of December 31, 2018.
Multi Cap Growth | Fair Value at December 31, 2018 (000) | Valuation Technique | Unobservable Input | Amount or Range/ Weighted Average | Impact to Valuation from an Increase in Input(d) | ||||||||||||||||||
Preferred Stocks | $ | 15,737,701 | Market Transaction Method | Precedent Transaction | $27.00-$48.77/$ | 44.86 | Increase | ||||||||||||||||
| Discounted Cash Flow | Weighted Average Cost of Capital | 14.0%-27.0%/17.08% | Decrease | ||||||||||||||||||||
| Perpetual Growth Rate | 3.0%-4.0%/3.50% | Increase | |||||||||||||||||||||
| Market Comparable Companies | Enterprise Value/ Revenue | 1.1x-12.8x/6.09x | Increase | ||||||||||||||||||||
38
Morgan Stanley Variable Investment Series
Notes to Financial Statements n December 31, 2018 continued
Multi Cap Growth | Fair Value at December 31, 2018 (000) | Valuation Technique | Unobservable Input | Amount or Range/ Weighted Average | Impact to Valuation from an Increase in Input(d) | ||||||||||||||||||
| Discount for Lack of Marketability | 9.0%-20.0%/16.73% | Decrease | |||||||||||||||||||||
| Comparable Transactions | Enterprise Value/ Revenue | 2.2x-22.5x/5.40x | Increase | ||||||||||||||||||||
(d) Represents the expected directional change in the fair value of the Level 3 investments that would result from an increase in the corresponding input. A decrease to the unobservable input would have the opposite effect. Significant changes in these inputs could result in significantly higher or lower fair value measurements.
3. Derivatives
Certain Funds may, but are not required to, use derivative instruments for a variety of purposes, including hedging, risk management, portfolio management or to earn income. Derivatives are financial instruments whose value is based, in part, on the value of an underlying asset, interest rate, index or financial instrument. Prevailing interest rates and volatility levels, among other things, also affect the value of derivative instruments. A derivative instrument often has risks similar to its underlying asset and may have additional risks, including imperfect correlation between the value of the derivative and the underlying asset, risks of default by the counterparty to certain transactions, magnification of losses incurred due to changes in the market value of the securities, instruments, indices or interest rates to which the derivative instrument relates, risks that the transactions may not be liquid and risks arising from margin requirements. The use of derivatives involves risks that are different from, and possibly greater than, the risks associated with other portfolio investments. Derivatives may involve the use of highly specialized instruments that require investment techniques and risk analyses different from those associated with other portfolio investments. All of a Fund's holdings, including derivative instruments, are marked-to-market each day with the change in value reflected in unrealized appreciation (depreciation). Upon disposition, a realized gain or loss is recognized.
Certain derivative transactions may give rise to a form of leverage. Leverage magnifies the potential for gain and risk of loss. Leverage associated with derivative transactions may cause a Fund to liquidate portfolio positions when it may not be advantageous to do so to satisfy its obligations or to meet earmarking or segregation requirements, pursuant to applicable Securities and Exchange Commission ("SEC") rules and regulations, or may cause a Fund to be more volatile than if the Fund had not been leveraged. Although the
39
Morgan Stanley Variable Investment Series
Notes to Financial Statements n December 31, 2018 continued
Adviser seek to use derivatives to further the Fund's investment objectives, there is no assurance that the use of derivatives will achieve this result.
Following is a description of the derivative instruments and techniques that a Fund used during the period and their associated risks:
Options — With respect to options, certain Funds are subject to equity risk, interest rate risk and foreign currency exchange risk in the normal course of pursuing its investment objectives. If a Fund buys an option, it buys a legal contract giving it the right to buy or sell a specific amount of the underlying instrument or foreign currency, or futures contract on the underlying instrument or foreign currency, at an agreed-upon price during a period of time or on a specified date typically in exchange for a premium paid by a Fund. A Fund may purchase and/or sell put and call options. Purchasing call options tends to increase a Fund's exposure to the underlying (or similar) instrument. Purchasing put options tends to decrease a Fund's exposure to the underlying (or similar) instrument. When entering into purchased option contracts, a Fund bears the risk of interest or exchange rates or securities prices moving unexpectedly, in which case, a Fund may not achieve the anticipated benefits of the purchased option contracts; however the risk of loss is limited to the premium paid. Purchased options are reported as part of "Total Investments in Securities" in the Statements of Assets and Liabilities. Premium paid for purchasing options which expired are treated as realized losses. If a Fund sells an option, it sells to another party the right to buy from or sell to a Fund a specific amount of the underlying instrument or foreign currency, or futures contract on the underlying instrument or foreign currency, at an agreed upon price during a period of time or on a specified date typically in exchange for a premium received by a Fund. When options are purchased OTC, a Fund bears the risk that the counterparty that wrote the option will be unable or unwilling to perform its obligations under the option contract. Options may also be illiquid and a Fund may have difficulty closing out its position. A decision as to whether, when and how to use options involves the exercise of skill and judgment and even a well-conceived option transaction may be unsuccessful because of market behavior or unexpected events. The prices of options can be highly volatile and the use of options can lower total returns.
Futures — A futures contract is a standardized, exchange-traded agreement to buy or sell a specific quantity of an underlying asset, reference rate or index at a specific price at a specific future time. The value of a futures contract tends to increase and decrease in tandem with the value of the underlying instrument. Depending on the terms of the particular contract, futures contracts are settled through either physical delivery of the underlying instrument on the settlement date or by payment of a cash settlement amount on the settlement date. During the period the futures contract is open, payments are received from or made to the broker based upon changes in the value of the contract (the variation margin). A decision as to whether,
40
Morgan Stanley Variable Investment Series
Notes to Financial Statements n December 31, 2018 continued
when and how to use futures contracts involves the exercise of skill and judgment and even a well-conceived futures transaction may be unsuccessful because of market behavior or unexpected events. In addition to the derivatives risks discussed above, the prices of futures contracts can be highly volatile, using futures contracts can lower total return and the potential loss from futures contracts can exceed a Fund's initial investment in such contracts. No assurance can be given that a liquid market will exist for any particular futures contract at any particular time. There is also the risk of loss by a Fund of margin deposits in the event of bankruptcy of a broker with which a Fund has open positions in the futures contract.
Swaps — A Fund may enter into OTC swap contracts or cleared swap transactions. A swap contract is an agreement between two parties pursuant to which the parties exchange payments at specified dates on the basis of a specified notional amount, with the payments calculated by reference to specified securities, indices, reference rates, currencies or other instruments. Typically swap agreements provide that when the period payment dates for both parties are the same, the payments are made on a net basis (i.e., the two payment streams are netted out, with only the net amount paid by one party to the other). A Fund's obligations or rights under a swap contract entered into on a net basis will generally be equal only to the net amount to be paid or received under the agreement, based on the relative values of the positions held by each party. Cleared swap transactions help reduce counterparty credit risk. In a cleared swap, a Fund's ultimate counterparty is a clearinghouse rather than a swap dealer, bank or other financial institution. OTC swap agreements are not entered into or traded on exchanges and often there is no central clearing or guaranty function for OTC swaps. These OTC swaps are often subject to credit risk or the risk of default or non-performance by the counterparty. Both OTC and cleared swaps could result in losses if interest rates, foreign currency exchange rates or other factors are not correctly anticipated by a Fund or if the reference index, security or investments do not perform as expected. During the period swap agreements are open, payments are received from or made to the clearinghouse or counterparty based upon changes in the value of the contract (variation margin). The Dodd-Frank Wall Street Reform and Consumer Protection Act and related regulatory developments require the clearing and exchange-trading of certain standardized swap transactions. Mandatory exchange-trading and clearing is occurring on a phased-in basis.
A Fund's use of swaps during the period included those based on the credit of an underlying security commonly referred to as credit default swaps. A Fund may be either the buyer or seller in a credit default swap. As the buyer in a credit default swap, a Fund would pay to the counterparty the periodic stream of payments. If no default occurs, a Fund would receive no benefit from the contract. As the seller in a credit default swap, a Fund would receive the stream of payments but would be subject to exposure on the notional amount of the swap, which it would be required to pay in the event of default. The use of credit default
41
Morgan Stanley Variable Investment Series
Notes to Financial Statements n December 31, 2018 continued
swaps could result in losses to a Fund if the Adviser fails to correctly evaluate the creditworthiness of the issuer of the referenced debt obligation.
If the Fund is a seller of protection and a credit event occurs, as defined under the terms of that particular swap agreement, the Fund will either (i) pay to the buyer of protection an amount equal to the notional amount of the swap agreement and take delivery of the referenced obligation, other deliverable obligations or underlying securities comprising the referenced index or (ii) pay a net settlement amount in the form of cash or securities equal to the notional amount of the swap agreement less the recovery value of the referenced obligation or underlying securities comprising the referenced index. If the Fund is a buyer of protection and a credit event occurs, as defined under the terms of that particular swap agreement, the Fund will either (i) receive from the seller of protection an amount equal to the notional amount of the swap agreement and deliver the referenced obligation, other deliverable obligations or underlying securities comprising the referenced index or (ii) receive a net settlement amount in the form of cash or securities equal to the notional amount of the swap agreement less the recovery value of the referenced obligation or underlying securities comprising the referenced index. Recovery values are estimated by market makers considering either industry standard recovery rates or entity specific factors and considerations until a credit event occurs. If a credit event has occurred, the recovery value is determined by a facilitated auction whereby a minimum number of allowable broker bids, together with a specified valuation method, are used to calculate the settlement value. The Fund's maximum risk of loss from counterparty risk, either as the protection seller or as the protection buyer, is the fair value of the swap agreement.
The current credit rating of each individual issuer is included in the table following the Portfolio of Investments and serves as an indicator of the current status of the payment/performance risk of the credit derivative. Alternatively, for credit default swaps on an index of credits, the quoted market prices and current values serve as an indicator of the current status of the payment/performance risk of the credit derivative. Generally, lower credit ratings and increasing market values, in absolute terms, represent a deterioration of the credit and a greater likelihood of an adverse credit event of the issuer.
When a Fund has an unrealized loss on a swap agreement, the Fund has instructed the custodian to pledge cash or liquid securities as collateral with a value approximately equal to the amount of the unrealized loss. Collateral pledges are monitored and subsequently adjusted if and when the swap valuations fluctuate. If applicable, cash collateral is included with "Due from (to) Broker" in the Statements of Assets and Liabilities.
42
Morgan Stanley Variable Investment Series
Notes to Financial Statements n December 31, 2018 continued
Upfront payments received or paid by a Fund will be reflected as an asset or liability, respectively, in the Statements of Assets and Liabilities.
FASB ASC 815, "Derivatives and Hedging" ("ASC 815"), is intended to improve financial reporting about derivative instruments by requiring enhanced disclosures to enable investors to better understand how and why a Fund uses derivative instruments, how these derivative instruments are accounted for and their effects on a Fund's financial position and results of operations.
The following table sets forth the fair value of each Fund's derivative contracts by primary risk exposure as of December 31, 2018:
FUND | PRIMARY RISK EXPOSURE | ASSET DERIVATIVES STATEMENTS OF ASSETS AND LIABILITIES LOCATION | FAIR VALUE | LIABILITY DERIVATIVES STATEMENTS OF ASSETS AND LIABILITIES LOCATION | FAIR VALUE | ||||||||||||||||||
Income Plus | Interest Rate Risk | Variation margin on open futures contracts | $ | 270,042 | (e) | Variation margin on open futures contracts | $ | (259,394 | )(e) | ||||||||||||||
| Interest Rate Risk | Variation margin on open swap agreements | 79,890 | (e) | Variation margin on open swap agreements | (71,132 | )(e) | |||||||||||||||||
$ | 349,932 | $ | (330,526 | ) | |||||||||||||||||||
Multi Cap Growth | Currency Risk | Investments, at Value (Purchased Options) | $ | 161,564 | (f) | ||||||||||||||||||
(e) Includes cumulative appreciation (depreciation) as reported in the Portfolio of Investments. Only current day's net variation margin is reported within the Statements of Assets and Liabilities.
(f) Amounts are included in Investments in securities in the Statements of Assets and Liabilities.
The following tables set forth by primary risk exposure of each Fund's realized gains (losses) and change in unrealized appreciation (depreciation) by type of derivative contract for the year ended December 31, 2018 in accordance with ASC 815:
AMOUNT OF REALIZED GAIN (LOSS) ON DERIVATIVES | |||||||||||||||||||
FUND | PRIMARY RISK EXPOSURE | FUTURES CONTRACTS | PURCHASED OPTIONS(f) | SWAP AGREEMENTS | |||||||||||||||
Income Plus | Interest Rate Risk | $ | (113,771 | ) | $ | — | $ | 115,627 | |||||||||||
Credit Risk | — | — | (44,735 | ) | |||||||||||||||
Total | $ | (113,771 | ) | $ | — | $ | 70,892 | ||||||||||||
Multi Cap Growth | Currency Risk | $ | — | $ | (496,031 | ) | $ | — | |||||||||||
43
Morgan Stanley Variable Investment Series
Notes to Financial Statements n December 31, 2018 continued
CHANGE IN UNREALIZED APPRECIATION (DEPRECIATION) ON DERIVATIVES | |||||||||||||||||||
FUND | PRIMARY RISK EXPOSURE | FUTURES CONTRACTS | PURCHASED OPTIONS(g) | SWAP AGREEMENTS | |||||||||||||||
Income Plus | Interest Rate Risk | $ | (1,661 | ) | $ | — | $ | 54,083 | |||||||||||
Credit Risk | — | — | 42,032 | ||||||||||||||||
Total | $ | (1,661 | ) | $ | — | $ | 96,115 | ||||||||||||
Multi Cap Growth | Currency Risk | $ | — | $ | (272,063 | ) | $ | — | |||||||||||
(g) Amounts are included in Realized and Unrealized Gain (Loss) on Investments in the Statements of Operations.
At December 31, 2018, each Fund's derivative assets and liabilities are as follows:
| GROSS AMOUNTS OF ASSETS AND LIABILITIES PRESENTED IN THE STATEMENTS OF ASSETS AND LIABILITIES | |||||||||||||||
FUND | DERIVATIVES(g) | ASSETS(h) | LIABILITIES(h) | ||||||||||||
Multi Cap Growth | Purchased Options | $ | 161,564 | (f) | $ | — | |||||||||
(f) Amounts are included in Investments in securities in the Statements of Assets and Liabilities.
(h) Absent an event of default or early termination, OTC derivative assets and liabilities are presented gross and not offset in the Statements of Assets and Liabilities.
Certain Funds typically enter into International Swaps and Derivatives Association, Inc. Master Agreements ("ISDA Master Agreements") or similar master agreements (collectively, "Master Agreements") with their respective contract counterparties for certain OTC derivatives in order to, among other things, reduce its credit risk to counterparties. ISDA Master Agreements include provisions for general obligations, representations, collateral and events of default or termination. Under an ISDA Master Agreement, a Fund typically may offset with the counterparty certain OTC derivative financial instruments' payables and/or receivables with collateral held and/or posted and create one single net payment (close-out netting) in the event of default, termination and/or potential deterioration in the credit quality of the counterparty. Various Master Agreements govern the terms of certain transactions with counterparties, including transactions such as swap, forward, repurchase and reverse repurchase agreements. These Master Agreements typically attempt to reduce the counterparty risk associated with such transactions by specifying credit protection mechanisms and providing standardization that improves legal certainty. Cross-termination provisions under Master Agreements typically provide that a default in connection with one transaction between a Fund and a counterparty gives the non-defaulting party the right to terminate any other transactions in place with the defaulting party to create one single net payment due to/due from the defaulting party and may be a feature in certain Master Agreements. In the event a Fund exercises its right to terminate a Master
44
Morgan Stanley Variable Investment Series
Notes to Financial Statements n December 31, 2018 continued
Agreement after a counterparty experiences a termination event as defined in the Master Agreement, the return of collateral with market value in excess of a Fund's net liability may be delayed or denied.
The following table presents derivative financial instruments that are subject to enforceable netting arrangements as of December 31, 2018:
GROSS AMOUNTS NOT OFFSET IN THE STATEMENTS OF ASSETS AND LIABILITIES | |||||||||||||||||||||||
FUND | COUNTERPARTY | GROSS ASSET DERIVATIVES PRESENTED IN THE STATEMENTS OF ASSETS AND LIABILITIES | FINANCIAL INSTRUMENT | COLLATERAL RECEIVED | NET AMOUNT (NOT LESS THAN $0) | ||||||||||||||||||
Multi Cap Growth | Royal Bank of Scotland | $ | 161,564 | (f) | $ | — | $ | (161,564 | )(f) | $ | 0 | ||||||||||||
(f) Amounts are included in Investments in securities in the Statements of Assets and Liabilities.
(i) The actual collateral received is greater than the amount shown here due to overcollateralization.
For the year ended December 31, 2018, the average monthly amount outstanding for each derivative type is as follows:
Income Plus:
Futures Contracts:
Average monthly notional value | $ | 32,448,531 | |||||
Swap Agreements:
Average monthly notional amount | $ | 8,179,124 | |||||
Multi Cap Growth:
Purchased Options:
Average monthly notional amount | 183,143,469 | ||||||
4. Advisory/Administration Agreements
Pursuant to an Investment Advisory Agreement with the Adviser, the Trust pays an advisory fee, accrued daily and payable monthly, by applying the annual rates listed below to each Fund's net assets determined at the close of each business day:
Income Plus — 0.42% to the portion of the daily net assets not exceeding $500 million; 0.35% to the portion of the daily net assets exceeding $500 million but not exceeding $1.25 billion; and 0.22% to the portion of
45
Morgan Stanley Variable Investment Series
Notes to Financial Statements n December 31, 2018 continued
the daily net assets in excess of $1.25 billion. For the year ended December 31, 2018, the advisory fee rate (net of waivers/rebate) was equivalent to an annual effective rate of 0.42% of the Fund's average daily net assets.
Multi Cap Growth — 0.42% to the portion of the daily net assets not exceeding $1 billion; 0.395% to the portion of the daily net assets exceeding $1 billion but not exceeding $2 billion; and 0.37% to the portion of the daily net assets in excess of $2 billion. For the year ended December 31, 2018, the advisory fee rate (net of waivers/rebate) was equivalent to an annual effective rate of 0.40% of the Fund's average daily net assets.
The Adviser also serves as the Administrator to the Trust and provides administrative services pursuant to an Administration Agreement for an annual fee, accrued daily and paid monthly, of 0.08% of each Fund's average daily net assets.
Effective 07/01/18, the Adviser/Administrator has agreed to reduce its advisory fee, its administration fee and/or reimburse Income Plus Portfolio so that total annual Fund operating expenses, excluding certain investment related expenses, 12b-1 fees, taxes, interest and other extraordinary expenses (including litigation), will not exceed 0.95%. The fee waivers and/or expense reimbursements will continue for at least one year from the date of the Fund's prospectus (es) or until such time that the Trustees act to discontinue all or a portion of such waivers and/or reimbursements when they deem such action is appropriate. This arrangement had no effect during the most recent fiscal period.
The Adviser/Administrator has agreed to reduce its advisory fee, its administration fee and/or reimburse Multi Cap Growth Portfolio so that total Fund operating expenses, excluding certain investment related expenses, 12b-1 fees, taxes, interest and other extraordinary expenses (including litigation), will not exceed 0.57%. The fee waivers and/or expense reimbursements will continue for at least one year from the date of the Fund's prospectus (es) or until such time that the Trustees act to discontinue all or a portion of such waivers and/or reimbursements when they deem such action is appropriate. For the year ended December 31, 2018, $33,296 of advisory fees were waived pursuant to this arrangement.
Under a Sub-Administration agreement between the Administrator and State Street, State Street provides certain administrative services to the Trust. For such services, the Administrator pays State Street a portion of the fee the Administrator receives from each Fund.
5. Plan of Distribution
Shares of the Trust are distributed by Morgan Stanley Distribution, Inc. (the "Distributor"), an affiliate of the Adviser/Administrator. The Trust has adopted a Plan of Distribution (the "Plan") pursuant to Rule 12b-1 under the Act. Under the Plan, Class Y shares of each Fund bear a distribution fee which is accrued daily and paid monthly at the annual rate of 0.25% of the average daily net assets of the class.
46
Morgan Stanley Variable Investment Series
Notes to Financial Statements n December 31, 2018 continued
6. Dividend Disbursing and Transfer Agent
The Trust's dividend disbursing and transfer agent is DST Asset Manager Solutions, Inc. ("DST"). Pursuant to a Transfer Agency Agreement, the Trust pays DST a fee based on the number of classes, accounts and transactions relating to the Funds of the Trust.
7. Custodian Fees
State Street (the "Custodian") also serves as Custodian for the Trust in accordance with a Custodian Agreement. The Custodian holds cash, securities and other assets of the Trust as required by the Act. Custody fees are payable monthly based on assets held in custody, investment purchases and sales activity and account maintenance fees, plus reimbursement for certain out-of-pocket expenses.
8. Security Transactions and Transactions with Affiliates
For the year ended December 31, 2018, purchases and sales of investment securities, excluding short-term investments, were as follows:
OTHER | |||||||||||
FUND | PURCHASES | SALES | |||||||||
| Income Plus | $ | 39,244,171 | $ | 49,546,701 | |||||||
| Multi Cap Growth | 284,944,441 | 330,983,793 | |||||||||
Each Fund invests in the Institutional Class of the Morgan Stanley Institutional Liquidity Funds (the "Liquidity Funds"), an open-end management investment company managed by the Adviser, both directly and as a portion of the securities held as collateral on loaned securities. Advisory fees paid by each Fund are reduced by an amount equal to its pro-rata share of advisory and administrative fees paid by the Fund due to its investment in the Liquidity Funds.
A summary of each Fund's transactions in shares of the Liquidity Funds during the year ended December 31, 2018 is as follows:
FUND | VALUE DECEMBER 31, 2017 | PURCHASES AT COST | SALES | DIVIDEND INCOME | NET REALIZED GAIN (LOSS) | CHANGE IN UNREALIZED APPRECIATION (DEPRECIATION) | VALUE DECEMBER 31, 2018 | ||||||||||||||||||||||||
Income Plus | $ | 724,758 | $ | 22,311,129 | $ | 22,970,106 | $ | 12,452 | $ | — | $ | — | $ | 65,781 | |||||||||||||||||
| Multi Cap Growth | 16,920,194 | 183,222,177 | 189,738,306 | 126,014 | — | — | 10,404,065 | ||||||||||||||||||||||||
47
Morgan Stanley Variable Investment Series
Notes to Financial Statements n December 31, 2018 continued
For the year ended December 31, 2018, advisory fees paid were reduced by the following relating to each Fund's investment in the Liquidity Funds:
FUND | ADVISORY FEE REDUCTION | ||||||
Income Plus | $ | 1,183 | |||||
Multi Cap Growth | 14,468 | ||||||
The Trust is permitted to purchase and sell securities ("cross-trade") from and to other Morgan Stanley funds as well as other funds and client accounts for which the Adviser or an affiliate of the Adviser serves as investment adviser, pursuant to procedures approved by the Trustees in compliance with Rule 17a-7 under the Act (the "Rule"). Each cross-trade is executed at the current market price in compliance with provisions of the Rule. For the year ended December 31, 2018, the Multi Cap Growth Portfolio engaged in cross-trade purchases of $1,270,234.
The following Fund had transactions with the following affiliates of the Trust:
FUND | ISSUER | VALUE DECEMBER 31, 2017 | PURCHASES AT COST | SALES | INTEREST INCOME | NET REALIZED LOSS | CHANGE IN UNREALIZED APPRECIATION (DEPRECIATION) | VALUE DECEMBER 31, 2018 | |||||||||||||||||||||||||||
| Income Plus | MetLife, Inc. | $ | 634,510 | $ | — | $ | 288,227 | $ | 19,950 | $ | (18,833 | ) | $ | (45,357 | ) | $ | 282,093 | ||||||||||||||||||
For the year ended December 31, 2018, the Multi Cap Growth Portfolio incurred $366 in brokerage commissions with Morgan Stanley & Co., LLC, an affiliate of the Adviser/Administrator and Distributor, for portfolio transactions executed on behalf of the Fund.
The Trust has an unfunded noncontributory defined benefit pension plan covering certain independent Trustees of the Trust who will have served as independent Trustees for at least five years at the time of retirement. Benefits under this plan are based on factors which include years of service and compensation. The Trustees voted to close the plan to new participants and eliminate the future benefits growth due to increases to compensation after July 31, 2003.
48
Morgan Stanley Variable Investment Series
Notes to Financial Statements n December 31, 2018 continued
At December 31, 2018, the accrued pension liability reflected as "Trustees' fees" in the Statements of Assets and Liabilities are as follows:
AGGREGATE PENSION LIABILITY | |||||||||||
| INCOME PLUS | MULTI CAP GROWTH | ||||||||||
$ | 3,850 | $ | 9,896 | ||||||||
The Trust has an unfunded Deferred Compensation Plan (the "Compensation Plan"), which allows each independent Trustee to defer payment of all, or a portion, of the fees he or she receives for serving on the Board of Trustees. Each eligible Trustee generally may elect to have the deferred amounts credited with a return equal to the total return on one or more of the Morgan Stanley funds that are offered as investment options under the Compensation Plan. Appreciation/depreciation and distributions received from these investments are recorded with an offsetting increase/decrease in the deferred compensation obligation and do not affect the NAV of the Trust.
9. Federal Income Tax Status
It is the Funds' intention to continue to qualify as a regulated investment company and distribute all of its taxable and tax-exempt income. Accordingly, no provision for Federal income taxes is required in the financial statements.
A Fund may be subject to taxes imposed by countries in which it invests. Such taxes are generally based on income and/or capital gains earned or repatriated. Taxes are accrued based on net investment income, net realized gains and net unrealized appreciation as such income and/or gains are earned. Taxes may also be based on transactions in foreign currency and are accrued based on the value of investments denominated in such currency.
FASB ASC 740-10, "Income Taxes — Overall", sets forth a minimum threshold for financial statement recognition of the benefit of a tax position taken or expected to be taken in a tax return. Management has concluded there are no significant uncertain tax positions that would require recognition in the financial statements. If applicable, the Funds recognize interest accrued related to unrecognized tax benefits in "Interest Expense" and penalties in "Other Expenses" in the Statements of Operations. The Funds file tax returns with the U.S. Internal Revenue Service, New York and various states. Each of the tax years in the four-year period ended December 31, 2018 remains subject to examination by taxing authorities.
49
Morgan Stanley Variable Investment Series
Notes to Financial Statements n December 31, 2018 continued
The tax character of distributions paid may differ from the character of distributions for U.S. GAAP purposes due to short-term capital gains being treated as ordinary income for tax purposes. The tax character of distributions paid during fiscal years 2018 and 2017 was as follows:
2018 DISTRIBUTIONS PAID FROM: | 2017 DISTRIBUTIONS PAID FROM: | ||||||||||||||||||
| FUND | ORDINARY INCOME | LONG-TERM CAPITAL GAIN | ORDINARY INCOME | LONG-TERM CAPITAL GAIN | |||||||||||||||
Income Plus | $ | 2,900,920 | $ | 1,798,551 | $ | 3,452,819 | $ | — | |||||||||||
Multi Cap Growth | 12,257,137 | 62,800,449 | — | 24,057,609 | |||||||||||||||
The amount and character of income and gains to be distributed are determined in accordance with income tax regulations which may differ from GAAP. These book/tax differences are either considered temporary or permanent in nature.
Temporary differences are primarily due to differing book and tax treatments for the timing of the recognition of gains (losses) on certain investment transactions and the timing of the deductibility of certain expenses.
Permanent differences, primarily due to equalization debits resulted in the following reclassifications among the Fund's components of net assets at December 31, 2018:
| FUND | TOTAL ACCUMULATED LOSS | PAID-IN-CAPITAL | |||||||||
Income Plus | $ | (1,193 | ) | $ | 1,193 | ||||||
At December 31, 2018, the components of distributable earnings on a tax basis were as follows:
| FUND | UNDISTRIBUTED ORDINARY INCOME | UNDISTRIBUTED LONG-TERM CAPITAL GAIN | |||||||||
| Income Plus | $ | 2,707,416 | $ | — | |||||||
| Multi Cap Growth | 14,313,179 | 58,286,857 | |||||||||
50
Morgan Stanley Variable Investment Series
Notes to Financial Statements n December 31, 2018 continued
At December 31, 2018, the following Fund had available for Federal income tax purposes unused short term and/or long term capital losses that will not expire:
| FUND | SHORT TERM LOSSES (NO EXPIRATION) | LONG TERM LOSSES (NO EXPIRATION) | |||||||||
Income Plus | $ | 146,809 | $ | 979,167 | |||||||
To the extent that capital loss carryforwards are used to offset any future capital gains realized, no capital gains tax liability will be incurred by a Fund for gains realized and not distributed. To the extent that capital gains are offset, such gains will not be distributed to the shareholders.
10. Purposes of and Risks Relating to Certain Financial Instruments
Certain Funds may lend securities to qualified financial institutions, such as broker-dealers, to earn additional income. Risks in securities lending transactions are that a borrower may not provide additional collateral when required or return the securities when due, and that the value of the short-term investments will be less than the amount of cash collateral plus any rebate that is required to be returned to the borrower.
Foreign security and currency transactions may involve certain considerations and risks not typically associated with those of U.S. dollar denominated transactions as a result of, among other factors, fluctuations of exchange rates in relation to the U.S. dollar, the possibility of lower levels of governmental supervision and regulation of foreign securities markets and the possibility of political or economic instability.
11. Credit Facility
The Trust and other Morgan Stanley funds participated in a $150,000,000 committed, unsecured revolving line of credit facility (the "Facility") with State Street. This Facility is to be used for temporary emergency purposes or funding of shareholder redemption requests. The interest rate on borrowings is based on the federal funds rate or 1 month LIBOR rate plus a spread. The Facility also has a commitment fee of 0.25% per annum based on the unused portion of the Facility. During the year ended December 31, 2018, the Funds did not have any borrowings under the Facility.
51
Morgan Stanley Variable Investment Series
Notes to Financial Statements n December 31, 2018 continued
12. Other
At December 31, 2018, certain Funds had record owners of 10% or greater. Investment activities of these shareholders could have a material impact on these Funds. These Funds and the aggregate percentage of such owners were as follows:
| PERCENTAGE OF OWNERSHIP | |||||||
Income Plus | 94.4 | % | |||||
Multi Cap Growth | 95.0 | ||||||
13. Accounting Pronouncement
In March 2017, FASB issued an Accounting Standard Update, ASU 2017-08, Receivables-Nonrefundable Fees and Other Costs (Subtopic 310-20), Premium Amortization on Purchased Callable Debt Securities ("ASU 2017-08") which amends the amortization period for certain purchased callable debt securities held at a premium, shortening such period to the earliest call date. ASU 2017-08 does not require any accounting change for debt securities held at a discount; the discount continues to be accreted to maturity. ASU 2017-08 is effective for fiscal years, and interim periods within those fiscal years, beginning after December 15, 2018. At this time, management is evaluating the implications of these changes on the financial statements.
14. Fund Liquidations
On June 14, 2018, the Trustees of the Trust approved a Plan of Liquidation with respect to European Equity Portfolio and Limited Duration Portfolio (together the "Funds"). On September 12, 2018, the shareholders of the Funds approved the Plan of Liquidation, pursuant to which substantially all of the assets of the Funds were liquidated, known liabilities of the Funds were satisfied, the remaining proceeds were distributed to the Funds' shareholders, and all of the issued and outstanding shares of the Funds were redeemed (the "Liquidation"). The Liquidation was consummated on October 19, 2018.
15. Subsequent Event
On October 4, 2018, the Trustees of the Trust, on behalf of Multi Cap Growth Portfolio (the "Fund"), approved an Agreement and Plan of Reorganization by and between the Trust, on behalf of the Fund, and Morgan Stanley Variable Insurance Fund, Inc., on behalf of its series Growth Portfolio ("VIF Growth"), pursuant to which substantially all of the assets and liabilities of the Fund would be transferred to VIF Growth and shareholders of the Fund would become shareholders of VIF Growth, receiving shares of VIF Growth equal to the value of their holdings in the Fund (the "Reorganization"). Class X shareholders of the Fund would receive Class I Shares of VIF Growth and Class Y shareholders of the Fund would receive Class II Shares of VIF Growth. On February 6, 2019, shareholders of the Fund approved the Reorganization. It is anticipated that the Reorganization will be consummated on or about April 29, 2019.
52
(This page has been intentionally left blank.)
Morgan Stanley Variable Investment Series
Financial Highlights
FOR THE YEAR ENDED DECEMBER 31 | NET ASSET VALUE BEGINNING OF PERIOD | NET INVESTMENT INCOME (LOSS)(1) | NET REALIZED AND UNREALIZED GAIN (LOSS) | TOTAL FROM INVESTMENT OPERATIONS | DIVIDENDS TO SHAREHOLDERS | DISTRIBUTIONS TO SHAREHOLDERS | TOTAL DIVIDENDS AND DISTRIBUTIONS | ||||||||||||||||||||||||
| INCOME PLUS CLASS X SHARES | |||||||||||||||||||||||||||||||
2014 | $ | 11.48 | $ | 0.42 | $ | 0.47 | $ | 0.89 | $ | (0.51 | ) | — | $ | (0.51 | ) | ||||||||||||||||
2015 | 11.86 | 0.42 | (0.66 | ) | (0.24 | ) | (0.47 | ) | $ | (0.01 | ) | (0.48 | ) | ||||||||||||||||||
| 2016(2) | 11.14 | 0.42 | 0.37 | 0.79 | (0.46 | ) | (0.28 | ) | (0.74 | ) | |||||||||||||||||||||
2017 | 11.19 | 0.34 | 0.39 | 0.73 | (0.41 | ) | — | (0.41 | ) | ||||||||||||||||||||||
2018 | 11.51 | 0.36 | (0.82 | ) | (0.46 | ) | (0.38 | ) | (0.24 | ) | (0.62 | ) | |||||||||||||||||||
CLASS Y SHARES | |||||||||||||||||||||||||||||||
2014 | 11.45 | 0.39 | 0.45 | 0.84 | (0.47 | ) | — | (0.47 | ) | ||||||||||||||||||||||
2015 | 11.82 | 0.39 | (0.64 | ) | (0.25 | ) | (0.44 | ) | (0.01 | ) | (0.45 | ) | |||||||||||||||||||
| 2016(2) | 11.12 | 0.39 | 0.35 | 0.74 | (0.42 | ) | (0.28 | ) | (0.70 | ) | |||||||||||||||||||||
2017 | 11.16 | 0.32 | 0.39 | 0.71 | (0.38 | ) | — | (0.38 | ) | ||||||||||||||||||||||
2018 | 11.49 | 0.33 | (0.82 | ) | (0.49 | ) | (0.35 | ) | (0.24 | ) | (0.59 | ) | |||||||||||||||||||
| MULTI CAP GROWTH CLASS X SHARES | |||||||||||||||||||||||||||||||
2014 | 60.67 | (0.06 | ) | 3.23 | 3.17 | — | (7.79 | ) | (7.79 | ) | |||||||||||||||||||||
2015 | 56.05 | (0.15 | ) | 4.86 | 4.71 | — | (10.37 | ) | (10.37 | ) | |||||||||||||||||||||
| 2016(3) | 50.39 | 0.00 | (4) | (1.85 | ) | (1.85 | ) | — | (7.91 | ) | (7.91 | ) | |||||||||||||||||||
2017 | 40.63 | (0.04 | ) | 19.27 | 19.23 | — | (5.20 | ) | (5.20 | ) | |||||||||||||||||||||
2018 | 54.66 | (0.07 | ) | 8.83 | 8.76 | — | (17.06 | ) | (17.06 | ) | |||||||||||||||||||||
CLASS Y SHARES | |||||||||||||||||||||||||||||||
2014 | 59.96 | (0.20 | ) | 3.18 | 2.98 | — | (7.79 | ) | (7.79 | ) | |||||||||||||||||||||
2015 | 55.15 | (0.28 | ) | 4.78 | 4.50 | — | (10.37 | ) | (10.37 | ) | |||||||||||||||||||||
| 2016(3) | 49.28 | (0.11 | ) | (1.81 | ) | (1.92 | ) | — | (7.91 | ) | (7.91 | ) | |||||||||||||||||||
2017 | 39.45 | (0.16 | ) | 18.66 | 18.50 | — | (5.20 | ) | (5.20 | ) | |||||||||||||||||||||
2018 | 52.75 | (0.20 | ) | 8.58 | 8.38 | — | (17.06 | ) | (17.06 | ) | |||||||||||||||||||||
See Notes to Financial Statements
54
| RATIOS TO AVERAGE NET ASSETS | |||||||||||||||||||||||||||||||
FOR THE YEAR ENDED DECEMBER 31 | NET ASSET VALUE END OF PERIOD | TOTAL RETURN(6) | NET ASSETS END OF PERIOD (000'S) | EXPENSES | NET INVESTMENT INCOME (LOSS) | REBATE FROM MORGAN STANLEY AFFILIATE | PORTFOLIO TURNOVER RATE | ||||||||||||||||||||||||
| INCOME PLUS CLASS X SHARES | |||||||||||||||||||||||||||||||
2014 | $ | 11.86 | 7.79 | % | $ | 68,129 | 0.64 | %(7) | 3.52 | %(7) | 0.00 | %(5) | 43 | % | |||||||||||||||||
2015 | 11.14 | (2.09 | ) | 57,579 | 0.68 | (7) | 3.56 | (7) | 0.00 | (5) | 44 | ||||||||||||||||||||
| 2016(2) | 11.19 | 7.08 | 53,539 | 0.63 | (7)(8) | 3.67 | (7)(8) | 0.00 | (5) | 39 | |||||||||||||||||||||
2017 | 11.51 | 6.65 | 48,050 | 0.77 | (7) | 3.02 | (7) | 0.00 | (5) | 50 | |||||||||||||||||||||
2018 | 10.43 | (4.01 | ) | 38,430 | 0.78 | (7) | 3.27 | (7) | 0.00 | (5) | 47 | ||||||||||||||||||||
CLASS Y SHARES | |||||||||||||||||||||||||||||||
2014 | 11.82 | 7.40 | 69,491 | 0.89 | (7) | 3.27 | (7) | 0.00 | (5) | 43 | |||||||||||||||||||||
2015 | 11.12 | (2.22 | ) | 56,969 | 0.93 | (7) | 3.31 | (7) | 0.00 | (5) | 44 | ||||||||||||||||||||
| 2016(2) | 11.16 | 6.68 | 52,595 | 0.88 | (7)(8) | 3.42 | (7)(8) | 0.00 | (5) | 39 | |||||||||||||||||||||
2017 | 11.49 | 6.46 | 48,287 | 1.02 | (7) | 2.77 | (7) | 0.00 | (5) | 50 | |||||||||||||||||||||
2018 | 10.41 | (4.31 | ) | 38,832 | 1.03 | (7) | 3.02 | (7) | 0.00 | (5) | 47 | ||||||||||||||||||||
| MULTI CAP GROWTH CLASS X SHARES | |||||||||||||||||||||||||||||||
2014 | 56.05 | 5.71 | 200,910 | 0.54 | (7) | (0.11 | )(7) | 0.00 | (5) | 29 | |||||||||||||||||||||
2015 | 50.39 | 8.60 | 188,317 | 0.57 | (7)(9) | (0.27 | )(7)(9) | 0.00 | (5) | 34 | |||||||||||||||||||||
| 2016(3) | 40.63 | (3.41 | ) | 160,229 | 0.56 | (7)(9) | 0.01 | (7)(9) | 0.00 | (5) | 42 | ||||||||||||||||||||
2017 | 54.66 | 49.39 | 204,928 | 0.57 | (7)(9) | (0.09 | )(7)(9) | 0.00 | (5) | 67 | |||||||||||||||||||||
2018 | 46.36 | 13.27 | 201,060 | 0.56 | (7)(9) | (0.12 | )(7)(9) | 0.00 | (5) | 104 | |||||||||||||||||||||
CLASS Y SHARES | |||||||||||||||||||||||||||||||
2014 | 55.15 | 5.44 | 56,027 | 0.79 | (7) | (0.36 | )(7) | 0.00 | (5) | 29 | |||||||||||||||||||||
2015 | 49.28 | 8.34 | 51,882 | 0.82 | (7)(9) | (0.52 | )(7)(9) | 0.00 | (5) | 34 | |||||||||||||||||||||
| 2016(3) | 39.45 | (3.65 | ) | 42,909 | 0.81 | (7)(9) | (0.24 | )(7)(9) | 0.00 | (5) | 42 | ||||||||||||||||||||
2017 | 52.75 | 49.00 | 53,144 | 0.82 | (7)(9) | (0.34 | )(7)(9) | 0.00 | (5) | 67 | |||||||||||||||||||||
2018 | 44.07 | 13.00 | 50,733 | 0.81 | (7)(9) | (0.37 | )(7)(9) | 0.00 | (5) | 104 | |||||||||||||||||||||
55
Morgan Stanley Variable Investment Series
Financial Highlights continued
(1) The per share amounts were computed using an average number of shares outstanding during the period.
(2) Reflects prior period Custodian out-of-pocket expenses that were reimbursed in September 2016. The amount of the reimbursement was immaterial on a per share basis and did not impact the total return of the Fund.
(3) Reflects prior period Custodian out-of-pocket expenses that were reimbursed in September 2016. The amount of the reimbursement was immaterial on a per share basis and did not impact the total return of the Fund. The annualized expense and net investment income (loss) ratios would be unchanged as the reimbursement of Custodian fees was offset against expense waivers/reimbursements with no impact to net expenses or net investment income (loss).
(4) Amount is less than $0.001.
(5) Amount is less than 0.005%.
(6) Calculated based on the net asset value as of the last business day of the period. Performance shown does not reflect fees and expenses imposed by your insurance company. If performance information included the effect of these additional charges, the total returns would be lower.
(7) The ratios reflect the rebate of certain Fund expenses in connection with investments in a Morgan Stanley affiliate during the period. The effect of the rebate on the ratios is disclosed in the above table as "Rebate from Morgan Stanley affiliate."
(8) If the Fund had not received the reimbursement from the Custodian, the annualized expense and net investment income ratios would have been as follows:
PERIOD ENDED | EXPENSE RATIO | NET INVESTMENT INCOME RATIO | |||||||||
December 31, 2016 | |||||||||||
Class X | 0.68 | % | 3.62 | % | |||||||
Class Y | 0.93 | 3.37 | |||||||||
(9) If the Fund had borne all of its expenses that were reimbursed or waived by the Adviser/Administrator, the annualized expense and net investment loss ratios would have been as follows:
PERIOD ENDED | EXPENSE RATIO | NET INVESTMENT LOSS RATIO | |||||||||
December 31, 2018 | |||||||||||
Class X | 0.58 | % | (0.14 | )% | |||||||
Class Y | 0.83 | (0.39 | ) | ||||||||
December 31, 2017 | |||||||||||
Class X | 0.60 | (0.12 | ) | ||||||||
Class Y | 0.85 | (0.37 | ) | ||||||||
December 31, 2016 | |||||||||||
Class X | 0.58 | (0.01 | ) | ||||||||
Class Y | 0.83 | (0.26 | ) | ||||||||
December 31, 2015 | |||||||||||
Class X | 0.58 | (0.28 | ) | ||||||||
Class Y | 0.83 | (0.53 | ) | ||||||||
See Notes to Financial Statements
56
Morgan Stanley Variable Investment Series
Report of Independent Registered Public Accounting Firm
To the Shareholders and Board of Trustees of
Morgan Stanley Variable Investment Series
Opinion on the Financial Statements
We have audited the accompanying statements of assets and liabilities of Morgan Stanley Variable Investment Series (the "Trust") (comprising, Income Plus Portfolio and Multi Cap Growth Portfolio) (collectively the "Funds") including the portfolios of investments, as of December 31, 2018, and the related statements of operations for the year then ended, the statements of changes in net assets for each of the two years in the period then ended, the financial highlights for each of the five years in the period then ended and the related notes (collectively referred to as the "financial statements"). In our opinion, the financial statements present fairly, in all material respects, the financial position of each of the Funds comprising Morgan Stanley Variable Investment Series at December 31, 2018, the results of their operations for the year then ended, the changes in their net assets for each of the two years in the period then ended and their financial highlights for each of the five years in the period then ended, in conformity with U.S. generally accepted accounting principles.
Basis for Opinion
These financial statements are the responsibility of the Trust's management. Our responsibility is to express an opinion on the Funds' financial statements based on our audits. We are a public accounting firm registered with the Public Company Accounting Oversight Board (United States) ("PCAOB") and are required to be independent with respect to the Trust in accordance with the U.S. federal securities law and the applicable rules and regulations of the Securities and Exchange Commission and the PCAOB.
We conducted our audits in accordance with the standards of the PCAOB. Those standards require that we plan and perform the audit to obtain reasonable assurance about whether the financial statements are free of material misstatement, whether due to error or fraud. The Trust is not required to have, nor were we engaged to perform, an audit of the Trust's internal control over financial reporting. As part of our audits, we are required to obtain an understanding of internal control over financial reporting, but not for the purpose of expressing an opinion on the effectiveness of the Trust's internal control over financial reporting. Accordingly, we express no such opinion.
Our audits included performing procedures to assess the risks of material misstatement of the financial statements, whether due to error or fraud, and performing procedures that respond to those risks. Such procedures included examining, on a test basis, evidence regarding the amounts and disclosures in the financial statements. Our procedures included confirmation of securities owned as of December 31, 2018 by correspondence with the custodian and others or by other appropriate auditing procedures where replies from others were not received. Our audits also included evaluating the accounting principles used and significant estimates made by management, as well as evaluating the overall presentation of the financial statements. We believe that our audits provide a reasonable basis for our opinion.

We have served as the auditor of one or more Morgan Stanley investment companies since 2000.
Boston, Massachusetts
February 20, 2019
57
Morgan Stanley Variable Investment Series
Trustee and Officer Information (unaudited)
Independent Trustees:
| Name, Age and Address of Independent Trustee | Position(s) Held with Registrant | Length of Time Served* | Principal Occupation(s) During Past 5 Years and Other Relevant Professional Experience | Number of Portfolios in Fund Complex Overseen by Independent Trustee** | Other Directorships Held by Independent Trustee*** | ||||||||||||||||||
| Frank L. Bowman (74) c/o Perkins Coie LLP Counsel to the Independent Trustees 30 Rockefeller Plaza New York, NY 10112 | Trustee | Since August 2006 | President, Strategic Decisions, LLC (consulting) (since February 2009); Director or Trustee of various Morgan Stanley Funds (since August 2006); Chairperson of the Compliance and Insurance Committee (since October 2015); formerly, Chairperson of the Insurance Sub-Committee of the Compliance and Insurance Committee (2007-2015); served as President and Chief Executive Officer of the Nuclear Energy Institute (policy organization) (February 2005-November 2008); retired as Admiral, U.S. Navy after serving over 38 years on active duty including 8 years as Director of the Naval Nuclear Propulsion Program in the Department of the Navy and the U.S. Department of Energy (1996-2004); served as Chief of Naval Personnel (July 1994-September 1996) and on the Joint Staff as Director of Political Military Affairs (June 1992-July 1994); knighted as Honorary Knight Commander of the Most Excellent Order of the British Empire; awarded the Officier de l'Orde National du Mérite by the French Government; elected to the National Academy of Engineering (2009). | 82 | Director of BP p.l.c.; Director of Naval and Nuclear Technologies LLP; Director Emeritus of the Armed Services YMCA; Member of the National Security Advisory Council of the Center for U.S. Global Engagement and a member of the CNA Military Advisory Board; Trustee of Fairhaven United Methodist Church; Member of the Board of Advisors of the Dolphin Scholarship Foundation; and Director of other various non-profit organizations. | ||||||||||||||||||
58
Morgan Stanley Variable Investment Series
Trustee and Officer Information (unaudited) continued
| Name, Age and Address of Independent Trustee | Position(s) Held with Registrant | Length of Time Served* | Principal Occupation(s) During Past 5 Years and Other Relevant Professional Experience | Number of Portfolios in Fund Complex Overseen by Independent Trustee** | Other Directorships Held by Independent Trustee*** | ||||||||||||||||||
| Kathleen A. Dennis (65) c/o Perkins Coie LLP Counsel to the Independent Trustees 30 Rockefeller Plaza New York, NY 10112 | Trustee | Since August 2006 | President, Cedarwood Associates (mutual fund and investment management consulting) (since July 2006); Chairperson of the Liquidity and Alternatives Sub-Committee of the Investment Committee (since October 2006) and Director or Trustee of various Morgan Stanley Funds (since August 2006); formerly, Senior Managing Director of Victory Capital Management (1993-2006). | 82 | Director of various non-profit organizations. | ||||||||||||||||||
| Nancy C. Everett (63) c/o Perkins Coie LLP Counsel to the Independent Trustees 30 Rockefeller Plaza New York, NY 10112 | Trustee | Since January 2015 | Chief Executive Officer, Virginia Commonwealth University Investment Company (since November 2015); Owner OBIR, LLC (institutional investment management consulting) (since June 2014); formerly, Managing Director, BlackRock, Inc. (February 2011-December 2013); and Chief Executive Officer, General Motors Asset Management (a/k/a Promark Global Advisors, Inc.) (June 2005-May 2010). | 83 | Formerly, Member of Virginia Commonwealth University School of Business Foundation (2005-2016); Member of Virginia Commonwealth University Board of Visitors (2013-2015); Member of Committee on Directors for Emerging Markets Growth Fund, Inc. (2007-2010); Chairperson of Performance Equity Management, LLC (2006-2010); and Chairperson, GMAM Absolute Return Strategies Fund, LLC (2006-2010). | ||||||||||||||||||
59
Morgan Stanley Variable Investment Series
Trustee and Officer Information (unaudited) continued
| Name, Age and Address of Independent Trustee | Position(s) Held with Registrant | Length of Time Served* | Principal Occupation(s) During Past 5 Years and Other Relevant Professional Experience | Number of Portfolios in Fund Complex Overseen by Independent Trustee** | Other Directorships Held by Independent Trustee*** | ||||||||||||||||||
| Jakki L. Haussler (61) c/o Perkins Coie LLP Counsel to the Independent Trustees 30 Rockefeller Plaza New York, NY 10112 | Trustee | Since January 2015 | Chairman and Chief Executive Officer, Opus Capital Group (since January 1996); formerly, Director, Capvest Venture Fund, LP (May 2000-December 2011); Partner, Adena Ventures, LP (July 1999-December 2010); Director, The Victory Funds (February 2005-July 2008). | 83 | Director of Service Corporation International and Member, Audit Committee and Investment Committee; Director of Cincinnati Bell Inc. and Member, Audit Committee and Governance and Nominating Committee; Chairman of Northern Kentucky University Member, Investment Committee; Member of Chase College of Law Transactional Law Practice Center Board of Advisors; Director of Best Transport; Director of Chase College of Law Board of Visitors; formerly, Member, University of Cincinnati Foundation Investment Committee; Member, Miami University Board of Visitors (2008-2011); Trustee of Victory Funds (2005-2008) and Chairman, Investment Committee (2007-2008) and Member, Service Provider Committee (2005-2008). | ||||||||||||||||||
| Dr. Manuel H. Johnson (69) c/o Johnson Smick International, Inc. 220 I Street, NE — Suite 200 Washington, D.C. 20002 | Trustee | Since July 1991 | Senior Partner, Johnson Smick International, Inc. (consulting firm); Chairperson of the Investment Committee (since October 2006) and Director or Trustee of various Morgan Stanley Funds (since July 1991); Co-Chairman and a founder of the Group of Seven Council (G7C) (international economic commission); formerly, Chairperson of the Audit Committee (July 1991-September 2006), Vice Chairman of the Board of Governors of the Federal Reserve System and Assistant Secretary of the U.S. Treasury. | 82 | Director of NVR, Inc. (home construction). | ||||||||||||||||||
60
Morgan Stanley Variable Investment Series
Trustee and Officer Information (unaudited) continued
| Name, Age and Address of Independent Trustee | Position(s) Held with Registrant | Length of Time Served* | Principal Occupation(s) During Past 5 Years and Other Relevant Professional Experience | Number of Portfolios in Fund Complex Overseen by Independent Trustee** | Other Directorships Held by Independent Trustee*** | ||||||||||||||||||
| Joseph J. Kearns (76) c/o Perkins Coie LLP Counsel to the Independent Trustees 30 Rockefeller Plaza New York, NY 10112 | Trustee | Since August 1994 | Senior Adviser, Kearns & Associates LLC (investment consulting); Chairperson of the Audit Committee (since October 2006) and Director or Trustee of various Morgan Stanley Funds (since August 1994); formerly, Deputy Chairperson of the Audit Committee (July 2003-September 2006) and Chairperson of the Audit Committee of various Morgan Stanley Funds (since August 1994); CFO of the J. Paul Getty Trust. | 83 | Prior to August 10, 2016, Director of Electro Rent Corporation (equipment leasing); Prior to December 31, 2013, Director of The Ford Family Foundation. | ||||||||||||||||||
| Michael F. Klein (60) c/o Perkins Coie LLP Counsel to the Independent Trustees 30 Rockefeller Plaza New York, NY 10112 | Trustee | Since August 2006 | Managing Director, Aetos Alternatives Management, LP (since March 2000); Co-President, Aetos Alternatives Management, LP (since January 2004) and Co-Chief Executive Officer of Aetos Capital LLC (since August 2013); Chairperson of the Fixed Income Sub-Committee of the Investment Committee (since October 2006) and Director or Trustee of various Morgan Stanley Funds (since August 2006); formerly, Managing Director, Morgan Stanley & Co. Inc. and Morgan Stanley Dean Witter Investment Management and President, various Morgan Stanley Funds (June1998-March 2000); Principal, Morgan Stanley & Co. Inc. and Morgan Stanley Dean Witter Investment Management (August 1997-December 1999). | 83 | Director of certain investment funds managed or sponsored by Aetos Alternatives Management, LP; Director of Sanitized AG and Sanitized Marketing AG (specialty chemicals). | ||||||||||||||||||
61
Morgan Stanley Variable Investment Series
Trustee and Officer Information (unaudited) continued
| Name, Age and Address of Independent Trustee | Position(s) Held with Registrant | Length of Time Served* | Principal Occupation(s) During Past 5 Years and Other Relevant Professional Experience | Number of Portfolios in Fund Complex Overseen by Independent Trustee** | Other Directorships Held by Independent Trustee*** | ||||||||||||||||||
| Patricia Maleski (58) c/o Perkins Coie LLP Counsel to the Independent Trustees 30 Rockefeller Plaza New York, NY 10112 | Trustee | Since January 2017 | Managing Director, JPMorgan Asset Management (2004-2016); Oversight and Control Head of Fiduciary and Conflicts of Interest Program (2015-2016); Chief Control Officer-Global Asset Management (2013-2015); President, JPMorgan Funds (2010-2013); Chief Administrative Officer (2004-2013); various other positions including Treasurer and Board Liaison (since 2001). | 83 | None. | ||||||||||||||||||
| Michael E. Nugent (82) 522 Fifth Avenue New York, NY 10036 | Chair of the Board and Trustee | Chair of the Boards since July 2006 and Trustee since July 1991 | Chair of the Boards of various Morgan Stanley Funds (since July 2006); Chairperson of the Closed-End Fund Committee (since June 2012); Governance Committee (since January 2019) and Director or Trustee of various Morgan Stanley Funds (since July 1991); formerly, Chairperson of the Insurance Committee (until July 2006); General Partner, Triumph Capital, L.P. (private investment partnership) (1988-2013). | 82 | None. | ||||||||||||||||||
| W. Allen Reed (71) c/o Perkins Coie LLP Counsel to the Independent Trustees 30 Rockefeller Plaza New York, NY 10112 | Trustee | Since August 2006 | Chairperson of the Equity Sub-Committee of the Investment Committee (since October 2006) and Director or Trustee of various Morgan Stanley Funds (since August 2006); formerly, President and CEO of General Motors Asset Management; Chairman and Chief Executive Officer of the GM Trust Bank and Corporate Vice President of General Motors Corporation (August 1994-December 2005). | 82 | Director of Legg Mason, Inc.; formerly, Director of the Auburn University Foundation (2010-2015). | ||||||||||||||||||
62
Morgan Stanley Variable Investment Series
Trustee and Officer Information (unaudited) continued
| Name, Age and Address of Independent Trustee | Position(s) Held with Registrant | Length of Time Served* | Principal Occupation(s) During Past 5 Years and Other Relevant Professional Experience | Number of Portfolios in Fund Complex Overseen by Independent Trustee** | Other Directorships Held by Independent Trustee*** | ||||||||||||||||||
| Fergus Reid (86)**** c/o Joe Pietryka, Inc. 85 Charles Colman Blvd. Pawling, NY 12564 | Director | Since June 1992 | Chairman, Joe Pietryka, Inc.; Chairperson of the Governance Committee and Director or Trustee of various Morgan Stanley Funds (since June 1992). | 83 | Formerly, Trustee and Director of certain investment companies in the JP Morgan Fund Complex managed by JP Morgan Investment Management Inc. (1987-2012). | ||||||||||||||||||
* This is the earliest date the Trustee began serving the Morgan Stanley Funds. Each Trustee serves an indefinite term, until his or her successor is elected.
** The Fund Complex includes (as of December 31, 2018) all open-end and closed-end funds (including all of their portfolios) advised by Morgan Stanley Investment Management Inc. (the "Adviser") and any funds that have an adviser that is an affiliated person of the Adviser (including, but not limited to, Morgan Stanley AIP GP LP).
*** This includes any directorships at public companies and registered investment companies held by the Trustee at any time during the past five years.
**** Effective date of retirement is December 31, 2018.
63
Morgan Stanley Variable Investment Series
Trustee and Officer Information (unaudited) continued
Executive Officers:
| Name, Age and Address of Executive Officer | Position(s) Held with Registrant | Length of Time Served* | Principal Occupation(s) During Past 5 Years | ||||||||||||
| John H. Gernon (55) 522 Fifth Avenue New York, NY 10036 | President and Principal Executive Officer | Since September 2013 | President and Principal Executive Officer of the Equity and Fixed Income Funds and the Morgan Stanley AIP Funds (since September 2013) and the Liquidity Funds and various money market funds (since May 2014) in the Fund Complex; Managing Director of the Adviser; Head of Product (since 2006). | ||||||||||||
| Timothy J. Knierim (59) 522 Fifth Avenue New York, NY 10036 | Chief Compliance Officer | Since December 2016 | Managing Director of the Adviser and various entities affiliated with the Adviser; Chief Compliance Officer of various Morgan Stanley Funds and the Adviser (since December 2016) and Chief Compliance Officer of Morgan Stanley AIP GP LP (since 2014). Formerly, Managing Director and Deputy Chief Compliance Officer of the Adviser (2014-2016); and formerly, Chief Compliance Officer of Prudential Investment Management, Inc. (2007-2014). | ||||||||||||
| Francis J. Smith (53) 522 Fifth Avenue New York, NY 10036 | Treasurer and Principal Financial Officer | Treasurer since July 2003 and Principal Financial Officer since September 2002 | Managing Director of the Adviser and various entities affiliated with the Adviser; Treasurer (since July 2003) and Principal Financial Officer of various Morgan Stanley Funds (since September 2002). | ||||||||||||
| Mary E. Mullin (51) 522 Fifth Avenue New York, NY 10036 | Secretary | Since June 1999 | Managing Director of the Adviser; Secretary of various Morgan Stanley Funds (since June 1999). | ||||||||||||
| Michael J. Key (39) 522 Fifth Avenue New York, NY 10036 | Vice President | Since June 2017 | Vice President of the Equity and Fixed Income Funds, Liquidity Funds, various money market funds and the Morgan Stanley AIP Funds in the Fund Complex (since June 2017); Executive Director of the Adviser; Head of Product Development for Equity and Fixed Income Funds (since August 2013). | ||||||||||||
* This is the earliest date the officer began serving the Morgan Stanley Funds. Each officer serves a one-year term, until his or her successor is elected and qualifies.
64
Morgan Stanley Variable Investment Series
Federal Tax Notice n December 31, 2018 (unaudited)
For Federal income tax purposes, the following information is furnished with respect to the distributions paid by each applicable Fund during the taxable year ended December 31, 2018.
Each of the applicable Funds designated and paid the following amounts as a long-term capital gain distribution:
FUND | AMOUNT | ||||||
Income Plus | $ | 1,798,551 | |||||
Multi Cap Growth | 62,800,449 | ||||||
65
Trustees | |||||||
| Frank L. Bowman | Joseph J. Kearns | ||||||
| Kathleen A. Dennis | Michael F. Klein | ||||||
| Nancy C. Everett | Patricia Maleski | ||||||
| Jakki L. Haussler | Michael E. Nugent | ||||||
| Dr. Manuel H. Johnson | Chair of the Board | ||||||
W. Allen Reed | |||||||
Fergus Reid | |||||||
Officers | |||||||
John H. Gernon
President and Principal Executive Officer
Timothy J. Knierim
Chief Compliance Officer
Francis J. Smith
Treasurer and Principal Financial Officer
Mary E. Mullin
Secretary
Michael J. Key
Vice President
| Transfer Agent | Custodian | ||||||
| DST Asset Manager Solutions, Inc. 2000 Crown Colony Drive Quincy, Massachusetts 02169 | State Street Bank and Trust Company One Lincoln Street Boston, Massachusetts 02111 | ||||||
| Independent Registered Public Accounting Firm | Legal Counsel | ||||||
| Ernst & Young LLP 200 Clarendon Street Boston, Massachusetts 02116 | Dechert LLP 1095 Avenue of the Americas New York, New York 10036 | ||||||
| Counsel to the Independent Trustees | Adviser and Administrator | ||||||
| Perkins Coie LLP 30 Rockefeller Plaza New York, New York 10112 | Morgan Stanley Investment Management Inc. 522 Fifth Avenue New York, New York 10036 | ||||||
This report is submitted for the general information of shareholders of the Trust. For more detailed information about the Trust, its fees and expenses and other pertinent information, please read its Prospectus. The Trust's Statement of Additional Information contains additional information about the Trust, including its trustees. It is available without charge, by calling (800) 548-7786.
This report is not authorized for distribution to prospective investors in the Trust unless preceded or accompanied by an effective Prospectus. Read the Prospectus carefully before investing.
Morgan Stanley Distribution, Inc., member FINRA.
#40113A
VARINANN
2397857 EXP 02.29.2020
Item 2. Code of Ethics.
(a) The registrant has adopted a code of ethics (the “Code of Ethics”) that applies to its principal executive officer, principal financial officer, principal accounting officer or controller, or persons performing similar functions, regardless of whether these individuals are employed by the registrant or a third party.
(b) No information need be disclosed pursuant to this paragraph.
(c) Not applicable.
(d) Not applicable.
(e) Not applicable.
(f)
(1) The registrant’s Code of Ethics is attached hereto as Exhibit 12 A.
(2) Not applicable.
(3) Not applicable.
Item 3. Audit Committee Financial Expert.
The registrant’s Board of Trustees has determined that Joseph J. Kearns, an “independent” Trustee, is an “audit committee financial expert” serving on its audit committee. Under applicable securities laws, a person who is determined to be an audit committee financial expert will not be deemed an “expert” for any purpose, including without limitation for the purposes of Section 11 of the Securities Act of 1933, as a result of being designated or identified as an audit committee financial expert. The designation or identification of a person as an audit committee financial expert does not impose on such person any duties, obligations, or liabilities that are greater than the duties, obligations, and liabilities imposed on such person as a member of the audit committee and Board of Trustees in the absence of such designation or identification.
Item 4. Principal Accountant Fees and Services.
(a)(b)(c)(d) and (g). Based on fees billed for the periods shown:
2018
|
| Registrant |
| Covered Entities(1) |
| ||
Audit Fees |
| $ | 106,745 |
| N/A |
| |
|
|
|
|
|
| ||
Non-Audit Fees |
|
|
|
|
| ||
Audit-Related Fees |
| $ | — | (2) | $ | — | (2) |
Tax Fees |
| $ | 9,533 | (3) | $ | 8,773,935 | (4) |
All Other Fees |
| $ |
|
| $ | 18,115 | (5) |
Total Non-Audit Fees |
| $ | 9,533 |
| $ | 8,792,050 |
|
|
|
|
|
|
| ||
Total |
| $ | 116,278 |
| $ | 8,792,050 |
|
2017
|
| Registrant |
| Covered Entities(1) |
| ||
Audit Fees |
| $ | 195,768 |
| N/A |
| |
|
|
|
|
|
| ||
Non-Audit Fees |
|
|
|
|
| ||
Audit-Related Fees |
| $ | — | (2) | $ | — | (2) |
Tax Fees |
| $ | 18,500 | (3) | $ | 11,474,825 | (4) |
All Other Fees |
| $ | — |
| $ | 136,088 | (5) |
Total Non-Audit Fees |
| $ | 18,500 |
| $ | 11,610,913 |
|
|
|
|
|
|
| ||
Total |
| $ | 214,268 |
| $ | 11,610,913 |
|
N/A- Not applicable, as not required by Item 4.
(1) Covered Entities include the Adviser (excluding sub-advisors) and any entity controlling, controlled by or under common control with the Adviser that provides ongoing services to the Registrant.
(2) Audit-Related Fees represent assurance and related services provided that are reasonably related to the performance of the audit of the financial statements of the Covered Entities’ and funds advised by the Adviser or its affiliates, specifically data verification and agreed-upon procedures related to asset securitizations and agreed-upon procedures engagements.
(3) Tax Fees represent tax compliance, tax planning and tax advice services provided in connection with the preparation and review of the Registrant’s tax returns.
(4) Tax Fees represent tax compliance, tax planning and tax advice services provided in connection with the review of Covered Entities’ tax returns.
(5) All other fees represent project management for future business applications and improving business and operational processes.
(e)(1) The audit committee’s pre-approval policies and procedures are as follows:
APPENDIX A
AUDIT COMMITTEE
AUDIT AND NON-AUDIT SERVICES
PRE-APPROVAL POLICY AND PROCEDURES
OF THE
MORGAN STANLEY FUNDS
AS ADOPTED AND AMENDED JULY 23, 2004 AND JUNE 15 AND 16, 2016(3)
1. Statement of Principles
The Audit Committee of the Board is required to review and, in its sole discretion, pre-approve all Covered Services to be provided by the Independent Auditors to the Fund and Covered Entities in order to assure that services performed by the Independent Auditors do not impair the auditor’s independence from the Fund.
The SEC has issued rules specifying the types of services that an independent auditor may not provide to its audit client, as well as the audit committee’s administration of the engagement of the independent auditor. The SEC’s rules establish two different approaches to pre-approving services, which the SEC considers to be equally valid. Proposed services either: may be pre-approved without consideration of specific case-by-case services by the Audit Committee (“general pre-approval”); or require the specific pre-approval of the Audit Committee or its delegate (“specific pre-approval”). The Audit Committee believes that the combination of these two approaches in this Policy will result in an effective and efficient procedure to pre-approve services performed by the Independent Auditors. As set forth in this Policy, unless a type of service has received general pre-approval, it will require specific pre-approval by the Audit Committee (or by any member of the Audit Committee to which pre-approval authority has been delegated) if it is to be provided by the Independent Auditors. Any proposed services exceeding pre-approved cost levels or budgeted amounts will also require specific pre-approval by the Audit Committee.
The appendices to this Policy describe the Audit, Audit-related, Tax and All Other services that have the general pre-approval of the Audit Committee. The term of any general pre-approval is 12 months from the date of pre-approval, unless the Audit Committee considers and provides a different period and states otherwise. The Audit Committee will annually review and pre-approve the services that may be provided by the Independent Auditors without obtaining specific pre-approval from the Audit Committee. The Audit Committee will add to or subtract from the list of general pre-approved services from time to time, based on subsequent determinations.
The purpose of this Policy is to set forth the policy and procedures by which the Audit Committee intends to fulfill its responsibilities. It does not delegate the Audit Committee’s responsibilities to pre-approve services performed by the Independent Auditors to management.
The Fund’s Independent Auditors have reviewed this Policy and believes that implementation of the Policy will not adversely affect the Independent Auditors’ independence.
(3) This Audit Committee Audit and Non-Audit Services Pre-Approval Policy and Procedures (the “Policy”), adopted as of the date above, supersedes and replaces all prior versions that may have been adopted from time to time.
2. Delegation
As provided in the Act and the SEC’s rules, the Audit Committee may delegate either type of pre-approval authority to one or more of its members. The member to whom such authority is delegated must report, for informational purposes only, any pre-approval decisions to the Audit Committee at its next scheduled meeting.
3. Audit Services
The annual Audit services engagement terms and fees are subject to the specific pre-approval of the Audit Committee. Audit services include the annual financial statement audit and other procedures required to be performed by the Independent Auditors to be able to form an opinion on the Fund’s financial statements. These other procedures include information systems and procedural reviews and testing performed in order to understand and place reliance on the systems of internal control, and consultations relating to the audit. The Audit Committee will approve, if necessary, any changes in terms, conditions and fees resulting from changes in audit scope, Fund structure or other items.
In addition to the annual Audit services engagement approved by the Audit Committee, the Audit Committee may grant general pre-approval to other Audit services, which are those services that only the Independent Auditors reasonably can provide. Other Audit services may include statutory audits and services associated with SEC registration statements (on Forms N-1A, N-2, N-3, N-4, etc.), periodic reports and other documents filed with the SEC or other documents issued in connection with securities offerings.
The Audit Committee has pre-approved the Audit services in Appendix B.1. All other Audit services not listed in Appendix B.1 must be specifically pre-approved by the Audit Committee (or by any member of the Audit Committee to which pre-approval has been delegated).
4. Audit-related Services
Audit-related services are assurance and related services that are reasonably related to the performance of the audit or review of the Fund’s financial statements and, to the extent they are Covered Services, the Covered Entities or that are traditionally performed by the Independent Auditors. Because the Audit Committee believes that the provision of Audit-related services does not impair the independence of the auditor and is consistent with the SEC’s rules on auditor independence, the Audit Committee may grant general pre-approval to Audit-related services. Audit-related services include, among others, accounting consultations related to accounting, financial reporting or disclosure matters not classified as “Audit services”; assistance with understanding and implementing new accounting and financial reporting guidance from rulemaking authorities; agreed-upon or expanded audit procedures related to accounting and/or billing records required to respond to or comply with financial, accounting or regulatory reporting matters; and assistance with internal control reporting requirements under Forms N-CEN and/or N-CSR.
The Audit Committee has pre-approved the Audit-related services in Appendix B.2. All other Audit-related services not listed in Appendix B.2 must be specifically pre-approved by the Audit Committee (or by any member of the Audit Committee to which pre-approval has been delegated).
5. Tax Services
The Audit Committee believes that the Independent Auditors can provide Tax services to the Fund and, to the extent they are Covered Services, the Covered Entities, such as tax compliance, tax planning and tax advice without impairing the auditor’s independence, and the SEC has stated that the Independent Auditors may provide such services.
Pursuant to the preceding paragraph, the Audit Committee has pre-approved the Tax Services in Appendix B.3. All Tax services in Appendix B.3 must be specifically pre-approved by the Audit Committee (or by any member of the Audit Committee to which pre-approval has been delegated).
6. All Other Services
The Audit Committee believes, based on the SEC’s rules prohibiting the Independent Auditors from providing specific non-audit services, that other types of non-audit services are permitted. Accordingly, the Audit Committee believes it may grant general pre-approval to those permissible non-audit services classified as All Other services that it believes are routine and recurring services, would not impair the independence of the auditor and are consistent with the SEC’s rules on auditor independence.
The Audit Committee has pre-approved the All Other services in Appendix B.4. Permissible All Other services not listed in Appendix B.4 must be specifically pre-approved by the Audit Committee (or by any member of the Audit Committee to which pre-approval has been delegated).
7. Pre-Approval Fee Levels or Budgeted Amounts
Pre-approval fee levels or budgeted amounts for all services to be provided by the Independent Auditors will be established annually by the Audit Committee. Any proposed services exceeding these levels or amounts will require specific pre-approval by the Audit Committee. The Audit Committee is mindful of the overall relationship of fees for audit and non-audit services in determining whether to pre-approve any such services.
8. Procedures
All requests or applications for services to be provided by the Independent Auditors that do not require specific approval by the Audit Committee will be submitted to the Fund’s Principal Financial and Accounting Officer and must include a detailed description of the services to be rendered. The Fund’s Principal Financial and Accounting Officer will determine whether such services are included within the list of services that have received the general pre-approval of the Audit Committee. The Audit Committee will be informed on a timely basis of any such services rendered by the Independent Auditors. Requests or applications to provide services that require specific approval by the Audit Committee or Chairman of the Audit Committee will be submitted to the Audit Committee by the Fund’s Principal Financial and
Accounting Officer, who, after consultation with the Independent Auditors, will discuss whether the request or application is consistent with the SEC’s rules on auditor independence.
The Audit Committee has designated the Fund’s Principal Financial and Accounting Officer to monitor the performance of all services provided by the Independent Auditors and to determine whether such services are in compliance with this Policy. The Fund’s Principal Financial and Accounting Officer will report to the Audit Committee on a periodic basis on the results of its monitoring. Both the Fund’s Principal Financial and Accounting Officer and management will immediately report to the chairman of the Audit Committee any breach of this Policy that comes to the attention of the Fund’s Principal Financial and Accounting Officer or any member of management.
9. Additional Requirements
The Audit Committee has determined to take additional measures on an annual basis to meet its responsibility to oversee the work of the Independent Auditors and to assure the auditor’s independence from the Fund, such as reviewing a formal written statement from the Independent Auditors delineating all relationships between the Independent Auditors and the Fund, consistent with the PCAOB’s Ethics and Independence Rule 3526, and discussing with the Independent Auditors its methods and procedures for ensuring independence.
10. Covered Entities
Covered Entities include the Fund’s investment adviser(s) and any entity controlling, controlled by or under common control with the Fund’s investment adviser(s) that provides ongoing services to the Fund(s). Beginning with non-audit service contracts entered into on or after May 6, 2003, the Fund’s audit committee must pre-approve non-audit services provided not only to the Fund but also to the Covered Entities if the engagements relate directly to the operations and financial reporting of the Fund. This list of Covered Entities would include:
Morgan Stanley Funds
Morgan Stanley & Co. LLC
Morgan Stanley Investment Management Inc.
Morgan Stanley Investment Management Limited
Morgan Stanley Investment Management Private Limited
Morgan Stanley Asset & Investment Trust Management Co., Limited
Morgan Stanley Investment Management Company
Morgan Stanley Services Company, Inc.
Morgan Stanley Distribution, Inc.
Morgan Stanley AIP GP LP
Morgan Stanley Alternative Investment Partners LP
Morgan Stanley Smith Barney LLC
Morgan Stanley Capital Management LLC
Morgan Stanley Asia Limited
(e)(2) Beginning with non-audit service contracts entered into on or after May 6, 2003, the audit committee also is required to pre-approve services to Covered Entities to the extent that the services are determined to have a direct impact on the operations or financial reporting of the
Registrant. 100% of such services were pre-approved by the audit committee pursuant to the Audit Committee’s pre-approval policies and procedures (attached hereto).
(f) Not applicable.
(g) See table above.
(h) The audit committee of the Board of Trustees has considered whether the provision of services other than audit services performed by the auditors to the Registrant and Covered Entities is compatible with maintaining the auditors’ independence in performing audit services.
Item 5. Audit Committee of Listed Registrants.
(a) The registrant has a separately-designated standing audit committee established in accordance with Section 3(a)(58)(A) of the Exchange Act whose members are:
Joseph J. Kearns, Jakki L. Haussler, Michael F. Klein and W. Allen Reed.
(b) Not applicable.
Item 6. Schedule of Investments
(a) Refer to Item 1.
(b) Not applicable.
Item 7. Disclosure of Proxy Voting Policies and Procedures for Closed-End Management Investment Companies.
Applicable only to reports filed by closed-end funds.
Item 8. Portfolio Managers of Closed-End Management Investment Companies
Applicable only to reports filed by closed-end funds.
Item 9. Closed-End Fund Repurchases
Applicable only to reports filed by closed-end funds.
Item 10. Submission of Matters to a Vote of Security Holders
Not applicable.
Item 11. Controls and Procedures
(a) The registrant’s principal executive officer and principal financial officer have concluded that the registrant’s disclosure controls and procedures are sufficient to ensure that information required to be disclosed by the registrant in this Form N-CSR was recorded, processed, summarized and reported within the time periods specified in the Securities and Exchange Commission’s rules and forms, based upon such officers’ evaluation of these controls and procedures as of a date within 90 days of the filing date of the report.
(b) There were no changes in the registrant’s internal control over financial reporting that occurred during the second fiscal quarter of the period covered by this report that has materially affected, or is reasonably likely to materially affect, the registrant’s internal control over financial reporting.
Item 12. Exhibits
(a) The Code of Ethics for Principal Executive and Senior Financial Officers is attached hereto.
(b) A separate certification for each principal executive officer and principal financial officer of the registrant are attached hereto as part of EX-99.CERT.
SIGNATURES
Pursuant to the requirements of the Securities Exchange Act of 1934 and the Investment Company Act of 1940, the registrant has duly caused this report to be signed on its behalf by the undersigned, thereunto duly authorized.
Morgan Stanley Variable Investment Series
/s/ John H. Gernon |
|
John H. Gernon |
|
Principal Executive Officer |
|
February 19, 2019 |
|
Pursuant to the requirements of the Securities Exchange Act of 1934 and the Investment Company Act of 1940, this report has been signed by the following persons on behalf of the registrant and in the capacities and on the dates indicated.
/s/ John H. Gernon |
|
John H. Gernon |
|
Principal Executive Officer |
|
February 19, 2019 |
|
|
|
/s/ Francis Smith |
|
Francis Smith |
|
Principal Financial Officer |
|
February 19, 2019 |
|