UNITED STATES
SECURITIES AND EXCHANGE COMMISSION
Washington, D.C. 20549
FORM N-CSR
CERTIFIED SHAREHOLDER REPORT OF REGISTERED
MANAGEMENT INVESTMENT COMPANIES
Investment Company Act file number: 811-03692
Morgan Stanley Variable Investment Series
(Exact name of registrant as specified in charter)
| 522 Fifth Avenue, New York, New York | 10036 | |
| (Address of principal executive offices) | (Zip code) |
John H. Gernon
522 Fifth Avenue, New York, New York 10036
(Name and address of agent for service)
Registrant's telephone number, including area code: 212-296-0289
Date of fiscal year end: December 31,
Date of reporting period: December 31, 2022
Item 1 - Report to Shareholders
MORGAN STANLEY
VARIABLE INVESTMENT SERIES
Annual Report
DECEMBER 31, 2022
The Fund is intended to be a funding vehicle for variable annuity contracts and variable life insurance policies offered by the separate accounts of certain life insurance companies.
Morgan Stanley Variable Investment Series
Table of Contents (unaudited)
Letter to the Shareholders | 1 | ||||||
Expense Example | 6 | ||||||
Portfolio of Investments | 8 | ||||||
| Statement of Assets and Liabilities | 19 | ||||||
| Statement of Operations | 20 | ||||||
| Statements of Changes in Net Assets | 21 | ||||||
| Notes to Financial Statements | 23 | ||||||
| Financial Highlights | 40 | ||||||
| Report of Independent Registered Public Accounting Firm | 42 | ||||||
| Liquidity Risk Management Program | 44 | ||||||
| Trustee and Officer Information | 45 | ||||||
| Federal Tax Notice | 52 | ||||||
Morgan Stanley Variable Investment Series - Income Plus Portfolio
Letter to the Shareholders ◼ December 31, 2022 (unaudited)
Dear Shareholder:
In 2022 global credit markets experienced one of their worst performances on record. The Bloomberg U.S. Corporate Index (the "Index") closed the year 38 basis points (bps) wider to 130 bps.i Government bond yields rose globally, with 10- and 30-year U.S. Treasury yields rising 236 bps and 206 bps, respectively. Volatility also spiked, with the VIX up 26% to finish at 22.ii U.S. investment grade corporate bonds outperformed European investment grade bonds, which widened 72 bps. This weak performance was attributable to increasing recession fears while inflation remains historically high. The period also saw the omicron COVID-19 variant prolong supply chain issues, while Russia's invasion of Ukraine exacerbated commodity price rises. Central banks were slow to raise interest rates on what they considered to be "transitory" inflation, and to compensate they eventually began increasing rates aggressively. Clarity remains lacking as to where economies and markets will eventually end up, which led to a generally risk-off sentiment, significantly higher yields and wider credit spreads in the period.
The first quarter of 2022 was one of the worst quarters since the 1980s for global fixed income markets, as central bankers, seemingly en masse, relinquished the idea of "transitory" inflation. Russia's invasion of Ukraine caused risky assets to sell off while also exacerbating inflation concerns due to economic sanctions imposed by Western nations and increasing commodity prices.
In the second quarter conditions worsened, as global credit markets experienced their worst first half performance on record. COVID-19 reemerged as a major headwind, with outbreaks in China sustaining supply chain disruptions. The tectonic plates of inflation and recession collided. The U.S. market saw this as a potential solution to historically high inflation, leading to a pullback in yields and reduced rate hike expectations. This view was shared to a lesser degree in the European markets.
The third quarter began strong as bond and credit markets reversed course dramatically in July, generating exceptionally strong performance while also being the first positive return month of the year. However, August and September saw July's rally in developed market rates reverse while volatility reached historic levels, as optimism for a soft landing in the economy had been seriously compromised.
The fourth quarter saw a reversal of the trend seen in the third quarter. After sharp increases in rates during August and September, global developed market rates were mixed in October. Numerous countries
i Source: Bloomberg L.P. Data as of December 31, 2022. One basis point = 0.01%. "Bloomberg®" and the Bloomberg Index/Indices used are service marks of Bloomberg Finance L.P. and its affiliates, and have been licensed for use for certain purposes by Morgan Stanley Investment Management (MSIM). Bloomberg is not affiliated with MSIM, does not approve, endorse, review, or recommend any product, and does not guarantee the timeliness, accurateness, or completeness of any data or information relating to any product.
ii Source: Bloomberg L.P. Data as of December 31, 2022. The Chicago Board Options Exchange Volatility Index, known as VIX, is a measure of stock price volatility.
Morgan Stanley Variable Investment Series - Income Plus Portfolio
Letter to the Shareholders ◼ December 31, 2022 (unaudited) continued
saw rates decrease as central banks like the Reserve Bank of Australia and Bank of Canada appeared to shift to a more dovish approach. Further, the rise in yields following the U.K. pension fund maelstrom reversed as the issues abated, with yields falling significantly over October. On the other hand, in the U.S., yields continued to rise following still high inflation data.
In November, developed market rates continued where they left off at the end of October, with yields falling and curves bull flattening during November. While the Federal Reserve (Fed) hiked by a fourth consecutive 75 bps hike at its November meeting, the view that central banks are starting to slow the pace of hikes remained a key theme, given they have now already tightened policy significantly, there is some evidence of inflation slowing (downside surprises reported in the U.S. and eurozone), and the growth data is uncertain.
Yields ended the year higher following a broad sell-off during December, as economic data remained relatively strong, central bankers demonstrated that they were still committed to hiking as much as necessary, and Japan modified its yield curve control policy. During the month, the Fed slowed its pace of hiking as expected, raising the policy rate by 50 bps. Similarly, the Bank of Canada, Swiss National Bank, Bank of England and European Central Bank all also opted for 50 basis point hikes. Notably, the Bank of Japan surprised markets by adjusting its yield curve control policy, widening the allowable deviation from the 0% target for the 10-year yield to 50 bps, from 25 bps previously. As a result, Japanese government bonds, unrestricted by the limit, immediately sold off to a level more consistent with fundamental pricing, while the Japanese yen strengthened.
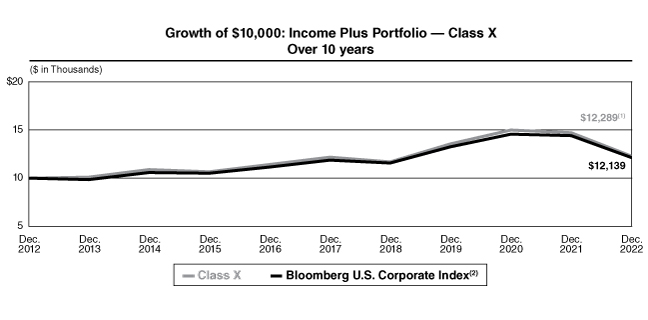
For the 12-month period ended December 31, 2022, Variable Investment Series — Income Plus Portfolio (the "Fund") Class X shares produced a total return of -16.47% (net of fees), underperforming the Index, which returned -15.76%. For the same period, the Fund's Class Y shares returned -16.66% (net of fees). Past performance is no guarantee of future results.
The performance of the Fund's two share classes varies because each has different expenses. The Fund's total returns assume the reinvestment of all distributions but do not reflect the deduction of any charges by your insurance company. Such costs would lower performance.
2
Morgan Stanley Variable Investment Series - Income Plus Portfolio
Letter to the Shareholders ◼ December 31, 2022 (unaudited) continued
The portfolio's underweight duration position contributed positively to relative performance. Overall, positioning to investment grade and high yield credit both had a negative impact on performance as spreads widened in 2022. The portfolio is positioned to be overweight financials and underweight industrials. Off-benchmark allocations to convertible bonds also had a negative impact on performance during the period.
In terms of positioning, we have not actively changed the portfolio's key risk positions. In terms of strategic positioning, we continue to favor the financials (financial other and insurance), basic industry and energy sectors. The portfolio's largest overweight remains financials. We maintain a small overweight to BBB-rated non-financials. We remain underweight to non-financial bonds rated A or better. The portfolio continues to hold small allocations to off-benchmark sectors such as convertible bonds, emerging market corporate bonds and high yield corporate bonds. We also continue to maintain a long risk position.
While the Fed has officially stepped down its pace of hikes, the future path of rates is more important. How high and for how long central bankers will have to go will largely depend on growth and inflation conditions. In our view, the rates market is priced close to fair; however, central bankers have been quite clear in their determination to keep rates high, and while inflation will continue to come down from the earlier peak, inflation and labor market data prints are still indicating that the economy is overheated. If that continues, inflation may remain higher than central bankers find comfortable. As a result, the risk for rates still seems to be for them to go marginally higher.
Looking forward, our base case view is that we are compensated to own credit as we view corporate fundamentals to be resilient and the macro backdrop likely to improve as monetary policy pivots and China reopens. Looking to corporate fundamentals, we view companies as having built liquidity in recent quarters and implemented cost efficiencies under the COVID era. We expect profit margins to be pressured and top-line revenue to be challenging (as evidenced by third quarter 2022 corporate earnings reports), but given the starting point we believe corporates will likely be able to manage a slowdown without significant downgrades or defaults (in our base case scenario of low default rates and mild recession). We do, however, see some potential economic headwinds in the first half of 2023, and therefore look to be tactical in positioning while retaining a small long position in high quality financials.
There is no guarantee that any sectors mentioned will continue to perform as discussed above or that securities in such sectors will be held by the Fund in the future.
3
Morgan Stanley Variable Investment Series - Income Plus Portfolio
Letter to the Shareholders ◼ December 31, 2022 (unaudited) continued
Performance Summary
Performance data quoted represents past performance, which is no guarantee of future results and current performance may be lower or higher than the figures shown. For most recent month-end performance figures, please contact the issuing insurance company or speak with your Financial Advisor. Investment return and principal value will fluctuate. When you sell Fund shares, they may be worth less than their original cost. Total returns do not reflect the deduction of taxes that a shareholder would pay on Fund distributions or the redemption of Fund shares. Performance for Class Y shares will vary from the performance of Class X shares due to differences in expenses. Performance assumes reinvestment of all distributions for the underlying portfolio based on net asset value (NAV). It does not reflect the deduction of insurance expenses, an annual contract maintenance fee, or surrender charges. If performance information included the effect of these additional charges, the total returns would be lower. Fund's total returns are calculated based on the net asset value as of the last business day of the period.
Average Annual Total Returns as of December 31, 2022 (unaudited)
1 Year | 5 Years | 10 Years | Since Inception* | ||||||||||||||||
Class X | -16.47 | % | 0.19 | % | 2.08 | % | 5.97 | % | |||||||||||
Class Y | -16.66 | % | -0.06 | % | 1.83 | % | 4.69 | % | |||||||||||
(1) Ending value on December 31, 2022 for the underlying portfolio. This figure does not reflect the deduction of any account fees or sales charges.
(2) The Bloomberg U.S. Corporate Index is a broad-based benchmark that measures the investment grade, U.S. dollar-denominated, fixed rate, taxable corporate bond market. It includes USD-denominated securities publicly issued by U.S. and non-U.S. industrial, utility and financial issuers that meet specified maturity, liquidity and quality requirements. The Index is unmanaged and its returns do not include any sales charges or fees. Such costs would lower performance. It is not possible to invest directly in an index.
* Inception dates of March 1, 1987 for Class X and June 5, 2000 for Class Y.
4
Morgan Stanley Variable Investment Series - Income Plus Portfolio
Letter to the Shareholders ◼ December 31, 2022 (unaudited) continued
For More Information About Portfolio Holdings
Each Morgan Stanley fund provides a complete schedule of portfolio holdings in its Semi-Annual and Annual Reports within 60 days of the end of the fund's second and fourth fiscal quarters. The Semi-Annual Reports and the Annual Reports are filed electronically with the Securities and Exchange Commission ("SEC") on Form N-CSRS and Form N-CSR, respectively. Morgan Stanley also delivers the Semi-Annual and Annual Reports to fund shareholders and makes these reports available on its public web site, www.morganstanley.com/im/shareholderreports. Each Morgan Stanley non-money market fund also files a complete schedule of portfolio holdings with the SEC for the fund's first and third fiscal quarters as an attachment to Form N-PORT. Morgan Stanley does not deliver the reports for the first and third fiscal quarters to shareholders, but makes the complete schedule of portfolio holdings for the fund's first and third fiscal quarters available on its public website. The holdings for each money market fund are also posted to the Morgan Stanley public website. You may obtain the Form N-PORT filings (as well as the Form N-CSR and N-CSRS filings) by accessing the SEC's web site, http://www.sec.gov. You can also request copies of these materials, upon payment of a duplicating fee, by electronic request at the SEC's e-mail address (publicinfo@sec.gov).
Proxy Voting Policy and Procedures and Proxy Voting Record
You may obtain a copy of the Fund's Proxy Voting Policy and Procedures without charge, upon request, by calling toll free 1 (800) 869-6397 or by visiting our web site at www.morganstanley.com/im/shareholderreports. It is also available on the SEC's web site at http://www.sec.gov.
You may obtain information regarding how the Fund voted proxies relating to portfolio securities during the most recent twelve-month period ended June 30 without charge by visiting our web site at www.morganstanley.com/im/shareholderreports. This information is also available on the SEC's web site at http://www.sec.gov.
5
Morgan Stanley Variable Investment Series - Income Plus Portfolio
Expense Example ◼ December 31, 2022 (unaudited)
As a shareholder of the Fund, you incur two types of costs: (1) insurance company charges; and (2) ongoing costs, which may include advisory fees, administration fees, distribution and services (12b-1) fees and other Fund expenses. These examples are intended to help you understand your ongoing costs (in dollars) of investing in the Fund and to compare these costs with the ongoing costs of investing in other mutual funds.
These examples are based on an investment of $1,000 invested at the beginning of the period and held for the entire period 07/01/22 – 12/31/22.
Actual Expenses
The first line of the tables on the following page provides information about actual account values and actual expenses. You may use the information in this line, together with the amount you invested, to estimate the expenses that you paid over the period. Simply divide your account value by $1,000 (for example, an $8,600 account value divided by $1,000 = 8.6), then multiply the result by the number in the first line under the heading entitled "Expenses Paid During Period" to estimate the expenses you paid on your account during this period.
Hypothetical Example for Comparison Purposes
The second line of the tables on the following page provides information about hypothetical expenses based on the Fund's actual expense ratio and an assumed rate of return of 5% per year before expenses, which is not the Fund's actual return. The hypothetical account values and expenses may not be used to estimate the actual ending account balance or expenses you paid for the period. You may use this information to compare the ongoing cost of investing in the Fund and other funds. To do so, compare this 5% hypothetical example with the 5% hypothetical examples that appear in the shareholder reports of the other funds.
Please note that the expenses shown in the tables are meant to highlight your ongoing costs only and do not reflect any insurance company charges. Therefore, the second line of the tables is useful in comparing ongoing costs, and will not help you determine the relative total cost of owning different funds. In addition, if these insurance company charges were included, your costs would have been higher.
6
Morgan Stanley Variable Investment Series - Income Plus Portfolio
Expense Example ◼ December 31, 2022 (unaudited) continued
| Beginning Account Value | Ending Account Value | Expenses Paid During Period(1) | |||||||||||||
07/01/22 | 12/31/22 | 07/01/22 – 12/31/22 | |||||||||||||
Class X | |||||||||||||||
| Actual (-1.80% return) | $ | 1,000.00 | $ | 982.00 | $ | 3.75 | |||||||||
| Hypothetical (5% annual return before expenses) | $ | 1,000.00 | $ | 1,021.42 | $ | 3.82 | |||||||||
Class Y | |||||||||||||||
| Actual (-1.80% return) | $ | 1,000.00 | $ | 982.00 | $ | 5.00 | |||||||||
| Hypothetical (5% annual return before expenses) | $ | 1,000.00 | $ | 1,020.16 | $ | 5.09 | |||||||||
(1) Expenses are equal to the Fund's annualized expense ratios of 0.75% and 1.00% for Class X and Class Y shares, respectively, multiplied by the average account value over the period and multiplied by 184/365 (to reflect the one-half year period). If the Fund had borne all of its expenses, the annualized expense ratios would have been 1.08% and 1.33% for Class X and Class Y shares, respectively.
7
Morgan Stanley Variable Investment Series - Income Plus Portfolio
Portfolio of Investments ◼ December 31, 2022
| PRINCIPAL AMOUNT (000) | COUPON RATE | MATURITY DATE | VALUE | ||||||||||||||||
Commercial Mortgage-Backed Securities (2.3%) | |||||||||||||||||||
$ | 400 | Credit Suisse Mortgage Trust, Class A, 1 Month Term SOFR + 3.14% (a) | 7.479 | (b)% | 09/09/24 | $ | 396,592 | ||||||||||||
500 | J.P. Morgan Chase Commercial Mortgage Securities Trust, 1 Month Term SOFR + 2.18% (a) | 6.515 | (b) | 08/15/39 | 500,627 | ||||||||||||||
GBP | 206 | Taurus 2018-2 UK DAC, 3 Month GBP SONIA + 1.22% (United Kingdom) | 4.497 | (b) | 05/22/28 | 246,334 | |||||||||||||
| Total Commercial Mortgage-Backed Securities (Cost $1,133,493) | 1,143,553 | ||||||||||||||||||
Corporate Bonds (93.8%) | |||||||||||||||||||
Basic Materials (3.3%) | |||||||||||||||||||
$ | 200 | Braskem Netherlands Finance BV (Brazil) (a) | 4.50 | 01/31/30 | 170,543 | ||||||||||||||
375 | Celanese U.S. Holdings LLC | 6.165 | 07/15/27 | 370,474 | |||||||||||||||
150 | DuPont de Nemours, Inc. | 5.319 | 11/15/38 | 144,793 | |||||||||||||||
225 | Glencore Funding LLC (Australia) (a) | 2.50 | 09/01/30 | 183,145 | |||||||||||||||
200 | Minsur SA (Peru) (a) | 4.50 | 10/28/31 | 174,039 | |||||||||||||||
500 | Newcastle Coal Infrastructure Group Pty Ltd. (Australia) (a) | 4.40 | 09/29/27 | 431,377 | |||||||||||||||
200 | NOVA Chemicals Corp. (Canada) (a) | 4.875 | 06/01/24 | 193,958 | |||||||||||||||
1,668,329 | |||||||||||||||||||
Communications (9.9%) | |||||||||||||||||||
75 | Airbnb, Inc. (c) | 0.00 | 03/15/26 | 61,912 | |||||||||||||||
250 | Amazon.com, Inc. | 2.50 | 06/03/50 | 158,696 | |||||||||||||||
75 | Amazon.com, Inc. | 2.70 | 06/03/60 | 45,536 | |||||||||||||||
175 | Amazon.com, Inc. | 4.70 | 12/01/32 | 173,787 | |||||||||||||||
300 | AT&T, Inc. | 2.55 | 12/01/33 | 231,432 | |||||||||||||||
713 | AT&T, Inc. | 3.55 | 09/15/55 | 478,951 | |||||||||||||||
200 | Baidu, Inc. (China) | 1.72 | 04/09/26 | 178,150 | |||||||||||||||
200 | Charter Communications Operating LLC/Charter Communications Operating Capital | 2.80 | 04/01/31 | 156,161 | |||||||||||||||
375 | Charter Communications Operating LLC/Charter Communications Operating Capital | 3.50 | 03/01/42 | 241,513 | |||||||||||||||
25 | Charter Communications Operating LLC/Charter Communications Operating Capital | 5.125 | 07/01/49 | 19,004 | |||||||||||||||
175 | Comcast Corp. | 3.75 | 04/01/40 | 145,053 | |||||||||||||||
275 | Comcast Corp. | 4.00 | 03/01/48 | 221,844 | |||||||||||||||
375 | Level 3 Financing, Inc. (a) | 3.40 | 03/01/27 | 317,526 | |||||||||||||||
200 | NBN Co. Ltd. (Australia) (a) | 2.50 | 01/08/32 | 155,538 | |||||||||||||||
350 | NBN Co. Ltd. (Australia) (a) | 2.625 | 05/05/31 | 278,008 | |||||||||||||||
200 | Ooredoo International Finance Ltd. (Qatar) (a) | 2.625 | 04/08/31 | 172,346 | |||||||||||||||
200 | Prosus NV (China) (a) | 3.68 | 01/21/30 | 166,705 | |||||||||||||||
See Notes to Financial Statements
8
Morgan Stanley Variable Investment Series - Income Plus Portfolio
Portfolio of Investments ◼ December 31, 2022 continued
| PRINCIPAL AMOUNT (000) | COUPON RATE | MATURITY DATE | VALUE | ||||||||||||||||
$ | 175 | Rogers Communications, Inc. (Canada) (a) | 4.55 | % | 03/15/52 | $ | 136,486 | ||||||||||||
80 | Spotify USA, Inc. (c) | 0.00 | 03/15/26 | 64,800 | |||||||||||||||
113 | Sprint Spectrum Co. LLC/Sprint Spectrum Co. II LLC/Sprint Spectrum Co. III LLC (a) | 4.738 | 03/20/25 | 111,227 | |||||||||||||||
250 | T-Mobile USA, Inc. | 2.25 | 11/15/31 | 197,288 | |||||||||||||||
150 | T-Mobile USA, Inc. | 3.30 | 02/15/51 | 100,760 | |||||||||||||||
375 | Tencent Holdings Ltd. (China) (a) | 3.595 | 01/19/28 | 344,351 | |||||||||||||||
60 | Uber Technologies, Inc. (c) | 0.00 | 12/15/25 | 50,835 | |||||||||||||||
150 | Verizon Communications, Inc. | 1.75 | 01/20/31 | 116,729 | |||||||||||||||
100 | Verizon Communications, Inc. | 2.65 | 11/20/40 | 67,867 | |||||||||||||||
255 | Verizon Communications, Inc. | 2.987 | 10/30/56 | 156,705 | |||||||||||||||
50 | Verizon Communications, Inc. | 3.40 | 03/22/41 | 37,793 | |||||||||||||||
100 | Vodafone Group PLC (United Kingdom) | 4.375 | 02/19/43 | 80,469 | |||||||||||||||
204 | Walt Disney Co. | 2.75 | 09/01/49 | 135,864 | |||||||||||||||
100 | Walt Disney Co. | 3.50 | 05/13/40 | 80,914 | |||||||||||||||
75 | Wayfair, Inc. | 0.625 | 10/01/25 | 49,237 | |||||||||||||||
4,933,487 | |||||||||||||||||||
Consumer, Cyclical (7.8%) | |||||||||||||||||||
422 | Alaska Airlines 2020-1 Class A Pass Through Trust (a) | 4.80 | 02/15/29 | 402,028 | |||||||||||||||
80 | American Airlines, Inc./AAdvantage Loyalty IP Ltd. (a) | 5.75 | 04/20/29 | 73,261 | |||||||||||||||
125 | Brunswick Corp. | 5.10 | 04/01/52 | 90,301 | |||||||||||||||
150 | Daimler Trucks Finance North America LLC (Germany) (a) | 2.00 | 12/14/26 | 132,368 | |||||||||||||||
175 | Dick's Sporting Goods, Inc. | 4.10 | 01/15/52 | 113,469 | |||||||||||||||
200 | Ferguson Finance PLC (a) | 4.65 | 04/20/32 | 182,571 | |||||||||||||||
300 | General Motors Co. | 6.60 | 04/01/36 | 294,887 | |||||||||||||||
25 | General Motors Co. | 6.75 | 04/01/46 | 24,082 | |||||||||||||||
125 | Home Depot, Inc. | 2.375 | 03/15/51 | 75,122 | |||||||||||||||
475 | Hyundai Capital America (a) | 3.00 | 02/10/27 | 426,964 | |||||||||||||||
260 | JetBlue Pass Through Trust, Series AA | 2.75 | 11/15/33 | 213,813 | |||||||||||||||
125 | Lowe's Cos., Inc. | 3.00 | 10/15/50 | 80,053 | |||||||||||||||
125 | Lowe's Cos., Inc. | 5.80 | 09/15/62 | 120,399 | |||||||||||||||
55 | Macy's Retail Holdings LLC (a) | 5.875 | 03/15/30 | 47,806 | |||||||||||||||
100 | Magallanes, Inc. (a) | 5.05 | 03/15/42 | 76,863 | |||||||||||||||
275 | Magallanes, Inc. | 5.141 | 03/15/52 | 200,978 | |||||||||||||||
450 | Marriott International, Inc., Series HH | 2.85 | 04/15/31 | 365,486 | |||||||||||||||
150 | McDonald's Corp. | 4.45 | 09/01/48 | 131,237 | |||||||||||||||
275 | Nissan Motor Co. Ltd. (Japan) (a) | 3.522 | 09/17/25 | 255,716 | |||||||||||||||
155 | Peloton Interactive, Inc. (c) | 0.00 | 02/15/26 | 110,642 | |||||||||||||||
200 | Resorts World Las Vegas LLC/RWLV Capital, Inc. (a) | 4.625 | 04/16/29 | 142,146 | |||||||||||||||
See Notes to Financial Statements
9
Morgan Stanley Variable Investment Series - Income Plus Portfolio
Portfolio of Investments ◼ December 31, 2022 continued
| PRINCIPAL AMOUNT (000) | COUPON RATE | MATURITY DATE | VALUE | ||||||||||||||||
$ | 125 | Starbucks Corp. | 2.25 | % | 03/12/30 | $ | 104,122 | ||||||||||||
75 | Starbucks Corp. | 2.55 | 11/15/30 | 63,241 | |||||||||||||||
200 | Warnermedia Holdings, Inc. (a) | 4.279 | 03/15/32 | 165,254 | |||||||||||||||
3,892,809 | |||||||||||||||||||
Consumer, Non-Cyclical (8.1%) | |||||||||||||||||||
125 | AbbVie, Inc. | 4.05 | 11/21/39 | 107,516 | |||||||||||||||
150 | AbbVie, Inc. | 4.25 | 11/21/49 | 125,254 | |||||||||||||||
200 | Altria Group, Inc. | 3.40 | 02/04/41 | 133,319 | |||||||||||||||
25 | Anheuser-Busch InBev Worldwide, Inc. (Belgium) | 4.35 | 06/01/40 | 22,076 | |||||||||||||||
50 | Anheuser-Busch InBev Worldwide, Inc. (Belgium) | 4.375 | 04/15/38 | 44,897 | |||||||||||||||
236 | Anheuser-Busch InBev Worldwide, Inc. (Belgium) | 4.60 | 04/15/48 | 206,279 | |||||||||||||||
350 | BAT Capital Corp. (United Kingdom) | 2.259 | 03/25/28 | 291,053 | |||||||||||||||
150 | BAT Capital Corp. (United Kingdom) | 3.734 | 09/25/40 | 102,346 | |||||||||||||||
235 | Cedars-Sinai Health System, Series 2021 | 2.288 | 08/15/31 | 189,064 | |||||||||||||||
275 | CVS Health Corp. | 1.75 | 08/21/30 | 217,353 | |||||||||||||||
225 | CVS Health Corp. | 5.05 | 03/25/48 | 203,093 | |||||||||||||||
375 | Eli Lilly & Co. | 2.25 | 05/15/50 | 236,701 | |||||||||||||||
175 | Global Payments, Inc. | 5.40 | 08/15/32 | 167,173 | |||||||||||||||
EUR | 100 | Grifols SA (Spain) (a) | 2.25 | 11/15/27 | 93,754 | ||||||||||||||
$ | 100 | HCA, Inc. (a) | 4.625 | 03/15/52 | 78,291 | ||||||||||||||
200 | HCA, Inc. | 5.25 | 06/15/49 | 171,282 | |||||||||||||||
500 | Imperial Brands Finance PLC (United Kingdom) (a) | 3.125 | 07/26/24 | 478,290 | |||||||||||||||
225 | JBS USA LUX SA/JBS USA Food Co./JBS USA Finance, Inc. (a) | 2.50 | 01/15/27 | 197,125 | |||||||||||||||
150 | JDE Peet's NV (Netherlands) (a) | 1.375 | 01/15/27 | 126,811 | |||||||||||||||
225 | Kimberly-Clark de Mexico SAB de CV (Mexico) (a) | 2.431 | 07/01/31 | 180,267 | |||||||||||||||
125 | Philip Morris International, Inc. | 5.75 | 11/17/32 | 127,820 | |||||||||||||||
EUR | 100 | Q-Park Holding I BV (Netherlands) (a) | 1.50 | 03/01/25 | 98,519 | ||||||||||||||
$ | 225 | Smithfield Foods, Inc. (a) | 3.00 | 10/15/30 | 171,788 | ||||||||||||||
325 | Transurban Finance Co. Pty Ltd. (Australia) (a) | 2.45 | 03/16/31 | 256,403 | |||||||||||||||
4,026,474 | |||||||||||||||||||
Energy (7.5%) | |||||||||||||||||||
175 | BP Capital Markets PLC (United Kingdom) | 4.375 | 06/22/25(d) | 167,563 | |||||||||||||||
175 | BP Capital Markets PLC (United Kingdom) | 4.875 | 03/22/30(d) | 153,672 | |||||||||||||||
125 | Continental Resources, Inc. (a) | 2.268 | 11/15/26 | 108,470 | |||||||||||||||
275 | Continental Resources, Inc. (a) | 2.875 | 04/01/32 | 204,087 | |||||||||||||||
350 | Coterra Energy, Inc. | 3.90 | 05/15/27 | 327,339 | |||||||||||||||
275 | Diamondback Energy, Inc. | 3.125 | 03/24/31 | 228,384 | |||||||||||||||
125 | Enbridge, Inc. (Canada) | 2.50 | 08/01/33 | 96,499 | |||||||||||||||
50 | Energy Transfer LP | 5.00 | 05/15/50 | 40,170 | |||||||||||||||
50 | Energy Transfer LP | 6.25 | 04/15/49 | 46,734 | |||||||||||||||
See Notes to Financial Statements
10
Morgan Stanley Variable Investment Series - Income Plus Portfolio
Portfolio of Investments ◼ December 31, 2022 continued
| PRINCIPAL AMOUNT (000) | COUPON RATE | MATURITY DATE | VALUE | ||||||||||||||||
$ | 125 | Enterprise Products Operating LLC | 3.30 | % | 02/15/53 | $ | 83,712 | ||||||||||||
125 | Enterprise Products Operating LLC | 3.95 | 01/31/60 | 90,835 | |||||||||||||||
200 | EQT Corp. | 5.70 | 04/01/28 | 199,194 | |||||||||||||||
175 | Exxon Mobil Corp. | 3.452 | 04/15/51 | 132,640 | |||||||||||||||
175 | HF Sinclair Corp. | 5.875 | 04/01/26 | 175,360 | |||||||||||||||
75 | Kinder Morgan, Inc. | 5.45 | 08/01/52 | 67,708 | |||||||||||||||
225 | Midwest Connector Capital Co. LLC (a) | 4.625 | 04/01/29 | 203,737 | |||||||||||||||
100 | MPLX LP | 5.20 | 12/01/47 | 85,525 | |||||||||||||||
275 | ONEOK, Inc. | 3.10 | 03/15/30 | 231,054 | |||||||||||||||
75 | ONEOK, Inc. | 3.40 | 09/01/29 | 64,977 | |||||||||||||||
200 | Rockies Express Pipeline LLC (a) | 3.60 | 05/15/25 | 189,174 | |||||||||||||||
325 | Sabine Pass Liquefaction LLC | 4.50 | 05/15/30 | 302,020 | |||||||||||||||
75 | Shell International Finance BV (Netherlands) | 3.125 | 11/07/49 | 53,063 | |||||||||||||||
200 | Transportadora de Gas Internacional SA ESP (Colombia) (a) | 5.55 | 11/01/28 | 183,855 | |||||||||||||||
200 | Var Energi ASA (Norway) (a) | 7.50 | 01/15/28 | 204,113 | |||||||||||||||
125 | Williams Cos., Inc. | 5.30 | 08/15/52 | 112,426 | |||||||||||||||
3,752,311 | |||||||||||||||||||
Finance (38.1%) | |||||||||||||||||||
300 | AerCap Ireland Capital DAC/AerCap Global Aviation Trust (Ireland) | 1.65 | 10/29/24 | 276,922 | |||||||||||||||
250 | AerCap Ireland Capital DAC/AerCap Global Aviation Trust (Ireland) | 3.00 | 10/29/28 | 209,896 | |||||||||||||||
50 | Air Lease Corp. | 2.10 | 09/01/28 | 40,815 | |||||||||||||||
225 | Air Lease Corp. | 4.625 | 10/01/28 | 210,886 | |||||||||||||||
150 | American National Group, Inc. (a) | 6.144 | 06/13/32 | 142,308 | |||||||||||||||
225 | Aon Corp./Aon Global Holdings PLC | 2.60 | 12/02/31 | 184,290 | |||||||||||||||
200 | Australia & New Zealand Banking Group Ltd. (Australia) (a) | 2.57 | 11/25/35 | 147,163 | |||||||||||||||
325 | Avolon Holdings Funding Ltd. (Ireland) (a) | 2.875 | 02/15/25 | 300,478 | |||||||||||||||
200 | Banco de Credito e Inversiones SA (Chile) (a) | 2.875 | 10/14/31 | 166,661 | |||||||||||||||
400 | Banco Santander SA (Spain) | 1.722 | 09/14/27 | 342,163 | |||||||||||||||
200 | Banco Santander SA (Spain) | 4.175 | 03/24/28 | 185,796 | |||||||||||||||
300 | Bank Hapoalim BM (Israel) (a) | 3.255 | 01/21/32 | 259,422 | |||||||||||||||
875 | Bank of America Corp. | 2.687 | 04/22/32 | 702,437 | |||||||||||||||
275 | Bank of America Corp. | 3.846 | 03/08/37 | 228,423 | |||||||||||||||
400 | Bank of America Corp. | 5.015 | 07/22/33 | 380,938 | |||||||||||||||
550 | Bank of Ireland Group PLC (Ireland) (a) | 2.029 | 09/30/27 | 465,116 | |||||||||||||||
175 | Belrose Funding Trust (a) | 2.33 | 08/15/30 | 132,903 | |||||||||||||||
75 | Boston Properties LP | 6.75 | 12/01/27 | 77,465 | |||||||||||||||
250 | BPCE SA (France) (a) | 3.116 | 10/19/32 | 182,971 | |||||||||||||||
250 | BPCE SA (France) (a) | 3.648 | 01/14/37 | 187,439 | |||||||||||||||
See Notes to Financial Statements
11
Morgan Stanley Variable Investment Series - Income Plus Portfolio
Portfolio of Investments ◼ December 31, 2022 continued
| PRINCIPAL AMOUNT (000) | COUPON RATE | MATURITY DATE | VALUE | ||||||||||||||||
$ | 400 | BPCE SA (France) (a) | 5.15 | % | 07/21/24 | $ | 391,803 | ||||||||||||
275 | Capital One Financial Corp. | 3.273 | 03/01/30 | 235,648 | |||||||||||||||
100 | Carlyle Finance Subsidiary LLC (a) | 3.50 | 09/19/29 | 84,789 | |||||||||||||||
250 | Charles Schwab Corp., Series G | 5.375 | 06/01/25(d) | 245,750 | |||||||||||||||
400 | CI Financial Corp. (Canada) | 4.10 | 06/15/51 | 237,031 | |||||||||||||||
625 | Citigroup, Inc. | 2.52 | 11/03/32 | 487,590 | |||||||||||||||
825 | Citigroup, Inc. | 3.057 | 01/25/33 | 667,906 | |||||||||||||||
150 | CNO Global Funding (a) | 1.75 | 10/07/26 | 131,713 | |||||||||||||||
70 | Coinbase Global, Inc. (a) | 3.375 | 10/01/28 | 37,093 | |||||||||||||||
200 | Commerzbank AG (Germany) (a) | 8.125 | 09/19/23 | 201,615 | |||||||||||||||
325 | Corporate Office Properties LP | 2.75 | 04/15/31 | 243,949 | |||||||||||||||
475 | Credit Suisse Group AG (Switzerland) (a) | 9.016 | 11/15/33 | 487,659 | |||||||||||||||
150 | Deutsche Bank AG (Germany) | 2.222 | 09/18/24 | 144,915 | |||||||||||||||
275 | EDP Finance BV (Portugal) (a) | 6.30 | 10/11/27 | 283,342 | |||||||||||||||
200 | Extra Space Storage LP Co. | 3.90 | 04/01/29 | 179,559 | |||||||||||||||
275 | Federation des Caisses Desjardins du Quebec (Canada) (a) | 4.55 | 08/23/27 | 264,630 | |||||||||||||||
300 | First-Citizens Bank & Trust Co. | 2.969 | 09/27/25 | 283,820 | |||||||||||||||
675 | Global Atlantic Fin Co. (a) | 4.40 | 10/15/29 | 566,366 | |||||||||||||||
650 | Goldman Sachs Group, Inc. | 2.615 | 04/22/32 | 519,929 | |||||||||||||||
175 | Goldman Sachs Group, Inc. | 2.64 | 02/24/28 | 156,067 | |||||||||||||||
200 | Grupo Aval Ltd. (Colombia) (a) | 4.375 | 02/04/30 | 162,366 | |||||||||||||||
375 | High Street Funding Trust I (a) | 4.111 | 02/15/28 | 350,021 | |||||||||||||||
350 | HSBC Holdings PLC (United Kingdom) | 1.589 | 05/24/27 | 302,178 | |||||||||||||||
275 | HSBC Holdings PLC (United Kingdom) | 4.755 | 06/09/28 | 260,357 | |||||||||||||||
225 | Intact Financial Corp. (Canada) (a) | 5.459 | 09/22/32 | 222,683 | |||||||||||||||
325 | Intercontinental Exchange, Inc. | 4.60 | 03/15/33 | 312,042 | |||||||||||||||
250 | Intesa Sanpaolo SpA (Italy) (a) | 7.00 | 11/21/25 | 255,243 | |||||||||||||||
175 | Jefferies Group LLC/Jefferies Group Capital Finance, Inc. | 2.625 | 10/15/31 | 133,916 | |||||||||||||||
625 | JPMorgan Chase & Co. | 1.953 | 02/04/32 | 479,520 | |||||||||||||||
325 | JPMorgan Chase & Co. | 3.54 | 05/01/28 | 299,561 | |||||||||||||||
50 | JPMorgan Chase & Co. | 3.964 | 11/15/48 | 39,235 | |||||||||||||||
200 | JPMorgan Chase & Co. | 4.565 | 06/14/30 | 188,603 | |||||||||||||||
75 | KKR Group Finance Co. XII LLC (a) | 4.85 | 05/17/32 | 70,238 | |||||||||||||||
400 | LeasePlan Corp. NV (Netherlands) (a) | 2.875 | 10/24/24 | 375,602 | |||||||||||||||
275 | Life Storage LP | 2.40 | 10/15/31 | 212,230 | |||||||||||||||
225 | Macquarie Group Ltd. (Australia) (a) | 2.871 | 01/14/33 | 173,165 | |||||||||||||||
300 | Marsh & McLennan Cos., Inc. | 5.875 | 08/01/33 | 317,206 | |||||||||||||||
200 | MDGH GMTN (RSC) Ltd. (United Arab Emirates) (a) | 4.50 | 11/07/28 | 198,639 | |||||||||||||||
150 | Metropolitan Life Global Funding I (a) | 2.95 | 04/09/30 | 130,466 | |||||||||||||||
325 | National Australia Bank Ltd. (Australia) (a) | 2.332 | 08/21/30 | 248,110 | |||||||||||||||
See Notes to Financial Statements
12
Morgan Stanley Variable Investment Series - Income Plus Portfolio
Portfolio of Investments ◼ December 31, 2022 continued
| PRINCIPAL AMOUNT (000) | COUPON RATE | MATURITY DATE | VALUE | ||||||||||||||||
$ | 200 | Nordea Bank Abp (Finland) (a) | 5.375 | % | 09/22/27 | $ | 201,269 | ||||||||||||
225 | Northern Trust Corp. | 6.125 | 11/02/32 | 237,970 | |||||||||||||||
200 | Oversea-Chinese Banking Corp. Ltd. (Singapore) (a) | 1.832 | 09/10/30 | 179,657 | |||||||||||||||
300 | Radian Group, Inc. | 4.875 | 03/15/27 | 275,389 | |||||||||||||||
125 | Rocket Mortgage LLC/Rocket Mortgage Co-Issuer, Inc. (a) | 3.875 | 03/01/31 | 95,706 | |||||||||||||||
350 | Sabra Health Care LP | 3.20 | 12/01/31 | 261,223 | |||||||||||||||
250 | Santander U.K. Group Holdings PLC (United Kingdom) | 6.833 | 11/21/26 | 253,504 | |||||||||||||||
225 | Shinhan Bank Co., Ltd. (Korea, Republic of) (a) | 4.00 | 04/23/29 | 200,799 | |||||||||||||||
200 | Societe Generale SA (France) (a) | 2.889 | 06/09/32 | 154,326 | |||||||||||||||
125 | Stewart Information Services Corp. | 3.60 | 11/15/31 | 96,079 | |||||||||||||||
200 | Sun Communities Operating LP | 4.20 | 04/15/32 | 176,695 | |||||||||||||||
250 | SVB Financial Group | 1.80 | 02/02/31 | 182,933 | |||||||||||||||
45 | SVB Financial Group | 4.10 | 02/15/31 | 25,979 | |||||||||||||||
200 | Swedbank AB (Sweden) (a) | 3.356 | 04/04/25 | 192,395 | |||||||||||||||
275 | Synchrony Bank | 5.625 | 08/23/27 | 268,418 | |||||||||||||||
175 | Synovus Financial Corp. | 5.20 | 08/11/25 | 172,813 | |||||||||||||||
200 | Toronto-Dominion Bank (Canada) | 8.125 | 10/31/82 | 208,500 | |||||||||||||||
100 | VICI Properties LP | 4.75 | 02/15/28 | 95,054 | |||||||||||||||
350 | VICI Properties LP/VICI Note Co., Inc. (a) | 3.875 | 02/15/29 | 307,258 | |||||||||||||||
100 | Westpac Banking Corp. (Australia) | 2.668 | 11/15/35 | 74,534 | |||||||||||||||
19,067,548 | |||||||||||||||||||
Health Care (1.0%) | |||||||||||||||||||
275 | Adventist Health System | 5.43 | 03/01/32 | 271,671 | |||||||||||||||
225 | CommonSpirit Health | 6.073 | 11/01/27 | 230,456 | |||||||||||||||
502,127 | |||||||||||||||||||
Industrials (2.5%) | |||||||||||||||||||
125 | Boeing Co. | 2.95 | 02/01/30 | 106,139 | |||||||||||||||
125 | Boeing Co. | 3.25 | 02/01/35 | 95,438 | |||||||||||||||
150 | Eaton Corp. | 4.15 | 03/15/33 | 139,917 | |||||||||||||||
200 | Sealed Air Corp. (a) | 1.573 | 10/15/26 | 172,958 | |||||||||||||||
300 | Silgan Holdings, Inc. (a) | 1.40 | 04/01/26 | 265,018 | |||||||||||||||
EUR | 100 | Standard Industries, Inc. (a) | 2.25 | 11/21/26 | 91,989 | ||||||||||||||
$ | 200 | Union Pacific Corp. | 4.95 | 09/09/52 | 192,938 | ||||||||||||||
275 | Vontier Corp. | 2.95 | 04/01/31 | 199,115 | |||||||||||||||
1,263,512 | |||||||||||||||||||
See Notes to Financial Statements
13
Morgan Stanley Variable Investment Series - Income Plus Portfolio
Portfolio of Investments ◼ December 31, 2022 continued
| PRINCIPAL AMOUNT (000) | COUPON RATE | MATURITY DATE | VALUE | ||||||||||||||||
Technology (4.7%) | |||||||||||||||||||
$ | 225 | Apple, Inc. | 2.375 | % | 02/08/41 | $ | 159,921 | ||||||||||||
350 | Apple, Inc. | 3.95 | 08/08/52 | 299,420 | |||||||||||||||
125 | Broadcom, Inc. (a) | 3.187 | 11/15/36 | 90,178 | |||||||||||||||
75 | Broadcom, Inc. (a) | 3.419 | 04/15/33 | 60,336 | |||||||||||||||
250 | Dell International LLC/EMC Corp. (a) | 3.45 | 12/15/51 | 153,957 | |||||||||||||||
350 | DXC Technology Co. | 1.80 | 09/15/26 | 305,244 | |||||||||||||||
225 | Intel Corp. | 2.80 | 08/12/41 | 157,980 | |||||||||||||||
75 | Intel Corp. | 3.25 | 11/15/49 | 51,376 | |||||||||||||||
150 | International Business Machines Corp. | 2.85 | 05/15/40 | 109,405 | |||||||||||||||
175 | Kyndryl Holdings, Inc. | 2.05 | 10/15/26 | 142,990 | |||||||||||||||
500 | Micron Technology, Inc. | 2.703 | 04/15/32 | 375,087 | |||||||||||||||
150 | Microsoft Corp. | 2.525 | 06/01/50 | 99,431 | |||||||||||||||
200 | Oracle Corp. | 3.60 | 04/01/50 | 135,490 | |||||||||||||||
75 | Oracle Corp. | 3.85 | 07/15/36 | 61,586 | |||||||||||||||
75 | RingCentral, Inc. (c) | 0.00 | 03/15/26 | 59,250 | |||||||||||||||
55 | Western Digital Corp. | 1.50 | 02/01/24 | 52,662 | |||||||||||||||
50 | Ziff Davis, Inc. (a) | 1.75 | 11/01/26 | 50,100 | |||||||||||||||
2,364,413 | |||||||||||||||||||
Utilities (10.9%) | |||||||||||||||||||
225 | Alliant Energy Finance Co. (a) | 3.60 | 03/01/32 | 194,618 | |||||||||||||||
200 | APA Infrastructure Ltd. (Australia) (a) | 4.20 | 03/23/25 | 193,286 | |||||||||||||||
350 | Berkshire Hathaway Energy Co. | 2.85 | 05/15/51 | 230,757 | |||||||||||||||
50 | Berkshire Hathaway Energy Co. (a) | 4.60 | 05/01/53 | 43,693 | |||||||||||||||
175 | Cleveland Electric Illuminating Co. (a) | 4.55 | 11/15/30 | 164,196 | |||||||||||||||
200 | Consorcio Transmantaro SA (Peru) (a) | 4.70 | 04/16/34 | 182,355 | |||||||||||||||
100 | Consumers Energy Co. | 2.50 | 05/01/60 | 56,423 | |||||||||||||||
175 | Dominion Energy, Inc. | 5.375 | 11/15/32 | 174,006 | |||||||||||||||
175 | DTE Electric Co. | 2.95 | 03/01/50 | 119,513 | |||||||||||||||
50 | Duke Energy Corp. | 5.00 | 08/15/52 | 44,638 | |||||||||||||||
247 | Duke Energy Indiana LLC | 2.75 | 04/01/50 | 156,139 | |||||||||||||||
225 | Edison International | 6.95 | 11/15/29 | 235,487 | |||||||||||||||
225 | Enel Finance International NV (Italy) (a) | 5.00 | 06/15/32 | 203,259 | |||||||||||||||
100 | Entergy Texas, Inc. | 3.55 | 09/30/49 | 72,228 | |||||||||||||||
100 | Exelon Corp. | 4.10 | 03/15/52 | 80,438 | |||||||||||||||
275 | Fells Point Funding Trust (a) | 3.046 | 01/31/27 | 250,667 | |||||||||||||||
50 | Indiana Michigan Power Co. | 4.25 | 08/15/48 | 40,808 | |||||||||||||||
150 | Interstate Power and Light Co. | 2.30 | 06/01/30 | 122,929 | |||||||||||||||
100 | Interstate Power and Light Co. | 3.50 | 09/30/49 | 71,732 | |||||||||||||||
125 | Jersey Central Power & Light Co. (a) | 2.75 | 03/01/32 | 101,271 | |||||||||||||||
396 | National Fuel Gas Co. | 2.95 | 03/01/31 | 311,232 | |||||||||||||||
125 | New England Power Co. (United Kingdom) (a) | 5.936 | 11/25/52 | 129,299 | |||||||||||||||
See Notes to Financial Statements
14
Morgan Stanley Variable Investment Series - Income Plus Portfolio
Portfolio of Investments ◼ December 31, 2022 continued
| PRINCIPAL AMOUNT (000) | COUPON RATE | MATURITY DATE | VALUE | ||||||||||||||||
$ | 125 | NextEra Energy Capital Holdings, Inc. | 1.90 | % | 06/15/28 | $ | 106,945 | ||||||||||||
350 | NextEra Energy Capital Holdings, Inc. | 2.75 | 11/01/29 | 303,502 | |||||||||||||||
75 | NextEra Energy Capital Holdings, Inc. | 3.00 | 01/15/52 | 49,305 | |||||||||||||||
275 | Niagara Mohawk Power Corp. (a) | 2.759 | 01/10/32 | 223,904 | |||||||||||||||
150 | Northern States Power Co. | 2.90 | 03/01/50 | 103,312 | |||||||||||||||
150 | Pacific Gas and Electric Co. | 3.30 | 08/01/40 | 102,072 | |||||||||||||||
125 | PECO Energy Co. | 3.05 | 03/15/51 | 86,060 | |||||||||||||||
50 | Public Service Co. of Colorado | 4.50 | 06/01/52 | 45,163 | |||||||||||||||
175 | Public Service Co. of Colorado, Series 34 | 3.20 | 03/01/50 | 125,055 | |||||||||||||||
300 | Public Service Enterprise Group, Inc. | 2.45 | 11/15/31 | 240,523 | |||||||||||||||
150 | Southern California Edison Co. | 4.00 | 04/01/47 | 117,915 | |||||||||||||||
225 | Southern Co. | 4.40 | 07/01/46 | 188,717 | |||||||||||||||
100 | Union Electric Co. | 3.90 | 04/01/52 | 81,100 | |||||||||||||||
100 | Virginia Electric and Power Co. | 2.45 | 12/15/50 | 59,704 | |||||||||||||||
175 | Virginia Electric and Power Co. | 2.95 | 11/15/51 | 115,803 | |||||||||||||||
50 | Virginia Electric and Power Co., Series C | 4.625 | 05/15/52 | 43,908 | |||||||||||||||
275 | Vistra Operations Co. LLC (a) | 4.875 | 05/13/24 | 269,802 | |||||||||||||||
5,441,764 | |||||||||||||||||||
| Total Corporate Bonds (Cost $54,161,027) | 46,912,774 | ||||||||||||||||||
Short-Term Investments (2.9%) | |||||||||||||||||||
U.S. Treasury Security (1.8%) | |||||||||||||||||||
889 | U.S. Treasury Bill (e)(f) (Cost $882,200) | 3.843 | 03/16/23 | 881,636 | |||||||||||||||
See Notes to Financial Statements
15
Morgan Stanley Variable Investment Series - Income Plus Portfolio
Portfolio of Investments ◼ December 31, 2022 continued
| NUMBER OF SHARES (000) | VALUE | ||||||||||||||||||
Investment Company (1.1%) | |||||||||||||||||||
536 | Morgan Stanley Institutional Liquidity Funds - Government Portfolio - Institutional Class (See Note 8) (Cost $535,663) | $ | 535,663 | ||||||||||||||||
| Total Short-Term Investments (Cost $1,417,863) | 1,417,299 | ||||||||||||||||||
| Total Investments (Cost $56,712,383) (g)(h) | 99.0 | % | 49,473,626 | ||||||||||||||||
Other Assets in Excess of Liabilities | 1.0 | 513,937 | |||||||||||||||||
Net Assets | 100.0 | % | $ | 49,987,563 | |||||||||||||||
SOFR Secured Overnight Financing Rate.
SONIA Sterling Overnight Index Average.
(a) 144A security - Certain conditions for public sale may exist. Unless otherwise noted, these securities are deemed to be liquid.
(b) Floating or variable rate securities: The rates disclosed are as of December 31, 2022. For securities based on a published reference rate and spread, the reference rate and spread are indicated in the description in the Portfolio of Investments. Certain variable rate securities may not be based on a published reference rate and spread but are determined by the issuer or agent and are based on current market conditions. These securities do not indicate a reference rate and spread in their description in the Portfolio of Investments.
(c) Capital appreciation bond.
(d) Perpetual - One or more securities do not have a predetermined maturity date. Rates for these securities are fixed for a period of time, after which they revert to a floating rate. Interest rates in effect are as of December 31, 2022.
(e) All or a portion of the security was pledged to cover margin requirements for futures contracts.
(f) Rate shown is the yield to maturity at December 31, 2022.
(g) Securities are available for collateral in connection with open foreign currency forward exchange contracts and futures contracts.
(h) At December 31, 2022, the aggregate cost for federal income tax purposes is $56,844,336. The aggregate gross unrealized appreciation is $94,694 and the aggregate gross unrealized depreciation is $7,507,233, resulting in net unrealized depreciation of $7,412,539.
See Notes to Financial Statements
16
Morgan Stanley Variable Investment Series - Income Plus Portfolio
Portfolio of Investments ◼ December 31, 2022 continued
FOREIGN CURRENCY FORWARD EXCHANGE CONTRACTS:
The Fund had the following foreign currency forward exchange contracts open at December 31, 2022:
COUNTERPARTY | CONTRACTS TO DELIVER | IN EXCHANGE FOR | DELIVERY DATE | UNREALIZED DEPRECIATION | |||||||||||||||
HSBC Bank PLC | EUR | 251,983 | $ | 250,337 | 02/09/23 | $ | (20,043 | ) | |||||||||||
UBS AG | GBP | 204,969 | $ | 232,349 | 02/09/23 | (15,680 | ) | ||||||||||||
UBS AG | $ | 2,107 | GBP | 1,713 | 02/09/23 | (34 | ) | ||||||||||||
$ | (35,757 | ) | |||||||||||||||||
FUTURES CONTRACTS:
The Fund had the following futures contracts open at December 31, 2022:
| NUMBER OF CONTRACTS | EXPIRATION DATE | NOTIONAL AMOUNT (000) | VALUE | UNREALIZED APPRECIATION (DEPRECIATION) | |||||||||||||||||||
Long: | |||||||||||||||||||||||
U.S. Treasury 2 yr. Note | 30 | Mar-23 | $ | 6,000 | $ | 6,152,344 | $ | 4,741 | |||||||||||||||
U.S. Treasury Long Bond | 36 | Mar-23 | 3,600 | 4,512,375 | (41,724 | ) | |||||||||||||||||
U.S. Treasury Ultra Bond | 7 | Mar-23 | 700 | 940,188 | (15,060 | ) | |||||||||||||||||
U.S. Treasury 5 yr. Note | 2 | Mar-23 | 200 | 215,859 | (3,498 | ) | |||||||||||||||||
Short: | |||||||||||||||||||||||
German Euro-Bund Index | 1 | Mar-23 | EUR | (100 | ) | (142,295 | ) | 9,914 | |||||||||||||||
U.S. Treasury 10 yr. Note | 30 | Mar-23 | $ | (3,000 | ) | (3,368,906 | ) | 17,187 | |||||||||||||||
U.S. Treasury 10 yr. Ultra Note | 51 | Mar-23 | (5,100 | ) | (6,032,344 | ) | 21,538 | ||||||||||||||||
$ | (6,902 | ) | |||||||||||||||||||||
EUR — Euro
GBP — British Pound
USD — United States Dollar
See Notes to Financial Statements
17
Morgan Stanley Variable Investment Series - Income Plus Portfolio
Portfolio of Investments ◼ December 31, 2022 continued
| LONG TERM CREDIT ANALYSIS+ (unaudited) | |||||||
AAA | 5.2 | % | |||||
AA | 9.6 | ||||||
A | 30.1 | ||||||
BBB | 51.0 | ||||||
BB | 2.2 | ||||||
B or Below | 1.1 | ||||||
Not Rated | 0.8 | ||||||
100.0 | %++ | ||||||
+ The ratings shown is an aggregation of the highest security level rating amongst Standard & Poor's Ratings Group ("S&P), Moody's Investors Services, Inc. ("Moody's") and Fitch Ratings ("Fitch"), each a Nationally Recognized Statistical Ratings Organization ("NRSRO").
++ Does not include open long/short futures contracts with a value of $21,364,311 and net unrealized depreciation of $6,902. Does not include an open foreign currency forward exchange contract with total unrealized depreciation of $35,757.
See Notes to Financial Statements
18
Morgan Stanley Variable Investment Series - Income Plus Portfolio
Financial Statements
Statement of Assets and Liabilities
December 31, 2022
Assets: | |||||||
Investments in securities, at value* | $ | 48,937,963 | |||||
Investment in affiliate, at value** | 535,663 | ||||||
Total investments in securities, at value | 49,473,626 | ||||||
Foreign currency, at value*** | 8,698 | ||||||
Receivable for: | |||||||
Interest | 512,881 | ||||||
Shares of beneficial interest sold | 197,243 | ||||||
Dividends from affiliate | 2,639 | ||||||
Prepaid expenses and other assets | 10,181 | ||||||
| Total Assets | 50,205,268 | ||||||
Liabilities: | |||||||
Unrealized depreciation on open foreign currency forward exchange contracts | 35,757 | ||||||
Payable for: | |||||||
Distribution fee (Class Y Shares) | 5,966 | ||||||
Variation margin on open futures contracts | 5,592 | ||||||
Trustees' fees | 5,027 | ||||||
Administration fee | 3,460 | ||||||
Advisory fee | 2,932 | ||||||
Transfer agent fees | 685 | ||||||
Shares of beneficial interest redeemed | 84 | ||||||
Accrued expenses and other payables | 158,202 | ||||||
| Total Liabilities | 217,705 | ||||||
Net Assets | $ | 49,987,563 | |||||
Composition of Net Assets: | |||||||
Paid-in-Capital | $ | 60,094,011 | |||||
Total Accumulated Loss | (10,106,448 | ) | |||||
Net Assets | $ | 49,987,563 | |||||
| * Cost | $ | 56,176,720 | |||||
| ** Affiliated Cost | $ | 535,663 | |||||
| *** Foreign Currency Cost | $ | 7,904 | |||||
Class X Shares: | |||||||
Net Assets | $ | 22,434,721 | |||||
| Shares Outstanding (unlimited shares authorized, $0.01 par value) | 2,587,044 | ||||||
Net Asset Value Per Share | $ | 8.67 | |||||
Class Y Shares: | |||||||
Net Assets | $ | 27,552,842 | |||||
| Shares Outstanding (unlimited shares authorized, $0.01 par value) | 3,179,708 | ||||||
Net Asset Value Per Share | $ | 8.67 | |||||
See Notes to Financial Statements
19
Morgan Stanley Variable Investment Series - Income Plus Portfolio
Financial Statements continued
Statement of Operations
For the year ended December 31, 2022
Net Investment Income: | |||||||
Income | |||||||
Interest (net of $187 foreign withholding tax) | $ | 2,077,313 | |||||
Dividends from affiliates (Note 8) | 10,680 | ||||||
Total Income | 2,087,993 | ||||||
Expenses | |||||||
Advisory fee (Note 4) | 234,462 | ||||||
Professional fees | 170,378 | ||||||
Distribution fee (Class Y shares) (Note 5) | 76,186 | ||||||
Administration fee (Note 4) | 44,659 | ||||||
Shareholder reports and notices | 38,258 | ||||||
Custodian fees (Note 7) | 24,002 | ||||||
Trustees' fees and expenses | 5,853 | ||||||
Transfer agent fees (Note 6) | 4,240 | ||||||
Other | 47,369 | ||||||
Total Expenses | 645,407 | ||||||
Less: amounts waived (Note 4) | (150,539 | ) | |||||
Less: rebate from Morgan Stanley affiliated cash sweep (Note 8) | (803 | ) | |||||
Net Expenses | 494,065 | ||||||
Net Investment Income | 1,593,928 | ||||||
Realized and Unrealized Gain (Loss): | |||||||
Realized Gain (Loss) on: | |||||||
Investments | (4,520,824 | ) | |||||
Futures contracts | 6,906 | ||||||
Swap agreements | (2,373 | ) | |||||
Foreign currency forward exchange contracts | 47,672 | ||||||
Foreign currency translation | 569 | ||||||
Net Realized Loss | (4,468,050 | ) | |||||
Change in Unrealized Appreciation (Depreciation) on: | |||||||
Investments | (8,161,514 | ) | |||||
Futures contracts | 165,746 | ||||||
Foreign currency forward exchange contracts | (35,858 | ) | |||||
Foreign currency translation | 3,101 | ||||||
Net Change in Unrealized Appreciation (Depreciation) | (8,028,525 | ) | |||||
Net Loss | (12,496,575 | ) | |||||
Net Decrease in Net Assets Resulting from Operations | $ | (10,902,647 | ) | ||||
See Notes to Financial Statements
20
Morgan Stanley Variable Investment Series - Income Plus Portfolio
Financial Statements continued
Statements of Changes in Net Assets
| For The Year Ended December 31, 2022 | For The Year Ended December 31, 2021 | ||||||||||
Increase (Decrease) in Net Assets: | |||||||||||
Operations: | |||||||||||
Net investment income | $ | 1,593,928 | $ | 1,299,286 | |||||||
Net realized gain (loss) | (4,468,050 | ) | 1,417,197 | ||||||||
Net change in unrealized appreciation (depreciation) | (8,028,525 | ) | (4,212,925 | ) | |||||||
Net Decrease in Net Assets Resulting from Operations | (10,902,647 | ) | (1,496,442 | ) | |||||||
Dividends and Distributions to Shareholders: | |||||||||||
Class X shares | (921,020 | ) | (3,411,897 | ) | |||||||
Class Y shares | (1,000,579 | ) | (3,908,138 | ) | |||||||
Total Dividends and Distributions to Shareholders | (1,921,599 | ) | (7,320,035 | ) | |||||||
Net increase (decrease) from transactions in shares of beneficial interest | (5,976,162 | ) | 1,174,958 | ||||||||
Net Decrease | (18,800,408 | ) | (7,641,519 | ) | |||||||
Net Assets: | |||||||||||
Beginning of period | 68,787,971 | 76,429,490 | |||||||||
End of Period | $ | 49,987,563 | $ | 68,787,971 | |||||||
See Notes to Financial Statements
21
Morgan Stanley Variable Investment Series - Income Plus Portfolio
Financial Statements continued
Statements of Changes in Net Assets continued
Summary of Transactions in Shares of Beneficial Interest
| For The Year Ended December 31, 2022 | For The Year Ended December 31, 2021 | ||||||||||
Class X Shares | |||||||||||
Shares | |||||||||||
Sold | 54,901 | 122,906 | |||||||||
Reinvestment of dividends and distributions | 103,953 | 313,305 | |||||||||
Redeemed | (481,354 | ) | (516,670 | ) | |||||||
Net Decrease - Class X | (322,500 | ) | (80,459 | ) | |||||||
Amount | |||||||||||
Sold | $ | 492,276 | $ | 1,382,045 | |||||||
Reinvestment of dividends and distributions | 921,020 | 3,411,897 | |||||||||
Redeemed | (4,500,424 | ) | (5,885,807 | ) | |||||||
Net Decrease - Class X | $ | (3,087,128 | ) | $ | (1,091,865 | ) | |||||
Class Y Shares | |||||||||||
Shares | |||||||||||
Sold | 157,246 | 236,941 | |||||||||
Reinvestment of dividends and distributions | 112,932 | 358,874 | |||||||||
Redeemed | (565,042 | ) | (386,578 | ) | |||||||
Net Increase (Decrease) - Class Y | (294,864 | ) | 209,237 | ||||||||
Amount | |||||||||||
Sold | $ | 1,435,377 | $ | 2,723,343 | |||||||
Reinvestment of dividends and distributions | 1,000,579 | 3,908,138 | |||||||||
Redeemed | (5,324,990 | ) | (4,364,658 | ) | |||||||
Net Increase (Decrease) - Class Y | $ | (2,889,034 | ) | $ | 2,266,823 | ||||||
See Notes to Financial Statements
22
Morgan Stanley Variable Investment Series
Notes to Financial Statements ◼ December 31, 2022
1. Organization and Accounting Policies
Morgan Stanley Variable Investment Series (the "Trust") is registered under the Investment Company Act of 1940, as amended (the "Act"), as an open-end management investment company. The Trust is offered exclusively to life insurance companies in connection with particular life insurance and/or annuity contracts they offer. The Trust applies investment company accounting and reporting guidance Accounting Standards Codification ("ASC") Topic 946.
The Trust consists of Income Plus Portfolio (the "Fund"). The Trust was organized on February 25, 1983 as a Massachusetts business trust and the Fund commenced operations on March 1, 1987. The Fund is classified as diversified and seeks, as its primary objective, to provide a high level of current income by investing primarily in U.S. government securities and other fixed-income securities. As a secondary objective, the Fund seeks capital appreciation but only when consistent with its primary objective.
On June 5, 2000, the Trust commenced offering one additional class of shares (Class Y shares). The Fund currently offers two share classes — Class X shares and Class Y shares. The two classes are identical except that Class Y shares incur distribution expenses. Class X shares are generally available to holders of contracts offered before May 1, 2000. Class Y shares are available to holders of contracts offered on or after June 5, 2000.
The following is a summary of significant accounting policies:
A. Valuation of Investments — (1) An equity portfolio security listed or traded on an exchange is valued at its latest reported sales price (or at the exchange official closing price if such exchange reports an official closing price), and if there were no sales on a given day and if there is no official exchange closing price for that day, the security is valued at the mean between the last reported bid and asked prices if such bid and asked prices are available on the relevant exchanges. If only bid prices are available then the latest bid price may be used. Listed equity securities not traded on the valuation date with no reported bid and asked prices available on the exchange are valued at the mean between the current bid and asked prices obtained from one or more reputable brokers/dealers. In cases where a security is traded on more than one exchange, the security is valued on the exchange designated as the primary market; (2) all other equity portfolio securities for which over-the-counter ("OTC") market quotations are readily available are valued at the latest reported sales price (or at the market official closing price if such market reports an official closing price), and if there was no trading in the security on a given day and if there is no official closing price from relevant markets for that day, the security is valued at the mean between the last reported bid and asked prices if such bid and asked prices are available on the relevant markets. An unlisted equity security that does not trade on the valuation date and for which bid and asked prices from the relevant markets are unavailable is valued at the
23
Morgan Stanley Variable Investment Series
Notes to Financial Statements ◼ December 31, 2022 continued
mean between the current bid and asked prices obtained from one or more reputable brokers/dealers; (3) futures are valued at the settlement price on the exchange on which they trade or, if a settlement price is unavailable, at the last sale price on the exchange; (4) OTC swaps may be valued by an outside pricing service approved by the Trust's Board of Trustees (the "Trustees") or quotes from a broker/dealer. Swaps cleared on a clearinghouse or exchange may be valued using the closing price provided by the clearinghouse or exchange; (5) foreign exchange transactions ("spot contracts") and foreign exchange forward contracts ("forward contracts") are valued daily using an independent pricing vendor at the spot and forward rates, respectively, as of the close of the New York Stock Exchange ("NYSE"); (6) fixed income securities may be valued by an outside pricing service/vendor approved by the Trustees. The pricing service/vendor may employ a pricing model that takes into account, among other things, bids, yield spreads and/or other market data and specific security characteristics. If Morgan Stanley Investment Management Inc. (the "Adviser"), a wholly-owned subsidiary of Morgan Stanley, determines that the price provided by the outside pricing service/vendor does not reflect the security's fair value or is unable to provide a price, prices from brokers/dealers may also be utilized. In these circumstances, the value of the security will be the mean of bid and asked prices obtained from brokers/dealers; (7) when market quotations are not readily available, as defined by Rule 2a-5 under the Act, including circumstances under which the Adviser determines that the closing price, last sale price or the mean between the last reported bid and asked prices are not reflective of a security's market value, portfolio securities are valued at their fair value as determined in good faith under procedures approved by and under the general supervision of the Trustees. Occasionally, developments affecting the closing prices of securities and other assets may occur between the times at which valuations of such securities are determined (that is, close of the foreign market on which the securities trade) and the close of business on the NYSE. If developments occur during such periods that are expected to materially affect the value of such securities, such valuations may be adjusted to reflect the estimated fair value of such securities as of the close of the NYSE, as determined in good faith by the Trustees or by the Adviser using a pricing service and/or procedures approved by the Trustees; and (8) investments in mutual funds, including the Morgan Stanley Institutional Liquidity Funds, are valued at the net asset value ("NAV") as of the close of each business day.
In connection with Rule 2a-5 of the Act, which became effective September 8, 2022, the Trustees have designated the Trust's Adviser as its valuation designee. The valuation designee has responsibility for determining fair value and to make the actual calculations pursuant to the fair valuation methodologies previously approved by the Trustees. Under procedures approved by the Trustees, the Trust's Adviser, as valuation designee, has formed a Valuation Committee whose members are approved by the Trustees. The
24
Morgan Stanley Variable Investment Series
Notes to Financial Statements ◼ December 31, 2022 continued
Valuation Committee provides administration and oversight of the Trust's valuation policies and procedures, which are reviewed at least annually by the Trustees. These procedures allow the Trust to utilize independent pricing services, quotations from securities and financial instrument dealers and other market sources to determine fair value.
B. Accounting for Investments — Security transactions are accounted for on the trade date (date the order to buy or sell is executed). Realized gains and losses on security transactions are determined by the identified cost method. Dividend income and other distributions are recorded on the ex-dividend date, except for certain dividends on foreign securities which are recorded as soon as the Trust is informed after the ex-dividend date. Interest income is accrued daily as earned except where collection is not expected. Discounts are accreted and premiums are amortized over the life of the respective securities and are included in interest income.
C. Multiple Class Allocations — Investment income, expenses (other than distribution fees) and realized and unrealized gains and losses are allocated to each class of shares based upon the relative net asset value on the date such items are recognized. Distribution fees are charged directly to the respective class.
D. Foreign Currency Translation and Foreign Investments — The books and records of the Fund are maintained in U.S. dollars. Foreign currency amounts are translated into U.S. dollars as follows:
— investments, other assets and liabilities at the prevailing rate of exchange on the valuation date;
— investment transactions and investment income at the prevailing rates of exchange on the dates of such transactions.
Although the net assets of the Fund are presented at the foreign exchange rates and market values at the close of the period, the Fund does not isolate that portion of the results of operations arising as a result of changes in the foreign exchange rates from the fluctuations arising from changes in the market prices of securities held at period end. Similarly, the Fund does not isolate the effect of changes in foreign exchange rates from the fluctuations arising from changes in the market prices of securities sold during the period. Accordingly, realized and unrealized foreign currency gains (losses) on investments in securities are included in the reported net realized and unrealized gains (losses) on investment transactions and balances. However, pursuant to U.S. federal income tax regulations, gains and losses from certain foreign currency transactions and the foreign currency portion of gains and losses realized on sales and maturities of foreign denominated debt securities are treated as ordinary income for U.S. federal income tax purposes.
25
Morgan Stanley Variable Investment Series
Notes to Financial Statements ◼ December 31, 2022 continued
Net realized gains (losses) on foreign currency transactions represent net foreign exchange gains (losses) from foreign currency forward exchange contracts, disposition of foreign currencies, currency gains (losses) realized between the trade and settlement dates on securities transactions, and the difference between the amount of investment income and foreign withholding taxes recorded on the Fund's books and the U.S. dollar equivalent amounts actually received or paid. The change in unrealized currency gains (losses) on foreign currency transactions for the period is reflected in the Statement of Operations.
E. Dividends and Distributions to Shareholders — Dividends and distributions to shareholders are recorded on the ex-dividend date. Dividends from net investment income, if any, are declared and paid annually. Net realized capital gains, if any, are distributed at least annually.
F. Use of Estimates — The preparation of financial statements in accordance with generally accepted accounting principles in the United States ("GAAP") requires management to make estimates and assumptions that affect the reported amounts and disclosures. Actual results could differ from those estimates.
G. Indemnifications — The Trust enters into contracts that contain a variety of indemnifications. The Trust's maximum exposure under these arrangements is unknown. However, the Trust has not had prior claims or losses pursuant to these contracts and expects the risk of loss to be remote.
2. Fair Valuation Measurements
Financial Accounting Standards Board ("FASB") ASC 820, "Fair Value Measurement" ("ASC 820"), defines fair value as the price that would be received to sell an asset or pay to transfer a liability in an orderly transaction between market participants at the measurement date. ASC 820 establishes a three-tier hierarchy to distinguish between (1) inputs that reflect the assumptions market participants would use in valuing an asset or liability developed based on market data obtained from sources independent of the reporting entity (observable inputs); and (2) inputs that reflect the reporting entity's own assumptions about the assumptions market participants would use in valuing an asset or liability developed based on the best information available in the circumstances (unobservable inputs) and to establish classification of fair value measurements for disclosure purposes. Various inputs are used in determining the value of the Fund's investments. The inputs are summarized in the three broad levels listed below:
• Level 1 — unadjusted quoted prices in active markets for identical investments
• Level 2 — other significant observable inputs (including quoted prices for similar investments, interest rates, prepayment speeds, credit risk, etc.)
26
Morgan Stanley Variable Investment Series
Notes to Financial Statements ◼ December 31, 2022 continued
• Level 3 — significant unobservable inputs including the Fund's own assumptions in determining the fair value of investments. Factors considered in making this determination may include, but are not limited to, information obtained by contacting the issuer, analysts, or the appropriate stock exchange (for exchange-traded securities), analysis of the issuer's financial statements or other available documents and, if necessary, available information concerning other securities in similar circumstances.
The inputs or methodology used for valuing securities are not necessarily an indication of the risk associated with investing in those securities and the determination of the significance of a particular input to the fair value measurement in its entirety requires judgment and considers factors specific to each security.
The following is a summary of the inputs used to value the Fund's investments as of December 31, 2022:
Investment Type | Level 1 Unadjusted Quoted Prices | Level 2 Other Significant Observable Inputs | Level 3 Significant Unobservable Inputs | Total | |||||||||||||||
Assets: | |||||||||||||||||||
Fixed Income Securities | |||||||||||||||||||
Commercial Mortgage-Backed Securities | $ | — | $ | 1,143,553 | $ | — | $ | 1,143,553 | |||||||||||
Corporate Bonds | — | 46,912,774 | — | 46,912,774 | |||||||||||||||
Total Fixed Income Securities | — | 48,056,327 | — | 48,056,327 | |||||||||||||||
Short-Term Investments | |||||||||||||||||||
U.S. Treasury Security | — | 881,636 | — | 881,636 | |||||||||||||||
Investment Company | 535,663 | — | — | 535,663 | |||||||||||||||
Total Short-Term Investments | 535,663 | 881,636 | — | 1,417,299 | |||||||||||||||
Futures Contracts | 53,380 | — | — | 53,380 | |||||||||||||||
Total Assets | 589,043 | 48,937,963 | — | 49,527,006 | |||||||||||||||
Liabilities: | |||||||||||||||||||
Foreign Currency Forward Exchange Contracts | — | (35,757 | ) | — | (35,757 | ) | |||||||||||||
Futures Contracts | (60,282 | ) | — | — | (60,282 | ) | |||||||||||||
Total Liabilities | (60,282 | ) | (35,757 | ) | — | (96,039 | ) | ||||||||||||
Total | $ | 528,761 | $ | 48,902,206 | $ | — | $ | 49,430,967 | |||||||||||
Transfers between investment levels may occur as the markets fluctuate and/or the availability of data used in an investment's valuation changes.
27
Morgan Stanley Variable Investment Series
Notes to Financial Statements ◼ December 31, 2022 continued
3. Derivatives
The Fund may, but is not required to, use derivative instruments for a variety of purposes, including hedging, risk management, portfolio management or to earn income. Derivative instruments used by the Fund will be counted towards the Fund's exposure in the types of securities listed herein to the extent they have economic characteristics similar to such securities. Derivatives are financial instruments whose value is based, in part, on the value of an underlying asset, interest rate, index or financial instrument. Prevailing interest rates and volatility levels, among other things, also affect the value of derivative instruments. A derivative instrument often has risks similar to its underlying asset and may have additional risks, including imperfect correlation between the value of the derivative and the underlying asset, risks of default by the counterparty to certain transactions, magnification of losses incurred due to changes in the market value of the securities, instruments, indices or interest rates to which the derivative instrument relates, risks that the transactions may not be liquid, risks arising from margin and payment requirements, risks arising from mispricing or valuation complexity and operational and legal risks. The use of derivatives involves risks that are different from, and possibly greater than, the risks associated with other portfolio investments. Derivatives may involve the use of highly specialized instruments that require investment techniques and risk analyses different from those associated with other portfolio investments. All of the Fund's holdings, including derivative instruments, are marked-to-market each day with the change in value reflected in unrealized appreciation (depreciation). Upon disposition, a realized gain or loss is recognized.
Certain derivative transactions may give rise to a form of leverage. Leverage magnifies the potential for gain and risk of loss. Leverage associated with derivative transactions may cause the Fund to liquidate portfolio positions when it may not be advantageous to do so to satisfy its obligations or may cause the Fund to be more volatile than if the Fund had not been leveraged. Although the Adviser seeks to use derivatives to further the Fund's investment objectives, there is no assurance that the use of derivatives will achieve this result.
Following is a description of the derivative instruments and techniques that the Fund used during the period and their associated risks:
Foreign Currency Forward Exchange Contracts — In connection with its investments in foreign securities, the Fund entered into contracts with banks, brokers/dealers to purchase or sell foreign currencies at a future date. A foreign currency forward exchange contract ("currency contract") is a negotiated agreement between the contracting parties to exchange a specified amount of currency at a specified future time at a specified rate. The rate can be higher or lower than the spot rate between the currencies that are the subject of the contract. Currency contracts may be used to protect against uncertainty in the level of
28
Morgan Stanley Variable Investment Series
Notes to Financial Statements ◼ December 31, 2022 continued
future foreign currency exchange rates or to gain or modify exposure to a particular currency. In addition, the Fund may use cross currency hedging or proxy hedging with respect to currencies in which the Fund has or expects to have portfolio or currency exposure. Cross currency hedges involve the sale of one currency against the positive exposure to a different currency and may be used for hedging purposes or to establish an active exposure to the exchange rate between any two currencies. To the extent hedged by the use of currency contracts, the precise matching of the currency contract amounts and the value of the securities involved will not generally be possible because the future value of such securities in foreign currencies will change as a consequence of market movements in the value of those securities between the date on which the contract is entered into and the date it matures. Furthermore, such transactions may reduce or preclude the opportunity for gain if the value of the currency should move in the direction opposite to the position taken. There is additional risk to the extent that currency contracts create exposure to currencies in which the Fund's securities are not denominated. Unanticipated changes in currency prices may result in poorer overall performance for the Fund than if it had not entered into such contracts. The use of currency contracts involves the risk of loss from the insolvency or bankruptcy of the counterparty to the contract or the failure of the counterparty to make payments or otherwise comply with the terms of the contract. A currency contract is marked-to-market daily and the change in market value is recorded by the Fund as unrealized gain or loss. The Fund records realized gains (losses) when the currency contract is closed equal to the difference between the value of the currency contract at the time it was opened and the value at the time it was closed.
Futures — A futures contract is a standardized, exchange-traded agreement to buy or sell a specific quantity of an underlying asset, reference rate or index at a specific price at a specific future time. The value of a futures contract tends to increase and decrease in tandem with the value of the underlying instrument. Depending on the terms of the particular contract, futures contracts are settled through either physical delivery of the underlying instrument on the settlement date or by payment of a cash settlement amount on the settlement date. During the period the futures contract is open, payments are received from or made to the broker based upon changes in the value of the contract (the variation margin). A decision as to whether, when and how to use futures contracts involves the exercise of skill and judgment and even a well-conceived futures transaction may be unsuccessful because of market behavior or unexpected events. In addition to the derivatives risks discussed above, the prices of futures contracts can be highly volatile, using futures contracts can lower total return and the potential loss from futures contracts can exceed the Fund's initial investment in such contracts. No assurance can be given that a liquid market will exist for any particular futures contract at any particular time.
29
Morgan Stanley Variable Investment Series
Notes to Financial Statements ◼ December 31, 2022 continued
Swaps — The Fund may enter into OTC swap contracts or cleared swap transactions. A swap contract is an agreement between two parties pursuant to which the parties exchange payments at specified dates on the basis of a specified notional amount, with the payments calculated by reference to specified securities, indices, reference rates, currencies or other instruments. Typically swap agreements provide that when the period payment dates for both parties are the same, the payments are made on a net basis (i.e., the two payment streams are netted out, with only the net amount paid by one party to the other). The Fund's obligations or rights under a swap contract entered into on a net basis will generally be equal only to the net amount to be paid or received under the agreement, based on the relative values of the positions held by each party. Cleared swap transactions help reduce counterparty credit risk. In a cleared swap, the Fund's ultimate counterparty is a clearinghouse rather than a swap dealer, bank or other financial institution. OTC swap agreements are not entered into or traded on exchanges and often there is no central clearing or guaranty function for OTC swaps. These OTC swaps are often subject to credit risk or the risk of default or non-performance by the counterparty. Both OTC and cleared swaps could result in losses if interest rates, foreign currency exchange rates or other factors are not correctly anticipated by the Fund or if the reference index, security or investments do not perform as expected. During the period swap agreements are open, payments are received from or made to the counterparty or clearing-house based on changes in the value of the contract or variation margin, respectively. The Dodd-Frank Wall Street Reform and Consumer Protection Act and related regulatory developments require the clearing and exchange-trading of certain standardized swap transactions. Mandatory exchange-trading and clearing is occurring on a phased-in basis based on the type of market participant and U.S. Commodities Futures Trading Commission ("CFTC") approval of contracts for central clearing and exchange trading.
The Fund's use of swaps during the period included those based on the credit of an underlying security commonly referred to as credit default swaps. The Fund may be either the buyer or seller in a credit default swap. As the buyer in a credit default swap, the Fund would pay to the counterparty the periodic stream of payments. If no default occurs, the Fund would receive no benefit from the contract. As the seller in a credit default swap, the Fund would receive the stream of payments but would be subject to exposure on the notional amount of the swap, which it would be required to pay in the event of default. The use of credit default swaps could result in losses to the Fund if the Adviser fails to correctly evaluate the creditworthiness of the issuer of the referenced debt obligation.
If the Fund is a seller of protection and a credit event occurs, as defined under the terms of that particular swap agreement, the Fund will either (i) pay to the buyer of protection an amount equal to the notional amount of the swap agreement and take delivery of the referenced obligation, other deliverable obligations
30
Morgan Stanley Variable Investment Series
Notes to Financial Statements ◼ December 31, 2022 continued
or underlying securities comprising the referenced index or (ii) pay a net settlement amount in the form of cash or securities equal to the notional amount of the swap agreement less the recovery value of the referenced obligation or underlying securities comprising the referenced index. If the Fund is a buyer of protection and a credit event occurs, as defined under the terms of that particular swap agreement, the Fund will either (i) receive from the seller of protection an amount equal to the notional amount of the swap agreement and deliver the referenced obligation, other deliverable obligations or underlying securities comprising the referenced index or (ii) receive a net settlement amount in the form of cash or securities equal to the notional amount of the swap agreement less the recovery value of the referenced obligation or underlying securities comprising the referenced index. Recovery values are estimated by market makers considering either industry standard recovery rates or entity specific factors and considerations until a credit event occurs. If a credit event has occurred, the recovery value is determined by a facilitated auction whereby a minimum number of allowable broker bids, together with a specified valuation method, are used to calculate the settlement value. The Fund's maximum risk of loss from counterparty risk, either as the protection seller or as the protection buyer, is the fair value of the swap agreement.
The current credit rating of each individual issuer is included in the table following the Portfolio of Investments and serves as an indicator of the current status of the payment/performance risk of the credit derivative. Alternatively, for credit default swaps on an index of credits, the quoted market prices and current values serve as an indicator of the current status of the payment/performance risk of the credit derivative. Generally, lower credit ratings and increasing market values, in absolute terms, represent a deterioration of the credit and a greater likelihood of an adverse credit event of the issuer.
When the Fund has an unrealized loss on a swap agreement, the Fund has instructed the custodian to pledge cash or liquid securities as collateral with a value approximately equal to the amount of the unrealized loss. Collateral pledges are monitored and subsequently adjusted if and when the swap valuations fluctuate. If applicable, cash collateral is included with "Due from (to) Broker" in the Statements of Asset and Liabilities.
Upfront payments received or paid by the Fund will be reflected as an asset or liability, respectively, in the Statement of Assets and Liabilities.
At December 31, 2022, the Fund did not have any open swap agreements.
FASB ASC 815, "Derivatives and Hedging" ("ASC 815"), is intended to improve financial reporting about derivative instruments by requiring enhanced disclosures to enable investors to better understand how and
31
Morgan Stanley Variable Investment Series
Notes to Financial Statements ◼ December 31, 2022 continued
why the Fund uses derivative instruments, how these derivative instruments are accounted for and their effects on the Fund's financial position and results of operations.
The following table sets forth the fair value of the Fund's derivative contracts by primary risk exposure as of December 31, 2022:
| PRIMARY RISK EXPOSURE | ASSET DERIVATIVES STATEMENT OF ASSETS AND LIABILITIES LOCATION | FAIR VALUE | LIABILITY DERIVATIVES STATEMENT OF ASSETS AND LIABILITIES LOCATION | FAIR VALUE | |||||||||||||||
| Interest Rate Risk | Variation margin on open futures contracts | $ | 53,380 | (a) | Variation margin on open futures contracts | $ | (60,282 | )(a) | |||||||||||
| Currency Risk | Unrealized appreciation on open foreign currency forward exchange contracts | — | Unrealized depreciation on open foreign currency forward exchange contracts | (35,757 | ) | ||||||||||||||
$ | 53,380 | $ | (96,039 | ) | |||||||||||||||
(a) Includes cumulative appreciation (depreciation) as reported in the Portfolio of Investments. Only current day's net variation margin is reported within the Statement of Assets and Liabilities.
The following tables set forth by primary risk exposure of the Fund's realized gains (losses) and change in unrealized appreciation (depreciation) by type of derivative contract for the year ended December 31, 2022 in accordance with ASC 815:
AMOUNT OF REALIZED GAIN (LOSS) ON DERIVATIVES | |||||||||||||||
| PRIMARY RISK EXPOSURE | FUTURES CONTRACTS | FOREIGN CURRENCY FORWARD EXCHANGE CONTRACTS | SWAP AGREEMENTS | ||||||||||||
Interest Rate Risk | $ | 6,906 | $ | — | $ | — | |||||||||
Currency Risk | — | 47,672 | — | ||||||||||||
Credit Risk | — | — | (2,373 | ) | |||||||||||
Total | $ | 6,906 | $ | 47,672 | $ | (2,373 | ) | ||||||||
CHANGE IN UNREALIZED APPRECIATION (DEPRECIATION) ON DERIVATIVES | |||||||||||
| PRIMARY RISK EXPOSURE | FUTURES CONTRACTS | FOREIGN CURRENCY FORWARD EXCHANGE CONTRACTS | |||||||||
Interest Rate Risk | $ | 165,746 | $ | — | |||||||
Currency Risk | — | (35,858 | ) | ||||||||
Total | $ | 165,746 | $ | (35,858 | ) | ||||||
32
Morgan Stanley Variable Investment Series
Notes to Financial Statements ◼ December 31, 2022 continued
At December 31, 2022, the Fund's derivative assets and liabilities are as follows:
GROSS AMOUNTS OF ASSETS AND LIABILITIES PRESENTED IN THE STATEMENT OF ASSETS AND LIABILITIES | |||||||||||
| DERIVATIVES(b) | ASSETS(c) | LIABILITIES(c) | |||||||||
Foreign Currency Forward Exchange Contracts | $ | — | $ | (35,757 | ) | ||||||
(b) Excludes exchange-traded derivatives.
(c) Absent an event of default or early termination, OTC derivative assets and liabilities are presented gross and not offset in the Statement of Assets and Liabilities.
The Fund typically enter into International Swaps and Derivatives Association, Inc. Master Agreements ("ISDA Master Agreements") or similar master agreements (collectively, "Master Agreements") with their respective contract counterparties for certain OTC derivatives in order to, among other things, reduce its credit risk to counterparties. ISDA Master Agreements include provisions for general obligations, representations, collateral and events of default or termination. Under an ISDA Master Agreement, the Fund typically may offset with the counterparty certain OTC derivative financial instruments' payables and/or receivables with collateral held and/or posted and create one single net payment (close-out netting) in the event of default, termination and/or potential deterioration in the credit quality of the counterparty. Various Master Agreements govern the terms of certain transactions with counterparties, including transactions such as swap, forward, repurchase and reverse repurchase agreements. These Master Agreements typically attempt to reduce the counterparty risk associated with such transactions by specifying credit protection mechanisms and providing standardization that improves legal certainty. Cross-termination provisions under Master Agreements typically provide that a default in connection with one transaction between the Fund and a counterparty gives the non-defaulting party the right to terminate any other transactions in place with the defaulting party to create one single net payment due to/due from the defaulting party and may be a feature in certain Master Agreements. In the event the Fund exercises its right to terminate a Master Agreement after a counterparty experiences a termination event as defined in the Master Agreement, the return of collateral with market value in excess of the Fund's net liability may be delayed or denied.
33
Morgan Stanley Variable Investment Series
Notes to Financial Statements ◼ December 31, 2022 continued
The following table presents derivative financial instruments that are subject to enforceable netting arrangements as of December 31, 2022:
GROSS AMOUNTS NOT OFFSET IN THE STATEMENT OF ASSETS AND LIABILITIES | |||||||||||||||||||
COUNTERPARTY | GROSS LIABILITY DERIVATIVES PRESENTED IN THE STATEMENT OF ASSETS AND LIABILITIES | FINANCIAL INSTRUMENT | COLLATERAL PLEDGED | NET AMOUNT (NOT LESS THAN $0) | |||||||||||||||
| HSBC Bank PLC | $ | 20,043 | $ | — | $ | — | $ | 20,043 | |||||||||||
UBS AG | 15,714 | — | — | 15,714 | |||||||||||||||
Total | $ | 35,757 | $ | — | $ | — | $ | 35,757 | |||||||||||
For the year ended December 31, 2022, the average monthly amount outstanding for each derivative type is as follows:
Foreign Currency Forward Exchange Contracts:
Average monthly principal amount | $ | 351,017 | |||||
Futures Contracts:
Average monthly original value | $ | 24,259,319 | |||||
4. Advisory/Administration Agreements
Pursuant to an Investment Advisory Agreement with the Adviser, the Trust pays an advisory fee, accrued daily and payable monthly, by applying the following annual rates to the net assets of the Fund determined as of the close of each business day: 0.42% to the portion of the daily net assets not exceeding $500 million; 0.35% to the portion of the daily net assets exceeding $500 million but not exceeding $1.25 billion; and 0.22% to the portion of the daily net assets in excess of $1.25 billion. For the year ended December 31, 2022, the advisory fee rate (net of waiver/rebate) was equivalent to an annual effective rate of 0.15% of the Fund's average daily net assets.
The Adviser also serves as the Administrator to the Trust and provides administrative services pursuant to an Administration Agreement for an annual fee, accrued daily and paid monthly, of 0.08% of the Fund's average daily net assets.
The Fund's Adviser and Administrator have agreed to reduce its advisory fee, its administration fee and/or reimburse the Fund so that total annual operating expenses, excluding certain investment related expenses, taxes, interest and other extraordinary expenses (including litigation), will not exceed 0.75% with respect to Class X shares and 1.00% with respect to Class Y shares. The fee waivers and/or expense reimbursements
34
Morgan Stanley Variable Investment Series
Notes to Financial Statements ◼ December 31, 2022 continued
will continue for at least one year from the date of the Fund's prospectus or until such time that the Trustees act to discontinue all or a portion of such waivers and/or reimbursements when they deem such action is appropriate. The Adviser and Administrator may make additional voluntary fee waivers and/or expense reimbursements and may discontinue these voluntary fee waivers and/or expense reimbursements at any time in the future. For the year ended December 31, 2022, $150,539 of advisory fees were waived by the Adviser pursuant to this arrangement.
Under a Sub-Administration agreement between the Administrator and State Street Bank and Trust Company ("State Street"), State Street provides certain administrative services to the Trust. For such services, the Administrator pays State Street a portion of the fee the Administrator receives from the Fund.
5. Plan of Distribution
Shares of the Trust are distributed by Morgan Stanley Distribution, Inc. (the "Distributor"), an affiliate of the Adviser/Administrator. The Trust has adopted a Plan of Distribution (the "Plan") pursuant to Rule 12b-1 under the Act. Under the Plan, Class Y shares of the Fund bear a distribution fee which is accrued daily and paid monthly at the annual rate of 0.25% of the average daily net assets of the class.
6. Dividend Disbursing and Transfer/Co-Transfer Agent
The Trust's dividend disbursing and transfer agent is SS&C Global Investor & Distribution Solutions, Inc. ("SS&C GIDS, Inc."). Pursuant to a Transfer Agency Agreement, the Trust pays SS&C GIDS, Inc. a fee based on the number of classes, accounts and transactions relating to the Fund of the Trust.
Eaton Vance Management ("EVM"), an affiliate of Morgan Stanley, provides co-transfer agency and related services to the Fund pursuant to a Co-Transfer Agency Services Agreement. For the year ended December 31,2022, EVM earned $0 for providing such services.
7. Custodian Fees
State Street (the "Custodian") also serves as Custodian for the Trust in accordance with a Custodian Agreement. The Custodian holds cash, securities and other assets of the Trust as required by the Act. Custody fees are payable monthly based on assets held in custody, investment purchases and sales activity and account maintenance fees, plus reimbursement for certain out-of-pocket expenses.
8. Security Transactions and Transactions with Affiliates
The Fund's cost of purchases and proceeds from sales of investment securities, excluding short-term investments, for the year ended December 31, 2022, aggregated $47,305,433 and $53,541,720, respectively.
35
Morgan Stanley Variable Investment Series
Notes to Financial Statements ◼ December 31, 2022 continued
The Fund invests in the Institutional Class of the Morgan Stanley Institutional Liquidity Funds — Government Portfolio (the "Liquidity Funds"), an open-end management investment company managed by the Adviser. Advisory fees paid by the Fund are reduced by an amount equal to its pro-rata share of advisory and administrative fees paid by the Fund due to its investment in the Liquidity Funds. For the year ended December 31, 2022, advisory fees paid were reduced by $803 relating to the Fund's investment in the Liquidity Funds.
A summary of the Fund's transactions in shares of affiliated investments during the year ended December 31, 2022 is as follows:
| AFFILIATED INVESTMENT COMPANY | VALUE DECEMBER 31, 2021 | PURCHASES AT COST | PROCEEDS FROM SALES | DIVIDEND INCOME | REALIZED GAIN (LOSS) | CHANGE IN UNREALIZED APPRECIATION (DEPRECIATION) | VALUE DECEMBER 31, 2022 | ||||||||||||||||||||||||
| Liquidity Funds | $ | 612,012 | $ | 20,425,190 | $ | 20,501,539 | $ | 10,680 | $ | — | $ | — | $ | 535,663 | |||||||||||||||||
The Fund is permitted to purchase and sell securities ("cross-trade") from and to other Morgan Stanley funds as well as other funds and client accounts for which the Adviser or an affiliate of the Adviser serves as investment adviser, pursuant to procedures approved by the Trustees in compliance with Rule 17a-7 under the Act (the "Rule"). Each cross-trade is executed at the current market price in compliance with provisions of the Rule. For the year ended December 31, 2022, the Fund did not engage in any cross-trade transactions.
The Trust has an unfunded noncontributory defined benefit pension plan covering certain independent Trustees of the Trust who will have served as independent Trustees for at least five years at the time of retirement. Benefits under this plan are based on factors which include years of service and compensation. The Trustees voted to close the plan to new participants and eliminate the future benefits growth due to increases to compensation after July 31, 2003.
At December 31, 2022, the accrued pension liability reflected as "Trustees' fees" in the Statement of Assets and Liabilities for the Fund is $5,027.
The Trust has an unfunded Deferred Compensation Plan (the "Compensation Plan"), which allows each independent Trustee to defer payment of all, or a portion, of the fees he or she receives for serving on the Board of Trustees. Each eligible Trustee generally may elect to have the deferred amounts credited with a return equal to the total return on one or more of the Morgan Stanley funds that are offered as investment options under the Compensation Plan. Appreciation/depreciation and distributions received from these
36
Morgan Stanley Variable Investment Series
Notes to Financial Statements ◼ December 31, 2022 continued
investments are recorded with an offsetting increase/decrease in the deferred compensation obligation and do not affect the NAV of the Trust.
9. Federal Income Tax Status
It is the Fund's intention to continue to qualify as a regulated investment company and distribute all of its taxable and tax-exempt income. Accordingly, no provision for federal income taxes is required in the financial statements.
The Fund may be subject to taxes imposed by countries in which it invests. Such taxes are generally based on income and/or capital gains earned or repatriated. Taxes are accrued based on net investment income, net realized gains and net unrealized appreciation as such income and/or gains are earned. Taxes may also be based on transactions in foreign currency and are accrued based on the value of investments denominated in such currency.
FASB ASC 740-10, "Income Taxes — Overall", sets forth a minimum threshold for financial statement recognition of the benefit of a tax position taken or expected to be taken in a tax return. Management has concluded there are no significant uncertain tax positions that would require recognition in the financial statements. If applicable, the Fund recognizes interest accrued related to unrecognized tax benefits in "Interest Expense" and penalties in "Other Expenses" in the Statement of Operations. The Fund files tax returns with the U.S. Internal Revenue Service, New York and various states. Generally, each of the tax years in the four-year period ended December 31, 2022 remains subject to examination by taxing authorities.
The tax character of distributions paid may differ from the character of distributions shown for GAAP purposes due to short-term capital gains being treated as ordinary income for tax purposes. The tax character of distributions paid during fiscal years 2022 and 2021 was as follows:
2022 DISTRIBUTIONS PAID FROM: | 2021 DISTRIBUTIONS PAID FROM: | ||||||||||||||
| ORDINARY INCOME | LONG-TERM CAPITAL GAIN | ORDINARY INCOME | LONG-TERM CAPITAL GAIN | ||||||||||||
| $ | 930,980 | $ | 990,619 | $ | 4,529,993 | $ | 2,790,042 | ||||||||
The amount and character of income and gains to be distributed are determined in accordance with income tax regulations which may differ from GAAP. These book/tax differences are either considered temporary or permanent in nature.
Temporary differences are attributable to differing book and tax treatments for the timing of the recognition of gains (losses) on certain investment transactions and the timing of the deductibility of certain expenses.
37
Morgan Stanley Variable Investment Series
Notes to Financial Statements ◼ December 31, 2022 continued
The Fund had no permanent differences causing reclassifications among the components of net assets for the year ended December 31, 2022.
At December 31, 2022, the components of distributable earnings for the Fund on a tax basis were as follows:
| UNDISTRIBUTED ORDINARY INCOME | UNDISTRIBUTED LONG-TERM CAPITAL GAIN | ||||||
| $ | 1,670,027 | $ | — | ||||
At December 31, 2022, the Fund had available for federal income tax purposes unused short-term and long-term capital losses of $2,162,410 and $2,193,075, respectively, that do not have an expiration date.
To the extent that capital loss carryforwards are used to offset any future capital gains realized, no capital gains tax liability will be incurred by the Fund for gains realized and not distributed. To the extent that capital gains are offset, such gains will not be distributed to the shareholders.
10. Market Risk and Risks Relating to Certain Financial Instruments
Foreign security and currency transactions may involve certain considerations and risks not typically associated with those of U.S. dollar denominated transactions as a result of, among other factors, fluctuations of exchange rates in relation to the U.S. dollar, the possibility of lower levels of governmental supervision and regulation of foreign securities markets and the possibility of political or economic instability.
Social, political, economic and other conditions and events, such as war, natural disasters, health emergencies (e.g., epidemics and pandemics), terrorism, conflicts, social unrest, recessions, inflation, rapid interest rate changes and supply chain disruptions, may occur and could significantly impact issuers, industries, governments and other systems, including the financial markets. It is difficult to predict when events affecting the U.S. or global financial markets may occur, the effects that such events may have and the duration of those effects (which may last for extended periods). These events may negatively impact broad segments of businesses and populations and have a significant and rapid negative impact on the performance of the Fund's investments and exacerbate pre-existing risks to the Fund. For example, coronavirus ("COVID-19") and associated recovery responses could adversely impact the operations of the Fund and its service providers and financial performance of the Fund and the Fund's investments. The extent of such impact depends on future developments, including (i) the duration and spread of the outbreak, (ii) the restrictions and advisories, (iii) the effects on the financial markets, (iv) government and regulatory responses, and (v) the effects on the economy overall as a result of developments such as disruption to consumer demand, economic output and supply chains. The duration and extent of COVID-19 and
38
Morgan Stanley Variable Investment Series
Notes to Financial Statements ◼ December 31, 2022 continued
associated economic and market conditions and uncertainty over the long term cannot be reasonably estimated at this time. The ultimate impact of COVID-19 and the extent to which the associated conditions impact the Fund will also depend on future developments, which are highly uncertain, difficult to accurately predict and subject to change at any time. The financial performance of the Fund's investments (and, in turn, the Fund's investment results) may be adversely affected because of these and similar types of factors and developments.
11. Credit Facility
The Trust and other Morgan Stanley funds participated in a $300,000,000 committed, unsecured revolving line of credit facility (the "Facility") with State Street. This Facility is to be used for temporary emergency purposes or funding of shareholder redemption requests. The interest rate for any funds drawn will be based on the federal funds rate or overnight bank funding rate plus a spread. The Facility also has a commitment fee of 0.25% per annum based on the unused portion of the Facility, which is allocated among participating funds based on relative net assets. During the year ended December 31, 2022, the Fund did not have any borrowings under the Facility.
12. Other
At December 31, 2022, the Trust had record owners of 10% or greater. Investment activities of these shareholders could have a material impact on the Trust. The aggregate percentage of such owners was 95.6%.
13. Results of Special Meeting of Shareholders (unaudited)
On February 25, 2022, a special meeting of the Fund's shareholders was held for the purpose of voting on the following matter, the results of which were as follows:
Election of Trustees by all shareholders:
FOR | AGAINST | ||||||||||
Frances L. Cashman | 6,055,374 | 195,298 | |||||||||
Nancy C. Everett | 6,016,288 | 234,384 | |||||||||
Eddie A. Grier | 5,932,174 | 318,498 | |||||||||
Jakki L. Haussler | 6,016,288 | 234,384 | |||||||||
Patricia A. Maleski | 6,055,851 | 194,821 | |||||||||
39
Morgan Stanley Variable Investment Series - Income Plus Portfolio
Financial Highlights
| FOR THE YEAR ENDED DECEMBER 31 | NET ASSET VALUE BEGINNING OF PERIOD | NET INVESTMENT INCOME(1) | NET REALIZED AND UNREALIZED GAIN (LOSS) | TOTAL FROM INVESTMENT OPERATIONS | DIVIDENDS TO SHAREHOLDERS | DISTRIBUTIONS TO SHAREHOLDERS | TOTAL DIVIDENDS AND DISTRIBUTIONS | ||||||||||||||||||||||||
CLASS X SHARES | |||||||||||||||||||||||||||||||
2018 | $ | 11.51 | $ | 0.36 | $ | (0.82 | ) | $ | (0.46 | ) | $ | (0.38 | ) | $ | (0.24 | ) | $ | (0.62 | ) | ||||||||||||
2019 | 10.43 | 0.35 | 1.30 | 1.65 | (0.41 | ) | — | (0.41 | ) | ||||||||||||||||||||||
2020 | 11.67 | 0.27 | 0.94 | 1.21 | (0.40 | ) | (0.25 | ) | (0.65 | ) | |||||||||||||||||||||
2021 | 12.23 | 0.22 | (0.44 | ) | (0.22 | ) | (0.40 | ) | (0.83 | ) | (1.23 | ) | |||||||||||||||||||
2022 | 10.78 | 0.28 | (2.05 | ) | (1.77 | ) | (0.17 | ) | (0.17 | ) | (0.34 | ) | |||||||||||||||||||
CLASS Y SHARES | |||||||||||||||||||||||||||||||
2018 | 11.49 | 0.33 | (0.82 | ) | (0.49 | ) | (0.35 | ) | (0.24 | ) | (0.59 | ) | |||||||||||||||||||
2019 | 10.41 | 0.33 | 1.30 | 1.63 | (0.38 | ) | — | (0.38 | ) | ||||||||||||||||||||||
2020 | 11.66 | 0.24 | 0.93 | 1.17 | (0.37 | ) | (0.25 | ) | (0.62 | ) | |||||||||||||||||||||
2021 | 12.21 | 0.19 | (0.43 | ) | (0.24 | ) | (0.37 | ) | (0.83 | ) | (1.20 | ) | |||||||||||||||||||
2022 | 10.77 | 0.25 | (2.04 | ) | (1.79 | ) | (0.14 | ) | (0.17 | ) | (0.31 | ) | |||||||||||||||||||
(1) The per share amounts were computed using an average number of shares outstanding during the period.
(2) Amount is less than 0.005%.
(3) Calculated based on the net asset value as of the last business day of the period. Performance shown does not reflect fees and expenses imposed by your insurance company. If performance information included the effect of these additional charges, the total returns would be lower.
(4) The ratios reflect the rebate of certain Fund expenses in connection with investments in a Morgan Stanley affiliate during the period. The effect of the rebate on the ratios is disclosed in the above table as "Rebate from Morgan Stanley affiliate."
(5) If the Fund had borne all of its expenses that were waived by the Adviser/Administrator, the annualized expense and net investment income ratios would have been as follows:
PERIOD ENDED | EXPENSE RATIO | NET INVESTMENT INCOME RATIO | |||||||||
December 31, 2022 | |||||||||||
Class X | 1.02 | % | 2.72 | % | |||||||
Class Y | 1.27 | 2.47 | |||||||||
December 31, 2021 | |||||||||||
Class X | 0.88 | 1.88 | |||||||||
Class Y | 1.13 | 1.63 | |||||||||
See Notes to Financial Statements
40
| RATIO TO AVERAGE NET ASSETS | |||||||||||||||||||||||||||||||
| FOR THE YEAR ENDED DECEMBER 31 | NET ASSET VALUE END OF PERIOD | TOTAL RETURN(3) | NET ASSETS END OF PERIOD (000'S) | EXPENSES | NET INVESTMENT INCOME | REBATE FROM MORGAN STANLEY AFFILIATE | PORTFOLIO TURNOVER RATE | ||||||||||||||||||||||||
CLASS X SHARES | |||||||||||||||||||||||||||||||
2018 | $ | 10.43 | (4.01 | )% | $ | 38,430 | 0.78 | %(4) | 3.27 | %(4) | 0.00 | %(2) | 47 | % | |||||||||||||||||
2019 | 11.67 | 15.96 | 37,676 | 0.81 | (4) | 3.15 | (4) | 0.00 | (2) | 72 | |||||||||||||||||||||
2020 | 12.23 | 10.63 | 36,562 | 0.91 | (4) | 2.27 | (4) | 0.00 | (2) | 144 | |||||||||||||||||||||
2021 | 10.78 | (1.87 | ) | 31,376 | 0.81 | (4)(5) | 1.95 | (4)(5) | 0.00 | (2) | 107 | ||||||||||||||||||||
2022 | 8.67 | (16.47 | ) | 22,435 | 0.75 | (4)(5) | 2.99 | (4)(5) | 0.00 | (2) | 87 | ||||||||||||||||||||
CLASS Y SHARES | |||||||||||||||||||||||||||||||
2018 | 10.41 | (4.31 | ) | 38,832 | 1.03 | (4) | 3.02 | (4) | 0.00 | (2) | 47 | ||||||||||||||||||||
2019 | 11.66 | 15.78 | 41,004 | 1.06 | (4) | 2.90 | (4) | 0.00 | (2) | 72 | |||||||||||||||||||||
2020 | 12.21 | 10.27 | 39,867 | 1.16 | (4) | 2.02 | (4) | 0.00 | (2) | 144 | |||||||||||||||||||||
2021 | 10.77 | (2.04 | ) | 37,412 | 1.06 | (4)(5) | 1.70 | (4)(5) | 0.00 | (2) | 107 | ||||||||||||||||||||
2022 | 8.67 | (16.66 | ) | 27,553 | 1.00 | (4)(5) | 2.74 | (4)(5) | 0.00 | (2) | 87 | ||||||||||||||||||||
41
Morgan Stanley Variable Investment Series - Income Plus Portfolio
Report of Independent Registered Public Accounting Firm
To the Shareholders and Board of Trustees of
Morgan Stanley Income Plus Portfolio
Opinion on the Financial Statements
We have audited the accompanying statement of assets and liabilities of Morgan Stanley Variable Investment Series (the "Trust") (comprising, Income Plus Portfolio (the "Fund")), including the portfolio of investments, as of December 31, 2022, and the related statement of operations for the year then ended, the statements of changes in net assets for each of the two years in the period then ended, the financial highlights for each of the five years in the period then ended and the related notes (collectively referred to as the "financial statements"). In our opinion, the financial statements present fairly, in all material respects, the financial position of the Fund comprising Morgan Stanley Variable Investment Series at December 31, 2022, the results of its operations for the year then ended, the changes in its net assets for each of the two years in the period then ended and its financial highlights for each of the five years in the period then ended, in conformity with U.S. generally accepted accounting principles.
Basis for Opinion
These financial statements are the responsibility of the Trust's management. Our responsibility is to express an opinion on the Fund's financial statements based on our audits. We are a public accounting firm registered with the Public Company Accounting Oversight Board (United States) ("PCAOB") and are required to be independent with respect to the Trust in accordance with the U.S. federal securities laws and the applicable rules and regulations of the Securities and Exchange Commission and the PCAOB.
We conducted our audits in accordance with the standards of the PCAOB. Those standards require that we plan and perform the audit to obtain reasonable assurance about whether the financial statements are free of material misstatement, whether due to error or fraud. The Trust is not required to have, nor were we engaged to perform, an audit of the Trust's internal control over financial reporting. As part of our audits, we are required to obtain an understanding of internal control over financial reporting, but not for the purpose of expressing an opinion on the effectiveness of the Trust's internal control over financial reporting. Accordingly, we express no such opinion.
Our audits included performing procedures to assess the risks of material misstatement of the financial statements, whether due to error or fraud, and performing procedures that respond to those risks. Such procedures included examining, on a test basis, evidence regarding the amounts and disclosures in the financial statements. Our procedures included confirmation of securities owned as of December 31, 2022, by
42
Morgan Stanley Variable Investment Series - Income Plus Portfolio
Report of Independent Registered Public Accounting Firm continued
correspondence with the custodian, brokers and others; when replies were not received from brokers and others, we performed other auditing procedures. Our audits also included evaluating the accounting principles used and significant estimates made by management, as well as evaluating the overall presentation of the financial statements. We believe that our audits provide a reasonable basis for our opinion.

We have served as the auditor of one or more Morgan Stanley investment companies since 2000.
Boston, Massachusetts
February 22, 2023
43
Morgan Stanley Variable Investment Series - Income Plus Portfolio
Liquidity Risk Management Program (unaudited)
In compliance with Rule 22e-4 under the Investment Company Act of 1940, as amended (the "Liquidity Rule"), the Fund has adopted and implemented a liquidity risk management program (the "Program"), which is reasonably designed to assess and manage the risk that the Fund could not meet requests to redeem shares issued by the Fund without significant dilution of remaining investors' interests in the Fund (i.e., liquidity risk). The Fund's Board of Trustees (the "Board") previously approved the designation of the Liquidity Risk Subcommittee (the "LRS") as Program administrator. The LRS is comprised of representatives from various divisions within Morgan Stanley Investment Management.
At a meeting held on March 1-2, 2022, the Board reviewed a written report prepared by the LRS that addressed the Program's operation and assessed its adequacy, and effectiveness of implementation for the period from January 1, 2021, through December 31, 2021, as required under the Liquidity Rule. The report concluded that the Program operated effectively and was adequately and effectively implemented in all material aspects, and that the relevant controls and safeguards were appropriately designed to enable the LRS to administer the Program in compliance with the Liquidity Rule.
In accordance with the Program, the LRS assessed each Fund's liquidity risk no less frequently than annually taking into consideration certain factors, as applicable, such as (i) investment strategy and liquidity of portfolio investments, (ii) short-term and long-term cash flow projections and (iii) holdings of cash and cash equivalents and borrowing arrangements and other funding sources. Certain factors are considered under both normal and reasonably foreseeable stressed conditions.
Each Fund portfolio investment is classified into one of four liquidity categories, which classification is assessed at least monthly by the LRS. The classification is based on a determination of the number of days it is reasonably expected to take to convert the investment into cash, or sell or dispose of the investment, in current market conditions without significantly changing the market value of the investment. Liquidity classification determinations take into account various market, trading and investment-specific considerations, as well as market depth, and in some cases utilize third-party vendor data.
The Liquidity Rule limits a fund's investments in illiquid investments to 15% of its net assets and requires funds that do not primarily hold assets that are highly liquid investments to determine and maintain a minimum percentage of the fund's net assets to be invested in highly liquid investments (highly liquid investment minimum or "HLIM"). The LRS believes that the Program includes provisions reasonably designed to review, monitor and comply with the 15% limit on illiquid investments and for determining, periodically reviewing and complying with the HLIM requirement, as applicable.
There can be no assurance that the Program will achieve its objectives under all circumstances in the future. Please refer to the Fund's prospectus for more information regarding the Fund's exposure to liquidity risk and other risks to which it may be subject.
44
Morgan Stanley Variable Investment Series
Trustee and Officer Information (unaudited)
Independent Trustees:
| Name, Address and Birth Year of Independent Trustee | Position(s) Held with Registrant | Length of Time Served* | Principal Occupation(s) During Past 5 Years and Other Relevant Professional Experience | Number of Funds in Fund Complex Overseen by Independent Trustee** | Other Directorships Held by Independent Trustee During Past 5 Years*** | ||||||||||||||||||
| Frank L. Bowman c/o Perkins Coie LLP Counsel to the Independent Trustees 1155 Avenue of the Americas 22nd Floor New York, NY 10036 Birth Year: 1944 | Trustee | Since August 2006 | President, Strategic Decisions, LLC (consulting) (since February 2009); Director or Trustee of various Morgan Stanley Funds (since August 2006); Chairperson of the Compliance and Insurance Committee (since October 2015); formerly, Chairperson of the Insurance Sub-Committee of the Compliance and Insurance Committee (2007-2015); served as President and Chief Executive Officer of the Nuclear Energy Institute (policy organization) (February 2005-November 2008); retired as Admiral, U.S. Navy after serving over 38 years on active duty including 8 years as Director of the Naval Nuclear Propulsion Program in the Department of the Navy and the U.S. Department of Energy (1996-2004); served as Chief of Naval Personnel (July 1994-September 1996) and on the Joint Staff as Director of Political Military Affairs (June 1992-July 1994); knighted as Honorary Knight Commander of the Most Excellent Order of the British Empire; awarded the Officier de l'Orde National du Mèrite by the French Government; elected to the National Academy of Engineering (2009). | 85 | Director of Naval and Nuclear Technologies LLP; Director Emeritus of the Armed Services YMCA; Member of the National Security Advisory Council of the Center for U.S. Global Engagement and a former member of the CNA Military Advisory Board; Chairman of Fairhaven United Methodist Church Board of Trustees; Member of the Board of Advisors of the Dolphin Scholarship Foundation; Director of other various nonprofit organizations; formerly, Director of BP, plc (November 2010-May 2019). | ||||||||||||||||||
| Frances L. Cashman c/o Perkins Coie LLP Counsel to the Independent Trustees 1155 Avenue of the Americas 22nd Floor New York, NY 10036 Birth Year: 1961 | Trustee | Trustee Since February 2022 | Chief Executive Officer, Asset Management Division, Director or Trustee of various Morgan Stanley Funds (since February 2022); Delinian Ltd. (financial information) (May 2021-Present); Executive Vice President and various other roles, Legg Mason & Co. (asset management) (2010-2020); Managing Director, Stifel Nicolaus (2005-2010). | 86 | Trustee and Investment Committee Member, GeorgiaTech Foundation (since June 2019); Trustee and Chair of Marketing Committee, Member of Investment Committee, Loyola Blakefield (Since September 2017); Trustee, MMI Gateway Foundation (since September 2017); Director and Investment Committee Member, Catholic Community Foundation Board (2012-2018); Director and Investment Committee Member, St. Ignatius Loyola Academy (2011-2017). | ||||||||||||||||||
45
Morgan Stanley Variable Investment Series
Trustee and Officer Information (unaudited) continued
| Name, Address and Birth Year of Independent Trustee | Position(s) Held with Registrant | Length of Time Served* | Principal Occupation(s) During Past 5 Years and Other Relevant Professional Experience | Number of Funds in Fund Complex Overseen by Independent Trustee** | Other Directorships Held by Independent Trustee During Past 5 Years*** | ||||||||||||||||||
| Kathleen A. Dennis c/o Perkins Coie LLP Counsel to the Independent Trustees 1155 Avenue of the Americas 22nd Floor New York, NY 10036 Birth Year: 1953 | Trustee | Since August 2006 | Chairperson of the Governance Committee (since January 2021), Chairperson of the Liquidity and Alternatives Sub-Committee of the Investment Committee (2006-2020) and Director or Trustee of various Morgan Stanley Funds (since August 2006); President, Cedarwood Associates (mutual fund and investment management consulting) (since July 2006); formerly, Senior Managing Director of Victory Capital Management (1993-2006). | 85 | Board Member, University of Albany Foundation (2012-present); Board Member, Mutual Funds Directors Forum (2014-present); Director of various non-profit organizations. | ||||||||||||||||||
| Nancy C. Everett c/o Perkins Coie LLP Counsel to the Independent Trustees 1155 Avenue of the Americas 22nd Floor New York, NY 10036 Birth Year: 1955 | Trustee | Since January 2015 | Chairperson of the Equity Investment Committee (since January 2021); Director or Trustee of various Morgan Stanley Funds (since January 2015); Chief Executive Officer, Virginia Commonwealth University Investment Company (since November 2015); Owner, OBIR, LLC (institutional investment management consulting) (since June 2014); formerly, Managing Director, BlackRock, Inc. (February 2011-December 2013) and Chief Executive Officer, General Motors Asset Management (a/k/a Promark Global Advisors, Inc.) (June 2005-May 2010). | 86 | Formerly, Member of Virginia Commonwealth University School of Business Foundation (2005-2016); Member of Virginia Commonwealth University Board of Visitors (2013-2015); Member of Committee on Directors for Emerging Markets Growth Fund, Inc. (2007-2010); Chairperson of Performance Equity Management, LLC (2006-2010); and Chairperson, GMAM Absolute Return Strategies Fund, LLC (2006-2010). | ||||||||||||||||||
46
Morgan Stanley Variable Investment Series
Trustee and Officer Information (unaudited) continued
| Name, Address and Birth Year of Independent Trustee | Position(s) Held with Registrant | Length of Time Served* | Principal Occupation(s) During Past 5 Years and Other Relevant Professional Experience | Number of Funds in Fund Complex Overseen by Independent Trustee** | Other Directorships Held by Independent Trustee During Past 5 Years*** | ||||||||||||||||||
| Eddie A. Grier c/o Perkins Coie LLP Counsel to the Independent Trustees 1155 Avenue of the Americas 22nd Floor New York, NY 10036 Birth Year: 1955 | Trustee | Trustee Since February 2022 | Dean, Santa Clara University Leavey School of Business (since July 2021); Director or Trustee of various Morgan Stanley Funds (since February 2022); Dean, Virginia Commonwealth University School of Business (2010-2021); President and various other roles, Walt Disney Company (entertainment and media) (1981-2010). | 86 | Director, Witt/Keiffer, Inc. (executive search) (since 2016); Director, NuStar GP, LLC (energy) (since August 2021); Director, Sonida Senior Living, Inc. (residential community operator) (2016-2021); Director, NVR, Inc. (homebuilding) (2013-2020); Director, Middleburg Trust Company (wealth management) (2014-2019); Director, Colonial Williamsburg Company (2012-2021); Regent, University of Massachusetts Global (since 2021); Director and Chair, ChildFund International (2012-2021); Trustee, Brandman University (2010-2021); Director, Richmond Forum (2012-2019). | ||||||||||||||||||
| Jakki L. Haussler c/o Perkins Coie LLP Counsel to the Independent Trustees 1155 Avenue of the Americas 22nd Floor New York, NY 10036 Birth Year: 1957 | Trustee | Since January 2015 | Chairperson of the Audit Committee (January 2023), Director or Trustee of various Morgan Stanley Funds (since January 2015); Chairman, Opus Capital Group (since 1996); formerly, Chief Executive Officer, Opus Capital Group (1996-2019); Director, Capvest Venture Fund, LP (May 2000-December 2011); Partner, Adena Ventures, LP (July 1999-December 2010); Director, The Victory Funds (February 2005-July 2008). | 86 | Director, Barnes Group Inc. (since July 2021); Vertiv Holdings Co. (VRT) (August 2022); Director of Cincinnati Bell Inc. and Member, Audit Committee and Chairman, Governance and Nominating Committee (2008-2021); Director of Service Corporation International and Member, Audit Committee and Investment Committee; Director of Northern Kentucky University Foundation and Member, Investment Committee; Member of Chase College of Law Center for Law and Entrepreneurship Director of Best Transport (2005-2019); Director of Chase College of Law Board of Visitors; formerly, Member, University of Cincinnati Foundation Investment Committee; Member, Miami University Board of Visitors (2008-2011); Trustee of Victory Funds (2005-2008) and Chairman, Investment Committee (2007-2008) and Member, Service Provider Committee (2005-2008). | ||||||||||||||||||
47
Morgan Stanley Variable Investment Series
Trustee and Officer Information (unaudited) continued
| Name, Address and Birth Year of Independent Trustee | Position(s) Held with Registrant | Length of Time Served* | Principal Occupation(s) During Past 5 Years and Other Relevant Professional Experience | Number of Funds in Fund Complex Overseen by Independent Trustee** | Other Directorships Held by Independent Trustee During Past 5 Years*** | ||||||||||||||||||
| Dr. Manuel H. Johnson c/o Johnson Smick International, Inc. 220 I Street, NE Suite 200 Washington, D.C. 20002 Birth Year: 1949 | Trustee | Since July 1991 | Senior Partner, Johnson Smick International, Inc. (consulting firm); Chairperson of the Fixed Income, Liquidity and Alternatives Investment Committee (since January 2021), Chairperson of the Investment Committee (2006-2020) and Director or Trustee of various Morgan Stanley Funds (since July 1991); Co-Chairman and a founder of the Group of Seven Council (G7C) (international economic commission); formerly, Chairperson of the Audit Committee (July 1991-September 2006); Vice Chairman of the Board of Governors of the Federal Reserve System and Assistant Secretary of the U.S. Treasury. | 85 | Director of NVR, Inc. (home construction). | ||||||||||||||||||
| Joseph J. Kearns c/o Perkins Coie LLP Counsel to the Independent Trustees 1155 Avenue of the Americas 22nd Floor New York, NY 10036 Birth Year: 1942 | Trustee | Since August 1994 | Senior Adviser, Kearns & Associates LLC (investment consulting); Chairperson of the Audit Committee of various Morgan Stanley Funds (August 1994-December 2022), and Director or Trustee of various Morgan Stanley Funds (since August 1994); formerly, Deputy Chairperson of the Audit Committee (July 2003-September 2006); CFO of the J. Paul Getty Trust (1982-1999). | 86 | Director, Rubicon Investments (since February 2019); Prior to August 2016, Director of Electro Rent Corporation (equipment leasing); Prior to December 31, 2013, Director of The Ford Family Foundation. | ||||||||||||||||||
48
Morgan Stanley Variable Investment Series
Trustee and Officer Information (unaudited) continued
| Name, Address and Birth Year of Independent Trustee | Position(s) Held with Registrant | Length of Time Served* | Principal Occupation(s) During Past 5 Years and Other Relevant Professional Experience | Number of Funds in Fund Complex Overseen by Independent Trustee** | Other Directorships Held by Independent Trustee During Past 5 Years*** | ||||||||||||||||||
| Michael F. Klein c/o Perkins Coie LLP Counsel to the Independent Trustees 1155 Avenue of the Americas 22nd Floor New York, NY 10036 Birth Year: 1958 | Trustee | Since August 2006 | Chairperson of the Risk Committee (since January 2021); Managing Director, Aetos Alternatives Management, LP (since March 2000); Co-President, Aetos Alternatives Management, LP (since January 2004) and Co-Chief Executive Officer of Aetos Alternatives Management, LP (since August 2013); Chairperson of the Fixed Income Sub-Committee of the Investment Committee (2006-2020) and Director or Trustee of various Morgan Stanley Funds (since August 2006); formerly, Managing Director, Morgan Stanley & Co. Inc. and Morgan Stanley Dean Witter Investment Management and President, various Morgan Stanley Funds (June 1998-March 2000); Principal, Morgan Stanley & Co. Inc. and Morgan Stanley Dean Witter Investment Management (August 1997-December 1999). | 85 | Director of certain investment funds managed or sponsored by Aetos Alternatives Management, LP; Director of Sanitized AG and Sanitized Marketing AG (specialty chemicals). | ||||||||||||||||||
| Patricia A. Maleski c/o Perkins Coie LLP Counsel to the Independent Trustees 1155 Avenue of the Americas 22nd Floor New York, NY 10036 Birth Year: 1960 | Trustee | Since January 2017 | Director or Trustee of various Morgan Stanley Funds (since January 2017); Managing Director, JPMorgan Asset Management (2004-2016); Oversight and Control Head of Fiduciary and Conflicts of Interest Program (2015-2016); Chief Control Officer — Global Asset Management (2013-2015); President, JPMorgan Funds (2010-2013); Chief Administrative Officer (2004-2013); various other positions including Treasurer and Board Liaison (since 2001). | 86 | Trustee (since January 2022) and Treasurer (since January 2023), Nutley Family Service Bureau, Inc. | ||||||||||||||||||
49
Morgan Stanley Variable Investment Series
Trustee and Officer Information (unaudited) continued
| Name, Address and Birth Year of Independent Trustee | Position(s) Held with Registrant | Length of Time Served* | Principal Occupation(s) During Past 5 Years and Other Relevant Professional Experience | Number of Funds in Fund Complex Overseen by Independent Trustee** | Other Directorships Held by Independent Trustee During Past 5 Years*** | ||||||||||||||||||
| W. Allen Reed c/o Perkins Coie LLP Counsel to the Independent Trustees 1155 Avenue of the Americas 22nd Floor New York, NY 10036 Birth Year: 1947 | Chair of the Board and Trustee | Chair of the Board since August 2020 and Trustee since August 2006 | Chair of the Boards of various Morgan Stanley Funds (since August 2020); Director or Trustee of various Morgan Stanley Funds (since August 2006); formerly, Vice Chair of the Boards of various Morgan Stanley Funds (January 2020-August 2020); President and Chief Executive Officer of General Motors Asset Management; Chairman and Chief Executive Officer of the GM Trust Bank and Corporate Vice President of General Motors Corporation (August 1994-December 2005). | 85 | Formerly, Director of Legg Mason, Inc. (2006-2019); and Director of the Auburn University Foundation (2010-2015). | ||||||||||||||||||
* This is the earliest date the Trustee began serving the Morgan Stanley Funds. Each Trustee serves an indefinite term, until his or her successor is elected.
** The Fund Complex includes (as of December 31, 2022) all open-end and closed-end funds (including all of their portfolios) advised by Morgan Stanley Investment Management Inc. (the "Adviser") and any funds that have an adviser that is an affiliated person of the Adviser (including, but not limited to, Morgan Stanley AIP GP LP).
*** This includes any directorships at public companies and registered investment companies held by the Trustee at any time during the past five years.
50
Morgan Stanley Variable Investment Series
Trustee and Officer Information (unaudited) continued
Executive Officers:
| Name, Address and Birth Year of Executive Officer | Position(s) Held with Registrant | Length of Time Served* | Principal Occupation(s) During Past 5 Years | ||||||||||||
| John H. Gernon 522 Fifth Avenue New York, NY 10036 Birth Year: 1963 | President and Principal Executive Officer | Since September 2013 | President and Principal Executive Officer of the Equity and Fixed Income Funds and the Morgan Stanley AIP Funds (since September 2013) and the Liquidity Funds and various money market funds (since May 2014) in the Fund Complex; Managing Director of the Adviser. | ||||||||||||
| Deidre A. Downes 1633 Broadway New York, NY 10019 Birth Year: 1977 | Chief Compliance Officer | Since November 2021 | Executive Director of the Adviser (since January 2021) and Chief Compliance Officer of various Morgan Stanley Funds (since November 2021). Formerly, Vice President and Corporate Counsel at PGIM and Prudential Financial (October 2016-December 2020). | ||||||||||||
| Francis J. Smith 522 Fifth Avenue New York, NY 10036 Birth Year: 1965 | Treasurer and Principal Financial Officer | Treasurer since July 2003 and Principal Financial Officer since September 2002 | Managing Director of the Adviser and various entities affiliated with the Adviser; Treasurer (since July 2003) and Principal Financial Officer of various Morgan Stanley Funds (since September 2002). | ||||||||||||
| Mary E. Mullin 1633 Broadway New York, NY 10019 Birth Year: 1967 | Secretary | Since June 1999 | Managing Director of the Adviser; Secretary of various Morgan Stanley Funds (since June 1999). | ||||||||||||
| Michael J. Key 522 Fifth Avenue New York, NY 10036 Birth Year: 1979 | Vice President | Since June 2017 | Vice President of the Equity and Fixed Income Funds, Liquidity Funds, various money market funds and the Morgan Stanley AIP Funds in the Fund Complex (since June 2017); Managing Director of the Adviser; Head of Product Development for Equity and Fixed Income Funds (since August 2013). | ||||||||||||
The Fund's statement of additional information includes further information about the Fund's Trustees and Officers, and is available without charge by visiting www.morganstanley.com/im/shareholderreports or upon request by calling 1 (800) 869-6397.
* This is the earliest date the officer began serving the Morgan Stanley Funds. Each officer serves an indefinite term, until his or her successor is elected.
51
Morgan Stanley Variable Investment Series - Income Plus Portfolio
Federal Tax Notice ◼ December 31, 2022 (unaudited)
For federal income tax purposes, the following information is furnished with respect to the distributions paid by the Fund during its taxable year ended December 31, 2022.
The Fund designated and paid $990,619 as a long-term capital gain distribution.
In January, the Fund provides tax information to shareholders for the preceding calendar year.
52
Trustees | |||||||
| Frank L. Bowman | Dr. Manuel H. Johnson | ||||||
| Frances L. Cashman | Joseph J. Kearns | ||||||
| Kathleen A. Dennis | Michael F. Klein | ||||||
| Nancy C. Everett | Patricia A. Maleski | ||||||
| Eddie A. Grier | W. Allen Reed | ||||||
| Jakki L. Haussler | Chair of the Board | ||||||
Officers
John H. Gernon
President and Principal Executive Officer
Deidre A. Downes
Chief Compliance Officer
Francis J. Smith
Treasurer and Principal Financial Officer
Mary E. Mullin
Secretary
Michael J. Key
Vice President
| Transfer Agent | Custodian | ||||||
| SS&C Global Investor & Distribution Solutions, Inc. 2000 Crown Colony Drive Quincy, Massachusetts 02169 | State Street Bank and Trust Company One Lincoln Street Boston, Massachusetts 02111 | ||||||
| Independent Registered Public Accounting Firm | Legal Counsel | ||||||
| Ernst & Young LLP 200 Clarendon Street Boston, Massachusetts 02116 | Dechert LLP 1095 Avenue of the Americas New York, New York 10036 | ||||||
| Counsel to the Independent Trustees | Adviser and Administrator | ||||||
| Perkins Coie LLP 1155 Avenue of the Americas, 22nd Floor New York, New York 10036 | Morgan Stanley Investment Management Inc. 522 Fifth Avenue New York, New York 10036 | ||||||
Co-Transfer Agent | |||||||
Eaton Vance Management
Two International Place
Boston, Massachusetts 02110
This report is submitted for the general information of shareholders of the Trust. For more detailed information about the Trust, its fees and expenses and other pertinent information, please read its Prospectus. The Trust's Statement of Additional Information contains additional information about the Trust, including its trustees. It is available without charge, by calling 1 (800) 869-6397.
This report is not authorized for distribution to prospective investors in the Trust unless preceded or accompanied by an effective Prospectus. Read the Prospectus carefully before investing.
Morgan Stanley Distribution, Inc., member FINRA.
#40113A
VARINANN
5444849 EXP 02.29.24
Item 2. Code of Ethics.
(a) The registrant has adopted a code of ethics (the “Code of Ethics”) that applies to its principal executive officer, principal financial officer, principal accounting officer or controller, or persons performing similar functions, regardless of whether these individuals are employed by the registrant or a third party.
(b) No information need be disclosed pursuant to this paragraph.
(c) Not applicable.
(d) Not applicable.
(e) Not applicable.
(f)
(1) The registrant’s Code of Ethics is attached hereto as Exhibit 13 A.
(2) Not applicable.
(3) Not applicable.
Item 3. Audit Committee Financial Expert.
The registrant’s Board of Trustees has determined that Jakki L. Haussler, an “independent” Trustee, is an “audit committee financial expert” serving on its audit committee. Under applicable securities laws, a person who is determined to be an audit committee financial expert will not be deemed an “expert” for any purpose, including without limitation for the purposes of Section 11 of the Securities Act of 1933, as a result of being designated or identified as an audit committee financial expert. The designation or identification of a person as an audit committee financial expert does not impose on such person any duties, obligations, or liabilities that are greater than the duties, obligations, and liabilities imposed on such person as a member of the audit committee and Board of Trustees in the absence of such designation or identification.
Item 4. Principal Accountant Fees and Services.
(a)(b)(c)(d) and (g). Based on fees billed for the periods shown:
| 2022 | ||||||||
| Registrant | Covered Entities(1) | |||||||
| Audit Fees | $ | 64,680 | N/A | |||||
| Non-Audit Fees | ||||||||
| Audit-Related Fees | $ | — | (2) | $ | — | (2) | ||
| Tax Fees | $ | — | (3) | $ | — | (4) | ||
| All Other Fees | $ | — | $ | 5,778,872 | (5) | |||
| Total Non-Audit Fees | $ | — | $ | 5,778,872 | ||||
| Total | $ | 64,680 | $ | 5,778,872 | ||||
| 2021 | ||||||||
| Registrant | Covered Entities(1) | |||||||
| Audit Fees | $ | 61,019 | N/A | |||||
| Non-Audit Fees | ||||||||
| Audit-Related Fees | $ | — | (2) | $ | — | (2) | ||
| Tax Fees | $ | — | (3) | $ | — | (4) | ||
| All Other Fees | $ | — | $ | 26,678,468 | (5) | |||
| Total Non-Audit Fees | $ | — | $ | 26,678,468 | ||||
| Total | $ | 61,019 | $ | 26,678,468 | ||||
N/A- Not applicable, as not required by Item 4.
| (1) | Covered Entities include the Adviser (excluding sub-advisors) and any entity controlling, controlled by or under common control with the Adviser that provides ongoing services to the Registrant. |
| (2) | Audit-Related Fees represent assurance and related services provided that are reasonably related to the performance of the audit of the financial statements of the Covered Entities’ and funds advised by the Adviser or its affiliates, specifically data verification and agreed-upon procedures related to asset securitizations and agreed-upon procedures engagements. |
| (3) | Tax Fees represent tax compliance, tax planning and tax advice services provided in connection with the preparation and review of the Registrant’s tax returns. |
| (4) | Tax Fees represent tax compliance, tax planning and tax advice services provided in connection with the review of Covered Entities’ tax returns. |
| (5) | The fees included under “All Other Fees” are for services provided by Ernst & Young LLP related to surprise examinations for certain investment accounts to satisfy SEC Custody Rules and consulting services related to merger integration for sister entity to the Adviser. |
(e)(1) The audit committee’s pre-approval policies and procedures are as follows:
AUDIT COMMITTEE
AUDIT AND NON-AUDIT SERVICES
PRE-APPROVAL POLICY AND PROCEDURES
OF THE
MORGAN STANLEY FUNDS
AS ADOPTED AND AMENDED JULY 23, 2004 AND JUNE 12 AND 13, 20193
| 1. | Statement of Principles |
The Audit Committee of the Board is required to review and, in its sole discretion, pre-approve all Covered Services to be provided by the Independent Auditors to the Fund and Covered Entities in order to assure that services performed by the Independent Auditors do not impair the auditor’s independence from the Fund.
The SEC has issued rules specifying the types of services that an independent auditor may not provide to its audit client, as well as the audit committee’s administration of the engagement of the independent auditor. The SEC’s rules establish two different approaches to pre-approving services, which the SEC considers to be equally valid. Proposed services either: may be pre-approved without consideration of specific case-by-case services by the Audit Committee (“general pre-approval”); or require the specific pre-approval of the Audit Committee or its delegate (“specific pre-approval”). The Audit Committee believes that the combination of these two approaches in this Policy will result in an effective and efficient procedure to pre-approve services performed by the Independent Auditors. As set forth in this Policy, unless a type of service has received general pre-approval, it will require specific pre-approval by the Audit Committee (or by any member of the Audit Committee to which pre-approval authority has been delegated) if it is to be provided by the Independent Auditors. Any proposed services exceeding pre-approved cost levels or budgeted amounts will also require specific pre-approval by the Audit Committee.
The appendices to this Policy describe the Audit, Audit-related, Tax and All Other services that have the general pre-approval of the Audit Committee. The term of any general pre-approval is 12 months from the date of pre-approval, unless the Audit Committee considers and provides a different period and states otherwise. The Audit Committee will annually review and pre-approve the services that may be provided by the Independent Auditors without obtaining specific pre-approval from the Audit Committee. The Audit Committee will add to or subtract from the list of general pre-approved services from time to time, based on subsequent determinations.
The purpose of this Policy is to set forth the policy and procedures by which the Audit Committee intends to fulfill its responsibilities. It does not delegate the Audit Committee’s responsibilities to pre-approve services performed by the Independent Auditors to management.
The Fund’s Independent Auditors have reviewed this Policy and believes that implementation of the Policy will not adversely affect the Independent Auditors’ independence.
3 This Audit Committee Audit and Non-Audit Services Pre-Approval Policy and Procedures (the “Policy”), adopted as of the date above, supersedes and replaces all prior versions that may have been adopted from time to time.
| 2. | Delegation |
As provided in the Act and the SEC’s rules, the Audit Committee may delegate either type of pre-approval authority to one or more of its members. The member to whom such authority is delegated must report, for informational purposes only, any pre-approval decisions to the Audit Committee at its next scheduled meeting.
| 3. | Audit Services |
The annual Audit services engagement terms and fees are subject to the specific pre-approval of the Audit Committee. Audit services include the annual financial statement audit and other procedures required to be performed by the Independent Auditors to be able to form an opinion on the Fund’s financial statements. These other procedures include information systems and procedural reviews and testing performed in order to understand and place reliance on the systems of internal control, and consultations relating to the audit. The Audit Committee will approve, if necessary, any changes in terms, conditions and fees resulting from changes in audit scope, Fund structure or other items.
In addition to the annual Audit services engagement approved by the Audit Committee, the Audit Committee may grant general pre-approval to other Audit services, which are those services that only the Independent Auditors reasonably can provide. Other Audit services may include statutory audits and services associated with SEC registration statements (on Forms N-1A, N-2, N-3, N-4, etc.), periodic reports and other documents filed with the SEC or other documents issued in connection with securities offerings.
The Audit Committee has pre-approved the Audit services in Appendix A. All other Audit services not listed in Appendix A must be specifically pre-approved by the Audit Committee (or by any member of the Audit Committee to which pre-approval has been delegated).
| 4. | Audit-related Services |
Audit-related services are assurance and related services that are reasonably related to the performance of the audit or review of the Fund’s financial statements and, to the extent they are Covered Services, the Covered Entities or that are traditionally performed by the Independent Auditors. Because the Audit Committee believes that the provision of Audit-related services does not impair the independence of the auditor and is consistent with the SEC’s rules on auditor independence, the Audit Committee may grant general pre-approval to Audit-related services. Audit-related services include, among others, accounting consultations related to accounting, financial reporting or disclosure matters not classified as “Audit services”; assistance with understanding and implementing new accounting and financial reporting guidance from rulemaking authorities; agreed-upon or expanded audit procedures related to accounting and/or billing records required to respond to or comply with financial, accounting or regulatory reporting matters; and assistance with internal control reporting requirements under Forms N-CEN and/or N-CSR.
The Audit Committee has pre-approved the Audit-related services in Appendix A. All other Audit-related services not listed in Appendix A must be specifically pre-approved by the Audit Committee (or by any member of the Audit Committee to which pre-approval has been delegated).
| 5. | Tax Services |
The Audit Committee believes that the Independent Auditors can provide Tax services to the Fund and, to the extent they are Covered Services, the Covered Entities, such as tax compliance, tax planning and tax advice without impairing the auditor’s independence, and the SEC has stated that the Independent Auditors may provide such services.
Pursuant to the preceding paragraph, the Audit Committee has pre-approved the Tax Services in Appendix A. All Tax services in Appendix A must be specifically pre-approved by the Audit Committee (or by any member of the Audit Committee to which pre-approval has been delegated).
| 6. | All Other Services |
The Audit Committee believes, based on the SEC’s rules prohibiting the Independent Auditors from providing specific non-audit services, that other types of non-audit services are permitted. Accordingly, the Audit Committee believes it may grant general pre-approval to those permissible non-audit services classified as All Other services that it believes are routine and recurring services, would not impair the independence of the auditor and are consistent with the SEC’s rules on auditor independence.
The Audit Committee has pre-approved the All Other services in Appendix A. Permissible All Other services not listed in Appendix A must be specifically pre-approved by the Audit Committee (or by any member of the Audit Committee to which pre-approval has been delegated).
| 7. | Pre-Approval Fee Levels or Budgeted Amounts |
Pre-approval fee levels or budgeted amounts for all services to be provided by the Independent Auditors will be established annually by the Audit Committee. Any proposed services exceeding these levels or amounts will require specific pre-approval by the Audit Committee. The Audit Committee is mindful of the overall relationship of fees for audit and non-audit services in determining whether to pre-approve any such services.
| 8. | Procedures |
All requests or applications for services to be provided by the Independent Auditors that do not require specific approval by the Audit Committee will be submitted to the Fund’s Principal Financial and Accounting Officer and must include a detailed description of the services to be rendered. The Fund’s Principal Financial and Accounting Officer will determine whether such services are included within the list of services that have received the general pre-approval of the Audit Committee. The Audit Committee will be informed on a timely basis of any such services rendered by the Independent Auditors. Requests or applications to provide services that require specific approval by the Audit Committee or Chairperson of the Audit Committee will be submitted to the Audit Committee by the Fund’s Principal Financial and Accounting Officer, who, after consultation with the Independent Auditors, will discuss whether the request or application is consistent with the SEC’s rules on auditor independence.
The Audit Committee has designated the Fund’s Principal Financial and Accounting Officer to monitor the performance of all services provided by the Independent Auditors and to determine whether such services are in compliance with this Policy. The Fund’s Principal Financial and Accounting Officer will report to the Audit Committee on a periodic basis on the results of its monitoring. Both the Fund’s Principal Financial and Accounting Officer and management will immediately report to the Chairperson of the Audit Committee any breach of this Policy that comes to the attention of the Fund’s Principal Financial and Accounting Officer or any member of management.
| 9. | Additional Requirements |
The Audit Committee has determined to take additional measures on an annual basis to meet its responsibility to oversee the work of the Independent Auditors and to assure the auditor’s independence from the Fund, such as reviewing a formal written statement from the Independent Auditors delineating all relationships between the Independent Auditors and the Fund, consistent with the PCAOB’s Ethics and Independence Rule 3526, and discussing with the Independent Auditors its methods and procedures for ensuring independence.
| 10. | Covered Entities |
Covered Entities include the Fund’s investment adviser(s) and any entity controlling, controlled by or under common control with the Fund’s investment adviser(s) that provides ongoing services to the Fund(s). Beginning with non-audit service contracts entered into on or after May 6, 2003, the Fund’s audit committee must pre-approve non-audit services provided not only to the Fund but also to the Covered Entities if the engagements relate directly to the operations and financial reporting of the Fund. This list of Covered Entities would include:
Morgan Stanley Funds
Morgan Stanley & Co. LLC
Morgan Stanley Investment Management Inc.
Morgan Stanley Investment Management Limited
Morgan Stanley Investment Management Private Limited
Morgan Stanley Asset & Investment Trust Management Co., Limited
Morgan Stanley Investment Management Company
Morgan Stanley Services Company, Inc.
Morgan Stanley Distribution, Inc.
Morgan Stanley AIP GP LP
Morgan Stanley Alternative Investment Partners LP
Morgan Stanley Smith Barney LLC
Morgan Stanley Capital Management LLC
Morgan Stanley Asia Limited
Morgan Stanley Services Group
(e)(2) Beginning with non-audit service contracts entered into on or after May 6, 2003, the audit committee also is required to pre-approve services to Covered Entities to the extent that the services are determined to have a direct impact on the operations or financial reporting of the Registrant. 100% of such services were pre-approved by the audit committee pursuant to the Audit Committee’s pre-approval policies and procedures (attached hereto).
(f) Not applicable.
(g) See table above.
(h) The audit committee of the Board of Trustees has considered whether the provision of services other than audit services performed by the auditors to the Registrant and Covered Entities is compatible with maintaining the auditors’ independence in performing audit services.
APPENDIX A
Pre-Approved Audit Services
| Service Range of Fees | ||
| The Fund(s) | Covered Entities | |
Statutory audits or financial audits for the Funds
|
For a complete list of fees, please contact the legal department **
|
N/A |
Services associated with SEC registration statements (including new fund filings/seed audits), periodic reports and other documents filed with the SEC or other documents issued in connection with securities offerings (e.g., comfort letters for closed-end fund offerings, consents), and assistance in responding to SEC comment letters
|
*
|
* |
Consultations by the Fund’s management as to the accounting or disclosure treatment of transactions or events and/or the actual or potential impact of final or proposed rules, standards or interpretations by the SEC, FASB, or other regulatory or standard setting bodies (Note: Under SEC rules, some consultations may be “audit related” services rather than “audit” services)
|
*
|
* |
Pre-Approved Audit-Related Services
| Service Range of Fees | ||
| The Fund(s) | Covered Entities | |
Attest procedures not required by statute or regulation | *
| * |
Due diligence services pertaining to potential fund mergers
|
* |
* |
Consultations by the Fund’s management as to the accounting or disclosure treatment of transactions or events and/or the actual or potential impact of final or proposed rules, standards or interpretations by the SEC, FASB, or other regulatory or standard-setting bodies (Note: Under SEC rules, some consultations may be “audit” services rather than “audit-related” services)
|
*
|
* |
General assistance with implementation of the requirements of SEC rules or listing standards promulgated pursuant to the Sarbanes-Oxley Act
|
* |
* |
Pre-Approved Tax Services
| Service Range of Fees | ||
| The Fund(s) | Covered Entities | |
U.S. federal, state and local tax planning and advice
|
* |
* |
U.S. federal, state and local tax compliance |
* |
* |
International tax planning and advice |
* |
* |
International tax compliance
|
* |
* |
Review/preparation of federal, state, local and international income, franchise, and other tax returns
|
$450,000 PwC |
N/A
|
| Identification of Passive Foreign Investment Companies | $175,000 PwC | * |
| PwC ITV Tool – assist in determining which Fund holdings have foreign capital gains tax exposure | $125,000 PwC | * |
| Foreign Tax Services - Preparation of local foreign tax returns and assistance with local tax compliance issues (including maintenance of transaction schedules, assistance in periodic tax remittances, tax registration, representing funds before foreign revenue authorities and assistance with assessment orders) | $500,000 PwC | * |
Assistance with tax audits and appeals before the IRS and similar state, local and foreign agencies |
* |
* |
Tax advice and assistance regarding statutory, regulatory or administrative developments (e.g., excise tax reviews, evaluation of Fund’s tax compliance function)
|
*
|
*
|
Pre-Approved All Other Services
| Service Range of Fees | ||
| The Fund(s) | Covered Entities | |
Risk management advisory services, e.g., assessment and testing of security infrastructure controls
|
*
|
*
|
*Aggregate fees related to the pre-approved services will be limited to 10% of the 2022/2023 annual fees for audit and tax services (see fee schedule distributed by the Auditors).
** Audit and tax services for new funds/portfolios will be subject to the maximum audit and tax fee for a fund/portfolio on fee schedule distributed by the Auditors.
Prohibited Non-Audit Services
| ● | Bookkeeping or other services related to the accounting records or financial statements of the audit client | |
| ● | Financial information systems design and implementation | |
| ● | Appraisal or valuation services, fairness opinions or contribution-in-kind reports | |
| ● | Actuarial services | |
| ● | Internal audit outsourcing services | |
| ● | Management functions | |
| ● | Human resources | |
| ● | Broker-dealer, investment adviser or investment banking services | |
| ● | Legal services | |
| ● | Expert services unrelated to the audit |
| (i) | Not Applicable. |
| (j) | Not Applicable. |
Item 5. Audit Committee of Listed Registrants.
| (a) | The registrant has a separately-designated standing audit committee established in accordance with Section 3(a)(58)(A) of the Exchange Act whose members are: |
Joseph J. Kearns, Nancy C. Everett, Eddie A. Grier and Jakki L. Haussler.
(b) Not applicable.
Item 6. Schedule of Investments
(a) Refer to Item 1.
(b) Not applicable.
Item 7. Disclosure of Proxy Voting Policies and Procedures for Closed-End Management Investment Companies.
Applicable only to reports filed by closed-end funds.
Item 8. Portfolio Managers of Closed-End Management Investment Companies
Applicable only to reports filed by closed-end funds.
Item 9. Closed-End Fund Repurchases
Applicable only to reports filed by closed-end funds.
Item 10. Submission of Matters to a Vote of Security Holders
There have been no material changes to the procedures by which shareholders may recommend nominee to the Fund’s Board of Trustees since the Fund last provided disclosure in response to this item.
Item 11. Controls and Procedures
(a) The registrant’s principal executive officer and principal financial officer have concluded that the registrant’s disclosure controls and procedures are sufficient to ensure that information required to be disclosed by the registrant in this Form N-CSR was recorded, processed, summarized and reported within the time periods specified in the Securities and Exchange Commission’s rules and forms, based upon such officers’ evaluation of these controls and procedures as of a date within 90 days of the filing date of the report.
(b) There were no changes in the registrant’s internal control over financial reporting that occurred during the period covered by this report that has materially affected, or is reasonably likely to materially affect, the registrant’s internal control over financial reporting.
Item 12. Disclosure of Securities Lending Activities for Closed End Management Investment Companies.
Not Applicable
Item 13. Exhibits
(a) The Code of Ethics for Principal Executive and Senior Financial Officers.
SIGNATURES
Pursuant to the requirements of the Securities Exchange Act of 1934 and the Investment Company Act of 1940, the registrant has duly caused this report to be signed on its behalf by the undersigned, thereunto duly authorized.
Morgan Stanley Variable Investment Series
| /s/ John H. Gernon | |
| John H. Gernon | |
| Principal Executive Officer | |
| February 16, 2023 |
Pursuant to the requirements of the Securities Exchange Act of 1934 and the Investment Company Act of 1940, this report has been signed by the following persons on behalf of the registrant and in the capacities and on the dates indicated.
| /s/ John H. Gernon | |
| John H. Gernon | |
| Principal Executive Officer | |
| February 16, 2023 | |
| /s/ Francis J. Smith | |
| Francis J. Smith | |
| Principal Financial Officer | |
| February 16, 2023 |