UNITED STATES
SECURITIES AND EXCHANGE COMMISSION
WASHINGTON, D.C. 20549
FORM N-CSR
CERTIFIED SHAREHOLDER REPORT OF REGISTERED MANAGEMENT
INVESTMENT COMPANIES
Investment Company Act file number 811-3694
Oppenheimer Gold & Special Minerals Fund
(Exact name of registrant as specified in charter)
6803 South Tucson Way, Centennial, Colorado 80112-3924
(Address of principal executive offices) (Zip code)
Arthur S. Gabinet
OFI Global Asset Management, Inc.
Two World Financial Center, New York, New York 10281-1008
(Name and address of agent for service)
Registrant’s telephone number, including area code: (303) 768-3200
Date of fiscal year end: June 30
Date of reporting period: 12/31/2013
Item 1. Reports to Stockholders.
Class A Shares
AVERAGE ANNUAL TOTAL RETURNS AT 12/31/13
| | | | | | | | | | | | |
| | | Class A Shares of the Fund | | | | |
| | | Without Sales Charge | | | With Sales Charge | | | MSCI World Index | |
| 6-Month | | | -0.06 | % | | | -5.81 | % | | | 16.83 | % |
| 1-Year | | | -47.83 | | | | -50.83 | | | | 26.68 | |
| 5-Year | | | -0.49 | | | | -1.66 | | | | 15.02 | |
| 10-Year | | | 3.45 | | | | 2.84 | | | | 6.98 | |
Performance data quoted represents past performance, which does not guarantee future results. The investment return and principal value of an investment in the Fund will fluctuate so that an investor’s shares, when redeemed, may be worth more or less than their original cost. Fund returns include changes in share price, reinvested distributions, and a 5.75% maximum applicable sales charge except where “without sales charge” is indicated. Current performance may be lower or higher than the performance quoted. Returns do not consider capital gains or income taxes on an individual’s investment. Returns for periods of less than one year are cumulative and not annualized. For performance data current to the most recent month-end, visit oppenheimerfunds.com or call 1.800.CALL OPP (225.5677).
2 OPPENHEIMER GOLD & SPECIAL MINERALS FUND
Fund Performance Discussion
The Fund’s Class A shares (without sales charge) produced a total return of -0.06% during the reporting period, underperforming its benchmark, the MSCI World Index, which returned 16.83%. Gold stocks and gold bullion remained out of favor among investors over the six-month reporting period, mainly due to their preference for companies that are more leveraged to recovering U.S. and global economies. Although the Fund lagged its benchmark, it outperformed its peers in the Lipper Precious Metals Equity Funds Index which returned -4.81%.
MARKET OVERVIEW
Although gold stocks generally lost value over the second half of 2013, they did so at a more moderate rate than over the first half of 2013, which suggests to us that capital outflows from the industry group have slowed and the bulk of the industry group’s decline may be behind us. Indeed, in our analysis, gold stocks ended 2013 with attractive valuations compared to historical norms.
Historically, gold stocks have tended to lag broader market averages during economic recoveries, and this reporting period was no exception. The U.S. recovery was fueled by falling unemployment, strengthening housing markets, and an aggressively accommodative monetary policy from the Federal Reserve. In other developed markets, Japan’s economy responded positively to stimulative monetary and fiscal policies implemented by the country’s new prime minister in an attempt to end years of economic stagnation. Europe posted mildly positive economic growth when a regional recession ended and concerns receded regarding a persistent debt crisis.
The emerging markets generally did not participate in the global recovery, instead experiencing further slowdowns in key markets in Asia and Latin America. Sluggish demand from the emerging markets for energy and construction materials weighed on commodity prices, including those of precious metals, as central banks restricted imports in an effort to reduce their nations’ trade deficits and shore up their currency exchange rates.
In turn, lower gold bullion prices hurt the earnings of many gold producers, particularly those with marginal reserves, as production costs either increased or remained roughly unchanged. In this challenging environment, investors turned away from gold stocks in favor of investments that are more responsive to improving economic conditions.
FUND PEFORMANCE
The Fund began the reporting period with a relatively defensive investment posture in which we emphasized larger gold producers with strong track records of success, diversified exposure to a number of metals
3 OPPENHEIMER GOLD & SPECIAL MINERALS FUND
and mining operations, positive free cash flows, and competitive dividend yields. In addition, it favored companies that receive royalties from multiple properties engaged in all stages of production. The Fund generally had less exposure to smaller producers in the early stages of the production process.
This focus on higher-quality companies helped to cushion the impact of price deterioration among gold stocks over the reporting period. For example, Goldcorp, Inc. held up well, supported by positive cash flows and a monthly dividend payment. Diversified metals-and-mining company Freeport McMoRan Copper & Gold, Inc. benefited from its exposure to industrial metals and a high dividend yield. Canada-based SEMAFO, Inc., which operates several gold mines in Africa, was rewarded for its positive cash flows and high-quality assets. Among royalty companies, Franco-Nevada Corp. fared relatively well due to its royalty interests in more than 340 properties, and Royal Gold, Inc. gained a degree of value on the strength of its interests in nearly 200 different properties.
The Fund also benefited from its positions in producers of other metals, including Silver Wheaton Corp., which buys silver from an array of mining companies and sells it at a profit. Among iron ore producers, African Minerals Ltd. rallied from a low valuation on the strength of its growth potential, and Brazil’s Vale SA attracted investors with a generous dividend yield.
The Fund encountered disappointing results from gold miner Koza Altin Isletmeleri AS in Turkey, where political turmoil disrupted operations before courts intervened and enabled production to resume. The Fund held relatively small positions in two early-stage companies, Gold Standard Ventures Corp. and Romarco Minerals, Inc., that lagged industry group averages.
STRATEGY & OUTLOOK
We have been encouraged by recent evidence that the bear market in gold stocks may be nearing an end, and we continue to believe that many gold producers were punished more severely during the downturn than was warranted by their business prospects. In our view, valuations should rise toward historical norms as industry-wide skepticism abates and investors return their focus to company fundamentals.
Our cautiously constructive outlook is reinforced by economic factors, most notably the possibility that inflationary pressures could rise in the wake of aggressively accommodative monetary policies throughout the world. In addition, we believe supply-and-demand dynamics should become more favorable, as the supply of newly mined gold is limited by reduced capacity stemming from projects that were canceled or delayed during the downturn. Meanwhile, demand for gold has remained robust from consumers, including an expanding middle class in the world’s developing nations, and recovering investor demand may add to supply-and-demand imbalances that could drive gold prices higher.
4 OPPENHEIMER GOLD & SPECIAL MINERALS FUND
In the meantime, we intend to maintain the Fund’s relatively conservative positioning, including a focus on higher-quality companies that have demonstrated their ability to remain profitable even when commodity prices are low. When we begin to see more solid signs of a sustainable rally in gold prices, we may begin to shift assets to the stocks of other fundamentally sound gold producers that are currently available at attractively low prices.
| | |
 | | 
Shanquan Li Portfolio Manager |
5 OPPENHEIMER GOLD & SPECIAL MINERALS FUND
Top Holdings and Allocations
| | | | |
TOP TEN COMMON STOCK HOLDINGS | |
| Freeport-McMoRan Copper & Gold, Inc. | | | 7.4 | % |
| Randgold Resources Ltd., ADR | | | 6.3 | |
| Franco-Nevada Corp. | | | 6.2 | |
| Barrick Gold Corp. | | | 5.7 | |
| Royal Gold, Inc. | | | 5.7 | |
| Goldcorp, Inc. | | | 5.6 | |
| Silver Wheaton Corp. | | | 4.1 | |
| Eldorado Gold Corp. | | | 3.9 | |
| Yamana Gold, Inc. | | | 3.9 | |
| Osisko Mining Corp. | | | 3.2 | |
Portfolio holdings and allocations are subject to change. Percentages are as of December 31, 2013, and are based on net assets. For more current Fund holdings, please visit oppenheimerfunds.com.
| | |
| REGIONAL ALLOCATION |
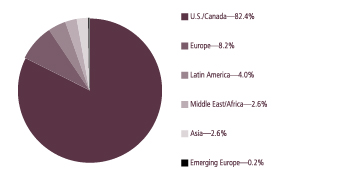 |
Portfolio holdings and allocations are subject to change. Percentages are as of December 31, 2013, and are based on the total market value of investments.
6 OPPENHEIMER GOLD & SPECIAL MINERALS FUND
Share Class Performance
AVERAGE ANNUAL TOTAL RETURNS WITHOUT SALES CHARGE AS OF 12/31/13
| | | | | | | | | | | | | | | | | | | | |
| | | Inception Date | | | 6-Month | | | 1-Year | | | 5-Year | | | 10-Year | |
| Class A (OPGSX) | | | 7/19/83 | | | | -0.06 | % | | | -47.83 | % | | | -0.49 | % | | | 3.45 | % |
| Class B (OGMBX) | | | 11/1/95 | | | | -0.52 | % | | | -48.29 | % | | | -1.33 | % | | | 2.96 | % |
| Class C (OGMCX) | | | 11/1/95 | | | | -0.52 | % | | | -48.26 | % | | | -1.23 | % | | | 2.68 | % |
| Class I (OGMIX) | | | 10/26/12 | | | | 0.18 | % | | | -47.56 | % | | | -47.30 | %* | | | N/A | |
| Class N (OGMNX) | | | 3/1/01 | | | | -0.25 | % | | | -47.96 | % | | | -0.81 | % | | | 3.12 | % |
| Class Y (OGMYX) | | | 9/7/10 | | | | 0.06 | % | | | -47.75 | % | | | -22.32 | %* | | | N/A | |
AVERAGE ANNUAL TOTAL RETURNS WITH SALES CHARGE AS OF 12/31/13
| | | | | | | | | | | | | | | | | | | | |
| | | Inception Date | | | 6-Month | | | 1-Year | | | 5-Year | | | 10-Year | |
| Class A (OPGSX) | | | 7/19/83 | | | | -5.81 | % | | | -50.83 | % | | | -1.66 | % | | | 2.84 | % |
| Class B (OGMBX) | | | 11/1/95 | | | | -5.49 | % | | | -50.88 | % | | | -1.66 | % | | | 2.96 | % |
| Class C (OGMCX) | | | 11/1/95 | | | | -1.51 | % | | | -48.78 | % | | | -1.23 | % | | | 2.68 | % |
| Class I (OGMIX) | | | 10/26/12 | | | | 0.18 | % | | | -47.56 | % | | | -47.30 | %* | | | N/A | |
| Class N (OGMNX) | | | 3/1/01 | | | | -1.25 | % | | | -48.48 | % | | | -0.81 | % | | | 3.12 | % |
| Class Y (OGMYX) | | | 9/7/10 | | | | 0.06 | % | | | -47.75 | % | | | -22.32 | %* | | | N/A | |
*Shows performance since inception.
Performance data quoted represents past performance, which does not guarantee future results. The investment return and principal value of an investment in the Fund will fluctuate so that an investor’s shares, when redeemed, may be worth more or less than their original cost. Current performance may be lower or higher than the performance quoted. Returns do not consider capital gains or income taxes on an individual’s investment. For performance data current to the most recent month-end, visit oppenheimerfunds.com or call 1.800.CALL OPP (225.5677). Fund returns include changes in share price, reinvested distributions, and the applicable sales charge: for Class A shares, the current maximum initial sales charge of 5.75%; for Class B shares, the contingent deferred sales charge of 5% (1-year) and 2% (5-year); and for Class C and N shares, the contingent deferred sales charge of 1% for the 1-year period. There is no sales charge for Class I and Class Y shares. Because Class B shares convert to Class A shares 72 months after purchase, the 10-year return for Class B shares uses Class A performance for the period after conversion. Returns for periods of less than one year are cumulative and not annualized.
The Fund’s performance is compared to the performance of the MSCI World Index, an index of issuers listed on the stock exchanges of foreign countries and the United States. The Index is unmanaged and cannot be purchased directly by investors. Index performance includes reinvestment of income, but does not reflect transaction costs, fees, expenses or taxes. Index performance is shown for illustrative purposes only as a benchmark for the Fund’s performance, and does not predict or depict performance of the Fund. The Fund’s performance reflects the effects of the Fund’s business and operating expenses.
The Fund’s investment strategy and focus can change over time. The mention of specific fund holdings does not constitute a recommendation by OppenheimerFunds, Inc. or its affiliates.
7 OPPENHEIMER GOLD & SPECIAL MINERALS FUND
Before investing in any of the Oppenheimer funds, investors should carefully consider a fund’s investment objectives, risks, charges and expenses. Fund prospectuses and summary prospectuses contain this and other information about the funds, and may be obtained by asking your financial advisor, visiting oppenheimerfunds.com, or calling 1.800.CALL OPP (225.5677). Read prospectuses and summary prospectuses carefully before investing.
Shares of Oppenheimer funds are not deposits or obligations of any bank, are not guaranteed by any bank, are not insured by the FDIC or any other agency, and involve investment risks, including the possible loss of the principal amount invested.
8 OPPENHEIMER GOLD & SPECIAL MINERALS FUND
Fund Expenses
Fund Expenses. As a shareholder of the Fund, you incur two types of costs: (1) transaction costs, which may include sales charges (loads) on purchase payments, contingent deferred sales charges on redemptions; and (2) ongoing costs, including management fees; distribution and service fees; and other Fund expenses. These examples are intended to help you understand your ongoing costs (in dollars) of investing in the Fund and to compare these costs with the ongoing costs of investing in other mutual funds.
The examples are based on an investment of $1,000.00 invested at the beginning of the period and held for the entire 6-month period ended December 31, 2013.
Actual Expenses. The first section of the table provides information about actual account values and actual expenses. You may use the information in this section for the class of shares you hold, together with the amount you invested, to estimate the expense that you paid over the period. Simply divide your account value by $1,000.00 (for example, an $8,600.00 account value divided by $1,000.00 = 8.60), then multiply the result by the number in the first section under the heading entitled “Expenses Paid During Period” to estimate the expenses you paid on your account during this period.
Hypothetical Example for Comparison Purposes. The second section of the table provides information about hypothetical account values and hypothetical expenses based on the Fund’s actual expense ratio for each class of shares, and an assumed rate of return of 5% per year for each class before expenses, which is not the actual return. The hypothetical account values and expenses may not be used to estimate the actual ending account balance or expenses you paid for the period. You may use this information to compare the ongoing costs of investing in the Fund and other funds. To do so, compare this 5% hypothetical example for the class of shares you hold with the 5% hypothetical examples that appear in the shareholder reports of the other funds.
Please note that the expenses shown in the table are meant to highlight your ongoing costs only and do not reflect any transactional costs, such as front-end or contingent deferred sales charges (loads), or a $12.00 fee imposed annually on accounts valued at less than $500.00 (subject to exceptions described in the Statement of Additional Information). Therefore, the “hypothetical” section of the table is useful in comparing ongoing costs only, and will not help you determine the relative total costs of owning different funds. In addition, if these transactional costs were included, your costs would have been higher.
9 OPPENHEIMER GOLD & SPECIAL MINERALS FUND
| | | | | | | | | | | | |
| Actual | | Beginning
Account
Value
July 1, 2013 | | | Ending
Account
Value
December 31, 2013 | | | Expenses
Paid During
6 Months Ended
December 31, 2013 | |
| Class A | | $ | 1,000.00 | | | $ | 999.40 | | | $ | 6.32 | |
| Class B | | | 1,000.00 | | | | 994.80 | | | | 10.61 | |
| Class C | | | 1,000.00 | | | | 994.80 | | | | 10.41 | |
| Class I | | | 1,000.00 | | | | 1,001.80 | | | | 3.64 | |
| Class N | | | 1,000.00 | | | | 997.50 | | | | 8.04 | |
| Class Y | | | 1,000.00 | | | | 1,000.60 | | | | 4.80 | |
| | | |
Hypothetical
(5% return before expenses) | | | | | | | | | |
| Class A | | | 1,000.00 | | | | 1,018.90 | | | | 6.38 | |
| Class B | | | 1,000.00 | | | | 1,014.62 | | | | 10.72 | |
| Class C | | | 1,000.00 | | | | 1,014.82 | | | | 10.52 | |
| Class I | | | 1,000.00 | | | | 1,021.58 | | | | 3.68 | |
| Class N | | | 1,000.00 | | | | 1,017.19 | | | | 8.12 | |
| Class Y | | | 1,000.00 | | | | 1,020.42 | | | | 4.85 | |
Expenses are equal to the Fund’s annualized expense ratio for that class, multiplied by the average account value over the period, multiplied by 184/365 (to reflect the one-half year period). Those annualized expense ratios, excluding indirect expenses from affiliated funds, based on the 6-month period ended December 31, 2013 are as follows:
| | | | |
| Class | | Expense Ratios | |
| Class A | | | 1.25 | % |
| Class B | | | 2.10 | |
| Class C | | | 2.06 | |
| Class I | | | 0.72 | |
| Class N | | | 1.59 | |
| Class Y | | | 0.95 | |
The expense ratios reflect voluntary and contractual waivers and/or reimbursements of expenses by the Fund’s Manager and Transfer Agent. Some of these undertakings may be modified or terminated at any time, as indicated in the Fund’s prospectus. The “Consolidated Financial Highlights” tables in the Fund’s financial statements, included in this report, also show the gross expense ratios, without such waivers or reimbursements and reduction to custodian expenses, if applicable.
10 OPPENHEIMER GOLD & SPECIAL MINERALS FUND
| | | | |
| | |
| | | CONSOLIDATED STATEMENT OF INVESTMENTS December 31, 2013 / Unaudited | | |
| | | | | | | | | | |
| | | Shares | | | Value | | | |
| Common Stocks—97.4% | | | | | | | | | | |
| Materials—97.4% | | | | | | | | | | |
| Metals & Mining—97.4% | | | | | | | | | | |
| African Minerals Ltd.1 | | | 2,900,000 | | | $ | 9,583,361 | | | |
| Agnico Eagle Mines Ltd.2 | | | 1,110,000 | | | | 29,281,800 | | | |
| Alacer Gold Corp.2 | | | 2,800,000 | | | | 5,719,934 | | | |
| Alamos Gold, Inc.2 | | | 2,700,000 | | | | 32,712,638 | | | |
| Alrosa AO | | | 2,000,000 | | | | 2,133,186 | | | |
| Antofagasta plc | | | 500,000 | | | | 6,860,433 | | | |
| Argonaut Gold, Inc.1 | | | 5,172,697 | | | | 25,906,094 | | | |
| AuRico Gold, Inc.2 | | | 3,100,000 | | | | 11,346,000 | | | |
| B2Gold Corp.1 | | | 10,411,108 | | | | 21,366,171 | | | |
| Banro Corp.1 | | | 7,000,000 | | | | 3,892,000 | | | |
| Barrick Gold Corp.2 | | | 3,990,000 | | | | 70,343,700 | | | |
| Beadell Resources Ltd.1 | | | 13,000,000 | | | | 9,168,980 | | | |
| Capstone Mining Corp.1 | | | 4,180,000 | | | | 11,805,131 | | | |
| Centerra Gold, Inc. | | | 5,760,100 | | | | 23,425,401 | | | |
| Coeur Mining, Inc.1 | | | 360,200 | | | | 3,908,170 | | | |
| Compania de Minas Buenaventura SA, ADR | | | 1,128,903 | | | | 12,666,292 | | | |
| Dominion Diamond Corp.1 | | | 200,000 | | | | 2,872,000 | | | |
| Duluth Metals Ltd.1,4 | | | 7,804,800 | | | | 5,730,990 | | | |
| Dundee Precious Metals, Inc.1 | | | 4,629,700 | | | | 13,380,258 | | | |
| Eldorado Gold Corp.2,3 | | | 1,600,000 | | | | 9,104,000 | | | |
| Eldorado Gold Corp.2,3 | | | 7,000,000 | | | | 39,736,408 | | | |
| First Majestic Silver Corp.1 | | | 1,750,000 | | | | 17,182,866 | | | |
| Franco-Nevada Corp.2 | | | 1,880,000 | | | | 76,591,200 | | | |
| Freeport-McMoRan Copper & Gold, Inc.2 | | | 2,400,000 | | | | 90,576,000 | | | |
| Glencore Xstrata plc1 | | | 1,757,110 | | | | 9,134,384 | | | |
| Gold Standard Ventures Corp.1 | | | 2,407,700 | | | | 1,637,236 | | | |
| Goldcorp, Inc.2 | | | 3,190,000 | | | | 69,127,300 | | | |
| IAMGOLD Corp. | | | 4,600,000 | | | | 15,318,000 | | | |
| Ivanhoe Mines Ltd.1 | | | 4,386,600 | | | | 7,722,233 | | | |
| Kinross Gold Corp.2,3 | | | 3,000,000 | | | | 13,132,502 | | | |
| Kinross Gold Corp.2,3 | | | 1,010,000 | | | | 4,423,800 | | | |
| Koza Altin Isletmeleri AS | | | 3,180,000 | | | | 32,967,544 | | | |
| Metalurgica Gerdau SA, Cl. A | | | 1,100,000 | | | | 10,915,964 | | | |
| Nevsun Resources Ltd. | | | 3,507,690 | | | | 11,645,531 | | | |
| New Gold, Inc.1,2,3 | | | 400,000 | | | | 2,096,000 | | | |
| New Gold, Inc.1,3 | | | 6,800,000 | | | | 35,592,375 | | | |
| Newmont Mining Corp.2 | | | 850,000 | | | | 19,575,500 | | | |
| Orocobre Ltd.1 | | | 300,000 | | | | 667,012 | | | |
| Osisko Mining Corp.1,2 | | | 8,800,000 | | | | 39,019,063 | | | |
| Polymetal International plc | | | 20,000 | | | | 190,192 | | | |
| Primero Mining Corp.1 | | | 1,948,800 | | | | 8,585,911 | | | |
| | | | | | | | | | |
| | | Shares | | | Value | | | |
| Metals & Mining Continued | | | | | | | | | | |
| Randgold Resources Ltd., ADR2 | | | 1,225,194 | | | $ | 76,954,435 | | | |
| Real Gold Mining Ltd.1 | | | 10,400,000 | | | | 13,412 | | | |
| Regis Resources Ltd. | | | 2,000,000 | | | | 5,234,319 | | | |
| Rio Tinto plc, Sponsored ADR | | | 328,700 | | | | 18,548,541 | | | |
| Romarco Minerals, Inc.1,4 | | | 30,127,000 | | | | 10,635,561 | | | |
| Royal Gold, Inc. | | | 1,524,900 | | | | 70,252,143 | | | |
| Sandstorm Gold Ltd.1 | | | 1,742,300 | | | | 7,439,621 | | | |
| SEMAFO, Inc.2,4 | | | 14,120,000 | | | | 37,086,185 | | | |
| Silver Wheaton Corp.2 | | | 2,470,000 | | | | 49,869,300 | | | |
| Tahoe Resources, Inc.1 | | | 900,500 | | | | 14,984,320 | | | |
| Teck Resources Ltd., Cl. B | | | 621,800 | | | | 16,173,017 | | | |
| Vale SA, Sponsored ADR | | | 1,700,000 | | | | 25,925,000 | | | |
| Yamana Gold, Inc.2 | | | 5,570,000 | | | | 48,013,400 | | | |
Total Common Stocks
(Cost $1,492,020,802) | | | | | | | 1,198,172,814 | | | |
| | | | | | | | | | | |
| | | Units | | | | | | |
| Rights, Warrants and Certificates—0.0% | | | |
| Kinross Gold Corp. Wts., Strike Price 21.939CAD, Exp. 9/17/141,2 | | | | | | | | | | |
| (Cost $–) | | | 483,450 | | | | 6,827 | | | |
| | | | | | | | | | | |
| | | Shares | | | | | | |
| Investment Companies—3.5% | | | |
| Oppenheimer Institutional Money Market Fund, Cl. E, 0.09%4,5 | | | 15,211,645 | | | | 15,211,645 | | | |
| SPDR Gold Trust Exchange Traded Fund1 | | | 240,000 | | | | 27,880,800 | | | |
Total Investment Companies
(Cost $46,020,094) | | | | | | | 43,092,445 | | | |
Total Investments, at Value
(Cost $1,538,040,896) | | | 100.9 | % | | | 1,241,272,086 | | | |
| Liabilities in Excess of Other Assets | | | (0.9 | ) | | | (10,699,783 | ) | | |
| | |
|
|
| | |
| Net Assets | | | 100.0 | % | | $ | 1,230,572,303 | | | |
| | |
|
|
| | |
11 OPPENHEIMER GOLD & SPECIAL MINERALS FUND
| | | | |
| | |
| | | CONSOLIDATED STATEMENT OF INVESTMENTS Unaudited / Continued | | |
Footnotes to Consolidated Statement of Investments
Strike price is reported in U.S. Dollars, except for those denoted in the following currency:
1. Non-income producing security.
2. All or a portion of the security position is held in segregated accounts and pledged to cover margin requirements with respect to outstanding written options. The aggregate market value of such securities is $110,538,908. See Note 6 of the accompanying Consolidated Notes.
3. The Fund holds securities which have been issued by the same entity and that trade on separate exchanges.
4. Is or was an affiliate, as defined in the Investment Company Act of 1940, at or during the period ended December 31, 2013, by virtue of the Fund owning at least 5% of the voting securities of the issuer or as a result of the Fund and the issuer having the same investment adviser. Transactions during the period in which the issuer was an affiliate are as follows:
| | | | | | | | | | | | | | | | |
| | | Shares/Units
June 28, 2013a | | | Gross
Additions | | | Gross
Reductions | | | Shares/Units
December 31, 2013 | |
| Duluth Metals Ltd. | | | 7,804,800 | | | | — | | | | — | | | | 7,804,800 | |
| Duluth Metals Ltd. Wts., Strike Price $0.001, Exp. 7/31/13 | | | 513,653 | | | | — | | | | 513,653 | | | | — | |
| Kirkland Lake Gold, Inc. | | | 4,382,900 | | | | — | | | | 4,382,900 | | | | — | |
| Oppenheimer Institutional Money Market Fund, Cl. E | | | — | | | | 297,113,566 | | | | 281,901,921 | | | | 15,211,645 | |
| Romarco Minerals, Inc.b | | | 30,127,000 | | | | — | | | | — | | | | 30,127,000 | |
| SEMAFO, Inc. | | | 14,789,748 | | | | 120,000 | | | | 789,748 | | | | 14,120,000 | |
| | | | |
| | | | | | Value | | | Income | | | Realized
Loss | |
| Duluth Metals Ltd. | | | $ | 5,730,990 | | | $ | — | | | $ | — | |
Duluth Metals Ltd. Wts., Strike Price $0.001, Exp. 7/31/13 | | | | | | | — | | | | — | | | | 64,947 | |
| Kirkland Lake Gold, Inc. | | | | | | | — | | | | — | | | | 35,273,270 | |
| Oppenheimer Institutional Money Market Fund, Cl. E | | | | | | | 15,211,645 | | | | 9,150 | | | | — | |
| Romarco Minerals, Inc.b | | | | | | | — | c | | | — | | | | — | |
| SEMAFO, Inc. | | | | | | | 37,086,185 | | | | — | | | | 7,615,620 | |
| | | | | | |
|
|
|
| Total | | | | | | $ | 58,028,820 | | | $ | 9,150 | | | $ | 42,953,837 | |
| | | | | | |
|
|
|
a. June 28, 2013 represents the last business day of the Fund’s reporting period. See Note 1 of the accompanying Consolidated Notes.
b. No longer an affiliate as of December 31, 2013.
c. The security is no longer an affiliate, therefore, the value has been excluded from this table.
5. Rate shown is the 7-day yield as of December 31, 2013.
12 OPPENHEIMER GOLD & SPECIAL MINERALS FUND
Footnotes to Consolidated Statement of Investments Continued
| | | | | | | | |
| Distribution of investments representing geographic holdings, as a percentage of total investments at value, is as follows: | |
| Geographic Holdings | | Value | | | Percent | |
| Canada | | $ | 757,631,564 | | | | 61.1 | % |
| United States | | | 262,677,467 | | | | 21.3 | |
| Jersey, Channel Islands | | | 76,954,435 | | | | 6.2 | |
| Brazil | | | 36,840,964 | | | | 3.0 | |
| Australia | | | 33,618,852 | | | | 2.6 | |
| Turkey | | | 32,967,544 | | | | 2.6 | |
| United Kingdom | | | 16,443,794 | | | | 1.3 | |
| Peru | | | 12,666,292 | | | | 1.0 | |
| Switzerland | | | 9,134,384 | | | | 0.7 | |
| Russia | | | 2,323,378 | | | | 0.2 | |
| Mongolia | | | 13,412 | | | | 0.0 | |
| | |
|
|
|
| Total | | $ | 1,241,272,086 | | | | 100.0 | % |
| | |
|
|
|
| | | | | | | | | | | | | | | | | | | | | | | | | | | | | | | | | | | |
| Exchange-Traded Options Written at December 31, 2013 |
| Description | | | | Exercise
Price | | Expiration
Date | | | | Number of
Contracts | | Premiums
Received | | Value |
| Alamos Gold, Inc. Call | | | | CAD | | | | | 17.000 | | | | | 1/18/14 | | | | | CAD | | | | | (2,000 | ) | | | $ | 171,684 | | | | $ | (3,766 | ) |
| Caterpillar, Inc. Put | | | | USD | | | | | 75.000 | | | | | 2/22/14 | | | | | USD | | | | | (1,000 | ) | | | | 139,452 | | | | | (16,000 | ) |
| Eastman Chemical Co. Put | | | | USD | | | | | 67.500 | | | | | 3/22/14 | | | | | USD | | | | | (1,000 | ) | | | | 201,431 | | | | | (55,000 | ) |
| First Quantum Minerals Ltd. Put | | | | CAD | | | | | 18.000 | | | | | 4/19/14 | | | | | CAD | | | | | (2,000 | ) | | | | 260,890 | | | | | (170,393 | ) |
| First Quantum Minerals Ltd. Put | | | | CAD | | | | | 17.000 | | | | | 7/19/14 | | | | | CAD | | | | | (1,500 | ) | | | | 230,540 | | | | | (151,800 | ) |
| Franco-Nevada Corp. Call | | | | USD | | | | | 55.000 | | | | | 1/18/14 | | | | | USD | | | | | (2,000 | ) | | | | 454,754 | | | | | (12,000 | ) |
| Franco-Nevada Corp. Call | | | | USD | | | | | 50.000 | | | | | 1/18/14 | | | | | USD | | | | | (1,000 | ) | | | | 141,962 | | | | | (5,000 | ) |
| Franco-Nevada Corp. Put | | | | USD | | | | | 40.000 | | | | | 4/19/14 | | | | | USD | | | | | (2,000 | ) | | | | 673,917 | | | | | (615,000 | ) |
| Freeport-McMoRan Copper & Gold, Inc. Call | | | | USD | | | | | 32.000 | | | | | 1/18/14 | | | | | USD | | | | | (1,000 | ) | | | | 106,960 | | �� | | | (576,000 | ) |
| Goldcorp, Inc. Put | | | | USD | | | | | 24.000 | | | | | 1/18/14 | | | | | USD | | | | | (1,000 | ) | | | | 100,962 | | | | | (249,000 | ) |
| Royal Gold, Inc. Put | | | | USD | | | | | 40.000 | | | | | 1/18/14 | | | | | USD | | | | | (1,000 | ) | | | | 136,962 | | | | | (9,000 | ) |
| Sociedad Quimica y Minera de Chile, ADR Put | | | | USD | | | | | 22.500 | | | | | 7/19/14 | | | | | USD | | | | | (1,500 | ) | | | | 250,443 | | | | | (202,500 | ) |
| Teck Resources Ltd. Put | | | | USD | | | | | 25.000 | | | | | 2/22/14 | | | | | USD | | | | | (2,000 | ) | | | | 286,364 | | | | | (170,000 | ) |
| U.S. Silica Holdings, Inc. Put | | | | USD | | | | | 25.000 | | | | | 3/22/14 | | | | | USD | | | | | (2,000 | ) | | | | 223,925 | | | | | (90,000 | ) |
| | | | | | | | | | | | | | | | | | | | | | | | | | | | |
|
|
|
| Total of Exchange-Traded Options Written | | | | | | | | | | | | | | | | | | | | | | | | | | | | $ | 3,380,246 | | | | $ | (2,325,459 | ) |
| | | | | | | | | | | | | | | | | | | | | | | | | | | | |
|
|
|
See accompanying Notes to Consolidated Financial Statements.
13 OPPENHEIMER GOLD & SPECIAL MINERALS FUND
| | | | |
| | |
| | | CONSOLIDATED STATEMENT OF ASSETS & LIABILITIES December 31, 2013 Unaudited | | |
| | | | |
| Assets | | | |
| Investments, at value—see accompanying consolidated statement of investments: | | | | |
| Unaffiliated companies (cost $1,421,834,710) | | $ | 1,183,243,266 | |
| Affiliated companies (cost $116,206,186) | |
| 58,028,820
|
|
| | | | 1,241,272,086 | |
| Cash | | | 2,154,770 | |
| Receivables and other assets: | | | | |
| Shares of beneficial interest sold | | | 7,511,468 | |
| Investments sold | | | 2,169,005 | |
| Dividends | | | 1,083,991 | |
| Other | |
| 157,774
|
|
| Total assets | | | 1,254,349,094 | |
| Liabilities | | | |
| Options written, at value (premiums received $3,380,246) | | | 2,325,459 | |
| Payables and other liabilities: | | | | |
| Shares of beneficial interest redeemed | | | 16,564,044 | |
| Investments purchased | | | 3,896,957 | |
| Trustees’ compensation | | | 260,414 | |
| Distribution and service plan fees | | | 233,890 | |
| Transfer and shareholder servicing agent fees | | | 223,466 | |
| Shareholder communications | | | 175,692 | |
| Other | |
| 96,869
|
|
| Total liabilities | | | 23,776,791 | |
| Net Assets | | $
| 1,230,572,303
|
|
| Composition of Net Assets | | | |
| Paid-in capital | | | 2,578,878,588 | |
| Accumulated net investment loss | | | (72,146,553 | ) |
| Accumulated net realized loss on investments and foreign currency transactions | | | (979,895,935 | ) |
| Net unrealized depreciation on investments and translation of assets and liabilities denominated in foreign currencies | |
| (296,263,797
| )
|
| Net Assets | | $
| 1,230,572,303
|
|
14 OPPENHEIMER GOLD & SPECIAL MINERALS FUND
| | | | |
| Net Asset Value Per Share | | | |
| Class A Shares: | | | | |
| Net asset value and redemption price per share (based on net assets of $738,715,356 and 44,938,828 shares of beneficial interest outstanding) | | $ | 16.44 | |
| Maximum offering price per share (net asset value plus sales charge of 5.75% of offering price) | | $ | 17.44 | |
| Class B Shares: | | | | |
| Net asset value, redemption price (excludes applicable contingent deferred sales charge) and offering price per share (based on net assets of $28,241,105 and 1,831,549 shares of beneficial interest outstanding) | | $ | 15.42 | |
| Class C Shares: | | | | |
| Net asset value, redemption price (excludes applicable contingent deferred sales charge) and offering price per share (based on net assets of $178,141,263 and 11,643,130 shares of beneficial interest outstanding) | | $ | 15.30 | |
| Class I Shares: | | | | |
| Net asset value, redemption price and offering price per share (based on net assets of $32,949,179 and 2,001,332 shares of beneficial interest outstanding) | | $ | 16.46 | |
| Class N Shares: | | | | |
| Net asset value, redemption price (excludes applicable contingent deferred sales charge) and offering price per share (based on net assets of $122,463,649 and 7,744,636 shares of beneficial interest outstanding) | | $ | 15.81 | |
| Class Y Shares: | | | | |
| Net asset value, redemption price and offering price per share (based on net assets of $130,061,751 and 7,934,388 shares of beneficial interest outstanding) | | $ | 16.39 | |
See accompanying Notes to Consolidated Financial Statements.
15 OPPENHEIMER GOLD & SPECIAL MINERALS FUND
| | | | |
| | |
| | | CONSOLIDATED STATEMENT OF OPERATIONS For the Six Months Ended December 31, 2013 Unaudited | | |
| | | | |
| Investment Income | | | |
| Dividends: | | | | |
| Unaffiliated companies (net of foreign withholding taxes of $1,098,422) | | $ | 9,264,002 | |
| Affiliated companies | | | 9,150 | |
| Interest | | | 40 | |
| Other income | | | 28,521 | |
| Total investment income | | | 9,301,713 | |
| Expenses | | | |
| Management fees | | | 4,800,279 | |
| Distribution and service plan fees: | | | | |
| Class A | | | 1,061,250 | |
| Class B | | | 175,582 | |
| Class C | | | 1,064,522 | |
| Class N | | | 330,757 | |
| Transfer and shareholder servicing agent fees: | | | | |
| Class A | | | 1,674,799 | |
| Class B | | | 98,639 | |
| Class C | | | 371,205 | |
| Class I | | | 4,915 | |
| Class N | | | 342,627 | |
| Class Y | | | 169,213 | |
| Shareholder communications: | | | | |
| Class A | | | 218,892 | |
| Class B | | | 24,015 | |
| Class C | | | 67,649 | |
| Class I | | | 19 | |
| Class N | | | 14,062 | |
| Class Y | | | 43,221 | |
| Custodian fees and expenses | | | 28,609 | |
| Trustees’ compensation | | | 23,079 | |
| Other | | | 92,368 | |
| Total expenses | | | 10,605,702 | |
| Less waivers and reimbursements of expenses | | | (836,641 | ) |
| Net expenses | | | 9,769,061 | |
| Net Investment Loss | | | (467,348 | ) |
16 OPPENHEIMER GOLD & SPECIAL MINERALS FUND
| | | | |
| Realized and Unrealized Gain (Loss) | | | |
| Net realized gain (loss) on: | | | | |
| Investments from: | | | | |
Unaffiliated companies (includes premiums on options exercised) | | $ | (429,008,337 | ) |
Affiliated companies | | | (42,953,837 | ) |
| Closing and expiration of option contracts written | | | 4,049,638 | |
| Foreign currency transactions | | | 71,510 | |
| Net realized loss | | | (467,841,026 | ) |
| Net change in unrealized appreciation/depreciation on: | | | | |
| Investments | | | 446,444,373 | |
| Translation of assets and liabilities denominated in foreign currencies | | | 12,382,916 | |
| Option contracts written | | | 6,380,668 | |
| Net change in unrealized appreciation/depreciation | | | 465,207,957 | |
| Net Decrease in Net Assets Resulting from Operations | | $
| (3,100,417
| )
|
See accompanying Notes to Consolidated Financial Statements.
17 OPPENHEIMER GOLD & SPECIAL MINERALS FUND
| | | | |
| | |
| | | CONSOLIDATED STATEMENTS OF CHANGES IN NET ASSETS Unaudited | | |
| | | | | | | | |
| | | Six Months Ended
December 31, 2013
(Unaudited) | | | Year Ended
June 28, 20131 | |
| Operations | | | | | | |
| Net investment loss | | $ | (467,348 | ) | | $ | (4,641,258 | ) |
| Net realized loss | | | (467,841,026 | ) | | | (383,747,052 | ) |
| Net change in unrealized appreciation/depreciation | |
| 465,207,957
|
| |
| (757,467,771
| )
|
| Net decrease in net assets resulting from operations | | | (3,100,417 | ) | | | (1,145,856,081 | ) |
| Beneficial Interest Transactions | | | | | | |
| Net increase (decrease) in net assets resulting from beneficial interest transactions: | | | | | | | | |
| Class A | | | (52,545,892 | ) | | | (185,760,959 | ) |
| Class B | | | (7,096,851 | ) | | | (29,949,426 | ) |
| Class C | | | (20,073,453 | ) | | | (49,676,061 | ) |
| Class I | | | 9,324,914 | | | | 29,701,468 | |
| Class N | | | 8,166,581 | | | | 2,484,053 | |
| Class Y | |
| 6,459,767
|
| |
| (260,192,973
| )
|
| | | | (55,764,934 | ) | | | (493,393,898 | ) |
| Net Assets | | | | | | |
| Total decrease | | | (58,865,351 | ) | | | (1,639,249,979 | ) |
| Beginning of period | |
| 1,289,437,654
|
| |
| 2,928,687,633
|
|
| End of period (including accumulated net investment loss of $72,146,553 and $71,679,205, respectively) | | $
| 1,230,572,303
|
| | $
| 1,289,437,654
|
|
1. June 28, 2013 represents the last business day of the Fund’s reporting period. See Note 1 of the accompanying Consolidated Notes.
See accompanying Notes to Consolidated Financial Statements.
18 OPPENHEIMER GOLD & SPECIAL MINERALS FUND
| | | | |
| | |
| | | CONSOLIDATED FINANCIAL HIGHLIGHTS | | |
| | | | | | | | | | | | | | | | | | | | | | | | |
| Class A | | Six Months
Ended
December 31,
2013
(Unaudited) | | | Year Ended
June 28,
20131 | | | Year Ended
June 29,
20121,2 | | | Year Ended
June 30,
20112 | | | Year Ended
June 30,
2010 | | | Year Ended
June 30,
2009 | |
| Per Share Operating Data | | | | | | | | | | | | | | | | | | |
| Net asset value, beginning of period | | $ | 16.45 | | | $ | 29.22 | | | $ | 44.89 | | | $ | 39.93 | | | $ | 26.21 | | | $ | 38.79 | |
| Income (loss) from investment operations: | | | | | | | | | | | | | | | | | | | | | | | | |
| Net investment income (loss)3 | | | 0.01 | | | | (0.01 | ) | | | (0.20 | ) | | | (0.28 | ) | | | (0.26 | ) | | | 0.78 | 4 |
| Net realized and unrealized gain (loss) | | | (0.02 | ) | | | (12.76 | ) | | | (13.06 | ) | | | 10.76 | | | | 14.65 | | | | (12.42 | ) |
| | |
|
|
|
| Total from investment operations | | | (0.01 | ) | | | (12.77 | ) | | | (13.26 | ) | | | 10.48 | | | | 14.39 | | | | (11.64 | ) |
| Dividends and/or distributions to shareholders: | | | | | | | | | | | | | | | | | | | | | | | | |
| Dividends from net investment income | | | 0.00 | | | | 0.00 | | | | (0.62 | ) | | | (4.52 | ) | | | (0.67 | ) | | | (0.49 | ) |
| Distributions from net realized gain | | | 0.00 | | | | 0.00 | | | | (1.78 | ) | | | (1.00 | ) | | | 0.00 | | | | (0.45 | ) |
| Tax return of capital distribution | | | 0.00 | | | | 0.00 | | | | (0.01 | ) | | | 0.00 | | | | 0.00 | | | | 0.00 | |
| | |
|
|
|
| Total dividends and/or distributions to shareholders | | | 0.00 | | | | 0.00 | | | | (2.41 | ) | | | (5.52 | ) | | | (0.67 | ) | | | (0.94 | ) |
| Net asset value, end of period | | $ | 16.44 | | | $ | 16.45 | | | $ | 29.22 | | | $ | 44.89 | | | $ | 39.93 | | | $ | 26.21 | |
| | |
|
|
|
| Total Return, at Net Asset Value5 | | (0.06)% | | | (43.70)% | | | (30.49)% | | | 25.22% | | | 55.18% | | | (28.29)% | |
| | | | | | | | | | | | | | | | | | | | | | | | | |
| Ratios/Supplemental Data | | | | | | | | | | | | | | | | | | |
| Net assets, end of period (in thousands) | | $ | 738,715 | | | $ | 790,790 | | | $ | 1,611,924 | | | $ | 3,140,551 | | | $ | 2,500,205 | | | $ | 1,439,082 | |
| Average net assets (in thousands) | | $ | 858,101 | | | $ | 1,480,784 | | | $ | 2,376,520 | | | $ | 3,277,921 | | | $ | 1,983,223 | | | $ | 1,184,093 | |
| Ratios to average net assets:6 | | | | | | | | | | | | | | | | | | | | | | | | |
| Net investment income (loss) | | | 0.06 | % | | | (0.04 | )% | | | (0.51 | )% | | | (0.61 | )% | | | (0.74 | )% | | | 3.35 | %4 |
| Total expenses7 | | | 1.38 | % | | | 1.30 | % | | | 1.22 | % | | | 1.07 | % | | | 1.12 | % | | | 1.20 | % |
| Expenses after payments, waivers and/or reimbursements and reduction to custodian expenses | | | 1.25 | % | | | 1.23 | % | | | 1.20 | % | | | 1.07 | % | | | 1.12 | % | | | 1.19 | % |
| Portfolio turnover rate | | | 41 | % | | | 41 | % | | | 48 | % | | | 37 | % | | | 20 | % | | | 81 | % |
19 OPPENHEIMER GOLD & SPECIAL MINERALS FUND
| | | | |
| | |
| | | CONSOLIDATED FINANCIAL HIGHLIGHTS Continued | | |
1. June 28, 2013 and June 29, 2012 represent the last business days of the Fund’s reporting periods. See Note 1 of the accompanying Consolidated Notes.
2. Certain amounts have been restated to reflect a change in method of accounting. See Note 1 of the accompanying Consolidated Notes.
3. Per share amounts calculated based on the average shares outstanding during the period.
4. Net investment income per share and the net investment income ratio include $0.67 and 2.89%, respectively, resulting from a special dividend from Anglo Ferrous Brazil SA in July 2008.
5. Assumes an initial investment on the business day before the first day of the fiscal period, with all dividends and distributions reinvested in additional shares on the reinvestment date, and redemption at the net asset value calculated on the last business day of the fiscal period. Sales charges are not reflected in the total returns. Total returns are not annualized for periods less than one full year. Returns do not reflect the deduction of taxes that a shareholder would pay on fund distributions or the redemption of fund shares.
6. Annualized for periods less than one full year.
7. Total expenses including indirect expenses from affiliated fund were as follows:
| | | | |
| Six Months Ended December 31, 2013 | | | 1.38 | % |
| Year Ended June 28, 2013 | | | 1.30 | % |
| Year Ended June 29, 2012 | | | 1.22 | % |
| Year Ended June 30, 2011 | | | 1.07 | % |
| Year Ended June 30, 2010 | | | 1.12 | % |
| Year Ended June 30, 2009 | | | 1.20 | % |
See accompanying Notes to Consolidated Financial Statements.
20 OPPENHEIMER GOLD & SPECIAL MINERALS FUND
| | | | | | | | | | | | | | | | | | | | | | | | |
| Class B | | Six Months
Ended
December 31,
2013
(Unaudited) | | | Year Ended
June 28,
20131 | | | Year Ended
June 29,
20121,2 | | | Year Ended
June 30,
20112 | | | Year Ended
June 30,
2010 | | | Year Ended
June 30,
2009 | |
| Per Share Operating Data | | | | | | | | | | | | | | | | | | |
| Net asset value, beginning of period | | $ | 15.49 | | | $ | 27.77 | | | $ | 42.76 | | | $ | 38.26 | | | $ | 25.17 | | | $ | 37.00 | |
| Income (loss) from investment operations: | | | | | | | | | | | | | | | | | | | | | | | | |
| Net investment income (loss)3 | | | (0.06 | ) | | | (0.26 | ) | | | (0.48 | ) | | | (0.64 | ) | | | (0.54 | ) | | | 0.62 | 4 |
| Net realized and unrealized gain (loss) | | | (0.01 | ) | | | (12.02 | ) | | | (12.41 | ) | | | 10.30 | | | | 14.06 | | | | (11.78 | ) |
| | |
|
|
|
| Total from investment operations | | | (0.07 | ) | | | (12.28 | ) | | | (12.89 | ) | | | 9.66 | | | | 13.52 | | | | (11.16 | ) |
| Dividends and/or distributions to shareholders: | | | | | | | | | | | | | | | | | | | | | | | | |
| Dividends from net investment income | | | 0.00 | | | | 0.00 | | | | (0.31 | ) | | | (4.16 | ) | | | (0.43 | ) | | | (0.22 | ) |
| Distributions from net realized gain | | | 0.00 | | | | 0.00 | | | | (1.78 | ) | | | (1.00 | ) | | | 0.00 | | | | (0.45 | ) |
| Tax return of capital distribution | | | 0.00 | | | | 0.00 | | | | (0.01 | ) | | | 0.00 | | | | 0.00 | | | | 0.00 | |
| | |
|
|
|
| Total dividends and/or distributions to shareholders | | | 0.00 | | | | 0.00 | | | | (2.10 | ) | | | (5.16 | ) | | | (0.43 | ) | | | (0.67 | ) |
| Net asset value, end of period | | $ | 15.42 | | | $ | 15.49 | | | $ | 27.77 | | | $ | 42.76 | | | $ | 38.26 | | | $ | 25.17 | |
| | |
|
|
|
| Total Return, at Net Asset Value5 | | (0.52)% | | | (44.18)% | | | (31.03)% | | | 24.19% | | | 53.86% | | | (28.91)% | |
| | | | | | | | | | | | | | | | | | | | | | | | | |
| Ratios/Supplemental Data | | | | | | | | | | | | | | | | | | |
| Net assets, end of period (in thousands) | | $ | 28,241 | | | $ | 35,001 | | | $ | 95,198 | | | $ | 171,961 | | | $ | 149,228 | | | $ | 111,935 | |
| Average net assets (in thousands) | | $ | 34,697 | | | $ | 78,911 | | | $ | 139,623 | | | $ | 178,499 | | | $ | 137,358 | | | $ | 101,129 | |
| Ratios to average net assets:6 | | | | | | | | | | | | | | | | | | | | | | | | |
| Net investment income (loss) | | | (0.75 | )% | | | (0.94 | )% | | | (1.29 | )% | | | (1.44 | )% | | | (1.61 | )% | | | 2.79 | %4 |
| Total expenses7 | | | 2.41 | % | | | 2.21 | % | | | 2.01 | % | | | 1.91 | % | | | 1.98 | % | | | 2.09 | % |
| Expenses after payments, waivers and/or reimbursements and reduction to custodian expenses | | | 2.10 | % | | | 2.09 | % | | | 1.99 | % | | | 1.91 | % | | | 1.98 | % | | | 2.03 | % |
| Portfolio turnover rate | | | 41 | % | | | 41 | % | | | 48 | % | | | 37 | % | | | 20 | % | | | 81 | % |
21 OPPENHEIMER GOLD & SPECIAL MINERALS FUND
| | | | |
| | |
| | | CONSOLIDATED FINANCIAL HIGHLIGHTS Continued | | |
1. June 28, 2013 and June 29, 2012 represent the last business days of the Fund’s reporting periods. See Note 1 of the accompanying Consolidated Notes.
2. Certain amounts have been restated to reflect a change in method of accounting. See Note 1 of the accompanying Consolidated Notes.
3. Per share amounts calculated based on the average shares outstanding during the period.
4. Net investment income per share and the net investment income ratio include $0.65 and 2.89%, respectively, resulting from a special dividend from Anglo Ferrous Brazil SA in July 2008.
5. Assumes an initial investment on the business day before the first day of the fiscal period, with all dividends and distributions reinvested in additional shares on the reinvestment date, and redemption at the net asset value calculated on the last business day of the fiscal period. Sales charges are not reflected in the total returns. Total returns are not annualized for periods less than one full year. Returns do not reflect the deduction of taxes that a shareholder would pay on fund distributions or the redemption of fund shares.
6. Annualized for periods less than one full year.
7. Total expenses including indirect expenses from affiliated fund were as follows:
| | | | |
| Six Months Ended December 31, 2013 | | | 2.41 | % |
| Year Ended June 28, 2013 | | | 2.21 | % |
| Year Ended June 29, 2012 | | | 2.01 | % |
| Year Ended June 30, 2011 | | | 1.91 | % |
| Year Ended June 30, 2010 | | | 1.98 | % |
| Year Ended June 30, 2009 | | | 2.09 | % |
See accompanying Notes to Consolidated Financial Statements.
22 OPPENHEIMER GOLD & SPECIAL MINERALS FUND
| | | | | | | | | | | | | | | | | | | | | | | | |
| Class C | | Six Months
Ended
December 31,
2013
(Unaudited) | | | Year Ended
June 28,
20131 | | | Year Ended
June 29,
20121,2 | | | Year Ended
June 30,
20112 | | | Year Ended
June 30,
2010 | | | Year Ended
June 30,
2009 | |
| Per Share Operating Data | | | | | | | | | | | | | | | | | | |
| Net asset value, beginning of period | | $ | 15.37 | | | $ | 27.52 | | | $ | 42.46 | | | $ | 38.04 | | | $ | 25.05 | | | $ | 36.89 | |
| Income (loss) from investment operations: | | | | | | | | | | | | | | | | | | | | | | | | |
| Net investment income (loss)3 | | | (0.06 | ) | | | (0.21 | ) | | | (0.43 | ) | | | (0.60 | ) | | | (0.50 | ) | | | 0.61 | 4 |
| Net realized and unrealized gain (loss) | | | (0.01 | ) | | | (11.94 | ) | | | (12.32 | ) | | | 10.26 | | | | 13.98 | | | | (11.74 | ) |
| | |
|
|
|
| Total from investment operations | | | (0.07 | ) | | | (12.15 | ) | | | (12.75 | ) | | | 9.66 | | | | 13.48 | | | | (11.13 | ) |
| Dividends and/or distributions to shareholders: | | | | | | | | | | | | | | | | | | | | | | | | |
| Dividends from net investment income | | | 0.00 | | | | 0.00 | | | | (0.40 | ) | | | (4.24 | ) | | | (0.49 | ) | | | (0.26 | ) |
| Distributions from net realized gain | | | 0.00 | | | | 0.00 | | | | (1.78 | ) | | | (1.00 | ) | | | 0.00 | | | | (0.45 | ) |
| Tax return of capital distribution | | | 0.00 | | | | 0.00 | | | | (0.01 | ) | | | 0.00 | | | | 0.00 | | | | 0.00 | |
| | |
|
|
|
| Total dividends and/or distributions to shareholders | | | 0.00 | | | | 0.00 | | | | (2.19 | ) | | | (5.24 | ) | | | (0.49 | ) | | | (0.71 | ) |
| Net asset value, end of period | | $ | 15.30 | | | $ | 15.37 | | | $ | 27.52 | | | $ | 42.46 | | | $ | 38.04 | | | $ | 25.05 | |
| | |
|
|
|
| Total Return, at Net Asset Value5 | | (0.52)% | | | (44.11)% | | | (30.96)% | | | 24.31% | | | 53.98% | | | (28.84)% | |
| | | | | | | | | | | | | | | | | | | | | | | | | |
| Ratios/Supplemental Data | | | | | | | | | | | | | | | | | | |
| Net assets, end of period (in thousands) | | $ | 178,141 | | | $ | 198,474 | | | $ | 416,485 | | | $ | 637,676 | | | $ | 476,835 | | | $ | 288,407 | |
| Average net assets (in thousands) | | $ | 210,442 | | | $ | 383,403 | | | $ | 559,825 | | | $ | 620,759 | | | $ | 396,328 | | | $ | 252,930 | |
| Ratios to average net assets:6 | | | | | | | | | | | | | | | | | | | | | | | | |
| Net investment income (loss) | | | (0.74 | )% | | | (0.78 | )% | | | (1.16 | )% | | | (1.35 | )% | | | (1.51 | )% | | | 2.76 | %4 |
| Total expenses7 | | | 2.12 | % | | | 1.99 | % | | | 1.89 | % | | | 1.81 | % | | | 1.88 | % | | | 1.98 | % |
| Expenses after payments, waivers and/or reimbursements and reduction to custodian expenses | | | 2.06 | % | | | 1.97 | % | | | 1.87 | % | | | 1.81 | % | | | 1.88 | % | | | 1.96 | % |
| Portfolio turnover rate | | | 41 | % | | | 41 | % | | | 48 | % | | | 37 | % | | | 20 | % | | | 81 | % |
23 OPPENHEIMER GOLD & SPECIAL MINERALS FUND
| | | | |
| | |
| | | CONSOLIDATED FINANCIAL HIGHLIGHTS Continued | | |
1. June 28, 2013 and June 29, 2012 represent the last business days of the Fund’s reporting periods. See Note 1 of the accompanying Consolidated Notes.
2. Certain amounts have been restated to reflect a change in method of accounting. See Note 1 of the accompanying Consolidated Notes.
3. Per share amounts calculated based on the average shares outstanding during the period.
4. Net investment income per share and the net investment income ratio include $0.64 and 2.89%, respectively, resulting from a special dividend from Anglo Ferrous Brazil SA in July 2008.
5. Assumes an initial investment on the business day before the first day of the fiscal period, with all dividends and distributions reinvested in additional shares on the reinvestment date, and redemption at the net asset value calculated on the last business day of the fiscal period. Sales charges are not reflected in the total returns. Total returns are not annualized for periods less than one full year. Returns do not reflect the deduction of taxes that a shareholder would pay on fund distributions or the redemption of fund shares.
6. Annualized for periods less than one full year.
7. Total expenses including indirect expenses from affiliated fund were as follows:
| | | | |
| Six Months Ended December 31, 2013 | | | 2.12 | % |
| Year Ended June 28, 2013 | | | 1.99 | % |
| Year Ended June 29, 2012 | | | 1.89 | % |
| Year Ended June 30, 2011 | | | 1.81 | % |
| Year Ended June 30, 2010 | | | 1.88 | % |
| Year Ended June 30, 2009 | | | 1.98 | % |
See accompanying Notes to Consolidated Financial Statements.
24 OPPENHEIMER GOLD & SPECIAL MINERALS FUND
| | | | | | | | |
| Class I | | Six Months
Ended
December 31,
2013
(Unaudited) | | | Period Ended
June 28,
20131,2 | |
| Per Share Operating Data | | | | | | |
| Net asset value, beginning of period | | $ | 16.43 | | | $ | 35.07 | |
| Income (loss) from investment operations: | | | | | | | | |
| Net investment income3 | | | 0.05 | | | | 0.33 | |
| Net realized and unrealized loss | | | (0.02 | ) | | | (18.97 | ) |
| | |
|
|
|
| Total from investment operations | | | 0.03 | | | | (18.64 | ) |
| Dividends and/or distributions to shareholders: | | | | | | | | |
| Dividends from net investment income | | | 0.00 | | | | 0.00 | |
| Distributions from net realized gain | | | 0.00 | | | | 0.00 | |
| Tax return of capital distribution | | | 0.00 | | | | 0.00 | |
| | |
|
|
|
| Total dividends and/or distributions to shareholders | | | 0.00 | | | | 0.00 | |
| Net asset value, end of period | | $ | 16.46 | | | $ | 16.43 | |
| | |
|
|
|
| Total Return, at Net Asset Value4 | | 0.18% | | | (53.14)% | |
| | | | | | | | | |
| Ratios/Supplemental Data | | | | | | |
| Net assets, end of period (in thousands) | | $ | 32,949 | | | $ | 24,687 | |
| Average net assets (in thousands) | | $ | 32,354 | | | $ | 4,739 | |
| Ratios to average net assets:5 | | | | | | | | |
| Net investment income | | | 0.57 | % | | | 2.62 | % |
| Total expenses6 | | | 0.73 | % | | | 0.94 | % |
| Expenses after payments, waivers and/or reimbursements and reduction to custodian expenses | | | 0.72 | % | | | 0.92 | % |
| Portfolio turnover rate | | | 41 | % | | | 41 | % |
1. June 28, 2013 represents the last business day of the Fund’s reporting period. See Note 1 of the accompanying Consolidated Notes.
2. For the period from October 26, 2012 (inception of offering) to June 28, 2013.
3. Per share amounts calculated based on the average shares outstanding during the period.
4. Assumes an initial investment on the business day before the first day of the fiscal period, with all dividends and distributions reinvested in additional shares on the reinvestment date, and redemption at the net asset value calculated on the last business day of the fiscal period. Sales charges are not reflected in the total returns. Total returns are not annualized for periods less than one full year. Returns do not reflect the deduction of taxes that a shareholder would pay on fund distributions or the redemption of fund shares.
5. Annualized for periods less than one full year.
6. Total expenses including indirect expenses from affiliated fund were as follows:
| | | | |
| Six Months Ended December 31, 2013 | | | 0.73 | % |
| Period Ended June 28, 2013 | | | 0.94 | % |
See accompanying Notes to Consolidated Financial Statements.
25 OPPENHEIMER GOLD & SPECIAL MINERALS FUND
| | | | |
| | |
| | | CONSOLIDATED FINANCIAL HIGHLIGHTS Continued | | |
| | | | | | | | | | | | | | | | | | | | | | | | |
| Class N | | Six Months
Ended
December 31,
2013
(Unaudited) | | | Year Ended
June 28,
20131 | | | Year Ended
June 29,
20121,2 | | | Year Ended
June 30,
20112 | | | Year Ended
June 30,
2010 | | | Year Ended
June 30,
2009 | |
| Per Share Operating Data | | | | | | | | | | | | | | | | | | |
| Net asset value, beginning of period | | $ | 15.85 | | | $ | 28.23 | | | $ | 43.53 | | | $ | 38.88 | | | $ | 25.58 | | | $ | 37.94 | |
| Income (loss) from investment operations: | | | | | | | | | | | | | | | | | | | | | | | | |
| Net investment income (loss)3 | | | (0.03 | ) | | | (0.08 | ) | | | (0.29 | ) | | | (0.44 | )�� | | | (0.39 | ) | | | 0.57 | 4 |
| Net realized and unrealized gain (loss) | | | (0.01 | ) | | | (12.30 | ) | | | (12.64 | ) | | | 10.49 | | | | 14.30 | | | | (12.04 | ) |
| | |
|
|
|
| Total from investment operations | | | (0.04 | ) | | | (12.38 | ) | | | (12.93 | ) | | | 10.05 | | | | 13.91 | | | | (11.47 | ) |
| Dividends and/or distributions to shareholders: | | | | | | | | | | | | | | | | | | | | | | | | |
| Dividends from net investment income | | | 0.00 | | | | 0.00 | | | | (0.58 | ) | | | (4.40 | ) | | | (0.61 | ) | | | (0.44 | ) |
| Distributions from net realized gain | | | 0.00 | | | | 0.00 | | | | (1.78 | ) | | | (1.00 | ) | | | 0.00 | | | | (0.45 | ) |
| Tax return of capital distribution | | | 0.00 | | | | 0.00 | | | | (0.01 | ) | | | 0.00 | | | | 0.00 | | | | 0.00 | |
| | |
|
|
|
| Total dividends and/or distributions to shareholders | | | 0.00 | | | | 0.00 | | | | (2.37 | ) | | | (5.40 | ) | | | (0.61 | ) | | | (0.89 | ) |
| Net asset value, end of period | | $ | 15.81 | | | $ | 15.85 | | | $ | 28.23 | | | $ | 43.53 | | | $ | 38.88 | | | $ | 25.58 | |
| | |
|
|
|
| Total Return, at Net Asset Value5 | | (0.25)% | | | (43.86)% | | | (30.67)% | | | 24.79% | | | 54.60% | | | (28.55)% | |
| | | | | | | | | | | | | | | | | | | | | | | | | |
| Ratios/Supplemental Data | | | | | | | | | | | | | | | | | | |
| Net assets, end of period (in thousands) | | $ | 122,464 | | | $ | 115,079 | | | $ | 199,154 | | | $ | 263,079 | | | $ | 157,461 | | | $ | 72,805 | |
| Average net assets (in thousands) | | $ | 130,994 | | | $ | 191,117 | | | $ | 246,052 | | | $ | 236,220 | | | $ | 115,927 | | | $ | 54,016 | |
| Ratios to average net assets:6 | | | | | | | | | | | | | | | | | | | | | | | | |
| Net investment income (loss) | | | (0.29 | )% | | | (0.30 | )% | | | (0.77 | )% | | | (0.96 | )% | | | (1.12 | )% | | | 2.55 | %4 |
| Total expenses7 | | | 1.74 | % | | | 1.75 | % | | | 1.51 | % | | | 1.43 | % | | | 1.55 | % | | | 1.63 | % |
| Expenses after payments, waivers and/or reimbursements and reduction to custodian expenses | | | 1.59 | % | | | 1.52 | % | | | 1.49 | % | | | 1.43 | % | | | 1.49 | % | | | 1.52 | % |
| Portfolio turnover rate | | | 41 | % | | | 41 | % | | | 48 | % | | | 37 | % | | | 20 | % | | | 81 | % |
26 OPPENHEIMER GOLD & SPECIAL MINERALS FUND
1. June 28, 2013 and June 29, 2012 represent the last business days of the Fund’s reporting periods. See Note 1 of the accompanying Consolidated Notes.
2. Certain amounts have been restated to reflect a change in method of accounting. See Note 1 of the accompanying Consolidated Notes.
3. Per share amounts calculated based on the average shares outstanding during the period.
4. Net investment income per share and the net investment income ratio include $0.65 and 2.89%, respectively, resulting from a special dividend from Anglo Ferrous Brazil SA in July 2008.
5. Assumes an initial investment on the business day before the first day of the fiscal period, with all dividends and distributions reinvested in additional shares on the reinvestment date, and redemption at the net asset value calculated on the last business day of the fiscal period. Sales charges are not reflected in the total returns. Total returns are not annualized for periods less than one full year. Returns do not reflect the deduction of taxes that a shareholder would pay on fund distributions or the redemption of fund shares.
6. Annualized for periods less than one full year.
7. Total expenses including indirect expenses from affiliated fund were as follows:
| | | | |
| Six Months Ended December 31, 2013 | | | 1.74 | % |
| Year Ended June 28, 2013 | | | 1.75 | % |
| Year Ended June 29, 2012 | | | 1.51 | % |
| Year Ended June 30, 2011 | | | 1.43 | % |
| Year Ended June 30, 2010 | | | 1.55 | % |
| Year Ended June 30, 2009 | | | 1.63 | % |
See accompanying Notes to Consolidated Financial Statements.
27 OPPENHEIMER GOLD & SPECIAL MINERALS FUND
| | | | |
| | |
| | | CONSOLIDATED FINANCIAL HIGHLIGHTS Continued | | |
| | | | | | | | | | | | | | | | |
| Class Y | | Six Months
Ended
December 31,
2013
(Unaudited) | | | Year Ended
June 28,
20131 | | | Year Ended
June 29,
20121,2 | | | Period Ended
June 30,
20112,3 | |
| Per Share Operating Data | | | | | | | | | | | | |
| Net asset value, beginning of period | | $ | 16.37 | | | $ | 29.06 | | | $ | 44.90 | | | $ | 45.55 | |
| Income (loss) from investment operations: | | | | | | | | | | | | | | | | |
| Net investment income (loss)4 | | | 0.03 | | | | 0.01 | | | | (0.10 | ) | | | (0.05 | ) |
| Net realized and unrealized gain (loss) | | | (0.01 | ) | | | (12.70 | ) | | | (13.05 | ) | | | 5.09 | |
| | |
|
|
|
| Total from investment operations | | | 0.02 | | | | (12.69 | ) | | | (13.15 | ) | | | 5.04 | |
| Dividends and/or distributions to shareholders: | | | | | | | | | | | | | | | | |
| Dividends from net investment income | | | 0.00 | | | | 0.00 | | | | (0.89 | ) | | | (4.69 | ) |
| Distributions from net realized gain | | | 0.00 | | | | 0.00 | | | | (1.78 | ) | | | (1.00 | ) |
| Tax return of capital distribution | | | 0.00 | | | | 0.00 | | | | (0.02 | ) | | | 0.00 | |
| | |
|
|
|
| Total dividends and/or distributions to shareholders | | | 0.00 | | | | 0.00 | | | | (2.69 | ) | | | (5.69 | ) |
| Net asset value, end of period | | $ | 16.39 | | | $ | 16.37 | | | $ | 29.06 | | | $ | 44.90 | |
| | |
|
|
|
| Total Return, at Net Asset Value5 | | 0.06% | | | (43.63)% | | | (30.34)% | | | 10.16% | |
| | | | | | | | | | | | | | | | | |
| Ratios/Supplemental Data | | | | | | | | | | | | |
| Net assets, end of period (in thousands) | | $ | 130,062 | | | $ | 125,407 | | | $ | 605,927 | | | $ | 222,043 | |
| Average net assets (in thousands) | | $ | 138,355 | | | $ | 559,544 | | | $ | 568,371 | | | $ | 89,984 | |
| Ratios to average net assets:6 | | | | | | | | | | | | | | | | |
| Net investment income (loss) | | | 0.36 | % | | | 0.05 | % | | | (0.27 | )% | | | (0.13 | )% |
| Total expenses7 | | | 1.01 | % | | | 1.19 | % | | | 1.06 | % | | | 0.66 | % |
| Expenses after payments, waivers and/or reimbursements and reduction to custodian expenses | | | 0.95 | % | | | 1.08 | % | | | 1.03 | % | | | 0.66 | % |
| Portfolio turnover rate | | | 41 | % | | | 41 | % | | | 48 | % | | | 37 | % |
28 OPPENHEIMER GOLD & SPECIAL MINERALS FUND
1. June 28, 2013 and June 29, 2012 represent the last business days of the Fund’s reporting periods. See Note 1 of the accompanying Consolidated Notes.
2. Certain amounts have been restated to reflect a change in method of accounting. See Note 1 of the accompanying Consolidated Notes.
3. For the period from September 7, 2010 (inception of offering) to June 30, 2011.
4. Per share amounts calculated based on the average shares outstanding during the period.
5. Assumes an initial investment on the business day before the first day of the fiscal period, with all dividends and distributions reinvested in additional shares on the reinvestment date, and redemption at the net asset value calculated on the last business day of the fiscal period. Sales charges are not reflected in the total returns. Total returns are not annualized for periods less than one full year. Returns do not reflect the deduction of taxes that a shareholder would pay on fund distributions or the redemption of fund shares.
6. Annualized for periods less than one full year.
7. Total expenses including indirect expenses from affiliated fund were as follows:
| | | | |
| Six Months Ended December 31, 2013 | | | 1.01 | % |
| Year Ended June 28, 2013 | | | 1.19 | % |
| Year Ended June 29, 2012 | | | 1.06 | % |
| Period Ended June 30, 2011 | | | 0.66 | % |
See accompanying Notes to Consolidated Financial Statements.
29 OPPENHEIMER GOLD & SPECIAL MINERALS FUND
| | | | |
| | |
| | | NOTES TO CONSOLIDATED FINANCIAL STATEMENTS December 31, 2013 Unaudited | | |
1. Significant Accounting Policies
Oppenheimer Gold & Special Minerals Fund (the “Fund”) is registered under the Investment Company Act of 1940, as amended, as a non-diversified open-end management investment company. The Fund’s investment objective is to seek capital appreciation. The Fund’s investment adviser is OFI Global Asset Management, Inc. (“OFI Global” or the “Manager”), a wholly-owned subsidiary of OppenheimerFunds, Inc. (“OFI” or the “Sub-Adviser”). The Manager has entered into a sub-advisory agreement with OFI.
The Fund offers Class A, Class C, Class I, Class N and Class Y shares, and previously offered Class B shares for new purchase through June 29, 2012. Subsequent to that date, no new purchases of Class B shares are permitted, however reinvestment of dividend and/or capital gain distributions and exchanges of Class B shares into and from other Oppenheimer funds will be allowed. Class A shares are sold at their offering price, which is normally net asset value plus a front-end sales charge. Class C and Class N shares are sold, and Class B shares were sold, without a front-end sales charge but may be subject to a contingent deferred sales charge (“CDSC”). Class N shares are sold only through retirement plans. Retirement plans that offer Class N shares may impose charges on those accounts. Class I and Class Y shares are sold to certain institutional investors or intermediaries without either a front-end sales charge or a CDSC, however, the intermediaries may impose charges on their accountholders who beneficially own Class I and Class Y shares. All classes of shares have identical rights and voting privileges with respect to the Fund in general and exclusive voting rights on matters that affect that class alone. Earnings, net assets and net asset value per share may differ due to each class having its own expenses, such as transfer and shareholder servicing agent fees and shareholder communications, directly attributable to that class. Class A, B, C and N shares have separate distribution and/or service plans under which they pay fees. Class I and Class Y shares do not pay such fees. Class B shares will automatically convert to Class A shares 72 months after the date of purchase.
The following is a summary of significant accounting policies consistently followed by the Fund.
Previous Annual Period. The last day of the Fund’s fiscal year was the last day the New York Stock Exchange was open for trading. The Fund’s consolidated financial statements have been presented through that date to maintain consistency with the Fund’s net asset value calculations used for shareholder transactions.
Basis for Consolidation. The Fund has established a Cayman Islands exempted company, Oppenheimer Gold & Special Minerals Fund (Cayman) Ltd., which is wholly-owned and controlled by the Fund (the “Subsidiary”). The Fund and Subsidiary are both managed by the Manager. The Fund may invest up to 25% of its total assets in the Subsidiary. The subsidiary invests primarily in shares of exchange-traded funds that invest in gold bullion (“Gold ETFs”), commodity-linked derivatives related to gold or other special minerals (including commodity futures, financial futures, options and swap contracts), and certain fixed-income securities and other investments that may serve as margin or collateral for the Subsidiary’s derivatives positions. Investments in the Subsidiary are intended to provide the Fund with exposure to
30 OPPENHEIMER GOLD & SPECIAL MINERALS FUND
1. Significant Accounting Policies (Continued)
minerals commodities market returns within the limitations of the federal tax requirements that apply to the Fund. The Subsidiary is subject to the same investment restrictions and guidelines, and follows the same compliance policies and procedures, as the Fund.
The financial statements have been consolidated and include accounts of the Fund and the Subsidiary. Accordingly, all inter-company transactions and balances have been eliminated. At December 31, 2013, the Fund owned 4,056 shares with a market value of $30,364,789.
Investment in Oppenheimer Institutional Money Market Fund. The Fund is permitted to invest daily available cash balances in an affiliated money market fund. The Fund may invest the available cash in Class E shares of Oppenheimer Institutional Money Market Fund (“IMMF”) to seek current income while preserving liquidity. IMMF is a registered open-end management investment company, regulated as a money market fund under the Investment Company Act of 1940, as amended. The Manager is the investment adviser of IMMF, and the Sub-Adviser provides investment and related advisory services to IMMF. When applicable, the Fund’s investment in IMMF is included in the Consolidated Statement of Investments. Shares of IMMF are valued at their net asset value per share. As a shareholder, the Fund is subject to its proportional share of IMMF’s Class E expenses, including its management fee. The Manager will waive fees and/or reimburse Fund expenses in an amount equal to the indirect management fees incurred through the Fund’s investment in IMMF.
Concentration Risk. Concentration risk is the risk that the Fund’s investments in securities of companies in one industry may cause it to be more exposed to changes in that industry or market sector as compared to a more broadly diversified fund. The Fund invests primarily in the mining and metals industry.
Foreign Currency Translation. The Fund’s accounting records are maintained in U.S. dollars. The values of securities denominated in foreign currencies and amounts related to the purchase and sale of foreign securities and foreign investment income are translated into U.S. dollars as of the close of the New York Stock Exchange (the “Exchange”), normally 4:00 P.M. Eastern time, on each day the Exchange is open for trading. Foreign exchange rates may be valued primarily using a reliable bank, dealer or service authorized by the Board of Trustees.
Reported net realized gains and losses from foreign currency transactions arise from sales of portfolio securities, sales and maturities of short-term securities, sales of foreign currencies, exchange rate fluctuations between the trade and settlement dates on securities transactions, and the difference between the amounts of dividends, interest, and foreign withholding taxes recorded on the Fund’s books and the U.S. dollar equivalent of the amounts actually received or paid. Net unrealized appreciation and depreciation on the translation of assets and liabilities denominated in foreign currencies arise from changes in the values of assets and liabilities, including investments in securities at fiscal period end, resulting from changes in exchange rates.
The effect of changes in foreign currency exchange rates on investments is separately identified from the fluctuations arising from changes in market values of securities held and reported with all other foreign currency gains and losses in the Fund’s Consolidated Statement of Operations.
31 OPPENHEIMER GOLD & SPECIAL MINERALS FUND
| | | | |
| | |
| | | NOTES TO CONSOLIDATED FINANCIAL STATEMENTS Unaudited / Continued | | |
1. Significant Accounting Policies (Continued)
Allocation of Income, Expenses, Gains and Losses. Income, expenses (other than those attributable to a specific class), gains and losses are allocated on a daily basis to each class of shares based upon the relative proportion of net assets represented by such class. Operating expenses directly attributable to a specific class are charged against the operations of that class.
Federal Taxes. The Fund intends to comply with provisions of the Internal Revenue Code applicable to regulated investment companies and to distribute substantially all of its investment company taxable income to shareholders. Therefore, no federal income or excise tax provision is required. The Fund files income tax returns in U.S. federal and applicable state jurisdictions. The statute of limitations on the Fund’s tax return filings generally remain open for the three preceding fiscal reporting period ends.
During the fiscal year ended June 28, 2013, the Fund did not utilize any capital loss carryforward to offset capital gains realized in that fiscal year. The Fund had straddle losses of $140,191. Details of the fiscal year ended June 28, 2013 capital loss carryforwards are included in the table below. Capital loss carryforwards with no expiration, if any, must be utilized prior to those with expiration dates. Capital losses with no expiration will be carried forward to future years if not offset by gains.
| | | | |
| Expiring | | | |
| No expiration | | $ | 503,695,029 | |
As of December 31, 2013, it is estimated that the capital loss carryforwards would be $971,536,055 which will not expire. The estimated capital loss carryforward represents the carryforward as of the end of the last fiscal year, increased or decreased by capital losses or gains realized in the first six months of the current fiscal year. During the six months ended December 31, 2013, it is estimated that the Fund will not utilize any capital loss carryforward to offset realized capital gains.
Net investment income (loss) and net realized gain (loss) may differ for financial statement and tax purposes. The character of dividends and distributions made during the fiscal year from net investment income or net realized gains may differ from their ultimate characterization for federal income tax purposes. Also, due to timing of dividends and distributions, the fiscal year in which amounts are distributed may differ from the fiscal year in which the income or net realized gain was recorded by the Fund.
The aggregate cost of securities and other investments and the composition of unrealized appreciation and depreciation of securities and other investments for federal income tax purposes as of December 31, 2013 are noted in the following table. The primary difference between book and tax appreciation or depreciation of securities and other investments, if applicable, is attributable to the tax deferral of losses or tax realization of financial statement unrealized gain or loss.
32 OPPENHEIMER GOLD & SPECIAL MINERALS FUND
1. Significant Accounting Policies (Continued)
| | | | |
| Federal tax cost of securities | | $ | 1,538,588,565 | |
| Federal tax cost of other investments | | | (3,380,246 | ) |
| | |
|
|
|
| Total federal tax cost | | $ | 1,535,208,319 | |
| | |
|
|
|
| Gross unrealized appreciation | | $ | 81,177,590 | |
| Gross unrealized depreciation | | | (377,439,281 | ) |
| | |
|
|
|
| Net unrealized depreciation | | $ | (296,261,691 | ) |
| | |
|
|
|
Trustees’ Compensation. The Fund has adopted an unfunded retirement plan (the “Plan”) for the Fund’s independent trustees. Benefits are based on years of service and fees paid to each trustee during their period of service. The Plan was frozen with respect to adding new participants effective December 31, 2006 (the “Freeze Date”) and existing Plan Participants as of the Freeze Date will continue to receive accrued benefits under the Plan. Active independent trustees as of the Freeze Date have each elected a distribution method with respect to their benefits under the Plan. During the six months ended December 31, 2013, the Fund’s projected benefit obligations, payments to retired trustees and accumulated liability were as follows:
| | | | |
| Projected Benefit Obligations Increased | | $ | 4,165 | |
| Payments Made to Retired Trustees | | | — | |
| Accumulated Liability as of December 31, 2013 | | | 102,403 | |
The Board of Trustees has adopted a compensation deferral plan for independent trustees that enables trustees to elect to defer receipt of all or a portion of the annual compensation they are entitled to receive from the Fund. For purposes of determining the amount owed to the Trustee under the plan, deferred amounts are treated as though equal dollar amounts had been invested in shares of the Fund or in other Oppenheimer funds selected by the Trustee. The Fund purchases shares of the funds selected for deferral by the Trustee in amounts equal to his or her deemed investment, resulting in a Fund asset equal to the deferred compensation liability. Such assets are included as a component of “Other” within the asset section of the Consolidated Statement of Assets and Liabilities. Deferral of trustees’ fees under the plan will not affect the net assets of the Fund, and will not materially affect the Fund’s assets, liabilities or net investment income per share. Amounts will be deferred until distributed in accordance with the compensation deferral plan.
Dividends and Distributions to Shareholders. Dividends and distributions to shareholders, which are determined in accordance with income tax regulations and may differ from U.S. generally accepted accounting principles, are recorded on the ex-dividend date. Income and capital gain distributions, if any, are declared and paid annually or at other times as deemed necessary by the Manager.
The tax character of distributions is determined as of the Fund’s fiscal year end. Therefore, a portion of the Fund’s distributions made to shareholders prior to the Fund’s fiscal year end may ultimately be categorized as a tax return of capital.
33 OPPENHEIMER GOLD & SPECIAL MINERALS FUND
| | | | |
| | |
| | | NOTES TO CONSOLIDATED FINANCIAL STATEMENTS Unaudited / Continued | | |
1. Significant Accounting Policies (Continued)
Investment Income. Dividend income is recorded on the ex-dividend date or upon ex-dividend notification in the case of certain foreign dividends where the ex-dividend date may have passed. Non-cash dividends included in dividend income, if any, are recorded at the fair market value of the securities received. Interest income is recognized on an accrual basis. Discount and premium, which are included in interest income on the Consolidated Statement of Operations, are amortized or accreted daily.
Custodian Fees. “Custodian fees and expenses” in the Consolidated Statement of Operations may include interest expense incurred by the Fund on any cash overdrafts of its custodian account during the period. Such cash overdrafts may result from the effects of failed trades in portfolio securities and from cash outflows resulting from unanticipated shareholder redemption activity. The Fund pays interest to its custodian on such cash overdrafts, to the extent they are not offset by positive cash balances maintained by the Fund, at a rate equal to the Federal Funds Rate plus 0.50%. The “Reduction to custodian expenses” line item, if applicable, represents earnings on cash balances maintained by the Fund during the period. Such interest expense and other custodian fees may be paid with these earnings.
Security Transactions. Security transactions are recorded on the trade date. Realized gains and losses on securities sold are determined on the basis of identified cost.
Indemnifications. The Fund’s organizational documents provide current and former trustees and officers with a limited indemnification against liabilities arising in connection with the performance of their duties to the Fund. In the normal course of business, the Fund may also enter into contracts that provide general indemnifications. The Fund’s maximum exposure under these arrangements is unknown as this would be dependent on future claims that may be made against the Fund. The risk of material loss from such claims is considered remote.
Other. The preparation of financial statements in conformity with accounting principles generally accepted in the United States of America requires management to make estimates and assumptions that affect the reported amounts of assets and liabilities and disclosure of contingent assets and liabilities at the date of the financial statements and the reported amounts of increases and decreases in net assets from operations during the reporting period. Actual results could differ from those estimates.
2. Securities Valuation
The Fund calculates the net asset value of its shares as of the close of the New York Stock Exchange (the “Exchange”), normally 4:00 P.M. Eastern time, on each day the Exchange is open for trading.
The Fund’s Board has adopted procedures for the valuation of the Fund’s securities and has delegated the day-to-day responsibility for valuation determinations under those procedures to the Manager. The Manager has established a Valuation Committee which is responsible for determining a “fair valuation” for any security for which market quotations are not “readily available.” The Valuation Committee’s fair valuation determinations are subject to review, approval and ratification by the Fund’s Board at its next regularly scheduled meeting covering the calendar quarter in which the fair valuation was determined.
34 OPPENHEIMER GOLD & SPECIAL MINERALS FUND
2. Securities Valuation (Continued)
Valuation Methods and Inputs
Securities are valued using unadjusted quoted market prices, when available, as supplied primarily by third party pricing services or dealers.
The following methodologies are used to determine the market value or the fair value of the types of securities described below:
Securities traded on a registered U.S. securities exchange (including exchange-traded derivatives other than futures and futures options) are valued based on the last sale price of the security reported on the principal exchange on which it is traded, prior to the time when the Fund’s assets are valued. In the absence of a sale, the security is valued at the last sale price on the prior trading day, if it is within the spread of the current day’s closing “bid” and “asked” prices, and if not, at the current day’s closing bid price. A security of a foreign issuer traded on a foreign exchange, but not listed on a registered U.S. securities exchange, is valued based on the last sale price on the principal exchange on which the security is traded, as identified by the third party pricing service used by the Manager, prior to the time when the Fund’s assets are valued. If the last sale price is unavailable, the security is valued at the most recent official closing price on the principal exchange on which it is traded. If the last sales price or official closing price for a foreign security is not available, the security is valued at the mean between the bid and asked price per the exchange or, if not available from the exchange, obtained from two dealers. If bid and asked prices are not available from either the exchange or two dealers, the security is valued by using one of the following methodologies (listed in order of priority); (1) using a bid from the exchange, (2) the mean between the bid and asked price as provided by a single dealer, or (3) a bid from a single dealer.
Shares of a registered investment company that are not traded on an exchange are valued at that investment company’s net asset value per share.
Corporate and government debt securities (of U.S. or foreign issuers) and municipal debt securities, event-linked bonds, loans, mortgage-backed securities, collateralized mortgage obligations, and asset-backed securities are valued at the mean between the “bid” and “asked” prices utilizing evaluated prices obtained from third party pricing services or broker-dealers who may use matrix pricing methods to determine the evaluated prices.
Short-term money market type debt securities with a remaining maturity of sixty days or less are valued at cost adjusted by the amortization of discount or premium to maturity (amortized cost), which approximates market value. Short-term debt securities with a remaining maturity in excess of sixty days are valued at the mean between the “bid” and “asked” prices utilizing evaluated prices obtained from third party pricing services or broker-dealers.
A description of the standard inputs that may generally be considered by the third party pricing vendors in determining their evaluated prices is provided below.
35 OPPENHEIMER GOLD & SPECIAL MINERALS FUND
| | | | |
| | |
| | | NOTES TO CONSOLIDATED FINANCIAL STATEMENTS Unaudited / Continued | | |
2. Securities Valuation (Continued)
| | |
| Security Type | | Standard inputs generally considered by third-party
pricing vendors |
| Corporate debt, government debt, municipal, mortgage-backed and asset-backed securities | | Reported trade data, broker-dealer price quotations, benchmark yields, issuer spreads on comparable securities, the credit quality, yield, maturity, and other appropriate factors. |
| Loans | | Information obtained from market participants regarding reported trade data and broker-dealer price quotations. |
| Event-linked bonds | | Information obtained from market participants regarding reported trade data and broker-dealer price quotations. |
If a market value or price cannot be determined for a security using the methodologies described above, or if, in the “good faith” opinion of the Manager, the market value or price obtained does not constitute a “readily available market quotation,” or a significant event has occurred that would materially affect the value of the security the security is fair valued either (i) by a standardized fair valuation methodology applicable to the security type or the significant event as previously approved by the Valuation Committee and the Fund’s Board or (ii) as determined in good faith by the Manager’s Valuation Committee. The Valuation Committee considers all relevant facts that are reasonably available, through either public information or information available to the Manager, when determining the fair value of a security. Fair value determinations by the Manager are subject to review, approval and ratification by the Fund’s Board at its next regularly scheduled meeting covering the calendar quarter in which the fair valuation was determined. Those fair valuation standardized methodologies include, but are not limited to, valuing securities at the last sale price or initially at cost and subsequently adjusting the value based on: changes in company specific fundamentals, changes in an appropriate securities index, or changes in the value of similar securities which may be further adjusted for any discounts related to security-specific resale restrictions. When possible, such methodologies use observable market inputs such as unadjusted quoted prices of similar securities, observable interest rates, currency rates and yield curves. The methodologies used for valuing securities are not necessarily an indication of the risks associated with investing in those securities nor can it be assured that the Fund can obtain the fair value assigned to a security if it were to sell the security.
To assess the continuing appropriateness of security valuations, the Manager, or its third party service provider who is subject to oversight by the Manager, regularly compares prior day prices, prices on comparable securities, and sale prices to the current day prices and challenges those prices exceeding certain tolerance levels with the third party pricing service or broker source. For those securities valued by fair valuations, whether through a standardized fair valuation methodology or a fair valuation determination, the Valuation Committee reviews and affirms the reasonableness of the valuations based on such methodologies and fair valuation determinations on a regular basis after considering all relevant information that is reasonably available.
Classifications
Each investment asset or liability of the Fund is assigned a level at measurement date based on the significance and source of the inputs to its valuation. Various data inputs are used in determining the value of each of the Fund’s investments as of the reporting period end. These
36 OPPENHEIMER GOLD & SPECIAL MINERALS FUND
2. Securities Valuation (Continued)
data inputs are categorized in the following hierarchy under applicable financial accounting standards:
1) Level 1-unadjusted quoted prices in active markets for identical assets or liabilities (including securities actively traded on a securities exchange)
2) Level 2-inputs other than unadjusted quoted prices that are observable for the asset or liability (such as unadjusted quoted prices for similar assets and market corroborated inputs such as interest rates, prepayment speeds, credit risks, etc.)
3) Level 3-significant unobservable inputs (including the Manager’s own judgments about assumptions that market participants would use in pricing the asset or liability).
The inputs used for valuing securities are not necessarily an indication of the risks associated with investing in those securities.
The table below categorizes amounts that are included in the Fund’s Consolidated Statement of Assets and Liabilities as of December 31, 2013 based on valuation input level:
| | | | | | | | | | | | | | | | |
| | | Level 1—
Unadjusted
Quoted Prices | | | Level 2—
Other Significant
Observable Inputs | | | Level 3—
Significant
Unobservable
Inputs | | | Value | |
| Assets Table | | | | | | | | | | | | | | | | |
| Investments, at Value: | | | | | | | | | | | | | | | | |
| Common Stocks | | | | | | | | | | | | | | | | |
Materials | | $ | 1,111,304,027 | | | $ | 86,855,375 | | | $ | 13,412 | | | $ | 1,198,172,814 | |
| Rights, Warrants and Certificates | | | 6,827 | | | | — | | | | — | | | | 6,827 | |
| Investment Company | | | 43,092,445 | | | | — | | | | — | | | | 43,092,445 | |
| | |
|
|
| |
|
|
| |
|
|
| |
|
|
|
| Total Assets | | $ | 1,154,403,300 | | | $ | 86,855,375 | | | $ | 13,412 | | | $ | 1,241,272,086 | |
| | |
|
|
| |
|
|
| |
|
|
| |
|
|
|
| | | | |
| Liabilities Table | | | | | | | | | | | | | | | | |
| Other Financial Instruments: | | | | | | | | | | | | | | | | |
| Options written, at value | | $ | (2,325,459 | ) | | $ | — | | | $ | — | | | $ | (2,325,459 | ) |
| | |
|
|
| |
|
|
| |
|
|
| |
|
|
|
| Total Liabilities | | $ | (2,325,459 | ) | | $ | — | | | $ | — | | | $ | (2,325,459 | ) |
| | |
|
|
| |
|
|
| |
|
|
| |
|
|
|
Currency contracts and forwards, if any, are reported at their unrealized appreciation/ depreciation at measurement date, which represents the change in the contract’s value from trade date. Futures, if any, are reported at their variation margin at measurement date, which represents the amount due to/from the Fund at that date. All additional assets and liabilities included in the above table are reported at their market value at measurement date.
3. Shares of Beneficial Interest
The Fund has authorized an unlimited number of no par value shares of beneficial interest of each class. Transactions in shares of beneficial interest were as follows:
37 OPPENHEIMER GOLD & SPECIAL MINERALS FUND
| | | | |
| | |
| | | NOTES TO CONSOLIDATED FINANCIAL STATEMENTS Unaudited / Continued | | |
3. Shares of Beneficial Interest (Continued)
| | | | | | | | | | | | | | | | |
| | | Six Months Ended December 31, 2013 | | | Year Ended June 28, 2013 | |
| | | Shares | | | Amount | | | Shares | | | Amount | |
| Class A | | | | | | | | | | | | | | | | |
| Sold | | | 9,933,487 | | | $ | 181,751,231 | | | | 18,676,638 | | | $ | 501,599,660 | |
| Redeemed | | | (13,072,200 | ) | | | (234,297,123 | ) | | | (25,756,303 | ) | | | (687,360,619 | ) |
| | |
|
|
|
| Net decrease | | | (3,138,713 | ) | | $ | (52,545,892 | ) | | | (7,079,665 | ) | | $ | (185,760,959 | ) |
| | |
|
|
|
| | | | | | | | | | | | | | | | | |
| Class B | | | | | | | | | | | | | | | | |
| Sold | | | 70,573 | | | $ | 1,235,826 | | | | 186,631 | | | $ | 5,370,023 | |
| Redeemed | | | (498,200 | ) | | | (8,332,677 | ) | | | (1,355,666 | ) | | | (35,319,449 | ) |
| | |
|
|
|
| Net decrease | | | (427,627 | ) | | $ | (7,096,851 | ) | | | (1,169,035 | ) | | $ | (29,949,426 | ) |
| | |
|
|
|
| | | | | | | | | | | | | | | | | |
| Class C | | | | | | | | | | | | | | | | |
| Sold | | | 1,418,355 | | | $ | 24,016,630 | | | | 3,163,365 | | | $ | 83,827,115 | |
| Redeemed | | | (2,686,220 | ) | | | (44,090,083 | ) | | | (5,384,494 | ) | | | (133,503,176 | ) |
| | |
|
|
|
| Net decrease | | | (1,267,865 | ) | | $ | (20,073,453 | ) | | | (2,221,129 | ) | | $ | (49,676,061 | ) |
| | |
|
|
|
| | | | | | | | | | | | | | | | | |
| Class I | | | | | | | | | | | | | | | | |
| Sold | | | 684,862 | | | $ | 12,679,900 | | | | 1,548,325 | | | $ | 30,481,217 | |
| Redeemed | | | (186,134 | ) | | | (3,354,986 | ) | | | (45,721 | ) | | | (779,749 | ) |
| | |
|
|
|
| Net increase | | | 498,728 | | | $ | 9,324,914 | | | | 1,502,604 | | | $ | 29,701,468 | |
| | |
|
|
|
| | | | | | | | | | | | | | | | | |
| Class N | | | | | | | | | | | | | | | | |
| Sold | | | 2,231,878 | | | $ | 38,464,484 | | | | 3,598,096 | | | $ | 95,089,492 | |
| Redeemed | | | (1,748,308 | ) | | | (30,297,903 | ) | | | (3,392,225 | ) | | | (92,605,439 | ) |
| | |
|
|
|
| Net increase | | | 483,570 | | | $ | 8,166,581 | | | | 205,871 | | | $ | 2,484,053 | |
| | |
|
|
|
| | | | | | | | | | | | | | | | | |
| Class Y | | | | | | | | | | | | | | | | |
| Sold | | | 4,003,747 | | | $ | 71,573,888 | | | | 11,063,895 | | | $ | 296,128,455 | |
| Redeemed | | | (3,725,706 | ) | | | (65,114,121 | ) | | | (24,258,856 | ) | | | (556,321,428 | ) |
| | |
|
|
| |
|
|
| |
|
|
| |
|
|
|
| Net increase (decrease) | | | 278,041 | | | $ | 6,459,767 | | | | (13,194,961 | ) | | $ | (260,192,973 | ) |
| | |
|
|
| |
|
|
| |
|
|
| |
|
|
|
4. Purchases and Sales of Securities
The aggregate cost of purchases and proceeds from sales of securities, other than short-term obligations and investments in IMMF, for the six months ended December 31, 2013 were as follows:
| | | | | | | | |
| | | Purchases | | | Sales | |
| Investment securities | | $ | 567,462,255 | | | $ | 612,545,486 | |
5. Fees and Other Transactions with Affiliates
Management Fees. Under the investment advisory agreement, the Fund pays the Manager a management fee based on the daily net assets of the Fund at an annual rate as shown in the following table:
38 OPPENHEIMER GOLD & SPECIAL MINERALS FUND
5. Fees and Other Transactions with Affiliates (Continued)
| | | | |
| Fee Schedule | | | |
| Up to $200 million | | | 0.75% | |
| Next $200 million | | | 0.72 | |
| Next $200 million | | | 0.69 | |
| Next $200 million | | | 0.66 | |
| Next $2.2 billion | | | 0.60 | |
| Next $1.0 billion | | | 0.59 | |
| Next $2.0 billion | | | 0.58 | |
| Next $4.0 billion | | | 0.57 | |
| Over $10 billion | | | 0.56 | |
The Manager also provides investment management related services to the Subsidiary. The Subsidiary pays the Manager a monthly management fee at an annual rate according to the above schedule. The Subsidiary also pays certain other expenses including custody and directors’ fees.
Sub-Adviser Fees. The Manager has retained the Sub-Adviser to provide the day-to-day portfolio management of the Fund. Under the Sub-Advisory Agreement, the Manager pays the Sub-Adviser an annual fee in monthly installments, equal to a percentage of the investment management fee collected by the Manager from the Fund, which shall be calculated after any investment management fee waivers. The fee paid to the Sub-Adviser is paid by the Manager, not by the Fund.
Transfer Agent Fees. OFI Global (the “Transfer Agent”) serves as the transfer and shareholder servicing agent for the Fund. Fees incurred by the Fund with respect to these services are detailed in the Consolidated Statement of Operations.
Sub-Transfer Agent Fees. The Transfer Agent has retained Shareholder Services, Inc., a wholly-owned subsidiary of OFI (the “Sub-Transfer Agent”), to provide the day-to-day transfer agent and shareholder servicing of the Fund. Under the Sub-Transfer Agency Agreement, the Transfer Agent pays the Sub-Transfer Agent an annual fee in monthly installments, equal to a percentage of the transfer agent fee collected by the Transfer Agent from the Fund, which shall be calculated after any applicable fee waivers. The fee paid to the Sub-Transfer Agent is paid by the Transfer Agent, not by the Fund.
Distribution and Service Plan (12b-1) Fees. Under its General Distributor’s Agreement with the Fund, OppenheimerFunds Distributor, Inc. (the “Distributor”) acts as the Fund’s principal underwriter in the continuous public offering of the Fund’s classes of shares.
Service Plan for Class A Shares. The Fund has adopted a Service Plan (the “Plan”) for Class A shares under Rule 12b-1 of the Investment Company Act of 1940. Under the Plan, the Fund reimburses the Distributor for a portion of its costs incurred for services provided to accounts that hold Class A shares. Reimbursement is made periodically at an annual rate of
39 OPPENHEIMER GOLD & SPECIAL MINERALS FUND
| | | | |
| | |
| | | NOTES TO CONSOLIDATED FINANCIAL STATEMENTS Unaudited / Continued | | |
5. Fees and Other Transactions with Affiliates (Continued)
up to 0.25% of the daily net assets of Class A shares of the Fund. The Distributor currently uses all of those fees to pay dealers, brokers, banks and other financial institutions periodically for providing personal service and maintenance of accounts of their customers that hold Class A shares. Any unreimbursed expenses the Distributor incurs with respect to Class A shares in any fiscal year cannot be recovered in subsequent periods. Fees incurred by the Fund under the Plan are detailed in the Consolidated Statement of Operations.
Distribution and Service Plans for Class B, Class C and Class N Shares. The Fund has adopted Distribution and Service Plans (the “Plans”) for Class B, Class C and Class N shares under Rule 12b-1 of the Investment Company Act of 1940 to compensate the Distributor for its services in connection with the distribution of those shares and servicing accounts. Under the Plans, the Fund pays the Distributor an annual asset-based sales charge of 0.75% on Class B and Class C shares daily net assets and 0.25% on Class N shares daily net assets. The Distributor also receives a service fee of 0.25% per year under each plan. If either the Class B, Class C or Class N plan is terminated by the Fund or by the shareholders of a class, the Board of Trustees and its independent trustees must determine whether the Distributor shall be entitled to payment from the Fund of all or a portion of the service fee and/or asset-based sales charge in respect to shares sold prior to the effective date of such termination. Fees incurred by the Fund under the Plans are detailed in the Consolidated Statement of Operations. The Distributor determines its uncompensated expenses under the Plans at calendar quarter ends. The Distributor’s aggregate uncompensated expenses under the Plans at December 31, 2013 were as follows:
| | | | |
| Class C | | | $7,383,514 | |
| Class N | | | 4,154,046 | |
Sales Charges. Front-end sales charges and contingent deferred sales charges (“CDSC”) do not represent expenses of the Fund. They are deducted from the proceeds of sales of Fund shares prior to investment or from redemption proceeds prior to remittance, as applicable. The sales charges retained by the Distributor from the sale of shares and the CDSC retained by the Distributor on the redemption of shares is shown in the following table for the period indicated.
| | | | | | | | | | | | | | | | | | | | |
| Six Months Ended | | Class A
Front-End
Sales Charges
Retained by
Distributor | | | Class A
Contingent
Deferred Sales
Charges
Retained by
Distributor | | | Class B
Contingent
Deferred Sales
Charges
Retained by
Distributor | | | Class C
Contingent
Deferred Sales
Charges
Retained by
Distributor | | | Class N
Contingent
Deferred Sales
Charges
Retained by
Distributor | |
| December 31, 2013 | | $ | 122,247 | | | $ | 2,756 | | | $ | 57,860 | | | $ | 20,509 | | | $ | 189 | |
Waivers and Reimbursements of Expenses. The Manager has contractually agreed to waive the Fund’s management fee in an amount equal to the management fee of the Subsidiary. During the six months ended December 31, 2013, this waiver reduced the Fund’s management fee by $101,965.
40 OPPENHEIMER GOLD & SPECIAL MINERALS FUND
5. Fees and Other Transactions with Affiliates (Continued)
The Manager will waive fees and/or reimburse Fund expenses in an amount equal to the indirect management fees incurred through the Fund’s investment in IMMF. During the six months ended December 31, 2013, the Manager waived fees and/or reimbursed the Fund $9,032 for IMMF management fees.
The Transfer Agent has voluntarily agreed to limit transfer and shareholder servicing agent fees for Classes B, C, N and Y shares to 0.35% of average annual net assets per class and for Class A shares to 0.30% of average annual net assets of the class.
During the six months ended December 31, 2013, the Transfer Agent waived transfer and shareholder servicing agent fees as follows:
| | | | |
| Class A | | $ | 509,822 | |
| Class B | | | 51,135 | |
| Class C | | | 42,900 | |
| Class N | | | 91,730 | |
| Class Y | | | 30,057 | |
Some of these undertakings may be modified or terminated at any time; some may not be modified or terminated until after one year from the date of the current prospectus, as indicated therein.
6. Risk Exposures and the Use of Derivative Instruments
The Fund’s investment objectives not only permit the Fund to purchase investment securities, they also allow the Fund to enter into various types of derivatives contracts, including, but not limited to, futures contracts, forward currency exchange contracts, credit default swaps, interest rate swaps, total return swaps, variance swaps and purchased and written options. In doing so, the Fund will employ strategies in differing combinations to permit it to increase, decrease, or change the level or types of exposure to market risk factors. These instruments may allow the Fund to pursue its objectives more quickly and efficiently than if it were to make direct purchases or sales of securities capable of effecting a similar response to market factors. Such contracts may be entered into through a bilateral over-the-counter (“OTC”) transaction, or through a securities or futures exchange and cleared through a clearinghouse.
Market Risk Factors. In accordance with its investment objectives, the Fund may use derivatives to increase or decrease its exposure to one or more of the following market risk factors:
Commodity Risk. Commodity risk relates to the change in value of commodities or commodity indexes as they relate to increases or decreases in the commodities market. Commodities are physical assets that have tangible properties. Examples of these types of assets are crude oil, heating oil, metals, livestock, and agricultural products.
Credit Risk. Credit risk relates to the ability of the issuer to meet interest and principal payments, or both, as they come due. In general, lower-grade, higher-yield bonds are subject to credit risk to a greater extent than lower-yield, higher-quality bonds.
41 OPPENHEIMER GOLD & SPECIAL MINERALS FUND
| | | | |
| | |
| | | NOTES TO CONSOLIDATED FINANCIAL STATEMENTS Unaudited / Continued | | |
6. Risk Exposures and the Use of Derivative Instruments (Continued)
Equity Risk. Equity risk relates to the change in value of equity securities as they relate to increases or decreases in the general market.
Foreign Exchange Rate Risk. Foreign exchange rate risk relates to the change in the U.S. dollar value of a security held that is denominated in a foreign currency. The U.S. dollar value of a foreign currency denominated security will decrease as the dollar appreciates against the currency, while the U.S. dollar value will increase as the dollar depreciates against the currency.
Interest Rate Risk. Interest rate risk refers to the fluctuations in value of fixed-income securities resulting from the inverse relationship between price and yield. For example, an increase in general interest rates will tend to reduce the market value of already issued fixed-income investments, and a decline in general interest rates will tend to increase their value. In addition, debt securities with longer maturities, which tend to have higher yields, are subject to potentially greater fluctuations in value from changes in interest rates than obligations with shorter maturities.
Volatility Risk. Volatility risk refers to the magnitude of the movement, but not the direction of the movement, in a financial instrument’s price over a defined time period. Large increases or decreases in a financial instrument’s price over a relative time period typically indicate greater volatility risk, while small increases or decreases in its price typically indicate lower volatility risk.
Derivatives may have little or no initial cash investment relative to their market value exposure and therefore can produce significant gains or losses in excess of their cost due to unanticipated changes in the market risk factors and the overall market. This use of embedded leverage allows the Fund to increase its market value exposure relative to its net assets and can substantially increase the volatility of the Fund’s performance. In instances where the Fund is using derivatives to decrease, or hedge, exposures to market risk factors for securities held by the Fund, there are also risks that those derivatives may not perform as expected resulting in losses for the combined or hedged positions. Some derivatives have the potential for unlimited loss, regardless of the size of the Fund’s initial investment.
Additional associated risks from investing in derivatives also exist and potentially could have significant effects on the valuation of the derivative and the Fund. Typically, the associated risks are not the risks that the Fund is attempting to increase or decrease exposure to, per its investment objectives, but are the additional risks from investing in derivatives. Examples of these associated risks are liquidity risk, which is the risk that the Fund will not be able to sell the derivative in the open market in a timely manner, and counterparty credit risk, which is the risk that the counterparty will not fulfill its obligation to the Fund.
The Fund’s actual exposures to these market risk factors and associated risks during the period are discussed in further detail, by derivative type, below.
Option Activity
The Fund may buy and sell put and call options, or write put and call options. When an option is written, the Fund receives a premium and becomes obligated to sell or purchase the underlying security, currency or other underlying financial instrument at a fixed price, upon exercise of the option.
42 OPPENHEIMER GOLD & SPECIAL MINERALS FUND
6. Risk Exposures and the Use of Derivative Instruments (Continued)
Options can be traded through an exchange or through a privately negotiated arrangement with a dealer in an OTC transaction. Options traded through an exchange are generally cleared through a clearinghouse (such as The Options Clearing Corporation). The difference between the premium received or paid, and market value of the option, is recorded as unrealized appreciation or depreciation. The net change in unrealized appreciation or depreciation is reported in the Consolidated Statement of Operations. When an option is exercised, the cost of the security purchased or the proceeds of the security sale are adjusted by the amount of premium received or paid. Upon the expiration or closing of the option transaction, a gain or loss is reported in the Consolidated Statement of Operations.
The Fund has purchased call options on individual equity securities and/or equity indexes to increase exposure to equity risk. A purchased call option becomes more valuable as the price of the underlying financial instrument appreciates relative to the strike price.
During the six months ended December 31, 2013, the Fund had an ending monthly average market value of $7,143 on purchased call options.
Options written, if any, are reported in a schedule following the Consolidated Statement of Investments and as a liability in the Consolidated Statement of Assets and Liabilities. Securities held in collateral accounts to cover potential obligations with respect to outstanding written options are noted in the Consolidated Statement of Investments.
The risk in writing a call option is that the market price of the security increases and if the option is exercised, the Fund must either purchase the security at a higher price for delivery or, if the Fund owns the underlying security, give up the opportunity for profit. The risk in writing a put option is that the Fund may incur a loss if the market price of the security decreases and the option is exercised. The risk in buying an option is that the Fund pays a premium whether or not the option is exercised. The Fund also has the additional risk that there may be an illiquid market where the Fund is unable to close the contract.
The Fund has written put options on individual equity securities and/or equity indexes to increase exposure to equity risk. A written put option becomes more valuable as the price of the underlying financial instrument appreciates relative to the strike price.
The Fund has written call options on individual equity securities and/or equity indexes to decrease exposure to equity risk. A written call option becomes more valuable as the price of the underlying financial instrument depreciates relative to the strike price.
The Fund has written put options on individual commodities to increase exposure to commodity risk. A written put option becomes more valuable as the price of the underlying financial instrument appreciates relative to the strike price.
During the six months ended December 31, 2013, the Fund had an ending monthly average market value of $1,323,883 and $3,078,858 on written call options and written put options, respectively.
Additional associated risks to the Fund include counterparty credit risk and liquidity risk.
43 OPPENHEIMER GOLD & SPECIAL MINERALS FUND
| | | | |
| | |
| | | NOTES TO CONSOLIDATED FINANCIAL STATEMENTS Unaudited / Continued | | |
6. Risk Exposures and the Use of Derivative Instruments (Continued)
Written option activity for the six months ended December 31, 2013 was as follows:
| | | | | | | | | | | | | | | | |
| | | Call Options
| | | Put Options
| |
| | | Number of
Contracts | | | Amount of
Premiums | | | Number of
Contracts | | | Amount of
Premiums | |
| Options outstanding as of June 28, 2013 | | | — | | | $ | — | | | | 9,000 | | | $ | 1,292,937 | |
| Options written | | | 25,000 | | | | 3,157,878 | | | | 35,000 | | | | 4,915,186 | |
| Options closed or expired | | | (12,000 | ) | | | (1,397,173 | ) | | | (20,776 | ) | | | (2,652,466 | ) |
| Options exercised | | | (7,000 | ) | | | (885,345 | ) | | | (8,224 | ) | | | (1,050,771 | ) |
| | |
|
|
|
| Options outstanding as of December 31, 2013 | | | 6,000 | | | $ | 875,360 | | | | 15,000 | | | $ | 2,504,886 | |
| | |
|
|
|
Counterparty Credit Risk. Derivative positions are subject to the risk that the counterparty will not fulfill its obligation to the Fund. The Fund intends to enter into derivative transactions with counterparties that the Manager believes to be creditworthy at the time of the transaction.
For financial reporting purposes, the Fund does not offset derivative assets and derivative liabilities that are subject to netting arrangements in the Consolidated Statement of Assets and Liabilities. Bankruptcy or insolvency laws of a particular jurisdiction may impose restrictions on or prohibitions against the right of offset in bankruptcy, insolvency or other events.
The Fund’s risk of loss from counterparty credit risk on exchange-traded derivatives cleared through a clearinghouse and for cleared swaps is generally considered lower than as compared to OTC derivatives. However, counterparty credit risk exists with respect to initial and variation margin deposited/paid by the Fund that is held in futures commission merchant, broker and/or clearinghouse accounts for such exchange-traded derivatives and for cleared swaps.
With respect to cleared swaps, such transactions will be submitted for clearing, and if cleared, will be held in accounts at futures commission merchants or brokers that are members of clearinghouses. While brokers, futures commission merchants and clearinghouses are required to segregate customer margin from their own assets, in the event that a broker, futures commission merchant or clearinghouse becomes insolvent or goes into bankruptcy and at that time there is a shortfall in the aggregate amount of margin held by the broker, futures commission merchant or clearinghouse for all its customers, U.S. bankruptcy laws will typically allocate that shortfall on a pro-rata basis across all the broker’s, futures commission merchant’s or clearinghouse’s customers, potentially resulting in losses to the Fund.
There is the risk that a broker, futures commission merchant or clearinghouse will decline to clear a transaction on the Fund’s behalf, and the Fund may be required to pay a termination fee to the executing broker with whom the Fund initially enters into the transaction. Clearinghouses may also be permitted to terminate cleared swaps at any time. The Fund is also subject to the risk that the broker or futures commission merchant will improperly use the Fund’s assets deposited/paid as initial or variation margin to satisfy payment obligations of another customer. In the event of a default by another customer of the broker or futures commission merchant, the Fund might not receive its variation margin
44 OPPENHEIMER GOLD & SPECIAL MINERALS FUND
6. Risk Exposures and the Use of Derivative Instruments (Continued)
payments from the clearinghouse, due to the manner in which variation margin payments are aggregated for all customers of the broker/futures commission merchant.
Collateral and margin requirements differ by type of derivative. Margin requirements are established by the broker, futures commission merchant or clearinghouse for exchange-traded and cleared derivatives, including cleared swaps. Brokers, futures commission merchants and clearinghouses can ask for margin in excess of the regulatory minimum, or increase the margin amount, in certain circumstances.
For financial reporting purposes, cash collateral that has been pledged to cover obligations of the Fund, if any, is reported separately on the Consolidated Statement of Assets and Liabilities as cash pledged as collateral. Non-cash collateral pledged by the Fund, if any, is noted in the Consolidated Statement of Investments. Generally, the amount of collateral due from or to a party must exceed a minimum transfer amount threshold (e.g. $250,000) before a transfer has to be made. To the extent amounts due to the Fund from its counterparties are not fully collateralized, contractually or otherwise, the Fund bears the risk of loss from counterparty nonperformance.
The following table presents the valuations of derivative instruments by risk exposure as reported within the Consolidated Statement of Assets and Liabilities as of December 31, 2013:
| | | | | | |
| | | Liability Derivatives
| |
Derivatives Not Accounted for as Hedging
Instruments | | Consolidated Statement of Assets and
Liabilities Location | | | Value | |
| Equity contracts | | Options written, at value | | $ | 2,325,459 | |
The effect of derivative instruments on the Consolidated Statement of Operations is as follows:
| | | | | | | | |
Derivatives Not
Accounted for as Hedging
Instruments | | Investments from unaffiliated
companies (including premiums on
options exercised)* | | Closing and expiration
of option contracts written | | | Total | |
| Equity contracts | | $(771,243) | | $4,049,638 | | $ | 3,278,395 | |
*Includes purchased option contracts, purchased swaption contracts and written option contracts exercised, if any.
| | | | |
| Amount of Change in Unrealized Gain or (Loss) Recognized on Derivatives | |
| Derivatives Not Accounted for as Hedging Instruments | |
| Option
Contracts
Written |
|
| Equity contracts | | $ | 6,380,668 | |
7. Pending Litigation
Since 2009, seven class action lawsuits have been pending in the U.S. District Court for the District of Colorado against OppenheimerFunds, Inc. (“OFI”), OppenheimerFunds Distributor, Inc., the Fund’s principal underwriter and distributor (the “Distributor”), and certain funds (but not including the Fund) advised by OFI Global Asset Management, Inc. and distributed by the Distributor (the “Defendant Funds”). The lawsuits also name as defendants certain officers and current and former trustees of the respective Defendant Funds. The lawsuits raise
45 OPPENHEIMER GOLD & SPECIAL MINERALS FUND
| | | | |
| | |
| | | NOTES TO CONSOLIDATED FINANCIAL STATEMENTS Unaudited / Continued | | |
7. Pending Litigation (Continued)
claims under federal securities law and allege, among other things, that the disclosure documents of the respective Defendant Funds contained misrepresentations and omissions and that the respective Defendant Funds’ investment policies were not followed. The plaintiffs in these actions seek unspecified damages, equitable relief and awards of attorneys’ fees and litigation expenses. The Defendant Funds’ Boards of Trustees have also engaged counsel to represent the Funds and the present and former Independent Trustees named in those suits. On August 26, 2013, the parties in six of these lawsuits executed a memorandum of understanding setting forth the terms of proposed settlements of those actions. The proposed settlements are subject to a variety of contingencies, including the execution of settlement agreements, which will require preliminary and final approval by the court. The proposed settlements do not resolve a seventh outstanding lawsuit relating to Oppenheimer California Municipal Fund.
Other class action and individual lawsuits have been filed since 2008 in various state and federal courts against OFI and certain of its affiliates by investors seeking to recover investments they allegedly lost as a result of the “Ponzi” scheme run by Bernard L. Madoff and his firm, Bernard L. Madoff Investment Securities, LLC (“BLMIS”). Plaintiffs in these suits allege that they suffered losses as a result of their investments in several funds managed by an affiliate of OFI and assert a variety of claims, including breach of fiduciary duty, fraud, negligent misrepresentation, unjust enrichment, and violation of federal and state securities laws and regulations, among others. They seek unspecified damages, equitable relief and awards of attorneys’ fees and litigation expenses. Neither the Distributor, nor any of the Oppenheimer mutual funds, their independent trustees or directors are named as defendants in these lawsuits. None of the Oppenheimer mutual funds invested in any funds or accounts managed by Madoff or BLMIS. On February 28, 2011, a stipulation of partial settlement of three groups of consolidated putative class action lawsuits relating to these matters was filed in the U.S. District Court for the Southern District of New York. On August 19, 2011, the court entered an order and final judgment approving the settlement as fair, reasonable and adequate. In September 2011, certain parties filed notices of appeal from the court’s order approving the settlement. The settlement does not resolve other outstanding lawsuits against OFI and its affiliates relating to BLMIS.
On April 16, 2010, a lawsuit was filed in New York state court against (i) OFI, (ii) an affiliate of OFI and (iii) AAArdvark IV Funding Limited (“AAArdvark IV”), an entity advised by OFI’s affiliate, in connection with investments made by the plaintiffs in AAArdvark IV. Plaintiffs allege breach of contract and common law fraud claims against the defendants and seek compensatory damages, costs and disbursements, including attorney fees. On April 11, 2013, the court granted defendants’ motion for summary judgment, dismissing plaintiffs’ fraud claim with prejudice and dismissing their contract claim without prejudice, and granted plaintiffs leave to replead their contract claim to assert a cause of action for specific performance within 30 days. On May 9, 2013, plaintiffs filed a notice of appeal from the court’s dismissal order. On January 7, 2014, the appellate court affirmed the trial court’s dismissal order. On July 15, 2011, a lawsuit was filed in New York state court against OFI, an
46 OPPENHEIMER GOLD & SPECIAL MINERALS FUND
7. Pending Litigation (Continued)
affiliate of OFI and AAArdvark Funding Limited (“AAArdvark I”), an entity advised by OFI’s affiliate, in connection with investments made by the plaintiffs in AAArdvark I. The complaint alleges breach of contract and common law fraud claims against the defendants and seeks compensatory damages, costs and disbursements, including attorney fees. On November 9, 2011, a lawsuit was filed in New York state court against OFI, an affiliate of OFI and AAArdvark XS Funding Limited (“AAArdvark XS”), an entity advised by OFI’s affiliate, in connection with investments made by the plaintiffs in AAArdvark XS. The complaint alleged breach of contract against the defendants and sought compensatory damages, costs and disbursements, including attorney fees. On November 8, 2013, the parties filed a stipulation of discontinuance dismissing the lawsuit with prejudice.
OFI believes the lawsuits and appeals described above are without legal merit and, with the exception of actions it has settled, is defending against them vigorously. While it is premature to render any opinion as to the outcome in these lawsuits, or whether any costs that the Defendant Funds may bear in defending the suits might not be reimbursed by insurance, OFI believes that these suits should not impair the ability of OFI or the Distributor to perform their respective duties to the Fund, and that the outcome of all of the suits together should not have any material effect on the operations of any of the Oppenheimer mutual funds.
47 OPPENHEIMER GOLD & SPECIAL MINERALS FUND
| | | | |
| | |
| | | BOARD APPROVAL OF THE FUND’S INVESTMENT ADVISORY
AND SUB-ADVISORY AGREEMENTS Unaudited | | |
The Fund has entered into an investment advisory agreement with OFI Global Asset Management, Inc. (“OFI Global” or the “Adviser”), a wholly-owned subsidiary of OppenheimerFunds, Inc. (“OFI” or the “Sub-Adviser”) (“OFI Global” and “OFI” together the “Managers”) and OFI Global has entered into a sub-advisory agreement with OFI whereby OFI provides investment sub-advisory services to the Fund (collectively, the “Agreements”). Each year, the Board of Trustees (the “Board”), including a majority of the independent Trustees, is required to determine whether to renew the Agreements. The Investment Company Act of 1940, as amended, requires that the Board request and evaluate, and that the Managers provide, such information as may be reasonably necessary to evaluate the terms of the Agreements. The Board employs an independent consultant to prepare a report that provides information, including comparative information that the Board requests for that purpose. In addition to in-person meetings focused on this evaluation, the Board receives information throughout the year regarding Fund services, fees, expenses and performance.
The Adviser, Sub-Adviser and the independent consultant provided information to the Board on the following factors: (i) the nature, quality and extent of the Managers’ services, (ii) the investment performance of the Fund and the Managers, (iii) the fees and expenses of the Fund, including comparative expense information, (iv) the profitability of the Managers and their affiliates, including an analysis of the cost of providing services, (v) whether economies of scale are realized as the Fund grows and whether fee levels reflect these economies of scale for Fund investors and (vi) other benefits to the Managers from their relationship with the Fund. The Board was aware that there are alternatives to retaining the Managers.
Outlined below is a summary of the principal information considered by the Board as well as the Board’s conclusions.
Nature, Quality and Extent of Services. The Board considered information about the nature, quality and extent of the services provided to the Fund and information regarding the Managers’ key personnel who provide such services. The Sub-Adviser’s duties include providing the Fund with the services of the portfolio manager and the Sub-Adviser’s investment team, who provide research, analysis and other advisory services in regard to the Fund’s investments; securities trading services; oversight of third-party service providers; monitoring compliance with applicable Fund policies and procedures and adherence to the Fund��s investment restrictions; and risk management. The Managers are responsible for providing certain administrative services to the Fund as well. Those services include providing and supervising all administrative and clerical personnel who are necessary in order to provide effective corporate administration for the Fund; compiling and maintaining records with respect to the Fund’s operations; preparing and filing reports required by the Securities and Exchange Commission; preparing periodic reports regarding the operations of the Fund for its shareholders; preparing proxy materials for shareholder meetings; and preparing the registration statements required by Federal and state securities laws for the sale of the Fund’s shares. The Managers also provide the Fund with office space, facilities and equipment.
The Board also considered the quality of the services provided and the quality of the Managers’ resources that are available to the Fund. The Board took account of the fact that the Sub-Adviser has had over fifty years of experience as an investment adviser and that its assets under management rank it among the top mutual fund managers in the United States. The Board evaluated the Sub-Adviser’s advisory, administrative, accounting, legal, compliance
48 OPPENHEIMER GOLD & SPECIAL MINERALS FUND
services and risk management, and information the Board has received regarding the experience and professional qualifications of the Managers’ key personnel and the size and functions of its staff. In its evaluation of the quality of the portfolio management services provided, the Board considered the experience of Shanquan Li, the portfolio manager for the Fund, and the Sub-Adviser’s investment team and analysts. The Board members also considered the totality of their experiences with the Managers as directors or trustees of the Fund and other funds advised by the Managers. The Board considered information regarding the quality of services provided by affiliates of the Managers, which its members have become knowledgeable about in connection with the renewal of the Fund’s service agreements. The Board concluded, in light of the Managers’ experience, reputation, personnel, operations and resources that the Fund benefits from the services provided under the Agreement.
Investment Performance of the Fund, the Adviser and the Sub-Adviser. Throughout the year, the Adviser and the Sub-Adviser provided information on the investment performance of the Fund, the Adviser and the Sub-Adviser, including comparative performance information. The Board also reviewed information, prepared by the Adviser, the Sub-Adviser and the independent consultant, comparing the Fund’s historical performance to its benchmark and to the performance of other retail equity precious metals funds. The Board noted that the Fund’s ten-year performance was better than its category median, its five-year performance was equal to its category median, and its one-year and three-year performance was below its category median.
Costs of Services by the Adviser. The Board reviewed the fees paid to the Adviser and the other expenses borne by the Fund. The Board also considered the comparability of the fees charged and the services provided to the Fund to the fees and services for other clients or accounts advised by the Adviser. The independent consultant provided comparative data in regard to the fees and expenses of the Fund and other retail front-end load equity precious metals funds with comparable asset levels and distribution features. The Fund’s contractual management fees and total expenses were lower than its peer group median and its category median.
Economies of Scale and Profits Realized by the Adviser and Sub-Adviser. The Board considered information regarding the Managers’ costs in serving as the Fund’s investment adviser and sub-adviser, including the costs associated with the personnel and systems necessary to manage the Fund, and information regarding the Managers’ profitability from their relationship with the Fund. The Board reviewed whether the Managers may realize economies of scale in managing and supporting the Fund. The Board noted that the Fund currently has management fee breakpoints, which are intended to share with Fund shareholders economies of scale that may exist as the Fund’s assets grow.
Other Benefits to the Managers. In addition to considering the profits realized by the Managers, the Board considered information that was provided regarding the direct and indirect benefits the Managers receive as a result of their relationship with the Fund, including compensation paid to the Managers’ affiliates and research provided to the Adviser in connection with permissible brokerage arrangements (soft dollar arrangements). The Board also considered that the Managers must be able to pay and retain experienced professional personnel at competitive rates to provide quality services to the Fund.
49 OPPENHEIMER GOLD & SPECIAL MINERALS FUND
| | | | |
| | |
| | | BOARD APPROVAL OF THE FUND’S INVESTMENT ADVISORY
AND SUB-ADVISORY AGREEMENTS Unaudited / Continued | | |
Conclusions. These factors were also considered by the independent Trustees meeting separately from the full Board, assisted by experienced counsel to the Fund and to the independent Trustees. Fund counsel and the independent Trustees’ counsel are independent of the Managers within the meaning and intent of the Securities and Exchange Commission Rules.
Based on its review of the information it received and its evaluations described above, the Board, including a majority of the independent Trustees, decided to continue the Agreements through September 30, 2014. In arriving at its decision, the Board did not identify any factor or factors as being more important than others, but considered all of the above information, and considered the terms and conditions of the Agreements, including the management fees, in light of all the surrounding circumstances.
50 OPPENHEIMER GOLD & SPECIAL MINERALS FUND
| | | | |
| | |
| | | SPECIAL SHAREHOLDER MEETINGS Unaudited | | |
On September 27, 2013, following an adjournment from a second shareholder meeting held on June 21, 2013, as adjourned to August 2, 2013 and August 12, 2013, a meeting of Oppenheimer Gold & Special Minerals Fund was held at which the sub-proposals below (Proposal No. 2 (including certain of its sub-proposals)) and an Agreement and Plan of Reorganization to reorganize the Fund into a Delaware statutory trust (Proposal No. 3) were approved as described in the Fund’s Proxy Statement. The following is a report of the votes cast:
2a: Proposal to revise the fundamental policy relating to borrowing
| | | | | | | | | | | | | | | | | | |
For
| | Against
| | | | Abstain
| | | | | | | | | | | | |
| 33,715,227 | | 1,799,530 | | | | 3,590,125 | | | | | | | | | | | | |
2b-1: Proposal to revise the fundamental policy relating to concentration of investments
| | | | | | | | | | | | | | | | | | |
For
| | Against
| | | | Abstain
| | | | | | | | | | | | |
| 33,860,176 | | 1,685,599 | | | | 3,559,110 | | | | | | | | | | | | |
2b-2: Proposal to remove the additional fundamental policy relating to concentration of investments
| | | | | | | | | | | | | | | | | | |
For
| | Against
| | | | Abstain
| | | | | | | | | | | | |
| 33,733,907 | | 1,763,707 | | | | 3,607,271 | | | | | | | | | | | | |
2c-1: Proposal to remove the fundamental policy relating to diversification of investments
| | | | | | | | | | | | | | | | | | |
For
| | Against
| | | | Abstain
| | | | | | | | | | | | |
| 33,741,923 | | 1,801,153 | | | | 3,561,812 | | | | | | | | | | | | |
2d: Proposal to revise the fundamental policy relating to lending
| | | | | | | | | | | | | | | | | | |
For
| | Against
| | | | Abstain
| | | | | | | | | | | | |
| 33,628,161 | | 1,882,356 | | | | 3,594,371 | | | | | | | | | | | | |
2e: Proposal to remove the additional fundamental policy relating to estate and commodities
| | | | | | | | | | | | | | | | | | |
For
| | Against
| | | | Abstain
| | | | | | | | | | | | |
| 33,773,194 | | 1,740,590 | | | | 3,591,103 | | | | | | | | | | | | |
2f: Proposal to revise the fundamental policy relating to senior securities
| | | | | | | | | | | | | | | | | | |
For
| | Against
| | | | Abstain
| | | | | | | | | | | | |
| 33,634,176 | | 1,831,091 | | | | 3,639,621 | | | | | | | | | | | | |
2g: Proposal to remove the additional fundamental policy relating to underwriting
| | | | | | | | | | | | | | | | | | |
For
| | Against
| | | | Abstain
| | | | | | | | | | | | |
| 33,683,185 | | 1,814,120 | | | | 3,607,576 | | | | | | | | | | | | |
2j: Proposal to remove miscellaneous fundamental policy relating to investment strategy restrictions
| | | | | | | | | | | | | | | | | | |
For
| | Against
| | | | Abstain
| | | | | | | | | | | | |
| 33,739,297 | | 1,767,299 | | | | 3,598,291 | | | | | | | | | | | | |
2k: Proposal to remove miscellaneous fundamental policy relating to investment strategy restrictions
| | | | | | | | | | | | | | | | | | |
For
| | Against
| | | | Abstain
| | | | | | | | | | | | |
| 33,716,940 | | 1,780,745 | | | | 3,607,196 | | | | | | | | | | | | |
2l: Proposal to remove miscellaneous fundamental policy relating to investment strategy restrictions
| | | | | | | | | | | | | | | | | | |
For
| | Against
| | | | Abstain
| | | | | | | | | | | | |
| 33,688,404 | | 1,799,519 | | | | 3,616,957 | | | | | | | | | | | | |
51 OPPENHEIMER GOLD & SPECIAL MINERALS FUND
| | | | |
| | |
| | | SPECIAL SHAREHOLDER MEETINGS Unaudited / continued | | |
Proposal 3: To approve an Agreement and Plan of Reorganization that provides for the reorganization of a Fund from a Maryland corporation or Massachusetts business trust, as applicable, into a Delaware statutory trust.
| | | | | | | | | | | | | | | | | | |
For
| | Against
| | | | Abstain
| | | | | | | | | | | | |
| 34,397,176 | | 1,245,944 | | | | 3,461,768 | | | | | | | | | | | | |
On October 25, 2013, following an adjournment from a second shareholder meeting held on June 21, 2013, as adjourned to August 2, 2013 and August 12, 2013, and September 27, 2013, a meeting of the Fund was held at which the sub-proposal below, as described in the Fund’s Proxy Statement, was not approved. The following is a report of the votes cast:
2r: Proposal to convert the Fund’s investment objective from fundamental to non-fundamental
| | | | | | | | | | | | | | | | | | |
For
| | Against
| | | | Abstain
| | | | | | | | | | | | |
| 31,372,480 | | 4,227,745 | | | | 3,717,364 | | | | | | | | | | | | |
52 OPPENHEIMER GOLD & SPECIAL MINERALS FUND
| | | | |
| | |
| | | PORTFOLIO PROXY VOTING POLICIES AND PROCEDURES; UPDATES TO CONSOLIDATED STATEMENTS OF INVESTMENTS Unaudited | | |
The Fund has adopted Portfolio Proxy Voting Policies and Procedures under which the Fund votes proxies relating to securities (“portfolio proxies”) held by the Fund. A description of the Fund’s Portfolio Proxy Voting Policies and Procedures is available (i) without charge, upon request, by calling the Fund toll-free at 1.800.CALL OPP (225.5677), (ii) on the Fund’s website at oppenheimerfunds.com, and (iii) on the SEC’s website at www.sec.gov. In addition, the Fund is required to file Form N-PX, with its complete proxy voting record for the 12 months ended June 30th, no later than August 31st of each year. The Fund’s voting record is available (i) without charge, upon request, by calling the Fund toll-free at 1.800.CALL OPP (225.5677), and (ii) in the Form N-PX filing on the SEC’s website at www.sec.gov.
The Fund files its complete schedule of portfolio holdings with the SEC for the first quarter and the third quarter of each fiscal year on Form N-Q. The Fund’s Form N-Q filings are available on the SEC’s website at www.sec.gov. Those forms may be reviewed and copied at the SEC’s Public Reference Room in Washington, D.C. Information on the operation of the Public Reference Room may be obtained by calling 1-800-SEC-0330.
Householding—Delivery of Shareholder Documents
This is to inform you about OppenheimerFunds’ “householding” policy. If more than one member of your household maintains an account in a particular fund, OppenheimerFunds will mail only one copy of the fund’s prospectus (or, if available, the fund’s summary prospectus), annual and semiannual report and privacy policy. The consolidation of these mailings, called householding, benefits your fund through reduced mailing expense, and benefits you by reducing the volume of mail you receive from OppenheimerFunds. Householding does not affect the delivery of your account statements.
Please note that we will continue to household these mailings for as long as you remain an OppenheimerFunds shareholder, unless you request otherwise. If you prefer to receive multiple copies of these materials, please call us at 1.800.CALL-OPP (225-5677). You may also notify us in writing or via email. We will begin sending you individual copies of the prospectus (or, if available, the summary prospectus), reports and privacy policy within 30 days of receiving your request to stop householding.
53 OPPENHEIMER GOLD & SPECIAL MINERALS FUND
| | | | |
| | |
| | | OPPENHEIMER GOLD & SPECIAL MINERALS FUND | | |
| | |
| Trustees and Officers | | Brian F. Wruble, Chairman of the Board of Trustees and Trustee |
| | David K. Downes, Trustee |
| | | Matthew P. Fink, Trustee |
| | | Edmund P. Giambastiani, Jr., Trustee |
| | | Phillip A. Griffiths, Trustee |
| | | Mary F. Miller, Trustee |
| | | Joel W. Motley, Trustee |
| | | Joanne Pace, Trustee |
| | | Joseph M. Wikler, Trustee |
| | | Peter I. Wold, Trustee |
| | | William F. Glavin, Jr., President and Principal Executive Officer |
| | | Shanquan Li, Vice President |
| | | Arthur S. Gabinet, Secretary and Chief Legal Officer |
| | | Christina M. Nasta, Vice President and Chief Business Officer |
| | | Mark S. Vandehey, Vice President and Chief Compliance Officer |
| | | Brian W. Wixted, Treasurer and Principal Financial & Accounting Officer |
| |
| Manager | | OFI Global Asset Management, Inc. |
| |
| Sub-Adviser | | OppenheimerFunds, Inc. |
| |
| Distributor | | OppenheimerFunds Distributor, Inc. |
| |
| Transfer and Shareholder Servicing Agent | | OFI Global Asset Management, Inc. |
| |
| Sub-Transfer Agent | | Shareholder Services, Inc. DBA OppenheimerFunds Services |
| |
| Independent Registered Public Accounting Firm | | KPMG LLP |
| |
| Legal Counsel | | Kramer Levin Naftalis & Frankel LLP |
| |
| | | The financial statements included herein have been taken from the records of the Fund without examination of those records by the independent registered public accounting firm. |
© 2014 OppenheimerFunds, Inc. All rights reserved.
54 OPPENHEIMER GOLD & SPECIAL MINERALS FUND
As an Oppenheimer fund shareholder, you are entitled to know how we protect your personal information and how we limit its disclosure.
Information Sources
We obtain nonpublic personal information about our shareholders from the following sources:
| | l | | Applications or other forms |
| | l | | When you create a user ID and password for online account access |
| | l | | When you enroll in eDocs Direct, our electronic document delivery service |
| | l | | Your transactions with us, our affiliates or others |
| | l | | A software program on our website, often referred to as a “cookie,” which indicates which parts of our site you’ve visited |
| | l | | When you set up challenge questions to reset your password online |
If you visit oppenheimerfunds.com and do not log on to the secure account information areas, we do not obtain any personal information about you. When you do log on to a secure area, we do obtain your user ID and password to identify you. We also use this information to provide you with products and services you have requested, to inform you about products and services that you may be interested in and assist you in other ways.
We do not collect personal information through our website unless you willingly provide it to us, either directly by email or in those areas of the website that request information. In order to update your personal information (including your mailing address, email address and phone number) you must first log on and visit your user profile.
If you have set your browser to warn you before accepting cookies, you will receive the warning message with each cookie. You can refuse cookies by turning them off in your browser. However, doing so may limit your access to certain sections of our website.
We use cookies to help us improve and manage our website. For example, cookies help us recognize new versus repeat visitors to the site, track the pages visited, and enable some special features on the website. This data helps us provide a better service for our website visitors.
Protection of Information
We do not disclose any non-public personal information (such as names on a customer list) about current or former customers to anyone, except as permitted by law.
Disclosure of Information
We send your financial advisor (as designated by you) copies of confirmations, account statements and other documents reporting activity in your fund accounts. We may also use details about you and your investments to help us, our financial service affiliates, or firms that jointly market their financial products and services with ours, to better serve your investment needs or suggest financial services or educational material that may be of interest to you. If this requires us to provide you with an opportunity to “opt in” or “opt out” of such information sharing with a firm not affiliated with us, you will receive notification on how to do so, before any such sharing takes place.
Right of Refusal
We will not disclose your personal information to unaffiliated third parties (except as permitted by law), unless we first offer you a reasonable opportunity to refuse or “opt out” of such disclosure.
55 OPPENHEIMER GOLD & SPECIAL MINERALS FUND
| | | | |
| | |
| | | PRIVACY POLICY NOTICE Continued | | |
Internet Security and Encryption
In general, the email services provided by our website are encrypted and provide a secure and private means of communication with us. To protect your own privacy, confidential and/or personal information should only be communicated via email when you are advised that you are using a secure website.
As a security measure, we do not include personal or account information in non-secure emails, and we advise you not to send such information to us in non-secure emails. Instead, you may take advantage of the secure features of our website to encrypt your email correspondence. To do this, you will need to use a browser that supports Secure Sockets Layer (SSL) protocol.
We do not guarantee or warrant that any part of our website, including files available for download, are free of viruses or other harmful code. It is your responsibility to take appropriate precautions, such as use of an anti-virus software package, to protect your computer hardware and software.
| | l | | All transactions, including redemptions, exchanges and purchases, are secured by SSL and 128-bit encryption. SSL is used to establish a secure connection between your PC and OppenheimerFunds’ server. It transmits information in an encrypted and scrambled format. |
| | l | | Encryption is achieved through an electronic scrambling technology that uses a “key” to code and then decode the data. Encryption acts like the cable converter box you may have on your television set. It scrambles data with a secret code so that no one can make sense of it while it is being transmitted. When the data reaches its destination, the same software unscrambles the data. |
| | l | | You can exit the secure area by either closing your browser, or for added security, you can use the Log Out button before you close your browser. |
Other Security Measures
We maintain physical, electronic and procedural safeguards to protect your personal account information. Our employees and agents have access to that information only so that they may offer you products or provide services, for example, when responding to your account questions.
How You Can Help
You can also do your part to keep your account information private and to prevent unauthorized transactions. If you obtain a user ID and password for your account, do not allow it to be used by anyone else. Also, take special precautions when accessing your account on a computer used by others.
Who We Are
This joint notice describes the privacy policies of the Oppenheimer funds, OppenheimerFunds, Inc., and each of its investment adviser subsidiaries, OppenheimerFunds Distributor, Inc. and OFI Global Trust Co. It applies to all Oppenheimer fund accounts you presently have, or may open in the future, using your Social Security number—whether or not you remain a shareholder of our funds. This notice was last updated November 2013. In the event it is updated or changed, we will post an updated notice on our website at oppenheimerfunds.com. If you have any questions about these privacy policies, write to us at P.O. Box 5270, Denver, CO 80217-5270, email us by clicking on the Contact Us section of our website at oppenheimerfunds.com or call us at 1.800.CALL OPP (225.5677).
56 OPPENHEIMER GOLD & SPECIAL MINERALS FUND
Item 2. Code of Ethics.
Not applicable to semiannual reports.
Item 3. Audit Committee Financial Expert.
Not applicable to semiannual reports.
Item 4. Principal Accountant Fees and Services.
Not applicable to semiannual reports.
Item 5. Audit Committee of Listed Registrants
Not applicable.
Item 6. Schedule of Investments.
a) Not applicable. The complete schedule of investments is included in Item 1 of this Form N-CSR.
b) Not applicable.
Item 7. Disclosure of Proxy Voting Policies and Procedures for Closed-End Management Investment Companies.
Not applicable.
Item 8. Portfolio Managers of Closed-End Management Investment Companies.
Not applicable.
Item 9. Purchases of Equity Securities by Closed-End Management Investment Company
and Affiliated Purchasers.
Not applicable.
Item 10. Submission of Matters to a Vote of Security Holders.
The Fund’s Governance Committee Provisions with Respect to Nominations of Directors/Trustees to the Respective Boards
None
Item 11. Controls and Procedures.
Based on their evaluation of the registrant’s disclosure controls and procedures (as defined in rule 30a-3(c) under the Investment Company Act of 1940 (17 CFR 270.30a-3(c)) as of 12/31/2013, the registrant’s principal executive officer and principal financial officer found the registrant’s disclosure controls and procedures to provide reasonable assurances that information required to be disclosed by the registrant in the reports that it files under the Securities Exchange Act of 1934 (a) is accumulated and communicated to registrant’s management, including its principal executive officer and principal financial officer, to allow timely decisions regarding required disclosure, and (b) is recorded, processed, summarized and reported, within the time periods specified in the rules and forms adopted by the U.S. Securities and Exchange Commission.
There have been no changes in the registrant’s internal controls over financial reporting that occurred during the registrant’s second fiscal quarter of the period covered by this report that have materially affected, or are reasonably likely to materially affect, the registrant’s internal control over financial reporting.
Item 12. Exhibits.
| (a) | (1) Not applicable to semiannual reports. |
(2) Exhibits attached hereto.
(3) Not applicable.
| (b) | Exhibit attached hereto. |
SIGNATURES
Pursuant to the requirements of the Securities Exchange Act of 1934 and the Investment Company Act of 1940, the registrant has duly caused this report to be signed on its behalf by the undersigned, thereunto duly authorized.
Oppenheimer Gold & Special Minerals Fund
| | |
| By: | | /s/ William F. Glavin, Jr. |
| | William F. Glavin, Jr. |
| | Principal Executive Officer |
| Date: | | 2/10/2014 |
Pursuant to the requirements of the Securities Exchange Act of 1934 and the Investment Company Act of 1940, this report has been signed below by the following persons on behalf of the registrant and in the capacities and on the dates indicated.
| | |
| By: | | /s/ William F. Glavin, Jr. |
| | William F. Glavin, Jr. |
| | Principal Executive Officer |
| Date: | | 2/10/2014 |
| | |
| By: | | /s/ Brian W. Wixted |
| | Brian W. Wixted |
| | Principal Financial Officer |
| Date: | | 2/10/2014 |