The Fund is a separate series of Davis New York Venture Fund, Inc., which is registered under the Investment Company Act of 1940, as amended, as a diversified, open-end management investment company. The Fund’s investment objective is growth of capital. The Fund offers shares in five classes, Class A, Class B, Class C, Class R, and Class Y. The Class A shares are sold with a front-end sales charge and the Class B and Class C shares are sold at net asset value and may be subject to a contingent deferred sales charge upon redemption. Class R and Class Y shares are sold at net asset value and are not subject to any contingent deferred sales charge. Class R shares generally are available only to retirement and benefit plans. Class Y shares are only available to certain qualified investors. Income, expenses (other than those attributable to a specific class), and gains and losses are allocated daily to each class of shares based upon the relative proportion of net assets represented by each class. Operating expenses directly attributable to a specific class, such as distribution and transfer agent fees, are charged against the operations of that class. All classes have identical rights with respect to voting (exclusive of each Class’s distribution arrangement), liquidation, and distributions. The following is a summary of significant accounting policies followed by the Fund in the preparation of its financial statements.
DAVIS NEW YORK VENTURE FUND
NOTES TO FINANCIAL STATEMENTS – (Continued)
July 31, 2005 |
|
NOTE 1 – SUMMARY OF SIGNIFICANT ACCOUNTING POLICIES – (Continued)
Reported net realized foreign exchange gains or losses arise from sales and maturities of investments, sales of foreign currencies, currency gains or losses realized between the trade and settlement dates on securities transactions, the difference between the amounts of dividends, interest and foreign withholding taxes recorded on the Fund’s books, and the U.S. dollar equivalent of the amounts actually received or paid. Net unrealized foreign exchange gains and losses arise from changes in the value of assets and liabilities other than investments in securities at fiscal year end, resulting from changes in the exchange rate. The Fund includes foreign currency gains and losses realized on the sale of investments together with market gains and losses on such investments in the statement of operations.
Federal Income Taxes – It is the Fund’s policy to comply with the requirements of the Internal Revenue Code applicable to regulated investment companies and to distribute substantially all of its taxable income, including any net realized gains on investments not offset by loss carryovers, to shareholders. Therefore, no provision for federal income or excise tax is required. At July 31, 2005, the Fund had available for Federal income tax purposes unused capital loss carryovers of $2,281,535,000 of which $4,237,000 expires in 2009, $458,003,000 expires in 2010, $1,141,176,000 expires in 2011, $435,021,000 expires in 2012, and $243,098,000 expires in 2013. In addition, at July 31, 2005, the Fund had approximately $329,150,000 of post October 2004 losses available to offset future capital gains, if any, which expire in 2014.
Securities Transactions and Related Investment Income – Securities transactions are accounted for on the trade date (date the order to buy or sell is executed) with realized gain or loss on the sale of securities being determined based upon identified cost. Dividend income is recorded on the ex-dividend date. Interest income, which includes accretion of discount and amortization of premium, is accrued as earned.
Dividends and Distributions to Shareholders – Dividends and distributions to shareholders are recorded on the ex-dividend date. Net investment income (loss), net realized gains (losses) and net unrealized appreciation (depreciation) of investments may differ for financial statement and tax purposes primarily because of the recognition of certain foreign currency gains (losses) as ordinary income (loss) for tax purposes and the tax deferral of losses on “wash sale” transactions. The character of dividends and distributions made during the fiscal year from net investment income and net realized securities gains may differ from their ultimate characterization for Federal income tax purposes. Also, due to the timing of dividends and distributions, the fiscal year in which amounts are distributed may differ from the fiscal year in which income or realized gain was recorded by the Fund. The Fund adjusts the classification of distributions to shareholders to reflect the differences between financial statement amounts and distributions determined in accordance with income tax regulations. Accordingly, during the year ended July 31, 2005, amounts have been reclassified to reflect a decrease in undistributed net investment income of $409,463, an increase in accumulated net realized losses from investments and foreign currency transactions of $3,251,267, and an increase to additional paid in capital of $3,660,730. Net assets have not been affected by this reclassification.
The tax character of distributions paid during the years ended July 31, 2005 and 2004, was as follows:
| | 2005 | | 2004 | |
Ordinary income | | $ | 130,953,748 | | $ | 89,368,987 | |
| | | | | | | |
24
DAVIS NEW YORK VENTURE FUND
NOTES TO FINANCIAL STATEMENTS – (Continued)
July 31, 2005 |
|
NOTE 1 – SUMMARY OF SIGNIFICANT ACCOUNTING POLICIES – (Continued)
As of July 31, 2005, the components of distributable earnings (accumulated losses) on a tax basis were as follows:
Undistributed net investment income | | $ | 104,971,726 | |
Accumulated net realized losses from investments and foreign currency transactions | | | (2,610,685,155 | ) |
Net unrealized appreciation on investments and foreign currency transactions | | | 9,954,030,903 | |
Total | | $ | 7,448,317,474 | |
Use of Estimates in Financial Statements – In preparing financial statements in conformity with accounting principles generally accepted in the United States of America, management makes estimates and assumptions that affect the reported amounts of assets and liabilities and disclosure of contingent assets and liabilities at the date of the financial statements, as well as the reported amounts of income and expenses during the reporting period. Actual results may differ from these estimates.
NOTE 2 – PURCHASES AND SALES OF SECURITIES
Purchases and sales of investment securities (excluding short-term securities) for the year ended July 31, 2005, were $3,901,271,572 and $876,684,430, respectively.
NOTE 3 – INVESTMENT ADVISORY FEES AND OTHER TRANSACTIONS WITH AFFILIATES
Advisory fees are paid monthly to Davis Advisors (the “Adviser”), the Fund’s investment adviser. Until April 1, 2005, the annual rate was 0.75% of the average net assets for the first $250 million, 0.65% of the average net assets on the next $250 million, 0.55% of the average net assets on the next $2.5 billion, 0.54% of the average net assets on the next $1 billion, 0.53% of the average net assets on the next $1 billion, 0.52% of the average net assets on the next $1 billion, 0.51% of the average net assets on the next $1 billion, 0.50% of the average net assets on the next $3 billion, 0.485% of the average net assets on the next $8 billion, and 0.47% of the average net assets in excess of $18 billion. Effective April 1, 2005, the Advisory fee was changed from 0.47% of the average net assets in excess of $18 billion to 0.47% of the average net assets on the next $7 billion, and 0.455% of the average net assets in excess of $25 billion. Management fees paid during the year ended July 31, 2005, approximated 0.50% of average net assets.
State Street Bank & Trust Co. (“State Street Bank”) is the Fund’s primary transfer agent. The Adviser is also paid for certain transfer agent services. The fee for these services for the year ended July 31, 2005, amounted to $1,831,074. State Street Bank is the Fund’s primary accounting provider. Fees for such services are included in the custodian fee as State Street Bank also serves as the Fund’s custodian. The Adviser is also paid for certain accounting services. The fee amounted to $399,996 for the year ended July 31, 2005. Certain directors and the officers of the Fund are also directors and officers of the general partner of the Adviser.
Davis Selected Advisers-NY, Inc. (“DSA-NY”), a wholly-owned subsidiary of the Adviser, acts as sub-adviser to the Fund. DSA-NY performs research and portfolio management services for the Fund under a Sub-Advisory Agreement with the Adviser. The Fund pays no fees directly to DSA-NY.
25
DAVIS NEW YORK VENTURE FUND
NOTES TO FINANCIAL STATEMENTS – (Continued)
July 31, 2005 |
|
NOTE 4 – DISTRIBUTION AND UNDERWRITING FEES
CLASS A SHARES
Class A shares of the Fund are sold at net asset value plus a sales charge and are redeemed at net asset value.
During the year ended July 31, 2005, Davis Distributors, LLC, the Fund’s Underwriter (the “Underwriter” or “Distributor”) received $20,631,716 from commissions earned on sales of Class A shares of the Fund, of which $3,154,890 was retained by the Underwriter and the remaining $17,476,826 was reallowed to investment dealers. The Underwriter paid the costs of prospectuses in excess of those required to be filed as part of the Fund’s registration statement, sales literature and other expenses assumed or incurred by it in connection with such sales.
The Underwriter is reimbursed for amounts paid to dealers as a service fee or commissions with respect to Class A shares sold by dealers which remain outstanding during the period. The service fee is paid at an annual rate up to 1/4 of 1% of the average net assets maintained by the responsible dealers. The service fee for Class A shares of the Fund for the year ended July 31, 2005, was $37,758,656.
CLASS B SHARES
Class B shares of the Fund are sold at net asset value and are redeemed at net asset value less a contingent deferred sales charge if redeemed within six years of purchase.
The Fund pays a distribution fee to reimburse the Distributor for commission advances on the sale of the Fund’s Class B shares. Payments under the Class B Distribution Plan are limited to an annual rate of equal to the lesser of 1.25% of the average daily net asset value of the Class B shares or the maximum amount provided by applicable rule or regulation of the National Association of Securities Dealers, Inc., (“NASD”), which currently is 1.00%. Therefore, the effective rate of the Class B Distribution Plan is currently 1%, of which 0.75% may be used to pay distribution expenses and 0.25% may be used to pay shareholder service fees. The NASD rule also limits the aggregate amount the Fund may pay for distribution to 6.25% of gross Fund sales since inception of the Rule 12b-1 plan, plus interest, at 1% over the prime rate on unpaid amounts. The Distributor intends to seek full payment (plus interest at prime plus 1%) of distribution charges that exceed the 1% annual limit in some future period or periods when the plan limits have not been reached.
During the year ended July 31, 2005, Class B shares of the Fund made distribution plan payments which included distribution fees of $39,982,158 and service fees of $13,240,718.
Commission advances by the Distributor during the year ended July 31, 2005 on the sale of Class B shares of the Fund amounted to $9,605,359, all of which was reallowed to qualified selling dealers.
The Distributor intends to seek payment from Class B shares of the Fund in the amount of $318,642,517 representing the cumulative commission advances by the Distributor on the sale of the Fund’s Class B shares, plus interest, reduced by cumulative distribution fees paid by the Fund and cumulative contingent deferred sales charges paid by redeeming shareholders. The Fund has no contractual obligation to pay any such distribution charges and the amount, if any, timing and condition of such payment are solely within the discretion of the Directors who are not interested persons of the Fund or the Distributor.
26
DAVIS NEW YORK VENTURE FUND
NOTES TO FINANCIAL STATEMENTS – (Continued)
July 31, 2005 |
|
NOTE 4 – DISTRIBUTION AND UNDERWRITING FEES – (Continued)
CLASS B SHARES – (Continued)
A contingent deferred sales charge is imposed upon redemption of certain Class B shares of the Fund within six years of the original purchase. The charge is a declining percentage starting at 4% of the lesser of net asset value of the shares redeemed or the total cost of such shares. During the year ended July 31, 2005 the Distributor received $5,897,401 in contingent deferred sales charges from Class B shares of the Fund.
CLASS C SHARES
Class C shares of the Fund are sold at net asset value and are redeemed at net asset value less a contingent deferred sales charge of 1% if redeemed within one year of purchase. Payments under the Class C Distribution Plan are limited to an annual rate of equal to the lesser of 1.25% of the average daily net asset value of the Class C shares or the maximum amount provided by applicable rule or regulation of the National Association of Securities Dealers, Inc., (“NASD”), which currently is 1.00%. Therefore, the effective rate of the Class C Distribution Plan is currently 1%, of which 0.75% may be used to pay distribution expenses and 0.25% may be used to pay shareholder service fees. Class C shares are subject to the same 6.25% and 1% limitations applicable to the Class B Distribution Plan.
During the year ended July 31, 2005, Class C shares of the Fund made distribution plan payments which included distribution fees of $33,151,516 and service fees of $11,050,505. During the year ended July 31, 2005, the Distributor received $447,787 in contingent deferred sales charges from Class C shares of the Fund.
CLASS R SHARES
Class R shares of the Fund are sold and redeemed at net asset value. Payments under the Class R Distribution Plan are limited to an annual rate of 0.75% of the average daily net asset value of the Class R shares or the maximum amount provided by applicable rule or regulation of the National Association of Securities Dealers, Inc., (“NASD”), which currently is 1.00%. The effective rate of the Class R Distribution Plan is currently 0.50%, of which 0.25% may be used to pay distribution expenses and 0.25% may be used to pay shareholder service fees. Class R shares are subject to the same 6.25% and 1% limitations applicable to the Class B Distribution Plan.
During the year ended July 31, 2005, Class R shares of the Fund made distribution plan payments which included distribution fees and service fees of $116,272 for each.
27
DAVIS NEW YORK VENTURE FUND
NOTES TO FINANCIAL STATEMENTS – (Continued)
July 31, 2005 |
NOTE 5 – CAPITAL STOCK
At July 31, 2005, there were 3,000,000,000 shares of capital stock ($0.05 par value per share) authorized, 2,125,000,000 of which shares are classified as Davis New York Venture Fund. Transactions in capital stock were as follows:
Class A
| | Year ended
July 31, 2005 | | Year ended
July 31, 2004 | |
| | Shares | | Amount | | Shares | | Amount | |
Shares subscribed | | 166,584,140 | | $ | 5,032,860,658 | | 129,537,957 | | $ | 3,537,315,624 | |
Shares issued in reinvestment of distributions | | 3,462,382 | | | 104,739,483 | | 2,700,189 | | | 71,365,847 | |
| | 170,046,522 | | | 5,137,600,141 | | 132,238,146 | | | 3,608,681,471 | |
Shares redeemed | | (87,405,898 | ) | | (2,638,099,228 | ) | (73,663,816 | ) | | (1,997,566,384 | ) |
Net increase | | 82,640,624 | | $ | 2,499,500,913 | | 58,574,330 | | $ | 1,611,115,087 | |
Class B
| | Year ended
July 31, 2005 | | Year ended
July 31, 2004 | |
| | Shares | | Amount | | Shares | | Amount | |
Shares subscribed | | 12,661,172 | | $ | 364,329,137 | | 17,255,350 | | $ | 445,891,461 | |
Shares issued in reinvestment of distributions | | 6,001 | | | 174,369 | | 3,859 | | | 97,967 | |
| | 12,667,173 | | | 364,503,506 | | 17,259,209 | | | 445,989,428 | |
Shares redeemed | | (40,494,793 | ) | | (1,169,943,162 | ) | (35,819,817 | ) | | (931,808,970 | ) |
Net decrease | | (27,827,620 | ) | $ | (805,439,656 | ) | (18,560,608 | ) | $ | (485,819,542 | ) |
Class C
| | Year ended
July 31, 2005 | | Year ended
July 31, 2004 | |
| | Shares | | Amount | | Shares | | Amount | |
Shares subscribed | | 35,123,857 | | $ | 1,024,314,882 | | 27,305,099 | | $ | 717,037,581 | |
Shares issued in reinvestment of distributions | | 33,016 | | | 965,026 | | 35,030 | | | 895,031 | |
| | 35,156,873 | | | 1,025,279,908 | | 27,340,129 | | | 717,932,612 | |
Shares redeemed | | (18,985,186 | ) | | (551,123,053 | ) | (18,332,071 | ) | | (478,925,435 | ) |
Net increase | | 16,171,687 | | $ | 474,156,855 | | 9,008,058 | | $ | 239,007,177 | |
28
DAVIS NEW YORK VENTURE FUND
NOTES TO FINANCIAL STATEMENTS – (Continued)
July 31, 2005 |
NOTE 5 – CAPITAL STOCK – (Continued)
Class R
| | Year ended
July 31, 2005 | | August 20, 2003
(Inception of Class)
through
July 31, 2004 | |
| | Shares | | Amount | | Shares | | Amount | |
Shares subscribed | | 3,032,631 | | $ | 92,446,812 | | 381,213 | | $ | 10,854,447 | |
Shares issued in reinvestment of distributions | | 4,563 | | | 138,272 | | 27 | | | 704 | |
| | 3,037,194 | | | 92,585,084 | | 381,240 | | | 10,855,151 | |
Shares redeemed | | (423,685 | ) | | (12,946,021 | ) | (15,729 | ) | | (446,025 | ) |
Net increase | | 2,613,509 | | $ | 79,639,063 | | 365,511 | | $ | 10,409,126 | |
Class Y
| | Year ended
July 31, 2005 | | Year ended
July 31, 2004 | |
| | Shares | | Amount | | Shares | | Amount | |
Shares subscribed | | 39,188,485 | | $ | 1,201,424,907 | | 15,287,681 | | $ | 426,257,699 | |
Shares issued in reinvestment of distributions | | 436,774 | | | 13,347,827 | | 328,341 | | | 8,766,699 | |
| | 39,625,259 | | | 1,214,772,734 | | 15,616,022 | | | 435,024,398 | |
Shares redeemed* | | (12,553,449 | ) | | (381,586,882 | ) | (11,605,390 | ) | | (316,529,379 | ) |
Net increase | | 27,071,810 | | $ | 833,185,852 | | 4,010,632 | | $ | 118,495,019 | |
* Amounts include redemptions as a result of in-kind transfers of securities (see Note 10 in the Notes to Financial Statements).
NOTE 6 – EXPENSES PAID INDIRECTLY
Under an agreement with the custodian bank, custodian fees are reduced for earnings on cash balances maintained at the custodian by the Fund. Such reductions amounted to $3,906 during the year ended July 31, 2005.
NOTE 7 – SECURITIES LOANED
Davis New York Venture Fund (the “Fund”) has entered into a securities lending arrangement with UBS Financial Services, Inc. Under the terms of the agreement, the Fund receives fee income from lending transactions; in exchange for such fees, UBS Financial Services, Inc. is authorized to loan securities on behalf of the Fund, against receipt of collateral at least equal to the value of the securities loaned. As of July 31, 2005, the Fund had on loan securities valued at $83,028,604; cash of $88,768,615 was received as collateral for the loans. The Fund bears the risk of any deficiency in the amount of the collateral available for return to a borrower due to a loss in an approved investment.
29
DAVIS NEW YORK VENTURE FUND NOTES TO FINANCIAL STATEMENTS – (Continued) July 31, 2005 |
NOTE 8 – BANK BORROWINGS
The Fund may borrow up to 5% of its assets from a bank to purchase portfolio securities, or for temporary and emergency purposes. The purchase of securities with borrowed funds creates leverage in the Fund. The Fund has entered into an agreement, which enables it to participate with certain other funds managed by the Adviser in an unsecured line of credit with a bank, which permits borrowings up to $50 million, collectively. Interest is charged based on its borrowings, at a rate equal to the overnight Federal Funds Rate plus 0.75%. The Fund had no borrowings outstanding for the year ended July 31, 2005.
NOTE 9 – PAYMENTS BY AFFILIATES
The Adviser reimbursed the Fund for commissions paid to certain broker dealers which received brokerage which was directed for sale of fund shares from January 1, 2000 to July 31, 2003. The amount paid to the Fund in the fiscal year ended July 31, 2004 was $2,246,097.
NOTE 10 – IN-KIND REDEMPTION
During the years ended July 31, 2005 and 2004, shareholders redeemed 2,268,469 and 917,428 shares, respectively, in exchange for Fund portfolio securities valued at $67,571,498 and $22,091,668, respectively. The Fund realized a gain (loss) of $6,610,672 and $(2,949,942) for the years ended July 31, 2005 and 2004, respectively. This gain (loss) is not taxable for Federal Income Tax purposes.
NOTE 11 – ILLIQUID SECURITIES
Securities may be considered illiquid if they lack a readily available market or if valuation has not changed for a certain period of time. The aggregate value of illiquid securities in Davis New York Venture Fund amounted to $61,293,800 or 0.20% of the Fund’s net assets, as of July 31, 2005.
Security | | | Acquisition
Date | | Principal | | Cost per
Unit | | Valuation per Unit as
of July 31,
2005 |
Level 3 Communications, Inc., Conv. Sr. Notes, 10.00%, 05/01/11 | | 4/4/05 | | | 68,500,000 | | $100.00 | | $89.48 | |
| | | | | | | | | | | |
NOTE 12 – LITIGATION MATTERS
On June 2, 2004, a proposed class action lawsuit was filed in the United States District Court for the Southern District of New York on behalf of investors in certain mutual funds (“Funds”) managed by Davis Selected Advisers L.P. (“Davis Advisors”) including the Davis New York Venture Fund. The plaintiffs claim that Davis Advisors and its affiliates, and the individual directors of the Funds (collectively the “Defendants”) used Fund assets to pay brokers to market the Funds and that the Defendants disguised such payments as brokerage commissions and further failed to disclose such payments in public filings or elsewhere. The lawsuit seeks damages of unspecified amounts. Three substantially identical proposed class action lawsuits were filed against the Defendants later in June and July 2004 in the United States Court for the Southern District of New York. All four suits have been consolidated into a single action. Davis Advisors believes the actions are without merit and the Defendants intend to vigorously defend the proceedings. Although no determination can be made at this time, the Fund does not expect this lawsuit to have a material adverse effect on the assets or results of the Fund.
30
DAVIS NEW YORK VENTURE FUND
FINANCIAL HIGHLIGHTS
CLASS A |
|
Financial Highlights for a share of capital stock outstanding throughout each period.
| | Year ended July 31, | |
| | 2005 | | 2004 | | 2003 | | 2002 | | 2001 | |
| | | | | | | | | | | | | | | | |
Net Asset Value, Beginning of Period | | $ | 27.83 | | $ | 23.73 | | $ | 21.47 | | $ | 25.99 | | $ | 30.64 | |
| | | | | | | | | | | | | | | | |
Income (Loss) From Investment Operations | | | | | | | | | | | | | | | | |
Net Investment Income | | | .30 | 3 | | .17 | | | .18 | | | .12 | | | .11 | |
Net Realized and Unrealized Gains (Losses) | | | 4.23 | | | 4.12 | | | 2.21 | | | (4.61 | ) | | (2.07 | ) |
Total From Investment Operations | | | 4.53 | | | 4.29 | | | 2.39 | | | (4.49 | ) | | (1.96 | ) |
| | | | | | | | | | | | | | | | |
Dividends and Distributions | | | | | | | | | | | | | | | | |
Dividends from Net Investment Income | | | (.23 | ) | | (.19 | ) | | (.13 | ) | | (.03 | ) | | (.04 | ) |
Distributions in Excess of Net Investment Income | | | – | | | – | | | – | | | – | | | (.01 | ) |
Distributions from Realized Gains | | | – | | | – | | | – | | | – | | | (2.64 | ) |
Total Dividends and Distributions | | | (.23 | ) | | (.19 | ) | | (.13 | ) | | (.03 | ) | | (2.69 | ) |
Net Asset Value, End of Period | | $ | 32.13 | | $ | 27.83 | | $ | 23.73 | | $ | 21.47 | | $ | 25.99 | |
Total Return1 | | | 16.34 | % | | 18.10 | % | | 11.19 | % | | (17.29 | )% | | (6.70 | )% |
| | | | | | | | | | | | | | | | |
Ratios/Supplemental Data | | | | | | | | | | | | | | | | |
| | | | | | | | | | | | | | | | |
Net Assets, End of Period (000,000 omitted) | | $ | 17,508 | | $ | 12,868 | | $ | 9,581 | | $ | 8,734 | | $ | 10,678 | |
Ratio of Expenses to Average Net Assets | | | .89 | % | | .92 | % | | .95 | % | | .92 | % | | .89 | % |
Ratio of Net Investment Income to Average Net Assets | | | .98 | % | | .77 | % | | .85 | % | | .49 | % | | .50 | % |
Portfolio Turnover Rate2 | | | 3 | % | | 6 | % | | 10 | % | | 22 | % | | 15 | % |
1 | Assumes hypothetical initial investment on the business day before the first day of the fiscal period, with all dividends and distributions reinvested in additional shares on the reinvestment date, and redemption at the net asset value calculated on the last business day of the fiscal period. Sales charges are not reflected in the total returns. |
2 | The lesser of purchases or sales of portfolio securities for a period, divided by the monthly average of the market value of portfolio securities owned during the period. Securities with a maturity or expiration date at the time of acquisition of one year or less are excluded from the calculation. |
3 | Per share calculations were based on average shares outstanding for the period. |
See Notes to Financial Statements
31
DAVIS NEW YORK VENTURE FUND
FINANCIAL HIGHLIGHTS
CLASS B |
|
Financial Highlights for a share of capital stock outstanding throughout each period.
| | Year ended July 31, | |
| | 2005 | | 2004 | | 2003 | | 2002 | | 2001 | |
Net Asset Value, Beginning of Period | | $ | 26.60 | | $ | 22.70 | | $ | 20.58 | | $ | 25.09 | | $ | 29.85 | |
| | | | | | | | | | | | | | | | |
Income (Loss) From Investment Operations | | | | | | | | | | | | | | | | |
Net Investment Income (Loss) | | | .05 | 4 | | (.02 | )4 | | .01 | 4 | | (.09 | ) | | (.03 | ) |
Net Realized and Unrealized Gains (Losses) | | | 4.04 | | | 3.92 | | | 2.11 | | | (4.42 | ) | | (2.09 | ) |
Total From Investment Operations | | | 4.09 | | | 3.90 | | | 2.12 | | | (4.51 | ) | | (2.12 | ) |
| | | | | | | | | | | | | | | | |
Dividends and Distributions | | | | | | | | | | | | | | | | |
Dividends from Net Investment Income | | | –3 | | | –3 | | | – | | | – | | | – | |
Distributions from Realized Gains | | | – | | | – | | | – | | | – | | | (2.64 | ) |
Total Dividends and Distributions | | | –3 | | | –3 | | | – | | | – | | | (2.64 | ) |
Net Asset Value, End of Period | | $ | 30.69 | | $ | 26.60 | | $ | 22.70 | | $ | 20.58 | | $ | 25.09 | |
Total Return1 | | | 15.38 | % | | 17.18 | % | | 10.30 | % | | (17.98 | )% | | (7.46 | )% |
| | | | | | | | | | | | | | | | |
Ratios/Supplemental Data | | | | | | | | | | | | | | | | |
| | | | | | | | | | | | | | | | |
Net Assets, End of Period (000,000 omitted) | | $ | 5,223 | | $ | 5,267 | | $ | 4,917 | | $ | 4,874 | | $ | 6,303 | |
Ratio of Expenses to Average Net Assets | | | 1.69 | % | | 1.73 | % | | 1.77 | % | | 1.72 | % | | 1.71 | % |
Ratio of Net Investment Income (Loss) to Average Net Assets | | | .18 | % | | (.04 | )% | | .03 | % | | (.31 | )% | | (.32 | )% |
Portfolio Turnover Rate2 | | | 3 | % | | 6 | % | | 10 | % | | 22 | % | | 15 | % |
1 | Assumes hypothetical initial investment on the business day before the first day of the fiscal period, with all dividends and distributions reinvested in additional shares on the reinvestment date, and redemption at the net asset value calculated on the last business day of the fiscal period. Sales charges are not reflected in the total returns. |
2 | The lesser of purchases or sales of portfolio securities for a period, divided by the monthly average of the market value of portfolio securities owned during the period. Securities with a maturity or expiration date at the time of acquisition of one year or less are excluded from the calculation. |
3 | Less than $0.005 per share. |
4 | Per share calculations were based on average shares outstanding for the period. |
See Notes to Financial Statements
32
DAVIS NEW YORK VENTURE FUND
FINANCIAL HIGHLIGHTS
CLASS C |
|
Financial Highlights for a share of capital stock outstanding throughout each period.
| | Year ended July 31, | |
| | 2005 | | 2004 | | 2003 | | 2002 | | 2001 | |
Net Asset Value, Beginning of Period | | $ | 26.77 | | $ | 22.85 | | $ | 20.71 | | $ | 25.24 | | $ | 30.00 | |
| | | | | | | | | | | | | | | | |
Income (Loss) From Investment Operations | | | | | | | | | | | | | | | | |
Net Investment Income (Loss) | | | .05 | 4 | | –3,4 | | | –3 | | | (.08 | ) | | (.02 | ) |
Net Realized and Unrealized Gains (Losses) | | | 4.08 | | | 3.93 | | | 2.14 | | | (4.45 | ) | | (2.10 | ) |
Total From Investment Operations | | | 4.13 | | | 3.93 | | | 2.14 | | | (4.53 | ) | | (2.12 | ) |
| | | | | | | | | | | | | | | | |
Dividends and Distributions | | | | | | | | | | | | | | | | |
Dividends from Net Investment Income | | | (.01 | ) | | (.01 | ) | | – | | | – | | | – | |
Distributions from Realized Gains | | | – | | | – | | | – | | | – | | | (2.64 | ) |
Total Dividends and Distributions | | | (.01 | ) | | (.01 | ) | | – | | | – | | | (2.64 | ) |
Net Asset Value, End of Period | | $ | 30.89 | | $ | 26.77 | | $ | 22.85 | | $ | 20.71 | | $ | 25.24 | |
Total Return1 | | | 15.42 | % | | 17.19 | % | | 10.33 | % | | (17.95 | )% | | (7.42 | )% |
| | | | | | | | | | | | | | | | |
Ratios/Supplemental Data | | | | | | | | | | | | | | | | |
Net Assets, End of Period (000,000 omitted) | | $ | 4,998 | | $ | 3,899 | | $ | 3,122 | | $ | 3,004 | | $ | 3,825 | |
Ratio of Expenses to Average Net Assets | | | 1.68 | % | | 1.70 | % | | 1.74 | % | | 1.70 | % | | 1.68 | % |
Ratio of Net Investment Income (Loss) toAverage Net Assets | | | .19 | % | | (.01) | % | | .06 | % | | (.29 | )% | | (.29 | )% |
Portfolio Turnover Rate2 | | | 3 | % | | 6 | % | | 10 | % | | 22 | % | | 15 | % |
1 | Assumes hypothetical initial investment on the business day before the first day of the fiscal period, with all dividends and distributions reinvested in additional shares on the reinvestment date, and redemption at the net asset value calculated on the last business day of the fiscal period. Sales charges are not reflected in the total returns. |
2 | The lesser of purchases or sales of portfolio securities for a period, divided by the monthly average of the market value of portfolio securities owned during the period. Securities with a maturity or expiration date at the time of acquisition of one year or less are excluded from the calculation. |
3 | Less than $0.005 per share. |
4 | Per share calculations were based on average shares outstanding for the period. |
See Notes to Financial Statements
33
DAVIS NEW YORK VENTURE FUND
FINANCIAL HIGHLIGHTS
CLASS R |
Financial Highlights for a share of capital stock outstanding throughout each period.
| | Year ended
July 31,
2005 | | August 20, 2003
(Inception
of class)
through
July 31,
2004 | |
Net Asset Value, Beginning of Period | | | $ | 27.83 | | | | $ | 23.98 | | |
Income From Investment Operations | | | | | | | | | | | |
Net Investment Income | | | | .23 | 3 | | | | .13 | 3 | |
Net Realized and Unrealized Gains | | | | 4.23 | | | | | 3.86 | | |
Total From Investment Operations | | | | 4.46 | | | | | 3.99 | | |
| | | | | | | | | | | |
Dividends and Distributions | | | | | | | | | | | |
Dividends from Net Investment Income | | | | (.16 | ) | | | | (.14 | ) | |
Total Dividends and Distributions | | | | (.16 | ) | | | | (.14 | ) | |
Net Asset Value, End of Period | | | $ | 32.13 | | | | $ | 27.83 | | |
| | | | | | | | | | | |
Total Return1 | | | | 16.04 | % | | | | 16.67 | % | |
| | | | | | | | | | | |
Ratios/Supplemental Data | | | | | | | | | | | |
Net Assets, End of Period (000,000 omitted) | | | $ | 96 | | | | $ | 10 | | |
Ratio of Expenses to Average Net Assets | | | | 1.15 | % | | | | 1.15 | %* | |
Ratio of Net Investment Income to Average Net Assets | | | | .72 | % | | | | .51 | %* | |
Portfolio Turnover Rate2 | | | | 3 | % | | | | 6 | % | |
1 | Assumes hypothetical initial investment on the business day before the first day of the fiscal period (or inception of offering), with all dividends and distributions reinvested in additional shares on the reinvestment date, and redemption at the net asset value calculated on the last business day of the fiscal period. Sales charges are not reflected in the total returns. Total returns are not annualized for periods of less than one full year. |
2 | The lesser of purchases or sales of portfolio securities for a period, divided by the monthly average of the market value of portfolio securities owned during the period. Securities with a maturity or expiration date at the time of acquisition of one year or less are excluded from the calculation. |
3 | Per share calculations were based on average shares outstanding for the period. |
See Notes to Financial Statements
34
DAVIS NEW YORK VENTURE FUND
FINANCIAL HIGHLIGHTS
CLASS Y |
Financial Highlights for a share of capital stock outstanding throughout each period.
| | Year ended July 31, | |
| | 2005 | | 2004 | | 2003 | | 2002 | | 2001 | |
Net Asset Value, Beginning of Period | | $ | 28.18 | | $ | 24.01 | | $ | 21.72 | | $ | 26.29 | | $ | 30.96 | |
Income (Loss) From Investment Operations | | | | | | | | | | | | | | | | |
Net Investment Income | | | .40 | 3 | | .28 | | | .25 | | | .26 | | | .13 | |
Net Realized and Unrealized Gains (Losses) | | | 4.28 | | | 4.16 | | | 2.24 | | | (4.73 | ) | | (2.02 | ) |
Total From Investment Operations | | | 4.68 | | | 4.44 | | | 2.49 | | | (4.47 | ) | | (1.89 | ) |
| | | | | | | | | | | | | | | | |
Dividends and Distributions | | | | | | | | | | | | | | | | |
Dividends from Net Investment Income | | | (.33 | ) | | (.27 | ) | | (.20 | ) | | (.10 | ) | | (.12 | ) |
Distributions in Excess of Net Investment Income | | | – | | | – | | | – | | | – | | | (.02 | ) |
Distributions from Realized Gains | | | – | | | – | | | – | | | – | | | (2.64 | ) |
Total Dividends and Distributions | | | (.33 | ) | | (.27 | ) | | (.20 | ) | | (.10 | ) | | (2.78 | ) |
| | | | | | | | | | | | | | | | |
Net Asset Value, End of Period | | $ | 32.53 | | $ | 28.18 | | $ | 24.01 | | $ | 21.72 | | $ | 26.29 | |
| | | | | | | | | | | | | | | | |
Total Return1 | | | 16.68 | % | | 18.53 | % | | 11.53 | % | | (17.04 | )% | | (6.41 | )% |
Ratios/Supplemental Data | | | | | | | | | | | | | | | | |
| | | | | | | | | | | | | | | | |
Net Assets, End of Period (000,000 omitted) | | $ | 2,444 | | $ | 1,354 | | $ | 1,057 | | $ | 946 | | $ | 1,465 | |
Ratio of Expenses to Average Net Assets | | | .58 | % | | .58 | % | | .61 | % | | .62 | % | | .62 | % |
Ratio of Net Investment Income to Average Net Assets | | | 1.29 | % | | 1.11 | % | | 1.19 | % | | .79 | % | | .77 | % |
Portfolio Turnover Rate2 | | | 3 | % | | 6 | % | | 10 | % | | 22 | % | | 15 | % |
1 | Assumes hypothetical initial investment on the business day before the first day of the fiscal period, with all dividends and distributions reinvested in additional shares on the reinvestment date, and redemption at the net asset value calculated on the last business day of the fiscal period. Sales charges are not reflected in the total returns. |
2 | The lesser of purchases or sales of portfolio securities for a period, divided by the monthly average of the market value of portfolio securities owned during the period. Securities with a maturity or expiration date at the time of acquisition of one year or less are excluded from the calculation. |
3 | Per share calculations were based on average shares outstanding for the period. |
See Notes to Financial Statements
35
Davis New York Venture Fund
REPORT OF INDEPENDENT REGISTERED PUBLIC ACCOUNTING FIRM |
To the Shareholders and Board of Directors
of Davis New York Venture Fund, Inc.:
We have audited the accompanying statement of assets and liabilities of Davis New York Venture Fund (a series of Davis New York Venture Fund, Inc.), including the schedule of investments, as of July 31, 2005, and the related statement of operations for the year then ended, the statements of changes in net assets for each of the years in the two-year period then ended, and the financial highlights for each of the years in the five-year period then ended. These financial statements and financial highlights are the responsibility of the Fund’s management. Our responsibility is to express an opinion on these financial statements and financial highlights based on our audits.
We conducted our audits in accordance with the standards of the Public Company Accounting Oversight Board (United States). Those standards require that we plan and perform the audit to obtain reasonable assurance about whether the financial statements and financial highlights are free of material misstatement. An audit includes examining, on a test basis, evidence supporting the amounts and disclosures in the financial statements. Our procedures included confirmation of securities owned as of July 31, 2005, by correspondence with the custodian and brokers or by other appropriate auditing procedures where replies from brokers were not received. An audit also includes assessing the accounting principles used and significant estimates made by management, as well as evaluating the overall financial statement presentation. We believe that our audits provide a reasonable basis for our opinion.
In our opinion, the financial statements and financial highlights referred to above present fairly, in all material respects, the financial position of Davis New York Venture Fund as of July 31, 2005, the results of its operations for the year then ended, the changes in its net assets for each of the years in the two-year period then ended, and the financial highlights for each of the years in the five-year period then ended, in conformity with U.S. generally accepted accounting principles.
KPMG LLP | | | |
Denver, Colorado
| | |
|
September 9, 2005 | | | |
36
DAVIS NEW YORK VENTURE FUND
FUND INFORMATION |
Federal Income Tax Information (Unaudited)
In early 2006, shareholders will receive information regarding all dividends and distributions paid to them by the Fund during calendar year 2005. Regulations of the U.S. Treasury Department require the Fund to report this information to the Internal Revenue Service.
During the fiscal year ended July 31, 2005, $130,953,748 of dividends paid by the Fund constituted income dividends for Federal Income Tax purposes.
Dividends paid by the Fund during the fiscal year ended July 31, 2005 which are not designated as capital gain distribution should be multiplied by 100% to arrive at the net amount eligible for the corporate dividends-received deduction.
For the fiscal year ended July 31, 2005, certain dividends paid by the Fund constitute qualified dividend income for Federal Income Tax purposes. The Fund designates $130,953,748 as qualified dividend income.
The foregoing information is presented to assist shareholders in reporting distributions received from the Fund to the Internal Revenue Service. Because of the complexity of the federal regulations which may affect your individual tax return and the many variations in state and local tax regulations, we recommend that you consult your tax adviser for specific guidance.
Portfolio Proxy Voting Policies and Procedures
The Fund has adopted Portfolio Proxy Voting Policies and Procedures under which the Fund votes proxies relating to securities held by the Fund. A description of the Fund’s Portfolio Proxy Voting Policies and Procedures is available (i) without charge, upon request, by calling the Fund toll-free at 1-800-279-0279, (ii) on the Fund’s website at www.davisfunds.com, and (iii) on the SEC’s website at www.sec.gov.
In addition, the Fund is required to file Form N-PX, with its complete proxy voting record for the 12 months ended June 30th, no later than August 31st of each year. The Fund’s Form N-PX filing is available (i) without charge, upon request, by calling the Fund toll-free at 1-800-279-0279, (ii) on the Fund’s website at www.davisfunds.com, and (iii) on the SEC’s website at www.sec.gov.
Form N–Q
The Fund files its complete schedule of portfolio holdings with the SEC for the first and third quarters of each fiscal year on Form N-Q. The Fund’s Form N-Q is available without charge upon request by calling 1-800-279-0279 or on the fund’s website at www.davisfunds.com or on the SEC’s website at www.sec.gov. The Fund’s Form N-Q may be reviewed and copied at the SEC’s Public Reference Room in Washington, DC, and that information on the operation of the Public Reference Room may be obtained by calling 1-800-SEC-0330.
37
DAVIS NEW YORK VENTURE FUND
DIRECTOR APPROVAL OF ADVISORY AGREEMENTS |
Process of Annual Review
The Board of Directors of the Davis Funds oversees the management of each Davis Fund and, as required by law, determines annually whether to approve the continuance of each Davis Fund’s advisory agreement with Davis Selected Advisers, L.P. and sub-advisory agreement with Davis Selected Advisers-NY, Inc. (jointly “Davis Advisors” and “Advisory Agreements”).
As a part of this process the Independent Directors, with the assistance of counsel for the Independent Directors, prepares questions which it submits to Davis Advisors in anticipation of the annual contract review. In a separate meeting held prior to the March 2005 board meeting, the Independent Directors reviewed and evaluated all information which they deemed reasonably necessary in the circumstances. Upon completion of this review, the Independent Directors recommended that the full Board of Directors approve the continuance of the Advisory Agreements, which occurred at the March 2005 board meeting.
Reasons the Independent Directors Approved Continuation of the Advisory Agreements.
The Independent Directors determinations were based upon a comprehensive consideration of all information provided to the Independent Directors and were not the result of any single factor. The following facts and conclusions were important, but not exclusive, in the Independent Directors’ recommendation to renew the Advisory Agreements.
The Independent Directors noted the importance of reviewing quantitative measures, but also recognize that qualitative factors, some of which are mentioned below, could be equally or more important in assessing whether Davis Fund shareholders have been, or are likely to be, well served by the renewal of the management contract. They noted both the value and shortcomings of purely quantitative measures, including the data provided by independent service providers, and concluded that while such measures and data can inform, they should not supersede the judgment of the Independent Directors who take many factors, including those listed below, into consideration in representing the shareholders of Davis Funds. In connection with reviewing comparative performance information, the Independent Directors generally give weight to longer-term measurements.
The Independent Directors believe that shareholders of Davis Funds should, and will, expect Davis Advisors to employ a disciplined, company specific, research driven, businesslike, long-term investment philosophy. The Independent Directors concluded that the willingness of Davis Advisors and related persons to invest a substantial amount of their own money alongside and on the same terms as other shareholders in the Davis Funds demonstrates a good alignment of interest between Davis Advisors and Davis Fund shareholders.
The Independent Directors recognized Davis Advisors’ (a) efforts to minimize transaction costs by generally having a long-term time horizon and low portfolio turnover; (b) focus on tax efficiency; (c) record of generally producing satisfactory after tax results over the longer-term; (d) efforts towards fostering healthy investor behavior by, among other things, providing informative and substantial educational material; and (e) efforts to promote shareholder interests by actively speaking out on corporate governance issues.
38
DAVIS NEW YORK VENTURE FUND
DIRECTOR APPROVAL OF ADVISORY AGREEMENTS – (Continued) |
Reasons the Independent Directors Approved Continuation of the Advisory Agreements – (Continued)
The Independent Directors also noted that Davis Advisors provides a number of services to the Davis Funds in addition to investment management. Non-investment management services provided by Davis Advisors to the Davis Funds include (a) extensive customer services to Fund shareholders; (b) responsibility for complying with legal duties and regulatory obligations; and (c) responsibility for general administrative and business services. Davis Advisors is reimbursed a portion of its costs in providing some, but not all, of these services.
The Independent Directors reviewed (a) comparative fee and expense information for competitive funds, as selected and analyzed by a nationally recognized independent service provider, (b) information regarding fees charged by Davis Advisors to other advisory clients, including funds which it sub-advises and private accounts, as well as the differences in the services provided to such other clients; and (c) the fee schedules and, if applicable, breakpoints of the various Davis Funds, including an assessment of competitive fee schedules.
The Independent Directors reviewed the profitability of each Davis Fund to Davis Advisors. The Independent Directors considered various potential benefits that Davis Advisors may receive in connection with the services it provides under the Advisory Agreements with each Davis Fund, including a review of portfolio brokerage practices. The Independent Directors noted that Davis Advisors does not use client commissions to pay for publications that are available to the general public or third-party research services.
Davis New York Venture Fund
The Independent Directors noted that Davis New York Venture Fund out-performed its benchmark, the Standard & Poor’s 500® Index, and exceeded the average performance of its peer group, as determined by an independent service provider, over longer-term investment horizons.
The Independent Directors considered the expense ratio for Davis New York Venture Fund and concluded that it is reasonable and competitive with the range of average expense ratios of its peer group as determined by an independent service provider.
The Independent Directors considered the advisory fee schedule for Davis New York Venture Fund and adding of an additional breakpoint in the management fee, resulting in a marginal management fee of 0.455% on average net assets over $25 billion. The Independent Directors concluded that the advisory fee schedule represents an appropriate sharing between Fund shareholders and Davis Advisors of such economies of scale as may exist in the management of the Fund at current asset levels.
Approval of Advisory Arrangements
The Independent Directors determined that the advisory fee for Davis New York Venture Fund was reasonable in light of the nature, quality and extent of the services being provided to the Fund, the costs incurred by Davis Advisors in providing such service, and in comparison to the range of the average advisory fees of its peer group as determined by an independent service provider. The Independent Directors therefore recommended continuation of the advisory agreements.
39
DAVIS NEW YORK VENTURE FUND 2949 East Elvira Road, Suite 101 Tucson, Arizona 85706 |
DIRECTORS
For the purposes of their service as directors to the Davis Funds, the business address for each of the directors is 2949 E. Elvira Road, Suite 101, Tucson, AZ 85706. Each Director serves until their retirement, resignation, death or removal. Subject to exceptions and exemptions which may be granted by the Independent Directors, Directors must retire at the close of business on the last day of the calendar year in which the Director attains age seventy-two (72), except that any person who was a Director on July 1, 1994, and at that date was seventy-three (73) years of age or less shall retire from the Board of Directors and cease being a Director at the close of business on the last day of the year in which the Director attains age seventy-four (74).
Name and
Age | | Position(s)
Held With
Fund | | Term of
Office and
Length of
Time
Served | | Principal
Occupation(s)
During Past Five
Years | | Number of
Portfolios in
Fund
Complex
Overseen by
Director | | Other
Directorships
Held by Director |
| | | | | | | | | | |
Independent Directors | | | | | | | | |
| | | | | | | | | | |
Wesley E.
Bass, Jr.
(born 8/21/31) | | Director | | director since
1990 | | President, Bass & Associates (financial consulting); formerly First Deputy City Treasurer, City of Chicago; and Executive Vice President, Chicago Title and Trust Company (bank and trust). | | 12 | | none |
| | | | | | | | | | |
Marc P. Blum
(born 9/9/42) | | Director | | director since
1986 | | Chief Executive Officer, World Total Return Fund, LLLP; Of Counsel to Gordon, Feinblatt, Rothman, Hoffberger and Hollander, LLC (law firm). | | 12 | | Director, Legg Mason Trust (asset management company) and Rodney Trust Company (Delaware). |
| | | | | | | | | | |
Thomas S.
Gayner
(born 12/16/61) | | Director | | director since
2004 | | Executive Vice President and Chief Investment Officer, Markel Corporation (insurance company). | | 12 | | none |
| | | | | | | | | | |
Jerry D. Geist
(born 5/23/34) | | Director | | director since
1986 | | Chairman, Santa Fe Center Enterprises (energy project development); Retired Chairman and President, Public Service Company of New Mexico. | | 12 | | Director, CH2M-Hill, Inc. (engineering); Chairman, Santa Fe Center Enterprises, Investment Committee for Microgeneration Technology Fund, UTECH Funds. |
40
DAVIS NEW YORK VENTURE FUND 2949 East Elvira Road, Suite 101 Tucson, Arizona 85706 |
DIRECTORS – (Continued)
Name and
Age | | Position(s)
Held With
Fund | | Term of
Office and
Length of
Time
Served | | Principal
Occupation(s)
During Past Five
Years | | Number of
Portfolios in
Fund
Complex
Overseen by
Director | | Other
Directorships
Held by Director |
| | | | | | | | | | |
Independent Directors - Continued | | | | | | |
| | | | | | | | | | |
D. James Guzy
(born 3/7/36) | | Director | | director since
1982 | | Chairman, PLX Technology, Inc. (semi-conductor manufacturer). | | 12 | | Director, Intel Corp. (semi-conductor manufacturer), Cirrus Logic Corp. (semi-conductor manufacturer), Alliance Technology Fund (a mutual fund), Micro Component Technology, Inc. (micro-circuit handling and testing equipment manufacturer), LogicVision, Inc. (semi-conductor software company), and Tessera Technologies, Inc. (semi-conductor packaging company). |
| | | | | | | | | | |
G. Bernard
Hamilton
(born 3/18/37) | | Director | | director since
1978 | | Managing General Partner, Avanti Partners, L.P. (investment partnership). | | 12 | | none |
| | | | | | | | | | |
Robert P.
Morgenthau
(born 3/22/57) | | Director | | director since
2002 | | Chairman, Northroad Capital Management, LLC (an investment management firm) since June 2002; President of Private Advisory Services of Bank of America (an investment management firm) from 2001 until 2002; prior to that a managing director and global head of marketing and distribution for Lazard Asset Management (an investment management firm) for ten years. | | 12 | | none |
41
DAVIS NEW YORK VENTURE FUND 2949 East Elvira Road, Suite 101 Tucson, Arizona 85706 |
DIRECTORS – (Continued)
Name and
Age | | Position(s)
Held With
Fund | | Term of
Office and
Length of
Time
Served | | Principal
Occupation(s)
During Past Five
Years | | Number of
Portfolios in
Fund
Complex
Overseen by
Director | | Other
Directorships
Held by Director |
| | | | | | | | | | |
Independent Directors - Continued | | | | | | |
| | | | | | | | | | |
Theodore B.
Smith, Jr.
(born 12/23/32) | | Director | | director since
1994 | | Chairman, Cantrock Realty and Mayor, Incorporated Village of Mill Neck, NY. | | 12 | | none |
| | | | | | | | | | |
Christian R.
Sonne
(born 5/6/36) | | Director | | director since
1990 | | General Partner, Tuxedo Park Associates (land holding and development firm); President and Chief Executive Officer, Mulford Securities Corporation (private investment fund) until 1990; formerly Vice President of Goldman Sachs & Co. (investment banking). | | 12 | | none |
| | | | | | | | | | |
Marsha
Williams
(born 3/28/51) | | Director | | director since
1999 | | Executive Vice President and Chief Financial Officer, Equity Office Properties Trust (a real estate investment trust); Former Chief Administrative Officer, Crate & Barrel (home furnishings retailer); Former Vice President and Treasurer, Amoco Corporation (oil & gas company). | | 15 | | Director, the Selected Funds (consisting of three portfolios) since 1996; Director, Modine Manufacturing, Inc. (heat transfer technology); Director, Chicago Bridge & Iron Company, N.V. (industrial construction and engineering). |
| | | | | | | | | | |
Inside Directors* | | | | | | | | |
| | | | | | | | | | |
Jeremy H. Biggs
(born 8/16/35) | | Director/
Chairman | | director since
1994 | | Vice Chairman, Member of the Investment Policy Committee and Member of the International Investment Committee, all for Fiduciary Trust Company International (money management firm) Consultant to Davis Selected Advisers, L.P. | | 12 | | none |
42
DAVIS NEW YORK VENTURE FUND 2949 East Elvira Road, Suite 101 Tucson, Arizona 85706 |
DIRECTORS – (Continued)
Name and
Age | | Position(s)
Held With
Fund | | Term of
Office and
Length of
Time
Served | | Principal
Occupation(s)
During Past Five
Years | | Number of
Portfolios in
Fund
Complex
Overseen by
Director | | Other
Directorships
Held by Director |
| | | | | | | | | | |
Inside Directors* - Continued | | | | |
| | | | | | | | | | |
Andrew A.
Davis
(born 6/25/63) | | Director | | director since
1997 | | President or Vice President of each Davis Fund and Selected Fund; President, Davis Selected Advisers, L.P., and also serves as an executive officer in certain companies affiliated with the Adviser. | | 15 | | Director, the Selected Funds (consisting of three portfolios) since 1998. |
| | | | | | | | | | |
Christopher C.
Davis
(born 7/13/65) | | Director | | director since
1997 | | Chief Executive Officer, President or Vice President of each Davis Fund and Selected Fund; Chairman and Chief Executive Officer, Davis Selected Advisers, L.P., and also serves as an executive officer in certain companies affiliated with the Adviser, including sole member of the Adviser’s general partner, Davis Investments, LLC; Employee of Shelby Cullom Davis & Co. (registered broker/dealer). | | 15 | | Director, the Selected Funds (consisting of three portfolios) since 1998. |
* | Jeremy H. Biggs, Andrew A. Davis and Christopher C. Davis own partnership units (directly, indirectly or both) of the Adviser and are considered to be “interested persons” of the Funds as defined in the Investment Company Act of 1940. Andrew A. Davis and Christopher C. Davis are brothers. |
43
DAVIS NEW YORK VENTURE FUND
2949 East Elvira Road, Tucson, Arizona 85706 |
Directors | Officers |
Wesley E. Bass, Jr. | Jeremy H. Biggs |
Jeremy H. Biggs | Chairman |
Marc P. Blum | Christopher C. Davis |
Andrew A. Davis | President |
Christopher C. Davis | Andrew A. Davis |
Thomas S. Gayner | Vice President |
Jerry D. Geist | Kenneth C. Eich |
D. James Guzy | Executive Vice President & |
G. Bernard Hamilton | Principal Executive Officer |
Robert P. Morgenthau | Sharra L. Reed |
Theodore B. Smith, Jr. | Vice President & Chief Compliance Officer |
Christian R. Sonne | Douglas A. Haines |
Marsha Williams | Vice President
& Principal Accounting Officer |
| Thomas D. Tays |
| Vice President & Secretary |
Investment Adviser
Davis Selected Advisers, L.P. (doing business as “Davis Advisors”)
2949 East Elvira Road, Suite 101
Tucson, Arizona 85706
(800) 279-0279
Distributor
Davis Distributors, LLC
2949 East Elvira Road, Suite 101
Tucson, Arizona 85706
Transfer Agent & Custodian
State Street Bank and Trust Company
c/o The Davis Funds
P. O. Box 8406
Boston, Massachusetts 02266-8406
Counsel
Seyfarth Shaw LLP
55 East Monroe Street, Suite 4200
Chicago, Illinois 60603-5803
Auditors
KPMG LLP
707 Seventeenth Street
Suite 2700
Denver, Colorado 80202
For more information about Davis New York Venture Fund, Inc. including management fee, charges, and expenses, see the current prospectus, which must precede or accompany this report. The Fund’s Statement of Additional Information contains additional information about the Fund’s Directors and is available without charge upon request by calling 1-800-279-0279 or on the Fund’s website at www.davisfunds.com. Quarterly Fact sheets are available on the Fund’s website at www.davisfunds.com. |
44
Annual Report
Davis Research Fund
July 31, 2005
Table of Contents
DAVIS RESEARCH FUND
2949 East Elvira Road, Suite 101
Tucson, Arizona 85706
| |
Management’s Discussion and Analysis
Market Environment
During the year ended July 31, 2005, the stock market, as measured by the Standard & Poor’s 500® Index1, increased by 14.05%. U.S. economic activity, as measured by the inflation-adjusted gross domestic product (“GDP”), increased between 3.4% and 4.0% over the last four calendar quarters ended June 30, 2005. Interest rates, as measured by the 10-year Treasury bond, began July 2004 at about 4.50%, ranged as low as 4.00% and ended July 2005 at about 4.30%.
Performance Overview
Davis Research Fund’s Class A shares delivered a total return on net asset value of 29.23% for the year ended July 31, 20052. Over the same time period, the Standard & Poor’s 500®Index1returned 14.05%. The Fund’s investment strategy is to use the Davis Investment Discipline to invest the majority of its assets in equity securities issued by large and medium-capitalization companies.
The Fund’s largest sector weighting was in retailing companies, and this group contributed3 the most to the Fund’s performance over the year ended July 31, 2005. The Fund made a substantially larger investment in retailing companies than the Index, and the Fund’s retailing companies out-performed the retailing companies included in the Index. This combination contributed to the Fund out-performing the Index. Due to the Fund’s significant investment in the company and its strong performance, AutoZone4was the single most important contributor to the Fund’s performance. Sears, Amazon.com, and AutoNation were also among the top contributors to performance. None of the Fund’s retailing companies detracted from performance over the year.
The Fund also held significant investments in media companies, and this group also made important contributions to the Fund’s performance. Lagardere was among the top contributors to performance, and none of the Fund’s media companies detracted from performance over the year.
Energy companies made significant contributions to the Fund’s performance. EOG Resources, Transocean, and Occidental Petroleum were among the top contributors to performance. None of the Fund’s energy companies detracted from performance over the year. The Fund no longer owns Transocean and Occidental Petroleum.
Other companies which made important contributions to performance included Altria Group, a food, beverage, and tobacco company; and Groupe Bruxelles Lambert, a diversified financial company.
Companies detracting from Fund performance over the year included Takefuji, a consumer finance company; Pfizer, a pharmaceutical and biotechnology company; Avon, a household and personal products company; Wal-Mart, a food and staples retailing company; and Microsoft, a software and services company. The Fund no longer owns Pfizer.
The Fund’s portfolio managers have identified a number of investment opportunities in foreign companies. The Fund had approximately 23% of its portfolio invested in foreign companies at July 31, 2005. As a group the companies which the Fund owned out-performed the S&P 500® Index.
2
DAVIS RESEARCH FUND
2949 East Elvira Road, Suite 101
Tucson, Arizona 85706
| |
Management’s Discussion and Analysis – (Continued)
This Annual Report is authorized for use by existing shareholders. Prospective shareholders must receive a current Davis Research Fund prospectus, which contains more information about investment strategies, risks, charges, and expenses. Please read the prospectus carefully before investing or sending money.
Davis Research Fund’s investment objective is long-term growth of capital. There can be no assurance that the Fund will achieve its objective. The primary risks of an investment in Davis Research Fund are: (1) market risk, (2) company risk, (3) foreign country risk, (4) medium-capitalization risk, (5) focused portfolio risk, (6) headline risk, and (7) selection risk. See the prospectus for a full description of each risk.
Class A, B, and C shares of Davis Research Fund have been registered with the Securities and Exchange Commission and the states of Arizona, Maine, Maryland, New Hampshire, New Mexico, New York, and Virginia. Shares of Davis Research Fund are not available for sale in any other state or jurisdiction. Currently, only the directors, officers and employees of the Fund or its investment adviser (and the investment adviser itself and affiliated companies) are eligible to purchase Fund shares. The Adviser reserves the right to reject any offer to purchase shares.
1 The S&P 500® Index is an unmanaged index of 500 selected common stocks, most of which are listed on the New York Stock Exchange. The Index is adjusted for dividends, weighted towards stocks with large market capitalizations, and represents approximately two-thirds of the total market value of all domestic common stocks. Investments cannot be made directly in the Index.
2 Total return assumes reinvestment of dividends and capital gain distributions. Past performance is not a guarantee of future results. Investment return and principal value will vary so that, when redeemed, an investor’s shares may be worth more or less than when purchased. Below are the average annual total returns for Davis Research Fund’s Class A shares for the periods ended July 31, 2005. Returns for other classes of shares will vary from the following returns:
(Without a 4.75% sales charge taken into consideration)
Fund Name | One Year | Three Years | Inception |
Davis Research Fund A | 29.23% | 20.90% | 10.54% - 10/31/01 |
(With the maximum 4.75% sales charge taken into consideration)
Fund Name | One Year | Three Years | Inception |
Davis Research Fund A | 23.13% | 18.96% | 9.11% - 10/31/01 |
Fund performance changes over time and current performance may be higher or lower than stated. For more current information please call Davis Funds Shareholder Services at 1-800-279-0279.
3
DAVIS RESEARCH FUND
2949 East Elvira Road, Suite 101
Tucson, Arizona 85706
| |
Management’s Discussion and Analysis – (Continued)
3 A company’s contribution to the Fund’s performance is a product of both its appreciation or depreciation and its weighting within the portfolio. For example, a 5% holding that rises 20% has twice as much impact as a 1% holding that rises 50%.
4 This Management Discussion and Analysis discusses a number of individual companies. The information provided in this report does not provide information reasonably sufficient upon which to base an investment decision and should not be considered a recommendation to purchase or sell any particular security. The schedule of investments lists the Fund’s holdings of each company discussed.
Shares of the Davis Research Fund are not deposits or obligations of any bank, are not guaranteed by any bank, are not insured by the FDIC or any other agency, and involve investment risks, including possible loss of the principal amount invested.
4
DAVIS RESEARCH FUND
CLASS A FUND PERFORMANCE |
Average Annual Total Return
for the Periods ended July 31, 2005 | | | | | Expense Example | | Beginning | | Ending | | Expenses Paid | |
(This calculation includes an initial sales charge of 4.75%.) | | | | | | | | Account Valxe
(02/01/05) | | | Account Value
(07/31/05) | | | During Period*
(02/01/05-07/31/05) | |
One Year | | 23.13% | | | Actual | | | $1,000.00 | | | | $1,105.56 | | | | $4.80 | | |
Life of the Class (October 31, 2001 through July 31, 2005) | | 9.11% | | | Hypothetical (5% return before expenses) | | | $1,000.00 | | | | $1,020.23 | | | | $4.61 | | |
*Expenses are equal to the Class’s annualized expense ratio (0.92%), multiplied by the average account value over the period, multiplied by 181/365 (to reflect the one-half year period). See Notes to Performance on page 8 for a description of the “Expense Example”.
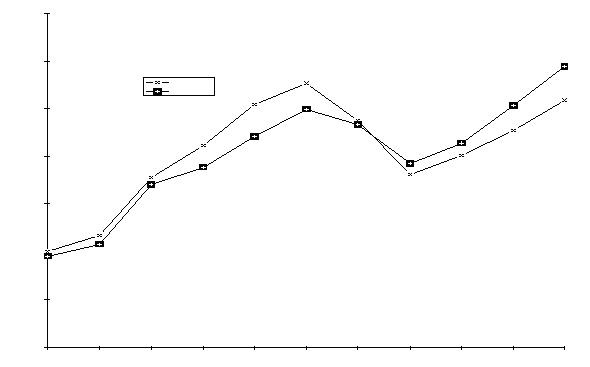
$10,000 invested at inception. Let’s say you invested $10,000 in Davis Research Fund, Class A Shares on October 31, 2001 (commencement of operations) and paid a 4.75% sales charge. As the chart shows, by July 31, 2005 the value of your investment would have been $13,866 - a 38.66% increase on your initial investment. For comparison, look at how the Standard & Poor’s 500 Stock Index did over the same time period. With dividends reinvested, the same $10,000 investment would have grown to $12,419 - a 24.19% increase.
$0
$2,000
$4,000
$6,000
$8,000
$10,000
$12,000
$14,000
$16,000
$18,000
$20,000
10/31/01
7/31/02
7/31/03
7/31/04
7/31/05
S & P 500
DRF Class A
The Standard & Poor’s 500 Stock Index is an unmanaged index of 500 selected common stocks, most of which are listed on the New York Stock Exchange. The index is adjusted for dividends, weighted towards stocks with large market capitalizations, and represents approximately two-thirds of the total market value of all domestic common stocks.
The performance data for Davis Research Fund contained in this report represents past performance and assumes that all distributions were reinvested, and should not be considered as an indication of future performance from an investment in the Fund today. The investment return and principal value will fluctuate so that shares may be worth more or less than their original cost when redeemed. Returns shown do not reflect the deduction of taxes that a shareholder would pay on fund distributions or the redemption of fund shares.
5
DAVIS RESEARCH FUND
CLASS B FUND PERFORMANCE |
Average Annual Total Return
for the Periods ended July 31, 2005 | | | | | Expense Example | | Beginning | | Ending | | Expenses Paid | |
(This calculation includes any applicable contingent deferred sales charge.) | | | | | | | | Account Value
(02/01/05) | | | Account Value
(07/31/05) | | | During Period*
(02/01/05-07/31/05) | |
One Year | | 23.07% | | | Actual | | | $1,000.00 | | | | $1,096.11 | | | | $10.34 | | |
Life of the Class (October 31, 2001 through July 31, 2005) | | 8.55% | | | Hypothetical (5% return before expenses) | | | $1,000.00 | | | | $1,014.93 | | | | $ 9.94 | | |
*Expenses are equal to the Class’s annualized expense ratio (1.99%), multiplied by the average account value over the period, multiplied by 181/365 (to reflect the one-half year period). See Notes to Performance on page 8 for a description of the “Expense Example”.
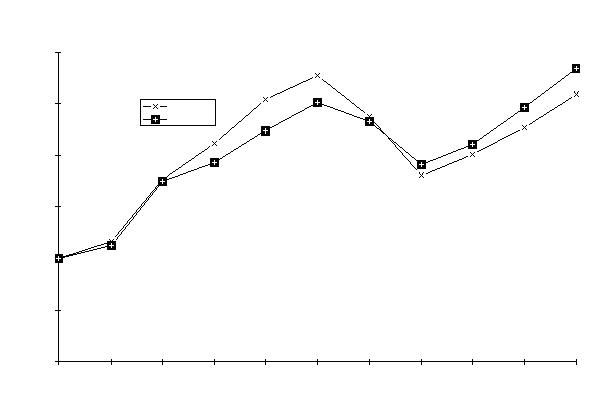
$10,000 invested at inception. Let’s say you invested $10,000 in Davis Research Fund, Class B Shares on October 31, 2001 (commencement of operations). As the chart shows, by July 31, 2005 the value of your investment (less a contingent deferred sales charge) would have been $13,600 - a 36.00% increase on your initial investment. For comparison, look at how the Standard & Poor’s 500 Stock Index did over the same time period. With dividends reinvested, the same $10,000 investment would have grown to $12,419 - a 24.19% increase.
$0
$2,000
$4,000
$6,000
$8,000
$10,000
$12,000
$14,000
$16,000
$18,000
$20,000
10/31/01
7/31/02
7/31/03
7/31/04
7/31/05
S & P 500
DRF Class B
The Standard & Poor’s 500 Stock Index is an unmanaged index of 500 selected common stocks, most of which are listed on the New York Stock Exchange. The index is adjusted for dividends, weighted towards stocks with large market capitalizations, and represents approximately two-thirds of the total market value of all domestic common stocks.
The performance data for Davis Research Fund contained in this report represents past performance and assumes that all distributions were reinvested, and should not be considered as an indication of future performance from an investment in the Fund today. The investment return and principal value will fluctuate so that shares may be worth more or less than their original cost when redeemed. Returns shown do not reflect the deduction of taxes that a shareholder would pay on fund distributions or the redemption of fund shares.
6
DAVIS RESEARCH FUND
CLASS C FUND PERFORMANCE |
Average Annual Total Return
for the Periods ended July 31, 2005 | | | | | Expense Example | | Beginning | | Ending | | Expenses Paid | |
(This calculation includes any applicable contingent deferred sales charge.) | | | | | | | | Account Value
(02/01/05) | | | Account Value
(07/31/05) | | | During Period*
(02/01/05-07/31/05) | |
One Year | | 26.07% | | | Actual | | | $1,000.00 | | | | $1,096.11 | | | | $10.34 | | |
Life of the Class (October 31, 2001 through July 31, 2005) | | 8.97% | | | Hypothetical (5% return before expenses) | | | $1,000.00 | | | | $1,014.93 | | | | $ 9.94 | | |
*Expenses are equal to the Class’s annualized expense ratio (1.99%), multiplied by the average account value over the period, multiplied by 181/365 (to reflect the one-half year period). See Notes to Performance on page 8 for a description of the “Expense Example”.
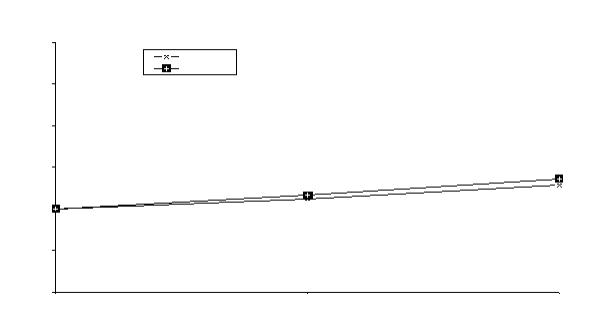
$10,000 invested at inception. Let’s say you invested $10,000 in Davis Research Fund, Class C Shares on October 31, 2001 (commencement of operations). As the chart shows, by July 31, 2005 the value of your investment would have been $13,800 – a 38.00% increase on your initial investment. For comparison, look at how the Standard & Poor’s 500 Stock Index did over the same time period. With dividends reinvested, the same $10,000 investment would have grown to $12,419 - a 24.19% increase.
$0
$2,000
$4,000
$6,000
$8,000
$10,000
$12,000
$14,000
$16,000
$18,000
$20,000
10/31/2001
7/31/2002
7/31/2003
7/31/2004
7/31/2005
S & P 500
DRF Class C
The Standard & Poor’s 500 Stock Index is an unmanaged index of 500 selected common stocks, most of which are listed on the New York Stock Exchange. The index is adjusted for dividends, weighted towards stocks with large market capitalizations, and represents approximately two-thirds of the total market value of all domestic common stocks.
The performance data for Davis Research Fund contained in this report represents past performance and assumes that all distributions were reinvested, and should not be considered as an indication of future performance from an investment in the Fund today. The investment return and principal value will fluctuate so that shares may be worth more or less than their original cost when redeemed. Returns shown do not reflect the deduction of taxes that a shareholder would pay on fund distributions or the redemption of fund shares.
7
DAVIS RESEARCH FUND
NOTES TO PERFORMANCE
| |
The following disclosure provides important information regarding the Fund’s Expense Example, which appears in each Class’s Fund Performance section of this Annual Report. Please refer to this information when reviewing the Expense Example for each Class.
Example
As a shareholder of the Fund, you incur two types of costs: (1) transaction costs, including sales charges (loads) on purchases; and (2) ongoing costs, including advisory and administrative fees, distribution and/or service (12b-1) fees, and other Fund expenses. The Expense Example is intended to help you understand your ongoing costs (in dollars) of investing in the Fund and to compare these costs with the ongoing costs of investing in other mutual funds. The Expense Example is based on an investment of $1,000 invested at the beginning of the period and held for the entire period indicated, which for each class is from 02/01/05 to 07/31/05. Please note that the Expense Example is general and does not reflect certain transaction or account specific costs, which may increase your total costs of investing in the Fund. If these transaction or account specific costs were included in the Expense Example, the expenses would have been higher.
Actual Expenses
The information represented in the row entitled “Actual” provides information about actual account values and actual expenses. You may use the information in this row, together with the amount you invested, to estimate the expenses that you paid over the period. Simply divide your account value by $1,000 (for example, an $8,600 account value divided by $1,000 = 8.6), then multiply the result by the number under the heading “Expenses Paid During Period” to estimate the expenses you paid for on your account during this period.
Hypothetical Example for Comparison Purposes
The information represented in the row entitled “Hypothetical” provides information about hypothetical account values and hypothetical expenses based on the Fund’s actual expense ratio and an assumed rate of return of 5% per year before expenses, which is not the Fund’s actual return. The hypothetical account values and expenses may not be used to estimate the actual ending account balance or expenses you paid for the period. You may use this information to compare the ongoing costs of investing in the Fund and other funds. To do so, compare this 5% hypothetical example with the 5% hypothetical examples that appear in the shareholder reports of the other funds.
Please note that the expenses shown in the table are meant to highlight your ongoing costs only and do not reflect any transactional costs, such as sales charges (loads). Therefore the information in the row entitled “Hypothetical” is useful in comparing ongoing costs only, and will not help you determine the relative total costs of owning different funds. In addition, if these transactional costs were included, your costs would have been higher.
8
DAVIS RESEARCH FUND
FUND OVERVIEW
At July 31, 2005
| |
Portfolio Makeup (% of Fund Net Assets)
Short Term Investments,
Other Assets & Liabilities
1.6%
Common Stock
98.4%
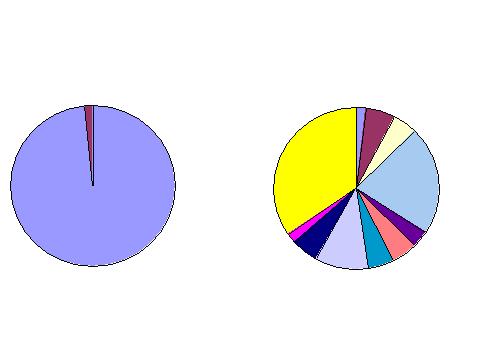
Sector Weightings
(% of Stock Holdings)
Diversified Financials
5.0%
Technology
10.6%
Health Care
5.3%
Household & Personal
Products
2.0%
Retailing
34.6%
Insurance
2.0%
Energy
5.9%
Food, Beverage, &
Tobacco
4.6%
Media
21.8%
Automobiles &
Components
3.1%
Food & Staples Retail
5.1%
Top 10 Holdings
Security | Sector | % of Fund
Net Assets |
Lagardere S.C.A. | Media | 10.26% | |
AutoZone, Inc. | Automotive Retail | 9.32% | |
Amazon.com, Inc. | Internet Retail | 6.22% | |
Comcast Corp., Special Class A | Media | 5.39% | |
AutoNation, Inc. | Automotive Retail | 5.20% | |
Home Depot, Inc. | Home Improvement Retail | 5.16% | |
Altria Group, Inc. | Food, Beverage, & Tobacco | 4.54% | |
Groupe Bruxelles Lambert S.A. | Diversified Financial Services | 4.18% | |
WPP Group PLC | Media | 3.39% | |
Harley-Davidson, Inc. | Automobiles & Components | 3.09% | |
9
DAVIS RESEARCH FUND
PORTFOLIO ACTIVITY AUGUST 1, 2004 THROUGH JULY 31, 2005
| |
New Positions Added (8/1/04-7/31/05)
(Highlighted positions are those greater than 2.75% of 7/31/05 total net assets)
Security | | Sector | | Date of 1st
Purchase | | % of 7/31/05
Fund
Net Assets | |
Amazon.com, Inc. | | Internet Retail | | 03/28/05 | | 6.22 | % | |
Avon Products, Inc. | | Household & Personal Products | | 06/24/05 | | 1.96 | % | |
Devon Energy Corp. | | Energy | | 06/28/05 | | 3.07 | % | |
EchoStar Communications Corp.,
Class A | | Media | | 05/09/05 | | 2.43 | % | |
Harley-Davidson, Inc. | | Automobiles & Components | | 04/18/05 | | 3.09 | % | |
Hewlett-Packard Co. | | Technology Hardware & Equipment | | 02/09/05 | | 2.73 | % | |
International Business Machines Corp. | | Technology Hardware & Equipment | | 04/15/05 | | 2.92 | % | |
Lowe’s Cos, Inc. | | Home Improvement Retail | | 10/06/04 | | 3.07 | % | |
Microsoft Corp. | | Software & Services | | 02/16/05 | | 2.96 | % | |
Nokia Oyj | | Technology Hardware & Equipment | | 03/29/05 | | 1.81 | % | |
Pfizer Inc. | | Pharmaceuticals & Biotechnology | | 11/24/04 | | – | | |
Sears Holdings Corp. | | Apparel Retail | | 11/18/04 | | 2.89 | % | |
Toll Brothers, Inc. | | Consumer Durables & Retail | | 01/10/05 | | – | | |
Wal-Mart Stores, Inc. | | Food & Staples Retailing | | 06/14/05 | | 2.60 | % | |
Positions Closed (8/1/04-7/31/05)
(Gains and losses greater than $500,000 are highlighted)
Security | | Sector | | Date of
Final Sale | | Gain/(Loss) | |
AmerisourceBergen Corp. | | Health Care Equipment & Services | | 11/24/04 | | $ | 27,475 | |
Heineken Holding NV | | Food, Beverage, & Tobacco | | 11/30/04 | | | 20,858 | |
McDonald’s Corp. | | Consumer Services | | 03/28/05 | | | 577,428 | |
Occidental Petroleum Corp. | | Energy | | 04/11/05 | | | 608,120 | |
Pfizer Inc. | | Pharmaceuticals & Biotechnology | | 12/22/04 | | | (53,894 | ) |
Toll Brothers, Inc. | | Consumer Durables & Retail | | 05/03/05 | | | 41,988 | |
Transocean Inc. | | Energy | | 05/13/05 | | | 635,603 | |
10
DAVIS RESEARCH FUND
SCHEDULE OF INVESTMENTS
July 31, 2005
Shares | | Security | | Value
(Note 1) |
COMMON STOCK – (98.44%) | | | |
| | | | | |
APPAREL RETAIL – (5.09%) | | | |
7,200 | | Sears Holdings Corp.* | | $ | 1,109,952 |
35,800 | | TJX Cos., Inc. | | | 841,658 |
| | | | | 1,951,610 |
AUTOMOBILES & COMPONENTS – (3.09%) | | | |
22,300 | | Harley-Davidson, Inc. | | | 1,186,137 |
AUTOMOTIVE RETAIL – (14.52%) | | | |
92,300 | | AutoNation, Inc.* | | | 1,992,757 |
36,700 | | AutoZone, Inc.* | | | 3,576,048 |
| | | | | 5,568,805 |
CONSUMER FINANCE – (0.79%) | | | |
4,700 | | Takefuji Corp. | | | 304,345 |
DIVERSIFIED FINANCIAL SERVICES – (4.18%) | | | |
17,700 | | Groupe Bruxelles Lambert S.A. | | | 1,600,944 |
ENERGY – (5.76%) | | | |
21,000 | | Devon Energy Corp. | | | 1,177,890 |
16,900 | | EOG Resources, Inc. | | | 1,032,590 |
| | | | | 2,210,480 |
FOOD & STAPLES RETAILING – (5.02%) | | | |
20,200 | | Costco Wholesale Corp. | | | 928,392 |
20,200 | | Wal-Mart Stores, Inc. | | | 996,870 |
| | | | | 1,925,262 |
FOOD, BEVERAGE, & TOBACCO – (4.54%) | | | |
26,000 | | Altria Group, Inc. | | | 1,740,960 |
HEALTH CARE EQUIPMENT & SERVICES – (2.89%) | | | |
18,600 | | Cardinal Health, Inc. | | | 1,108,188 |
HOME IMPROVEMENT RETAIL – (8.24%) | | | |
45,500 | | Home Depot, Inc. | | | 1,979,705 |
17,800 | | Lowe’s Cos, Inc. | | | 1,178,716 |
| | | | | 3,158,421 |
HOUSEHOLD & PERSONAL PRODUCTS – (1.96%) | | | |
23,000 | | Avon Products, Inc. | | | 752,330 |
INTERNET RETAIL – (6.22%) | | | |
52,800 | | Amazon.com, Inc.* | | | 2,384,184 |
MEDIA – (21.47%) | | | |
68,900 | | Comcast Corp., Special Class A* | | | 2,067,345 |
32,400 | | EchoStar Communications Corp., Class A* | | | 930,366 |
54,500 | | Lagardere S.C.A. | | | 3,934,977 |
122,800 | | WPP Group PLC | | | 1,301,437 |
| | | | | 8,234,125 |
11
DAVIS RESEARCH FUND
SCHEDULE OF INVESTMENTS – (Continued)
July 31, 2005
Shares/Principal | | Security | | | Value
(Note 1) | |
COMMON STOCK – (Continued) | | | | |
| | | | |
PHARMACEUTICALS & BIOTECHNOLOGY – (2.29%) | | | | |
18,000 | | Novartis AG, Registered | | $ | 875,868 | |
PROPERTY & CASUALTY INSURANCE – (1.96%) | | | | |
9 | | Berkshire Hathaway Inc., Class A* | | | 751,500 | |
SOFTWARE & SERVICES – (2.96%) | | | | |
44,400 | | Microsoft Corp. | | | 1,136,418 | |
TECHNOLOGY HARDWARE & EQUIPMENT – (7.46%) | | | | |
42,600 | | Hewlett-Packard Co. | | | 1,048,812 | |
13,400 | | International Business Machines Corp. | | | 1,118,364 | |
43,500 | | Nokia Oyj | | | 694,607 | |
| | | | | 2,861,783 | |
| | | | | | |
| | Total Common Stock – (identified cost $28,215,075) | | | 37,751,360 | |
| | | | | | |
SHORT TERM INVESTMENTS – (1.67%) | | | | |
| | | | | | |
$ 249,000 | | Banc of America Securities LLC Joint Repurchase Agreement, 3.30%, 08/01/05, dated 07/29/05, repurchase value of $249,068 (collateralized by: U.S. Government agency obligations in a pooled cash account, total market value $253,980) | | | 249,000 | |
392,000 | | Nomura Securities International, Inc. Joint Repurchase Agreement, 3.32%, | | | | |
| | 08/01/05, dated 07/29/05, repurchase value of $392,108 (collateralized by: U.S. Government agency obligations in a pooled cash account, total market value $399,840) | | | 392,000 | |
| | | | | | |
| | Total Short Term Investments – (identified cost $641,000) | | | 641,000 | |
| | | | | | |
| | Total Investments – (100.11%) – (identified cost $28,856,075) – (a) | | | 38,392,360 | |
| | Liabilities Less Other Assets – (0.11%) | | | (40,419 | ) |
| | Net Assets – (100.00%) | | $ | 38,351,941 | |
| | | | | | |
*Non-Income Producing Security. | | | | |
| | | | | | |
(a) Aggregate cost for Federal Income Tax purposes is $29,578,382. At July 31, 2005, unrealized appreciation (depreciation) of securities for Federal Income Tax purposes is as follows: | |
| | | | | | |
| | Unrealized appreciation | | $ | 8,867,453 | |
| | Unrealized depreciation | | | (53,475 | ) |
| | Net unrealized appreciation | | $ | 8,813,978 | |
| | | | | | | |
See Notes to Financial Statements
12
DAVIS RESEARCH FUND
STATEMENT OF ASSETS AND LIABILITIES
At July 31, 2005 | |
ASSETS: | | | | |
Investments in securities, at value (identified cost $28,856,075) (see accompanying Schedule of Investments) | | $ | 38,392,360 | |
Cash | | | 2,529 | |
Receivables: | | | | |
Dividends and interest receivable | | | 6,544 | |
Total assets | | | 38,401,433 | |
| | | | |
LIABILITIES: | | | | |
Accrued expenses | | | 24,869 | |
Accrued management fee | | | 24,623 | |
Total liabilities | | | 49,492 | |
| | | | |
NET ASSETS | | $ | 38,351,941 | |
| | | | |
Net assets consist of: | | | | |
Par value of shares of capital stock | | $ | 134,873 | |
Additional paid-in capital | | | 26,949,619 | |
Accumulated net investment loss | | | (54,329 | ) |
Net unrealized appreciation on investments and translation of assets and liabilities denominated in foreign currency | | | 9,535,781 | |
Accumulated net realized gains from investments and foreign currency transactions | | | 1,785,997 | |
Net assets | | $ | 38,351,941 | |
| | | | |
CLASS A SHARES | | | | |
Net assets | | $ | 38,349,181 | |
Shares outstanding | | | 2,697,261 | |
Net asset value and redemption price per share | | | | $ | 14.22 | |
Maximum offering price per share (100/95.25 of $14.22)* | | | | $ | 14.93 | |
CLASS B SHARES | | | | |
Net assets | | $ | 1,380 | |
Shares outstanding | | | 100 | |
Net asset value, offering and redemption price per share | | | | $ | 13.80 | |
CLASS C SHARES | | | | |
Net assets | | $ | 1,380 | |
Shares outstanding | | | 100 | |
Net asset value, offering and redemption price per share | | | | $ | 13.80 | |
* On purchases of $100,000 or more, the offering price is reduced.
See Notes to Financial Statements
13
DAVIS RESEARCH FUND
STATEMENT OF OPERATIONS
For the year ended July 31, 2005 | |
Investment Income : | | | | | | | |
Income: | | | | | | | |
Dividends (Net of foreign withholding taxes of $41,952) | | | | | $ | 426,108 | |
Interest | | | | | | 33,490 | |
Total income | | | | | | 459,598 | |
| | | | | | | |
Expenses: | | | | | | | |
Management fees (Note 3) | | $ | 254,221 | | | | |
Custodian fees | | | 31,939 | | | | |
Transfer agent fees | | | | | | | |
Class A | | | 535 | | | | |
Class B | | | 4 | | | | |
Class C | | | 4 | | | | |
Audit fees | | | 12,000 | | | | |
Legal fees | | | 359 | | | | |
Accounting fees (Note 3) | | | 6,000 | | | | |
Reports to shareholders | | | 697 | | | | |
Directors’ fees and expenses | | | 658 | | | | |
Registration and filing fees | | | 2,894 | | | | |
Miscellaneous | | | 7,070 | | | | |
Payments under distribution plan (Note 4) | | | | | | | |
Class B | | | 10 | | | | |
Class C | | | 10 | | | | |
Total expenses | | | | | | 316,401 | |
Expenses paid indirectly (Note 6) | | | | | | (178 | ) |
Net expenses | | | | | | 316,223 | |
Net investment income | | | | | | 143,375 | |
| | | | | | | |
Realized and Unrealized Gain on Investments and Foreign Currency: | | | | | | | |
Net realized gain (loss) from: | | | | | | | |
Investment transactions | | | | | | 3,433,061 | |
Foreign currency transactions | | | | | | (887 | ) |
Net increase in unrealized appreciation on investments and translation of assets and liabilities denominated in foreign currency | | | | | | 5,043,430 | |
Net realized and unrealized gain on investments and foreign currency | | | | | | 8,475,604 | |
Net increase in net assets resulting from operations | | | | | $ | 8,618,979 | |
See Notes to Financial Statements
14
DAVIS RESEARCH FUND
STATEMENTS OF CHANGES IN NET ASSETS | |
| | Year ended
July 31,
2005 | | Year ended
July 31,
2004 | |
OPERATIONS: | | | | | | | |
Net investment income | | $ | 143,375 | | $ | 175,136 | |
Net realized gain from investments and foreign currency transactions | | | 3,432,174 | | | 1,431,279 | |
Net increase in unrealized appreciation on investments and translation of assets and liabilities denominated in foreign currency | | | 5,043,430 | | | 1,657,866 | |
Net increase in net assets resulting from operations | | | 8,618,979 | | | 3,264,281 | |
| | | | | | | |
DIVIDENDS AND DISTRIBUTIONS TO SHAREHOLDERS FROM: | | | | | | | |
Net investment income: | | | | | | | |
Class A | | | (310,780 | ) | | (188,738 | ) |
| | | | | | | |
CAPITAL SHARE TRANSACTIONS: | | | | | | | |
| | | | | | | |
Net increase (decrease) in net assets resulting from capital share transactions (Note 5): | | | | | | | |
Class A | | | 513,826 | | | 283,429 | |
Class B | | | (52 | ) | | – | |
Class C | | | (52 | ) | | – | |
Total increase in net assets | | | 8,821,921 | | | 3,358,972 | |
NET ASSETS: | | | | | | | |
| | | | | | | |
Beginning of year | | | 29,530,020 | | | 26,171,048 | |
End of year | | $ | 38,351,941 | | $ | 29,530,020 | |
| | | | | | | |
*Including accumulated net investment income (loss) of | | $ | (54,329 | ) | $ | 113,963 | |
See Notes to Financial Statements
15
DAVIS RESEARCH FUND
NOTES TO FINANCIAL STATEMENTS
July 31, 2005 | |
NOTE 1 – SUMMARY OF SIGNIFICANT ACCOUNTING POLICIES
The Fund is a separate series of Davis New York Venture Fund, Inc., which is registered under the Investment Company Act of 1940, as amended, as a non-diversified, open-end management investment company. The Fund’s investment objective is long term growth of capital. The Fund commenced operations on October 31, 2001. The Fund offers shares in three classes, Class A, Class B, and Class C. The Class A shares are sold with a front-end sales charge and the Class B and Class C shares are sold at net asset value and may be subject to a contingent deferred sales charge upon redemption. Income, expenses (other than those attributable to a specific class), and gains and losses are allocated daily to each class of shares based upon the relative proportion of net assets represented by each class. Operating expenses directly attributable to a specific class, such as distribution and transfer agent fees, are charged against the operations of that class. All classes have identical rights with respect to voting (exclusive of each Class’s distribution arrangement), liquidation, and distributions. The following is a summary of significant accounting policies followed by the Fund in the preparation of its financial statements.
Security Valuation – Portfolio securities listed on national securities exchanges are valued at the last reported sales price on the day of valuation. Securities traded in the over the counter market and listed securities for which no sale was reported on that date are stated at the average of closing bid and asked prices. Securities for which market quotations are not readily available, or whose values have been affected by a significant event occurring after the close of their primary markets, are valued at fair value as determined in good faith by the Board of Directors. Short-term obligations are valued at amortized cost, which approximates fair value. These valuation procedures are reviewed and subject to approval by the Board of Directors.
Master Repurchase Agreements – The Fund, along with other affiliated funds, may transfer uninvested cash balances into one or more master repurchase agreement accounts. These balances are invested in one or more repurchase agreements, secured by U.S. government securities. Securities pledged as collateral for repurchase agreements are held by a custodian bank until the agreements mature. Each agreement requires that the market value of the collateral be sufficient to cover payments of interest and principal; however, in the event of default by the other party to the agreement, retention of the collateral may be subject to legal proceedings.
Currency Translation – The market values of all assets and liabilities denominated in foreign currencies are recorded in the financial statements after translation to the U.S. dollar based upon the mean between the bid and offered quotations of the currencies against U.S. dollars on the date of valuation. The cost basis of such assets and liabilities is determined based upon historical exchange rates. Income and expenses are translated at average exchange rates in effect as accrued or incurred.
Foreign Currency – The Fund may enter into forward purchases or sales of foreign currencies to hedge certain foreign currency denominated assets and liabilities against declines in market value relative to the U.S. dollar. Forward currency contracts are marked-to-market daily and the change in market value is recorded by the Fund as an unrealized gain or loss. When the forward currency contract is closed, the Fund records a realized gain or loss equal to the difference between the value of the forward currency contract at the time it was opened and value at the time it was closed. Investments in forward currency contracts may expose the Fund to risks resulting from unanticipated movements in foreign currency exchange rates or failure of the counter-party to the agreement to perform in accordance with the terms of the contract.
16
DAVIS RESEARCH FUND
NOTES TO FINANCIAL STATEMENTS – (Continued)
July 31, 2005 | |
NOTE 1 – SUMMARY OF SIGNIFICANT ACCOUNTING POLICIES – (Continued)
Reported net realized foreign exchange gains or losses arise from sales and maturities of investments, sales of foreign currencies, currency gains or losses realized between the trade and settlement dates on securities transactions, the difference between the amounts of dividends, interest and foreign withholding taxes recorded on the Fund’s books, and the U.S. dollar equivalent of the amounts actually received or paid. Net unrealized foreign exchange gains and losses arise from changes in the value of assets and liabilities other than investments in securities at fiscal year end, resulting from changes in the exchange rate. The Fund includes foreign currency gains and losses realized on the sale of investments together with market gains and losses on such investments in the statement of operations.
Federal Income Taxes – It is the Fund’s policy to comply with the requirements of the Internal Revenue Code applicable to regulated investment companies and to distribute substantially all of its taxable income, including any net realized gains on investments not offset by loss carryovers, to shareholders. Therefore, no provision for federal income or excise tax is required. During the year ended July 31, 2005, the Fund utilized $1,626,000 of capital loss carryforward from the prior year. At July 31, 2005, the Fund had no capital loss carryforwards available to offset future gains.
Securities Transactions and Related Investment Income – Securities transactions are accounted for on the trade date (date the order to buy or sell is executed) with realized gain or loss on the sale of securities being determined based upon identified cost. Dividend income is recorded on the ex-dividend date. Interest income, which includes accretion of discount and amortization of premium, is accrued as earned.
Dividends and Distributions to Shareholders – Dividends and distributions to shareholders are recorded on the ex-dividend date. Net investment income (loss), net realized gains (losses) and net unrealized appreciation (depreciation) of investments may differ for financial statement and tax purposes primarily because of the recognition of certain foreign currency gains (losses) as ordinary income (loss) for tax purposes and the tax deferral of losses on “wash sale” transactions. The character of the dividends and distributions made during the fiscal year from net investment income and net realized securities gains may differ from their ultimate characterization for Federal income tax purposes. Also, due to the timing of the dividends and distributions, the fiscal year in which amounts are distributed may differ from the fiscal year in which income or realized gain was recorded by the Fund. The Fund adjusts the classification of distributions to shareholders to reflect the differences between financial statement amounts and distributions determined in accordance with income tax regulations. Accordingly, during the year ended July 31, 2005 amounts have been reclassified to reflect an increase to accumulated net investment loss of $887 and a corresponding increase to accumulated net realized gains from investments and foreign currency transactions. Net assets have not been affected by this reclassification.
The tax character of distributions paid during the years ended July 31, 2005 and 2004 is as follows:
| | 2005 | | 2004 | |
Ordinary income | | $ | 310,780 | | $ | 188,738 | |
| | | | | | | |
17
DAVIS RESEARCH FUND
NOTES TO FINANCIAL STATEMENTS – (Continued)
July 31, 2005 | |
NOTE 1 – SUMMARY OF SIGNIFICANT ACCOUNTING POLICIES – (Continued)
As of July 31, 2005, the components of distributable earnings (accumulated losses) on a tax basis were as follows:
| | 2005 | |
Undistributed net investment income | | $ | 646,745 | |
Undistributed long term capital gain | | | 1,807,230 | |
Net unrealized appreciation on investments and foreign currency transactions | | | 8,813,474 | |
Total | | $ | 11,267,449 | |
Use of Estimates in Financial Statements – In preparing financial statements in conformity with accounting principles generally accepted in the United States of America, management makes estimates and assumptions that affect the reported amounts of assets and liabilities and disclosure of contingent assets and liabilities at the date of the financial statements, as well as the reported amounts of income and expenses during the reporting period. Actual results may differ from these estimates.
NOTE 2 – PURCHASES AND SALES OF SECURITIES
Purchases and sales of investment securities (excluding short-term securities) for the year ended July 31, 2005, were $19,405,177 and $17,368,827, respectively.
NOTE 3 – INVESTMENT ADVISORY FEES AND OTHER TRANSACTIONS WITH AFFILIATES
Advisory fees are paid to Davis Advisors (the “Adviser”), the Fund’s investment adviser, at the annual rate of 0.75% of the average net assets for the first $250 million, 0.65% of the average net assets on the next $250 million, and 0.55% of the average net assets in excess of $500 million. Management fees paid during the year ended July 31, 2005, approximated 0.75% of average net assets.
State Street Bank & Trust Co. (“State Street Bank”) is the Fund’s primary transfer agent. The Adviser is also paid for certain transfer agent services. The fee for these services for the year ended July 31, 2005 amounted to $80. State Street Bank is the Fund’s primary accounting provider. Fees for such services are included in the custodian fee as State Street Bank also serves as the Fund’s custodian. The Adviser is also paid for certain accounting services. The fee amounted to $6,000 for the year ended July 31, 2005. Certain directors and the officers of the Fund are also directors and officers of the general partner of the Adviser.
Davis Selected Advisers-NY, Inc. (“DSA-NY”), a wholly-owned subsidiary of the Adviser, acts as sub-adviser to the Fund. DSA-NY performs research and portfolio management services for the Fund under a Sub-Advisory Agreement with the Adviser. The Fund pays no fees directly to DSA-NY.
18
DAVIS RESEARCH FUND
NOTES TO FINANCIAL STATEMENTS – (Continued)
July 31, 2005 | |
NOTE 4 – DISTRIBUTION AND UNDERWRITING FEES
CLASS A SHARES
Class A shares of the Fund are sold at net asset value plus a sales charge and are redeemed at net asset value.
During the year ended July 31, 2005, Davis Distributors, LLC, the Fund’s Underwriter (the “Underwriter” or “Distributor”) received no commissions earned on sales of Class A shares of the Fund.
The Underwriter is reimbursed for amounts paid to dealers as a service fee or commissions with respect to Class A shares sold by dealers which remain outstanding during the period. The service fee is paid at an annual rate up to 1/4 of 1% of the average net assets maintained by the responsible dealers. There was no service fee for Class A shares of the Fund for the year ended July 31, 2005.
CLASS B SHARES
Class B shares of the Fund are sold at net asset value and are redeemed at net asset value less a contingent deferred sales charge if redeemed within six years of purchase.
The Fund pays a distribution fee to reimburse Davis Distributors, LLC (the “Distributor”) for commission advances on the sale of the Fund’s Class B shares. Payments under the Class B Distribution Plan are limited to an annual rate of equal to the lesser of 1.25% of the average daily net asset value of the Class B shares or the maximum amount provided by applicable rule or regulation of the National Association of Securities Dealers, Inc., (“NASD”), which currently is 1.00%. Therefore, the effective rate of the Class B Distribution Plan is currently 1%, of which 0.75% may be used to pay distribution expenses and 0.25% may be used to pay shareholder service fees. The NASD rule also limits the aggregate amount the Fund may pay for distribution to 6.25% of gross Fund sales since inception of the Rule 12b-1 plan, plus interest, at 1% over the prime rate on unpaid amounts. The Distributor intends to seek full payment (plus interest at prime plus 1%) of distribution charges that exceed the 1% annual limit in some future period or periods when the plan limits have not been reached.
During the year ended July 31, 2005, Class B shares of the Fund made distribution payments of $10. During the year ended July 31, 2005, there were no payments made for service fees.
There were no commission advances by the Distributor during the year ended July 31, 2005 on the sale of Class B shares of the Fund.
The Distributor intends to seek payment from Class B shares of the Fund in the amount of $42, which represents the maximum amount allowed under applicable NASD rules discussed above. The Fund has no contractual obligation to pay any such distribution charges and the amount, if any, timing and condition of such payments are solely within the discretion of the Directors who are not interested persons of the Fund or the Distributor.
A contingent deferred sales charge is imposed upon redemption of certain Class B shares of the Fund within six years of the original purchase. The charge is a declining percentage starting at 4% of the lesser of net asset value of the shares redeemed or the total cost of such shares. During the year ended July 31, 2005, the Distributor received no contingent deferred sales charges from Class B shares of the Fund.
19
DAVIS RESEARCH FUND
NOTES TO FINANCIAL STATEMENTS – (Continued)
July 31, 2005 | |
NOTE 4 – DISTRIBUTION AND UNDERWRITING FEES – (Continued)
CLASS C SHARES
Class C shares of the Fund are sold at net asset value and are redeemed at net asset value less a contingent deferred sales charge of 1% if redeemed within one year of purchase. Payments under the Class C Distribution Plan are limited to an annual rate equal to the lesser of 1.25% of the average daily net asset value of the Class C shares or the maximum amount provided by applicable rule or regulation of the National Association of Securities Dealers, Inc., (“NASD”), which currently is 1.00%. Therefore, the effective rate of the Class C Distribution Plan is currently 1%, of which 0.75% may be used to pay distribution expenses and 0.25% may be used to pay shareholder service fees. Class C shares are subject to the same 6.25% and 1% limitations applicable to the Class B Distribution Plan.
During the year ended July 31, 2005, Class C shares of the Fund made distribution payments of $10. During the year ended July 31, 2005, there were no payments made for service fees. During the year ended July 31, 2005, the Distributor received no contingent deferred sales charges from Class C shares of the Fund.
NOTE 5 – CAPITAL STOCK
At July 31, 2005, there were 3,000,000,000 shares of capital stock ($0.05 par value per share) authorized, 500,000,000 of which shares are classified as Davis Research Fund. Transactions in capital stock were as follows:
Class A | | | | | | | | | |
| | | | | | | | | |
| | Year ended
July 31, 2005 | | Year ended
July 31, 2004 | |
| | Shares | | Amount | | Shares | | Amount | |
Shares subscribed | | 35,961 | | $ | 479,265 | | 9,095 | | $ | 98,800 | |
Shares issued in reinvestment of distributions | | 23,294 | | | 310,250 | | 16,988 | | | 188,738 | |
| | 59,255 | | | 789,515 | | 26,083 | | | 287,538 | |
Shares redeemed | | (21,956 | ) | | (275,689 | ) | (370 | ) | | (4,109 | ) |
Net increase | | 37,299 | | $ | 513,826 | | 25,713 | | $ | 283,429 | |
Class B | | | | | | | | | |
| | | | | | | | | |
| | Year ended
July 31, 2005 | | Year ended
July 31, 2004 | |
| | Shares | | Amount | | Shares | | Amount | |
Shares subscribed | | – | | $ | – | | – | | $ | – | |
Shares redeemed | | (4 | ) | | (52 | ) | – | | | – | |
Net decrease | | (4 | ) | $ | (52 | ) | – | | $ | – | |
20
DAVIS RESEARCH FUND
NOTES TO FINANCIAL STATEMENTS – (Continued)
July 31, 2005 |
|
NOTE 5 – CAPITAL STOCK – (Continued)
Class C
| | Year ended
July 31, 2005 | | Year ended
July 31, 2004 | |
| | Shares | | Amount | | Shares | | Amount | |
Shares subscribed | | | – | | $ | – | | – | | $ | – | |
Shares redeemed | | | (4 | ) | | (52 | ) | – | | | – | |
Net decrease | | | (4 | ) | $ | (52 | ) | – | | $ | – | |
NOTE 6 – EXPENSES PAID INDIRECTLY
Under an agreement with the custodian bank, custodian fees are reduced for earnings on cash balances maintained at the custodian by the Fund. Such reductions amounted to $178 during the year ended July 31, 2005.
NOTE 7 – BANK BORROWINGS
The Fund may borrow up to 5% of its assets from a bank to purchase portfolio securities, or for temporary and emergency purposes. The purchase of securities with borrowed funds creates leverage in the Fund. The Fund has entered into an agreement, which enables it to participate with certain other Davis Funds in an unsecured line of credit with a bank, which permits borrowings up to $50 million, collectively. Interest is charged based on its borrowings, at a rate equal to the overnight Federal Funds Rate plus 0.75%. The Fund had no borrowings outstanding for the year ended July 31, 2005.
NOTE 8 – LITIGATION MATTERS
On June 2, 2004, a proposed class action lawsuit was filed in the United States District Court for the Southern District of New York on behalf of investors in certain mutual funds (“Funds”) managed by Davis Selected Advisers L.P. (“Davis Advisors”) including the Davis Research Fund. The plaintiffs claim that Davis Advisors and its affiliates, and the individual directors of the Funds (collectively the “Defendants”) used Fund assets to pay brokers to market the Funds and that the Defendants disguised such payments as brokerage commissions and further failed to disclose such payments in public filings or elsewhere. The lawsuit seeks damages of unspecified amounts. Three substantially identical proposed class action lawsuits were filed against the Defendants later in June and July 2004 in the United States Court for the Southern District of New York. All four suits have been consolidated into a single action. Davis Advisors believes the actions are without merit and the Defendants intend to vigorously defend the proceedings. Although no determination can be made at this time, the Fund does not expect this lawsuit to have a material adverse effect on the assets or results of the Fund.
21
DAVIS RESEARCH FUND
NOTES TO FINANCIAL
CLASS A |
|
Financial Highlights for a share of capital stock outstanding throughout each period.
| | Year ended
July 31, | | October 31, 2001
(Commencement
of operations)
through
July 31,
2002 | |
2005 | | 2004 | | 2003 |
Net Asset Value, Beginning of Period | | $ | 11.10 | | $ | 9.93 | | $ | 8.23 | | | $ | 10.00 | | |
| | | | | | | | | | | | | | | |
Income (Loss) From Investment Operations | | | | | | | | | | | | | | | |
Net Investment Income | | | 0.05 | | | 0.06 | | | 0.07 | | | | 0.06 | | |
Net Realized and Unrealized Gains (Losses) | | | 3.19 | | | 1.18 | | | 1.69 | | | | (1.82 | ) | |
Total From Investment Operations | | | 3.24 | | | 1.24 | | | 1.76 | | | | (1.76 | ) | |
| | | | | | | | | | | | | | | |
Dividends and Distributions | | | | | | | | | | | | | | | |
Dividends from Net Investment Income | | | (0.12 | ) | | (0.07 | ) | | (0.06 | ) | | | (0.01 | ) | |
| | | | | | | | | | | | | | | |
Net Asset Value, End of Period | | $ | 14.22 | | $ | 11.10 | | $ | 9.93 | | | $ | 8.23 | | |
| | | | | | | | | | | | | | | |
Total Return 1 | | | 29.23 | % | | 12.50 | % | | 21.56 | % | | | (17.62 | )% | |
| | | | | | | | | | | | | | | |
Ratios/Supplemental Data | | | | | | | | | | | | | | | |
| | | | | | | | | | | | | | | |
Net Assets, End of Period (000 omitted) | | $ | 38,349 | | $ | 29,528 | | $ | 26,169 | | | $ | 21,623 | | |
Ratio of Expenses to Average Net Assets | | | 0.93 | % | | 0.99 | % | | 1.03 | % | | | 1.05 | %* | |
Ratio of Net Investment Income to Average
Net Assets | | | 0.43 | % | | 0.60 | % | | 0.87 | % | | | 0.81 | %* | |
Portfolio Turnover Rate2 | | | 54 | % | | 44 | % | | 119 | % | | | 45 | % | |
1 | Assumes hypothetical initial investment on the business day before the first day of the fiscal period (or inception of offering), with all dividends and distributions reinvested in additional shares on the reinvestment date, and redemption at the net asset value calculated on the last business day of the fiscal period. Sales charges are not reflected in the total returns. Total returns are not annualized for periods of less than one year. |
2 | The lesser of purchases or sales of portfolio securities for a period, divided by the monthly average of the market value of portfolio securities owned during the period. Securities with a maturity or expiration date at the time of acquisition of one year or less are excluded from the calculation. |
See Notes to Financial Statement
22
DAVIS RESEARCH FUND
FINANCIAL HIGHLIGHTS
CLASS B |
Financial Highlights for a share of capital stock outstanding throughout each period.
| | Year ended
July 31, | | October 31, 2001
(Commencement
of operations)
through
July 31,
2002 | |
2005 | | 2004 | | 2003 |
Net Asset Value, Beginning of Period | | $ | 10.86 | | $ | 9.79 | | $ | 8.17 | | | $ | 10.00 | | |
Income (Loss) From Investment Operations | | | | | | | | | | | | | | | |
Net Investment Loss | | | (0.17 | ) | | (0.09 | ) | | (0.06 | ) | | | (0.02 | ) | |
Net Realized and Unrealized Gains (Losses) | | | 3.11 | | | 1.16 | | | 1.68 | | | | (1.81 | ) | |
Total From Investment Operations | | | 2.94 | | | 1.07 | | | 1.62 | | | | (1.83 | ) | |
Net Asset Value, End of Period | | $ | 13.80 | | $ | 10.86 | | $ | 9.79 | | | $ | 8.17 | | |
Total Return1 | | | 27.07 | % | | 10.93 | % | | 19.83 | % | | | (18.30 | )% | |
| | | | | | | | | | | | | | | |
Ratios/Supplemental Data | | | | | | | | | | | | | | | |
Net Assets, End of Period (000 omitted) | | $ | 1 | | $ | 1 | | $ | 1 | | | $ | 1 | | |
Ratio of Expenses to Average Net Assets | | | 2.02 | % | | 2.05 | % | | 2.06 | % | | | 2.04 | %* | |
Ratio of Net Investment Loss to Average Net Assets | | | (0.66 | )% | | (0.46 | )% | | (0.16 | )% | | | (0.18 | )%* | |
Portfolio Turnover Rate2 | | | 54 | % | | 44 | % | | 119 | % | | | 45 | % | |
1 | Assumes hypothetical initial investment on the business day before the first day of the fiscal period (or inception of offering), with all dividends and distributions reinvested in additional shares on the reinvestment date, and redemption at the net asset value calculated on the last business day of the fiscal period. Sales charges are not reflected in the total returns. Total returns are not annualized for periods of less than one year. |
2 | The lesser of purchases or sales of portfolio securities for a period, divided by the monthly average of the market value of portfolio securities owned during the period. Securities with a maturity or expiration date at the time of acquisition of one year or less are excluded from the calculation. |
* | Annualized |
See Notes to Financial Statements
23
DAVIS RESEARCH FUND
FINANCIAL HIGHLIGHTS
CLASS C |
Financial Highlights for a share of capital stock outstanding throughout each period.
| | Year ended
July 31, | | October 31, 2001
(Commencement
of operations)
through
July 31,
2002 | |
2005 | | 2004 | | 2003 |
| | | | | | | | | | | | | | | |
Net Asset Value, Beginning of Period | | $ | 10.86 | | $ | 9.79 | | $ | 8.17 | | | $ | 10.00 | | |
| | | | | | | | | | | | | | | |
Income (Loss) From Investment Operations | | | | | | | | | | | | | | | |
Net Investment Loss | | | (0.16 | ) | | (0.09 | ) | | (0.06 | ) | | | (0.02 | ) | |
Net Realized and Unrealized Gains (Losses) | | | 3.10 | | | 1.16 | | | 1.68 | | | | (1.81 | ) | |
Total From Investment Operations | | | 2.94 | | | 1.07 | | | 1.62 | | | | (1.83 | ) | |
Net Asset Value, End of Period | | $ | 13.80 | | $ | 10.86 | | $ | 9.79 | | | $ | 8.17 | | |
Total Return1 | | | 27.07 | % | | 10.93 | % | | 19.83 | % | | | (18.30 | )% | |
| | | | | | | | | | | | | | | |
Ratios/Supplemental Data | | | | | | | | | | | | | | | |
| | | | | | | | | | | | | | | |
Net Assets, End of Period (000 omitted) | | $ | 1 | | $ | 1 | | $ | 1 | | | $ | 1 | | |
Ratio of Expenses to Average Net Assets | | | 2.02 | % | | 2.05 | % | | 2.06 | % | | | 2.04 | %* | |
Ratio of Net Investment Loss to Average Net Assets | | | (0.66 | )% | | (0.46 | )% | | (0.16 | )% | | | (0.18 | )%* | |
Portfolio Turnover Rate2 | | | 54 | % | | 44 | % | | 119 | % | | | 45 | % | |
1 | Assumes hypothetical initial investment on the business day before the first day of the fiscal period (or inception of offering), with all dividends and distributions reinvested in additional shares on the reinvestment date, and redemption at the net asset value calculated on the last business day of the fiscal period. Sales charges are not reflected in the total returns. Total returns are not annualized for periods of less than one year. |
2 | The lesser of purchases or sales of portfolio securities for a period, divided by the monthly average of the market value of portfolio securities owned during the period. Securities with a maturity or expiration date at the time of acquisition of one year or less are excluded from the calculation. |
* | Annualized |
See Notes to Financial Statements
24
Davis Research Fund
REPORT OF INDEPENDENT REGISTERED PUBLIC ACCOUNTING FIRM |
To the Shareholders and Board of Directors
of Davis New York Venture Fund, Inc.:
We have audited the accompanying statement of assets and liabilities of Davis Research Fund (a series of Davis New York Venture Fund, Inc.), including the schedule of investments, as of July 31, 2005, and the related statement of operations for the year then ended, the statements of changes in net assets for each of the years in the two-year period then ended, and the financial highlights for each of the years in the three-year period then ended and the period from October 31, 2001 (commencement of operations) to July 31, 2002. These financial statements and financial highlights are the responsibility of the Fund’s management. Our responsibility is to express an opinion on these financial statements and financial highlights based on our audits.
We conducted our audits in accordance with the standards of the Public Company Accounting Oversight Board (United States). Those standards require that we plan and perform the audit to obtain reasonable assurance about whether the financial statements and financial highlights are free of material misstatement. An audit includes examining, on a test basis, evidence supporting the amounts and disclosures in the financial statements. Our procedures included confirmation of securities owned as of July 31, 2005, by correspondence with the custodian. An audit also includes assessing the accounting principles used and significant estimates made by management, as well as evaluating the overall financial statement presentation. We believe that our audits provide a reasonable basis for our opinion.
In our opinion, the financial statements and financial highlights referred to above present fairly, in all material respects, the financial position of Davis Research Fund as of July 31, 2005, the results of its operations for the year then ended, the changes in its net assets for each of the years in the two-year period then ended, and the financial highlights for each of the years in the three-year period then ended and the period from October 31, 2001 (commencement of operations) to July 31, 2002, in conformity with U.S. generally accepted accounting principles.
KPMG LLP | | | |
| | |
|
Denver, Colorado
September 9, 2005 | | | |
25
DAVIS RESEARCH FUND
FUND INFORMATION |
Federal Income Tax Information (Unaudited)
In early 2006, shareholders will receive information regarding all dividends and distributions paid to them by the Fund during calendar year 2005. Regulations of the U.S. Treasury Department require the Fund to report this information to the Internal Revenue Service.
During the fiscal year ended July 31, 2005, $310,780 of dividends paid by the Fund constituted net investment income dividends for Federal Income Tax purposes.
Dividends paid by the Fund during the fiscal year ended July 31, 2005 which are not designated as capital gain distribution should be multiplied by 82% to arrive at the net amount eligible for the corporate dividends-received deduction.
For the fiscal year ended July 31, 2005 certain dividends paid by the Fund constitute qualified dividend income for Federal Income Tax purposes. The Fund designates $253,534 as qualified dividend income.
The foregoing information is presented to assist shareholders in reporting distributions received from the Fund to the Internal Revenue Service. Because of the complexity of the federal regulations which may affect your individual tax return and the many variations in state and local tax regulations, we recommend that you consult your tax adviser for specific guidance.
Portfolio Proxy Voting Policies and Procedures
The Fund has adopted Portfolio Proxy Voting Policies and Procedures under which the Fund votes proxies relating to securities held by the Fund. A description of the Fund’s Portfolio Proxy Voting Policies and Procedures is available (i) without charge, upon request, by calling the Fund toll-free at 1-800-279-0279, and (ii) on the SEC’s website at www.sec.gov.
In addition, the Fund is required to file Form N-PX, with its complete proxy voting record for the 12 months ended June 30th, no later than August 31st of each year. The Fund’s Form N-PX filing is available (i) without charge, upon request, by calling the Fund toll-free at 1-800-279-0279, and (ii) on the SEC’s website at www.sec.gov.
Form N–Q
The Fund files its complete schedule of portfolio holdings with the SEC for the first and third quarters of each fiscal year on Form N-Q. The Fund’s Form N-Q is available without charge upon request by calling 1-800-279-0279 or on the SEC’s website at www.sec.gov. The Fund’s Form N-Q may be reviewed and copied at the SEC’s Public Reference Room in Washington, DC, and that information on the operation of the Public Reference Room may be obtained by calling 1-800-SEC-0330.
26
DAVIS RESEARCH FUND
DIRECTOR APPROVAL OF ADVISORY AGREEMENTS |
Process of Annual Review
The Board of Directors of the Davis Funds oversees the management of each Davis Fund and, as required by law, determines annually whether to approve the continuance of each Davis Fund’s advisory agreement with Davis Selected Advisers, L.P. and sub-advisory agreement with Davis Selected Advisers-NY, Inc. (jointly “Davis Advisors” and “Advisory Agreements”).
As a part of this process the Independent Directors, with the assistance of counsel for the Independent Directors, prepares questions which it submits to Davis Advisors in anticipation of the annual contract review. In a separate meeting held prior to the March 2005 board meeting, the Independent Directors reviewed and evaluated all information which they deemed reasonably necessary in the circumstances. Upon completion of this review, the Independent Directors recommended that the full Board of Directors approve the continuance of the Advisory Agreements, which occurred at the March 2005 board meeting.
Reasons the Independent Directors Approved Continuation of the Advisory Agreements.
The Independent Directors determinations were based upon a comprehensive consideration of all information provided to the Independent Directors and were not the result of any single factor. The following facts and conclusions were important, but not exclusive, in the Independent Directors’ recommendation to renew the Advisory Agreements.
The Independent Directors noted the importance of reviewing quantitative measures, but also recognize that qualitative factors, some of which are mentioned below, could be equally or more important in assessing whether Davis Fund shareholders have been, or are likely to be, well served by the renewal of the management contract. They noted both the value and shortcomings of purely quantitative measures, including the data provided by independent service providers, and concluded that while such measures and data can inform, they should not supersede the judgment of the Independent Directors who take many factors, including those listed below, into consideration in representing the shareholders of Davis Funds. In connection with reviewing comparative performance information, the Independent Directors generally give weight to longer-term measurements.
The Independent Directors believe that shareholders of Davis Funds should, and will, expect Davis Advisors to employ a disciplined, company specific, research driven, businesslike, long-term investment philosophy. The Independent Directors concluded that the willingness of Davis Advisors and related persons to invest a substantial amount of their own money alongside and on the same terms as other shareholders in the Davis Funds demonstrates a good alignment of interest between Davis Advisors and Davis Fund shareholders.
The Independent Directors recognized Davis Advisors’ (a) efforts to minimize transaction costs by generally having a long-term time horizon and low portfolio turnover; (b) focus on tax efficiency; (c) record of generally producing satisfactory after tax results over the longer-term; (d) efforts towards fostering healthy investor behavior by, among other things, providing informative and substantial educational material; and (e) efforts to promote shareholder interests by actively speaking out on corporate governance issues.
27
DAVIS RESEARCH FUND
DIRECTOR APPROVAL OF ADVISORY AGREEMENTS – (Continued) |
Reasons the Independent Directors Approved Continuation of the Advisory Agreements. - (Continued)
The Independent Directors also noted that Davis Advisors provides a number of services to the Davis Funds in addition to investment management. Non-investment management services provided by Davis Advisors to the Davis Funds include (a) extensive customer services to Fund shareholders; (b) responsibility for complying with legal duties and regulatory obligations; and (c) responsibility for general administrative and business services. Davis Advisors is reimbursed a portion of its costs in providing some, but not all, of these services.
The Independent Directors reviewed (a) comparative fee and expense information for competitive funds, as selected and analyzed by a nationally recognized independent service provider, (b) information regarding fees charged by Davis Advisors to other advisory clients, including funds which it sub-advises and private accounts, as well as the differences in the services provided to such other clients; and (c) the fee schedules and, if applicable, breakpoints of the various Davis Funds, including an assessment of competitive fee schedules.
The Independent Directors reviewed the profitability of each Davis Fund to Davis Advisors. The Independent Directors considered various potential benefits that Davis Advisors may receive in connection with the services it provides under the Advisory Agreements with each Davis Fund, including a review of portfolio brokerage practices. The Independent Directors noted that Davis Advisors does not use client commissions to pay for publications that are available to the general public or third-party research services.
Davis Research Fund
The Independent Directors noted that Davis Research Fund out-performed its benchmark, the Standard & Poor’s 500® Index, and exceeded the average performance of its peer group, as determined by an independent service provider, over the life of the Fund.
The Independent Directors considered the expense ratio for Davis Research Fund and concluded that it is reasonable and competitive with the range of average expense ratios of its peer group as determined by an independent service provider.
The Independent Directors considered the advisory fee schedule for Davis Research Fund and concluded that it represents an appropriate sharing between Fund shareholders and Davis Advisors of such economies of scale as may exist in the management of the Fund at current asset levels.
Approval of Advisory Arrangements
The Independent Directors determined that the advisory fee for Davis Research Fund was reasonable in light of the nature, quality and extent of the services being provided to the Fund, the costs incurred by Davis Advisors in providing such service, and in comparison to the range of the average advisory fees of its peer group as determined by an independent service provider. The Independent Directors therefore recommended continuation of the advisory agreements.
28
DAVIS RESEARCH FUND
2949 East Elvira Road, Suite 101
Tucson, Arizona 85706 |
DIRECTORS
For the purposes of their service as directors to the Davis Funds, the business address for each of the directors is 2949 E. Elvira Road, Suite 101, Tucson, AZ 85706. Each Director serves until their retirement, resignation, death or removal. Subject to exceptions and exemptions which may be granted by Independent Directors, Directors must retire at the close of business on the last day of the calendar year in which the Director attains age seventy-two (72), except that any person who was a Director on July 1, 1994, and at that date was seventy-three (73) years of age or less shall retire from the Board of Directors and cease being a Director at the close of business on the last day of the year in which the Director attains age seventy-four (74).
Name and
Age | | Position(s)
Held With
Fund | | Term of
Office and
Length of
Time
Served | | Principal
Occupation(s)
During Past Five
Years | | Number of
Portfolios in
Fund
Complex
Overseen by
Director | | Other
Directorships
Held by Director | |
Independent Directors | |
| | | | | | | | | | | |
Wesley E.
Bass, Jr.
(born 8/21/31) | | Director | | director since 1990 | | President, Bass & Associates (financial consulting); formerly First Deputy City Treasurer, City of Chicago; and Executive Vice President, Chicago Title and Trust Company (bank and trust). | | 12 | | none | |
| | | | | | | | | | | |
Marc P. Blum
(born 9/9/42) | | Director | | director since 1986 | | Chief Executive Officer, World Total Return Fund, LLLP; Of Counsel to Gordon, Feinblatt, Rothman, Hoffberger and Hollander, LLC (law firm). | | 12 | | Director, Legg Mason Trust (asset management company) and Rodney Trust Company (Delaware). | |
| | | | | | | | | | | |
Thomas S.
Gayner
(born 12/16/61) | | Director | | director since 2004 | | Executive Vice President and Chief Investment Officer, Markel Corporation (insurance company). | | 12 | | none | |
| | | | | | | | | | | |
Jerry D. Geist
(born 5/23/34) | | Director | | director since 1986 | | Chairman, Santa Fe Center Enterprises (energy project development); Retired Chairman and President, Public Service Company of New Mexico. | | 12 | | Director, CH2M-Hill, Inc. (engineering); Chairman, Santa Fe Center Enterprises, Investment Committee for Microgeneration Technology Fund, UTECH Funds. | |
29
DAVIS RESEARCH FUND
2949 East Elvira Road, Suite 101
Tucson, Arizona 85706 |
DIRECTORS – (Continued)
Name and
Age | | Position(s)
Held With
Fund | | Term of
Office and
Length of
Time
Served | | Principal
Occupation(s)
During Past Five
Years | | Number of
Portfolios in
Fund
Complex
Overseen by
Director | | Other
Directorships
Held by Director | |
Independent Directors - Continued | |
| | | | | | | | | | | |
D. James Guzy
(born 3/7/36) | | Director | | director since 1982 | | Chairman, PLX Technology, Inc. (semi-conductor manufacturer). | | 12 | | Director, Intel Corp. (semi-conductor manufacturer), Cirrus Logic Corp. (semi-conductor manufacturer), Alliance Technology Fund (a mutual fund), Micro Component Technology, Inc. (micro-circuit handling and testing equipment manufacturer), LogicVision, Inc. (semi-conductor software company), and Tessera Technologies, Inc. (semi-conductor packaging company). | |
| | | | | | | | | | | |
G. Bernard Hamilton
(born 3/18/37) | | Director | | director since 1978 | | Managing General Partner, Avanti Partners, L.P. (investment partnership). | | 12 | | none | |
| | | | | | | | | | | |
Robert P. Morgenthau
(born 3/22/57) | | Director | | director since 2002 | | Chairman, Northroad Capital Management, LLC (an investment management firm) since June 2002; President of Private Advisory Services of Bank of America (an investment management firm) from 2001 until 2002; prior to that a managing director and global head of marketing and distribution for Lazard Asset Management (an investment management firm) for ten years. | | 12 | | none | |
30
DAVIS RESEARCH FUND
2949 East Elvira Road, Suite 101
Tucson, Arizona 85706 |
DIRECTORS – (Continued)
Name and
Age | | Position(s)
Held With
Fund | | Term of
Office and
Length of
Time
Served | | Principal
Occupation(s)
During Past Five
Years | | Number of
Portfolios in
Fund
Complex
Overseen by
Director | | Other
Directorships
Held by Director | |
Independent Directors - Continued | |
| | | | | | | | | | | |
Theodore B. Smith, Jr.
(born 12/23/32) | | Director | | director since 1994 | | Chairman, Cantrock Realty and Mayor, Incorporated Village of Mill Neck, NY. | | 12 | | none | |
| | | | | | | | | | | |
Christian R. Sonne
(born 5/6/36) | | Director | | director since 1990 | | General Partner, Tuxedo Park Associates (land holding and development firm); President and Chief Executive Officer, Mulford Securities Corporation (private investment fund) until 1990; formerly Vice President of Goldman Sachs & Co. (investment banking). | | 12 | | none | |
| | | | | | | | | | | |
Marsha Williams
(born 3/28/51) | | Director | | director since 1999 | | Executive Vice President and Chief Financial Officer of Equity Office Properties Trust (a real estate investment trust); Former Chief Administrative Officer of Crate & Barrel (home furnishings retailer); former Vice President and Treasurer, Amoco Corporation (oil & gas company). | | 15 | | Director, the Selected Funds (consisting of three portfolios) since 1996; Director, Modine Manufacturing, Inc. (heat transfer technology); Director, Chicago Bridge & Iron Company, N.V. (industrial construction and engineering). | |
| | | | | | | | | | | |
Inside Directors* | |
| | | | | | | | | | | |
Jeremy H. Biggs
(born 8/16/35) | | Director/
Chairman | | director since 1994 | | Vice Chairman, Member of the Investment Policy Committee and Member of the International Investment Committee, all for Fiduciary Trust Company International (money management firm) Consultant to Davis Selected Advisers, L.P. | | 12 | | none | |
31
DAVIS RESEARCH FUND
2949 East Elvira Road, Suite 101
Tucson, Arizona 85706 |
DIRECTORS – (Continued)
Name and
Age | | Position(s)
Held With
Fund | | Term of
Office and
Length of
Time
Served | | Principal
Occupation(s)
During Past Five
Years | | Number of
Portfolios in
Fund
Complex
Overseen by
Director | | Other
Directorships
Held by Director | |
Inside Directors* - Continued | |
| | | | | | | | | | | |
Andrew A. Davis
(born 6/25/63) | | Director | | director since 1997 | | President or Vice President of each Davis Fund and Selected Fund; President, Davis Selected Advisers, L.P., and also serves as an executive officer in certain companies affiliated with the Adviser. | | 15 | | Director, the Selected Funds (consisting of three portfolios) since 1998. | |
| | | | | | | | | | | |
Christopher C. Davis
(born 7/13/65) | | Director | | director since 1997 | | Chief Executive Officer, President or Vice President of each Davis Fund and Selected Fund; Chairman and Chief Executive Officer, Davis Selected Advisers, L.P., and also serves as an executive officer in certain companies affiliated with the Adviser, including sole member of the Adviser’s general partner, Davis Investments, LLC; Employee of Shelby Cullom Davis & Co. (registered broker/dealer). | | 15 | | Director, the Selected Funds (consisting of three portfolios) since 1998. | |
* | Jeremy H. Biggs, Andrew A. Davis and Christopher C. Davis own partnership units (directly, indirectly or both) of the Adviser and are considered to be “interested persons” of the Funds as defined in the Investment Company Act of 1940. Andrew A. Davis and Christopher C. Davis are brothers. |
32
DAVIS RESEARCH FUND
2949 East Elvira Road, Tucson, Arizona 85706 |
Directors | | Officers |
Wesley E. Bass, Jr. | | Jeremy H. Biggs |
Jeremy H. Biggs | | Chairman |
Marc P. Blum | | Christopher C. Davis |
Andrew A. Davis | | President |
Christopher C. Davis | | Andrew A. Davis |
Thomas S. Gayner | | Vice President |
Jerry D. Geist | | Kenneth C. Eich |
D. James Guzy | | Executive Vice President & |
G. Bernard Hamilton | | Principal Executive Officer |
Robert P. Morgenthau | | Sharra L. Reed |
Theodore B. Smith, Jr. | | Vice President & Chief Compliance Officer |
Christian R. Sonne | | Douglas A. Haines |
Marsha Williams | | Vice President |
| | & Principal Accounting Officer |
| | Thomas D. Tays |
| | Vice President & Secretary |
Investment Adviser
Davis Selected Advisers, L.P. (doing business as “Davis Advisors”)
2949 East Elvira Road, Suite 101
Tucson, Arizona 85706
(800) 279-0279
Distributor
Davis Distributors, LLC
2949 East Elvira Road, Suite 101
Tucson, Arizona 85706
Transfer Agent & Custodian
State Street Bank and Trust Company
c/o The Davis Funds
P.O. Box 8406
Boston, Massachusetts 02266-8406
Counsel
Seyfarth Shaw LLC
55 East Monroe Street, Suite 4200
Chicago, Illinois 60603-5803
Auditors
KPMG LLP
707 Seventeenth Street
Suite 2700
Denver, Colorado 80202
For more information about Davis Research Fund including management fees, charges and expenses, see the current prospectus which must precede or accompany this report. The Fund’s Statement of Additional Information contains additional information about the Fund’s Directors and is available without charge upon request by calling 1-800-279-0279. |
33
ITEM 2. CODE OF ETHICS
The registrant has adopted a code of ethics that applies to the registrant’s principal executive officer, principal financial officer, principal accounting officer or controller, or persons performing similar functions.
Exhibit A of the code of ethics was amended September 14, 2004 to reflect Douglas A. Haines as Principal Financial and Principal Accounting Officer.
A copy of the code of ethics is filed as an exhibit to this form N-CSR.
ITEM 3. AUDIT COMMITTEE FINANCIAL EXPERT
The registrant’s board of directors has determined that independent trustee Marsh Williams qualifies as the “audit committee financial expert”, as defined in Item 3 of form N-CSR.
ITEM 4. PRINCIPAL ACCOUNTANT FEES AND SERVICES
| (a) | Audit Fees. The aggregate Audit Fees billed by KPMP LLP (“KPMG”) for professional services rendered for the audits of the audits of the financial statements, or services that are normally provided in connection with statutory and regulatory filings or engagements for the fiscal year ends July 31, 2005 and July 31, 2004 were $72,000 and $96,284, respectively. |
| (b) | Audit-Related Fees. The aggregate Audit-Related Fees billed by KPMG for services rendered for assurance and related services that are not reasonably related to the performance of the audit or review of the fund financial statements, but not reported as Audit Fees fore fiscal year ends July 31, 2005 and July 31, 2004 were $0 and $0, respectively. |
| (c) | Tax Fees. The aggregate Tax Fees billed by KPMG for professional services rendered for tax compliance, tax advise and tax planning for the fiscal year ends July 31, 2005 and July 31, 2004 were $7,820 and $8,740, respectively. |
Fees included in the Tax Fee category comprise all services performed by professional staff in the independent accountant’s tax division except those services related to the audit. These services include preparation of tax returns, tax advice related to mergers and a review of the fund income and capital gain distributions.
| (d) | All Other Fees. The aggregate Other Fees billed by KPMG for all other non-audit services rendered to the fund for the fiscal year ends July 31, 2005 and July 31, 2004 were $0 and $2,000, respectively. |
Fees included in the Other Fee category include consents for an offering of new Class R shares in Davis New York Venture Fund.
(e)(1) Audit Committee Pre-Approval Policies and Procedures.
The fund Audit Committee must pre-approve all audit and non-audit services provided by the independent accountant relating to the operations or financial reporting of the funds. Prior to the commencement of any audit or non-audit services to a fund, the Audit Committee reviews the services to determine whether they are appropriate and permissible under applicable law.
The fund Audit Committee has adopted a policy whereby audit and non-audit services performed by the fund independent accountant require pre-approval in advance at regularly scheduled Audit Committee meetings. If such a service is required between regularly scheduled Audit Committee meetings, pre-approval may be authorized by the Audit Committee Chairperson with ratification at the next scheduled audit committee meeting.
| (2) | No services included in (b) – (d) above were approved pursuant to paragraph (c)(7)(i)(C) of Rule 2-01 of Regulation S-X. |
| (g) | The Funds’ independent accountant did not provide any services to the investment advisor or any affiliate for the fiscal years ended July 31, 2005 and July 31, 2004. The fund has not paid any fees for non-audit not previously disclosed in items 4 (b) – (d). |
| (h) | The registrant’s audit committee of the board of trustees has considered whether the provision of non-audit services that were rendered to the registrant’s investment adviser, and any entity controlling, controlled by, or under common control with the investment adviser that provides ongoing services to the registrant that not pre-approved pursuant to paragraph (c)(7)(ii) of Rule 2-01 of Regulation S-X is compatible with maintaining the principal accountant’s independence. No such services were rendered. |
ITEM 5. AUDIT COMMITTEE OF LISTED REGISTRANTS
Not Applicable
ITEM 6. SCHEDULE OF INVESTMENTS
Not Applicable. The complete Schedule of Investments is included in Item 1 of this for N-CSR
ITEM 7. DISCLOSURE OF PROXY VOTING POLICIES AND PROCEDURES FOR CLOSED-END MANAGEMENT INVESTMENT COMPANIES
Not Applicable
ITEM 8. PORTFOLIO MANAGERS OF CLOSED-END MANAGEMENT INVESTMENT COMPANIES
Not Applicable
ITEM 9. PURCHASES OF EQUITY SECURITIES BY CLOSED-END MANAGEMENT INVESTMENT COMPANIES AND AFFILIATED PURCHASERS
Not Applicable
ITEM 10. SUBMISSION OF MATTERS TO A VOTE OF SECURITY HOLDERS
There have been no changes to the procedure by which shareholders may recommend nominees to the registrant’s Board of Trustees.
ITEM 11. CONTROLS AND PROCUDURES
| (a) | The registrant’s principal executive officer and principal financial officer have concluded that the registrant’s disclosure controls and procedures (as defined in Rule 30a-2 (c) under the Investment Company Act of 1940, as amended) are effective as of a date within 90 days of the filing date of this report. |
| (b) | There have been no significant changes in the registrant’s internal controls or in other factors that could significantly affect these controls. |
ITEM 12. EXHIBITS
(a)(1) | The registrant’s code of ethics pursuant to Item 2 of Form N-CSR is filed as an exhibit to this form N-CSR. |
(a)(2) | Certifications pursuant to Section 302 of the Sarbanes-Oxley Act of 2002 are attached. |
(b) Certifications pursuant to Section 906 of the Sarbanes-Oxley Act of 2002 are attached.
SIGNATURES
Pursuant to the requirements of the Securities Exchange Act of 1934 and the Investment Company Act of 1940, the registrant has duly caused this report to be signed on its behalf by the undersigned, thereunto duly authorized.
DAVIS NEW YORK VENTURE FUND, INC. | | |
By
| |
/s/ Kenneth C. Eich
Kenneth C. Eich
Principal Executive Officer
| | | |
| | | | | |
Date: October 5, 2005
Pursuant to the requirements of the Securities Exchange Act of 1934 and the Investment Company Act of 1940, this report has been signed below by the following persons on behalf of the registrant and in the capacities and on the dates indicated.
By | | /s/ Kenneth C. Eich
Kenneth C. Eich
Principal Executive Officer | | | |
| | | | | |
Date: October 5, 2005
By | | /s/ Douglas A. Haines
Douglas A. Haines
Principal Financial Officer | | | |
| | | | | |
Date: October 5, 2005