Bancorp reports two principal operating segments in the notes to its financial statements: West Coast Bank and West Coast Trust and parent company related operations. For more information regarding Bancorp’s operating segments, see Note 23 to the Company’s financial statements included under “Financial Statements and Supplementary Data” in Item 8 of this report.
The SEC maintains a website athttp://www.sec.gov that contains reports, proxy and information statements, and other information regarding issuers with publicly traded securities, including the Company.
Subsidiaries
West Coast Bank
The Bank was organized in 1925 under the name The Bank of Newport and its head office is currently located in Lake Oswego, Oregon. The Bank resulted from the merger on December 31, 1998, of the Bank of Newport of Newport, Oregon, The Commercial Bank of Salem, Oregon, Bank of Vancouver of Vancouver, Washington and Centennial Bank of Olympia, Washington, into a single entity, which was named West Coast Bank.
The Bank conducts business through 63 full and limited service branches located in western Oregon and southwestern Washington. The Oregon branches are located in the following cities and towns: Beaverton, Bend (2), Canby, Clackamas, Dallas, Depoe Bay, Eugene (2), Forest Grove, Gresham, Hillsboro (2), Keizer (3), King City, Lake Oswego, Lincoln City, McMinnville, Molalla, Monmouth, Mt. Angel, Newberg, Newport (2), North Plains, Oregon City, Portland (5), Salem (5), Silverton, Stayton, Sublimity, Tigard, Toledo, Tualatin, Waldport, Wilsonville (2) and Woodburn (3). The Bank’s Washington branches are located in Centralia, Chehalis, Hoodsport, Lacey (2), Olympia (2), Shelton, Tukwila and Vancouver (4).
The primary business strategy of the Bank is to provide comprehensive banking and related financial services tailored to individuals, professionals and businesses. The Bank emphasizes the diversity of its product lines and convenient access typically associated with larger financial organizations, while maintaining the local decision making authority, market knowledge and customer service orientation typically associated with a community bank. The Bank has significant focus on four targeted areas: 1) high value consumers (including the mature market), 2) small businesses that desire streamlined packaged products, 3) commercial businesses that benefit from customized lending, depository and investment solutions and 4) real estate finance including construction of commercial and residential projects in addition to permanent financing for income producing properties.
For consumer banking customers, the Bank offers a variety of flexible checking and savings accounts and check cards, as well as competitive borrowing products, such as personal lines of credit, credit cards and a variety of first and second lien residential mortgage products and other types of consumer loans. The consumer products consist of free checking and six other account types, each specifically designed to meet the needs of a unique market segment. The small business package of deposit accounts includes free business checking and an interest-bearing account for eligible organizations. Because of the straightforward and streamlined product design, our personal bankers are able to quickly and easily identify the best account for our clients. In 2006, the Bank introduced iDeposit, a remote deposit service that allows business customers to make deposits electronically without leaving their office. Customers have access to the Bank’s products and services through a variety of convenient channels such as 24 hour -7 days a week automated phone and Internet access, a personal customer service center accessed by phone, ATMs (both shared and proprietary networks), as well as through our branch locations.
For business banking customers, the Bank offers customized deposit products tailored for specific needs, including a variety of checking accounts, sophisticated Internet-based cash management and a full array of investment services, all with online and/or CD-ROM information reporting. Customized financing packages provide businesses with a comprehensive suite of credit facilities that include general commercial purpose loans (short and intermediate term), revolving lines of credit, real estate loans and lines to support construction, owner-occupied and investor financing and SBA loans. The Bank’s loan portfolio has some concentration in loans secured by real estate. The Bank also offers business credit cards (VISA) and equipment leasing through vendor alliances and other types of business credit.
The principal office of the Bank is at 5335 Meadows Road, Suite 201, Lake Oswego, OR 97035 (503) 684-0884.
West Coast Trust
West Coast Trust provides trust services and life insurance products to individuals, for-profit and not for-profit businesses and institutions. West Coast Trust acts as fiduciary of estates and conservatorships, and as a trustee under various wills, trusts, and pension and profit-sharing plans. The main office of West Coast Trust is located at 1000 SW Broadway, Suite 1100, Portland, Oregon 97205. (503) 279-3911.
Totten, Inc.
Totten, Inc., a Washington corporation, serves as trustee under deeds of trust and holds certain real estate licenses.
4
West Coast Statutory Trusts III, IV, V, VI, VII and VIII
West Coast Statutory Trusts III, IV, V, VI, VII and VIII are wholly-owned subsidiary trusts of Bancorp formed to facilitate the issuance of Pooled Trust Preferred Securities (“trust preferred securities”). The trusts were organized in September 2003, March 2004, April 2006, December 2006, March 2007 and June 2007 respectively, in connection with six offerings of trust preferred securities. For more information regarding Bancorp’s issuance of trust preferred securities, see Note 10 “Junior Subordinated Debentures” to Bancorp’s audited consolidated financial statements included in Item 8 of this report.
Employees
At December 31, 2007, Bancorp and its subsidiaries had approximately 850 employees. None of these employees are represented by labor unions and management believes that Bancorp’s relationship with its employees is good. Bancorp emphasizes a positive work environment for its employees and our work environment is measured annually utilizing an anonymous employee survey. Results indicate a high level of employee satisfaction with their work as well as with Bancorp in general. In addition, West Coast Bank was recognized in 2005, 2006, and 2007 as one of Oregon’s Best 100 Companies for which to work. Management continually strives to retain top talent as well as provide career development opportunities to enhance skill levels. A number of benefit programs are available to eligible employees, including group medical plans, paid sick leave, paid vacation, group life insurance, a 401(k) plan and a stock incentive plan. Employees are also eligible to purchase Bancorp’s common stock through direct payroll deductions under the Company’s stock purchase plan. In addition, bank owned life insurance, a deferred compensation plan and supplemental retirement benefits are available to certain officers and executives of Bancorp.
Competition
Commercial banking in the state of Oregon and southwest Washington is highly competitive with respect to providing banking services, including making loans and attracting deposits. The Bank competes with other banks, as well as with savings and loan associations, savings banks, credit unions, mortgage companies, investment banks, insurance companies, securities brokerages and other financial institutions. Banking in Oregon and Washington is dominated by several significant banking institutions, including U.S. Bank, Wells Fargo Bank, Bank of America and Washington Mutual Bank, which together account for a majority of the total commercial and savings bank loans and deposits in Oregon and Washington. These competitors have significantly greater financial resources and offer a greater number of branch locations (with statewide branch networks), higher lending limits, and a variety of services not offered by the Bank. Bancorp has attempted to offset some of the advantages of the larger competitors by arranging participations with other banks for loans above its legal lending limits, as well as leveraging technology and third party arrangements to deliver contemporary product solutions and better compete in targeted customer segments.Bancorp has positioned itself successfully as a local alternative to banking conglomerates that may be perceived by customers or potential customers to be impersonal, out-of-touch with the community, or simply not interested in providing banking services to some of Bancorp’s target customers.
In addition to larger institutions, numerous “community” banks or credit unions have been formed, expanded, or moved into Bancorp’s market areas and have developed a similar focus to Bancorp. These institutions have further increased competition, particularly in the Portland metropolitan area, where Bancorp has enjoyed significant growth in past years and focused much of its expansion efforts. This growing number of similar financial institutions and an increased focus by larger institutions on the Bank’s market segments in response to declining market perception and/or market share has led to intensified competition in all aspects of Bancorp’s business. At June 30, 2007, the Bank had approximately 3% and 17% of the deposit market share in the Portland, Oregon, and Salem Oregon areas, respectively, excluding credit unions. In Lincoln County on the Oregon coast, the Bank had over 28% of the deposit market share at June 30, 2007. Increased competitive pressure and changing customer deposit behaviors could adversely affect the Bank’s market share of deposits.
The adoption of the Gramm-Leach-Bliley Act of 1999 (the “GLB Act”) has led to further competition in the financial services industry. The GLB Act eliminated many of the barriers to affiliation among providers of various types of financial services and permitted business combinations among financial service providers such as banks, insurance companies, securities or brokerage firms and other financial service providers. Additionally, the rapid adoption of financial services through the Internet has reduced or even eliminated many barriers to entry by financial services providers physically located outside our market areas. For example, remote deposit services, partly developed in response to the Check 21 law, allow depository companies physically located in other geographical markets to service local businesses with minimal cost of entry. Although Bancorp has been able to compete effectively in the financial services business in its markets to date, there can be no assurance that it will be able to continue to do so in the future.
5
The financial services industry has experienced widespread consolidation over the last decade. Bancorp anticipates that consolidation among financial institutions in its market areas will continue. As noted, Bancorp may seek acquisition opportunities in markets of strategic importance to it from time to time. However, other financial institutions aggressively compete against Bancorp in the acquisition market. Some of these institutions may have greater access to capital markets, larger cash reserves and stock for use in acquisitions that is more liquid and more highly valued by the market.
Supervision and Regulation
Introduction
Bancorp is an Oregon corporation headquartered in Lake Oswego, Oregon, and is registered with the Federal Reserve as a bank holding company and a financial holding company. The Bank is organized as an Oregon non-member state bank.
The laws and regulations applicable to Bancorp and its subsidiaries are primarily intended to protect depositors of the Bank and not stockholders of Bancorp. Proposals to change the laws and regulations governing the banking industry are frequently introduced in Congress, in the state legislatures and before the various bank regulatory agencies. The likelihood and timing of any such proposals or legislation and the impact they might have on Bancorp and its subsidiaries cannot be determined. Changes in applicable laws or regulations or in the policies of banking and other government regulators may have a material effect on our business and prospects. Violation of the laws and regulations applicable to Bancorp and its subsidiaries may result in assessment of substantial civil monetary penalties, the imposition of a cease and desist order, and other regulatory sanctions.
The following is a brief description of the significant laws and regulations that govern our activities.
Bank Holding Company Regulation
As a registered bank holding company and financial holding company, Bancorp is subject to the supervision of, and regular inspection by, the Federal Reserve pursuant to the Bank Holding Company Act of 1956, as amended (the “BHCA”). Bancorp must file reports with the Federal Reserve and must provide it with such additional information as it may require.
Bank holding companies like Bancorp must, among other things, obtain prior Federal Reserve approval before they: (1) acquire direct or indirect ownership or control of any voting shares of any bank that results in total ownership or control, directly or indirectly, of more than 5% of the voting shares of such bank; (2) merge or consolidate with another bank holding company; or (3) acquire substantially all of the assets of another bank or bank holding company. In acting on applications for such prior approval, the Federal Reserve considers various factors, including, without limitation, the effect of the proposed transaction on competition in relevant geographic and product markets, and each transaction party’s financial condition, managerial resources and performance record under the Community Reinvestment Act.
Bank holding companies must also act as a source of financial and managerial strength to subsidiary banks. This means that Bancorp is required to commit, as necessary, resources to support the Bank. Under certain conditions, the Federal Reserve may conclude that certain actions of a bank holding company, such as payment of cash dividends, would constitute unsafe and unsound banking practices.
Financial holding companies are a special type of bank holding company that is authorized to engage in activities considered to be “financial in nature.” A financial holding company may engage in a broader range of activities than those permitted of a bank holding company, which may only engage, directly or indirectly, in the business of banking and activities that are closely related or incidental to banking. Bancorp could lose its qualification as a financial holding company if the Bank becomes less than “well capitalized” or if the Bank is rated as less than “well managed” by the FDIC or the Federal Reserve. If that were to occur, the Federal Reserve could mandate that Bancorp divest itself of certain assets or limit its activities to those activities permitted of bank holding companies.
Financial subsidiaries of a financial holding company continue to be regulated by their functional regulator. For example, if a Bancorp subsidiary engages in certain insurance activities the applicable state insurance regulator regulates the insurance activities. The Federal Reserve maintains umbrella supervision over all subsidiary activities, but will generally only intervene in the regulation of a financial subsidiary if its activities endanger the safety and soundness of an affiliated bank.
Subsidiary banks of a bank holding company are subject to certain other restrictions under the Federal Reserve Act and Regulation W on transactions with affiliates generally and in particular on extensions of credit to the parent holding company or any affiliate, investments in the securities of the parent, and on the use of such securities as collateral for loans to any borrower. The various regulations and restrictions that apply may limit Bancorp’s ability to obtain funds from the Bank for its cash needs, including funds for payment of dividends and operational expenses.
6
Bank Regulation
General.The Bank is an Oregon state-chartered non-member (of the Federal Reserve System) commercial bank operating in Oregon and Washington with deposits insured by the FDIC in an amount up to $100,000 per customer, and certain self-directed retirement accounts insured by the FDIC up to $250,000 per customer. As a result, the Bank is subject to supervision and regulation by the Oregon Department of Consumer and Business Services and the FDIC, and to a lesser extent, the Washington Department of Financial Institutions. The Bank's regulators engage in regular examinations of the Bank and have the authority to prohibit the Bank from engaging in activities they believe constitute unsafe or unsound banking practices.
Premiums for Deposit Insurance. The Bank is required to pay semiannual deposit insurance premiums to the FDIC. Premiums are based on how much risk a particular institution presents to the Bank Insurance Fund. Banks with higher levels of capital and a low degree of supervisory concern are assessed lower premiums than banks with lower levels of capital or a higher degree of supervisory concern. The Bank presently qualifies for the lowest premium level. The FDIC may terminate deposit insurance if it determines the institution involved has engaged in or is engaging in unsafe or unsound banking practices, is in unsafe or unsound condition, or has violated applicable laws, regulations or orders.
Community Reinvestment Act and Fair Lending and Reporting Requirements.The Bank is subject to the Community Reinvestment Act (“CRA”) and to certain fair lending and reporting requirements that relate primarily to home mortgage lending operations. The CRA generally requires the federal banking agencies to evaluate the record of a financial institution in meeting the credit needs of its local communities, including low- and moderate-income neighborhoods, consistent with the safe and sound operation of the institution. The federal banking agencies may take into account compliance with the CRA when regulating and supervising other activities, such as evaluating mergers, acquisitions and applications to open a branch or facility. In connection with its assessment of CRA performance, the FDIC assigns a rating of “outstanding,” “satisfactory,” “needs to improve” or “substantial noncompliance.” The Bank received a CRA rating of satisfactory during its most recent CRA examination in November 2005.
There are several rules and regulations governing fair lending and reporting practices by financial institutions. A bank may be subject to substantial damages, penalties and corrective measures for any violation of fair lending and reporting, including credit reporting, laws and regulations.
Consumer Privacy. Bancorp and Bank are subject to laws and regulations that impose privacy standards that limit the ability of banks and other financial institutions to disclose non-public information about consumers to nonaffiliated third parties. These limitations require disclosure of privacy policies to consumers and, in some circumstances, allow consumers to prevent disclosure of certain personal information to a nonaffiliated third party.
Capital Adequacy
Federal bank regulatory agencies use capital adequacy guidelines in the examination and regulation of bank holding companies and banks. If capital falls below minimum guideline levels, the bank holding company or bank may be denied approval to acquire or establish additional banks or non-bank businesses or to open new facilities.
The FDIC and Federal Reserve use risk-based capital guidelines for banks and bank holding companies. Risk-based guidelines are designed to make capital requirements more sensitive to differences in risk profiles among banks and bank holding companies, to account for off balance sheet exposure and to minimize disincentives for holding liquid assets. Assets and off balance sheet items are assigned to broad risk categories, each with appropriate weights. The resulting capital ratios represent capital as a percentage of total risk-weighted assets and off balance sheet items. The guidelines are minimums and the Federal Reserve may require that a banking organization maintain ratios in excess of the minimums, particularly organizations contemplating significant expansion. Current guidelines require all bank holding companies and federally-regulated banks to maintain a minimum risk-based total capital ratio equal to 8%, of which at least 4% must be Tier I capital. Tier I capital for bank holding companies includes common stockholders’ equity, qualifying preferred stock and minority interests in equity accounts of consolidated subsidiaries, minus specified intangibles and accumulated other comprehensive income (loss).
7
The Federal Reserve also employs a leverage ratio, which is Tier I capital as a percentage of total assets minus intangibles, to be used as a supplement to risk-based guidelines. The principal objective of the leverage ratio is to constrain the maximum degree to which a bank holding company may leverage its equity capital base. The Federal Reserve requires a minimum leverage ratio of 3%. However, for all but the most highly rated bank holding companies and for bank holding companies seeking to expand, the Federal Reserve expects an additional cushion of at least 1% to 2%.
The Federal Deposit Insurance Corporation Improvement Act (“FDICIA”), among other things, created a statutory framework of supervisory actions indexed to the capital level of the individual institution. Under regulations adopted by the FDIC, an institution is assigned to one of five capital categories - well capitalized, adequately capitalized, undercapitalized, significantly undercapitalized, and critically undercapitalized - depending on its total risk-based capital ratio, Tier I risk-based capital ratio, and leverage ratio, together with certain subjective factors. Institutions which are deemed to be “undercapitalized” depending on the category to which they are assigned are subject to certain mandatory supervisory corrective actions. Under current regulations, a “well-capitalized” institution must have a Tier 1 risk-based capital ratio of at least 6%, a total risk-based capital ration of at least 10%, and a leverage ratio of at least 5% and not be subject to a capital directive order. Under these guidelines, Bancorp is considered well capitalized as of the end of the fiscal year.
FDICIA.Under FDICIA, each federal banking agency has prescribed, by regulation, non-capital safety and soundness standards for institutions under its authority. These standards cover internal controls, information systems and internal audit systems, loan documentation, credit underwriting, interest rate exposure, asset growth, compensation, fees and benefits, such other operational and managerial standards as the agency determines to be appropriate, and standards for asset quality, earnings and stock valuation. An institution which fails to meet these standards must develop a plan acceptable to the agency, specifying the steps that the institution will take to meet the standards. Failure to submit or implement such a plan may subject the institution to regulatory sanctions. Management believes that the Bank currently satisfies all such standards.
Dividends
The principal source of Bancorp’s cash reserves is dividends received from the Bank. The banking regulators may prohibit banks and bank holding companies from paying dividends that would constitute an unsafe or unsound banking practice. In addition, a bank may not pay cash dividends if doing so would reduce the amount of its capital below that necessary to meet minimum applicable regulatory capital requirements. Oregon law also limits a bank's ability to pay dividends.
Interstate Banking and Branching
The Riegle-Neal Interstate Banking and Branching Efficiency Act of 1994 (the “Interstate Act”) generally authorizes interstate branching and relaxes federal law restrictions on interstate banking. Currently, bank holding companies may purchase banks in any state and states may not prohibit these purchases. Additionally, banks are permitted to merge with banks in other states, as long as the home state of neither merging bank has opted out under the legislation. Oregon and Washington each enacted “opting in” legislation in accordance with the Interstate Act. The Interstate Act requires regulators to consult with community organizations before permitting an interstate institution to close a branch in a low-income area.
The USA Patriot Act
Enacted in 2001, the Uniting and Strengthening America by Providing Appropriate Tools Required to Intercept and Obstruct Terrorism Act of 2001 (the “USA Patriot Act”) gives the federal government new powers to address terrorist threats through enhanced domestic security measures, expanded surveillance powers, increased information sharing and broadened anti-money laundering requirements. Among other requirements, the USA Patriot Act requires banks to implement additional policies and procedures with respect to money laundering, suspicious activities and currency transaction reporting and currency crimes.
Monetary and Fiscal Policy Effects on Interest Rates
Banking is a business which depends on interest rate differentials. In general, the differences between the interest paid by a bank on its deposits and its other borrowings and the interest received by a bank on loans extended to its customers and securities held in its investment portfolio constitute the major portion of a bank’s earnings. Thus, our earnings and growth are constantly subject to the influence of economic conditions generally, both domestic and foreign, and also to the monetary and fiscal policies of the United States and its agencies, particularly the Federal Reserve. The nature and timing of changes in such policies and their impact cannot be predicted.
8
ITEM 1A.RISK FACTORS
The following are risks that management believes are specific to our business. This should not be viewed as an all inclusive list or in any particular order.
Future loan losses may exceed our allowance for loan losses.
We are subject to credit risk, which is the risk that borrowers will fail to repay loans in accordance with their terms. A downturn in the economy or a specific industry sector or a rapid change in interest rates could adversely affect our borrowers’ ability to repay loans. A downturn in the relevant real estate markets could adversely affect the value of the collateral for many of our loans. Developments of this nature could result in losses in excess of our allowance for loan losses. In addition, to the extent that loan payments from borrowers are not timely, the loans will be placed on nonaccrual status, thereby reducing and/or reversing previously accrued interest income.
We maintain an allowance for loan losses that represents management’s best estimate, as of a particular date, of the probable amount of loan receivables that the Bank will be unable to collect. When available information confirms that specific loans or portions of loans are uncollectible, those amounts are charged off against the allowance for loan losses. Our management establishes the allowance for loan losses based on a continual evaluation of lending concentrations, specific credit risks, past loan loss experience, loan portfolio and collateral quality, and relevant economic, political, and regulatory conditions. Adverse changes in any of these or other factors that management considers relevant may result in an increase in the allowance for loan losses. In addition, federal and state banking regulators periodically review the allowance for loan losses and may require that the Bank increase the allowance or recognize loan charge-offs. Any additional provision for loan losses to increase the allowance for loan losses results in a decrease in net income, and possibly risk-based capital, and may have a material adverse effect on our financial condition and results of operations. For more information on this topic, see “Critical Accounting Policies” and “Allowance for Credit Losses and Net Loan Charge-offs” under Item 7 of this report below.
Rapidly changing interest rate environments could reduce our net interest margin, net interest income, fee income and net income.
Interest and fees on loans and securities, net of interest paid on deposits and borrowings, are a large part of our net income. Interest rates are key drivers of our net interest margin and are subject to many factors beyond the control of management. As interest rates change, net interest income is affected. Rapid increases in interest rates in the future could result in interest expense increasing faster than interest income because of mismatches in financial instrument maturities and rapid decreases in interest rates could result in interest income decreasing faster than interest expense, for example, when management is unable to match decreases in market interest rates, lowering earning assets yield, with reduced rates paid on deposits or borrowings. Further, substantially higher interest rates generally reduce loan demand and may result in slower loan growth particularly in construction lending, an important factor in Bancorp’s revenue growth over the past two years. Decreases or increases in interest rates could have a negative effect on the spreads between the interest rates earned on assets and the rates of interest paid on liabilities, and therefore decrease net interest income. For more information on this topic see “Quantitative and Qualitative Disclosures about Market Risk.”
Defaults and related losses in our two-step residential construction loan portfolio (“two-step loan portfolio”) could be greater than currently anticipated and are expected to result in a significant increase in other real estate owned (“OREO”) balances and number of properties to be disposed.
In January 2008, we announced a provision for credit losses in the amount of $27.8 million, pre-tax, for expected losses associated with our two-step loan portfolio. For additional information, see “Provision for Credit Losses” and “Two-Step Loan Portfolio” under Item 7 of this report below. Actual losses related to loans in the two-step loan portfolio (“two-step loans”) may be greater then anticipated, resulting in additional provision for credit losses in future periods.
Construction lending has been an important source of revenue and profitability for the Bank, but it is riskier than other forms of lending due in part to risks inherent in construction, including the possibility of delays and cost overruns, and the additional risks that may arise out of the extended time period between a loan commitment and the project’s eligibility for permanent financing, which may, among other things, allow for significant changes in the financial position of borrowers or changes in market conditions.
As part of our collection process for all nonperforming loans, including nonperforming two-step loans, we may foreclose on and take title to the real estate serving as collateral for the loan. Real estate owned by the Bank and not used in the ordinary course of its operations is referred to as “other real estate owned” or “OREO” property. Increased OREO balances lead to greater expenses as we incur costs to manage and dispose of the properties and, in certain cases, complete construction of residences prior to sale. Any decrease in sale prices on homes may lead to OREO write-downs with a corresponding expense in our income statement. We expect that our earnings over the next several quarters will be negatively affected by various expenses associated with OREO, including personnel costs, insurance and taxes, completion and repair costs, and other costs associated with property ownership, as well as by the funding costs associated with assets that are tied up in real estate properties during the period they are held in OREO.
9
We may be subject to environmental liability risk associated with lending activities.
A significant portion of our loan portfolio is secured by real property. In the ordinary course of business, we may foreclose on and take title to properties securing loans. There is a risk that hazardous or toxic substances will be found on these properties, in which case we may be liable for remediation costs and related personal injury and property damage. Compliance with environmental laws may require us to incur substantial expenses and may materially reduce the affected property’s value or limit our ability to use or sell the affected property. Environmental indemnifications obtained from borrowers and their principals or affiliates may not adequately compensate the Bank for losses related to environmental conditions. The remediation costs and financial liabilities associated with environmental conditions could have a material adverse effect on our financial condition and results of operations.
Recent disruptions in the subprime mortgage market and weakness in the real estate market that seems, in part, related to problems in the subprime market may continue to impact our operations.
Subprime mortgages are residential mortgage loans intended for borrowers who are perceived to have high credit risk. Subprime lenders and other participants in the subprime mortgage market have recently experienced higher than anticipated levels of borrower defaults and lender foreclosures in the past year, which in turn has caused significant adverse economic consequences to many participants in the subprime lending market, including loan originators, loan servicers, and participants in the secondary loan markets. These consequences have spread to other markets, including, most significantly, the general credit markets and real estate markets. In the past year, federal banking regulators, including the Federal Reserve and the FDIC, issued statements in support of loan modification programs for existing subprime loans. Federal and state legislators and regulators may pursue increased regulation of how loans are originated, purchased, and sold, regardless of whether those loans are made to subprime borrowers. Disruptions in the lending market and related regulatory responses may impact how the Bank buys and sells loans in the future or how the Bank underwrites loans that it originates, any of which could have a negative impact on our operations, capital, revenues, and net earnings, or materially reduce the liquidity provided to us by the secondary loan market. We have experienced a high rate of default in connection with our two-step loan portfolio, which we believe is due, in part, to the disruptions in the lending and real estate markets. We expect to experience further defaults and the rate of defaults may worsen if the lending and real estate markets do not stabilize and eventually begin to improve.
Significant legal and regulatory actions could subject us to uninsured liabilities and associated reputational risk.
From time to time, we are sued for damages or threatened with lawsuits relating to various aspects of our operations. We may also be subject to investigations and possibly substantial civil money penalties assessed by federal or state regulators in connection with violations of applicable laws and regulations. We may incur substantial attorney fees and expenses in the process of defending against lawsuits or regulatory actions and our insurance policies may not cover, or cover adequately, the costs of adverse judgments, civil money penalties, and attorney fees and expenses. As a result, we may be exposed to substantial uninsured liabilities, which could adversely affect our results of operations, capital, and financial condition.
We are subject to reputational risk, which is the potential that negative publicity regarding our business practices, whether true or not, could cause a decline in our customer base, stock price, or general reputation in the markets in which we operate. Reputational risk is heightened in the instance of publicity surrounding lawsuits or regulatory actions.
Slower than anticipated growth and/or revenues from new branches and product and service offerings could result in reduced net income.
We have placed a strategic emphasis on expanding our branch network and product offerings. Executing this strategy carries risks of slower than anticipated growth in new branches and products as well as associated revenues. Lower than expected loan and deposit growth at new branches and lower than expected demand for new product offerings may decrease anticipated revenues and net income. Opening new branches and introducing new products may result in more expenses than anticipated and divert financial and personnel resources from current core operations.
Decreased volumes and lower gains on sales of mortgage and SBA loans, and loan repurchase obligations, could adversely affect our net income.
We originate and sell mortgage loans and the guaranteed portion of SBA loans. Changes in interest rates affect demand for our loan products and the revenue realized on the sale of the loans. A decrease in the volume of loans sold may reduce associated revenues and net income. In the event of certain breaches of warranties and representations made by us in connection with loan sales, we may be contractually obligated to repurchase loans sold to correspondent lenders in the secondary market. Any repurchases would alter our financial assumptions which were based on recognizing the revenue associated with the original sale of the loans, and could adversely affect the results of our lending operations.
10
Inability to hire or retain certain key professionals, management and staff could adversely affect our revenues and net income.
We rely on key personnel to manage and operate our business, including, but not limited to, major revenue generating functions such as our loan and deposit portfolios. The loss of key staff may adversely affect our ability to maintain and manage these portfolios effectively, which could negatively affect our revenues and earnings. In addition, loss of key personnel could result in increased recruiting and hiring expenses, which could cause a decrease in our net income.
We face operational risks that may result in unexpected losses.
We face various operational risk that arise from the potential that inadequate information systems, operational problems, failures in internal controls, breaches of our security systems, fraud, the execution of unauthorized transactions by employees, or any number of unforeseen catastrophes could result in unexpected losses. Additionally, third party vendors provide key components of our business infrastructure such as internet connections, network access, data reporting, and data processing. Any problems caused by third parties could adversely affect our ability to deliver products and services to our customers and our revenues, expenses, and earnings. Replacing third party vendors, should that be necessary, may entail significant delay and expense.
The financial services industry is very competitive.
We face competition in attracting and retaining deposits, making loans and providing other financial services. Our competitors include other community banks, larger banking institutions and a wide range of other financial institutions such ascredit unions, government-sponsored enterprises, mutual fund companies, insurance companies and other non-bank businesses. Many of these competitors have substantially greater resources than us. For a more complete discussion of our competitive environment, see “Business—Competition” in Item 1 above. If we are unable to compete effectively, we will lose market share and income from deposits, loans, and other products may be reduced. We are currently in a particularly competitive market for low cost deposits, which has led to increased pressure on our net interest margin.
11
ITEM 1B.UNRESOLVED STAFF COMMENTS
None.
ITEM 2.PROPERTIES
The principal properties owned by the Bank include a 40,000-square-foot office and branch facility in downtown Salem, Oregon, a 15,600-square-foot office and branch facility in Newport, Oregon, and a 12,000-square-foot branch and office facility in Lacey, Washington. In total, the Bank owns 26 buildings, primarily to house branch offices. The Bank leases the land under six buildings and owns the land under 20 of these buildings. In addition, the Bank leases 45 office spaces and buildings for branch locations.
Other non-branch office facilities are located in leased office space, including our headquarters office in Lake Oswego, Oregon, office and processing space in Salem, Oregon, where the Bank’s data center is located, space in Wilsonville, Oregon, where its loan servicing and operations center is located, space in Vancouver, Washington, where we have a mortgage and SBA lending office, and space in Bend, Oregon, where we have a residential mortgage office. In addition, we lease three smaller office spaces for lending personnel in Lake Oswego, as well as space in downtown Portland, Oregon, and Tukwila, Washington.
The aggregate monthly rental on 52 leased properties is approximately $319,000.
ITEM 3.LEGAL PROCEEDINGS
Bancorp is periodically party to litigation arising in the ordinary course of business. Based on information currently known to management, although there are uncertainties inherent in litigation, we do not believe there is any legal action to which Bancorp or any of its subsidiaries is a party that, individually or in the aggregate, will have a material adverse effect on Bancorp’s financial condition and results of operations.
ITEM 4.SUBMISSION OF MATTERS TO A VOTE OF SECURITY HOLDERS
None.
12
PART II
| ITEM 5. | | MARKET FOR REGISTRANT’S COMMON EQUITY, RELATED STOCKHOLDERMATTERS ANDISSUER PURCHASES OF EQUITY SECURITIES |
Stock Price and Dividends
Bancorp common stock trades on the NASDAQ Global Select Market under the symbol “WCBO.” The high and low closing sale prices per share of our common stock for each quarter during the last two years are shown in the table below, together with dividend information for each period. The prices below do not include retail mark-ups, mark-downs or commissions, may not represent actual transactions and are not adjusted for dividends. As of December 31, 2007, we had approximately 2,162 holders of record.
| | 2007 | | 2006 |
| | Market Price | | Cash dividend | | | Market Price | | Cash dividend | |
| | | | High | | Low | | | declared | | | | High | | Low | | | declared | |
| 1st Quarter | | $34.44 | | $29.31 | | | $0.1200 | | | | $28.43 | | $25.53 | | | $0.1050 | |
| | 2nd Quarter | | $32.49 | | $29.57 | | | $0.1200 | | | | $30.62 | | $25.71 | | | $0.1050 | |
| 3rd Quarter | | $31.85 | | $25.97 | | | $0.1350 | | | | $32.66 | | $27.90 | | | $0.1200 | |
| 4th Quarter | | $30.78 | | $18.50 | | | $0.1350 | | | | $35.79 | | $29.85 | | | $0.1200 | |
Dividends are limited under federal and Oregon laws and regulations pertaining to Bancorp’s financial condition. Payment of dividends by the Bank may also be subject to restriction by state and federal banking regulators. See “Business – Supervision and Regulation.”
Information regarding securities authorized for issuance under equity compensation plans is incorporated by reference into Part III, Item 12 of this report.
Issuer Purchases of Equity Securities
The following table provides information about purchases of common stock by the Company during the quarter ended December 31, 2007:
| | | | | | Total Number of Shares | | |
| | | | | | | Purchased as Part of Publicly | | Maximum Number of Shares Remaining |
| | Total Number of Shares | | Average Price Paid | | Announced Plans or Programs | | at Period End that May Be Purchased |
| Period | Purchased/Cancelled (1) | | per Share | | (2) | | Under the Plans or Programs |
| 10/1/07 - 10/31/07 | 705 | | $28.80 | | 15,000 | | 1,051,821 |
| 11/1/07 - 11/30/07 | - | | | | - | | 1,051,821 |
| 12/1/07 - 12/31/07 | - | | | | - | | 1,051,821 |
| Total for quarter | 705 | | | | 15,000 | | |
| (1) | | Shares purchased by Bancorp during the quarter include: (1) shares purchased pursuant to the Company’s corporate stock repurchase program publicly announced in July 2000 (the “Repurchase Program”) and described in footnote 2 below, and (2) shares purchased from employees in connection with stock option swap exercises and cancellation of restricted stock to pay withholding taxes totaling 705 shares, 0 shares, and 0 shares, respectively, for the periods indicated. |
| (2) | | Under the Repurchase Program, the board of directors originally authorized the Company to purchase up to 330,000 common shares, which amount was increased by 550,000 shares in September 2000, by 1.0 million shares in September 2001, by 1.0 million shares in September 2002, and by 1.0 million shares in April 2004, and by 1.0 million shares in September 2007 for a total authorized repurchase amount as of December 31, 2007, of approximately 4.9 million shares. |
13
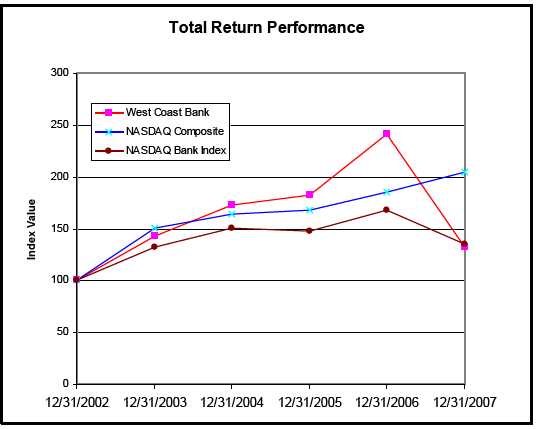
Five-Year Stock Performance Graph
The following chart compares the yearly percentage change in the cumulative shareholder return on our common stock during the five years ended December 31, 2007, with (1) the Total Return Index for the NASDAQ Stock Market (U.S. Companies) and (2) the Total Return Index for NASDAQ Bank Stocks. This comparison assumes $100.00 was invested on December 31, 2002, in our common stock and the comparison groups and assumes the reinvestment of all cash dividends prior to any tax effect and retention of all stock dividends. West Coast Bancorp’s total cumulative return was 32.5% over the five year period ended December 31, 2007 compared to 34.7% and 104.8% for the NASDAQ Bank Stocks and NASDAQ composite, respectively.
| | Period Ended |
| | Index | 12/31/02 | 12/31/03 | 12/31/04 | 12/31/05 | 12/31/06 | 12/31/07 |
| | West Coast Bancorp | 100.0 | 142.4 | 172.6 | 182.2 | 241.6 | 132.5 |
| NASDAQ Composite | 100.0 | 150.6 | 164.4 | 167.8 | 185.1 | 204.8 |
| NASDAQ Bank Index | 100.0 | 132.6 | 150.4 | 147.4 | 167.5 | 134.7 |
14
ITEM 6.SELECTED FINANCIAL DATA
Consolidated Five Year Financial Data
The following selected consolidated five year financial data should be read in conjunction with Bancorp’s consolidated financial statements and the accompanying notes presented in this report.
| (Dollars in thousands, except per share data) | As of and For the Year ended December 31, |
| | 2007 | | 2006 | | 2005 | | 2004 | | 2003 |
| Interest income | $ | 183,190 | | | $ | 150,798 | | | $ | 112,991 | | | $ | 92,988 | | | $ | 89,678 | |
| Interest expense | | 68,470 | | | | 49,926 | | | | 26,430 | | | | 18,115 | | | | 20,639 | |
| Net interest income | | 114,720 | | | | 100,872 | | | | 86,561 | | | | 74,873 | | | | 69,039 | |
| Provision for credit losses | | 38,956 | | | | 2,733 | | | | 2,175 | | | | 2,260 | | | | 3,800 | |
| Net interest income after provision for credit losses | | 75,764 | | | | 98,139 | | | | 84,386 | | | | 72,613 | | | | 65,239 | |
| Noninterest income | | 33,498 | | | | 28,096 | | | | 23,099 | | | | 22,463 | | | | 22,046 | |
| Noninterest expense | | 85,299 | | | | 81,665 | | | | 72,634 | | | | 63,371 | | | | 58,150 | |
| Income before income taxes | | 23,963 | | | | 44,570 | | | | 34,851 | | | | 31,705 | | | | 29,135 | |
| Provision for income taxes | | 7,121 | | | | 15,310 | | | | 11,011 | | | | 9,697 | | | | 9,338 | |
| Net income | $ | 16,842 | | | $ | 29,260 | | | $ | 23,840 | | | $ | 22,008 | | | $ | 19,797 | |
| |
| Net interest income on a tax equivalent basis | $ | 116,361 | | | $ | 102,432 | | | $ | 88,025 | | | $ | 76,526 | | | $ | 70,793 | |
| |
| Per share data: | | | | | | | | | | | | | | | | | | | |
| Basic earnings per share | $ | 1.09 | | | $ | 1.95 | | | $ | 1.63 | | | $ | 1.48 | | | $ | 1.31 | |
| Diluted earnings per share | $ | 1.05 | | | $ | 1.86 | | | $ | 1.55 | | | $ | 1.42 | | | $ | 1.26 | |
| Cash dividends | $ | 0.51 | | | $ | 0.45 | | | $ | 0.40 | | | $ | 0.36 | | | $ | 0.32 | |
| Period end book value | $ | 13.35 | | | $ | 12.89 | | | $ | 10.69 | | | $ | 9.94 | | | $ | 9.29 | |
| Weighted average common shares outstanding | | 15,507 | | | | 15,038 | | | | 14,658 | | | | 14,849 | | | | 15,077 | |
| Weighted average diluted shares outstanding | | 16,045 | | | | 15,730 | | | | 15,344 | | | | 15,526 | | | | 15,674 | |
| |
| Total assets | $ | 2,646,614 | | | $ | 2,465,372 | | | $ | 1,997,138 | | | $ | 1,790,919 | | | $ | 1,662,882 | |
| Total deposits | $ | 2,094,832 | | | $ | 2,006,352 | | | $ | 1,649,462 | | | $ | 1,472,709 | | | $ | 1,404,859 | |
| Total long-term borrowings | $ | 83,100 | | | $ | 57,991 | | | $ | 83,100 | | | $ | 85,500 | | | $ | 78,000 | |
| Total loans, net | $ | 2,125,752 | | | $ | 1,924,673 | | | $ | 1,533,985 | | | $ | 1,409,023 | | | $ | 1,202,750 | |
| Stockholders’ equity | $ | 208,241 | | | $ | 200,882 | | | $ | 157,123 | | | $ | 147,854 | | | $ | 140,053 | |
| Financial ratios: | | | | | | | | | | | | | | | | | | | |
| Return on average assets | | 0.66 | % | | | 1.33 | % | | | 1.28 | % | | | 1.28 | % | | | 1.24 | % |
| Return on average equity | | 7.93 | % | | | 16.47 | % | | | 15.76 | % | | | 15.45 | % | | | 14.52 | % |
| Average equity to average assets | | 8.37 | % | | | 8.10 | % | | | 8.09 | % | | | 8.29 | % | | | 8.57 | % |
| Dividend payout ratio | | 47.51 | % | | | 24.19 | % | | | 24.50 | % | | | 25.00 | % | | | 25.73 | % |
| Efficiency ratio (1) | | 56.90 | % | | | 62.23 | % | | | 64.19 | % | | | 64.01 | % | | | 62.64 | % |
| Net loans to assets | | 80.33 | % | | | 78.07 | % | | | 76.81 | % | | | 78.68 | % | | | 72.33 | % |
| Average yields earned (2) | | 7.72 | % | | | 7.37 | % | | | 6.49 | % | | | 5.84 | % | | | 6.08 | % |
| Average rates paid | | 3.76 | % | | | 3.27 | % | | | 2.06 | % | | | 1.50 | % | | | 1.78 | % |
| Net interest spread (2) | | 3.96 | % | | | 4.10 | % | | | 4.43 | % | | | 4.34 | % | | | 4.29 | % |
| Net interest margin (2) | | 4.86 | % | | | 4.96 | % | | | 4.99 | % | | | 4.72 | % | | | 4.70 | % |
| Nonperforming assets to total assets (3) | | 1.12 | % | | | 0.06 | % | | | 0.05 | % | | | 0.12 | % | | | 0.27 | % |
| Allowance for loan losses to total loans | | 2.16 | % | | | 1.18 | % | | | 1.32 | % | | | 1.33 | % | | | 1.49 | % |
| Allowance for credit losses to total loans | | 2.53 | % | | | 1.18 | % | | | 1.32 | % | | | 1.33 | % | | | 1.49 | % |
| Net loan charge-offs to average loans | | 0.34 | % | | | 0.06 | % | | | 0.05 | % | | | 0.11 | % | | | 0.21 | % |
| Allowance for loan loss to | | | | | | | | | | | | | | | | | | | |
| nonperforming assets (3) | | 177.53 | % | | | 1567.61 | % | | | 1881.86 | % | | | 867.48 | % | | | 411.08 | % |
| (1) | | The efficiency ratio has been computed as noninterest expense divided by the sum of net interest income on a tax equivalent basis and noninterest income excluding gains/losses on sales of securities. |
| (2) | | Interest earned on nontaxable securities has been computed on a 35% tax equivalent basis. |
| (3) | | Nonperforming assets include litigation settlement property in certain periods. |
15
Consolidated Quarterly Financial Data
The following table presents selected consolidated quarterly financial data for each quarter of 2007 and 2006. The financial information contained in this table reflects all adjustments, which, in the opinion of management, are necessary for a fair presentation of the results of the interim periods.
| (Dollars in thousands, except per share data) | 2007 Quarters ended (unaudited) |
| | Dec. 31, | | Sept. 30, | | June 30, | | March 31, |
| Interest income | $ | 45,528 | | | $ | 47,742 | | | $ | 46,148 | | | $ | 43,772 | |
| Interest expense | | 17,253 | | | | 17,905 | | | | 17,424 | | | | 15,888 | |
| Net interest income | | 28,275 | | | | 29,837 | | | | 28,724 | | | | 27,884 | |
| Provision for credit losses | | 29,956 | | | | 2,700 | | | | 3,500 | | | | 2,800 | |
| Net interest income (expense) | | | | | | | | | | | | | | | |
| after provision for credit losses | | (1,681 | ) | | | 27,137 | | | | 25,224 | | | | 25,084 | |
| Noninterest income | | 8,615 | | | | 8,145 | | | | 8,705 | | | | 8,033 | |
| Noninterest expense | | 20,160 | | | | 22,602 | | | | 21,500 | | | | 21,037 | |
| Income (loss) before income taxes | | (13,226 | ) | | | 12,680 | | | | 12,429 | | | | 12,080 | |
| Provision (benefit) for income taxes | | (5,739 | ) | | | 4,350 | | | | 4,294 | | | | 4,216 | |
| Net (loss) income | $ | (7,487 | ) | | $ | 8,330 | | | $ | 8,135 | | | $ | 7,864 | |
| |
| Basic (loss) earnings per share | $ | (0.48 | ) | | $ | 0.54 | | | $ | 0.52 | | | $ | 0.51 | |
| Diluted (loss) earnings per share | $ | (0.48 | ) | | $ | 0.52 | | | $ | 0.50 | | | $ | 0.49 | |
| |
| Return on average assets (1) | | -1.14 | % | | | 1.29 | % | | | 1.29 | % | | | 1.31 | % |
| Return on average equity (1) | | -13.51 | % | | | 15.33 | % | | | 15.51 | % | | | 15.68 | % |
| |
| (Dollars in thousands, except per share data) | 2006 Quarters ended (unaudited) |
| | Dec. 31, | | Sept. 30, | | June 30, | | March 31, |
| Interest income | $ | 42,302 | | | $ | 40,549 | | | $ | 35,599 | | | $ | 32,348 | |
| Interest expense | | 15,461 | | | | 14,254 | | | | 11,050 | | | | 9,161 | |
| Net interest income | | 26,841 | | | | 26,295 | | | | 24,549 | | | | 23,187 | |
| Provision for credit losses | | 1,200 | | | | 625 | | | | 500 | | | | 408 | |
| Net interest income after provision for credit losses | | 25,641 | | | | 25,670 | | | | 24,049 | | | | 22,779 | |
| Noninterest income | | 7,506 | | | | 7,468 | | | | 7,090 | | | | 6,032 | |
| Noninterest expense | | 21,379 | | | | 21,138 | | | | 20,571 | | | | 18,577 | |
| Income before income taxes | | 11,768 | | | | 12,000 | | | | 10,568 | | | | 10,234 | |
| Provision for income taxes | | 4,068 | | | | 4,131 | | | | 3,624 | | | | 3,487 | |
| Net income | $ | 7,700 | | | $ | 7,869 | | | $ | 6,944 | | | $ | 6,747 | |
| |
| Basic earnings per share | $ | 0.51 | | | $ | 0.51 | | | $ | 0.47 | | | $ | 0.46 | |
| Diluted earnings per share | $ | 0.48 | | | $ | 0.49 | | | $ | 0.45 | | | $ | 0.44 | |
| |
| Return on average assets (1) | | 1.29 | % | | | 1.35 | % | | | 1.33 | % | | | 1.37 | % |
| Return on average equity (1) | | 15.54 | % | | | 16.56 | % | | | 16.81 | % | | | 17.18 | % |
| (1) | | Ratios have been annualized. |
16
ITEM 7.MANAGEMENT’S DISCUSSION AND ANALYSIS OF FINANCIAL CONDITION ANDRESULTSOF OPERATIONS
The following discussion should be read in conjunction with the audited consolidated financial statements and related notes to those statements as of December 31, 2007 and 2006, and for each of the three years in the period ended December 31, 2007, of West Coast Bancorp and its subsidiaries that appear under the heading “Financial Statements and Supplementary Data” of this report. References to “we,” “our” or “us” refer to West Coast Bancorp and its subsidiaries.
Forward Looking Statement Disclosure
Statements in this Annual Report regarding future events or performance are “forward-looking statements” within the meaning of the Private Securities Litigation Reform Act of 1995 (the “PSLRA”) and are made pursuant to the safe harbors of the PSLRA. Actual results of West Coast Bancorp (“Bancorp” or the “Company”) could be quite different from those expressed or implied by the forward-looking statements. Any statements containing the words “could,” “may,” “should,” “plan,” “believes,” “anticipates,” “estimates,” “predicts,” “expects,” “projections,” “potential,” “continue,” or words of similar import, constitute “forward-looking statements,” as do any other statements that expressly or implicitly predict future events, results, or performance. Factors that could cause results to differ from results expressed or implied by our forward-looking statements include, among others, risks discussed in the text of this Annual Report as well as the following specific items:
- General economic conditions, whether national or regional, and conditions in the real estate markets, that could affect the demand for loans, lead to declining credit quality and increased loan losses, and negatively affect the value and salability of the real estate that is the collateral for many of our loans or that we may own directly;
- Competitive factors, including increased competition with community, regional and national financial institutions, that may lead to pricing pressures that reduce yields Bancorp achieves on loans and increase rates Bancorp pays on deposits, loss of Bancorp’s most valued customers, defection of key employees or groups of employees, or other losses;
- Increasing or decreasing interest rate environments, including the slope and level of, as well as changes in, the yield curve, that could lead to decreases in net interest margin, lower net interest and fee income, including lower gains on sales of loans, and changes in the value of Bancorp’s investment securities;
- Changing business or regulatory conditions, or new legislation, affecting the financial services industry that could lead to increased costs, changes in the competitive balance among financial institutions, or revisions to our strategic focus and product mix; and
- Changes or failures in technology or third party vendor relationships in important revenue production or service areas, or increases in required investments in technology that could reduce our revenues, increase our costs, or lead to disruptions in our business.
Furthermore, forward-looking statements are subject to risks and uncertainties related to the Company’s ability to, among other things, attract and retain key personnel; close loans in the pipeline; generate loan and deposit balances at projected spreads; sustain fee generation and gains on sales of loans; maintain asset quality; control the level of net loan charge-offs; adapt to changing customer deposit, investment and lending behaviors; generate retail investments; control expense growth; monitor and manage the Company’s financial reporting, operating and disclosure control environments, and other matters.
Readers are cautioned not to place undue reliance on our forward-looking statements, which reflect management’s analysis only as of the date of the statements. Bancorp does not intend to publicly revise or update forward-looking statements to reflect events or circumstances that arise after the date of this report.
Readers should carefully review all disclosures we file from time to time with the Securities and Exchange Commission (“SEC”).
17
Critical Accounting Policies
We have identified our most critical accounting policy to be that related to the allowance for credit losses, which is comprised of two components: the allowance for loan losses and the reserve for unfunded commitments. The allowance for loan losses is a reserve that relates to outstanding loan balances, while the reserve for unfunded commitments relates to that portion of total loan commitments that have not yet funded as of the date the reserve is calculated.
Our methodology for establishing the allowance for credit losses incorporates a variety of risk considerations, both quantitative and qualitative, that management believes are appropriate at each reporting date. Quantitative factors include our historical loss experience, delinquency and charge-off trends, estimates of, and changes in, collateral values, changes in risk ratings on loans and other factors. Qualitative factors include the general economic environment in our markets and, in particular, the state of the real estate market and specific relevant industries. Other qualitative factors that are considered in our methodology include, size and complexity of individual loans in relation to the lending officer’s background and experience levels, loan structure, extent and nature of waivers of existing loan policies, and pace of loan portfolio growth. As we add new products, increase the complexity of the loan portfolio, and expand our geographic coverage, we intend to enhance and adapt our methodology to keep pace with the size and complexity of the loan portfolio. Changes in any of the above factors could have a significant effect on the calculation of the allowance for credit losses in any given period. Management believes that our systematic methodology continues to be appropriate given our size and level of complexity. This discussion should be read in conjunction with our consolidated financial statements and related notes included elsewhere in this report, and the section “Allowance for Credit Losses and Net Loan Charge-offs” below.
As of September 30, 2007, we reclassified $1.0 million of the allowance for loan losses to a reserve for unfunded loan commitments. As a result, we are reporting our allowance for credit losses in this report and elsewhere for ease of comparison to prior periods and to give readers information about our entire loan portfolio, including our unfunded commitments. The reclassification of a portion of our allowance to a separate reserve had no impact on our provision for loan losses expense. Expense in the fourth quarter of 2007 related to provision for losses associated with unfunded commitments was recorded in the provision for credit losses in the income statement, and this practice will continue in the future.
The reserve for unfunded commitments was established in the third quarter of 2007 to recognize the loan and related unfunded commitment growth that had occurred in our loan portfolio. The reserve for unfunded commitments will be evaluated on a quarterly basis and appropriate increases or decreases will be reflected in the income statement. At December 31, 2007, our reserve for unfunded commitments was $8.0 million, with a significant portion of that related to unfunded commitments in our two-step loan portfolio. See “Financial Overview” below.
18
Developments and Financial Overview
Developments.Subsequent to year end 2007 we made two adjustments that are reflected in the financial results for the fourth quarter and full year 2007. Including these adjustments, our net income for full year 2007 was $16.8 million or $1.05 per diluted share, as compared to $16.7 million or $1.04 per diluted share disclosed in our earnings release dated January 15, 2008. Full year return on equity increased to 7.93% from the previously reported 7.86%. The two adjustments include the reversal of an accrued liability of $1.4 million pretax relating to a legal matter that ended in a settlement following a jury verdict in our favor and a charge of $1.1 million pretax to cover restitution to certain borrowers arising out of our failure to comply with certain loan disclosure requirements. The $1.1 million in restitution was recorded as a decrease to interest and fees on loans in the consolidated statements of income for the year ended December 31, 2007, with a corresponding accrued liability recorded in other liabilities on the consolidated balance sheet as of December 31, 2007.
Moreover, subsequent to December 31, 2007, the Bank amended its loan policy regarding the timing of placing certain segments of the Bank’s real estate construction loan portfolio on nonaccrual status, including, as examples, loans that are over 30 days past due and construction is incomplete, loans that are 60 days past due and construction is completed, and all loans made to borrowers that have not commenced construction. The amendments to our loan policy will apply to the entire construction loan portfolio; however, primarily the two-step loan portfolio is affected by the amended loan policy. For more information, see the subheading “Real Estate Construction” under “Loan Portfolio” and “Loan Portfolio” generally below.
Had the amended loan policy been in effect at December 31, 2007, nonaccrual two-step loans would have increased by $28.9 million, while delinquent 30-89 days past due two-step loans would have decreased by $24.4 million to $12.4 million. The adoption of the amendments to the loan policy would not have had a material effect on the December 31, 2007 financial statements. Under the amended loan policy, we will cease interest accruals on certain segments of the construction loan portfolio earlier and reverse previously accrued interest sooner than we would have under the previous loan policy. We do not believe the amendments to our loan policy materially affect the required allowance for credit losses for the two-step portfolio at December 31, 2007 or the provision for credit losses associated with the two-step portfolio for prior periods.
Overview forYears Ended December 31, 2007, 2006 and 2005.Our net income for the full year 2007 was $16.8 million, as compared to $29.3 million in 2006 and $23.8 million in 2005. Diluted earnings per share for the years ended December 31, 2007, 2006, and 2005 were $1.05, $1.86, and $1.55, respectively, while return on average equity decreased to 7.9% in 2007 from 16.5% in 2006 and 15.8% in 2005. The decrease in net income and decline in our return on equity was primarily due to a $30.0 million pre-tax provision for credit losses recorded in the fourth quarter of 2007, of which $27.8 million was associated with our two-step residential construction loan portfolio(the “two-step loan portfolio”). The provision for credit losses for the year ended December 31, 2007 was $38.9 million compared to $2.7 million in 2006 and $2.2 million in 2005.
Our financial objectives are primarily focused on diluted earnings per share growth of 10% or higher and return on average equity, tangible of 15% or higher. For the first time in three years, we failed to achieve our financial objectives in 2007, as our diluted earnings per share fell by 44% and our return on equity, tangible was 8.7%. Return on average equity, tangible is a non-GAAP financial measure used by the Company that eliminates the effects of merger-related intangible assets from the return on equity calculation. We calculate return on average equity, tangible by dividing net income less amortization on intangibles, after tax, by average shareholders’ equity less average intangible assets.
The following table presents return on average equity and return on average equity, tangible, for the years ended December 31, 2007, 2006 and 2005, together with the components of our calculation of return on average equity, tangible.
| | (Dollars in thousands) | | For the years ended December 31, |
| | | 2007 | | 2006 | | 2005 |
| | Net income | | $ | 16,842 | | | $ | 29,260 | | | $ | 23,840 | |
| Less: intangible asset amortization, net of tax (1) | | | 351 | | | | 283 | | | | 220 | |
| Net income, tangible | | $ | 17,193 | | | $ | 29,543 | | | $ | 24,060 | |
| |
| Average shareholders' equity | | $ | 212,349 | | | $ | 177,648 | | | $ | 151,263 | |
| Less: average intangibles | | | (14,740 | ) | | | (8,039 | ) | | | (346 | ) |
| Average shareholders' equity, tangible | | $ | 197,609 | | | $ | 169,609 | | | $ | 150,917 | |
| (1) Federal income tax provision applied at 35%. | | | | | | | | | | | | |
| |
| Return on average equity | | | 7.9 | % | | | 16.5 | % | | | 15.8 | % |
| Return on average equity, tangible | | | 8.7 | % | | | 17.4 | % | | | 15.9 | % |
19
Management uses return on equity, tangible internally and has disclosed it to investors based on its belief that the figure is commonly used in the industry and makes it easier to compare the Company's performance to other financial institutions that do not have merger-related intangible assets.
To sustain future growth and accomplish our financial objectives, we have defined five strategies:
- Focus on profitable customer segments;
- Exploit local market opportunities;
- Design and support value added products;
- Expand branch distribution; and
- Maintain community focus and high employee and customer satisfaction.
Our strategies are designed to direct our tactical investment decisions to support our financial objectives. To produce net interest income, the key component of our revenues, and consistent earnings growth over the long-term, we must generate loan and deposit growth at acceptable interest rate spreads within our markets of operation. To generate and grow loans and deposits, we believe that we must focus on a number of areas including, but not limited to, the quality and breadth of our branch network, our sales practices, customer and employee satisfaction and retention, technology, product innovation, vendor relationships, and providing competitive rates. Net interest income is sensitive to our ability to attract and retain lending officers and close loans in the pipeline, so any failure in that regard could negatively affect our ability to meet our goals. In addition, a decline in general economic conditions, as well as competitive pricing pressures on both loans and deposits, could limit our ability to generate net interest income.
We also consider non-interest income important to our continued financial success. Fee income generation is primarily related to our loan and deposit operations, such as deposit service charges, fees from payment system products (interchange, merchant services, ACH, check and credit card), and fees on sales of financial products, including residential mortgages and trust and investment products. Many of the products and services that generate fee income are offered through relationships with third party providers, thus we are dependent on successful continuity of those relationships to continue this important source of income.
While we review and manage all customer segments, we have focused increased efforts on four targeted areas: 1) high value consumers (including the mature market), 2) smaller businesses with credit needs under $250,000, 3) medium-sized commercial businesses with credit needs over $250,000 up to $20 million and 4) commercial real estate and construction-related businesses. These efforts have resulted in material growth in our commercial, construction and home equity loan portfolios as well as core deposits over the last two years.
To support growth in targeted customer segments, we have added 23 branch locations, or 37% of total current branches, since January 1, 2000, including four branches acquired in our acquisition of Mid-Valley Bank that closed in June 2006. Our financial statements and related disclosures include the financial condition and results of operations of Mid-Valley since its acquisition. The results produced by our new branches have met our expectations.With all of ournew and existing branches, we strive to maintain a local community-based management philosophy. We will continue to emphasizehiring local branch and lending personnel with strong ties to the specific local communities we enter and seek to serve and with expertise in growing and servicing targeted business and consumer customer segments.
iDeposit is an example of new products we have introduced over the last few years. iDeposit is a remote capture product which allows customers to deposit their checks electronically from their office. Through 2007 the Company has over 500 remote capture terminals serving customers. In addition, the Company offered new products such as payroll cards, upgrades to our electronic bill pay product, electronic statement delivery, check images online, and our automated wire transfer program. These are just a sample of the new and upgraded products that have been introduced over the past several years.
To limit the risks associated with doing business and growing revenues,we haveput in place numerous policies, processes and controls. We rely on these controls to produce information for management and the public that is accurate and complete and to help us to protect our assets. A failure or failures in our control environment could have an adverse effect on our results of operations or financial condition.
20
Income Statement Overview
Net Interest Income. The following table displays information on net interest income, average yields earned and rates paid, as well as net interest spread and margin information on a tax equivalent basis for the periods indicated. This information can be used to follow the changes in our yields and rates and the changes in our earning assets and liabilities over the past three years:
| | (Dollars in thousands) | | Year Ended December 31, | | Increase (Decrease) | | Change |
| | | 2007 | | 2006 | | 2005 | | 07-06 | | 06-05 | | 07-06 | | 06-05 |
| Interest and fee income (1) | | $ | 184,831 | | | $ | 152,358 | | | $ | 114,456 | | | $ | 32,473 | | | $ | 37,902 | | | 21.31 | % | | 33.11 | % |
| | Interest expense | | $ | 68,470 | | | $ | 49,926 | | | $ | 26,430 | | | $ | 18,544 | | | $ | 23,496 | | | 37.14 | % | | 88.90 | % |
| Net interest income (1) | | $ | 116,361 | | | $ | 102,432 | | | $ | 88,026 | | | $ | 13,929 | | | $ | 14,406 | | | 13.60 | % | | 16.37 | % |
| |
| Average interest earning assets | | $ | 2,394,958 | | | $ | 2,066,217 | | | $ | 1,764,209 | | | $ | 328,741 | | | $ | 302,008 | | | 15.91 | % | | 17.12 | % |
| Average interest bearing liabilities | | $ | 1,821,299 | | | $ | 1,525,683 | | | $ | 1,281,441 | | | $ | 295,616 | | | $ | 244,242 | | | 19.38 | % | | 19.06 | % |
| Average interest earning assets/ | | | | | | | | | | | | | | | | | | | | | | | | | | |
| Average interest bearing liabilities | | | 131.50 | % | | | 135.43 | % | | | 137.67 | % | | | -3.93 | % | | | -2.24 | % | | | | | | |
| Average yield earned (1) | | | 7.72 | % | | | 7.37 | % | | | 6.49 | % | | | 0.35 | % | | | 0.88 | % | | | | | | |
| Average rate paid | | | 3.76 | % | | | 3.27 | % | | | 2.06 | % | | | 0.49 | % | | | 1.21 | % | | | | | | |
| Net interest spread (1) | | | 3.96 | % | | | 4.10 | % | | | 4.43 | % | | | -0.14 | % | | | -0.33 | % | | | | | | |
| Net interest margin (1) | | | 4.86 | % | | | 4.96 | % | | | 4.99 | % | | | -0.10 | % | | | -0.03 | % | | | | | | |
| (1) | | Interest earned on nontaxable securities has been computed on a 35% tax equivalent basis. |
Net interest income on a tax equivalent basis totaled $116.4 million for the year ended December 31, 2007, an increase of $13.9 million, or 13.6%, from $102.4 million for 2006, which in turn was up $14.4 million from full year 2005. The increase in net interest income from 2006 to 2007 was mainly due to increased loan volumes. Average total loans grew by $349.2 million, or 20.0%, in 2007 compared to 2006. The net interest margin decreased from 4.96% in 2006 to 4.86% in 2007 with the main factors being interest reversals related to nonaccrual loans in the two-step loan portfolio, interest restitution costs for failure to comply with certain loan disclosure rules and a lag in the decline of deposit rates relative to the decline in asset yields in the second half of 2007 which was caused by lower market interest rates.
During 2007, we generated an increase of $13.0 million, or 3%, in average demand deposits over 2006 due in part to the continued emphasis on business clients along with free checking products. Average savings, money market balances and time deposits increased $196 million, or 18%, over 2006 as consumers shifted funds toward higher rate products.
Changing interest rate environments, including but not limited to the shape, change in and level of the yield curve, could lead to lower net interest income, and competitive pricing pressure could lead to increased deposit costs and lower loan yields and/or fees.
Loans transitioning into nonaccrual status require interest income reversals, consequently decreasing interest income as collection of principal and accrued interest becomes uncertain. We expect an increased level of interest reversals in 2008 associated with borrowers defaulting on loans in the two-step loan portfolio (“two-step loans”.) We also expect declining construction loan balances, and lower loan fee revenues due to the closing of the two-step loan program. The closure of the two-step loan program, along with interest reversals, cost of holding other real estate owned (“OREO”) properties, and the significant reduction in market interest rates in January 2008, are projected to further compress our net interest margin in 2008 compared to 2007.
21
Average Balances and Average Rates Earned and Paid. The following table sets forth, for the periods indicated, information with regard to (1) average balances of assets and liabilities, (2) the total dollar amounts of interest income on interest earning assets and interest expense on interest bearing liabilities, (3) resulting yields and rates, (4) net interest income and (5) net interest spread. Nonaccrual loans have been included in the tables as loans carrying a zero yield. Loan fees are recognized as income using the interest method over the life of the loan.
| | | Year Ended December 31, |
| (Dollars in thousands) | | 2007 | | 2006 | | 2005 |
| | | Average | | | | | | Average | | | | | | Average | | | | |
| | | Outstanding | | Interest | | Yield/ | | Outstanding | | Interest | | Yield/ | | Outstanding | | Interest | | Yield/ |
| | | Balance | | Earned/ Paid | | Rate (1) | | Balance | | Earned/ Paid | | Rate (1) | | Balance | | Earned/ Paid | | Rate (1) |
| ASSETS: | | | | | | | | | | | | | | | | | | | | | | | | | | | | | | |
| Interest earning balances | | | | | | | | | | | | | | | | | | | | | | | | | | | | | | |
| due from banks | | $ | 1,217 | | | $ | 51 | | 4.19 | % | | $ | 2,118 | | | $ | 109 | | 5.15 | % | | $ | 2,375 | | | $ | 88 | | 3.71 | % |
| Federal funds sold | | | 10,813 | | | | 513 | | 4.74 | % | | | 15,139 | | | | 759 | | 5.01 | % | | | 16,713 | | | | 564 | | 3.37 | % |
| Taxable securities | | | 207,782 | | | | 10,398 | | 5.00 | % | | | 228,434 | | | | 10,840 | | 4.75 | % | | | 197,098 | | | | 8,201 | | 4.16 | % |
| Nontaxable securities(2) | | | 76,799 | | | | 4,689 | | 6.11 | % | | | 70,324 | | | | 4,457 | | 6.34 | % | | | 65,036 | | | | 4,183 | | 6.43 | % |
| Loans, including fees(3) | | | 2,098,347 | | | | 169,180 | | 8.06 | % | | | 1,750,202 | | | | 136,193 | | 7.78 | % | | | 1,482,987 | | | | 101,419 | | 6.84 | % |
| Total interest earning assets | | | 2,394,958 | | | | 184,831 | | 7.72 | % | | | 2,066,217 | | | | 152,358 | | 7.37 | % | | | 1,764,209 | | | | 114,455 | | 6.49 | % |
| |
| Allowance for loan losses | | | (26,243 | ) | | | | | | | | | (21,495 | ) | | | | | | | | | (19,517 | ) | | | | | | |
| Premises and equipment | | | 32,598 | | | | | | | | | | 30,300 | | | | | | | | | | 29,286 | | | | | | | |
| Other assets | | | 136,405 | | | | | | | | | | 118,607 | | | | | | | | | | 95,782 | | | | | | | |
| Total assets | | $ | 2,537,718 | | | | | | | | | $ | 2,193,629 | | | | | | | | | $ | 1,869,760 | | | | | | | |
| |
| LIABILITIES AND | | | | | | | | | | | | | | | | | | | | | | | | | | | | | | |
| STOCKHOLDERS' EQUITY: | | | | | | | | | | | | | | | | | | | | | | | | | | | | | | |
| Interest bearing demand | | $ | 278,734 | | | $ | 3,436 | | 1.23 | % | | $ | 259,053 | | | $ | 2,224 | | 0.86 | % | | $ | 246,237 | | | $ | 1,004 | | 0.41 | % |
| Savings | | | 72,787 | | | | 569 | | 0.78 | % | | | 80,029 | | | | 459 | | 0.57 | % | | | 87,090 | | | | 240 | | 0.28 | % |
| Money market | | | 665,037 | | | | 24,953 | | 3.75 | % | | | 558,734 | | | | 19,112 | | 3.42 | % | | | 455,727 | | | | 8,922 | | 1.96 | % |
| Time deposits | | | 554,263 | | | | 26,078 | | 4.70 | % | | | 457,077 | | | | 19,132 | | 4.19 | % | | | 362,035 | | | | 10,331 | | 2.85 | % |
| Short-term borrowings | | | 136,731 | | | | 7,057 | | 5.16 | % | | | 66,139 | | | | 3,356 | | 5.07 | % | | | 18,512 | | | | 543 | | 2.93 | % |
| Long-term borrowings (4) | | | 113,747 | | | | 6,377 | | 5.61 | % | | | 104,651 | | | | 5,643 | | 5.39 | % | | | 111,840 | | | | 5,390 | | 4.82 | % |
| Total interest bearing | | | | | | | | | | | | | | | | | | | | | | | | | | | | | | |
| liabilities | | | 1,821,299 | | | | 68,470 | | 3.76 | % | | | 1,525,683 | | | | 49,926 | | 3.27 | % | | | 1,281,441 | | | | 26,430 | | 2.06 | % |
| Demand deposits | | | 479,311 | | | | | | | | | | 466,282 | | | | | | | | | | 421,766 | | | | | | | |
| Other liabilities | | | 24,759 | | | | | | | | | | 24,016 | | | | | | | | | | 15,290 | | | | | | | |
| Total liabilities | | | 2,325,369 | | | | | | | | | | 2,015,981 | | | | | | | | | | 1,718,497 | | | | | | | |
| Stockholders' equity | | | 212,349 | | | | | | | | | | 177,648 | | | | | | | | | | 151,263 | | | | | | | |
| Total liabilities and | | | | | | | | | | | | | | | | | | | | | | | | | | | | | | |
| stockholders' equity | | $ | 2,537,718 | | | | | | | | | $ | 2,193,629 | | | | | | | | | $ | 1,869,760 | | | | | | | |
| Net interest income | | | | | | $ | 116,361 | | | | | | | | | $ | 102,432 | | | | | | | | | $ | 88,025 | | | |
| Net interest spread | | | | | | | | | 3.96 | % | | | | | | | | | 4.10 | % | | | | | | | | | 4.43 | % |
| |
| Net interest margin | | | | | | | | | 4.86 | % | | | | | | | | | 4.96 | % | | | | | | | | | 4.99 | % |
| (1) | | Yield/rate calculations have been based on more detailed information and therefore may not recompute exactly due to rounding. |
| (2) | | Interest earned on nontaxable securities has been computed on a 35% tax equivalent basis. The tax equivalent basis adjustment for the years ended December 31, 2007, 2006 and 2005, was $1.6 million, $1.6 million and $1.5 million, respectively. |
| (3) | | Includes balances of loans held for sale and nonaccrual loans. |
| (4) | | Includes junior subordinated debentures with average balance of $50 million for 2007 and $32 million for 2006. |
Our net interest spread declined 47 basis points from 2005 to 2007 mainly due to our earning asset yields failing to increase as quickly as the rates on our interest bearing liabilities in what was an increasing interest rate environment. However, increases in demand deposit balances as well as increases in the overall level of interest rates in 2005 and early 2006 helped to limit the compression in the net interest margin despite a declining net interest spread. Non-interest bearing demand deposits contribute more to the net interest margin in higher rate environments as these low-cost funds are invested in higher earning assets. The strong growth in construction loan balances caused our average short-term borrowings to more than double from 2006.
22
The fourth quarter 2007 net interest margin of 4.62% compressed from 4.94% in the third quarter as a result of a declining rate environment, interest reversals on two-step loans and interest restitution costs for failure to comply with certain loan disclosure rules. As noted above, with the significant reduction in short-term market interest rates in the early part of 2008 and other factors, we expect the net interest margin to further contract in 2008.
Net Interest Income – Changes Due to Rate and Volume.The following table sets forth the dollar amounts of the changes in consolidated net interest income attributable to changes in volume and to changes in interest rates. Changes not due solely to volume or rate and changes due to new product lines, if any, are allocated to volume.
| (Dollars in thousands) | | Year Ended December 31, |
| | | 2007 compared to 2006 | | 2006 compared to 2005 |
| |
| | | Increase (Decrease) due to: | | Total Increase | | Increase (Decrease) due to: | | Total Increase |
| | | Volume | | Yield/Rate | | (Decrease) | | Volume | | Yield/Rate | | (Decrease) |
| Interest income: | | | | | | | | | | | | | | | | | | | | | | | |
| Interest earning balances due | | | | | | | | | | | | | | | | | | | | | | | |
| from banks | | $ | (38 | ) | | $ | (20 | ) | | $ | (58 | ) | | $ | (13 | ) | | $ | 34 | | | $ | 21 |
| Federal funds sold | | | (205 | ) | | | (41 | ) | | | (246 | ) | | | (79 | ) | | | 274 | | | | 195 |
| Investment security income: | | | | | | | | | | | | | | | | | | | | | | | |
| Interest on taxable securities | | | (1,132 | ) | | | 690 | | | | (442 | ) | | | 1,487 | | | | 1,152 | | | | 2,639 |
| Interest on nontaxable securities (1) | | | 395 | | | | (163 | ) | | | 232 | | | | 335 | | | | (61 | ) | | | 274 |
| Loans, including fees on loans | | | 30,741 | | | | 2,246 | | | | 32,987 | | | | 20,793 | | | | 13,981 | | | | 34,774 |
| Total interest income (1) | | | 29,761 | | | | 2,712 | | | | 32,473 | | | | 22,523 | | | | 15,380 | | | | 37,903 |
| |
| Interest expense: | | | | | | | | | | | | | | | | | | | | | | | |
| Savings and interest bearing demand | | | 4,196 | | | | 2,967 | | | | 7,163 | | | | 2,640 | | | | 8,989 | | | | 11,629 |
| Time deposits | | | 4,589 | | | | 2,357 | | | | 6,946 | | | | 3,978 | | | | 4,823 | | | | 8,801 |
| Short-term borrowings | | | 3,644 | | | | 57 | | | | 3,701 | | | | 2,417 | | | | 396 | | | | 2,813 |
| Long-term borrowings (2) | | | 176 | | | | 558 | | | | 734 | | | | (388 | ) | | | 641 | | | | 253 |
| Total interest expense | | | 12,605 | | | | 5,939 | | | | 18,544 | | | | 8,647 | | | | 14,849 | | | | 23,496 |
| Increase (decrease) in net interest income (1) | | $ | 17,156 | | | $ | (3,227 | ) | | $ | 13,929 | | | $ | 13,876 | | | $ | 531 | | | $ | 14,407 |
| (1) | | Tax exempt income has been adjusted to a tax-equivalent basis using a 35% tax equivalent basis. |
| (2) | | Long-term borrowings include junior subordinated debentures. |
Higher loan balances continued to be the main driver of the $13.9 million increase in net interest income in 2007 over 2006. Interest income from the investment portfolio declined in 2007 as we reduced the size of the portfolio to partially fund loan growth. Although higher earning asset yields boosted interest income attributable to rates, higher interest expense, primarily caused by higher deposit rates caused the overall impact to the change in net interest income attributable to rates to be negative $3.2 million. The cost of borrowings in 2007 increased, as short-term borrowings were used to fund the growth in residential construction loans.
Fourth quarter net interest income on a tax equivalent basis was $28.7 million, a decline from $30.2 million in the third quarter of 2007. The decline was due to a positive volume variance more than offset by a negative rate variance. The declining rate environment depressed net interest income due to the lower contribution of demand deposits and the lagging nature of deposit rates. We also experienced increased interest reversals on two-step loans becoming nonaccrual and the previously noted interest restitution costs. The combination of the projected increase in non-performing assets, which is likely to cause a higher levels of interest reversal and increased non-earning assets to be funded on our balance sheet, and deposit rates lagging the greater than expected reduction in Federal Funds rate of 1.25% in January 2008, is projected to put further pressure on our net interest margin and net interest income in 2008.
23
Provision for Credit Losses. The provision for credit losses is comprised of two components, a provision for loans losses to accommodate increases in our allowance for loan losses related to outstanding loans and a provision for unfunded commitments to address increases in our reserve for unfunded commitments. The provision for credit losses is recorded to bring the allowance for loan losses and the reserve for unfunded commitments to amounts considered appropriate by management based on factors which are described in the “Credit Management” and “Allowance for Credit Losses and Net Loan Charge-offs” sections of this report.
Provisions for credit losses of $38.9 million, $2.7 million, and $2.2 million, were recorded for the years ended December 31, 2007, 2006 and 2005, respectively, while net loan charge-offs were $7.1 million, $1.1 million, and $.7 million, over those same years. The provision for credit losses of $38.9 million increased $36.2 million in 2007 compared to 2006, largely due to the significant fourth quarter provision for credit losses of $27.8 million associated with our two-step loan portfolio as well as higher net loan charge-offs in the commercial and residential construction loan portfolios. In addition, a portion of the increase in the provision was consistent with the current credit cycle and reflected the impact of loan growth, loan mix changes, changes in the formula allowance for loan losses and a moderately unfavorable migration in our loan risk ratings outside the two-step loan portfolio. During 2007, we have had a greater proportion of our loan portfolio in construction loans than in 2006. Construction loans involve a higher inherent risk profile and are therefore allocated a higher provision for loan losses relative to most other loans in the portfolio.
On January 8, 2008, we announced a fourth quarter provision charge of $30 million, of which $27.8 million was related to the two-step loan portfolio. In estimating the amount of provision required for the two-step loan portfolio, a number of factors were considered, including, among others:
- Residential real estate market conditions in the market areas in which we have made two-step loans are deteriorating and the market for permanent take-out financing has tightened significantly. Those factors have put downward pressure on home values and updated appraisals, slowed home sales, increased the inventory of houses for sale, and increased our potential loss exposure.
- Concentrations in the two-step loan portfolio, such as concentrations by loan origination channel (ie. broker, non-broker) and collateral location, may expose us to higher losses.
- We have and will take unfinished homes into OREO. To complete unfinished homes, we may invest incremental amounts that will be difficult to recover but are necessary in order to facilitate home sales.
In establishing our fourth quarter provision for credit losses related to the two-step loan portfolio, we looked at the entire two-step loan portfolio as a homogenous pool of loans with the exception of impaired two-step loans which are measured individually. We then developed estimates for the probability of default and the loss percentage and related amount of loss given default. The estimate for defaults was based on actual trends in repayment, delinquencies, and nonperforming assets experienced over the last six months. Our percentage and amount of loss estimate was based on an analysis of changes in appraised values for completed properties between appraisals received at the time of loan origination and appraisals that have been recently updated. Analysis of current appraisals reveals a decline in appraised value to a degree that varies by market and property. At the present time, we are relying on changes in appraised values because we are not able to rely on the predictive value of actual two-step properties’ loss history. Our first loss in the two-step loan portfolio was recorded in second quarter 2007, and there were only two OREO sales as of year end 2007. Consequently, we consider our actual loss experience too limited and unseasoned to be used to establish reliable loss estimates.
In addition to the changes in appraised values, our loss estimates included expected sales costs associated with disposing properties. Furthermore, we utilized the commitment amount rather than the outstanding loan balance in projecting our potential loss exposure. Substantially all completed homes where borrowers default have drawn the commitment amount and except for unusual circumstances, we believe that unfinished homes taken into OREO will need to be completed to facilitate buyers in obtaining mortgage financing and to minimize loss exposure on properties that we sell. For more information, see section “Allowance for Credit Losses - Two-Step Loans” below.
Noninterest Income. Noninterest income remains a key focus for Bancorp, particularly revenues generated by our deposit accounts and payment systems products. Our noninterest income for the year ended December 31, 2007, was $33.5 million up $5.4 million or 19%, compared to $28.1 million in 2006, which was up 22% from $23.1 million in 2005. The full year 2005 noninterest income included a $1.3 million impairment charge recognized on a security held in our investment portfolio. Service charges on deposit accounts were up over 16% in 2007 and payment systems related revenues increased 19% or $1.3 million compared to 2006. These increases resulted from successful product introductions, new branch locations and marketing efforts that increased the number of transaction deposit accounts and improved the number of debit and credit card sales to our customer base. In 2007, gains on sales of loans were $3.4 million, or up 14% compared to 2006. This increase was driven by higher gains on sales of single family residential loans, which offset lower realized gains on sales of SBA loans. Trust and investment service revenue was up 17% or $.9 million in 2007 compared to 2006. Both transaction based sales and the volume of insurance and recurring fee accounts increased year over year for investment services, while West Coast Trust grew all core business lines as a result of new account sales and the strong stock market through most of 2007.
24
Changing interest rate environments, including the shape, change in and level of the yield curve, could lead to decreases in fee income, including lower gains on sales of loans, a key component of our noninterest income. Also, increased competition and other competitive factors could adversely affect our ability to sustain fee generation from payment systems related revenue and the sales of investment products.
Noninterest Expense. Noninterest expense was $85.3 in 2007, $81.7 million in 2006, and $72.6 million in 2005. Noninterest expense increased $3.6 million, or 4% in 2007 compared to 2006, with $2.5 million of the increase due to salaries and employee benefits expense growth. Higher salaries, additional team members and increased performance-based compensation were the key drivers of increased personnel expense.
Occupancy expense was $8.5 million in 2007 compared to $7.0 million in 2006, with the 21% increase in 2007 primarily caused by the addition of new locations. Professional fee expense decreased $.4 million in 2007 compared to 2006. Marketing expenses decreased $.4 million in 2007 due to decreased promotional expenses relating to high performance checking. Other noninterest expense decreased $2.0 million in 2007 compared to 2006 primarily due to the fourth quarter 2007 reversal of an accrued liability of $1.4 million pretax for management's estimate of loss exposure relating to a legal matter. Management determined that it was appropriate to reverse the accrued liability as a result of a favorable jury verdict and settlement of the matter.
We expect noninterest expenses associated with nonperforming two-step assets to increase materially in 2008 over 2007, including higher personnel costs, insurance and taxes, completion and repair costs, and other costs associated with property ownership, along with no further deferrals of two-step loan origination costs. Changing business conditions, increased costs in connection with retention of, or a failure to retain key employees, lower loan production volumes causing deferred loan origination costs to decline, or a failure to manage the our operating and control environments could adversely affect our ability to limit expense growth in the future.
Income Taxes. Our income tax expense for 2007 was $7.1 million, or 29.7% of income before income taxes, compared to $15.3 million or 34.4% of income before income taxes in 2006. Bancorp’s income tax expense decreased significantly in 2007 compared to 2006 due to lower pre-tax income. Taxes as a percentage of pretax income decreased in 2007 compared to 2006 due to the dollar amount of nontaxable income and tax credits increasing as a percentage of pretax net income. Income tax expense in 2005 was $11.1 million or 31.6% of income before income taxes. In 2005, the Company recorded the impact of a state of Oregon corporate income tax credit of $.3 million. Our effective tax rate remains lower than the statutory tax rate due to our nontaxable income generated from investments in bank owned life insurance, tax-exempt municipal bonds, business energy tax credits and low income housing credits. We continue to evaluate strategies to manage our income tax expense on an on-going basis, including additional investments in tax credits or other non-taxable income.
Balance Sheet Overview
Period end total assets increased 7% to $2.6 billion as of December 31, 2007, from $2.5 billion at December 31, 2006. Period end loans grew by 12% or $225 million since December 31, 2006, while deposits increased 4% or $88 million in the same period. Our balance sheet management efforts are focused on growth in targeted areas that support our corporate objectives and include:
- Small business and middle market commercial lending;
- Commercial, commercial real estate and construction lending;
- Home equity lending; and
- Core deposit production.
Over the past two years we generated strong growth in commercial, construction, and mortgage loan categories as a result of our investments in new products, branches, and most importantly people with experience in the local markets in which we are operating. In order to fund that growth, we put emphasis on launching depository services to support the transaction needs for business customers with a need to manage their cash and deposit balances. The increase in and retention of low cost demand deposit balances can also be attributed to the continued emphasis on our free checking products for both the business and consumer segments. Additionally, customer demand deposit balances and the attractiveness of interest bearing deposit products, such as money market and time deposit products will also be influenced by the level and shape of the yield curve. This in turn influences whether we pursue time deposits or other funding sources on a short term basis.
We anticipate real estate construction loan balances to materially contract in 2008 due to discontinuance of the two-step loan program and slowing demand for borrowings by builders and developers. As a result, we anticipate slower overall asset growth and total loan balances may be lower at the end of 2008 when compared to year end 2007. Our ability to achieve loan and deposit growth in the future will be dependent on many factors, including the effects of competition, health of the real estate market, economic conditions in our markets, retention of key personnel and valued customers, and our ability to close loans in the pipeline.
25
Investment Portfolio
The following table shows the amortized cost and fair value of Bancorp’s investment portfolio. At December 31, 2007, Bancorp had no securities classified as held to maturity.
| | (Dollars in thousands) | | 2007 | | 2006 |
| | | | Amortized | | | | Amortized | | |
| Available for sale | | Cost | | Fair value | | Cost | | Fair value |
| U.S. Treasury securities | | $ | 200 | | $ | 207 | | $ | - | | $ | - |
| U.S. Government Agency securities | | | 60,554 | | | 61,557 | | | 125,428 | | | 125,455 |
| Obligations of state and political subdivisions | | | 85,876 | | | 86,106 | | | 75,670 | | | 75,873 |
| Other securities | | | 123,509 | | | 121,555 | | | 128,044 | | | 127,324 |
| Total | | $ | 270,139 | | $ | 269,425 | | $ | 329,142 | | $ | 328,652 |
Bancorp decreased its investment portfolio by $59 million, or 18%, from December 31, 2006, to December 31, 2007 to fund loan growth during 2007. At December 31, 2007, the net unrealized loss on the investment portfolio was $.7 million representing .26% of the total portfolio compared to .15% at year end 2006. Bancorp regularly reviews its investment portfolio to determine whether any of its securities are other than temporarily impaired. In addition to accounting and regulatory guidance, in determining whether a security is other-than temporarily impaired, Bancorp periodically considers the duration and amount of each unrealized loss, the financial condition of the issuer and the prospects for a change in market value within a reasonable period of time.
The following table summarizes the contractual maturities and weighted average yields on Bancorp’s investment securities.
| | | | | | | After | | | | After | | | | | | | | | | |
| (Dollars in thousands) | | One year | | | | One through | | | | Five through | | | | Due after | | | | | | |
| | | or less | | Yield | | five years | | Yield | | ten years | | Yield | | ten years | | Yield | | Total | | Yield |
| U.S. Treasury securities | | $ | - | | - | | | $ | 207 | | 4.51 | % | | $ | - | | - | | | $ | - | | - | | | $ | 207 | | 4.51 | % |
| U.S. Govt. Agency securities | | | 9,139 | | 5.30 | % | | | 49,412 | | 5.38 | % | | | 2,003 | | 5.27 | % | | | 1,003 | | 5.61 | % | | | 61,557 | | 5.37 | % |
| Obligations of state and | | | | | | | | | | | | | | | | | | | | | | | | | | | | | | |
| political subdivisions (1) | | | 3,185 | | 6.21 | % | | | 26,887 | | 6.23 | % | | | 34,509 | | 5.75 | % | | | 21,525 | | 6.86 | % | | | 86,106 | | 6.20 | % |
| Other securities (2) | | | 2,005 | | 5.76 | % | | | 2,838 | | 4.34 | % | | | 26,612 | | 5.24 | % | | | 90,100 | | 4.54 | % | | | 121,555 | | 4.71 | % |
| Total (1) | | $ | 14,329 | | 5.57 | % | | $ | 79,344 | | 5.63 | % | | $ | 63,124 | | 5.52 | % | | $ | 112,628 | | 4.99 | % | | $ | 269,425 | | 5.34 | % |
| (1) | | Yields are stated on a federal tax equivalent basis at 35%. |
| (2) | | Does not reflect anticipated maturity from prepayments on mortgage-based and asset-based securities. Anticipated lives are significantly shorter than contractual maturities. |
The average life of Bancorp’s investment portfolio increased from 4.0 years at December 31, 2006 to 4.7 years at December 31, 2007. Management will consider realizing gains and/or losses on the Company’s investment portfolio on an on-going basis as part of Bancorp’s overall business strategy.
26
Loan Portfolio
The Company’s loan portfolio was $2.2 billion at December 31, 2007, an increase of $225 million or 12% from December 31, 2006. Approximately two-thirds of the loan growth in 2007 was attributable to the $152 million, or 42%, increase in the real estate construction loan category. Of the $152 million growth in total real estate construction loans, two-step loans accounted for $91 million, or 60%, of this growth. Commercial loans grew 9% or $41 million in 2007. The real estate mortgage category grew to $235 million of home equity lines and home equity loans and $96 million in single family residential loans, representing a 9% and 33% increase, respectively, over year end 2006. Commercial real estate, our largest loan category, declined slightly during 2007 due to competitive pricing pressures that prevented us from growing this portfolio consistent with our financial return targets.
Partly as a result of no new two-step loan commitments being made after October 19, 2007, the slowdown in the origination of residential construction loans to builders and residential subdivision or site development loans, and certain sizeable pay-offs in the commercial loan portfolio, the total loan portfolio declined $11 million during the fourth quarter of 2007. As previously noted, we anticipate total loan balances may be less at the end of 2008 when compared to year end 2007. A sustained slow rate of home sales and an elevated housing inventory level, or negative impacts from worsening economic conditions could hinder our efforts to grow our loan portfolio in 2008. Interest and fees earned on our loan portfolio is our primary source of revenue, and a decline in loan originations will have a negative impact on loan balances (growth), interest income, and loan fees earned.
The following table provides the composition of the loan portfolio and the balance of our allowance for loan losses for the periods shown.
| | | December 31, |
| (Dollars in thousands) | | 2007 | | 2006 | | 2005 | | 2004 | | 2003 |
| | | Amount | | Percent | | Amount | | Percent | | Amount | | Percent | | Amount | | Percent | | Amount | | Percent |
| Commercial | | $ | 504,101 | | | 23.2 | % | | $ | 463,188 | | | 23.8 | % | | $ | 364,604 | | | 23.5 | % | | $ | 357,776 | | | 25.1 | % | | $ | 236,949 | | | 19.4 | % |
| Real estate construction | | | 517,988 | | | 23.8 | % | | | 365,954 | | | 18.8 | % | | | 210,828 | | | 13.6 | % | | | 116,974 | | | 8.2 | % | | | 112,732 | | | 9.2 | % |
| Real estate mortgage | | | 330,803 | | | 15.2 | % | | | 287,495 | | | 14.8 | % | | | 242,015 | | | 15.6 | % | | | 212,959 | | | 14.9 | % | | | 179,331 | | | 14.7 | % |
| Commercial real estate | | | 796,622 | | | 36.7 | % | | | 804,865 | | | 41.3 | % | | | 709,176 | | | 45.6 | % | | | 704,390 | | | 49.3 | % | | | 652,882 | | | 53.5 | % |
| Installment and other | | | | | | | | | | | | | | | | | | | | | | | | | | | | | | | | | | | |
| consumer | | | 23,155 | | | 1.1 | % | | | 26,188 | | | 1.3 | % | | | 27,831 | | | 1.7 | % | | | 35,895 | | | 2.5 | % | | | 38,987 | | | 3.2 | % |
| Total loans | | | 2,172,669 | | | 100 | % | | | 1,947,690 | | | 100 | % | | | 1,554,454 | | | 100 | % | | | 1,427,994 | | | 100 | % | | | 1,220,881 | | | 100 | % |
| |
| Allowance for loan losses | | | (46,917 | ) | | 2.16 | % | | | (23,017 | ) | | 1.18 | % | | | (20,469 | ) | | 1.32 | % | | | (18,971 | ) | | 1.33 | % | | | (18,131 | ) | | 1.49 | % |
| |
| Total loans, net | | $ | 2,125,752 | | | | | | $ | 1,924,673 | | | | | | $ | 1,533,985 | | | | | | $ | 1,409,023 | | | | | | $ | 1,202,750 | | | | |
The following table presents the maturity distribution and interest rate sensitivity of the Company’s loan portfolio by category at December 31, 2007.
| (Dollars in thousands) | | Commercial | | Real Estate | | Real Estate | | Real Estate | | Installment | | |
| | | Loans | | Construction | | Mortgage | | Commercial | | and other | | Total |
| Maturity distribution: | | | | | | | | | | | | | | | | | | |
| Due within one year | | $ | 275,275 | | $ | 495,285 | | $ | 31,326 | | $ | 54,789 | | $ | 5,629 | | $ | 862,304 |
| Due after one through five years | | | 154,106 | | | 14,711 | | | 71,326 | | | 48,096 | | | 7,034 | | | 295,273 |
| Due after five years | | | 74,720 | | | 7,992 | | | 228,151 | | | 693,737 | | | 10,492 | | | 1,015,092 |
| Total | | $ | 504,101 | | $ | 517,988 | | $ | 330,803 | | $ | 796,622 | | $ | 23,155 | | $ | 2,172,669 |
| Interest rate sensitivity: | | | | | | | | | | | | | | | | | | |
| Fixed-interest rate loans | | $ | 140,956 | | $ | 272,876 | | $ | 126,536 | | $ | 141,885 | | $ | 12,481 | | $ | 694,734 |
| Floating or adjustable interest rate loans(1) | | | 363,145 | | | 245,112 | | | 204,267 | | | 654,737 | | | 10,674 | | | 1,477,935 |
| Total | | $ | 504,101 | | $ | 517,988 | | $ | 330,803 | | $ | 796,622 | | $ | 23,155 | | $ | 2,172,669 |
| (1) | | Certain loans contain provisions which place maximum or minimum limits on interest rate changes. In addition, the portfolio contains loans in which rates change less frequently than annually. The above table is based on stated maturity. |
27
As part of our strategic efforts over the last several years, we have placed an emphasis on increasing the commercial, real estate construction, and home equity loan (included under “Real Estate Mortgage” below) segments of our loan portfolio. As a result, the commercial portfolio has more than doubled in size and increased to 23% of the loan portfolio at year end 2007 compared to 19% at December 31, 2003 and the real estate construction loan portfolio has increased to 24% of the loan portfolio from 9% over that same period. We believe our focus on commercial businesses has been and remains a key contributor to growing low cost deposits. Real estate construction loans represented 24%, or $518 million, of the loan portfolio at December 31, 2007 compared to 9% at year end 2003. Due to the growth in the residential construction portfolio, the majority of which are short-term fixed rate loans, our overall loan portfolio has become more interest rate sensitive compared to prior years. Meanwhile, the commercial real estate portfolio declined from 54% of the loan portfolio at year end 2003 to 37% of the loan portfolio at the end of 2007.
Loans held for sale at December 31, 2007, were $3.2 million compared to $7.6 million at December 31, 2006. The majority of our loan sales are residential real estate mortgage loans and the guaranteed portion of SBA loans. These loans are sold on an individual basis. Residential real estate mortgage loans have been sold without retaining servicing rights or obligations. The guaranteed portion of SBA loans have been sold from time to time, with servicing rights and obligations usually retained.
As of December 31, 2007, and 2006, we had $18.9 million and $8.6 million, respectively, in outstanding loans to persons serving as directors, senior officers, principal stockholders and their related interests. These loans were made substantially on the same terms, including interest rates, maturities and collateral, as those made to other customers of the Bank. At December 31, 2007, and 2006, the Bank had no banker’s acceptances. As a result of discontinuing the two-step loan program and the rapid increase in the inventory of residential homes for sale within our markets, we expect real estate construction loan balances to decrease materially in the coming year. See “Two-Step Loan Portfolio” below. Below is a discussion of our loan portfolio by category.
Commercial. Expanding our commercial and industrial loan portfolio has been a major component of our strategic initiatives since 2000. The 9%, or $41 million, growth in this portfolio in 2007 end was driven by new customer relationships, revolving credit line utilization by commercial clients and growth in commercial term loans. At year end 2007, the commercial loan line utilization was consistent with past seasonality trends. We believe we have been successful in growing our commercial portfolio as a result of strong, experienced commercial lending teams throughout our market areas, including our agricultural lending group. In addition, over the past several years developments in our treasury management product line, including our iDeposit product, have enhanced our ability to attract and retain commercial lending and core deposit relationships. We also believe that our expanding branch network continues to be an important point of service contact for our commercial relationships.
Real Estate Construction.The composition of real estate construction loans as of December 31, 2007, 2006, and 2005 is presented in the following table.
| | | December 31, |
| | | 2007 | | 2006 | | 2005 |
| (Dollars in thousands) | | | Amount | | Percent | | Amount | | Percent | | Amount | | Percent |
| Commercial construction | | $ | 90,670 | | 17 | % | | $ | 63,592 | | | 17 | % | | $ | 45,278 | | | 21 | % |
| Two-step residential construction loans | | | 262,952 | | 51 | % | | | 171,692 | | | 47 | % | | | 66,234 | | | 31 | % |
| Residential construction to builder | | | 80,737 | | 16 | % | | | 62,709 | | | 17 | % | | | 47,568 | | | 23 | % |
| Residential subdivision or site development | | | 84,620 | | 16 | % | | | 70,351 | | | 20 | % | | | 53,367 | | | 26 | % |
| Net deferred fees | | | (991 | ) | 0 | % | | | (2,390 | ) | | -1 | % | | | (1,619 | ) | | -1 | % |
| Total real estate construction loans | | $ | 517,988 | | 100 | % | | $ | 365,954 | | | 100 | % | | $ | 210,828 | | | 100 | % |
At December 31, 2007, real estate construction loans were $518 million, up $152 million or 42% compared to $366 million at December 31, 2006. Over half of our construction loan growth since December 31, 2006, has been in two-step loans. See “Two-Step Loan Portfolio” below. The two-step loans category is comprised of loans that were made to an individual who expressed intent at the time of loan origination to construct a primary residence, a second home, or a rental/investment property. We have found that the actual use of the constructed property may change depending on various factors, such as market conditions and construction related contingencies. Commercial construction, residential construction, and residential subdivision or site development loans also contributed to overall growth in the total real estate construction portfolio. Commercial construction loans include financing provided for non-residential business properties and multifamily dwellings, while residential construction to builder loans are generally made to finance commercial builders and developers of residential properties. Subdivision or site development loans are also generally made to builders and developers of residential properties.
28
Real Estate Mortgage.At December 31, 2007, real estate mortgage loan balances were $331 million or approximately 15% of the Company’s total loan portfolio. Home equity loans and lines represented about $235 million or 71% of the real estate mortgage portfolio. The Bank’s home equity loans and lines are substantially generated by our branches within our market areas. Our underwriting is based on income that is verified through customary means, borrower debt repayment capacity, and loan to value ratios that we believe are prudent. At December 31, 2007, slightly less than half of our home equity portfolio was secured by a first lien, with the remainder of the portfolio generally secured by junior liens. In excess of 77% of our home equity loans had an original loan to value ratio of less than 85%.
Commercial Real Estate.The composition of commercial real estate loan types based on collateral is as follows:
| (Dollars in thousands) | December 31, 2007 | | December 31, 2006 |
| | Amount | | Percent | | Amount | | Percent |
| Office Buildings | $ | 179,000 | | 22.5% | | $ | 205,100 | | 25.5% |
| Retail Facilities | | 110,100 | | 13.8% | | | 103,900 | | 12.9% |
| Multi-Family - 5+ Residential | | 61,600 | | 7.7% | | | 78,200 | | 9.7% |
| Hotels/Motels | | 42,100 | | 5.3% | | | 52,400 | | 6.5% |
| Medical Offices | | 51,400 | | 6.5% | | | 54,700 | | 6.8% |
| Industrial parks and related | | 48,800 | | 6.1% | | | 50,300 | | 6.2% |
| | Commercial/Agricultural | | 54,400 | | 6.8% | | | 47,300 | | 5.9% |
| Assisted Living | | 12,400 | | 1.6% | | | 22,200 | | 2.8% |
| Manufacturing Plants | | 39,200 | | 4.9% | | | 29,700 | | 3.7% |
| Land Development and Raw Land | | 25,000 | | 3.1% | | | 19,300 | | 2.4% |
| Mini Storage | | 17,000 | | 2.1% | | | 16,100 | | 2.0% |
| Food Establishments | | 18,300 | | 2.3% | | | 17,500 | | 2.2% |
| Other | | 137,300 | | 17.3% | | | 108,200 | | 13.4% |
| | Total commercial real estate loans | $ | 796,600 | | 100.0% | | $ | 804,900 | | 100.0% |
The commercial real estate portfolio declined $8.2 million from December 31, 2006 to December 31, 2007. Continued market pressure on the pricing of such loans has been the primary cause of the lack of growth in this portfolio. Office buildings, retail facilities, and multi-family residential categories account for 44% of the collateral securing the commercial real estate portfolio, down from 48% at year end 2006. While the office building category has decreased to 23%, it remains a substantial portion of the Bank’s commercial real estate portfolio at year end 2007. We believe Bancorp’s underwriting of commercial real estate loans is adequate with loan to value ratios at origination generally not exceeding 75% and debt service coverage ratios generally at 120% or better.
The composition of the commercial real estate loan portfolio by occupancy type is as follows:
| | | December 31, | | December 31, | | | | | | |
| | 2007 | | 2006 | | Change |
| | (Dollars in thousands) | Amount | | Percent | | Amount | | Percent | | Amount | | Percent |
| Owner-occupied | $ | 382,387 | | 48% | | $ | 349,341 | | 43% | | $ | 33,046 | | | 9% |
| Non owner-occupied | | 414,235 | | 52% | | | 455,524 | | 57% | | | (41,289 | ) | | -9% |
| Total commercial real estate loans | $ | 796,622 | | 100% | | $ | 804,865 | | 100% | | $ | (8,243 | ) | | -1% |
The owner-occupied commercial real estate loan portfolio increased $33 million since December 31, 2006, while the non-owner occupied segment declined $41 million, and as a result the owner-occupied segment now accounts for 48% of the commercial real estate portfolio, up from 43% at December 31, 2006. The shift to owner-occupied commercial real estate loans was primarily caused by significant pricing pressure on non-owner occupied loan rates from secondary market participants. In addition, owner-occupied commercial real estate loans tend to be relationship driven. As a consequence, we have increased the number of owner-occupied commercial real estate loans in our portfolio.
Credit Management.
Credit risk is inherent in our lending activities. We manage the general risks inherent in the loan portfolio by following loan policies and underwriting practices designed to result in prudent lending activities. In addition, we attempt to manage our risk through our credit administration and credit review functions that are designed to help ensure compliance with our credit standards. Through the credit review function we monitor all credit related policies and practices on a post approval basis. The findings of these reviews are communicated to the chief credit officer and chief executive officer and the Loan, Investment, and Asset Liability Committee, which is made up of certain directors.
29
As part of our ongoing lending process, internal risk ratings are assigned to each commercial, commercial real estate and commercial real estate construction loan before the funds are advanced to the customer. Credit risk ratings are based on our assessment of the borrower’s credit worthiness and the quality of our collateral position at the time a particular loan is made. Thereafter, credit risk ratings are evaluated on an ongoing basis focusing on our interpretation of relevant risk factors known to us at the time of each evaluation. Large balance loans have the credit risk rating reviewed on at least an annual basis. The internal risk ratings are important when estimating the required allowance for credit losses. Credit files are examined periodically on a sample test basis by our credit review department and internal auditors, as well as by regulatory examiners. Our relationship managers are also responsible for evaluating the ongoing financial condition of each borrower in their respective portfolio of loans. These activities include, but are not limited to, maintaining open communication channels with borrowers, analyzing periodic financial statements and cash flow projections, evaluating collateral, and monitoring covenant compliance.
Although a risk of nonpayment exists with respect to all loans, certain specific types of risks are associated with different types of loans. The expected source of repayment of Bancorp’s loans is generally the cash flow of a particular project, income from the borrower's business, proceeds from the sale of real property, proceeds of refinancing, or personal income. As a result of the nature of our customer base and the growth experienced in the market areas we serve, real estate is frequently a material component of collateral for the Company’s loans. Risks associated with loans secured by real estate include decreasing land and property values, material increases in interest rates, deterioration in local economic conditions, changes in tax policies, tightening credit or refinancing markets, and a concentration of loans within any one area. See “Risk Factors” in Item 1A of this report.
Nonperforming Assets and Delinquencies
Nonperforming assets.Nonperforming assets consist of nonaccrual loans, loans past due more than 90 days and still accruing interest, and OREO. The following table presents information with respect to nonaccrual loans by category and OREO for the periods presented.
| | | December 31, | |
| (Dollars in thousands) | 2007 | | 2006 | | 2005 | | 2004 | | 2003 | |
| Commercial | $ | 2,401 | | $ | 385 | | $ | 625 | | $ | 436 | | $ | 403 | |
| Real estate construction | | 22,121 | | | 567 | | | - | | | - | | | - | |
| Real estate mortgage | | 552 | | | - | | | 228 | | | - | | | 498 | |
| Commercial real estate | | 1,353 | | | 516 | | | 231 | | | 1,367 | | | 1,689 | |
| Installment and other consumer | | - | | | - | | | 4 | | | - | | | 79 | |
| Total loans on nonaccrual status | | 26,427 | | | 1,468 | | | 1,088 | | | 1,803 | | | 2,669 | |
| | Loans past due 90 days or more but not on | | | | | | | | | | | | | | | |
| nonaccrual status | | - | | | - | | | - | | | - | | | - | |
| Other real estate owned | | 3,255 | | | - | | | - | | | 384 | | | 1,741 | |
| Total nonperforming assets | $ | 29,682 | | $ | 1,468 | | $ | 1,088 | | $ | 2,187 | | $ | 4,410 | |
| Percentage of nonperforming assets to | | | | | | | | | | | | | | | |
| total assets | | 1.12 | % | | 0.06 | % | | 0.05 | % | | 0.12 | % | | 0.27 | % |
| | |
| Total assets | $ | 2,646,614 | | $ | 2,465,372 | | $ | 1,997,138 | | $ | 1,790,919 | | $ | 1,662,882 | |
At December 31, 2007, total nonperforming assets were $29.7 million, or 1.12% of total assets, compared to $1.5 million, or .06% of total assets, at December 31, 2006. Nonaccrual loans increased to $26.4 million at December 31, 2007, from $1.5 million at December 31, 2006, a substantial portion of which relate to the two-step loan portfolio. For additional information, see “Nonperforming Assets and Delinquencies – Two-Step Loans” below. The amount of nonaccrual loans depends on portfolio growth, portfolio seasoning, problem loan recognition and resolution through collections, sales or charge-offs. The performance of any one loan can be affected by external factors, such as economic or market conditions, or factors particular to a borrower, such as actions of a borrower’s management or conditions affecting a borrower’s business.
OREO is real property of which the Bank has taken possession or that has been deeded to the bank through a deed-in-lieu of foreclosure, non-judicial foreclosure, judicial foreclosure or similar process in partial or full satisfaction of a loan or loans. The Company had 15 OREO properties at December 31, 2007, with a total net book value of $3.3 million. All but one of these 15 properties was attributable to the two-step loan portfolio. OREO is recorded at the lower of the carrying amount of the loan or fair value less estimated costs to sell. Management utilizes appraisal valuations and judgment in its assessment of fair market value and estimated selling costs. This amount becomes the property’s book value at the time it is taken into OREO. Any write-downs based on our determination of fair market value less estimated cost to sell at the date a particular property is acquired are charged to the allowance for loan losses. Management then periodically reviews OREO to determine whether the property continues to be carried at the lower of its recorded book value or fair value, net of estimated costs to sell. Any further OREO write-downs or gains on the sale of OREO are charged to other noninterest income. Expenses from the maintenance and operations of OREO properties are included in other noninterest expense in the statements of income. While OREO operational expense was minimal in 2007, we expect this expense to increase significantly in 2008 as a result of the projected increase in the number of OREO properties held.
30
Interest income on loans is accrued daily on the principal balance outstanding. Generally, loans are placed on nonaccrual status and no interest is accrued when factors indicate collection of interest or principal in accordance with the contractual terms is doubtful or when the principal or interest payment becomes 90 days past due. For such loans, previously accrued but uncollected interest is reversed and charged against current earnings and additional income is only recognized to the extent payments are subsequently received and the loan comes out of nonaccrual status. Interest income foregone on nonaccrual loans was approximately $1.4 million, $.1 million, and $.1 million in 2007, 2006 and 2005 respectively. We anticipate foregone interest to significantly increase in 2008.
During our normal loan review procedures, a loan is considered to be impaired when it is probable that we will be unable to collect all amounts due according to the contractual terms of the loan agreement. A loan is usually not considered to be impaired during a period of delay that is less than 90 days. Impaired loans are measured based on the present value of expected future cash flows, discounted at the loan’s effective interest rate or, as a practical expedient, at the loan’s observable market price or the fair market value of the collateral if the loan is collateral dependent. Loans that are measured at lower of cost or fair value and certain large groups of smaller balance homogeneous loans collectively measured for impairment, are excluded from impairment measurement. Impaired loans are charged to the allowance for loan losses when management believes, after considering economic, market, and business conditions, collection efforts, collateral position, and other factors deemed relevant, that the borrower’s financial condition is such that collection of principal and interest is not probable.
At December 31, 2007 and 2006, Bancorp’s recorded investment in certain loans that were considered to be impaired was $33.2 million and $6.2 million, respectively. Of these impaired loans, $21.7 million and $2.5 million had a specific related valuation allowance of $3.6 million and $1.2 million, respectively, while $11.5 million and $3.7 million did not require a specific valuation allowance at the same dates. The average recorded investment in impaired loans for the years ended December 31, 2007, 2006, and 2005 was approximately $15.5 million, $3.8 million and $4.4 million, respectively. For the years ended December 31, 2007, 2006, and 2005, interest income recognized on impaired loans totaled $23,000, $220,000, and $272,000, respectively, all of which was recognized on a cash basis. For more information, see “Allowance for Credit Losses - Two-Step Loans” below.
Delinquencies.Bancorp also monitors delinquencies, defined as balances over 30-89 days past due, not in nonaccrual status, as an important indicator for future nonperforming assets. Total delinquencies were 2.05% of total loans at December 31, 2007, up from .51% at December 31, 2006. The majority of the increase in the delinquencies since year end 2006 was associated with the residential construction portfolio, and specifically, the two-step loan portfolio. For further discussion, see section “Nonperforming Assets and Delinquencies – Two-Step Loans” below. Delinquencies of commercial loans increased from $3.2 million to $6.1 million, while delinquent commercial real estate and installment and other consumer loans declined from year end 2006.
The following table summarizes total delinquent loan balances by type of loan for the periods shown:
| | (Dollars in thousands) | December 31, 2007 | | December 31, 2006 |
| | Amount | | Amount |
| Commercial | $ | 6,086 | | $ | 3,170 |
| Real estate construction | | 36,941 | | | 2,969 |
| Real estate mortgage | | 531 | | | 147 |
| Commercial real estate | | 792 | | | 2,076 |
| | Installment and other consumer | | 134 | | | 1,560 |
| | | | | | |
| Total loans 30-89 days past due, not | | | | | |
| in nonaccrual status | $ | 44,484 | | $ | 9,922 |
| |
| Delinquent loans to total loans | | 2.05% | | | 0.51% |
31
Allowance for Credit Losses and Net Loan Charge-offs
Allowance for Credit Losses.An allowance for credit losses has been established based on management’s best estimate, as of the balance sheet date, of probable losses inherent in the loan portfolio. See “Critical Accounting Policies” above. The allowance for credit losses is comprised of two components: the allowance for loan losses, which is the sum of the specific, formula and unallocated allowance, and the reserve for unfunded commitments. Our methodology for determining the allowance for credit losses consists of several key elements, which include:
Specific Allowances.Specific allowances are generally established when management has identified unique or particular risks that are related to specific loans that demonstrate risk characteristics consistent with impairment.Specific allowances may also be established to address the unique risks associated with a group of loans or particular type of credit exposure, for example, potential losses associated with overdrafts.
Formula Allowance.The formula allowance is calculated by applying loss factors to individual loans based on the assignment of risk ratings, or through the assignment of loss factors to homogenous pools of loans. Changes in risk grades of both performing and nonperforming loans affect the amount of the formula allowance. Loss factors are based on our historical loss experience and such other data as management believes to be pertinent, and may be adjusted for significant factors that, in management’s judgment, affect the collectibility of the portfolio as of the evaluation date. For instance, management believes that commercial and industrial loans and real estate construction loans have produced significant losses at particular points in time. Therefore, management believes it is appropriate to use a reserve higher than recent charge-off experience would suggest in these categories of loans.
Unallocated Allowance.The unallocated loan loss allowance represents an amount for imprecision or uncertainty that is inherent in estimates used for the allowance, which may change from period to period. This portion of the allowance for loan losses currently applies to other than two-step loans, and is the result of our judgment about risks inherent in the portfolio, economic uncertainties, historical loss experience relative to current trends, and other subjective factors.Other considerations include: regional economic and business conditions that impact important segments of our portfolio, loan growth rates, depth and skill of lending staff, the interest rate environment, and bank regulatory examination results and findings of our internal credit examiners. Prior to September 30, 2007, the unallocated portion of our allowance also covered expected losses associated with unfunded commitments.
Reserve for Unfunded Commitments.A reserve for unfunded commitments is maintained at a level that, in the opinion of management, is adequate to absorb probable losses associated with commitments to lend funds under existing agreements; for example, the bank’s commitment to fund advances under lines of credit. The reserve amount for unfunded commitments is determined based on our methodologies described above with respect to the formula allowance. As our unfunded commitments decrease due to the transition to a funded loan, the corresponding reserve for unfunded commitments will decrease. The decrease to the provision for credit losses associated with decreases in the balance of unfunded commitments will be offset at least in part by an increase in the allowance for loan losses related to an additional amount funded. For further information, see “Critical Accounting Policies” above. The reserve for unfunded commitments was $8.0 million at December 31, 2007, due mainly to the estimated required allowance for unfunded commitments associated with the two-step portfolio. For more information, see “Allowance for Credit Losses - Two-Step Loans” below.
At December 31, 2007, the allowance for credit losses was $54.9 million, consisting of a $41.4 million formula allowance, a $3.6 million specific allowance, a $1.9 million unallocated allowance and an $8.0 million reserve for unfunded commitments. At December 31, 2006, the allowance for loan losses of $23.0 million (inclusive of the reserve for unfunded commitments, which was zero) consisted of a $20.7 million formula allowance, a $1.2 million specific allowance, and a $1.1 million unallocated allowance. The increase in the allowance was significantly driven by the allowance for credit losses required for the two-step loan program. For more information, see “Allowance for Credit Losses - Two-Step Loans” below.
Our allowance incorporates the results of measuring impaired loans as provided in Statement of Financial Accounting Standards (“SFAS”) No. 114, “Accounting by Creditors for Impairment of a Loan,” and SFAS No. 118, “Accounting by Creditors for Impairment of a Loan – Income Recognition and Disclosures.” These accounting standards prescribe the measurement, income recognition and guidelines concerning impaired loans. In addition, net overdraft losses are included in the calculation of the allowance for credit losses per the guidance provided by regulatory authorities early in 2005, “Joint Guidance on Overdraft Protection Programs.”
32
Changes in the total allowance for credit losses for full years ended December 31, 2007 through December 31, 2003, are presented in the following table.
| | December 31, |
| (Dollars in thousands) | 2007 | | 2006 | | 2005 | | 2004 | | 2003 |
| Loans outstanding at end of period | $ | 2,172,669 | | | $ | 1,947,690 | | | $ | 1,554,454 | | | $ | 1,427,994 | | | $ | 1,220,881 | |
| Average loans outstanding during the period | $ | 2,094,977 | | | $ | 1,745,777 | | | $ | 1,479,933 | | | $ | 1,301,447 | | | $ | 1,190,962 | |
| |
| Allowance for loan loss, beginning of period | $ | 23,017 | | | $ | 20,469 | | | $ | 18,971 | | | $ | 18,131 | | | $ | 16,838 | |
| Allowance for loan loss, from acquisition | | - | | | | 887 | | | | - | | | | - | | | | - | |
| Loans charged off: | | | | | | | | | | | | | | | | | | | |
| Commercial | | (3,798 | ) | | | (831 | ) | | | (634 | ) | | | (1,149 | ) | | | (1,494 | ) |
| Real estate | | (2,611 | ) | | | (48 | ) | | | (33 | ) | | | (527 | ) | | | (844 | ) |
| Installment and consumer | | (254 | ) | | | (130 | ) | | | (507 | ) | | | (698 | ) | | | (760 | ) |
| Overdraft | | (1,050 | ) | | | (912 | ) | | | (450 | ) | | | - | | | | - | |
| Total loans charged off | | (7,713 | ) | | | (1,921 | ) | | | (1,624 | ) | | | (2,374 | ) | | | (3,098 | ) |
| Recoveries: | | | | | | | | | | | | | | | | | | | |
| Commercial | | 269 | | | | 501 | | | | 478 | | | | 438 | | | | 380 | |
| Real estate | | 42 | | | | 40 | | | | 108 | | | | 340 | | | | 70 | |
| Installment and consumer | | 112 | | | | 75 | | | | 279 | | | | 176 | | | | 141 | |
| Overdraft | | 220 | | | | 233 | | | | 82 | | | | - | | | | - | |
| Total recoveries | | 643 | | | | 849 | | | | 947 | | | | 954 | | | | 591 | |
| Net loans charged off | | (7,070 | ) | | | (1,072 | ) | | | (677 | ) | | | (1,420 | ) | | | (2,507 | ) |
| Provision for credit loss | | 38,956 | | | | 2,733 | | | | 2,175 | | | | 2,260 | | | | 3,800 | |
| Allowance for credit loss, end of period | $ | 54,903 | | | $ | 23,017 | | | $ | 20,469 | | | $ | 18,971 | | | $ | 18,131 | |
| |
| Components of allowance for credit losses | | | | | | | | | | | | | | | | | | | |
| Allowance for loan losses | $ | 46,917 | | | $ | 23,017 | | | $ | 20,469 | | | $ | 18,971 | | | $ | 18,131 | |
| Reserve for unfunded commitments | | 7,986 | | | | - | | | | - | | | | - | | | | - | |
| Total allowance for credit losses | $ | 54,903 | | | $ | 23,017 | | | $ | 20,469 | | | $ | 18,971 | | | $ | 18,131 | |
| |
| Ratio of net loans charged off to average | | | | | | | | | | | | | | | | | | | |
| loans outstanding | | 0.34 | % | | | 0.06 | % | | | 0.05 | % | | | 0.11 | % | | | 0.21 | % |
| Ratio of allowance for loan losses to end of | | | | | | | | | | | | | | | | | | | |
| period loans | | 2.16 | % | | | 1.18 | % | | | 1.32 | % | | | 1.33 | % | | | 1.49 | % |
| Ratio of allowance for credit losses to end of | | | | | | | | | | | | | | | | | | | |
| period loans | | 2.53 | % | | | 1.18 | % | | | 1.32 | % | | | 1.33 | % | | | 1.49 | % |
The increase in the total allowance for credit losses in 2007 was primarily due to a higher reserve for credit losses associated with the two-step loan portfolio, including its commitments, delinquencies, nonaccrual loans, and related charge-offs. At December 31, 2007, our allowance for credit losses was 2.53% of total loans and 185% of total nonperforming loans, compared with an allowance for credit losses at December 31, 2006, of 1.18% of total loans, and 1568% of total nonperforming loans, respectively. For more information, see “Allowance for Credit Losses - Two-Step Loans” below.
At December 31, 2007, our total allowance for loan losses was $46.9 million, or 2.16% of total loans, and 158% of total nonperforming assets, compared with an allowance for loan losses at December 31, 2006, of $23.0 million, or 1.18% of total loans, and 1568% of total nonperforming assets.
33
The following table presents the composition of the Company’s total allowance for loan losses.
| | (Dollars in thousands) | December 31, |
| | 2007 | | 2006 |
| | | | | Percentage of | | | | | Percentage of |
| | | | | loans in each | | | | | loans in each |
| | | | | category to total | | | | | category to total |
| | Amount | | loans | | Amount | | loans |
| | Commercial | $ | 8,416 | | 23.2% | | $ | 7,637 | | 23.8% |
| Real estate construction | | 28,123 | | 23.8% | | | 5,043 | | 18.8% |
| Real estate mortgage | | 1,645 | | 15.2% | | | 1,433 | | 14.8% |
| Commercial real estate | | 5,808 | | 36.7% | | | 6,740 | | 41.3% |
| Installment and other | | 1,044 | | 1.1% | | | 1,036 | | 1.3% |
| Unallocated | | 1,881 | | - | | | 1,128 | | - |
| Total allowance for loan losses | $ | 46,917 | | 100.0% | | $ | 23,017 | | 100.0% |
The allowance for loan losses is based upon estimates of probable losses inherent in the loan portfolio. The actual losses may vary significantly from the estimated amounts. Our methodology discussed previously includes several features that are intended to reduce the differences between estimated and actual losses. By assessing the probable estimated losses inherent in the loan portfolio on a quarterly basis, we are able to adjust specific and inherent loss estimates based upon the most recent information available.
Overall, we believe that the allowance for credit losses is adequate to absorb losses in the loan portfolio at December 31, 2007. The process for determining the adequacy of the allowance for credit losses is critical to our financial results. It requires difficult, subjective and complex judgments as a result of the need to make estimates about the effect of matters that are uncertain. Therefore, we cannot provide assurance that, in any particular period, we will not have sizeable credit losses in relation to the amount reserved. We may later need to significantly adjust the allowance for credit losses considering factors in existence at such time, including economic, market, or business conditions and the results of ongoing internal and external examination processes.
Net Loan Charge-offs.During 2007, total net loan charge-offs were $7.1 million compared to $1.1 million in 2006. Net loan charge-offs reflect the realization of net losses in the loan portfolio that were recognized previously through the provision for credit losses. The net loan charge-offs average to total average loans outstanding was .34% for the year ended 2007, up from .12% in 2006. Since December 31, 1999, the total annual net loan charge-off percentage has ranged from .05% to .34%, an unusually low range compared to the long term historical experience. We expect our total net loan charge-off percentage to increase significantly above this range in 2008 as we recognize loan losses on the two-step loan portfolio and we anticipate a more challenging stage in the credit cycle.
34
Additional Loan Portfolio Disclosure
We are providing additional information below regarding nonperforming assets and the allowance for credit losses that distinguishes loans other than two-step loans from those in our two-step loan portfolio. Management is providing this information to aid in the readers understanding of the impact of the two-step loan portfolio on our entire loan portfolio.
The first section includes additional information regarding loans in our loan portfolio other than two-step loans. The second section includes information solely relating to loans in our two-step loan portfolio. For information regarding our total loan portfolio, please see the preceding section.
Loans Other Than Two-Step Loans
The following table shows our total loan portfolio by category, as well as the breakout of the two-step loan portfolio from our other real estate construction loans.
| | (Dollars in thousands, unaudited) | December 31, | | September 30, |
| | 2007 | | 2006 | | 2007 |
| Commercial loans | $ | 504,101 | | $ | 463,188 | | $ | 530,196 |
| Real estate construction loans1 | | 517,988 | | | 365,954 | | | 519,870 |
| Real estate mortgage loans | | 330,803 | | | 287,495 | | | 305,675 |
| Commercial real estate loans | | 796,622 | | | 804,865 | | | 804,200 |
| Installment and other consumer loans | | 23,155 | | | 26,188 | | | 23,360 |
| Total loans | $ | 2,172,669 | | $ | 1,947,690 | | $ | 2,183,301 |
| |
| 1Two-step loans | $ | 262,952 | | $ | 171,692 | | $ | 274,747 |
| All other construction loans | | 255,036 | | | 194,262 | | | 245,123 |
| Total real estate construction loans | $ | 517,988 | | $ | 365,954 | | $ | 519,870 |
| |
| Two-step loans | | 262,952 | | | 171,692 | | | 274,747 |
| Total loans other than two-step loans | | 1,909,717 | | | 1,775,998 | | | 1,908,554 |
| | Total loans | $ | 2,172,669 | | $ | 1,947,690 | | $ | 2,183,301 |
As shown above, loans other than two-step loans were $1.91 billion at year end 2007, up $134 million, or 8%, from December 31, 2006.
Nonperforming Assets and Delinquencies – Loans Other Than Two-Step Loans
Nonperforming assets - Loans Other Than Two-Step Loans.Nonperforming assets among loans other than two-step loans increased from $.9 million at year end 2006 to $5.9 million or .31% of the other than two-step loan portfolio at year end 2007. The increase in nonperforming assets in this portfolio was due to higher levels of nonaccrual loans, largely represented by one commercial real estate construction loan in the amount of $1.5 million and one commercial loan in the amount of $1.2 million.
The following table presents information about our nonperforming assets, delinquencies and the allowance for loan losses relating to loans other than two-step loans at the dates shown.
| | December 31, | | Sept. 30, |
| (Dollars in thousands, unaudited) | 2007 | | 2006 | | 2007 |
| Non-accruing loans other than two-step loans | $ | 5,882 | | | $ | 901 | | | $ | 1,172 | |
| 90 day past due and accruing interest | | - | | | | - | | | | - | |
| Total nonperforming loans other than two-step loans | | 5,882 | | | | 901 | | | | 1,172 | |
| | |
| Other real estate owned other than two-step loans | | - | | | | - | | | | - | |
| Total nonperforming assets other than two-step loans | $ | 5,882 | | | $ | 901 | | | $ | 1,172 | |
| | |
| Delinquent other than two-step loans 30-89 days past due | $ | 7,706 | | | $ | 6,953 | | | $ | 4,949 | |
| | |
| Nonperforming loans other than two-step loans to total loans other than two-step loans | | 0.31 | % | | | 0.05 | % | | | 0.06 | % |
| Nonperforming assets other than two-step assets to total assets | | 0.22 | % | | | 0.04 | % | | | 0.04 | % |
| Allowance for loan losses other than two-step loan losses to nonperforming loans other than two-step loans | | 391 | % | | | 2264 | % | | | 1921 | % |
| Delinquent loans other than two-step loans to total loans other than two-step loans | | 0.40 | % | | | 0.39 | % | | | 0.26 | % |
35
Delinquencies - Loans Other Than Two-Step Loans.Delinquencies in the other than two-step loan portfolio, defined as loans 30 to 89 days past due, was basically unchanged at 40basis points at December 31, 2007, compared to 39 basis points at December 31, 2006, and remained low relative to our historical range.
Allowance for Credit Losses and Net Loan Charge-offs – Loans Other Than Two-Step Loans
Allowance for Credit Losses - - Loans Other Than Two-Step Loans.The provision for credit losses for loans other than two-step loans during 2007 was $8.0 million, up from $1.3 million in 2006. The largest driver of the higher provision for credit losses for this category was net loan charge-offs, with risk rating migration accounting for the majority of the remaining increase. Net loan charge-offs were $4.5 million for the year ended December 31, 2007 compared to $1.1 million for the year ended December 31, 2006. The risk rating migration largely consisted of commercial loans and residential construction loans to builders being moved to higher risk rating categories. At December 31, 2007, the allowance for credit losses for loans other than two-step loans of $23.8 million consisted of a $20.3 million formula allowance, a $.7 million specific allowance, a $1.9 million unallocated allowance, and a $.9 million reserve for unfunded commitments. At December 31, 2006, the allowance for loan losses for loans other than two-step loans of $23.0 million consisted of a $20.7 million formula allowance, a $1.2 million specific allowance, and a $1.1 million unallocated allowance.
The following table presents information with respect to the change in our allowance for credit losses relating to loans other than two-step loans.
| | (Dollars in thousands) | December 31, |
| | 2007 | | 2006 |
| Allowance for credit losses other than two-step loans, beginning of period | $ | 20,399 | | | $ | 19,303 | |
| Provision for credit losses other than two-step loans | | 7,976 | | | | 1,281 | |
| |
| Charge-offs other than two-step loans | | (5,173 | ) | | | (1,921 | ) |
| Recoveries other than two-step loans | | 636 | | | | 849 | |
| | Net Charge-offs other than two-step loans | | (4,537 | ) | | | (1,072 | ) |
| |
| Allowance for credit losses, from acquisition | | - | | | | 887 | |
| |
| Total allowance for credit losses other than two-step loans | $ | 23,838 | | | $ | 20,399 | |
| |
| Components of allowance for credit losses other than two-step loans | | | | | | | |
| Allowance for loan losses other than two-step loans | $ | 23,000 | | | $ | 20,399 | |
| Reserve for unfunded commitments other than two-step loans | | 838 | | | | - | |
| Total allowance for credit losses other than two-step loans | $ | 23,838 | | | $ | 20,399 | |
| |
| Net loan charge-offs to average loans other than two-step loans | | 0.22 | % | | | 0.06 | % |
| Allowance for other than two-step loan losses to total other than two-step loans | | 1.20 | % | | | 1.15 | % |
| Allowance for other than two-step credit losses to total other than two-step loans | | 1.25 | % | | | 1.15 | % |
Net Loan Charge-offs – Loans Other Than Two-Step Loans.The $4.5 million net loancharge-offs for loans other than two-step loans in 2007 were largely attributable to losses related to commercial loans and overdrafts. Losses on two commercial relationships amounted to $3.6 million. The total loss through the third quarter of 2007 associated with one of the commercial borrowers was previously reported in the amount of $2.4 million; the loss on the second commercial borrower occurred late in fourth quarter 2007 in the amount of $1.2 million. In both cases, losses were related to unique circumstances with each business and management does not believe those losses are indicative of a deterioration in overall asset quality in the commercial loan portfolio. Net overdraft losses were $.8 million in 2007 compared to $.7 million for 2006. Net overdraft losses were spread across the Bank’s retail and business customers. Overdrafts are actively managed and specifically reserved for under our allowance for credit losses.
36
Two-Step Loan Portfolio
As discussed previously, the real estate construction loan category expanded rapidly over the past few years, reflecting the high levels of construction activity and related lending in the markets in which we operate. Our two-step loan program, which involved loans to individual borrowers to finance construction of residential properties, began in the first quarter 2002, but activity in the two-step loan portfolio accelerated significantly beginning in the first quarter of 2005. The program was referred to as the “two-step” loan program because each project involved two steps; initial construction financing that was provided by the Bank and secondary, or take-out, financing that was intended to be provided by third parties. The program was discontinued on October 19, 2007.
At December 31, 2007, the outstanding balance of loans originated in the two-step loan program was $263.0 million compared to $172 million at December 31, 2006. The majority of the two-step loan portfolio is scheduled to mature by June 30, 2008.
The Bank originated $252.7 million in two-step loans in the twelve months ended December 31, 2007, compared to $297.6 million in the same period of 2006. The following table presents two-step loan originations by quarter for the past two years:
| (Dollars in thousands) | Two-step residential |
| | construction loan |
| Period ended | originations |
| First quarter 2006 | $ | 49,443 |
| Second quarter 2006 | | 60,553 |
| Third quarter 2006 | | 92,867 |
| | Fourth quarter 2006 | | 94,751 |
| Total 2006 | $ | 297,614 |
| |
| First quarter 2007 | $ | 115,715 |
| Second quarter 2007 | | 76,969 |
| Third quarter 2007 | | 45,646 |
| Fourth quarter 2007 | | 14,386 |
| | Total 2007 | $ | 252,716 |
The combination of tighter underwriting criteria implemented in the second and third quarters of 2007 and a softer residential housing market slowed origination volumes within the two-step loan program in the second and third quarters. The continued sharp decline in the fourth quarter of 2007 reflects the impact of discontinuing the two-step loan program.
The following table presents two-step loan balance, unused commitment and total commitment detail as of the end of each period presented:
| | (Dollars in thousands) | | | | | | | Two-step commitments |
| | Two-step | | Two-step loan | | ( loan balance |
| Period ended | loan balance | | unused commitments | | plus unused commitments) |
| First quarter 2006 | $ | 85,129 | | $ | 66,914 | | $ | 152,043 |
| | Second quarter 2006 | | 111,256 | | | 77,846 | | | 189,102 |
| Third quarter 2006 | | 138,939 | | | 105,246 | | | 244,185 |
| Fourth quarter 2006 | | 171,692 | | | 132,732 | | | 304,424 |
| First quarter 2007 | | 216,371 | | | 160,918 | | | 377,289 |
| Second quarter 2007 | | 256,332 | | | 149,902 | | | 406,234 |
| Third quarter 2007 | | 274,747 | | | 123,447 | | | 398,194 |
| Fourth quarter 2007 | | 262,952 | | | 78,585 | | | 341,537 |
Total two-step loan balances plus unused commitments peaked in the second quarter of 2007. Moreover, two-step unused commitments at December 31, 2007, declined 51% from its peak at the end of the first quarter of 2007, reflecting the lower volume of new two-step loan originations combined with a higher level of draws on more mature two-step loans in our two-step loan portfolio. As a result of the significantly lower amount of two-step unused commitments at year end 2007 compared to prior periods in 2007 and no further commitments being issued, it is anticipated that the two-step loan balances will run-off over the next nine to twelve months.
37
The following table presents two-step commitments outstanding at December 31, 2007, by the period in which the loan commitments mature.
| | (Dollars in thousands) | Two-step residential |
| | construction loan |
| Period ended | commitment maturities |
| Maturities in 2007 | $ | 51,409 |
| First quarter 2008 | | 153,578 |
| Second quarter 2008 | | 90,058 |
| | Third quarter 2008 | | 35,625 |
| Fourth quarter 2008 | | 10,867 |
| Total | $ | 341,537 |
Approximately 84% of 2008 maturities are scheduled to occur by the end of the second quarter. Actual maturities may occur somewhat later as certain commitments are projected to be extended in the regular course of our construction lending business. The majority of the $51.4 million in two-step loans that matured during 2007 were either delinquent or nonperforming loans at year end 2007.
The following table illustrates two-step loan commitments by geographic areas.
| | | December 31, |
| Region | 2007 |
| Portland, Oregon / Vancouver, Washington | $ | 102,336 |
| Western Washington (Olympia, Seattle) | | 113,331 |
| Central Oregon (Bend, Redmond) | | 44,310 |
| | Oregon Coast (Newport, Lincoln City) | | 32,655 |
| Willamette Valley (Salem, Eugene) | | 34,331 |
| Southern Oregon (Medford, Roseburg) | | 14,574 |
| Total residential real estate construction loan originations | $ | 341,537 |
Credit Management - Two-Step Loans
Management action focused on the two-step loan portfolio has been concentrated in the following key areas:Increasing customer contact prior to loan maturity and encouraging early action to secure permanent financing or identify reasonable alternatives. We are initiating customer contact up to 120 days prior to maturity in order to determine the best strategy for each borrower. At this point, this typically includes helping the borrower identify permanent mortgage programs, extending the construction period for successful home completion and if third party or company take-out mortgage financing is not expected to materialize, attempting to pursue the least costly alternative in terms of property disposition.
Identifying higher risk elements within the portfolio and developing risk mitigation strategies. As patterns emerge that allow us to isolate risk elements, we evaluate appropriate action steps for risk mitigation and appropriate reserve adequacy.
Adding resources to assist with collection efforts and the management and sale of OREO property. We have expanded our capacity to address troubled loans by increasing staffing levels in our special assets and collections groups. We have also increased our capacity by contracting with a third party collection service and a work out specialist.
Providing mortgage loans to two-step borrowers who qualify. We have developed a set of mortgage loan products to provide bridge financing or permanent mortgage loans, collectively called replacement financing, to qualified borrowers with maturing two-step loans. This program is designed to assist two-step borrowers in their transition from a construction loan to permanent financing. Financing terms are generally more flexible than our standard products; however, in all cases, each loan request is considered based on a thorough review of the borrower’s repayment capacity. Under certain circumstances, we may consider discounting debt in order to restructure the loan to fit the borrower’s debt service capacity.
Since October 31, 2007, the number of active two-step loans has been reduced by 109 and total two-step loan commitments have decreased by $47 million. From October 31, 2007 to year end, we made 20 real estate mortgage loans totaling 7.5 million that were underwritten by the Bank as replacement loans for loans in the two-step loan portfolio. We believe replacement loans will fully perform relative to the terms and conditions of the loan contract, provided circumstances do not change. At December 31, 2007, we had 55 additional applications in process for mortgage loans totaling $17.8 million. Mortgage loans funded by the Bank in this program will be identified and internally segregated into a separate loan portfolio for ongoing credit management and monitoring purposes.
38
Nonperforming Assets and Delinquencies – Two-Step Loans
Nonperforming Assets – Two-Step Loans. The deterioration of asset quality in our two-step loan portfolio became significantly more pronounced in the fourth quarter of 2007. Nonperforming two-step assets were $23.8 million or 80% of total nonperforming assets at December 31, 2007. At December 31, 2007, total nonperforming two-step assets consisted of $20.5 million in loans placed on nonaccrual, and the book value of 14 residential properties carried in OREO in the amount of $3.3 million. We anticipate nonperforming assets associated with the two-step loan portfolio will continue to increase significantly in 2008.
Subsequent to December 31, 2007, the Bank amended its loan policy regarding the timing of placing certain segments of the real estate construction loan portfolio on nonaccrual status, including, as examples, loans that are over 30 days past due and construction is incomplete, loans that are 60 days past due and construction is completed, and all loans made to borrowers that have not commenced construction. The amendments to our loan policy will apply to the entire construction loan portfolio; however, primarily the two-step loan portfolio is affected by the amended loan policy. Had the amended loan policy been in effect at December 31, 2007, nonaccrual two-step loans would have increased by $28.9 million, while delinquent 30-89 days past due two-step loans would have decreased by $24.4 million to $12.4 million.
Two-step OREO property represents real property which the Bank has taken possession of that has been deeded to the bank through a deed-in-lieu of foreclosure, non-judicial foreclosure, judicial foreclosure or similar process in partial or full satisfaction of a loan or loans. It typically takes two to seven months following initial delinquency before property is recorded into OREO depending upon the resolution strategy and the complexities associated with the specific property. At year end 2007, we had approximately 95 properties in various stages of foreclosure, representing $32.0 million in loan balances. We expect the majority of these properties to be recorded into OREO during the second and third quarters of 2008. As this occurs, loan charge-offs will increase against our two-step allowance for loan losses. To date, the majority of the OREO properties were acquired through non-judicial foreclosures, as the borrowers have not shown capacity to support the debt. Additional recoveries from two-step loan borrowers are expected to be limited.
The following table presents information about our nonperforming assets, delinquencies and the allowance for credit losses relating to two-step loans at the dates shown.
| | Dollars in thousands | December 31, | | September 30, |
| | 2007 | | 2006 | | 2007 |
| Non-accruing two-step loans | $ | 20,545 | | | $ | 567 | | | $ | 6,695 | |
| 90 day past and accruing interest two-step loans | | - | | | | - | | | | - | |
| Total nonperforming two-step loans | | 20,545 | | | | 567 | | | | 6,695 | |
| |
| Other real estate owned two-step | | 3,255 | | | | - | | | | 1,183 | |
| Total nonperforming two-step assets | $ | 23,800 | | | $ | 567 | | | $ | 7,878 | |
| |
| Delinquent two-step loans 30-89 days past due | $ | 36,778 | | | $ | 2,969 | | | $ | 9,878 | |
| |
| Nonperforming two-step loans to total two-step loans | | 7.81 | % | | | 0.33 | % | | | 2.44 | % |
| Nonperforming two-step assets to total assets | | 0.90 | % | | | 0.02 | % | | | 0.30 | % |
| Allowance for two-step loan losses to nonperforming two-step loans | | 116 | % | | | 462 | % | | | 75 | % |
| Allowance for two-step loan losses to nonperforming two-step assets | | 100 | % | | | 462 | % | | | 64 | % |
| Delinquent two-step loans to total two-step loans | | 13.99 | % | | | 1.73 | % | | | 3.60 | % |
Delinquencies - Two-Step Loans.Delinquencies in the two-step loan portfolio increased significantly to $36.8 million at December 31, 2007 from $3.0 million at year end 2006. Delinquent two-step loans were 13.99% of total two-step loans at December 31, 2007, up from 1.73% at December 31, 2006 and 3.60% at September 30, 2007. Common issues causing delinquency among two-step borrowers include: difficulties obtaining permanent financing, construction delays or cost overruns, valuations on completed projects below expectations, borrower cash flow limitations, and borrowing that appears to have been for investment purposes without the capacity to carry the property through a down sales cycle.
39
Allowance for Credit Losses and Net Loan Charge-offs – Two-Step Loans
Allowance for Credit Losses - - Two-Step Loans.As mentioned under “Provision for CreditLosses” above, a $27.8 million provision for credit losses associated with the two-step portfolio was recorded in the fourth quarter of 2007. Net charge-offs in the two-step portfolio were $2.5 million in 2007, of which $1.9 million occurred in the fourth quarter, compared to no net charge-offs in 2006. The allowance for credit losses associated with the two-step loan portfolio increased to $31.1 million or 11.8% of total two-step loans at December 31, 2007, up significantly from $2.6 million and 1.52%, respectively, at year end 2006. The two-step allowance for credit losses is allocated into three separate components as follows: a pool based formula allowance of $21.1 million, specific reserves for impaired two-step loans totaling $2.9 million, and a $7.1 million reserve for unfunded commitments. We will record actual future charge-offs in the two-step loan portfolio against the allowance for loan losses assigned to the portfolio. We anticipate that the allowance for credit losses relating to the two-step loan portfolio at December 31, 2007 is adequate to cover credit losses inherent in the two-step loan portfolio as of that date based on our knowledge at that time; however, there are a number of factors that could cause results to differ, perhaps materially, from our expectations, including further deterioration in credit quality, declining home values, extraordinary construction costs to complete unfinished homes, or various economic factors.
The following table presents information with respect to the change in our allowance for credit losses relating to the two-step loan portfolio.
| | | | | Quarter to date |
| | (Dollars in thousands) | December 31, | | September 30, |
| | 2007 | | 2006 | | 2007 |
| Allowance for credit losses two-step loans, beginning of period | $ | 2,618 | | | $ | 1,166 | | | $ | 3,971 | |
| Provision for credit losses two-step loans | | 30,980 | | | | 1,452 | | | | 1,891 | |
| |
| Charge-offs two-step loans | | (2,540 | ) | | | - | | | | (666 | ) |
| Recoveries two-step loans | | 7 | | | | - | | | | - | |
| Net loan charge-offs two-step loans | | (2,533 | ) | | | - | | | | (666 | ) |
| | | | | | | | | | | | |
| Total allowance for credit losses two-step loans | $ | 31,065 | | | $ | 2,618 | | | $ | 5,196 | |
| |
| Components of allowance for credit losses two-step loans | | | | | | | | | | | |
| Allowance for loan losses two-step loans | $ | 23,917 | | | $ | 2,618 | | | $ | 5,025 | |
| Reserve for unfunded commitments two-step loans | | 7,148 | | | | - | | | | 171 | |
| Total allowance for credit losses two-step loans | $ | 31,065 | | | $ | 2,618 | | | $ | 5,196 | |
| |
| Net two-step loan charge-offs to average total loans | | 0.12 | % | | | 0.00 | % | | | 0.12 | % |
| Allowance for two-step loan losses to total two-step loans | | 9.10 | % | | | 1.52 | % | | | 1.83 | % |
| Allowance for two-step credit losses to total two-step loans | | 11.81 | % | | | 1.52 | % | | | 1.89 | % |
Net Loan Charge-offs – Two-Step Loans.Net loancharge-offs in the two-step loan portfolio increased from $0 in 2006 to $2.5 million in 2007. It is anticipated that net charge-offs against the established allowance for credit losses for the two-step loan portfolio will increase significantly in the first and subsequent quarters in 2008, as additional two-step loans are impaired and more properties are recorded into OREO.
40
Deposits and Borrowings
We use a mix of deposits and borrowings to fund earning asset growth. The composition of the mix depends in part on our interest rate risk position, funding costs of the various alternatives, the level and shape of the yield curve, collateral requirements and overall customer demand, and on credit market conditions. Our marketing efforts are primarily focused on growing business and consumer accounts and balances in lower cost products such as demand deposits, interest bearing demand and money market accounts. Borrowings are used to manage short-term volatility in funding needs and when they are less expensive than deposits or when necessary to adjust our interest rate risk position.
The following table summarizes the average amount of, and the average rate paid on, each of the deposit and borrowing categories for the periods shown.
| | | 2007 | | 2006 | | 2005 |
| (Dollars in thousands) | Average Balance | | Rate Paid | | Average Balance | | Rate Paid | | Average Balance | | Rate Paid |
| Demand | $ | 479,310 | | - | | | $ | 466,282 | | - | | | $ | 421,766 | | - | |
| Interest bearing demand | | 278,734 | | 1.23 | % | | | 259,054 | | 0.86 | % | | | 246,237 | | 0.41 | % |
| Savings | | 72,787 | | 0.78 | % | | | 80,029 | | 0.57 | % | | | 87,090 | | 0.28 | % |
| Money Market | | 665,037 | | 3.75 | % | | | 558,734 | | 3.42 | % | | | 455,727 | | 1.96 | % |
| Time deposits | | 554,263 | | 4.70 | % | | | 457,077 | | 4.19 | % | | | 362,035 | | 2.85 | % |
| Short-term borrowings | | 136,731 | | 5.16 | % | | | 66,139 | | 5.07 | % | | | 18,512 | | 2.93 | % |
| Long-term borrowings (1) | | 113,748 | | 5.61 | % | | | 104,651 | | 5.39 | % | | | 111,840 | | 4.82 | % |
| Total deposits and borrowings | $ | 2,300,610 | | 3.76 | % | | $ | 1,991,966 | | 3.27 | % | | $ | 1,703,207 | | 2.06 | % |
| (1) | | Long-term borrowings include junior subordinated debentures. |
Average core deposits consisting of demand, interest bearing demand, savings, and money market deposits increased 10% in 2007 compared to 2006. We believe our core deposit increase was mainly due to:
Consistent sales practices by branch and commercial teams resulting in both consumer and business core deposit growth;
Continued promotion of free checking products; and
Active marketing efforts within our markets.
The Company’s total average demand balances, of which approximately 90% are related to business customers, are driven primarily by the number of accounts and the seasonal fluctuation in average balances per account, peaking in late fall with a trough in the first quarter. The overall level of short-term market interest rates and the shape of the yield curve influence average demand balances as certain account analysis and other business customers seek to maintain balances necessary to cover service charges.
Growth in time deposits is primarily driven by the rates paid by the Company. We adjust the relative attractiveness of these deposits based on loan growth, borrowing costs and other factors. In 2007, we promoted money market accounts with high introductory rates. We retained, and continue to retain, the majority of the new balances generated in this promotion.
Average short-term borrowings during the year ended December 31, 2007, were $118 million higher than the year ended December 31, 2005. The growth in short-term borrowings since 2005 was primarily used to fund the growth in the two-step loan portfolio. Similar to short-term borrowings, two-step loans typically mature within one year of origination. We use longer term borrowing to match fund longer term loans and investments.
41
As of December 31, 2007, time deposits are presented below at the earlier of the next repricing date or maturity.
| | | Time Deposits | | | | |
| (Dollars in thousands) | of $100,000 or More | | Other Time Deposits | | Total Time Deposits |
| | Amount | | Percent | | Amount | | Percent | | Amount | | Percent |
| | Reprice/mature in 3 months or less | $ | 146,963 | | 50.8 | % | | $ | 56,729 | | 21.8 | % | | $ | 203,692 | | 36.9 | % |
| Reprice/mature after 3 months through 6 months | | 61,939 | | 21.4 | % | | | 70,993 | | 27.2 | % | | | 132,932 | | 24.2 | % |
| Reprice/mature after 6 months through one year | | 61,484 | | 21.2 | % | | | 102,308 | | 39.2 | % | | | 163,792 | | 29.8 | % |
| Reprice/mature after one year through five years | | 19,081 | | 6.6 | % | | | 30,743 | | 11.8 | % | | | 49,824 | | 9.1 | % |
| Reprice/mature after five years | | - | | 0.0 | % | | | 25 | | 0.0 | % | | | 25 | | 0.0 | % |
| Total | $ | 289,467 | | 100.0 | % | | $ | 260,798 | | 100.0 | % | | $ | 550,265 | | 100.0 | % |
Average time deposits increased $97.2 million, or 21.3% in 2007, compared to 2006, due to a shift in consumer demand toward time deposits and more aggressive pricing of time deposits in the second-half of the year to support the strong loan growth during this period. Over 90% of time deposits will mature and reprice in the next 12 months. In the short term, time deposits have limited impact on the liquidity of the Company and these deposits can generally be retained and/or expanded with increases in rates paid which might, however, increase our cost of funds more than anticipated. The level of time deposits in the future depends not only on customer preferences for time deposits but also our need for deposit funding volume as well as the required pricing to retain and attract time deposits relative to other funding alternatives including borrowings from Federal Home Loan Bank of Seattle (“FHLB”).
As of December 31, 2007, long-term and short-term borrowings through FHLB had the following items remaining to contractual maturity.
| | (Dollars in thousands) | Due in three | | three months | | Due after one year | | Due after | | |
| | months or less | | through one year | | through five years | | five years | | Total |
| Short-term borrowings | $ | 157,000 | | $ | 10,000 | | $ | - | | $ | - | | $ | 167,000 |
| Long-term borrowings (1) | | - | | | - | | | 83,100 | | | - | | | 83,100 |
| Total borrowings | $ | 157,000 | | $ | 10,000 | | $ | 83,100 | | $ | - | | $ | 250,100 |
| (1) | | Based on contractual maturities and may vary based on call dates. |
Deposit growth remains a key strategic focus for us and our ability to achieve deposit growth, particularly growth in core deposits, is subject to many risk factors including the effects of competitive pricing pressure, changing customer deposit behavior, and increasing or decreasing interest rate environments. Adverse developments with respect to any of these risk factors could limit our ability to attract and retain deposits and could have a material negative impact on net income.
42
Capital Resources
The Federal Reserve and FDIC have established minimum requirements for capital adequacy for bank holding companies and member banks. The requirements address both risk-based capital and leveraged capital. The regulatory agencies may establish higher minimum requirements if, for example, a corporation has previously received special attention or has a high susceptibility to interest rate risk. The Federal Reserve and FDIC risk-based capital guidelines require banks and bank holding companies to have a ratio of Tier 1 capital to total risk-weighted assets of at least 4% and a ratio of total capital to total risk-weighted assets of 8% or greater. In addition, the leverage ratio of Tier 1 capital to total assets less intangibles is required to be at least 3%. See “Liquidity and Sources of Funds” for further discussion of the impact of trust preferred securities on capital adequacy requirements. As of December 31, 2007, Bancorp and the Bank were considered “Well Capitalized” under the regulatory risk based capital guidelines.
Stockholders’ equity was $208.2 million at December 31, 2007, compared to $200.9 million at December 31, 2006, an increase of $7.3 million or 4% over that period of time. At December 31, 2007, the Bank’s total capital was 10.54% of risk weighted assets, compared to 10.23% at December 31, 2006. The Bank’s total capital stood at $260.1 million at year end 2007 compared to $235.7 million at year end 2006. Regulatory capital guidelines required the Bank's total capital to be $246.7 million or 10% or higher as a percent of total risk weighted assets at December 31, 2007, in order for the Bank to be designated "Well Capitalized".
As the following table indicates, Bancorp and the Bank currently exceed the regulatory minimum capital ratio requirements.
| | | | | | | Required For Minimum | | |
| (Dollars in thousands) | | | | | Capital Adequacy | | Required For Well Capitalized |
| December 31, 2007 | Actual | | | | | | | | | | |
| | Amount | | Ratio | | Amount | | % | | Amount | | % |
| Tier 1 Capital | | | | | | | | | | | | | | | | | |
| West Coast Bancorp | $ | 244,165 | | 9.88 | % | | $ | 98,804 | | 4 | % | | $ | 148,206 | | 6 | % |
| West Coast Bank | | 228,976 | | 9.28 | % | | | 98,687 | | 4 | % | | | 148,030 | | 6 | % |
| | | | | | | | | | | | | | | | | | |
| Total Capital | | | | | | | | | | | | | | | | | |
| West Coast Bancorp | $ | 275,306 | | 11.15 | % | | $ | 197,608 | | 8 | % | | $ | 247,010 | | 10 | % |
| West Coast Bank | | 260,080 | | 10.54 | % | | | 197,373 | | 8 | % | | | 246,717 | | 10 | % |
| | | | | | | | | | | | | | | | | | |
| Leverage Ratio | | | | | | | | | | | | | | | | | |
| West Coast Bancorp | $ | 244,165 | | 9.41 | % | | $ | 77,855 | | 3 | % | | $ | 129,759 | | 5 | % |
| West Coast Bank | | 228,976 | | 8.83 | % | | | 77,828 | | 3 | % | | | 129,714 | | 5 | % |
| | | | | | | | | | | | | | | | | | |
| Risk weighted assets | | | | | | | | | | | | | | | | | |
| West Coast Bancorp | $ | 2,470,097 | | | | | | | | | | | | | | | |
| West Coast Bank | | 2,467,165 | | | | | | | | | | | | | | | |
| | | | | | | | | | | | | | | | | | |
| Adjusted total assets | | | | | | | | | | | | | | | | | |
| West Coast Bancorp | $ | 2,595,174 | | | | | | | | | | | | | | | |
| West Coast Bank | | 2,594,280 | | | | | | | | | | | | | | | |
| | | | | | | | | | | | | | | | | | |
| December 31, 2006 | | | | | | | | | | | | | | | | | |
| Tier 1 Capital | | | | | | | | | | | | | | | | | |
| West Coast Bancorp | $ | 227,165 | | 9.85 | % | | $ | 92,277 | | 4 | % | | $ | 138,416 | | 6 | % |
| West Coast Bank | | 212,446 | | 9.22 | % | | | 92,156 | | 4 | % | | | 138,234 | | 6 | % |
| |
| Total Capital | | | | | | | | | | | | | | | | | |
| West Coast Bancorp | $ | 250,406 | | 10.85 | % | | $ | 184,555 | | 8 | % | | $ | 230,694 | | 10 | % |
| West Coast Bank | | 235,688 | | 10.23 | % | | | 184,311 | | 8 | % | | | 230,389 | | 10 | % |
| |
| Leverage Ratio | | | | | | | | | | | | | | | | | |
| West Coast Bancorp | $ | 227,165 | | 9.64 | % | | $ | 70,721 | | 3 | % | | $ | 117,868 | | 5 | % |
| West Coast Bank | | 212,446 | | 9.01 | % | | | 70,701 | | 3 | % | | | 117,836 | | 5 | % |
| |
| Risk weighted assets | | | | | | | | | | | | | | | | | |
| West Coast Bancorp | $ | 2,306,935 | | | | | | | | | | | | | | | |
| West Coast Bank | | 2,303,893 | | | | | | | | | | | | | | | |
| |
| Adjusted total assets | | | | | | | | | | | | | | | | | |
| West Coast Bancorp | $ | 2,357,369 | | | | | | | | | | | | | | | |
| West Coast Bank | | 2,356,715 | | | | | | | | | | | | | | | |
Adjusted total assets used in the calculation of the leverage ratio are based on quarterly average total assets as defined for regulatory reporting purposes.
43
In July 2000, we announced a stock repurchase program that was expanded in September 2000, June 2001, September 2002, April 2004, and most recently by 1.0 million shares in September 2007. Under this plan, the Company can purchase up to 4.88 million shares of the Company’s common stock, including completed purchases. The Company intends to use existing funds and/or long-term borrowings to finance the repurchases. When evaluating timing and amount of common stock repurchases, management considers a number of factors including, but not limited to, its projected earnings generation, risk weighted asset growth, capital ratios relative to regulatory capital guidelines, cash dividends on its common stock, availability and cost of other capital sources, and the market valuation of its stock price. We do not anticipate material share repurchases in the first half of 2008.
Total shares available for repurchase under this plan were approximately 1,052,000 at December 31, 2007. The following table presents information with respect to Bancorp’s stock repurchase program.
| | | | | | | Average cost per |
| (Shares and dollars in thousands) | Shares repurchased in period | | Cost of shares repurchased | | share |
| Year ended 2000 | 573 | | $ | 5,264 | | $ | 9.19 |
| Year ended 2001 | 534 | | | 6,597 | | | 12.35 |
| Year ended 2002 | 866 | | | 13,081 | | | 15.11 |
| Year ended 2003 | 587 | | | 10,461 | | | 17.81 |
| Year ended 2004 | 484 | | | 10,515 | | | 21.73 |
| Year ended 2005 | 484 | | | 11,815 | | | 24.41 |
| Year ended 2006 | 95 | | | 2,770 | | | 29.16 |
| Year ended 2007 | 205 | | | 5,847 | | | 28.52 |
| Plan to date total | 3,828 | | $ | 66,350 | | $ | 17.33 |
Liquidity and Sources of Funds
The Bank’s primary sources of funds are customer deposits, maturities of investment securities, sales of “Available for Sale” securities, loan sales, loan repayments, net income, advances from the FHLB, and the use of federal funds markets. Scheduled loan repayments are a relatively stable source of funds, while deposit inflows and unscheduled loan prepayments are not. Deposit inflows and unscheduled loan prepayments are influenced by general interest rate levels, interest rates available on other investments, competition, economic conditions and other factors. Deposits are the primary source of new funds. Total deposits were $2.1 billion at December 31, 2007, up from $2.0 billion at December 31, 2006.
The holding company relies on dividends from the Bank and proceeds from the issuance of trust preferred securities for its funds, which are used for various corporate purposes, including dividends and stock repurchases under Bancorp’s stock repurchase program. Trust preferred securities are an important source of liquidity for the holding company and provide regulatory capital for the Company.
At December 31, 2007, six wholly-owned subsidiary grantor trusts established by Bancorp had issued and sold $51 million of pooled trust preferred securities that remain outstanding. Trust preferred securities accrue and pay distributions periodically at specified annual rates as provided in each indenture. The trusts used all of the net proceeds from each sale of trust preferred securities to purchase a like amount of junior subordinated debentures (the “Debentures”) of the Company. The Debentures are the sole assets of the trusts. The Company’s obligations under the Debentures and related documents, taken together, constitute a full and unconditional guarantee by the Company of the obligations of the trusts. The trust preferred securities are mandatorily redeemable upon the maturity of the Debentures and may be subject to earlier redemption as provided in the indentures. The Company has the right to redeem the Debentures in whole (but not in part) on or after specific dates, at a redemption price specified in the indentures plus any accrued but unpaid interest to the redemption date.
The following table is a summary of outstanding trust preferred securities at December 31, 2007.
| | (Dollars in thousands) | | | | | | | | | | | |
| | | | Trust preferred | | | | | | Rate at | | |
| Issuance Trust | Issuance date | | security amount | | Rate type (1) | | Initial rate | | 12/31/07 | | Maturity date |
| | West Coast Statutory Trust III | September 2003 | | $ | 7,500 | | Fixed | | 6.75% | | 6.75% | | September 2033 |
| | West Coast Statutory Trust IV | March 2004 | | $ | 6,000 | | Fixed | | 5.88% | | 5.88% | | March 2034 |
| | West Coast Statutory Trust V | April 2006 | | $ | 15,000 | | Variable | | 6.79% | | 6.42% | | June 2036 |
| | West Coast Statutory Trust VI | December 2006 | | $ | 5,000 | | Variable | | 7.04% | | 6.67% | | December 2036 |
| | West Coast Statutory Trust VII | March 2007 | | $ | 12,500 | | Variable | | 6.90% | | 6.54% | | March 2037 |
| | West Coast Statutory Trust VIII | June 2007 | | $ | 5,000 | | Variable | | 6.74% | | 6.37% | | June 2037 |
| | | Total | | $ | 51,000 | | | | Weighted rate | | 6.45% | | |
| (1) | | The variable rate preferred securities reprice quarterly. |
44
The total amount of trust preferred securities outstanding at December 31, 2007, was $51 million. The interest rates on the trust preferred securities issued in April 2006, December 2006, March 2007 and June 2007 reset quarterly and are tied to the London Interbank Offered Rate (“LIBOR”) rate. The Company has the right to redeem the debentures of the September 2003 issuance in September 2008; the March 2004 issuance in March 2009; the April 2006 issuance in June 2011, the December 2006 issuance in December 2011, the March 2007 issuance in March 2012 and June 2007 issuance in June 2012. In December 2006, Bancorp redeemed $5 million of trust preferred securities issued in December 2001. Bancorp expensed $.1 million in deferred costs associated with this redemption. In June 2007, Bancorp redeemed $7.5 million of trust preferred securities issued in June 2002. Bancorp expensed $.1 million in deferred costs associated with this redemption.
On July 2, 2003, the Federal Reserve issued Supervisory Letter SR 03-13 clarifying that Bank Holding Companies should continue to report trust preferred securities in accordance with current Federal Reserve Bank instructions which allows trust preferred securities to be counted in Tier 1 capital subject to certain limitations. The Federal Reserve has indicated it will review the implications of any accounting treatment changes and, if necessary or warranted, will provide appropriate guidance. For additional information regarding trust preferred securities, see our consolidated financial statements and related notes included elsewhere in this report including Note 10, “Junior Subordinated Debentures.”
The Company has an agreement with Promontory Interfinancial Network that makes it possible to offer FDIC insured deposits in excess of the current deposit limits. This Certificate of Deposit Account Registry Service (“CDARS”) uses a deposit-matching program to match CDARS deposits in other participating banks, dollar for dollar. This product is designed to enhance our ability to attract and retain customers and increase deposits, by providing additional FDIC coverage to customers. CDARS deposits can be reciprocal or one-way. Due to the nature of the placement of funds, CDARS deposits are defined as "brokered deposits" by regulatory agencies. The Company’s CDARS balance at December 31, 2007, was $7.3 million in reciprocal balances. The Bank does not currently have any additional brokered deposits.
The holding company is a separate entity from the Bank and must provide for its own liquidity. An important source of the holding company’s liquidity is dividends declared and paid by the Bank to the holding company. There are statutory and regulatory provisions that could limit the ability of the Bank to pay dividends to the holding company. We believe that such restrictions will not have an adverse impact on the ability of the holding company to meet its liquidity needs which include quarterly cash dividend distributions to shareholders and debt service on the $51 million of outstanding junior subordinated debentures. In addition, the holding company receives cash from the exercise of options and the issuance of trust preferred securities. As of December 31, 2007, the holding company did not have any borrowing arrangements of its own.
Management expects to continue relying on customer deposits, maturity of investment securities, sales of “Available for Sale” securities, loan sales, loan repayments, net income, Federal Funds markets, advances from the FHLB, and other borrowings to provide liquidity. Management may also consider engaging in further offerings of trust preferred securities if the opportunity presents an attractive means of raising funds in the future. Although deposit balances at times have shown historical growth, such balances may be influenced by changes in the financial services industry, interest rates available on other investments, general economic conditions, competition, customer management of cash resources and other factors. Borrowings may be used on a short-term and long-term basis to compensate for reductions in other sources of funds. Borrowings may also be used on a long-term basis to support expanded lending activities and to match maturities, duration, or repricing intervals of assets. The sources of such funds may include, but are not limited to Federal Funds purchased, reverse repurchase agreements and borrowings from the FHLB.
45
Off Balance Sheet Arrangements
At December 31, 2007, the Bank had commitments to extend credit of $962 million, down 3%, compared to $989 million at December 31, 2006. For additional information regarding off balance sheet arrangements and future financial commitments, see our consolidated financial statements and related notes included elsewhere in this report including Note 21 “Financial instruments with off balance sheet risk.”
We are party to many contractual financial obligations, including repayment of borrowings, operating lease payments and commitments to extend credit. The table below presents certain future financial obligations including payments required under retirement plans which are included in “Other long-term liabilities” below.
| | | Payments due within time period at December 31, 2007 |
| (Dollars in thousands) | | | | | | | Due After Five | | |
| | 0-12 Months | | 1-3 Years | | 4-5 Years | | Years | | Total |
| Operating leases(1) | $ | 3,705 | | $ | 6,855 | | $ | 6,049 | | $ | 12,637 | | $ | 29,246 |
| Junior subordinated debentures(2) (3) | | 3,292 | | | 6,584 | | | 6,584 | | | 126,994 | | | 143,454 |
| Long-term borrowings(3) | | 3,717 | | | 68,449 | | | 21,804 | | | - | | | 93,970 |
| Other long-term liabilities | | 115 | | | 579 | | | 334 | | | 668 | | | 1,696 |
| Total | $ | 10,829 | | $ | 82,467 | | $ | 34,771 | | $ | 140,299 | | $ | 268,366 |
| (1) | | Operating leases do not include increases in common area charges. |
| (2) | | Junior subordinated debenture obligations reflect contractual maturities which are 30 years from origination and do not reflect possible call dates. |
| (3) | | Long-term borrowings and junior subordinated debenture obligations reflect interest payment obligations based on December 31, 2007 contractual interest rates. |
46
ITEM 7A.QUANTITATIVE AND QUALITATIVE DISCLOSURES ABOUT MARKET RISK
Market Risk
Interest rate, credit and operations risks are the most significant market risks impacting our performance. Other types of market risk, such as foreign currency exchange rate risk and commodity price risk, do not arise in the normal course of our business activities. We rely on loan reviews, prudent loan underwriting standards and an adequate allowance for credit losses to attempt to mitigate credit risk. Interest rate risk is reviewed at least quarterly by the Asset Liability Management Committee (“ALCO”) which includes senior management representatives. The ALCO manages our balance sheet to maintain the forecasted impact of interest rates on net interest income and present value of equity within acceptable ranges despite unforeseeable changes in interest rates.
Asset/liability management simulation models are used to measure interest rate risk. The models quantify interest rate risk by simulating forecasted net interest income over a 12-month time horizon under various rate scenarios, as well as monitoring the change in the present value of equity under the same rate scenarios. The present value of equity is defined as the difference between the market value of current assets less current liabilities. By measuring the change in the present value of equity under different rate scenarios, management can identify interest rate risk that may not be evident in simulating changes in forecasted net interest income. Readers are referred to the sections, “Forward Looking Statement Disclosure” and “Risk Factors” of this report in connection with this discussion of market risks.
The following tables show the approximate percentage change in forecasted net interest income over a 12-month period and the percentage change in the present value of equity under several rate scenarios. For the net interest income analysis, three rate scenarios provided by Global Insight, an outside economic service, are compared to a stable (flat) rate scenario:
| | | Actual rates December | Base Case | Falling Rates | Rising Rates |
| | 31, 2007 | 2008 (average) | 2008 (average) | 2008 (average) |
| Federal Funds Rate | 4.25% | 3.82% | 2.87% | 5.74% |
| Prime Rate | 7.25% | 6.82% | 5.87% | 8.74% |
| Treasury Yield Curve Spread 10- | 79 basis points | 84 basis points | 71 basis points | 93 basis points |
| year to 3 month | | | | |
| | Stable rate scenario compared to: | | Percent Change in | |
| | | Net Interest Income | |
| Rising | | +2.5% | |
| Base Case | | +.2% | |
| Falling | | -2.3% | |
As illustrated in the above table, at December 31, 2007, we estimate our balance sheet was asset sensitive over a 12 month horizon, meaning that interest earning assets mature or reprice more quickly than interest-bearing liabilities in a given period. Therefore, a significant decrease in market rates of interest could adversely affect net interest income, while an increase in market rates may increase net interest income. We attempt to limit our interest rate risk through managing the repricing characteristics of our assets and liabilities.
For the present value of equity analysis, the results are compared to the net present value of equity using the yield curve as of December 31, 2007. This curve is then shifted up and down and the net present value of equity is computed. This table does not include flattening or steepening yield curve effects.
| | December 31, 2007 | | Percent Change in | |
| Change in Interest Rates | | Present Value of Equity | |
| Up 200 basis points | | 4.0 | % | |
| Up 100 basis points | | 2.9 | % | |
| Down 100 basis points | | -1.1 | % | |
| Down 200 basis points | | -3.5 | % | |
It should be noted that the simulation model does not take into account future management actions that could be undertaken, should a change occur in actual market interest rates during the year. Also, certain assumptions are required to perform modeling simulations that may have a significant impact on the results. These include important assumptions regarding the level of interest rates and balance changes on deposit products that do not have stated maturities, as well as the relationship between loan yields and deposit rates relative to market interest rates. These assumptions have been developed through a combination of industry standards and future expected pricing behavior but could be significantly influenced by future competitor pricing behavior. The model also includes assumptions about changes in the composition or mix of the balance sheet. The results derived from the simulation model could vary significantly due to external factors such as changes in the prepayment assumptions, early withdrawals of deposits and competition. Any merger activity will also have an impact on the asset/liability position as new assets are acquired and added.
47
Interest Rate Sensitivity (Gap) Table
The primary objective of our asset/liability management is to maximize net interest income while maintaining acceptable levels of interest-rate sensitivity. We seek to meet this objective through influencing the maturity and repricing characteristics of our assets and liabilities.
The following table sets forth the estimated maturity and repricing and the resulting interest rate gap between interest earning assets and interest bearing liabilities at December 31, 2007. The amounts in the table are derived from internal data from the Bank based on maturities and next repricing dates including contractual repayments.
| | | Estimated Maturity or Repricing at December 31, 2007 |
| (Dollars in thousands) | | | | | | | Due After Five | | |
| | 0-3 Months | | 4-12 Months | | 1-5 Years | | Years | | Total |
| Interest Earning Assets: | | | | | | | | | | | | | | | | | | | |
| Interest earning balances due from banks | $ | 624 | | | $ | - | | | $ | - | | | $ | - | | | $ | 624 | |
| Federal funds sold | | 31,512 | | | | - | | | | - | | | | - | | | | 31,512 | |
| Trading assets | | 1,582 | | | | - | | | | - | | | | - | | | | 1,582 | |
| Investments available for sale(1)(2) | | 8,935 | | | | 26,903 | | | | 102,864 | | | | 130,723 | | | | 269,425 | |
| Loans held for sale | | 3,187 | | | | - | | | | - | | | | - | | | | 3,187 | |
| Loans, including fees | | 1,041,314 | | | | 377,491 | | | | 693,312 | | | | 60,552 | | | | 2,172,669 | |
| Total interest earning assets | $ | 1,087,154 | | | $ | 404,394 | | | $ | 796,176 | | | $ | 191,275 | | | | 2,478,999 | |
| Allowance for loan losses | | | | | | | | | | | | | | | | | | (46,917 | ) |
| Cash and due from banks | | | | | | | | | | | | | | | | | | 81,666 | |
| Other assets | | | | | | | | | | | | | | | | | | 132,866 | |
| Total assets | | | | | | | | | | | | | | | | | $ | 2,646,614 | |
| |
| Interest Bearing Liabilities: | | | | | | | | | | | | | | | | | | | |
| Savings,interest bearing demand | | | | | | | | | | | | | | | | | | | |
| and money markets(3) | $ | 115,298 | | | $ | 270,656 | | | $ | 343,593 | | | $ | 313,514 | | | $ | 1,043,061 | |
| Time deposits | | 196,519 | | | | 301,356 | | | | 52,365 | | | | 25 | | | | 550,265 | |
| Borrowings (2) | | 157,000 | | | | 10,000 | | | | 83,100 | | | | - | | | | 250,100 | |
| Junior subordinated debentures | | 37,500 | | | | 7,500 | | | | 6,000 | | | | - | | | | 51,000 | |
| Total interest bearing liabilities | $ | 506,317 | | | $ | 589,512 | | | $ | 485,058 | | | $ | 313,539 | | | | 1,894,426 | |
| Other liabilities | | | | | | | | | | | | | | | | | | 543,947 | |
| Total liabilities | | | | | | | | | | | | | | | | | | 2,438,373 | |
| Stockholders' equity | | | | | | | | | | | | | | | | | | 208,241 | |
| Total liabilities & stockholders' equity | | | | | | | | | | | | | | | | | $ | 2,646,614 | |
| |
| Interest sensitivity gap | $ | 580,836 | | | $ | (185,118 | ) | | $ | 311,118 | | | $ | (122,264 | ) | | $ | 584,572 | |
| Cumulative interest sensitivity gap | $ | 580,836 | | | $ | 395,718 | | | $ | 706,836 | | | $ | 584,572 | | | | | |
| Cumulative interest sensitivity gap | | | | | | | | | | | | | | | | | | | |
| as a percentage of total assets | | 22 | % | | | 15 | % | | | 27 | % | | | 22 | % | | | | |
| (1) | | Equity investments have been placed in the 0-3 month category. |
| (2) | | Repricing is based on anticipated call dates and may vary from contractual maturities. |
| (3) | | Repricing is based on estimated average lives. |
Certain shortcomings are inherent in the method of analysis presented in the foregoing table. For example, although certain assets and liabilities may have similar maturities and periods of repricing, they may react differently to changes in market interest rates. Also, interest rates on assets and liabilities may fluctuate in advance of changes in market interest rates, while interest rates on other assets and liabilities may follow changes in market interest rates. Given these shortcomings, management believes that rate risk is best measured by simulation modeling as opposed to measuring interest rate risk through interest rate gap measurement.
48
ITEM 8.FINANCIAL STATEMENTS AND SUPPLEMENTARY DATA
The following audited consolidated financial statements and related documents are set forth in this Annual Report on Form 10-K on the pages indicated:
| Report of Independent Registered Public Accounting Firm | 50 |
| Consolidated Balance Sheets | 51 |
| Consolidated Statements of Income | 52 |
| Consolidated Statements of Cash Flows | 53 |
| Consolidated Statements of Changes in Stockholders’ Equity | 54 |
| Notes to Consolidated Financial Statements | 55 |
49
REPORT OF INDEPENDENT REGISTERED PUBLIC ACCOUNTING FIRM
To the Board of Directors and Stockholders of
West Coast Bancorp
Lake Oswego, OR
We have audited the accompanying consolidated balance sheets of West Coast Bancorp and subsidiaries (the “Company”) as of December 31, 2007 and 2006, and the related consolidated statements of income, cash flows, and changes in stockholders’ equity for each of the three years in the period ended December 31, 2007. These financial statements are the responsibility of the Company’s management. Our responsibility is to express an opinion on these financial statements based on our audits.
We conducted our audits in accordance with the standards of the Public Company Accounting Oversight Board (United States). Those standards require that we plan and perform the audit to obtain reasonable assurance about whether the financial statements are free of material misstatement. An audit includes examining, on a test basis, evidence supporting the amounts and disclosures in the financial statements. An audit also includes assessing the accounting principles used and significant estimates made by management, as well as evaluating the overall financial statement presentation. We believe that our audits provide a reasonable basis for our opinion.
In our opinion, such consolidated financial statements present fairly, in all material respects, the financial position of West Coast Bancorp and subsidiaries as of December 31, 2007 and 2006, and the results of their operations and their cash flows for each of the three years in the period ended December 31, 2007, in conformity with accounting principles generally accepted in the United States of America.
We have also audited, in accordance with the standards of the Public Company Accounting Oversight Board (United States), the Company’s internal control over financial reporting as of December 31, 2007, based on the criteria established inInternal Control — Integrated Framework issued by the Committee of Sponsoring Organizations of the Treadway Commission, and our report dated March 5, 2008, expressed an unqualified opinion on the Company’s internal control over financial reporting.
/s/ DELOITTE & TOUCHE LLP
March 5, 2008
50
WEST COAST BANCORP
CONSOLIDATED BALANCE SHEETS
| As of December 31 (Dollars in thousands) | 2007 | | 2006 |
| ASSETS: | | | | | | | |
| Cash and cash equivalents: | | | | | | | |
| Cash and due from banks | $ | 81,666 | | | $ | 83,252 | |
| Federal funds sold | | 31,512 | | | | 10,062 | |
| Interest-bearing deposits in other banks | | 624 | | | | 486 | |
| Total cash and cash equivalents | | 113,802 | | | | 93,800 | |
| Trading assets | | 1,582 | | | | 1,075 | |
| Investment securities available for sale, at fair value | | | | | | | |
| (amortized cost: $270,139 and $329,142) | | 269,425 | | | | 328,652 | |
| Loans held for sale | | 3,187 | | | | 7,586 | |
| Loans | | 2,172,669 | | | | 1,947,690 | |
| Allowance for loan losses | | (46,917 | ) | | | (23,017 | ) |
| Loans, net | | 2,125,752 | | | | 1,924,673 | |
| Premises and equipment, net | | 34,733 | | | | 32,087 | |
| Goodwill | | 13,059 | | | | 13,059 | |
| Core deposit intangible, net | | 1,432 | | | | 1,973 | |
| Bank owned life insurance | | 22,612 | | | | 21,718 | |
| Other assets (Note 8) | | 61,030 | | | | 40,749 | |
| Total assets | $ | 2,646,614 | | | $ | 2,465,372 | |
| |
| LIABILITIES AND STOCKHOLDERS' EQUITY | | | | | | | |
| |
| Deposits: | | | | | | | |
| Demand deposits | $ | 501,506 | | | $ | 496,676 | |
| Savings and interest-bearing demand deposits | | 364,971 | | | | 343,689 | |
| Money market | | 678,090 | | | | 642,507 | |
| Time deposits | | 550,265 | | | | 523,480 | |
| Total deposits | | 2,094,832 | | | | 2,006,352 | |
| Short-term borrowings | | 167,000 | | | | 130,418 | |
| Long-term borrowings | | 83,100 | | | | 57,991 | |
| Junior subordinated debentures | | 51,000 | | | | 41,000 | |
| Reserve for unfunded commitments | | 7,986 | | | | - | |
| Other liabilities | | 34,455 | | | | 28,729 | |
| Total liabilities | | 2,438,373 | | | | 2,264,490 | |
| |
| Commitments and contingent liabilities (Notes 11 and 21) | | | | | | | |
| |
| STOCKHOLDERS' EQUITY: | | | | | | | |
| Preferred stock: no par value, none issued; | | | | | | | |
| 10,000,000 shares authorized | | - | | | | - | |
| Common stock: no par value, 50,000,000 shares | | | | | | | |
| authorized; 15,592,821 and 15,585,882 shares issued | | | | | | | |
| and outstanding, respectively | | 19,491 | | | | 19,482 | |
| Additional paid-in capital | | 70,391 | | | | 71,762 | |
| Retained earnings | | 118,792 | | | | 109,952 | |
| Accumulated other comprehensive loss | | (433 | ) | | | (314 | ) |
| Total stockholders' equity | | 208,241 | | | | 200,882 | |
| Total liabilities and stockholders' equity | $ | 2,646,614 | | | $ | 2,465,372 | |
See notes to consolidated financial statements
51
WEST COAST BANCORP
CONSOLIDATED STATEMENTS OF INCOME
| Year ended December 31 (In thousands, except per share amounts) | 2007 | | 2006 | | 2005 |
| INTEREST INCOME: | | | | | | | | | | | |
| Interest and fees on loans | $ | 169,180 | | | $ | 136,193 | | | $ | 101,419 | |
| Interest on taxable investment securities | | 10,398 | | | | 10,840 | | | | 8,201 | |
| Interest on nontaxable investment securities | | 3,048 | | | | 2,897 | | | | 2,719 | |
| Interest on deposits in other banks | | 51 | | | | 109 | | | | 88 | |
| Interest on federal funds sold | | 513 | | | | 759 | | | | 564 | |
| Total interest income | | 183,190 | | | | 150,798 | | | | 112,991 | |
| |
| INTEREST EXPENSE: | | | | | | | | | | | |
| Savings and interest-bearing demand | | 28,958 | | | | 21,795 | | | | 10,166 | |
| Time deposits | | 26,078 | | | | 19,132 | | | | 10,331 | |
| Short-term borrowings | | 7,057 | | | | 3,356 | | | | 543 | |
| Long-term borrowings | | 2,765 | | | | 2,868 | | | | 3,467 | |
| Junior subordinated debentures | | 3,612 | | | | 2,775 | | | | 1,923 | |
| Total interest expense | | 68,470 | | | | 49,926 | | | | 26,430 | |
| NET INTEREST INCOME | | 114,720 | | | | 100,872 | | | | 86,561 | |
| Provision for credit losses | | 38,956 | | | | 2,733 | | | | 2,175 | |
| Net interest income after provision for credit losses | | 75,764 | | | | 98,139 | | | | 84,386 | |
| |
| NONINTEREST INCOME: | | | | | | | | | | | |
| Service charges on deposit accounts | | 12,932 | | | | 11,096 | | | | 8,686 | |
| Payment systems related revenue | | 8,009 | | | | 6,738 | | | | 4,900 | |
| Trust and investment services revenue | | 6,390 | | | | 5,480 | | | | 5,151 | |
| Gains on sales of loans | | 3,364 | | | | 2,962 | | | | 3,046 | |
| Other | | 2,870 | | | | 2,506 | | | | 3,348 | |
| Loss on impairment of securities | | - | | | | - | | | | (1,316 | ) |
| Losses on sales of securities | | (67 | ) | | | (686 | ) | | | (716 | ) |
| Total noninterest income | | 33,498 | | | | 28,096 | | | | 23,099 | |
| |
| NONINTEREST EXPENSE: | | | | | | | | | | | |
| Salaries and employee benefits | | 49,787 | | | | 47,240 | | | | 40,606 | |
| Equipment | | 6,544 | | | | 5,477 | | | | 4,837 | |
| Occupancy | | 8,548 | | | | 7,048 | | | | 6,267 | |
| Payment systems related expense | | 3,143 | | | | 2,378 | | | | 1,739 | |
| Professional fees | | 2,072 | | | | 2,484 | | | | 2,984 | |
| Postage, printing and office supplies | | 3,896 | | | | 3,558 | | | | 2,833 | |
| Marketing | | 4,524 | | | | 4,967 | | | | 3,830 | |
| Communications | | 1,624 | | | | 1,370 | | | | 1,210 | |
| Other noninterest expense | | 5,161 | | | | 7,143 | | | | 8,328 | |
| Total noninterest expense | | 85,299 | | | | 81,665 | | | | 72,634 | |
| |
| INCOME BEFORE INCOME TAXES | | 23,963 | | | | 44,570 | | | | 34,851 | |
| PROVISION FOR INCOME TAXES | | 7,121 | | | | 15,310 | | | | 11,011 | |
| NET INCOME | $ | 16,842 | | | $ | 29,260 | | | $ | 23,840 | |
| |
| Basic earnings per share | $ | 1.09 | | | $ | 1.95 | | | $ | 1.63 | |
| Diluted earnings per share | $ | 1.05 | | | $ | 1.86 | | | $ | 1.55 | |
| |
| Weighted average common shares | | 15,507 | | | | 15,038 | | | | 14,658 | |
| Weighted average diluted shares | | 16,045 | | | | 15,730 | | | | 15,344 | |
See notes to consolidated financial statements
52
WEST COAST BANCORP
CONSOLIDATED STATEMENTS OF CASH FLOWS
| Year ended December 31 (Dollars in thousands) | 2007 | | 2006 | | 2005 |
| CASH FLOWS FROM OPERATING ACTIVITIES: | | | | | | | | | | | |
| Net income | $ | 16,842 | | | $ | 29,260 | | | $ | 23,840 | |
| Adjustments to reconcile net income to net cash | | | | | | | | | | | |
| provided by operating activities: | | | | | | | | | | | |
| Depreciation and amortization | | 4,747 | | | | 3,856 | | | | 3,415 | |
| Amortization of tax credits | | 916 | | | | 847 | | | | 750 | |
| Deferred income tax expense | | 12,879 | | | | 427 | | | | 1,719 | |
| Amortization of intangibles | | 541 | | | | 435 | | | | 339 | |
| Provision for credit losses | | 38,956 | | | | 2,733 | | | | 2,175 | |
| Federal Home Loan Bank stock dividend | | - | | | | - | | | | (39 | ) |
| (Decrease) increase in accrued interest receivable | | 80 | | | | (4,707 | ) | | | (2,044 | ) |
| Increase in other assets | | (34,695 | ) | | | (6,945 | ) | | | (4,513 | ) |
| Loss on impairment of securities | | - | | | | - | | | | 1,316 | |
| Losses on sales of securities | | 67 | | | | 686 | | | | 716 | |
| Realized net (loss) gain on derivatives | | 34 | | | | (15 | ) | | | (55 | ) |
| (Gain) loss on sale of fixed assets | | (63 | ) | | | 356 | | | | - | |
| Net gain on sale of other real estate owned | | (27 | ) | | | - | | | | - | |
| Gains on sale of loans | | (3,364 | ) | | | (2,962 | ) | | | (3,046 | ) |
| Origination of loans held for sale | | (93,213 | ) | | | (87,927 | ) | | | (85,966 | ) |
| Proceeds from sales of loans held for sale | | 100,976 | | | | 86,523 | | | | 88,498 | |
| Increase in interest payable | | 140 | | | | 770 | | | | 259 | |
| Increase in other liabilities | | 13,572 | | | | 2,722 | | | | 2,770 | |
| Increase in cash surrender value of bank owned life insurance | | (894 | ) | | | (819 | ) | | | (849 | ) |
| Stock based compensation expense | | 2,030 | | | | 1,641 | | | | 988 | |
| Tax benefit associated with stock options | | - | | | | - | | | | 1,255 | |
| Excess tax benefit from stock based compensation | | (144 | ) | | | (214 | ) | | | - | |
| Decrease (increase) in trading assets | | (507 | ) | | | (130 | ) | | | 13 | |
| Net cash provided by operating activities | | 58,873 | | | | 26,537 | | | | 31,541 | |
| |
| CASH FLOWS FROM INVESTING ACTIVITIES: | | | | | | | | | | | |
| Proceeds from maturities of available for sale securities | | 109,658 | | | | 51,180 | | | | 30,903 | |
| Proceeds from sales of available for sale securities | | 2,718 | | | | 33,163 | | | | 49,253 | |
| Purchase of available for sale securities | | (52,961 | ) | | | (101,725 | ) | | | (111,629 | ) |
| Acquisition, net of cash received | | - | | | | 6,915 | | | | - | |
| Purchase of Federal Home Loan Bank stock | | (385 | ) | | | - | | | | - | |
| Investments in tax credits | | (140 | ) | | | (454 | ) | | | (260 | ) |
| Loans made to customers greater than principal collected on loans | | (237,832 | ) | | | (321,471 | ) | | | (127,137 | ) |
| Purchase of loans | | (2,203 | ) | | | - | | | | - | |
| Proceeds from the sale of other real estate owned | | 565 | | | | - | | | | - | |
| Proceeds from the sales of fixed assets | | 442 | | | | 619 | | | | - | |
| Capital expenditures | | (7,645 | ) | | | (5,864 | ) | | | (3,726 | ) |
| Net cash used in investing activities | | (187,783 | ) | | | (337,637 | ) | | | (162,596 | ) |
| |
| CASH FLOWS FROM FINANCING ACTIVITIES: | | | | | | | | | | | |
| Net increase in demand, savings and interest | | | | | | | | | | | |
| bearing transaction accounts | | 61,695 | | | | 155,745 | | | | 154,521 | |
| Net increase in time deposits | | 26,785 | | | | 115,598 | | | | 22,232 | |
| Proceeds from issuance of junior subordinated debentures, net of costs | | 17,500 | | | | 20,000 | | | | - | |
| Redemption of junior subordinated debentures | | (7,500 | ) | | | (5,000 | ) | | | - | |
| Proceeds from issuance of long-term borrowings | | 40,100 | | | | 5,400 | | | | 22,600 | |
| Repayment of long-term borrowings | | (15,000 | ) | | | (32,100 | ) | | | (25,000 | ) |
| Net increase in short-term borrowings | | 36,582 | | | | 61,029 | | | | 19,568 | |
| Repurchase of common stock | | (5,847 | ) | | | (2,770 | ) | | | (11,815 | ) |
| Net proceeds from issuance of common stock | | 2,455 | | | | 5,334 | | | | 2,305 | |
| Excess tax benefit from stock based compensation | | 144 | | | | 214 | | | | - | |
| Dividends paid and cash paid for fractional shares | | (8,002 | ) | | | (6,919 | ) | | | (5,841 | ) |
| Net cash provided by financing activities | | 148,912 | | | | 316,531 | | | | 178,570 | |
| |
| NET INCREASE IN CASH AND CASH EQUIVALENTS | | 20,002 | | | | 5,431 | | | | 47,515 | |
| CASH AND CASH EQUIVALENTS AT BEGINNING OF YEAR | | 93,800 | | | | 88,369 | | | | 40,854 | |
| CASH AND CASH EQUIVALENTS AT END OF YEAR | $ | 113,802 | | | $ | 93,800 | | | $ | 88,369 | |
See notes to consolidated financial statements.
53
WEST COAST BANCORP
CONSOLIDATED STATEMENTS OF CHANGES IN STOCKHOLDERS' EQUITY
| | | | | | | | | | | | | | | | | | | | | Accumulated | | | | |
| | | | | | | | | Additional | | | | | | | | | | Other | | | | |
| (Shares and Dollars in thousands) | Common Stock | | | Paid-In | | Retained | | Deferred | | Comprehensive | | | | |
| Shares | | | Amount | | Capital | | Earnings | | Compensation | | Income (loss) | | Total |
| BALANCE, January 1, 2005 | 14,872 | | | $ | 18,590 | | | $ | 60,730 | | | $ | 69,612 | | | $ | (1,486 | ) | | $ | 408 | | | $ | 147,854 | |
| |
| Comprehensive income: | | | | | | | | | | | | | | | | | | | | | | | | | | |
| Net income | - | | | | - | | | | - | | | | 23,840 | | | | - | | | | - | | | $ | 23,840 | |
| Other comprehensive loss, net of tax: | | | | | | | | | | | | | | | | | | | | | | | | | | |
| Net unrealized investment/derivative losses | - | | | | - | | | | - | | | | - | | | | - | | | | (1,463 | ) | | | (1,463 | ) |
| Other comprehensive loss, net of tax | | | | | | | | | | | | | | | | | | | | | | | | | (1,463 | ) |
| Comprehensive income | | | | | | | | | | | | | | | | | | | | | | | | $ | 22,377 | |
| Cash dividends, $.40 per common share | - | | | | - | | | | - | | | | (5,841 | ) | | | - | | | | - | | | | (5,841 | ) |
| |
| Issuance of common stock-stock options | 286 | | | | 357 | | | | 2,988 | | | | - | | | | - | | | | - | | | | 3,345 | |
| Redemption of stock pursuant to stock plans | (42 | ) | | | (53 | ) | | | (955 | ) | | | - | | | | 31 | | | | - | | | | (977 | ) |
| Activity in deferred compensation plan | (2 | ) | | | (3 | ) | | | (60 | ) | | | - | | | | - | | | | - | | | | (63 | ) |
| Issuance of common stock-restricted stock | 62 | | | | 78 | | | | 1,228 | | | | - | | | | (1,306 | ) | | | - | | | | - | |
| Amortization of deferred compensation | | | | | | | | | | | | | | | | | | | | | | | | | | |
| restricted stock | - | | | | - | | | | - | | | | - | | | | 988 | | | | - | | | | 988 | |
| Common stock repurchased and retired | (484 | ) | | | (605 | ) | | | (11,210 | ) | | | - | | | | - | | | | - | | | | (11,815 | ) |
| Tax benefit associated with stock plans | - | | | | - | | | | 1,255 | | | | - | | | | - | | | | - | | | | 1,255 | |
| BALANCE, December 31, 2005 | 14,692 | | | | 18,364 | | | | 53,976 | | | | 87,611 | | | | (1,773 | ) | | | (1,055 | ) | | | 157,123 | |
| |
| Comprehensive income: | | | | | | | | | | | | | | | | | | | | | | | | | | |
| Net income | - | | | | - | | | | - | | | | 29,260 | | | | - | | | | - | | | $ | 29,260 | |
| Other comprehensive income, net of tax: | | | | | | | | | | | | | | | | | | | | | | | | | | |
| Net unrealized investment/derivative gains | - | | | | - | | | | - | | | | - | | | | - | | | | 741 | | | | 741 | |
| Other comprehensive income, net of tax | | | | | | | | | | | | | | | | | | | | | | | | | 741 | |
| Comprehensive income | | | | | | | | | | | | | | | | | | | | | | | | $ | 30,001 | |
| Cash dividends, $.45 per common share | - | | | | - | | | | - | | | | (6,919 | ) | | | - | | | | - | | | | (6,919 | ) |
| |
| Issuance of common stock-stock options | 367 | | | | 459 | | | | 4,248 | | | | - | | | | - | | | | - | | | | 4,707 | |
| Redemption of stock pursuant to stock plans | (39 | ) | | | (48 | ) | | | (1,034 | ) | | | - | | | | - | | | | - | | | | (1,082 | ) |
| Activity in deferred compensation plan | (5 | ) | | | (6 | ) | | | (160 | ) | | | - | | | | - | | | | - | | | | (166 | ) |
| Issuance of common stock-restricted stock | 58 | | | | 72 | | | | (72 | ) | | | - | | | | - | | | | - | | | | - | |
| Transition adjustment for the adoption of SFAS 123(R) | - | | | | - | | | | (1,773 | ) | | | - | | | | 1,773 | | | | | | | | | |
| Issuance of common stock-acquisition related | 608 | | | | 760 | | | | 15,712 | | | | | | | | | | | | | | | | 16,472 | |
| Common stock repurchased and retired | (95 | ) | | | (119 | ) | | | (2,651 | ) | | | - | | | | - | | | | - | | | | (2,770 | ) |
| Stock based compensation expense | - | | | | - | | | | 1,641 | | | | - | | | | - | | | | - | | | | 1,641 | |
| Tax benefit associated with stock plans | - | | | | - | | | | 1,875 | | | | - | | | | - | | | | - | | | | 1,875 | |
| BALANCE, December 31, 2006 | 15,586 | | | | 19,482 | | | | 71,762 | | | | 109,952 | | | | - | | | | (314 | ) | | $ | 200,882 | |
| |
| Comprehensive income: | | | | | | | | | | | | | | | | | | | | | | | | | | |
| Net income | | | | | | | | | | | | | 16,842 | | | | | | | | | | | $ | 16,842 | |
| Other comprehensive income, net of tax: | | | | | | | | | | | | | | | | | | | | | | | | | | |
| Net unrealized investment/derivative gains | | | | | | | | | | | | | | | | | | | | | (119 | ) | | | (119 | ) |
| Other comprehensive income, net of tax | | | | | | | | | | | | | | | | | | | | | | | | | (119 | ) |
| Comprehensive income | | | | | | | | | | | | | | | | | | | | | | | | $ | 16,723 | |
| Cash dividends, $.51 per common share | | | | | | | | | | | | | (8,002 | ) | | | | | | | | | | | (8,002 | ) |
| |
| Issuance of common stock-stock options | 162 | | | | 202 | | | | 2,123 | | | | | | | | | | | | | | | | 2,325 | |
| Redemption of stock pursuant to stock plans | (22 | ) | | | (28 | ) | | | (611 | ) | | | | | | | | | | | | | | | (639 | ) |
| Activity in deferred compensation plan | (2 | ) | | | (2 | ) | | | (82 | ) | | | | | | | | | | | | | | | (84 | ) |
| Issuance of common stock-restricted stock | 74 | | | | 93 | | | | (93 | ) | | | | | | | | | | | | | | | - | |
| Common stock repurchased and retired | (205 | ) | | | (256 | ) | | | (5,591 | ) | | | | | | | | | | | | | | | (5,847 | ) |
| Stock based compensation expense | | | | | | | | | 2,030 | | | | | | | | | | | | | | | | 2,030 | |
| Tax benefit associated with stock plans | | | | | | | | | 853 | | | | | | | | | | | | | | | | 853 | |
| BALANCE, December 31, 2007 | 15,593 | | | $ | 19,491 | | | $ | 70,391 | | | $ | 118,792 | | | $ | - | | | $ | (433 | ) | | $ | 208,241 | |
See notes to consolidated financial statements
54
WEST COAST BANCORP
NOTES TO CONSOLIDATED FINANCIAL STATEMENTS
1. SUMMARY OF SIGNIFICANT ACCOUNTING POLICIES
Nature of Operations.West Coast Bancorp’s activities include offering a full range of financial services through 63 branch offices in western Oregon and Washington. West Coast Trust Company, Inc. (“West Coast Trust”) provides fiduciary, agency, trust and related services, and life insurance products.
Principles of Consolidation. The accompanying consolidated financial statements include the accounts of West Coast Bancorp (“Bancorp” or “the Company”), which operates its wholly-owned subsidiaries, West Coast Bank (the “Bank”), West Coast Trust and Totten, Inc., after elimination of intercompany transactions and balances. West Coast Statutory Trusts III, IV, V, VI, VII and VIII are considered related parties to West Coast Bancorp and their financial results are not consolidated in West Coast Bancorp’s financial statements.
Use of Estimates in the Preparation of Financial Statements.The preparation of financial statements, in conformity with generally accepted accounting principles, requires management to make estimates and assumptions that affect the reported amounts of assets and liabilities and disclosure of contingent assets and liabilities at the date of the financial statements and the reported amounts of revenues and expenses during the reporting period. Actual results could differ from those estimates.
Operating Segments.Statement of Financial Accounting Standards (“SFAS”) No. 131, Disclosure about Segments of an Enterprise and Related Information, requires public enterprises to report certain information about their operating segments in the financial statements. The basis for determining the Company’s operating segments is the way in which management operates the businesses. Bancorp has identified two business segments, banking and other which include transactions of West Coast Trust. See Note 23, “Segment and related information” for more detail.
Cash and Cash Equivalents.Cash and cash equivalents include cash on hand, interest bearing deposits in other banks, amounts due from banks and federal funds sold. Generally, federal funds are purchased or sold for one-day periods.
Supplemental Cash Flow Information.For purposes of reporting cash flows, cash and cash equivalents include cash on hand, amounts due from banks and federal funds sold. The following table presents supplemental cash flow information for the years ended December 31, 2007, 2006 and 2005. See note 2, “Acquisition”, for additional information.
| (Dollars in thousands) | December 31, |
| | 2007 | | 2006 | | 2005 |
| Supplemental cash flow information: | | | | | | | | | | |
| Cash paid in the year for: | | | | | | | | | | |
| Interest | $ | 68,330 | | | $ | 49,155 | | $ | 26,171 | |
| Income taxes | $ | 19,131 | | | $ | 14,119 | | $ | 13,641 | |
| Noncash investing and financing activities: | | | | | | | | | | |
| Change in unrealized gain (loss) on available | | | | | | | | | | |
| for sale securities and derivatives, net of tax | $ | (119 | ) | | $ | 741 | | $ | (1,463 | ) |
| Dividends declared and accrued in other liabilities | $ | 2,110 | | | $ | 1,873 | | $ | 1,550 | |
| Net activity in other real estate owned | $ | 3,793 | | | $ | - | | $ | - | |
| Stock issued for acquisition | $ | - | | | $ | 16,472 | | $ | - | |
Trading Securities.Debt and equity securities that are bought and held principally for the purpose of selling them in the near term are classified as trading securities and reported at fair value, with unrealized gains and losses included in earnings. Trading assets held at December 31, 2007 and 2006 are related solely to assets held in a Rabbi Trust for benefit of the Company’s deferred compensation plans.
Investment Securities.Investment securities are classified as either available for sale or held to maturity. For purposes of computing gains and losses, cost of securities sold is determined using the specific identification method. Available for sale securities are carried at fair value with unrealized gains and losses, net of any tax effect, added to or deducted directly from stockholders’ equity. Held to maturity securities are carried at amortized cost. The Company does not have any held to maturity securities as of December 31, 2007 or 2006. The Company analyzes investment securities for other than temporary impairment on a periodic basis. Declines in fair value that are deemed other than temporary, if any, are reported in non-interest income.
55
1. SUMMARY OF SIGNIFICANT ACCOUNTING POLICIES (continued)
Federal Home Loan Bank Stock.Included in investment securities available for sale is the Bank’s investment in Federal Home Loan Bank of Seattle (“FHLB”) stock, which is carried at par value, which reasonably approximates its fair value. The Bank is required to maintain a minimum level of investment in FHLB stock based on specific percentages of its outstanding mortgages, total assets or FHLB advances. Stock redemptions are at the discretion of the FHLB.
Loans Held for Sale.Loans held for sale are carried at the lower of cost or market. Market value is determined in the aggregate. When a loan is sold, the gain is recognized in the consolidated statement of income as the proceeds less the book value of the loan including unamortized fees and capitalized direct costs. In addition, we originate loans to customers under Small Business Administration (“SBA”) programs that generally provide for SBA guarantees of 50% to 85% of each loan. We periodically sell the guaranteed portion of certain SBA loans to investors and retain the unguaranteed portion and servicing rights in our loan portfolio. Gains on these sales are earned through the sale of the guaranteed portion of the loan for an amount in excess of the adjusted carrying value of the portion of the loan sold. We allocate the carrying value of such loans between the portion sold, the portion retained and a value assigned to the right to service the loan. The difference between the adjusted carrying value of the portion retained and the face amount of the portion retained is amortized to interest income over the life of the related loan using a straight-line method over the anticipated lives of the pool of SBA loans.
Loans. Loans are reported net of unearned income. Interest income on loans is accrued daily on the unpaid principal balance outstanding as earned.
Loan Fees and Direct Loan Origination Costs.Loan origination and commitment fees and direct loan origination costs are deferred and recognized as an adjustment to the yield over the life of the related loans.
Commitments to Extend Credit.Unfunded loan commitments are generally related to providing credit facilities to customers of the bank and are not actively traded financial instruments. These unfunded commitments are disclosed as commitments to extend credit in Note 21 in the Notes to Consolidated Financial Statements.
Nonaccrual Loans.Loans (including impaired loans) are placed on nonaccrual status when the collection of interest or principal has become 90 days past due or is otherwise considered doubtful. When a loan is placed on nonaccrual status, unpaid accrued interest is reversed. Future interest payments are generally applied against principal. Certain customers having financial difficulties may have the terms of their loan agreements modified to require only principal payments and, as such, are reported as nonaccrual.
Subsequent to December 31, 2007, management amended the Bank’s loan policy in a manner that will accelerate the timing of placement of certain segments of the construction loan portfolio on nonaccrual status. As a consequence of this policy change, interest reversals recorded in interest income related to loans placed on nonaccrual will occur sooner. The amendment to the loan policy will also restrict the permitted use and timing of the method for capitalizing construction loan interest into the unpaid balance of construction loans. See note 5, “Loans and Allowance for Credit Losses”, for additional information. The adoption of the amendments to the loan policy did not have a material impact on the December 31, 2007 financial statements.
Impaired Loans.A loan is considered to be impaired when, based on current information and events, it is probable that the Company will be unable to collect all amounts due (both interest and principal) according to the contractual terms of the loan agreement. Impaired loans are measured based on the present value of expected future cash flows discounted at the loan’s effective interest rate or, as a practical expedient, at the loan’s observable market price or the fair market value of the collateral if the loan is collateral dependent. Loans that are currently measured at fair value or at lower of cost or fair value and certain large groups of smaller balance homogeneous loans that are collectively measured for impairment are excluded.
Allowance for Credit Losses.The allowance for credit losses is comprised of two components; the allowance for loan losses and the reserve for unfunded commitments. The allowance for loan losses is a calculation applied to outstanding loan balances, while the reserve for unfunded commitments is based upon a calculation applied to that portion of total loan commitments not yet funded for the period reported.
The allowance for credit losses is based on management’s estimates. Management determines the adequacy of the allowance for credit losses based on evaluations of the loan portfolio, recent loss experience and other factors, including economic conditions. The Company determines the amount of the allowance for credit losses required for certain sectors based on relative risk characteristics of the loan portfolio. Actual losses may vary from current estimates. These estimates are reviewed periodically and, as adjustments become necessary, are reported in earnings in the periods in which they become known. The allowance for credit losses is increased by provisions for credit losses in operating earnings. Losses are charged to the allowance while recoveries are credited to the allowance.
56
1.SUMMARY OF SIGNIFICANT ACCOUNTING POLICIES (continued)
Reserve for Unfunded Commitments.A reserve for unfunded commitments is maintained at a level that, in the opinion of management, is adequate to absorb losses associated with the Bank’s commitment to lend funds under existing agreements such as letters or lines of credit or construction loans. Management determines the adequacy of the reserve for unfunded commitments based upon reviews of individual credit facilities, current economic conditions, the risk characteristics of the various categories of commitments as well as pooled commitments with similar risk characteristics and other relevant factors. The reserve is based on estimates, and ultimate losses may vary from the current estimates. These estimates are evaluated on a regular basis and, as adjustments become necessary, they are reported in the provision for credit losses in the income statement in the periods in which they become known.
As of September 30, 2007, we reclassified $1.0 million of the allowance for loan losses to a reserve for unfunded loan commitments. The reclassification of a portion of our allowance for loans losses to a separate reserve had no impact on our provision for loan losses expense. Expense associated with unfunded commitments was recorded in the provision for credit losses in the income statement, and this practice will continue in the future.
Other Real Estate Owned.Other real estate owned (“OREO”) is real property that the Bank has taken ownership of in partial or full satisfaction of a loan or loans. OREO is recorded at the lower of the carrying amount of the loan or fair value less estimated costs to sell. This amount becomes the property’s new basis. Any write-downs based on the property fair value less estimated cost to sell at the date of acquisition are charged to the allowance for credit losses. Management periodically reviews OREO in an effort to ensure the property is carried at the lower of its new basis or fair value, net of estimated costs to sell. Any further OREO write-downs are charged to other noninterest expense. Net expenses from operations of OREO properties are included in other noninterest expense in the statements of income.
Premises and Equipment.Premises and equipment are stated at cost, less accumulated depreciation and amortization. Land is carried at cost. The provision for depreciation is computed on the straight-line method over the estimated useful lives of the related assets. In general, furniture and equipment is recorded with a useful life of 3 to 10 years, software and computer related equipment is recorded for 3 to 5 years and buildings are recorded for periods up to 40 years. Leasehold improvements are amortized over the life of the related lease, or the life of the related assets, whichever is shorter. Expenditures for major renovations and betterments of the Company’s premises and equipment are capitalized. Improvements are capitalized and depreciated over their estimated useful lives. Minor repairs, maintenance and improvements are charged to operations as incurred. When property is replaced or otherwise disposed of, the cost of such assets and the related accumulated depreciation are removed from their respective accounts. Related gain or loss, if any, is recorded in current operations.
Goodwill and Intangible Assets.At December 31, 2007, Bancorp had $14.5 million in goodwill and other intangible assets. Goodwill and other intangibles are periodically tested for impairment when impairment indicators exist, and at least once annually. If impairment was deemed to exist, the asset would be written down, with a charge to earnings.
Servicing of Financial Assets.Bancorp originates loans under SBA loan programs. Bancorp periodically sells such loans, and retains servicing rights on the loans originated and sold. The fair value of the servicing rights are determined based upon discounted cash flow analysis and such servicing rights are being amortized in proportion to, and over the period of, estimated future net servicing income. The servicing rights are periodically evaluated for impairment. No impairment was recognized during 2007, 2006, or 2005.
Income Taxes. Income taxes are accounted for using the asset and liability method. Under this method, a deferred tax asset or liability is determined based on the enacted tax rates that will be in effect when the differences between the financial statement carrying amounts and tax basis of existing assets and liabilities are expected to be reported in Bancorp’s income tax returns. The deferred tax provision for the year is equal to the net change in the net deferred tax asset from the beginning to the end of the year, less amounts applicable to the change in value related to investments available for sale as well as value changes in interest rate swaps accounted for as hedges. The effect on deferred taxes of a change in tax rates is recognized in income in the period that includes the enactment date.
Trust Company Assets.Assets (other than cash deposits) held by West Coast Trust in fiduciary or agency capacities for its trust customers are not included in the accompanying consolidated balance sheets, since such items are not assets of West Coast Trust.
Borrowings. Federal funds purchased and securities sold under agreements to repurchase generally mature within one to four days from the transaction date. Other short-term borrowed funds mature within one year from the transaction date. Long-term borrowed funds extend beyond one year.
Earnings Per Share Calculation.Earnings per share is calculated by dividing net income by the weighted average number of common shares outstanding during the year. Diluted earnings per share is calculated by adjusting income and outstanding shares, assuming conversion of all potentially dilutive securities, using the treasury stock method.
Service Charges on Deposit Accounts.Service charges on deposit accounts primarily represent monthly fees based on minimum balances or transaction-based fees. These fees are recognized as earned or as transactions occur and services are provided.
57
1. SUMMARY OF SIGNIFICANT ACCOUNTING POLICIES (continued)
Payment Systems Revenue.Credit and debit card revenue includes interchange income from credit and debit cards, annual fees, and other transaction and account management fees. Interchange income is a fee paid by a merchant bank to the card-issuing bank through the interchange network. Interchange fees are set by the credit card associations and are based on cardholder purchase volumes. The Company records interchange income as transactions occur. Transaction and account management fees are recognized as transactions occur or services are provided, except for annual fees, which are recognized over the applicable period. Volume-related payments to partners and credit card associations and expenses for rewards programs are also recorded within credit and debit card revenue. Payments to partners and expenses related to rewards programs are recorded when earned by the partner or customer.Merchant processing services revenue consists principally of transaction and account management fees charged to merchants for the electronic processing of transactions, net of interchange fees paid to the credit card issuing bank, card association assessments, and revenue sharing amounts, and are all recognized at the time the merchant’s transactions are processed or other services are performed. The Company may enter into revenue sharing agreements with referral partners or in connection with purchases of merchant contracts from sellers. The revenue sharing amounts are determined primarily on sales volume processed or revenue generated for a particular group of merchants. Merchant processing revenue also includes revenues related to point-of -sale equipment recorded as sales when the equipment is shipped or as earned for equipment rentals.
Trust and Investment Services Revenue.Trust and investment management fees are recognized over the period in which services are performed and are based on a percentage of the fair value of the assets under management or administration, fixed based on account type, or transaction-based fees.
New Accounting Pronouncements. On January 1, 2007, Bancorp adopted Financial Accounting Standards Board (“FASB”) Interpretation No. 48 (“FIN 48”), “Accounting for Uncertainty in Income Taxes - an Interpretation of FASB Statement No. 109.” FIN 48 prescribes a comprehensive model for how a company should recognize, measure, present, and disclose in its financial statements uncertain tax positions that it has taken or expects to take on a tax return. The adoption of this accounting standard did not have a material impact on the Company.
In September 2006, the FASB issued SFAS No. 157, “Fair Value Measurements.” This statement defines fair value, establishes a framework for measuring fair value and expands disclosures about fair value measurements. This statement applies under other accounting pronouncements that require or permit fair value measurements. This statement is effective for fiscal year and interim periods 2008. Management is currently evaluating the potential impact of this statement on the Company.
In February 2007, the FASB issued SFAS No. 159, “The Fair Value Option for Financial Assets and Financial Liabilities.” SFAS No. 159 provides entities with an option to report certain financial assets and liabilities at fair value with changes in fair value reported in earnings. In addition, it requires disclosures related to an entity’s election to use fair value reporting. It also requires entities to display the fair value of those assets and liabilities for which the entity has elected to use fair value on the face of the balance sheet. SFAS No. 159 is effective for fiscal year 2008. Management is currently evaluating the potential impact of this statement on the Company.
On December 4, 2007, the FASB issued SFAS No. 141(Revised), “Business Combinations” (“SFAS No. 141(R)”), and SFAS No. 160, “Noncontrolling Interests in Consolidated Financial Statements,” an amendment of ARB No. 51 (“SFAS No. 160”). These new standards are the outcome of a joint project with the International Accounting Standards Board (“IASB”). SFAS No. 141(R) and SFAS No. 160 introduce significant changes in the accounting for and reporting of business acquisitions and noncontrolling interests in a subsidiary. SFAS No. 141(R) and SFAS No. 160 continue the movement toward the greater use of fair values in financial reporting and increased transparency through expanded disclosures. SFAS No. 141(R) changes how business acquisitions are accounted for and will impact financial statements at the acquisition date and in subsequent periods. SFAS No. 160 requires noncontrolling interests (previously referred to as minority interests) to be reported as a component of equity, which changes the accounting for transactions with noncontrolling interest holders. SFAS No. 141(R) and SFAS No. 160 are effective for fiscal year 2010. Management is currently evaluating the potential impact of SFAS No. 141(R) and SFAS No. 160 on the Company.
In September 2006, the FASB's Emerging Issues Task Force ("EITF") reached a consensus on EITF Issue No. 06-4, "Accounting for Deferred Compensation and Postretirement Benefits Aspects of Endorsement Split-Dollar Life Insurance Arrangements" ("EITF 06-4"). This addresses endorsement split-dollar life insurance arrangements that provide a benefit to an employee that extends to postretirement periods. In an endorsement split-dollar arrangement, the employer owns and controls the policy, and the employer and an employee split the insurance policy's cash surrender value and/or death benefits.
The EITF consensus would require that the deferred compensation or postretirement benefit aspects of an endorsement-type split-dollar life insurance arrangement be recognized as a liability by the employer and that the obligation is not effectively settled by the purchase of a life insurance policy. The liability for future benefits would be recognized based on the substantive agreement with the employee, which may be either to provide a future death benefit or to pay for the future cost of the life insurance.
EITF 06-4 is effective for fiscal year 2008. Management is currently evaluating the potential impact of EITF 06-04 on the Company.
58
2.ACQUISITION
On June 23, 2006, the Company completed a merger transaction in which it acquired Mid-Valley Bank (“Mid-Valley”), headquartered in Woodburn, Oregon. This acquisition was consistent with the Company’s strategy of expanding its operations and market share in Oregon and Washington. Mid-Valley had a similar focus on community banking, as well as commercial and agricultural lending, as West Coast Bank. The results of operations of Mid-Valley have been included in the Company’s consolidated financial statements since the acquisition date.
The aggregate purchase price for the acquisition was $22.0 million which included cash of $5.0 million, direct merger costs of $.5 million, and approximately .6 million shares of common stock with an aggregate value of $16.5 million. The aggregate value of the common stock was calculated for this purpose using a $27.10 per share value based on the average closing price of Bancorp stock beginning two days prior to the acquisition announcement date of February 1, 2006, and ending two days after the announcement date. In addition, all outstanding options to purchase Mid-Valley stock were settled for cash payments totaling $3.6 million, which represented the aggregate difference between the transaction value of $19.19 per share of outstanding Mid-Valley stock and the exercise prices of the options.
The transaction was accounted for under the purchase method of accounting, with Mid-Valley’s assets and liabilities being recorded at their estimated fair values. Mid-Valley’s allowance for loan losses was recorded at carrying value and contained no specific reserves. The purchase price in excess of the net fair value of the assets and liabilities acquired was recorded as goodwill. The amount of goodwill recorded was $13.1 million. The goodwill will not be tax deductible for federal income tax purposes because the transaction is treated as a tax free reorganization.
The following table summarizes the estimated fair value of assets and liabilities purchased at the date of acquisition.
| | (Dollars in thousands) | | | |
| ASSETS ACQUIRED: | | |
| Cash and cash equivalents | $ | 11,924 |
| Investment securities | | 18,152 |
| Loans, net | | 71,950 |
| Premises and equipment, net | | 953 |
| Core deposit intangible assets | | 2,228 |
| Goodwill | | 13,059 |
| Other assets, net | | 3,499 |
| Total assets acquired | $ | 121,765 |
| LIABILITIES ASSUMED: | | |
| Deposits | $ | 85,547 |
| Borrowings | | 9,604 |
| Other liabilities | | 5,134 |
| Total liabilities assumed | $ | 100,285 |
| Net assets purchased | $ | 21,480 |
The Company is amortizing the resulting core deposit intangible of $2.2 million using the sum of the years digits method over seven years.
59
2. ACQUISITION (continued)
The following unaudited adjusted pro forma financial information for the years ended December 31, 2006, and 2005 assumes that the Mid-Valley acquisition occurred as of January 1, 2005. The pro forma results have been prepared for comparative purposes only and are not necessarily indicative of the results of operations which may occur in the future or that would have occurred had the Mid-Valley acquisition been consummated on the date indicated.
| | (In thousands, except per share amounts) | December 31, |
| | 2006 | | 2005 |
| Net interest income | $ | 103,166 | | $ | 90,888 |
| Provision for loan loss | | 2,733 | | | 2,339 |
| Noninterest income | | 28,217 | | | 23,331 |
| | Noninterest expense | | 84,534 | | | 77,089 |
| Income before income taxes | | 44,116 | | | 34,791 |
| Provision for income taxes | | 15,213 | | | 10,953 |
| Net income | $ | 28,903 | | $ | 23,838 |
| |
| Basic earnings per share | $ | 1.89 | | $ | 1.56 |
| Diluted earnings per share | $ | 1.80 | | $ | 1.49 |
| |
| Weighted average common shares | | 15,322 | | | 15,266 |
| Weighted average dilutive shares | | 16,015 | | | 15,952 |
3. INVESTMENT SECURITIES
The following table presents the available for sale investment portfolio as of December 31, 2007 and 2006:
| | (Dollars in thousands) | | | | | | | | | | | | |
| December 31, 2007 | Amortized | | Unrealized | | Unrealized | | | |
| | Cost | | Gross Gains | | Gross Losses | | Fair Value |
| U.S. Treasury securities | $ | 200 | | $ | 7 | | $ | - | | | $ | 207 |
| U.S. Government agency securities | | 60,554 | | | 1,009 | | | (6 | ) | | | 61,557 |
| Corporate securities | | 20,201 | | | 14 | | | (647 | ) | | | 19,568 |
| Mortgage-backed securities | | 85,050 | | | 135 | | | (988 | ) | | | 84,197 |
| Obligations of state and political subdivisions | | 85,876 | | | 577 | | | (347 | ) | | | 86,106 |
| | Equity investments and other securities | | 18,258 | | | 7 | | | (475 | ) | | | 17,790 |
| Total | $ | 270,139 | | $ | 1,749 | | $ | (2,463 | ) | | $ | 269,425 |
| |
| |
| (Dollars in thousands) | | | | | | | | | | | | |
| December 31, 2006 | Amortized | | Unrealized | | Unrealized | | | |
| | Cost | | Gross Gains | | Gross Losses | | Fair Value |
| U.S. Government agency securities | $ | 125,428 | | $ | 377 | | $ | (350 | ) | | $ | 125,455 |
| Corporate securities | | 23,753 | | | 206 | | | (74 | ) | | | 23,885 |
| Mortgage-backed securities | | 85,675 | | | 88 | | | (1,286 | ) | | | 84,477 |
| Obligations of state and political subdivisions | | 75,670 | | | 534 | | | (331 | ) | | | 75,873 |
| Equity investments and other securities | | 18,616 | | | 556 | | | (210 | ) | | | 18,962 |
| Total | $ | 329,142 | | $ | 1,761 | | $ | (2,251 | ) | | $ | 328,652 |
Gross realized gains in 2007, 2006, and 2005 were $96,000, $43,000, and $0, respectively. Gross realized losses in 2007, 2006, and 2005 were $163,000, $729,000, and $2,032,000, respectively. Dividends on investment securities for the years 2007, 2006, and 2005 were $302,000, 280,000, and 301,000, respectively. Securities with a fair value of approximately $89.1 million and $91.6 million were pledged to secure public deposits at December 31, 2007 and 2006, respectively. At December 31, 2007 and December 31, 2006, Bancorp had no reverse repurchase agreements. No outstanding mortgage-backed securities were classified as high risk at December 31, 2007 or 2006, under applicable regulatory guidelines.
60
3. INVESTMENT SECURITIES (continued)
The following table provides information on investment securities with 12 month or greater continuous unrealized losses as of December 31, 2007:
| | (Dollars in thousands) | Amortized cost of | | Fair value of | | | | |
| December 31, 2007 | securities with an | | securities with an | | | | |
| | unrealized loss more than | | unrealized loss more than | | Unrealized |
| | 12 continuous months | | 12 continuous months | | Gross Losses |
| U.S. Government agency securities | $ | 675 | | $ | 672 | | $ | (3 | ) |
| Mortgage-backed securities | | 45,116 | | | 44,261 | | | (855 | ) |
| | Obligations of state and political subdivisions | | 10,025 | | | 9,916 | | | (109 | ) |
| Equity investments and other securities | | 5,007 | | | 4,880 | | | (127 | ) |
| Total | $ | 60,823 | | $ | 59,729 | | $ | (1,094 | ) |
There were 45 investment securities with a 12 month or greater continuous unrealized loss in the investment portfolio at December 31, 2007, with a total unrealized loss of $1.1 million. At December 31, 2006, there were 73 investment securities with a 12 month or greater, continuous unrealized loss in the investment portfolio, with a total unrealized loss of $1.9 million. The unrealized loss on these securities was primarily due to changes in interest rates subsequent to their purchase. The value of most of our securities fluctuates as market interest rates change. Based on management’s evaluation and intent, none of the unrealized losses summarized in this table are considered other-than-temporary. The Company has the ability and intent to hold securities with unrealized losses until their values recover.
The following table provides information on investment securities which have an unrealized loss and have been in an unrealized loss position for less than 12 months as of December 31, 2007:
| | (Dollars in thousands) | Amortized cost of | | Fair value of | | | | |
| December 31, 2007 | securities with an | | securities with an | | | | |
| | unrealized loss less than | | unrealized loss less than | | Unrealized |
| | 12 continuous months | | 12 continuous months | | Gross Losses |
| U.S. Government agency securities | $ | 504 | | $ | 501 | | $ | (3 | ) |
| | Corporate securities | | 14,189 | | | 13,542 | | | (647 | ) |
| Mortgage-backed securities | | 21,928 | | | 21,795 | | | (133 | ) |
| Obligations of state and political subdivisions | | 22,555 | | | 22,317 | | | (238 | ) |
| Equity investments and other securities | | 2,947 | | | 2,599 | | | (348 | ) |
| Total | $ | 62,123 | | $ | 60,754 | | $ | (1,369 | ) |
There were a total of 47 securities in Bancorp’s investment portfolio at December 31, 2007, that have been in a continuous unrealized loss position for less than 12 months, with a book value of $62.1 million and a total unrealized loss of $1.4 million. At December 31, 2006, there were a total of 39 securities in Bancorp’s investment portfolio that have been in a continuous unrealized loss position for less than 12 months, with a book value of $59.7 million and a total unrealized loss of $.3 million. The unrealized loss on our investment securities portfolio was substantially due to an increase in interest rates subsequent to purchasing these securities. The fair value of these securities fluctuates as market interest rates change. Based on management’s evaluation and intent, none of the unrealized losses summarized in this table are considered other-than-temporary. The Company has the ability and intent to hold securities with a stated maturity until the value recovers.
61
4. MATURITIES OF INVESTMENT SECURITIES
The follow table presents the maturities of the investment portfolio at December 31, 2007:
| | (Dollars in thousands) | Available for sale |
| December 31, 2007 | Amortized cost | | Fair value |
| U.S. Treasury securities | | | | | |
| One year or less | $ | - | | $ | - |
| After one year through five years | | 200 | | | 207 |
| After five through ten years | | - | | | - |
| Due after ten years | | - | | | - |
| Total | | 200 | | | 207 |
| |
| U.S. Government agency securities: | | | | | |
| | One year or less | $ | 9,103 | | $ | 9,139 |
| After one year through five years | | 48,543 | | | 49,412 |
| After five through ten years | | 1,959 | | | 2,003 |
| Due after ten years | | 949 | | | 1,003 |
| Total | | 60,554 | | | 61,557 |
| |
| Corporate securities: | | | | | |
| One year or less | | 2,001 | | | 2,005 |
| After one year through five years | | - | | | - |
| After five through ten years | | 4,210 | | | 4,115 |
| Due after ten years | | 13,990 | | | 13,448 |
| Total | | 20,201 | | | 19,568 |
| |
| Obligations of state and political subdivisions: | | | | | |
| One year or less | | 3,170 | | | 3,185 |
| After one year through five years | | 26,672 | | | 26,887 |
| After five through ten years | | 34,306 | | | 34,509 |
| Due after ten years | | 21,728 | | | 21,525 |
| Total | | 85,876 | | | 86,106 |
| | | | | | |
| Sub-total | | 166,831 | | | 167,438 |
| |
| Mortgage-backed securities | | 85,050 | | | 84,197 |
| Equity investments and other securities | | 18,258 | | | 17,790 |
| Total securities | $ | 270,139 | | $ | 269,425 |
Mortgage-backed securities, including collateralized mortgage obligations and asset-backed securities, have maturities that will differ from contractual maturities because borrowers may have the right to call or prepay obligations with or without call or prepayment penalties.
62
5. LOANS AND ALLOWANCE FOR CREDIT LOSSES
The following table presents the loan portfolio as of December 31, 2007 and 2006:
| | (Dollars in thousands) | December 31, |
| | 2007 | | 2006 |
| Commercial loans | $ | 504,101 | | | $ | 463,188 | |
| Real estate construction | | 517,988 | | | | 365,954 | |
| | Real estate mortgage | | 330,803 | | | | 287,495 | |
| Commercial real estate | | 796,622 | | | | 804,865 | |
| Installment and other consumer | | 23,155 | | | | 26,188 | |
| Total loans | | 2,172,669 | | | | 1,947,690 | |
| Allowance for loan losses | | (46,917 | ) | | | (23,017 | ) |
| Total loans, net | $ | 2,125,752 | | | $ | 1,924,673 | |
As of September 30, 2007, we reclassified a portion of the allowance for loan losses and recorded a reserve for unfunded loan commitments. The amount reclassified into a reserve for unfunded commitments on the balance sheet was $1.0 million or ..05% of total loans. At December 31, 2007, the reserve for unfunded commitments was $8.0 million. For purposes of comparison to prior periods, the combined allowance for loan losses and reserve for unfunded commitments, defined as the total allowance for credit losses, is presented in the table below.
The following is an analysis of the changes in the allowance for credit losses:
| (Dollars in thousands) | Year Ending December 31, |
| | 2007 | | 2006 | | 2005 |
| Balance, beginning of period | $ | 23,017 | | | $ | 20,469 | | | $ | 18,971 | |
| Provision for credit losses | | 38,956 | | | | 2,733 | | | | 2,175 | |
| Losses charged to the allowance | | (7,713 | ) | | | (1,921 | ) | | | (1,624 | ) |
| Recoveries credited to the allowance | | 643 | | | | 849 | | | | 947 | |
| Allowance for loan losses, from acquisition | | - | | | | 887 | | | | - | |
| Balance, end of period | $ | 54,903 | | | $ | 23,017 | | | $ | 20,469 | |
| | |
| Components of allowance for credit losses | | | | | | | | | | | |
| Allowance for loan losses | $ | 46,917 | | | $ | 23,017 | | | $ | 20,469 | |
| Reserve for unfunded commitments | | 7,986 | | | | - | | | | - | |
| | Total allowance for credit losses | $ | 54,903 | | | $ | 23,017 | | | $ | 20,469 | |
The provision for credit losses of $38.9 million increased $36.2 million in 2007 compared to 2006, largely due to the significant fourth quarter provision for credit losses of $27.8 million associated with our two-step loan portfolio as well as higher net loan charge-offs in the commercial and residential construction loan portfolios.
Loans on which the accrual of interest has been discontinued amounted to approximately $26.4 million, $1.5 million and $1.1 million at December 31, 2007, 2006, and 2005, respectively. Subsequent to December 31, 2007, management amended the Bank’s loan policy in a manner that will accelerate the timing of placement of certain segments of the construction loan portfolio on nonaccrual status. As a consequence of this policy change, interest reversals recorded in interest income related to loans placed on nonaccrual will occur sooner. If the revised loan policy was in place as of December 31, 2007, nonaccrual loans would have been approximately $55.3 million compared to the reported 26.4 million.
Interest income foregone on nonaccrual loans was approximately $1.4 million, $.1 million and $.1 million in 2007, 2006, and 2005, respectively.
At December 31, 2007 and 2006, Bancorp’s recorded investment in certain loans that were considered to be impaired was $33.2 million and $6.2 million, respectively. Of these impaired loans, $21.7 million and $2.5 million, respectively, had a specific related valuation allowance of $3.6 million and $1.2 million, respectively, while $11.5 million and $3.7 million did not require a specific valuation allowance at the same dates. Management believes the balance of the allowance for credit losses in excess of these specific reserves is adequate to absorb losses on all loans and loan commitments in the portfolio. The process for determining the adequacy of the allowance for credit losses is critical to our financial results. It requires difficult, subjective and complex judgments, as a result of the need to make estimates about the effect of matters that are uncertain. Therefore, we cannot provide assurance that, in any particular period, we will not have sizeable credit losses in relation to the amount reserved. We may need to significantly adjust the allowance for credit losses, considering current factors at the time, including economic or market condition and ongoing internal and external examination processes.
63
5. LOANS AND ALLOWANCE FOR CREDIT LOSSES (continued)
The average recorded investment in impaired loans for the years ended December 31, 2007, 2006, and 2005 was approximately, $15.5 million, $3.8 million and $4.4 million, respectively. For the years ended December 31, 2007, 2006 and 2005, interest income recognized on impaired loans totaled $23,000, $220,000, and $272,000, respectively, all of which was recognized on a cash basis.
At December 31, 2007 and 2006, Bancorp had $1.4 million and $.9 million, respectively, of overdrafts classified as loans in the installment and other consumer loan category.
The Bank makes commercial, residential and consumer loans to customers primarily throughout Oregon and Washington. The Bank’s strategy for credit risk management includes well defined credit policies, specific underwriting criteria, and ongoing risk monitoring and review processes for all credit exposures. The Bank’s exposure to credit risk associated with its lending activities is measured on groups of loans with similar characteristics or on individual loans. Although the Bank has a diversified loan portfolio, a substantial portion of the loans in the portfolio were made to borrowers whose ability to honor their loan contracts is dependent upon the economies of Oregon and/or Washington. In addition, we have identified the Bank’s two-step residential construction loan (“two-step loan”) portfolio, which is a portion of our real estate construction loan portfolio, as having a concentration of credit risk.
Given certain market disruptions occurring over the second half of 2007, loans in the two-step loan portfolio (“two-step loan”) have demonstrated a greater rate of nonpayment than other categories of loans in the Bank’s loan portfolio. Common issues giving rise to nonpayment by two-step loan borrowers include: difficulties obtaining permanent financing, construction delays or cost overruns, valuations on completed projects below expectations, borrower cash flow limitations, and borrowing for investment purposes without the capacity to carry the property through a down sales cycle.
The following table presents information on the Bank’s real estate construction loans including two-step loans for the dates shown:
| | | December 31, |
| | 2007 | | 2006 |
| | (Dollars in thousands) | | Amount | | Percent | | Amount | | Percent |
| Commercial construction | $ | 90,670 | | | 17% | | $ | 63,592 | | | 17% |
| Two-step residential construction loans | | 262,952 | | | 51% | | | 171,692 | | | 47% |
| Residential construction to builder | | 80,737 | | | 16% | | | 62,709 | | | 17% |
| Residential subdivision or site development | | 84,620 | | | 16% | | | 70,351 | | | 20% |
| Net deferred fees | | (991 | ) | | 0% | | | (2,390 | ) | | -1% |
| Total real estate construction loans | $ | 517,988 | | | 100% | | $ | 365,954 | | | 100% |
6. PREMISES AND EQUIPMENT
Premises and equipment consists of the following:
| | (Dollars in thousands) | December 31, |
| | 2007 | | 2006 |
| Land | $ | 4,439 | | | $ | 4,465 | |
| Buildings and improvements | | 28,809 | | | | 26,760 | |
| | Furniture and equipment | | 28,695 | | | | 28,478 | |
| Construction in progress | | 3,339 | | | | 1,413 | |
| | | 65,282 | | | | 61,116 | |
| Accumulated depreciation | | (30,549 | ) | | | (29,029 | ) |
| Total | $ | 34,733 | | | $ | 32,087 | |
Depreciation included in occupancy and equipment expense amounted to $4.6 million, $3.6 million, and $3.0 million for the years ended December 31, 2007, 2006, and 2005, respectively. The Company periodically reviews the recorded value of its long-lived assets, specifically premises and equipment, to determine whether impairment exists.
64
7. GOODWILL AND INTANGIBLE ASSETS
The following table summarizes the changes in Bancorp’s goodwill and core deposit intangible asset for the years ended December 31, 2007 and 2006:
| | (Dollars in thousands) | | | | Core deposit |
| | Goodwill | | intangible |
| Balance, January 1, 2006 | $ | - | | $ | 180 | |
| Additions | | 13,059 | | | 2,228 | |
| | Amortization | | - | | | (435 | ) |
| Balance, December 31, 2006 | $ | 13,059 | | $ | 1,973 | |
| Amortization | | - | | | (541 | ) |
| Balance, December 31, 2007 | $ | 13,059 | | $ | 1,432 | |
Acquired goodwill and core deposit intangible are related to the acquisition of Mid-Valley Bank. Management evaluates goodwill on an annual basis as of April 30, or when other impairment indicators exist. All acquired goodwill resides in the Bank operating segment.
The following table presents the forecasted core deposit intangible asset amortization expense for 2008 through 2012.
| | (Dollars in thousands) | Full year |
| | expected |
| Year | amortization |
| | 2008 | $ | 438 |
| 2009 | | 358 |
| 2010 | | 279 |
| 2011 | | 199 |
| 2012 | | 119 |
8. OTHER ASSETS
The following table summarizes Bancorp’s other assets for the years ended December 31, 2007 and 2006:
| | (Dollars in thousands) | December 31, |
| | 2007 | | 2006 |
| Deferred tax assets, net | $ | 18,314 | | $ | 5,359 |
| Accrued interest receivable | | 16,540 | | | 16,620 |
| Investment in affordable housing tax credits | | 6,889 | | | 7,568 |
| | Other real estate owned | | 3,255 | | | - |
| Other | | 16,032 | | | 11,202 |
| Total other assets | $ | 61,030 | | $ | 40,749 |
Bancorp has invested in two limited partnerships that operate qualified affordable housing properties. Tax credits and tax deductions from operating losses are passed through the partnerships to Bancorp. The Company accounts for these investments using the equity method.
65
9. BORROWINGS
The following table summarizes Bancorp’s borrowings for the years ended December 31, 2007 and 2006:
| | (Dollars in thousands) | December 31, |
| | 2007 | | 2006 |
| Short-term borrowings- | | | | | |
| FHLB advances | $ | 167,000 | | $ | 130,418 |
| Long-term borrowings- | | | | | |
| FHLB non-putable advances | | 68,100 | | | 52,991 |
| | FHLB putable advances | | 15,000 | | | 5,000 |
| Total long-term borrowings | | 83,100 | | | 57,991 |
| Total borrowings | $ | 250,100 | | $ | 188,409 |
Long-term borrowings at December 31, 2007 consist of notes with fixed maturities and putable advances with the FHLB totaling $83.1 million. Total long-term borrowings with fixed maturities were $68.1 million with rates ranging from 3.72% to 5.42%. Bancorp had two putable advances totaling $15.0 million with original terms of three and five years at a rate of 3.36 % to 4.46%, with various put options and final maturities in September 2010 and June 2009. Principal payments due at maturity on Bancorp’s long-term borrowings at December 31, 2007 are $25.0 million in 2009, $32.6 million in 2010, $5.4 million in 2011, and $20.1 million in 2012, with no balances due thereafter.
Long-term borrowings at December 31, 2006 consisted of notes with fixed maturities and putable advances with the FHLB totaling $58.0 million. Total long-term borrowings with fixed maturities were $53.0 million with rates ranging from 3.13% to 5.43% Bancorp’s putable advances total $5.0 million with an original term of five years at a rate of 3.36%, quarterly put options if LIBOR exceeds 6% and a final maturity in June 2009.
FHLB advances are collateralized as provided for in the advance, pledge and security agreements with the FHLB, by certain investment securities and mortgage-backed securities, stock owned by Bancorp including deposits at the FHLB and certain qualifying loans. At December 31, 2007 the Company had additional borrowing capacity available at the FHLB of $269.2 million. In addition, we had credit lines which totaled $145.0 million at five institutions. The maximum amount outstanding from the FHLB under term advances at month end during 2007 and 2006 was $193.5 million and $130.4 million, respectively.
Bancorp had no outstanding Federal Funds purchased or reverse repurchase agreements at December 31, 2007 and 2006.
66
10. JUNIOR SUBORDINATED DEBENTURES
At December 31, 2007, six wholly-owned subsidiary grantor trusts established by Bancorp had issued and sold $51 million of pooled trust preferred securities (“trust preferred securities”). Trust preferred securities accrue and pay distributions periodically at specified annual rates as provided in each indenture. The trusts used all of the net proceeds from each sale of trust preferred securities to purchase a like amount of junior subordinated debentures (the “Debentures”) of the Company. The Debentures are the sole assets of the trusts. The Company’s obligations under the Debentures and related documents, taken together, constitute a full and unconditional guarantee by the Company of the obligations of the trusts. The trust preferred securities are mandatorily redeemable upon the maturity of the Debentures and may be subject to earlier redemption as provided in the indentures. The Company has the right to redeem the Debentures in whole (but not in part) on or after specific dates, at a redemption price specified in the indentures plus any accrued but unpaid interest to the redemption date.
The following table is a summary of outstanding trust preferred securities at December 31, 2007:
| | (Dollars in thousands) | | | | | | | | | | | | |
| | | | | Trust preferred | | | | | | Rate at | | |
| Issuance Trust | | Issuance date | | security amount | | Rate type (1) | | Initial rate | | 12/31/07 | | Maturity date |
| West Coast Statutory Trust III | | September 2003 | | $7,500 | | Fixed | | 6.75% | | 6.75% | | September 2033 |
| West Coast Statutory Trust IV | | March 2004 | | $6,000 | | Fixed | | 5.88% | | 5.88% | | March 2034 |
| West Coast Statutory Trust V | | April 2006 | | $15,000 | | Variable | | 6.79% | | 6.42% | | June 2036 |
| West Coast Statutory Trust VI | | December 2006 | | $5,000 | | Variable | | 7.04% | | 6.67% | | December 2036 |
| | West Coast Statutory Trust VII | | March 2007 | | $12,500 | | Variable | | 6.90% | | 6.54% | | March 2037 |
| West Coast Statutory Trust VIII | | June 2007 | | $5,000 | | Variable | | 6.74% | | 6.37% | | June 2037 |
| | | Total | | $51,000 | | | | Weighted rate | | 6.45% | | |
| (1) The variable rate preferred securities reprice quarterly. | | | | | | | | | | | |
The total amount of trust preferred securities outstanding at December 31, 2007, was $51 million. The interest rates on the trust preferred securities issued in April 2006, December 2006, March 2007, and June 2007 reset quarterly and are tied to the London Interbank Offered Rate (“LIBOR”) rate. The Company has the right to redeem the debentures of the September 2003 issuance in September 2008; the March 2004 issuance in March 2009; the April 2006 issuance in June 2011; the December 2006 issuance in December 2011; the March 2007 issuance in March 2012, and the June 2007 issuance in June 2012.
The junior subordinated debentures issued by Bancorp to the grantor trusts, totaling $51 million, are reflected in our consolidated balance sheet in the liabilities section at December 31, 2007 and 2006, under the caption “junior subordinated debentures.” Bancorp records interest expense on the corresponding junior subordinated debentures in the consolidated statements of income. Bancorp recorded $1.6 and $1.3 million in other assets in the consolidated balance sheet at December 31, 2007 and 2006, respectively, for the common capital securities issued by the issuing trusts.
67
11. COMMITMENTS AND CONTINGENT LIABILITIES
The Company leases land and office space under 52 leases, of which 49 are long-term operating leases that expire between 2008 and 2023. At the end of most of the respective lease terms, Bancorp has the option to renew the leases at fair market value. At December 31, 2007, minimum future lease payments under these leases and other operating leases were:
| (Dollars in thousands) | | Minimum Future |
| Year | | Lease Payments |
| 2008 | | $ | 3,705 |
| | 2009 | | | 3,572 |
| 2010 | | | 3,283 |
| 2011 | | | 3,081 |
| 2012 | | | 2,968 |
| | Thereafter | | | 12,637 |
| Total | | $ | 29,246 |
Rental expense for all operating leases was $3.7 million, $3.0 million, and $2.6 million for the years ended December 31, 2007, 2006, and 2005, respectively.
For the year ended December 31, 2007, the Company reversed an accrued liability in the amount of $1.4 million pretax for management’s estimate of loss exposure with respect to a legal matter as a result of a favorable jury verdict and settlement of the matter. The reversal of this accrued liability is reflected in the consolidated statements of income for the year ended December 31, 2007, as a decrease in noninterest expense.
Bancorp is periodically party to other litigation arising in the ordinary course of business. Based on information currently known to management, although there are uncertainties inherent in litigation, we do not believe there is any legal action to which Bancorp or any of its subsidiaries is a party that, individually or in the aggregate, will have a materially adverse effect on Bancorp’s financial condition and results of operations, cashflow, or liquidity.
12. INCOME TAXES
The provision for income taxes for the last three years consisted of the following:
| | (Dollars in thousands) | Year ended December 31, |
| | 2007 | | 2006 | | 2005 |
| Current | | | | | | | | | |
| | Federal | $ | 17,401 | | | $ | 13,009 | | $ | 8,510 |
| State | | 2,599 | | | | 1,874 | | | 782 |
| | | 20,000 | | | | 14,883 | | | 9,292 |
| Deferred | | | | | | | | | |
| Federal | | (11,143 | ) | | | 369 | | | 1,489 |
| State | | (1,736 | ) | | | 58 | | | 230 |
| | | (12,879 | ) | | | 427 | | | 1,719 |
| Total | | | | | | | | | |
| Federal | | 6,258 | | | | 13,378 | | | 9,999 |
| State | | 863 | | | | 1,932 | | | 1,012 |
| Total | $ | 7,121 | | | $ | 15,310 | | $ | 11,011 |
68
12. INCOME TAXES (continued)
Net deferred taxes are included in other assets on the Company’s balance sheet. The tax effect of temporary differences that give rise to significant portions of deferred tax assets and deferred tax liabilities as of December 31, 2007 and 2006 are presented below:
| | (Dollars in thousands) | December 31, |
| | 2007 | | 2006 |
| Deferred tax assets: | | | | | |
| Allowance for loan losses | $ | 18,030 | | $ | 8,845 |
| Reserve for unfunded commitments | | 3,069 | | | - |
| Net unrealized loss on investments | | | | | |
| available for sale | | 280 | | | 193 |
| Net unrealized loss on | | | | | |
| derivatives-Swap | | - | | | 11 |
| Deferred employee benefits | | 1,092 | | | 1,293 |
| Accrued contingency expense | | - | | | 526 |
| Loss on impairment of securities | | 405 | | | 506 |
| Stock option and restricted stock | | 488 | | | 320 |
| Other | | 1,015 | | | 450 |
| Total deferred tax assets | | 24,379 | | | 12,144 |
| |
| Deferred tax liabilities: | | | | | |
| Accumulated depreciation | | 1,134 | | | 1,437 |
| Loan origination costs | | 2,365 | | | 2,420 |
| Federal Home Loan Bank stock dividends | | 1,826 | | | 1,826 |
| Intangible assests | | 458 | | | 645 |
| Other | | 282 | | | 457 |
| Total deferred tax liabilities | | 6,065 | | | 6,785 |
| Net deferred tax assets | $ | 18,314 | | $ | 5,359 |
Based on historical performance, the Company believes it is more likely than not that the net deferred tax assets at December 31, 2007 and 2006 will be used to reduce future taxable income and therefore no valuation allowance associated with deferred tax assets has been established at December 31, 2007 and 2006.
The effective tax rate varies from the federal income tax statutory rate. The reasons for the variance are as follows:
| (Dollars in thousands) | Year ended December 31, |
| | | 2007 | | 2006 | | 2005 |
| Expected federal income tax provision (1) | $ | 8,387 | | | $ | 15,599 | | | $ | 12,198 | |
| State income tax, net of federal income tax effect | | 561 | | | | 1,256 | | | | 658 | |
| Interest on obligations of state and political subdivisions | | | | | | | | | | | |
| exempt from federal tax | | (1,247 | ) | | | (1,068 | ) | | | (973 | ) |
| Investment tax credits | | (598 | ) | | | (521 | ) | | | (521 | ) |
| Bank owned life insurance | | (303 | ) | | | (286 | ) | | | (291 | ) |
| Stock options | | 149 | | | | 186 | | | | - | |
| Other, net | | 172 | | | | 144 | | | | (60 | ) |
| Total | $ | 7,121 | | | $ | 15,310 | | | $ | 11,011 | |
| | | | | | | | | | | | |
| (1) Federal income tax provision applied at 35%. | | | | | | | | | | | |
Bancorp is subject to U.S. federal income tax and income tax of the State of Oregon. The years 2004 through 2006 remain open to examination for federal income taxes, and years 2003 through 2006 remain open for State examination. As of January 1, 2007, and December 31, 2007, Bancorp had no unrecognized tax benefits or uncertain tax positions. In addition, Bancorp had no accrued interest or penalties as of January 1, 2007 or December 31, 2007. It is Bancorp’s policy to record interest and penalties as a component of income tax expense.
69
13. STOCKHOLDERS’ EQUITY AND REGULATORY REQUIREMENTS
Authorized capital of Bancorp includes 10,000,000 shares of Preferred Stock no par value, none of which were issued at December 31, 2007, or 2006.
In July 2000, Bancorp announced a stock repurchase program that was expanded in September 2000, June 2001, September 2002, April 2004, and by 1.0 million shares in September 2007. Under this plan, the Company can purchase up to 4.88 million shares of the Company’s common stock. The Company intends to use existing funds and/or long-term borrowings to finance the repurchases. Total shares available for repurchase under this plan are 1,052,000 at December 31, 2007. The following table presents information with respect to Bancorp’s stock repurchase program.
| | | | | | | Average cost per |
| | (Shares and dollars in thousands) | Shares repurchased in period | | Cost of shares repurchased | | share |
| Year ended 2000 | 573 | | | $ 5,264 | | | $ 9.19 |
| Year ended 2001 | 534 | | | 6,597 | | | 12.35 |
| Year ended 2002 | 866 | | | 13,081 | | | 15.11 |
| Year ended 2003 | 587 | | | 10,461 | | | 17.81 |
| Year ended 2004 | 484 | | | 10,515 | | | 21.73 |
| Year ended 2005 | 484 | | | 11,815 | | | 24.41 |
| Year ended 2006 | 95 | | | 2,770 | | | 29.16 |
| Year ended 2007 | 205 | | | 5,847 | | | 28.52 |
| Plan to date total | 3,828 | | | $66,350 | | | $17.33 |
The Federal Reserve and Federal Deposit Insurance Corporation (“FDIC”) have established minimum requirements for capital adequacy for bank holding companies and member banks. Under capital adequacy guidelines and the regulatory framework for prompt corrective action, Bancorp and the Bank must meet specific capital guidelines that involve quantitative measures of assets, liabilities and certain off balance sheet items. The Federal Reserve and FDIC risk based capital guidelines require banks and bank holding companies to have a ratio of Tier 1 capital to total risk weighted assets of at least 4%, and a ratio of total capital to total risk weighted assets of 8% or greater. In addition, the leverage ratio of Tier 1 capital to total average assets less intangibles is required to be at least 3%. Bancorp and its bank subsidiary’s capital components, classification, risk weightings and other factors are also subject to qualitative judgments by regulators. Failure to meet minimum capital requirements can initiate certain action by regulators that, if undertaken, could have a material effect on Bancorp’s financial statements. As of December 31, 2007, Bancorp and its subsidiary bank are considered “Well Capitalized” under current risk based capital regulatory guidelines, which require well capitalized banks and bank holding companies to maintain Tier 1 capital of at least 6%, total risk based capital of at least 10% and a leverage ratio of at least 5%. Management believes that no events or changes in conditions have subsequently occurred which would significantly change Bancorp’s capital position. Dividends are limited under federal and Oregon laws and regulations pertaining to Bancorp’s financial condition. Payment of dividends by the Bank may also be subject to restriction by state and federal banking regulators. Under the restrictions of maintaining adequate minimum capital, as of December 31, 2007, the Bank could have declared dividends totaling $62.8 million without obtaining prior regulatory approval.
The following table presents selected risk adjusted capital information as of December 31, 2007 and 2006:
| | 2007 | | 2006 |
| |
| |
| | | | | | | | | | | Percent required | | | | | | | | | | | Percent required |
| | | | | | | | Amount Required | | for Minimum | | | | | | | | Amount Required | | for Minimum |
| (Dollars in thousands) | | | | | | | For Minimum | | Capital | | | | | | | | For Minimum | | Capital |
| | Amount | | Ratio | | Capital Adequacy | | Adequacy | | Amount | | Ratio | | Capital Adequacy | | Adequacy |
| Tier 1 Capital | | | | | | | | | | | | | | | | | | | | | |
| West Coast Bancorp | $ | 244,165 | | 9.88 | % | | $ | 98,804 | | 4% | | $ | 227,165 | | 9.85 | % | | $ | 92,277 | | 4% |
| West Coast Bank | | 228,976 | | 9.28 | % | | | 98,687 | | 4% | | | 212,446 | | 9.22 | % | | | 92,156 | | 4% |
| | | | | | | | | | | | | | | | | | | | | | |
| Total Capital | | | | | | | | | | | | | | | | | | | | | |
| West Coast Bancorp | $ | 276,306 | | 11.15 | % | | $ | 197,608 | | 8% | | $ | 250,406 | | 10.85 | % | | $ | 184,555 | | 8% |
| West Coast Bank | | 260,080 | | 10.54 | % | | | 197,373 | | 8% | | | 235,688 | | 10.23 | % | | | 184,311 | | 8% |
| | | | | | | | | | | | | | | | | | | | | | |
| Leverage Ratio | | | | | | | | | | | | | | | | | | | | | |
| West Coast Bancorp | $ | 244,165 | | 9.41 | % | | $ | 77,855 | | 3% | | $ | 227,165 | | 9.64 | % | | $ | 70,721 | | 3% |
| West Coast Bank | | 228,976 | | 8.83 | % | | | 77,828 | | 3% | | | 212,446 | | 9.01 | % | | | 70,701 | | 3% |
70
14. BALANCES WITH THE FEDERAL RESERVE BANK
The Bank is required to maintain cash reserves or deposits with the Federal Reserve equal to a percentage of reservable deposits. The average required reserves for the Bank were $5.0 million and $4.9 million during the years ended December 31, 2007 and 2006, respectively.
15. EARNINGS PER SHARE
The following table reconciles the numerator and denominator of the basic and diluted earnings per share computations:
| | | | Weighted Average | | |
| (Dollars and shares in thousands) | Net Income | | Shares | | Per Share Amount |
| |
| | For the year ended December 31, 2007 |
| | Basic earnings | $ | 16,842 | | 15,507 | | $ | 1.09 |
| Stock options | | | | 497 | | | |
| Restricted stock | | | | 41 | | | |
| Diluted earnings | $ | 16,842 | | 16,045 | | $ | 1.05 |
| |
| | For the year ended December 31, 2006 |
| Basic earnings | $ | 29,260 | | 15,038 | | $ | 1.95 |
| Stock options | | | | 648 | | | |
| Restricted stock | | | | 44 | | | |
| Diluted earnings | $ | 29,260 | | 15,730 | | $ | 1.86 |
| |
| | For the year ended December 31, 2005 |
| Basic earnings | $ | 23,840 | | 14,658 | | $ | 1.63 |
| Stock options | | | | 642 | | | |
| Restricted stock | | | | 44 | | | |
| Diluted earnings | $ | 23,840 | | 15,344 | | $ | 1.55 |
Bancorp had no reconciling items between net income and income available to common stockholders for the periods reported. There were 145,454 shares having an antidilutive effect on earnings per share in 2007, and there were no shares having an antidilutive effect on earnings per share in 2006 and 2005. Antidilutive shares are excluded from Bancorp’s earnings per share calculations.
71
16. COMPREHENSIVE INCOME
The following table displays the components of other comprehensive income for the last three years:
| (Dollars in thousands) | Year ended December 31, |
| | 2007 | | 2006 | | 2005 |
| | Net income as reported | $ | 16,842 | | | $ | 29,260 | | | $ | 23,840 | |
| |
| Unrealized holding gains (losses) on securities: | | | | | | | | | | | |
| Unrealized holding gains (losses) arising during the year | | (291 | ) | | | 541 | | | | (4,713 | ) |
| Tax (provision) benefit | | 114 | | | | (213 | ) | | | 1,852 | |
| Unrealized holding gains (losses) arising during the year, net of tax | | (177 | ) | | | 328 | | | | (2,861 | ) |
| |
| Unrealized (losses) gains on derivatives- cash flow hedges | | 28 | | | | (6 | ) | | | 270 | |
| Tax benefit (provision) | | (11 | ) | | | 2 | | | | (106 | ) |
| Unrealized (losses) gains on derivatives- cash flow hedges, net of tax | | 17 | | | | (4 | ) | | | 164 | |
| |
| Less: Reclassification adjustment for impairment and | | | | | | | | | | | |
| losses on sales of securities | | 67 | | | | 686 | | | | 2,032 | |
| Tax benefit | | (26 | ) | | | (269 | ) | | | (798 | ) |
| Net realized losses, net of tax | | 41 | | | | 417 | | | | 1,234 | |
| | | | | | | | | | | | |
| Total comprehensive income | $ | 16,723 | | | $ | 30,001 | | | $ | 22,377 | |
17. TIME DEPOSITS
Included in time deposits are deposits in denominations of $100,000 or greater, totaling $286.1 million and $250.5 million at December 31, 2007 and 2006, respectively. Interest expense relating to time deposits in denominations of $100,000 or greater was $14.0 million, $9.8 million and $5.2 million for the years ended December 31, 2007, 2006 and 2005, respectively. Maturity amounts on Bancorp’s time deposits include $497.8 million in 2008, $28.4 million in 2009, $7.3 million in 2010, $4.8 million in 2011, and $12.0 million in 2012. Included in the maturity amounts are $2.1 million in variable rate time deposits that reprice monthly with maturities in the first quarter of 2008.
72
18. EMPLOYEE BENEFIT PLANS
West Coast Bancorp employee benefits include a plan established under section 401(k) of the Internal Revenue Code for certain qualified employees (the “401(k) plan”). Employee contributions up to 100 percent of salaries under the Internal Revenue Code guidelines can be made under the 401(k) plan, of which Bancorp matches 50 percent of the employees’ contributions up to a maximum of three percent of the employees’ eligible compensation. Bancorp may also elect to make discretionary contributions to the plan. Employees vest immediately in their own contributions and earnings thereon and vest in Bancorp’s contributions over five years of eligible service. In 2005 Bancorp made a qualified non-elective contribution in the amount of $700 per full-time employee, excluding certain executive officers, prorated for part time employees and with immediate vesting. Bancorp’s 401(k) plan related expenses totaled $.94 million, $.82 million and $1.17 million for 2007, 2006, and 2005, respectively, of which $0, $0, and $.4 million, respectively, were discretionary.
Bancorp provides separate non-qualified deferred compensation plans for directors and executive officers (collectively, “Deferred Compensation Plans”) as supplemental benefit plans which permit directors and selected officers to elect to defer receipt of all or any portion of their future salary, bonus or directors’ fees, including with respect to officers, amounts they otherwise might not be able to defer under the 401(k) plan due to specified Internal Revenue Code restrictions on the maximum deferral that may be allowed under that plan. Under the plans, an amount equal to compensation being deferred by participants is placed in a rabbi trust, the assets of which are available to Bancorp’s creditors, and invested consistent with the participants’ direction among a variety of investment alternatives. A deferred compensation liability of $2.4 million was accrued as of December 31, 2007, compared to $2.5 million at December 31, 2006.
Bancorp has multiple supplemental executive retirement agreements with former and current executives. The following table reconciles the accumulated liability for the benefit obligation of these agreements:
| | (Dollars in thousands) | Year ended December 31, |
| | | 2007 | | 2006 |
| Beginning balance | $ | 1,978 | | | $ | 1,371 | |
| Benefit expense | | 344 | | | | 677 | |
| Benefit payments | | (99 | ) | | | (70 | ) |
| Ending balance | $ | 2,223 | | | $ | 1,978 | |
Bancorp’s obligations under supplemental executive retirement agreements are unfunded plans and have no plan assets. The benefit obligation represents the vested net present value of future payments to individuals under the agreements. Bancorp’s benefit expense, as specified in the agreements for the entire year 2008, is expected to be $.3 million. The benefits expected to be paid are presented in the following table:
| (Dollars in thousands) | | | |
| |
| | | Benefits expected to |
| Year | | be paid |
| | 2008 | | $ | 115 |
| 2009 | | | 220 |
| 2010 | | | 185 |
| 2011 | | | 174 |
| 2012 | | | 167 |
| 2013 through 2017 | | | 835 |
73
19. STOCK PLANS
At December 31, 2007, Bancorp maintains multiple stock option plans. Bancorp’s stock option plans include the 2002 Stock Incentive Plan (“2002 Plan”), the 1999 Stock Option Plan, the Combined 1991 Employee Stock Option Plan and Non-Qualified Stock Option Plan, and the 1995 Directors Stock Option Plan. No additional grants may be made under plans other than the 2002 Plan. The 2002 Plan, which is shareholder approved, permits the grant of stock options and restricted stock awards for up to 1.9 million shares, of which .45 million shares remain available for issue, of which .18 million shares may be allocated to restricted stock awards.
All stock options have an exercise price that is equal to the closing fair market value of Bancorp’s stock on the date the options were granted. Options granted under the 2002 Plan generally vest over a three or four-year vesting period; however, certain grants have been made that vested immediately. Stock options granted have a ten-year maximum term. Options previously issued under the 1999 or prior plans are fully vested.
The following table presents information on stock options outstanding for the periods shown.
| | | | | | 2007 | | | | 2006 | | | | 2005 |
| | | | | Weighted | | | | Weighted | | | | Weighted |
| | | | | Avg. Ex. | | | | Avg. Ex. | | | | Avg. Ex. |
| | | 2007 Common Shares | | Price | | 2006 Common Shares | | Price | | 2005 Common Shares | | Price |
| | Balance, beginning of year | | 1,470,036 | | | $ | 16.61 | | 1,693,135 | | | $ | 14.80 | | 1,777,854 | | | $ | 13.61 |
| Granted | | 11,900 | | | | 31.53 | | 157,775 | | | | 27.65 | | 217,475 | | | | 20.76 |
| Exercised | | (161,834 | ) | | | 14.36 | | (366,893 | ) | | | 12.83 | | (285,944 | ) | | | 11.70 |
| Forfeited | | (8,517 | ) | | | 25.17 | | (13,981 | ) | | | 21.71 | | (16,250 | ) | | | 19.06 |
| Balance, end of year | | 1,311,585 | | | $ | 16.97 | | 1,470,036 | | | $ | 16.61 | | 1,693,135 | | | $ | 14.80 |
| Exercisable, end of year | | 1,099,940 | | | | | | 1,151,694 | | | | | | 1,392,283 | | | | |
As of December 31, 2007, outstanding stock options consist of the following:
| | | | | | Weighted Avg. | | Weighted Avg. | | | | Weighted Avg. |
| Exercise Price Range | | Options Outstanding | | Exercise Price | | Remaining Life | | Options Exercisable | | Exercise Price |
| | $ | 8.44 | - | $ 12.27 | | 381,398 | | $ | 10.53 | | 2.69 | | 381,398 | | $ | 10.53 |
| | 12.50 | - | 16.24 | | 395,836 | | | 15.18 | | 4.34 | | 395,836 | | | 15.18 |
| | 16.49 | - | 21.32 | | 358,997 | | | 20.64 | | 6.35 | | 265,688 | | | 20.55 |
| | 21.92 | - | 34.13 | | 175,354 | | | 27.48 | | 8.26 | | 57,018 | | | 26.80 |
| | Total | | | | 1,311,585 | | $ | 16.97 | | 4.93 | | 1,099,940 | | $ | 15.47 |
74
19. STOCK PLANS (continued)
The average fair value of options granted is estimated on the date of grant using the Black-Scholes option-pricing model. There were no non-qualified director options granted in 2007. The following table presents the assumptions used in the fair value calculation:
| | | | Non-Qualified Director Options | | Employee Options |
| | | 2006 | | 2005 | | 2007 | | 2006 | | 2005 |
| Risk Free interest rates | | | 4.95 | % | | | 3.88 | % | | | 4.44%-4.78 | % | | | 4.35%-5.13 | % | | | 3.82%-4.46 | % |
| Expected dividend | | | 1.64 | % | | | 1.75 | % | | | 1.48%-1.66 | % | | | 1.44%-1.65 | % | | | 1.52%-1.75 | % |
| | Expected lives, in years | | | 4 | | | | 4 | | | | 4 | | | | 4 | | | | 4 | |
| Expected volatility | | | 23 | % | | | 24 | % | | | 23 | % | | | 23 | % | | | 24 | % |
| Fair value of options granted | | $ | 6.12 | | | $ | 4.32 | | | $ | 6.80 | | | $ | 6.15 | | | $ | 4.35 | |
The following table presents information on stock options outstanding for the periods shown, less estimated forfeitures.
| | (Dollars in thousands, except share and per share data) | | Year ended December 31, |
| | | 2007 | | 2006 |
| Intrinsic value of options exercised in the period | | $ | 2,706 | | $ | 6,227 |
| |
| Stock options fully vested and expected to vest: | | | | | | |
| Number | | | 1,235,652 | | | 1,453,658 |
| Weighted avg. exercise price | | $ | 16.85 | | $ | 16.51 |
| Aggregate intrinsic value | | $ | 2,044 | | $ | 26,350 |
| Weighted avg. contractual term of options | | | 4.9 years | | | 5.7 years |
| |
| Stock options vested and currently exercisable | | | | | | |
| Number | | | 1,099,940 | | | 1,151,694 |
| Weighted avg. exercise price | | $ | 15.47 | | $ | 14.55 |
| Aggregate intrinsic value | | $ | 4,385 | | $ | 23,132 |
| Weighted avg. contractual term of options | | | 4.4 years | | | 4.9 years |
Bancorp grants restricted stock periodically as a part of the 2002 Plan for the benefit of employees and directors. At December 31, 2007, 271,000 shares remained available for grants under the 2002 Plan, of which not more than 178,000 shares can be awarded as restricted stock grants. Restricted stock grants are made at the discretion of the Board of Directors, except with regard to grants to Bancorp’s Section 16 officers, which are made at the discretion of the Board’s Compensation & Personnel Committee. Compensation expense for restricted stock is based on the market price of the Company stock at the date of the grant and amortized on a straight-line basis over the vesting period which is currently one, three or four years for all grants. Recipients of restricted stock do not pay any cash consideration to the Company for the shares, have the right to vote all shares subject to such grant and receive all dividends with respect to such shares, whether or not the shares have vested. The restriction is based upon continuous service.
Restricted stock consists of the following for the years ended December 31, 2007, 2006 and 2005:
| | | | | | Weighted | | | | Weighted | | | | Weighted |
| | | | | Average | | | | Average | | | | Average |
| | | | 2007 Restricted | | Grant Date | | 2006 Restricted | | Grant Date | | 2005 Restricted | | Grant Date |
| | | Shares | | Fair Value | | Shares | | Fair Value | | Shares | | Fair Value |
| Balance, beginning of year | | 123,746 | | | $ | 24.22 | | 123,027 | | | $ | 20.24 | | 107,271 | | | $ | 18.68 |
| Granted | | 74,170 | | | | 31.68 | | 57,840 | | | | 27.67 | | 62,050 | | | | 21.05 |
| Vested | | (47,583 | ) | | | 23.93 | | (55,715 | ) | | | 19.07 | | (44,704 | ) | | | 17.65 |
| Forfeited | | (2,016 | ) | | | 30.09 | | (1,406 | ) | | | 22.47 | | (1,590 | ) | | | 19.30 |
| Balance, end of year | | 148,317 | | | $ | 27.97 | | 123,746 | | | $ | 24.22 | | 123,027 | | | $ | 20.24 |
75
19. STOCK PLANS (continued)
The balance of unearned compensation related to these restricted shares as of December 31, 2007 and 2006 was $3.1 million and $2.3 million, respectively. Total pre-tax compensation and professional expense recognized for the restricted shares granted to employees and directors was $1.5 million, $1.0 million and $1.0 million in 2007, 2006 and 2005, respectively.
It is Bancorp’s policy to issue new shares for stock option exercises and restricted stock, rather than issue treasury shares. Bancorp expenses stock options on a straight line basis over the options’ related vesting term. Bancorp recognized pre-tax compensation and professional expense related to stock options of $.5 million and $.6 million in 2007 and 2006, respectively.
20. FAIR VALUES OF FINANCIAL INSTRUMENTS
A financial instrument is defined as cash, evidence of an ownership interest in an entity, or a contract that conveys or imposes the contractual right or obligation to either receive or deliver cash or another financial instrument. Examples of financial instruments included in Bancorp’s balance sheet are cash, federal funds sold or purchased, debt and equity securities, loans, demand, savings and other interest-bearing deposits, notes and debentures. Examples of financial instruments which are not included in the Bancorp balance sheet are commitments to extend credit and standby letters of credit.
Fair value is defined as the amount at which a financial instrument could be exchanged in a current transaction between willing parties, other than in a forced sale or liquidation, and is best evidenced by a quoted market price if one exists.
Accounting standards require the fair value of deposit liabilities with no stated maturity, such as demand deposits, NOW and money market accounts, to equal the carrying value of these financial instruments and does not allow for the recognition of the inherent value of core deposit relationships when determining fair value.
Bancorp has estimated fair value based on quoted market prices where available. In cases where quoted market prices were not available, fair values were based on the quoted market price of a financial instrument with similar characteristics, the present value of expected future cash flows or other valuation techniques that utilize assumptions which are highly subjective and judgmental in nature. Subjective factors include, among other things, estimates of cash flows, the timing of cash flows, risk and credit quality characteristics and interest rates. Accordingly, the results may not be precise, and modifying the assumptions may significantly affect the values derived. In addition, fair values established utilizing alternative valuation techniques may or may not be substantiated by comparison with independent markets. Further, fair values may or may not be realized if a significant portion of the financial instruments were sold in a bulk transaction or a forced liquidation. Therefore, any aggregate unrealized gains or losses should not be interpreted as a forecast of future earnings or cash flows. Furthermore, the fair values disclosed should not be interpreted as the aggregate current value of Bancorp.
The following methods and assumptions were used to estimate the fair value of each class of financial instruments for which it is practicable to estimate that value:
Cash and Cash Equivalents - The carrying amount is a reasonable estimate of fair value.
Investment Securities - For securities held for investment purposes, fair values are based on quoted market prices or dealer quotes. If a quoted market price is not available, fair value is estimated using quoted market prices for similar securities.
Loans - The fair value of loans is estimated by discounting the future cash flows using the current rate at which similar loans would be made to borrowers with similar credit ratings and for the same remaining maturities.
Bank owned life insurance - The carrying amount is the cash surrender value of all policies.
Deposit Liabilities - The fair value of demand deposits, savings accounts and other deposits is the amount payable on demand at the reporting date. The fair value of time deposit is estimated using the rates currently offered for deposits of similar remaining maturities.
Short-term borrowings - The carrying amount is a reasonable estimate of fair value given the short-term nature of these financial instruments.
Long-term borrowings - The fair value of the long-term borrowings is estimated by discounting the future cash flows using the current rate at which similar borrowings with similar remaining maturities could be made.
76
20. FAIR VALUES OF FINANCIAL INSTRUMENTS (continued)
Junior subordinated debentures - The carrying amount for the variable rate junior subordinated debentures is a reasonable estimate of fair value given the quarterly repricing characteristics. The fair value of the fixed rate junior subordinated debentures and trust preferred securities approximates the pricing of a preferred security offering at current market prices.
Commitments to Extend Credit, Standby Letters of Credit and Financial Guarantees - The majority of our commitments to extend credit carry current market interest rates if converted to loans. Because these commitments are generally unassignable by either the borrower or us, they only have value to the borrower and us.
The estimated fair values of financial instruments at December 31, 2007 are as follows:
| | (Dollars in thousands) | Carrying Value | | Fair Value |
| FINANCIAL ASSETS: | | | | | |
| Cash and cash equivalents | $ | 113,802 | | $ | 113,802 |
| Trading assets | | 1,582 | | | 1,582 |
| Investment securities | | 269,425 | | | 269,425 |
| | Net loans (net of allowance for loan losses | | | | | |
| and including loans held for sale) | | 2,128,939 | | | 2,151,108 |
| Bank owned life insurance | | 22,612 | | | 22,612 |
| |
| FINANCIAL LIABILITIES: | | | | | |
| Deposits | $ | 2,094,832 | | $ | 2,095,529 |
| Short-term borrowings | | 167,000 | | | 167,000 |
| Long-term borrowings | | 83,100 | | | 83,914 |
| |
| Junior subordinated debentures-variable | | 37,500 | | | 37,500 |
| Junior subordinated debentures-fixed | | 13,500 | | | 13,530 |
The estimated fair values of financial instruments at December 31, 2006 are as follows:
| | (Dollars in thousands) | Carrying Value | | Fair Value |
| FINANCIAL ASSETS: | | | | | |
| | Cash and cash equivalents | $ | 93,800 | | $ | 93,800 |
| Trading assets | | 1,075 | | | 1,075 |
| Investment securities | | 328,652 | | | 328,652 |
| Net loans (net of allowance for loan losses | | | | | |
| and including loans held for sale) | | 1,932,259 | | | 1,930,906 |
| Bank owned life insurance | | 21,718 | | | 21,718 |
| |
| Derivative instruments - Swaps | | 27 | | | 27 |
| |
| FINANCIAL LIABILITIES: | | | | | |
| Deposits | $ | 2,006,352 | | $ | 2,003,977 |
| Short-term borrowings | | 130,418 | | | 130,418 |
| Long-term borrowings | | 57,991 | | | 56,529 |
| |
| Junior subordinated debentures-variable | | 20,000 | | | 20,000 |
| Junior subordinated debentures-fixed | | 21,000 | | | 20,717 |
77
21. FINANCIAL INSTRUMENTS WITH OFF BALANCE SHEET RISK
Financial instruments held or issued for lending-related purposes.
The Bank has financial instruments with off balance sheet risk in the normal course of business to meet the financing needs of its customers. These financial instruments include commitments to extend credit and standby letters of credit. Those instruments involve, to varying degrees, elements of credit and interest rate risk in excess of the amount recognized in the Consolidated Balance Sheets.
The Bank’s exposure to credit loss in the event of nonperformance by the other party to the financial instrument for commitments to extend credit and standby letters of credit is represented by the contractual notional amount of those instruments. The Bank uses the same credit policies in making commitments and conditional obligations as for on-balance sheet instruments. As of December 31, 2007, outstanding commitments consist of the following:
| | (Dollars in thousands) | Contract or | | Contract or |
| | Notional Amount | | Notional Amount |
| | December 31, 2007 | | December 31, 2006 |
| | Financial instruments whose contract amounts represent credit risk: | | | | | |
| Commitments to extend credit in the form of loans | | | | | |
| Commercial | $ | 395,203 | | $ | 379,090 |
| Real estate construction | | 228,418 | | | 291,485 |
| Real estate mortgage | | 205,651 | | | 184,571 |
| Commercial real estate | | 27,116 | | | 16,452 |
| Installment and consumer | | 19,232 | | | 19,100 |
| Other1 | | 24,223 | | | 58,816 |
| Standby letters of credit and financial guarantees | | 8,081 | | | 6,837 |
| Account overdraft protection instruments | | 54,093 | | | 32,714 |
| | | | | | |
| Total | $ | 962,017 | | $ | 989,065 |
| 1 | | The category “other” represents commitments extended to clients or borrowers that have been extended but not yet fully executed. These extended commitments are not yet classified nor have they been placed into our loan system. |
Commitments to extend credit are agreements to lend to a customer, as long as there is no violation of any condition established in the contract. Commitments generally have fixed expiration dates or other termination clauses and may require payment of a fee. Many of the commitments may expire without being drawn upon; therefore total commitment amounts do not necessarily represent future cash requirements. Each customer’s creditworthiness is evaluated on a case-by-case basis. The amount of collateral obtained, if deemed necessary upon extension of credit, is based on management’s credit evaluation of the customer. Collateral held varies, but may include real property, accounts receivable, inventory, property, plant and equipment, and income-producing commercial properties.
Standby letters of credit are conditional commitments issued to support a customer’s performance or payment obligation to a third party. The credit risk involved in issuing letters of credit is essentially the same as that involved in extending loan facilities to customers.
Interest rates on residential 1-4 family mortgage loan applications are typically rate locked during the application stage for periods ranging from 15 to 45 days, the most typical period being 30 days. These loans are locked with various qualified investors under a best-efforts delivery program. The Company makes every effort to deliver these loans before their rate locks expire. This arrangement generally requires the Bank to deliver the loans prior to the expiration of the rate lock. Delays in funding the loans may require a lock extension. The cost of a lock extension at times is borne by the borrower and at times by the Bank. These lock extension costs paid by the Bank are not expected to have a material impact to operations. This activity is managed daily.
78
22. PARENT COMPANY ONLY FINANCIAL DATA
The following sets forth the condensed financial information of West Coast Bancorp on a stand-alone basis:
| WEST COAST BANCORP |
| | UNCONSOLIDATED BALANCE SHEETS |
| |
| As of December 31 (Dollars in thousands) | 2007 | | | 2006 |
| Assets: | | | | | |
| Cash and cash equivalents | $ | 4,102 | | $ | 5,716 |
| Investment in bank subsidiary | | 244,047 | | | 227,187 |
| Investment in other subsidiaries | | 3,708 | | | 3,238 |
| | Other assets | | 11,977 | | | 9,682 |
| Total assets | $ | 263,834 | | $ | 245,823 |
| |
| Liabilities and stockholders’ equity: | | | | | |
| Junior subordinated debentures | $ | 51,000 | | $ | 41,000 |
| Other liabilities | | 4,593 | | | 3,941 |
| Total liabilities | | 55,593 | | | 44,941 |
| Stockholders’ equity | | 208,241 | | | 200,882 |
| Total liabilities and stockholders’ equity | $ | 263,834 | | $ | 245,823 |
| WEST COAST BANCORP |
| UNCONSOLIDATED STATEMENTS OF INCOME |
| |
| | Year ended December 31 (Dollars in thousands) | 2007 | | 2006 | | 2005 |
| Income: | | | | | | | | |
| | Cash dividends from Bank | $ | 7,000 | | $ | 7,000 | | $ | 17,787 |
| Other income | | 10 | | | 65 | | | 15 |
| Total income | | 7,010 | | | 7,065 | | | 17,802 |
| Expenses: | | | | | | | | |
| Interest expense | | 3,612 | | | 2,774 | | | 3,215 |
| Other expense | | 699 | | | 650 | | | 533 |
| Total expense | | 4,311 | | | 3,424 | | | 3,748 |
| Income before income taxes and equity in undistributed | | | | | | | | |
| earnings of the subsidiaries | | 2,698 | | | 3,641 | | | 14,054 |
| Income tax benefit | | 1,678 | | | 1,310 | | | 1,456 |
| Net income before equity in undistributed earnings | | | | | | | | |
| of the subsidiaries | | 4,376 | | | 4,951 | | | 15,510 |
| Equity in undistributed earnings of the subsidiaries | | 12,466 | | | 24,309 | | | 8,330 |
| Net income | $ | 16,842 | | $ | 29,260 | | $ | 23,840 |
79
22. PARENT COMPANY ONLY FINANCIAL DATA (continued)
| WEST COAST BANCORP |
| UNCONSOLIDATED STATEMENTS OF CASH FLOWS |
| |
| | Year ended December 31 (Dollars in thousands) | 2007 | | 2006 | | 2005 |
| CASH FLOWS FROM OPERATING ACTIVITIES: | | | | | | | | | | | |
| Net income | $ | 16,842 | | | $ | 29,260 | | | $ | 23,840 | |
| Adjustments to reconcile net income to net cash | | | | | | | | | | | |
| | provided by operating activities: | | | | | | | | | | | |
| Undistributed earnings of subsidiaries | | (12,466 | ) | | | (24,309 | ) | | | (8,330 | ) |
| Increase in other assets | | (2,295 | ) | | | (3,441 | ) | | | (4,788 | ) |
| Increase (decrease) in other liabilities | | 652 | | | | 1,009 | | | | (116 | ) |
| Tax benefit associated with stock options | | - | | | | - | | | | (1,255 | ) |
| Net cash provided by operating activities | | 2,733 | | | | 2,519 | | | | 9,351 | |
| |
| CASH FLOWS FROM INVESTING ACTIVITIES: | | | | | | | | | | | |
| Purchase of Mid-Valley Bank stock | | - | | | | (5,009 | ) | | | - | |
| Capital contribution to subsidiaries | | (5,000 | ) | | | (7,500 | ) | | | - | |
| Net cash used in investing activities | | (5,000 | ) | | | (12,509 | ) | | | - | |
| |
| CASH FLOWS FROM FINANCING ACTIVITIES: | | | | | | | | | | | |
| Proceeds from issuance of junior subordinated notes | | 17,500 | | | | 20,000 | | | | - | |
| Redemption from maturity of junior subordinated notes | | (7,500 | ) | | | (5,000 | ) | | | | |
| Net proceeds from issuance of common stock | | 2,455 | | | | 5,334 | | | | 3,560 | |
| Repurchase of common stock | | (5,847 | ) | | | (2,770 | ) | | | (11,815 | ) |
| Dividends paid and cash paid for fractional shares | | (8,002 | ) | | | (6,919 | ) | | | (5,841 | ) |
| Other, net | | 2,047 | | | | 1,624 | | | | 988 | |
| Net cash provided by (used in) financing activities | | 653 | | | | 12,269 | | | | (13,108 | ) |
| |
| Net increase (decrease) in cash and cash equivalents | | (1,614 | ) | | | 2,279 | | | | (3,757 | ) |
| Cash and cash equivalents at beginning of year | | 5,716 | | | | 3,437 | | | | 7,194 | |
| Cash and cash equivalents at end of year | $ | 4,102 | | | $ | 5,716 | | | $ | 3,437 | |
80
23. SEGMENT AND RELATED INFORMATION
Bancorp accounts for intercompany fees and services at an estimated fair value according to regulatory requirements for the service provided. Intercompany items relate primarily to the use of accounting, human resources, data processing and marketing services provided by the Bank, West Coast Trust, and the holding company. All other accounting policies are the same as those described in the summary of significant accounting policies.
Summarized financial information concerning Bancorp’s reportable segments and the reconciliation to Bancorp’s consolidated results is shown in the following table. The “Other” column includes West Coast Trust’s operations and holding company related items including activity relating to trust preferred securities. Investment in subsidiaries is netted out of the presentations below. The “Intercompany” column identifies the intercompany activities of revenues, expenses and other assets, between the “Banking” and “Other” segment.
| | As of and for the year ended |
| (Dollars in thousands) | December 31, 2007 |
| | | Banking | | Other | | Intercompany | | Consolidated |
| Interest income | $ | 183,067 | | $ | 123 | | | $ | - | | | $ | 183,190 |
| Interest expense | | 64,857 | | | 3,613 | | | | - | | | | 68,470 |
| Net interest income (expense) | | 118,210 | | | (3,490 | ) | | | - | | | | 114,720 |
| Provision for credit losses | | 38,956 | | | - | | | | - | | | | 38,956 |
| Noninterest income | | 30,724 | | | 3,721 | | | | (947 | ) | | | 33,498 |
| Noninterest expense | | 82,466 | | | 3,780 | | | | (947 | ) | | | 85,299 |
| Income (loss) before income taxes | | 27,512 | | | (3,549 | ) | | | - | | | | 23,963 |
| Provision (benefit) for income taxes | | 8,505 | | | (1,384 | ) | | | - | | | | 7,121 |
| Net income (loss) | $ | 19,007 | | $ | (2,165 | ) | | $ | - | | | $ | 16,842 |
| |
| Depreciation and amortization | $ | 4,719 | | $ | 28 | | | $ | - | | | $ | 4,747 |
| | Assets | $ | 2,641,630 | | $ | 10,937 | | | $ | (5,953 | ) | | $ | 2,646,614 |
| Goodwill | $ | 13,059 | | $ | - | | | $ | - | | | $ | 13,059 |
| Loans, net | $ | 2,125,752 | | $ | - | | | $ | - | | | $ | 2,125,752 |
| Deposits | $ | 2,100,018 | | $ | - | | | $ | (5,186 | ) | | $ | 2,094,832 |
| Equity | $ | 244,047 | | $ | (35,806 | ) | | $ | - | | | $ | 208,241 |
| |
| | As of and for the year ended |
| (Dollars in thousands) | December 31, 2006 |
| | Banking | | Other | | Intercompany | | Consolidated |
| Interest income | $ | 150,706 | | $ | 92 | | | $ | - | | | $ | 150,798 |
| Interest expense | | 47,151 | | | 2,775 | | | | - | | | | 49,926 |
| Net interest income (expense) | | 103,555 | | | (2,683 | ) | | | - | | | | 100,872 |
| Provision for credit losses | | 2,733 | | | - | | | | - | | | | 2,733 |
| Noninterest income | | 25,733 | | | 3,243 | | | | (880 | ) | | | 28,096 |
| Noninterest expense | | 79,065 | | | 3,480 | | | | (880 | ) | | | 81,665 |
| Income (loss) before income taxes | | 47,490 | | | (2,920 | ) | | | - | | | | 44,570 |
| Provision (benefit) for income taxes | | 16,449 | | | (1,139 | ) | | | - | | | | 15,310 |
| Net income (loss) | $ | 31,041 | | $ | (1,781 | ) | | $ | - | | | $ | 29,260 |
| |
| Depreciation and amortization | $ | 3,685 | | $ | 171 | | | $ | - | | | $ | 3,856 |
| Assets | $ | 2,460,705 | | $ | 12,134 | | | $ | (7,467 | ) | | $ | 2,465,372 |
| Goodwill | $ | 13,059 | | $ | - | | | $ | - | | | $ | 13,059 |
| Loans, net | $ | 1,924,673 | | $ | - | | | $ | - | | | $ | 1,924,673 |
| Deposits | $ | 2,013,136 | | $ | - | | | $ | (6,784 | ) | | $ | 2,006,352 |
| Equity | $ | 227,186 | | $ | (26,304 | ) | | $ | - | | | $ | 200,882 |
81
23. SEGMENT AND RELATED INFORMATION (continued)
| | As of and for the year ended |
| (Dollars in thousands) | December 31, 2005 |
| | | Banking | | Other | | Intercompany | | Consolidated |
| Interest income | $ | 112,909 | | $ | 82 | | | $ | - | | | $ | 112,991 |
| Interest expense | | 23,215 | | | 3,215 | | | | - | | | | 26,430 |
| Net interest income (expense) | | 89,694 | | | (3,133 | ) | | | - | | | | 86,561 |
| Provision for credit losses | | 2,175 | | | - | | | | - | | | | 2,175 |
| Noninterest income | | 21,146 | | | 2,753 | | | | (800 | ) | | | 23,099 |
| Noninterest expense | | 70,462 | | | 2,972 | | | | (800 | ) | | | 72,634 |
| Income (loss) before income taxes | | 38,203 | | | (3,352 | ) | | | - | | | | 34,851 |
| | Provision (benefit) for income taxes | | 12,318 | | | (1,307 | ) | | | - | | | | 11,011 |
| Net income (loss) | $ | 25,885 | | $ | (2,045 | ) | | $ | - | | | $ | 23,840 |
| |
| Depreciation and amortization | $ | 3,407 | | $ | 8 | | | $ | - | | | $ | 3,415 |
| Assets | $ | 1,993,627 | | $ | 8,320 | | | $ | (4,809 | ) | | $ | 1,997,138 |
| Loans, net | $ | 1,533,985 | | $ | - | | | $ | - | | | $ | 1,533,985 |
| Deposits | $ | 1,653,754 | | $ | - | | | $ | (4,292 | ) | | $ | 1,649,462 |
| Equity | $ | 173,408 | | $ | (16,285 | ) | | $ | - | | | $ | 157,123 |
24. RELATED PARTY TRANSACTIONS
As of December 31, 2007 and 2006, the Bank had loan commitments to directors, senior officers, principal stockholders and their related interests totaling $20.9 million and $20.2 million, respectively. These commitments and the loan balances below were made substantially on the same terms in the course of ordinary banking business, including interest rates, maturities and collateral as those made to other customers of the Bank.
The following table presents a summary of outstanding balances for loans made to directors, senior officers, and principal stockholders of the Company and their related interests:
| | (Dollars in thousands) | December 31, |
| | 2007 | | 2006 |
| | Balance, beginning of period | $ | 8,556 | | | $ | 1,163 | |
| New loans and advances | | 10,423 | | | | 7,684 | |
| Principal payments and payoffs | | (89 | ) | | | (291 | ) |
| Balance, end of period | $ | 18,890 | | | $ | 8,556 | |
82
QUARTERLY FINANCIAL INFORMATION (unaudited)
| 2007 | |
| | (Dollars in thousands, except per share data) | December 31, | | September 30, | | June 30, | | March 31, |
| Interest income | $ | 45,528 | | | $ | 47,742 | | $ | 46,148 | | $ | 43,772 |
| Interest expense | | 17,253 | | | | 17,905 | | | 17,424 | | | 15,888 |
| Net interest income | | 28,275 | | | | 29,837 | | | 28,724 | | | 27,884 |
| Provision for credit losses | | 29,956 | | | | 2,700 | | | 3,500 | | | 2,800 |
| Noninterest income | | 8,615 | | | | 8,145 | | | 8,705 | | | 8,033 |
| Noninterest expense | | 20,160 | | | | 22,602 | | | 21,500 | | | 21,037 |
| Income before income taxes | | (13,226 | ) | | | 12,680 | | | 12,429 | | | 12,080 |
| Provision (benefit) for income taxes | | (5,739 | ) | | | 4,350 | | | 4,294 | | | 4,216 |
| | Net income (loss) | $ | (7,487 | ) | | $ | 8,330 | | $ | 8,135 | | $ | 7,864 |
| |
| Earnings (loss) per common share: | | | | | | | | | | | | |
| Basic (loss) | | ($0.48 | ) | | $ | 0.54 | | $ | 0.52 | | $ | 0.51 |
| Diluted (loss) | | ($0.48 | ) | | $ | 0.52 | | $ | 0.50 | | $ | 0.49 |
| |
| 2006 | |
| (Dollars in thousands, except per share data) | December 31, | | September 30, | | June 30, | | March 31, |
| Interest income | $ | 42,302 | | | $ | 40,549 | | $ | 35,599 | | $ | 32,348 |
| Interest expense | | 15,461 | | | | 14,254 | | | 11,050 | | | 9,161 |
| Net interest income | | 26,841 | | | | 26,295 | | | 24,549 | | | 23,187 |
| Provision for credit losses | | 1,200 | | | | 625 | | | 500 | | | 408 |
| Noninterest income | | 7,506 | | | | 7,468 | | | 7,090 | | | 6,032 |
| Noninterest expense | | 21,379 | | | | 21,138 | | | 20,571 | | | 18,577 |
| Income before income taxes | | 11,768 | | | | 12,000 | | | 10,568 | | | 10,234 |
| Provision for income taxes | | 4,068 | | | | 4,131 | | | 3,624 | | | 3,487 |
| Net income | $ | 7,700 | | | $ | 7,869 | | $ | 6,944 | | $ | 6,747 |
| |
| Earnings per common share: | | | | | | | | | | | | |
| Basic | $ | 0.51 | | | $ | 0.51 | | $ | 0.47 | | $ | 0.46 |
| Diluted | $ | 0.48 | | | $ | 0.49 | | $ | 0.45 | | $ | 0.44 |
83
ITEM 9.CHANGES IN AND DISAGREEMENTS WITH ACCOUNTANTS ON ACCOUNTING ANDFINANCIAL DISCLOSURE.
None.
ITEM 9A.CONTROLS AND PROCEDURES
Disclosure Controls and Procedures
Our disclosure controls and procedures are designed to ensure that information the Company must disclose in its reports filed or submitted under the Securities Exchange Act of 1934, as amended (the “Exchange Act”), is recorded, processed, summarized, and reported within the time periods specified in the SEC’s rules and forms. Our management has evaluated, with the participation and under the supervision of our chief executive officer (“CEO”) and chief financial officer (“CFO”), the effectiveness of our disclosure controls and procedures (as defined in Rules 13a-15(e) and 15d-15(e) of the Exchange Act) as of the end of the period covered by this report. Based on this evaluation, our CEO and CFO have concluded that, as of such date, the Company’s disclosure controls and procedures are effective in ensuring that information relating to the Company, including its consolidated subsidiaries, required to be disclosed in reports that it files under the Exchange Act is (1) recorded, processed, summarized and reported within the time periods specified in the SEC’s rules and forms, and (2) accumulated and communicated to our management, including our CEO and CFO, as appropriate to allow timely decisions regarding required disclosure.
Material Changes in Internal Control over Financial Reporting
None.
Management’s Report on Internal Control Over Financial Reporting
The Company’s management is responsible for establishing and maintaining adequate internal control over financial reporting. The Company’s internal control system is designed to provide reasonable assurance regarding the preparation, reliability and fair presentation of published financial statements for external purposes in accordance with accounting principles generally accepted in the United States of America. Management is also responsible for ensuring compliance with the federal laws and regulations concerning loans to insiders and the federal and state laws and regulations concerning dividend restrictions, both of which are designated by the Federal Deposit Insurance Corporation (“FDIC”) as safety and soundness laws and regulations. Nonetheless, all internal control systems, no matter how well designed, have inherent limitations. Even systems determined to be effective as of a particular date can provide only reasonable assurance with respect to financial statement preparation and presentation and may not eliminate the need for restatements.
The Company’s management assessed the effectiveness of the Company’s internal control over financial reporting as of December 31, 2007. In making this assessment, management used the criteria set forth by the Committee of Sponsoring Organizations of the Treadway Commission inInternal Control—Integrated Framework. Based on our assessment, we believe that, as of December 31, 2007, the Company’s internal control over financial reporting is effective based on those criteria.
The Company’s management has assessed its compliance with the designated safety and soundness laws and regulations and has maintained records of its determinations and assessments as required by the FDIC. Based on this assessment, management believes that West Coast Bancorp has complied, in all material respects, with the designated safety and soundness laws and regulations for the year ended December 31, 2007.
The Company’s independent registered public accounting firm has audited the Company’s internal control over financial reporting as of December 31, 2007, as stated in their report appearing below.
84
REPORT OF INDEPENDENT REGISTERED PUBLIC ACCOUNTING FIRM
To the Board of Directors and Stockholders of West Coast Bancorp
Lake Oswego, Oregon
We have audited the internal control over financial reporting of West Coast Bancorp and subsidiaries (the “Company”) as of December 31, 2007, based on criteria established inInternal Control — Integrated Framework issued by the Committee of Sponsoring Organizations of the Treadway Commission. Because management’s assessment and our audit were conducted to meet the reporting requirements of Section 112 of the Federal Deposit Insurance Corporation Improvement Act (FDICIA), management’s assessment and our audit of the Company’s internal control over financial reporting included controls over the preparation of the schedules equivalent to the basic financial statements in accordance with the instructions for the Consolidated Financial Statements for Bank Holding Companies (Form FR Y-9C). The Company’s management is responsible for maintaining effective internal control over financial reporting and for its assessment of the effectiveness of internal control over financial reporting included in the accompanying management’s report on internal control over financial reporting and compliance with designated laws and regulations. Our responsibility is to express an opinion on the Company’s internal control over financial reporting based on our audit.
We conducted our audit in accordance with the standards of the Public Company Accounting Oversight Board (United States). Those standards require that we plan and perform the audit to obtain reasonable assurance about whether effective internal control over financial reporting was maintained in all material respects. Our audit included obtaining an understanding of internal control over financial reporting, assessing the risk that a material weakness exists, testing and evaluating the design and operating effectiveness of internal control based on the assessed risk, and performing such other procedures as we considered necessary in the circumstances. We believe that our audit provides a reasonable basis for our opinion.
A company’s internal control over financial reporting is a process designed by, or under the supervision of, the company’s principal executive and principal financial officers, or persons performing similar functions, and effected by the company’s board of directors, management, and other personnel to provide reasonable assurance regarding the reliability of financial reporting and the preparation of financial statements for external purposes in accordance with generally accepted accounting principles. A company’s internal control over financial reporting includes those policies and procedures that (1) pertain to the maintenance of records that, in reasonable detail, accurately and fairly reflect the transactions and dispositions of the assets of the company; (2) provide reasonable assurance that transactions are recorded as necessary to permit preparation of financial statements in accordance with generally accepted accounting principles, and that receipts and expenditures of the company are being made only in accordance with authorizations of management and directors of the company; and (3) provide reasonable assurance regarding prevention or timely detection of unauthorized acquisition, use, or disposition of the company’s assets that could have a material effect on the financial statements.
Because of the inherent limitations of internal control over financial reporting, including the possibility of collusion or improper management override of controls, material misstatements due to error or fraud may not be prevented or detected on a timely basis. Also, projections of any evaluation of the effectiveness of the internal control over financial reporting to future periods are subject to the risk that the controls may become inadequate because of changes in conditions, or that the degree of compliance with the policies or procedures may deteriorate.
In our opinion, the Company maintained, in all material respects, effective internal control over financial reporting as of December 31, 2007, based on the criteria established inInternal Control – Integrated Framework issued by the Committee of Sponsoring Organizations of the Treadway Commission.
We have not examined and, accordingly, we do not express an opinion or any other form of assurance on management’s statement referring to compliance with laws and regulations.
We have also audited, in accordance with the standards of the Public Company Accounting Oversight Board (United States), the consolidated financial statements as of and for the year ended December 31, 2007, of the Company and our report dated March 5, 2008, expressed an unqualified opinion on those financial statements.
/s/ DELOITTE & TOUCHE LLP
Portland, Oregon
March 5, 2008
85
ITEM 9B.OTHER INFORMATION
None.
86
PART III
ITEM 10.DIRECTORS, EXECUTIVE OFFICERS AND CORPORATE GOVERNANCE
Information concerning directors and executive officers of Bancorp required to be included in this item is set forth under the headings “Election of Directors,” “Section 16(a) Beneficial Ownership Reporting Compliance,” and “Management” in Bancorp’s Proxy Statement for its 2008 Annual Meeting of Stockholders to be filed within 120 days of Bancorp’s fiscal year end of December 31, 2007 (the “Proxy Statement”), and is incorporated into this report by reference.
Audit and Compliance Committee
Bancorp has a separately-designated standing Audit and Compliance Committee established in accordance with Section 3(a)(58)(A) of the Exchange Act. The members of the Audit and Compliance Committee are Steven Spence (Chair), Lloyd D. Ankeny, Duane C. McDougall, and Nancy Wilgenbusch, each of whom is independent as independence for audit committee members is defined under NASDAQ listing standards applicable to the Company.
Audit Committee Financial Expert
Bancorp’s Board of Directors has determined that Duane C. McDougall, an Audit and Compliance Committee member, is an audit committee financial expert as defined in Item 407(d)(5) of Regulation S-K of the Exchange Act and is independent as independence for audit committee members is defined under NASDAQ listing standards applicable to the Company.
Code of Ethics
We have adopted a code of ethics (the “Code of Ethics”), for our CEO, CFO, principal accounting officer, and persons performing similar functions, entitled the West Coast Bancorp Code of Ethics for Senior Financial Officers. The Code of Ethics is available on our website at www.wcb.com under the tab for investor relations. Stockholders may request a free copy of the Code of Ethics from:
West Coast Bancorp
Attention: Secretary
5335 Meadows Road, Suite 201
Lake Oswego, Oregon 97035
(503) 684-0884
ITEM 11.EXECUTIVE COMPENSATION
Information concerning executive and director compensation and certain matters regarding participation in Bancorp’s compensation committee required by this item is set forth under the headings “Executive Compensation” and “Board of Directors” in the Proxy Statement and is incorporated into this report by reference.
87
| ITEM 12. | | SECURITY OWNERSHIP OF CERTAIN BENEFICIAL OWNERS AND MANAGEMENT ANDRELATED STOCK HOLDER MATTERS |
Security Ownership
Information concerning the security ownership of certain beneficial owners and management required by this item is set forth under the heading “Security Ownership of Certain Beneficial Owners and Management” in the Proxy Statement and is incorporated into this report by reference.
Equity Compensation Plan Information
Information concerning Bancorp’s equity compensation plans, including both stockholder approved plans and non-stockholder approved plans, required by this item is set forth under the heading “Executive Compensation—Equity Compensation Plan Information” in the Proxy Statement and is incorporated into this report by reference.
ITEM 13.CERTAIN RELATIONSHIPS AND RELATED TRANSACTIONS, AND DIRECTORINDEPENDENCE
Certain Relationships and Related Transactions
Information concerning certain relationships and related transactions required by this item is set forth under the heading “Transactions with Related Persons” in the Proxy Statement and is incorporated into this report by reference.
Director Independence
Information concerning the independence of Bancorp directors required by this item is set forth under the heading “Election of Directors” in the Proxy Statement and is incorporated into this report by reference.
ITEM 14.PRINCIPAL ACCOUNTANT FEES AND SERVICES
Information concerning fees paid to our accountants required by this item is included under the heading “Matters Related to our Auditors—Fees Paid to Independent Registered Public Accounting Firm” in the Proxy Statement and is incorporated into this report by reference.
88
PART IV
ITEM 15.EXHIBITS AND FINANCIAL STATEMENT SCHEDULES
| | (a)(1) | | Financial Statements: |
| |
| The financial statements and related documents listed in the Index set forth in Item 8 of this report are filed as part of this report. |
| |
| (2) | | Financial Statements Schedules: |
| |
| All other schedules to the consolidated financial statements are omitted because they are not applicable or not material or because the information is included in the consolidated financial statements or related notes in Item 8 above. |
| |
| (3) | | Exhibits: |
| |
| The response to this portion of Item 15 is submitted as a separate section of this report appearing immediately following the signature page and entitled “Index to Exhibits.” |
89
SIGNATURES
Pursuant to the requirements of Section 13 or 15(d) of the Securities Exchange Act of 1934, the registrant has duly caused this report to be signed on its behalf by the undersigned, thereunto duly authorized, on March 5, 2008.
| | WEST COAST BANCORP |
| (Registrant) |
| |
| By: | | /s/ Robert D. Sznewajs | |
| | | Robert D. Sznewajs |
| | | President and CEO |
Pursuant to the requirements of the Securities Exchange Act of 1934, this report has been signed below by the following persons on behalf of the registrant and in the capacities indicated on March 5, 2008.
| Principal Executive Officer: | | |
| | | |
| /s/ Robert D. Sznewajs | | | | President and CEO and Director |
| Robert D. Sznewajs | | |
| | | |
| Principal Financial Officer: | | |
| | | |
| /s/ Anders Giltvedt | | | | Executive Vice President and Chief Financial Officer |
| Anders Giltvedt | | |
| | | |
| Principal Accounting Officer: | | |
| | | |
| /s/ Kevin M. McClung | | | | Senior Vice President and Controller |
| Kevin M. McClung | | |
| | | |
| Remaining Directors: | | |
| | | |
| *Lloyd D. Ankeny, Chairman | | |
| *Michael J. Bragg | | |
| *Duane C. McDougall | | |
| *Steven J. Oliva | | |
| *J.F. Ouderkirk | | |
| *Steven N. Spence | | |
| *David J. Truitt | | |
| *Nancy A. Wilgenbusch, PhD. | | |
| | | |
| *By | | /s/ Robert D. Sznewajs | | | |
| | | Robert D. Sznewajs | | |
| | | Attorney-in-Fact | | |
90
Index to Exhibits
| Exhibit No. | | Exhibit |
| 3.1 | | Restated Articles of Incorporation. Incorporated by reference to Exhibit 3.1 to the Company’s Annual Report on Form 10-K for the year ended December 31, 2003 (the “2003 10-K”). |
| |
| 3.2 | | Restated Bylaws. Incorporated by reference to Exhibit 3.1 to the Company’s Current Report on Form 8-K dated October 24, 2006. |
| |
| 4 | | The Company has incurred long-term indebtedness as to which the amount involved is less than ten percent of the total assets of the Company and its subsidiaries on a consolidated basis. The Company agrees to furnish instruments relating to such indebtedness to the Commission upon its request. |
| |
| 10.1 | | Form of Indemnification Agreement for all directors and executive officers. Incorporated by reference to Exhibit 10.1 to the Company’s Quarterly Report on Form 10-Q for the quarter ended September 30, 1999.* |
| |
| 10.2 | | Change in Control Agreement between the Company and Robert D. Sznewajs dated January 1, 2003. Incorporated by reference to Exhibit 10.2 to the 2003 10-K.* |
| |
| 10.3 | | Change in Control Agreement between the Company and Anders Giltvedt dated January 1, 2003. Incorporated by reference to Exhibit 10.3 to the 2003 10-K.* |
| |
| 10.4 | | Change in Control Agreement between the Company and Xandra McKeown dated January 1, 2003. Incorporated by reference to Exhibit 10.4 to the 2003 10-K.* |
| |
| 10.5 | | Change in Control Agreement between the Company and James D. Bygland dated January 1, 2003. Incorporated by reference to Exhibit 10.5 to the 2003 10-K.* |
| |
| 10.6 | | Change in Control Agreement between the Company and Hadley Robbins dated March 5, 2007. Incorporated by reference to Exhibit 10.1 to the Quarterly Report on Form 10-Q for the quarter ended March 31, 2007 (the “March 2007 10-Q”).* |
| |
| 10.7 | | 401(k) Profit Sharing Plan. Incorporated by reference to Exhibit 99.1 to the Company’s Registration Statement on Form S-8 (Reg. No. 333-01649) filed March 12, 1996.* |
| |
| 10.8 | | Directors’ Deferred Compensation Plan. Incorporated by reference to Exhibit 4.3 to the Company’s Registration Statement on Form S-8 (Reg. No. 333-104835) filed April 30, 2003 (the “April 2003 S-8”).* |
| |
| 10.9 | | Amendment No. 2 (Freeze Amendment) to the Directors’ Deferred Compensation Plan. Incorporated by reference to Exhibit 10.9 to the Company’s Annual Report on Form 10-K for the year ended December 31, 2004 (the “2004 10-K”).* |
| |
| 10.10 | | Executives’ Deferred Compensation Plan. Incorporated by reference to Exhibit 4.4 to the April 2003 S-8.* |
| |
| 10.11 | | Amendment No. 4 (Freeze Amendment) to the Executives’ Deferred Compensation Plan. Incorporated by reference to Exhibit 10.11 to the 2004 10-K.* |
| |
| 10.12 | | Combined 1991 Incentive Stock Option Plan and 1991 Nonqualified Stock Option Plan. Incorporated by reference to Exhibit 99.1 to the Company’s Registration Statement on Form S-8 (Reg. No. 333-01651) filed March 12, 1996.* |
| |
| 10.13 | | Directors’ Stock Option Plan and Form of Agreement. Incorporated by Reference to Exhibits 99.1 and 99.2 to the Company’s Registration Statement on Form S-8 (Reg. No. 033-60259) filed June 15, 1995 (the “1995 S-8”).* |
| |
| 10.14 | | Incentive Stock Option Plan and Form of Agreement. Incorporated by reference to Exhibits 99.3 and 99.4 to the 1995 S-8.* |
| |
| 10.15 | | Nonqualified Stock Option Plan and Form of Agreement. Incorporated by reference to Exhibits 99.5 and 99.6 to the 1995 S-8.* |
| |
| 10.16 | | 1999 Stock Option Plan and Form of Agreement. Incorporated by reference to Exhibits 99.1 and 99.2 to the Company’s Registration Statement on Form S-8 (Reg. No. 333-86113) filed August 30, 1999.* |
*Indicates a management contract or compensatory plan, contract or arrangement.
91
Index to Exhibits (continued)
| Exhibit No. | | Exhibit |
| 10.17 | | 1999 Director Stock Option Plan and Form of Agreement. Incorporated by reference to Exhibits 99.1 and 99.2 to the Company’s Registration Statement on Form S-8 (Reg. No. 333-35318) filed April 21, 2000.* |
| |
| 10.18 | | 2002 Stock Incentive Plan, as amended. Incorporated by reference to Exhibit 10.2 to the Company’s Quarterly Report on Form 10-Q for the quarter ended September 30, 2006 (the “September 2006 10-Q”).* |
| |
| 10.19 | | Forms of Option Agreements and Restricted Stock Agreements under the 2002 Stock Incentive Plan. Incorporated by reference to Exhibits 10.3 through 10.7 to the September 2006 10-Q. |
| |
| 10.20 | | Supplemental Executive Retirement Plan adopted by West Coast Bank, the Company and Robert D. Sznewajs dated August 1, 2003, and amended as of July 1, 2005.Incorporated by reference to Exhibit 10.18 to the Company’s 2003 10-K and Exhibit 10.5 to the Company’s Quarterly Report on Form 10-Q for the quarter ended September 30, 2005 (the “September 2005 10-Q”).* |
| |
| 10.21 | | Supplemental Executive Retirement Plan adopted by West Coast Bank, the Company and Anders Giltvedt dated August 1,2003, and amended as of July 1, 2005. Incorporated by reference to Exhibit 10.19 to the Company’s 2003 10-K and Exhibit 10.2 to the September 2005 10-Q.* |
| |
| 10.22 | | Supplemental Executive Retirement Plan adopted by West Coast Bank, the Company and Xandra McKeown dated August 1, 2003, and amended as of July 1, 2005. Incorporated by reference to Exhibit 10.20 to the Company’s 2003 10-K and Exhibit 10.1 to the September 2005 10-Q.* |
| |
| 10.23 | | Supplemental Executive Retirement Plan adopted by West Coast Bank, the Company and James D. Bygland dated August 1, 2003, and amended as of July 1, 2005.Incorporated by reference to Exhibit 10.21 to the Company’s 2003 10-K and Exhibit 10.3 to the September 2005 10-Q.* |
| |
| 10.24 | | Supplemental Executive Retirement Plan adopted by West Coast Bank, the Company and Hadley Robbins dated April 1, 2007. Incorporated by reference to Exhibit 10.2 to the March 2007 10-Q.* |
| |
| 10.25 | | Directors’ Deferred Compensation Plan (Interim Document for Operational Compliance with the American Jobs Creation Act). Incorporated by reference to Exhibit 10.26 to the Company’s Annual Report on Form 10-K for the year ended December 31, 2005 (the “2005 10-K”).* |
| |
| 10.26 | | Executives’ Deferred Compensation Plan (Interim Document for Operational Compliance with the American Jobs Creation Act). Incorporated by reference to Exhibit 10.27 to the 2005 10-K.* |
| |
| 10.27 | | Employment Agreement dated effective as of January 1, 2008, between Robert D. Sznewajs and the Company. Incorporated by reference to Exhibit 10.1 to the Company’s Current Report on Form 8-K dated December 20, 2007.* |
| |
| 21 | | Subsidiaries of the Company. |
| |
| 23 | | Consent of Deloitte & Touche LLP. |
| |
| 24 | | Power of Attorney. |
| |
| 31.1 | | Certification of Chief Executive Officer under Section 302 of the Sarbanes-Oxley Act. |
| |
| 31.2 | | Certification of Chief Financial Officer under Section 302 of the Sarbanes-Oxley Act. |
| |
| 32 | | Certification of Chief Executive Officer and Chief Financial Officer under Section 906 of the Sarbanes-Oxley Act. |
*Indicates a management contract or compensatory plan, contract or arrangement.
92