UNITED STATES
SECURITIES AND EXCHANGE COMMISSION
Washington, D.C. 20549
FORM 10-K
[X] Annual Report Pursuant to Section 13 or 15(d) of
the Securities Exchange Act of 1934
For the fiscal year ended December 31, 2011
Commission file number 0-10997
WEST COAST BANCORP
(Exact name of registrant as specified in its charter)
| Oregon | 93-0810577 |
| (State or other jurisdiction | I.R.S. Employer Identification Number |
| of incorporation or organization) | |
5335 Meadows Road – Suite 201, Lake Oswego, Oregon 97035
(Address of principal executive offices)(Zip code)
(503) 684-0884
(Registrant's telephone number, including area code)
Securities registered pursuant to Section 12(b) of the Act: Common Stock
(Title of Class)
Securities registered pursuant to Section 12(g) of the Act: None
Indicate by check mark whether the registrant is a well known seasoned issuer, as defined in Rule 405 of the Securities Act. Yes [ ] No [X]
Indicate by check mark if the registrant is not required to file reports pursuant to Section 13 or Section 15(d) of the Exchange Act. Yes [ ] No [X]
Indicate by check mark whether the registrant: (1) has filed all reports required to be filed by Section 13 or 15(d) of the Securities Exchange Act of 1934 during the preceding 12 months (or for such shorter period that the registrant was required to file such reports), and (2) has been subject to such filing requirements for the past 90 days. Yes [X] No [ ]
Indicate by check mark whether the registrant has submitted electronically and posted on its corporate Website, if any, every Interactive Data File required to be submitted and posted pursuant to Rule 405 of Regulation S-T during the preceding 12 months (or for such shorter period that the registrant was required to submit and post such files). Yes [X] No [ ]
Indicate by check mark if disclosure of delinquent filers pursuant to Item 405 of Regulation S-K is not contained herein, and will not be contained, to the best of registrant’s knowledge, in definitive proxy or information statements incorporated by reference in Part III of this Form 10-K or any amendment to this Form 10-K. [ ]
Indicate by check mark whether the registrant is a large accelerated filer, an accelerated filer, a non-accelerated filer, or a smaller reporting company. See definition of “large accelerated filer,” “accelerated filer” and “smaller reporting company” in Rule 12b-2 of the Exchange Act.
[ ] Large Accelerated Filer [ X ] Accelerated Filer [ ] Non-accelerated Filer [ ] Smaller Reporting Company
Indicate by check mark whether the registrant is a shell company (as defined in Rule 12b-2 of the Exchange Act. Yes [ ] No [X]
The aggregate market value of registrant’s Common Stock held by non-affiliates of the registrant on June 30, 2011, was approximately $323,737,000.
The number of shares of registrant’s Common Stock outstanding on January 31, 2012, was 19,298,992.
DOCUMENTS INCORPORATED BY REFERENCE
Portions of the West Coast Bancorp Definitive Proxy Statement for the 2012 annual meeting of shareholders of West Coast Bancorp are incorporated by reference into Part III of this Form 10-K.
Table of Contents
| PART I | | | | PAGE |
| | Forward Looking Statement Disclosure | | 2 |
| ITEM 1. | | BUSINESS | | 3 |
| ITEM 1A. | | RISK FACTORS | | 11 |
| ITEM 1B. | | UNRESOLVED STAFF COMMENTS | | 16 |
| ITEM 2. | | PROPERTIES | | 16 |
| ITEM 3. | LEGAL PROCEEDINGS | | 16 |
| ITEM 4. | RESERVED | | 16 |
| |
| PART II | | | | |
| ITEM 5. | | MARKET FOR REGISTRANT’S COMMON EQUITY, RELATED STOCKHOLDER MATTERS |
| | | AND ISSUER PURCHASES OF EQUITY SECURITIES | | 17 |
| ITEM 6. | | SELECTED FINANCIAL DATA | | 19 |
| ITEM 7. | | MANAGEMENT’S DISCUSSION AND ANALYSIS OF FINANCIAL CONDITION AND | | |
| | RESULTS OF OPERATIONS | | 21 |
| ITEM 7A. | | QUANTITATIVE AND QUALITATIVE DISCLOSURES ABOUT MARKET RISK | | 52 |
| ITEM 8. | | FINANCIAL STATEMENTS AND SUPPLEMENTARY DATA | | 54 |
| ITEM 9. | | CHANGES IN AND DISAGRREMENTS WITH ACCOUNTANTS ON ACCOUNTING AND FINANCIAL DISCLOSURE | | 101 |
| ITEM 9A. | | CONTROLS AND PROCEDURES | | 101 |
| ITEM 9B. | OTHER INFORMATION | | 103 |
| |
| PART III | | | | |
| ITEM 10. | | DIRECTORS, EXECUTIVE OFFICERS AND CORPORATE GOVERNANCE | | 103 |
| ITEM 11. | | EXECUTIVE COMPENSATION | | 103 |
| ITEM 12. | | SECURITY OWNERSHIP OF CERTAIN BENEFICIAL OWNERS AND MANAGEMENT AND |
| | RELATED STOCK HOLDER MATTERS | | 104 |
| ITEM 13. | | CERTAIN RELATIONSHIPS AND RELATED TRANSACTIONS, AND DIRECTOR | | |
| | INDEPENDENCE | | 104 |
| ITEM 14. | | PRINCIPAL ACCOUNTANT FEES AND SERVICES | | 104 |
| |
| PART IV | | | | |
| ITEM 15. | | EXHIBITS AND FINANCIAL STATEMENT SCHEDULES | | 105 |
| SIGNATURES | | | 106 |
| INDEX TO EXHIBITS | | 107 |
1
Forward Looking Statement Disclosure
Statements in this Annual Report of West Coast Bancorp (“Bancorp” or the “Company”) regarding future events or performance are “forward-looking statements” within the meaning of the Private Securities Litigation Reform Act of 1995 (the “PSLRA”) and are made pursuant to the safe harbors of the PSLRA. The Company’s actual results could be quite different from those expressed or implied by the forward-looking statements. Words such as “could,” “may,” “should,” “plans,” “believes,” “anticipates,” “estimates,” “predicts,” “expects,” “projects,” “potential,” or “continue,” or words of similar meaning, often help identify “forward-looking statements,” which include any statements that expressly or implicitly predict future events, results, or performance. Factors that could cause events, results or performance to differ from those expressed or implied by our forward-looking statements include, among others, risks discussed in Item 1A, “Risk Factors” of this report, risks discussed elsewhere in the text of this report, as well as the following specific factors:
- General economic conditions, whether national or regional, and conditions in real estate markets, that may hinder our ability to increase lending activities or have an adverse effect on the demand for our loans and other products, our credit quality and related levels of nonperforming assets and loan losses, and the value and salability of the real estate that we own or that is the collateral for many of our loans;
- Changing bank regulatory conditions, policies, or programs, whether arising as new legislation or regulatory initiatives, that could lead to restrictions on activities of banks generally or West Coast Bank (the “Bank”) in particular, increased costs, including deposit insurance premiums, price controls on debit card interchange, regulation or prohibition of certain income producing activities, or changes in the secondary market for bank loan and other products;
- Competitive factors, including competition with community, regional and national financial institutions, that may lead to pricing pressures that reduce yields the Bank earns on loans and increase rates the Bank pays on deposits, the loss of our most valued customers, defection of key employees or groups of employees, or other losses;
- Increasing or decreasing interest rate environments, including changes in the slope and level of the yield curve, which may be caused by the Federal Reserve Bank’s public comments about future direction and level of interest rates, that could lead to decreases in net interest margin, lower net interest and fee income, including lower gains on sales of loans, and changes in the value of our investment securities;
- Failure to develop, implement, and distribute competitive and client value added products, that may adversely affect our ability to generate profitable revenue sources;
- Any failure to successfully implement expense reduction initiatives and realize expected efficiencies, while retaining revenues, that may result in us realizing less benefits from our cost reduction initiatives than expected; and
- Changes or failures in technology or third party vendor relationships in important revenue production or service areas or increases in required investments in technology that could reduce our revenues, increase our costs, or lead to disruptions in our business.
Furthermore, forward-looking statements are subject to risks and uncertainties related to the Company’s ability to, among other things: dispose of properties or other assets obtained through foreclosures at expected prices and within a reasonable period of time; attract and retain key personnel; generate loan and deposit balances at projected spreads; sustain fee generation including gains on sales of loans; maintain asset quality and control risk; limit the amount of net loan charge-offs; adapt to changing customer deposit, investment and borrowing behaviors; control expenses; and monitor and manage its financial reporting, operating and disclosure control environments.
Readers are cautioned not to place undue reliance on our forward-looking statements, which reflect management’s analysis only as of the date of the statements. We do not intend to publicly revise or update forward-looking statements to reflect events or circumstances that arise after the date of this report.
Readers should carefully review all disclosures we file from time to time with the Securities and Exchange Commission (“SEC”).
2
PART I
ITEM 1.BUSINESS
General
West Coast Bancorp (“Bancorp” or the “Company”) is a bank holding company headquartered in Lake Oswego, Oregon. Bancorp’s principal business activities are conducted through its full-service, commercial bank subsidiary, West Coast Bank (the “Bank”), an Oregon state-chartered bank with deposits insured by the Federal Deposit Insurance Corporation (“FDIC”). At December 31, 2011, the Bank had facilities in 41 cities and towns in western Oregon and southwestern Washington, operating a total of 55 full-service and five limited-service branches and a Small Business Administration (“SBA”) lending office in Vancouver, Washington. The Company, in January 2012, notified the FDIC and the Oregon Department of Consumer and Business Services Division of Finance and Corporate Securities (the “DFCS”) that it will close two limited service branches in April 2012. Bancorp also owns West Coast Trust Company, Inc. (“West Coast Trust”), an Oregon trust company that provides agency, fiduciary and other related trust services with offices in Portland and Salem, Oregon.
Bancorp reports two principal operating segments in the notes to its financial statements: West Coast Bank and West Coast Trust and parent company related operations. For more information regarding Bancorp’s operating segments, see Note 21 “Segment and Related Information” to the Company’s audited consolidated financial statements included under the section “Financial Statements and Supplementary Data” in Item 8 of this report.
Historical Information.Bancorp enjoyed a period of sustained growth from 2000 – 2007. However, in late 2007, with the onset of a significant slowdown in economic activity and unprecedented disruptions in the real estate and credit markets, the prior years of growth ended, and the Company experienced significant net losses for two consecutive years, including losses of $6.3 million in 2008 and $91.2 million in 2009, and its balance sheet contracted. During this period, the Bank experienced significant loan losses, particularly in the residential real estate construction area. The prolonged recession and severe slump in housing and other real estate markets has continued to limit new residential real estate construction and negatively impact the value of the property that serves as collateral for many loans.
Beginning in 2008, Bancorp and the Bank took several steps to preserve capital and sustain or improve regulatory capital ratios. The Bank carefully managed its capital position; reducing risk weighted assets, and focused on limiting operating expenses. During 2009 and 2010, Bancorp also raised a significant amount of new capital.
As part of its capital raising efforts, in October 2009, Bancorp received net proceeds of $139.2 million in a private capital raise (referred to in this report as, the “Private Capital Raise”) in which it issued, after giving effect to a one-for-five reverse split of the Company’s common stock in May 2011 (see “Reverse Stock Split” below): 14,288,490 shares of Common Stock; 121,328 shares of mandatorily convertible cumulative participating preferred stock, Series B (“Series B Preferred Stock”) convertible into 1,213,280 shares of Common Stock upon satisfaction of certain conditions; and Class C Warrants exercisable for a total of 240,000 shares of Series B Preferred Stock at a price of $100.00 per share (the “Class C Warrants”) that are, in turn, convertible into 2,400,000 shares of Common Stock, also upon satisfaction of certain conditions. For additional information regarding Reverse Stock Split, see Note 1 “Summary of Significant Accounting Policies” to the Company’s audited consolidated financial statements included under Item 8 of this report.
Following the private capital raise, Bancorp conducted a rights offering of up to 1.0 million shares of Common Stock at a subscription price of $10.00 per share during the first quarter 2010, with net proceeds of $9.3 million, and in June 2010, Bancorp sold, through a discretionary equity issuance program, an aggregate of .56 million shares of Common Stock at an average sales price of $14.00 per share, with aggregate gross sales proceeds of $7.9 million.
Regulatory capital ratios at Bancorp and the Bank improved significantly as a result of the Company’s capital raising activities and efforts to reduce risk weighted assets. These improvements have continued as Bancorp has generated net income over the past 18 months. For additional information regarding regulatory capital, see the discussion under the subheading “Capital Resources” in Item 7 of this report.
Among the effects of recent events, the Bank has experienced a significant reduction in the size of its loan portfolio and a significant increase in its portfolio of investment securities. This shift in earning asset mix has resulted in significant downward pressure on Bancorp’s net interest income and margin. That said, management believes that the current strong capital base and liquidity position, positions the Bank well for the future, allowing the Company the operating flexibility to pursue its business strategies going forward.
As of December 31, 2011, Bancorp had total assets of $2.43 billion, with total net loans of $1.47 billion and total investment securities of $729.8 million. Bancorp’s total deposits at December 31, 2011, were $1.92 billion and stockholders’ equity was $314.5 million. At December 31, 2010, Bancorp had total assets of $2.46 billion, total net loans of $1.50 billion and total investment securities of $646.1 million. Bancorp’s total deposits at December 31, 2010, were $1.94 billion, with stockholders’ equity of $272.6 million. At December 31, 2011, tangible book value per share was $15.20 up from $13.02 at December 31, 2010.
3
Net income for the year ending December 31, 2011 was $33.8 million or $1.58 per diluted share, up from net income of $3.2 million or $.16 per diluted share for the year ending December 31, 2010. The Company reported a net loss of $91.2 million or $29.15 per diluted share for the year ending December 31, 2009.
Bancorp and the Bank are each parties to an agreement with regulators. For more information regarding these regulatory agreements, see the discussion under the subheading “Current Regulatory Actions” in the section “Supervision and Regulation” included in Item 1 of this report.
Reverse Stock Split.As a result of the Reverse Stock Split, the number of outstanding shares of common stock declined from 96.4 million shares to 19.3 million shares as of May 19, 2011, and the number of authorized shares of common stock was reduced from 250 million to 50 million. Proportional adjustments were also made to the shares available under the Company’s stock incentive plans and the conversion or exercise rights of the Company's outstanding preferred stock, restricted stock, stock options and warrants. Outstanding preferred stock was unaffected by the Reverse Stock Split, only resulting conversion rights into common stock reflect the Reverse Stock Split.
West Coast Bank
The Bank traces its origins to a bank organized in 1925 under the name The Bank of Newport. The Bank in its current form resulted from the merger on December 31, 1998, of the Bank of Newport of Newport, Oregon, The Commercial Bank of Salem, Oregon, Bank of Vancouver of Vancouver, Washington and Centennial Bank of Olympia, Washington, into a single entity. This entity was re-named West Coast Bank. The Bank’s headquarters is located in Lake Oswego, Oregon.
The Bank’s Oregon branches are located in the following cities and towns: Beaverton, Canby, Clackamas, Dallas, Depoe Bay, Dundee, Eugene (2), Forest Grove, Gresham, Happy Valley, Hillsboro (2), Keizer (3), King City, Lake Oswego, Lincoln City, McMinnville, Molalla, Monmouth, Mt. Angel, Newberg, Newport (2), North Plains, Oregon City, Portland (5), Salem (5), Silverton, Stayton, Sublimity, Tigard, Tualatin, Waldport, Wilsonville and Woodburn (3). The Bank’s Washington branches are located in Centralia, Chehalis, Hoodsport, Lacey (2), Olympia (2), Shelton, Tukwila and Vancouver (3).
The primary business strategy of the Bank is to provide comprehensive banking and related financial services within its local communities. The Bank emphasizes the diversity and accessibility of its product lines and services and conducts its business consistent with its client value proposition, which is to provide products typically associated with larger financial organizations, while maintaining the local decision making authority, market knowledge and customer service orientation typically associated with a community bank. The Bank focuses on four targeted areas: 1) high value consumers, 2) small businesses that desire streamlined packaged products, 3) commercial businesses that benefit from customized lending, deposit, cash management, and investment solutions and 4) the principals and employees of associated commercial clients who have a commercial relationship with West Coast Bank.
For consumer banking customers, the Bank offers a variety of checking and savings accounts, check cards, and competitive borrowing products. Consumer accounts consist of three streamlined checking account types, each specifically designed to meet the needs of a unique market segment. Because of the straightforward and easy to understand product design, our branch staff are able to quickly and easily help clients identify the account that best fits their needs. Financing products for consumers include residential real estate mortgage loans, home equity lines and loans, personal lines of credit and consumer credit cards. Customers have access to the Bank’s products and services through a variety of convenient channels such as 24 hour 7 day a week automated phone and internet access, a personal customer service center accessed by phone, and ATMs, as well as through our branch locations.
For business banking customers, the Bank offers customized deposit products tailored for specific needs, including a variety of checking accounts; sophisticated internet-based cash management and payment solution products, such as iDepositSM - remote deposit capture. The Bank recently began offering a new business online suite of products called eBiz Access PLUSSM, which offers commercial clients a customized Treasury Management Online Banking system featuring enhanced security features, real time customizable reports, and expanded treasury management services that are all accessed through a customized dashboard.Customized financing packages provide businesses with a comprehensive suite of credit facilities that include general commercial loans, revolving lines of credit, real estate loans and lines to support construction, owner occupied and investor financing and SBA loans. The Bank also offers business credit cards (VISA), extensive merchant service options, equipment leasing through vendor alliances, and other types of business credit.
4
The Bank is committed to community banking and intends to remain community-focused. Bancorp’s strategic vision includes greater commercial banking market penetration, coupled with focused distribution capability in targeted Pacific Northwest markets. The Bank intends to grow its distribution in target markets through continued product expansion and use of new technology, including a full range of transaction and payment system capabilities.
West Coast Trust
West Coast Trust provides trust services and life insurance products to individuals, for-profit and not for-profit businesses and institutions. West Coast Trust acts as fiduciary of estates and conservatorships, and as a trustee under various wills, trusts, and pension and profit-sharing plans. The main office of West Coast Trust is located at 1000 SW Broadway, Suite 1100, Portland, Oregon 97205, (503) 279-3911. The market value of assets managed for others at December 31, 2011, was $287.6 million.
West Coast Statutory Trusts III, IV, V, VI, VII and VIII
West Coast Statutory Trusts III, IV, V, VI, VII and VIII are wholly-owned subsidiary trusts of Bancorp formed to facilitate the issuance of trust preferred securities. The trusts were organized in September 2003, March 2004, April 2006, December 2006, March 2007 and June 2007, respectively, in connection with six offerings of trust preferred securities. In September 2009, the Company elected to defer interest payments related to all of its trust preferred securities. During the second quarter of 2011, the Company paid all previously deferred interest on its trust preferred securities and, following regulatory approvals, continues to pay quarterly interest payments as they become due. For more information regarding Bancorp’s issuance of trust preferred securities, see Note 10 “Junior Subordinated Debentures” to the Company’s audited financial consolidated statements included under the section “Financial Statements and Supplementary Data” in Item 8 of this report. For more information regarding risks related to our trust preferred securities and junior subordinated debentures see the discussion under the section “Risk Factors” in Item 1A of this report.
Additional Information
Bancorp’s filings with the SEC, including its annual report on Form 10-K, quarterly reports on Form 10-Q, periodic reports on Form 8-K and amendments to these reports, are accessible free of charge at our website athttp://www.wcb.com as soon as reasonably practicable after filing with the SEC. By making this reference to our website, we do not intend to incorporate into this report any information contained in the website. The website should not be considered part of this report.
The SEC maintains a website athttp://www.sec.gov that contains periodic reports, proxy and information statements, and other information regarding issuers with publicly traded securities, including the Company.
Employees
At December 31, 2011, Bancorp and its subsidiaries had approximately 718 employees. None of these employees are represented by labor unions. Management believes that Bancorp’s relationship with its employees is good. Bancorp emphasizes a positive work environment for its employees and our work environment is measured annually utilizing an anonymous employee survey. Results continue to indicate a high level of employee satisfaction. Management continually strives to retain top talent as well as provide career development opportunities to enhance skill levels. A number of benefit programs are available to eligible employees.
Competition
Commercial banking in the state of Oregon and southwest Washington is highly competitive with respect to providing banking services, including making loans and attracting deposits.The Bank competes with other banks, as well as with savings and loan associations, savings banks, credit unions, mortgage companies, investment banks, insurance companies, securities brokerages and other financial institutions. Banking in Oregon and Washington is dominated by several large banking institutions, including U.S. Bank, Wells Fargo Bank, Bank of America, and JPMorgan Chase Bank, which together account for a majority of the total commercial and savings bank loans and deposits in Oregon and Washington. These competitors have significantly greater financial resources and offer a greater number of branch locations, higher lending limits, and a variety of services not offered by the Bank. The Bank has attempted to offset some of the advantages of the larger competitors by leveraging technology and third party arrangements to deliver contemporary product solutions and better compete in targeted customer segments. The Bank has positioned itself successfully as a local alternative to banking conglomerates that may be perceived by customers or potential customers to be impersonal, out-of-touch with the community, or simply not interested in providing banking products and services to some of the Bank’s target customers.
In addition to larger institutions, numerous “community” banks and credit unions operate in the Bank’s market areas. As a result of very weak real estate market conditions over the past few years, a number of banks and credit unions have developed a similar focus as the Bank. These institutions have further increased competition, particularly in the Portland metropolitan area, where the Bank has enjoyed growth in past years and focused much of its expansion efforts. Additionally, a heightened focus by larger institutions on Bancorp’s target market segments, such as small businesses, has led to intensified competition in all aspects of Bancorp’s business.
The financial services industry has experienced widespread consolidation over the last decade. Bancorp anticipates that consolidation among financial institutions in its market areas will continue and perhaps accelerate as a result of financial distress in the industry, intensified competition for the same customer segments, and significantly increased regulatory burdens and rules that are expected to increase expenses and put pressure on revenues.
5
Supervision and Regulation
Bancorp is an Oregon corporation headquartered in Lake Oswego, Oregon, and is registered with the Federal Reserve as a bank holding company. The Bank is an Oregon state bank and is not a member of the Federal Reserve System. The Bank’s primary federal regulator is the FDIC and, at the state level, the DFCS.
The laws and regulations applicable to Bancorp and its subsidiaries are primarily intended to protect borrowers and depositors of the Bank and not stockholders of Bancorp. Various proposals to change the laws and regulations governing the banking industry are currently pending in Congress, in the state legislatures and before the various bank regulatory agencies. As a result of the Dodd-Frank Act (as defined below), the creation of the Consumer Financial Protection Bureau and the current economic climate and regulatory environment, there is a high likelihood of enactment of new banking legislation and promulgation of new banking regulations. The following is a brief description of the significant laws and regulations that govern our activities.
Bank Holding Company Regulation
As a registered bank holding company, Bancorp is subject to the supervision of, and regular inspection by, the Federal Reserve pursuant to the Bank Holding Company Act of 1956, as amended (the “BHCA”). In addition, pursuant to the Dodd-Frank Wall Street Reform and Consumer Protection Act (“Dodd-Frank Act”) and subject to certain conditions, the FDIC has backup enforcement authority over bank holding companies, such as Bancorp, if the conduct or threatened conduct of the bank holding company poses a risk to the Deposit Insurance Fund. Bancorp must file reports with the Federal Reserve and must provide it with such additional information as it may require. The BHCA restricts the direct and indirect activities of Bancorp to banking, managing or controlling banks and other subsidiaries authorized under the BHCA, and activities that are closely related to banking or managing or controlling banks. Bank holding companies like Bancorp must, among other things, obtain prior Federal Reserve approval before they: (1) acquire direct or indirect ownership or control of any voting shares of any bank or bank holding company that results in total ownership or control, directly or indirectly, of more than 5% of the outstanding shares of any class of voting securities of such bank or bank holding company; (2) merge or consolidate with another bank holding company; or (3) acquire substantially all of the assets of another bank or bank holding company.
Bank holding companies must also act as a source of financial and managerial strength to subsidiary banks. This means that Bancorp is required to commit, as necessary, resources to support the Bank.
Subsidiary banks of a bank holding company are subject to certain other restrictions under the Federal Reserve Act and Regulation W which restricts transactions with affiliates. These restrictions may limit Bancorp’s ability to obtain funds from the Bank for its cash needs, including funds for payment of interest on its junior subordinated debentures, cash dividends and operational expenses.
6
Bank Regulation
General.The Bank is an Oregon state-bank and is not a member of the Federal Reserve System. The Bank conducts banking business in Oregon and Washington. The Bank is subject to supervision and regulation by the DFCS, the FDIC and to a lesser extent, the Washington Department of Financial Institutions. The Bank's regulators conduct regular examinations of the Bank and have the authority to prohibit the Bank from engaging in unsafe or unsound banking practices.
Deposit Insurance.Eligible deposits maintained at the Bank are insured by the FDIC up to $250,000 per account, and from December 31, 2010, through December 31, 2012, a depositor’s funds in a non-interest bearing transaction account or an Interest on Lawyers Trust Account are fully insured. The Bank is required to pay quarterly deposit insurance premiums to the FDIC. Premiums are based on an assessment of how much risk a particular institution presents to the Deposit Insurance Fund. Banks with higher levels of capital and a low degree of supervisory concern are assessed lower premiums than banks with lower levels of capital or a higher degree of supervisory concern. The FDIC may terminate deposit insurance if it determines the institution involved has engaged in or is engaging in unsafe or unsound banking practices, is in unsafe or unsound condition, or has violated applicable laws, regulations or orders.
Community Reinvestment Act and Fair Lending and Reporting Requirements.The Bank is subject to the Community Reinvestment Act of 1977, as amended (“CRA”) and to certain fair lending and reporting requirements that relate primarily to home mortgage lending operations. The CRA generally requires the federal banking agencies to evaluate the record of a financial institution in meeting the credit needs of its local communities, including low- and moderate-income neighborhoods, consistent with the safe and sound operation of the institution. The federal banking agencies may take into account compliance with the CRA when regulating and supervising other activities, such as evaluating mergers, acquisitions and applications to open a branch or facility. In connection with its assessment of CRA performance, the FDIC assigns a rating of “outstanding,” “satisfactory,” “needs to improve” or “substantial noncompliance.” The Bank’s most recent CRA rating, based on an examination in September 2010, was satisfactory. There are several rules and regulations governing fair lending and reporting practices by financial institutions. A bank may be subject to substantial damages, penalties and corrective measures for any violation of fair lending and reporting, including credit reporting, laws and regulations.
Consumer Privacy And Information Security. Financial Institutions, such as the Bank, are required by statute and regulation to disclose their privacy policies. In addition, we must appropriately safeguard our customers’ nonpublic, personal information.
Consumer Financial Protection Bureau. The Dodd-Frank Act, signed into law by the President on July 21, 2010, among other things, created a new Consumer Financial Protection Bureau (“CFPB”). As required by the Dodd-Frank Act, jurisdiction for all existing consumer protection laws and regulations has been transferred to the CFPB. In addition, the CFPB is granted authority to promulgate new consumer protection regulations for banks and nonbank financial firms offering consumer financial services or products to ensure that consumer are protected from “unfair, deceptive, or abusive” acts or practices. The CFPB has begun conducting studies of existing consumer protection regulations to gauge their effectiveness and to solicit comment on potential new regulations.
Non-Capital Safety and Soundness Standards.The Federal Reserve and the FDIC have prescribed, by regulation, non-capital safety and soundness standards for institutions under their authority. These standards cover internal controls, information systems and internal audit systems, loan documentation, credit underwriting, interest rate exposure, asset growth, compensation, fees and benefits, and other operational and managerial standards as the agency determines to be appropriate, and standards for asset quality, earnings and stock valuation. An institution that fails to meet these standards must develop a plan acceptable to the agency, specifying the steps it will take to meet the standards. Failure to submit a plan may subject the institution to regulatory sanctions. We believe the Bank is in compliance with these standards.
7
Capital Adequacy Requirements
Federal bank regulatory agencies use capital adequacy guidelines in the examination and regulation of bank holding companies and banks. If capital falls below minimum levels, the bank holding company or bank may, among other things, be denied approval to acquire or establish additional banks or non-bank businesses or to open new facilities.
The FDIC and Federal Reserve use risk-based capital guidelines for banks and bank holding companies. Risk-based guidelines are designed to make capital requirements more sensitive to differences in risk profiles among banks and bank holding companies, to account for off balance sheet exposure and to minimize disincentives for holding liquid low-risk assets. Assets and off balance sheet items are assigned to broad risk categories, each with appropriate weights. The resulting capital ratios represent capital as a percentage of total risk-weighted assets and off balance sheet items.
The guidelines are minimums and the Federal Reserve may require that a banking organization maintain ratios in excess of the minimums, particularly organizations contemplating significant expansion. Current guidelines require all bank holding companies and federally-regulated banks to maintain a minimum risk-based total capital ratio equal to 8%, of which at least 4% must be Tier 1 capital. Tier 1 capital for bank holding companies includes common stockholders’ equity, qualifying preferred stock and minority interests in equity accounts of consolidated subsidiaries, minus certain deductions, including goodwill, mortgage servicing assets, other identifiable intangible assets, and deferred tax assets subject to a disallowance.
The Federal Reserve also monitors a leverage ratio, which is Tier 1 capital as a percentage of total quarterly average tangible assets. The principal objective of the leverage ratio is to constrain the degree to which a bank holding company may leverage its equity capital base. The Federal Reserve requires a minimum leverage ratio of 3%.
For more information regarding the Bank and Bancorp’s capital and leverage ratios, see the discussion under the section “Capital Resources” in the Item 7 of this report. For more information regarding regulatory enforcement actions that increase minimum ratios applicable to Bancorp and the Bank, see the discussion under the subheading “Current Regulatory Actions” in this section below.
The Federal Deposit Insurance Corporation Improvement Act (“FDICIA”), among other things, created a statutory framework of supervisory actions indexed to the capital level of the individual institution. Under regulations adopted by the FDIC, an institution is assigned to one of five capital categories - well capitalized, adequately capitalized, undercapitalized, significantly undercapitalized, and critically undercapitalized - depending on its total risk-based capital ratio, Tier 1 risk-based capital ratio, and leverage ratio, together with certain subjective factors including, but not limited to an overall assessment of profitability, liquidity, interest rate sensitivity, and the level and severity, especially relative to capital, of nonperforming and classified assets. Undercapitalized, significantly undercapitalized, and critically undercapitalized banks are subject to certain mandatory supervisory corrective actions.
Pursuant to a Memorandum of Understanding (“MOU”) with the FDIC and DFCS, the Bank must, among other things, maintain higher levels of capital than required by published capital adequacy requirements, as discussed above.
8
Dividends
Substantially all of our activities are conducted through the Bank. Consequently, as the parent company of the Bank, the Company receives substantially all of its revenue as dividends from the Bank. The banking regulators may prohibit banks and bank holding companies from paying dividends that would constitute an unsafe or unsound banking practice. In addition, a bank may not pay cash dividends if doing so would reduce the amount of its capital below that necessary to meet minimum applicable regulatory capital requirements. Oregon law also limits a bank's ability to pay dividends.
Pursuant to the MOU with the FDIC and DFCS, the Bank is prohibited from paying dividends without the consent of the FDIC and DFCS. Pursuant to a Written Agreement (“Written Agreement”) with the Federal Reserve Bank of San Francisco (“Reserve Bank”) and DFCS, Bancorp is prohibited from paying dividends and making payments of interest or principal on subordinated indebtedness or trust preferred securities without the prior consent of the Reserve Bank, the Director of Banking Supervision and Regulation of the Board of Governors of the Federal Reserve System (the “Federal Reserve Director”), and the DFCS. Since June 2011, the Company has received permission to pay all interest payments on subordinated indebtedness from our regulatory authorities; however, there is no assurance that future approvals will be received. For more information regarding regulatory actions, see the discussion under the subheading “Current Regulatory Actions” in this section below.
Other Laws and Regulations
Interstate Banking and Branching.Subject to certain restrictions, adequately capitalized and managed bank holding companies may purchase banks in any state, and adequately capitalized and managed banks may merge with banks in other states or otherwise expand across state lines. Bank regulators are required to consult with community organizations before permitting an interstate institution to close a branch in a low income area.
Monetary and Fiscal Policy Effects on Interest Rates.Banking is a business which depends on interest rate differentials. In general, the major portion of a bank’s earnings derives from the differences between: (i) interest received by a bank on loans extended to its customers and the yield on securities held in its investment portfolio; and (ii) the interest paid by a bank on its deposits and its other borrowings (the bank’s “cost of funds.”) Thus, our earnings and growth are constantly subject to the influence of economic conditions generally, both domestic and foreign, and also to the monetary, fiscal and related policies of the United States and its agencies, particularly the Federal Reserve and the U.S. Treasury. The nature and timing of changes in such policies and their impact cannot be predicted.
The Volcker Rule.The Dodd-Frank Act implements the "Volcker Rule”, which prohibits “banking entities” such as Bancorp and the Bank from engaging in certain short-term proprietary trading activities and investments. Transactions in certain instruments, including obligations of the U.S. Government or a U.S. Government agency, government-sponsored enterprises, and state and local governments will be exempt from the prohibitions. The Volcker Rule also prohibits Bancorp and the Bank from owning, sponsoring, or having certain relationships with any hedge funds or private equity funds subject to certain exemptions. The prohibitions and restrictions of the Volcker Rule will not take effect until after publication of final interagency rules implementing the Volcker Rule. Upon effectiveness of the final interagency rules, Bancorp and the Bank will be afforded a two-year conformance period during which they can wind down, sell, or otherwise conform their respective activities, investments and relationships to the requirements of the Volcker Rule. When promulgated, Bancorp and the Bank will review the implications of the final interagency rules on their respective investments and relationships and will take all necessary actions to maintain regulatory compliance.
Overdraft Programs.The Electronic Funds Transfer Act (the “EFTA”) provides a basic framework for establishing the rights, liabilities, and responsibilities of consumers who use electronic funds transfer (“EFT”) systems. The EFTA is implemented by the Federal Reserve's Regulation E, which governs transfers initiated through ATMs, point-of-sale terminals, payroll cards, automated clearinghouse (“ACH”) transactions, telephone bill-payment plans, or remote banking services. Regulation E requires consumers to opt in (affirmatively consent) to participation in the Bank's overdraft service program for ATM and one-time debit card transactions before overdraft fees may be assessed on the consumer’s account. Notice of the opt-in right must be provided to all new customers who are consumers, and the customer's affirmative consent must be obtained, before charges may be assessed on the consumer's account for paying such overdrafts.
Regulation E also provide bank customers with an ongoing right to revoke consent to participation in an overdraft service program for ATM and one-time debit card transactions and prohibits banks from conditioning the payment of overdrafts for checks, ACH transactions, or other types of transactions that overdraw the consumer's account on the consumer's opting into an overdraft service for ATM and one-time debit card transactions. For customers who do not affirmatively consent to overdraft service for ATM and one-time debit card transactions, a bank must provide those customers with the same account terms, conditions, and features that it provides to consumers who do affirmatively consent, except for the overdraft service for ATM and one-time debit card transactions.
On November 24, 2010, the FDIC issued FIL-81-2010 to provide “guidance” (“Overdraft Guidance”) on automated overdraft service programs to ensure that a bank mitigates the risks associated with offering automated overdraft payment programs and complies with all consumer protection laws and regulations.
Regulation E and the Overdraft Guidance may have a substantial negative impact on the Bank's revenue from overdraft service fees and non-sufficient funds (“NSF”) charges if customers elect to not opt-in or subsequently elect to opt-out. For more information regarding risks facing Bancorp and the Bank, see the discussion under the section “Risk Factors” in Item 1A of this report.
9
Current Regulatory Actions
Regulatory Order. On October 18, 2011, the Bank received a regulatory order (“Order”) from the FDIC relating to its overdraft practices. As part of the Order, the Bank agreed to implement certain procedural improvements relating to its compliance function and overdraft program, pay a civil money penalty of $390,000, and make restitution to certain customers in accordance with the formula set out in the Order of approximately $246,000.
Additional information regarding the Order is available in the Company’s Current Report on Form 8-K, reporting entry into the agreement with the FDIC, filed with the SEC on October 24, 2011.
Bank Memorandum of Understanding. On October 6, 2010, the Bank entered into a MOU with the FDIC and DFCS. The MOU requires that during the life of the MOU the Bank may not pay dividends without the written consent of the FDIC and DFCS and that the Bank maintain higher levels of capital than required by published capital adequacy requirements.
Holding Company Written Agreement.On December 15, 2009, Bancorp entered into a Written Agreement with the Reserve Bank and DFCS. The Written Agreement requires that as long as the Written Agreement is in effect, Bancorp may not:
- Declare or pay any dividends without the prior written approval of the Reserve Bank, the Federal Reserve Director, and the DFCS;
- Directly or indirectly take dividends or any other form of payment representing a reduction in capital at the Bank without the prior written approval of the Reserve Bank and the DFCS;
- Make any payments of interest or principal on subordinated indebtedness or trust preferred securities without the prior written approval of the Reserve Bank, the Federal Reserve Director, and the DFCS; or
- Directly or indirectly incur, increase, or guarantee any debt without the prior written approval of the Reserve Bank and the DFCS.
10
ITEM 1A.RISK FACTORS
The following are risks that management believes are specific to our business. This should not be viewed as an all-inclusive list or in any particular order.
Future loan losses may exceed our allowance for credit losses.
We are subject to credit risk, which is the risk that borrowers will fail to repay loans in accordance with their terms. We maintain an allowance for credit losses that represents management’s best estimate, as of a particular date, of the probable amount of loan receivables and unfunded commitments that the Bank will be unable to collect. The process we use to estimate losses inherent in our loan portfolio involves difficult, subjective, and complex judgments, including forecasts of economic conditions and how these economic forecasts might affect the ability of our borrowers to repay their loans. These matters are inherently uncertain, which may, in turn, impact the reliability of estimates. In addition, if our estimates prove to be inaccurate and economic conditions are significantly less favorable than expected or we experience a rapid change in interest rates, our borrowers’ ability to repay loans could be adversely affected. Developments of this nature could result in losses in excess of our allowance for credit losses. If we determine that it is appropriate to increase the allowance for credit losses to address changing conditions, we will do so through additional provision for credit losses. Any additional provision for credit losses results in a decrease in net income and may have a material adverse effect on our financial condition, results of operations and regulatory capital position. For more information regarding the Company’s allowance for credit losses, see the discussion under the subheading “Allowance for Credit Losses” and “Critical Accounting Policies” included in Item 7 of this report.
A large percentage of our loan portfolio is secured by real estate. As a result, we are particularly vulnerable to continued deterioration in the real estate market in our market areas and other effects.
Approximately 79% of our loan portfolio is secured by real estate. As a result, we are vulnerable to declines in real estate values in the markets in which we operate. We have experienced declining real estate values over the last four years and high levels of net charge-offs and provision for credit losses. While net charge-offs and provision for credit losses have declined, if we experience increases in delinquencies with respect to commercial real estate or other real estate related loans, or continued declines in real estate market values, we would expect increased loan charge-offs and additional provision for credit losses, which could have a material adverse effect on our business, financial condition and results of operations. Because of our significant concentration in loans secured by real estate, we are particularly vulnerable to such effects.
The recession has been particularly severe in the market areas we serve and our results of operations may be adversely affected if the local economies do not improve.
Substantially all of our loans and loan opportunities are to businesses and individuals in our markets in Washington and Oregon. As evidenced by the unemployment rate in Oregon, which hovered at or above 10% from January 2009 through 2010 and remained elevated at 8.9% in December 2011, our region has been severely impacted by the same challenges facing the economy nationally and perhaps more so. The region has also experienced severe declines in residential and commercial real estate values. If we experience further deterioration in economic conditions or a prolonged delay in economic recovery in our market areas, we could face the following consequences, any of which could materially and adversely affect our business: the value of assets that serve as collateral for our loans, especially real estate, may decline further; loan delinquencies, foreclosures and losses on loans and other real estate owned properties (“OREO”) could increase; demand for our products and services may decrease or fail to accelerate; and access to low cost or non-interest bearing deposits may decrease.
Financial services legislation and regulatory reforms may have a significant impact on our businesses and results of operations.
Many of the provisions of Dodd-Frank have extended implementation periods and delayed effective dates and will require extensive additional rulemaking by regulatory authorities and multiple additional studies. Dodd-Frank, including future rules implementing its provisions and the interpretations of those rules, could result in a number of adverse impacts on us. The levels of capital and liquidity with which Bancorp and the Bank must maintain to operate may be increased, resulting in decreased leverage and reduced earnings. We may also be subjected to new and/or higher fees to various regulatory entities, including but not limited to deposit insurance premiums to the FDIC. The Bank may also be subject to additional regulations under the newly established CFPB which has been given broad authority to implement new consumer protection regulations. These and other provisions of Dodd-Frank could limit our ability to pursue business opportunities we might otherwise consider, impose additional costs on us, result in significant loss of revenue, impact the value of assets we hold, or otherwise significantly adversely affect our businesses.
11
Amendments to Regulation E, the FDIC’s Overdraft Guidance, and any new regulations may impact our customer’s participation in the Bank’s overdraft service program and our overdraft fee income may be negatively affected.
Regulation E requires customers who desire to participate in a regulated bank’s overdraft service program for ATM and one-time-debit card transactions to affirmatively opt-in to the program. Although the majority of our customers have elected to opt-in to the Bank’s overdraft program, we are not able to predict future customer behavior or determine whether new customers will elect to opt-in. FDIC Overdraft Guidance that became effective July 2011, requires banks to, among other things, establish an outreach program to customers who excessively overdraw their account and advise them of lower cost alternatives, institute appropriate daily limits on customer costs and consider eliminating overdraft fees for transactions that overdraw an account by a de minimus amount. The CFPB has indicated that it will be reviewing the overdraft practices of financial institutions and the Office of the Comptroller of the Currency, the primary regulator of national banks, has issued a proposed regulation that is more restrictive than Regulation E and the FDIC’s guidance. Therefore, further regulation regarding overdraft practices is possible. If customers do not elect to participate or remain in our overdraft protection program, an important source of noninterest income will be negatively affected.
The Order requires the Bank to mail an opt-in notice to customers to continue participation in the Bank’s overdraft service program for ATM and one-time-debit card transactions and customer may elect to opt-out or fail to respond.
The Order requires the Bank to mail a new opt-in notice to all customers who prior to December 20, 2011, opened a checking account with and affirmatively elected to participate in the Bank’s overdraft service program for ATM and one-time-debit card transactions. If the customer does not respond within thirty three days from the date of the mailing, then the Bank must remove the customer from participation in the program. The new opt-in notice is being mailed in February 2012, and we do not know how many customers will opt-out or fail to respond. If a substantial number of customers opt-out or fail to respond, there may be a material adverse effect on our non-interest income.
Congressional and regulatory initiatives could have an adverse effect on our business.
Federal and state legislators and regulators continue to pursue increased regulation of how loans are originated, purchased, and sold, and properties are foreclosed. These legislative and regulatory responses may impact how the Bank conducts business, makes and underwrites loans, and buys and sells loans in secondary markets, or lead to changes in the banking industry, lending markets and secondary markets for loans generally. We are unable to predict whether any legislative or regulatory initiatives will be implemented or what form they will take. Any such actions could affect us in substantial and unpredictable ways and could have an adverse effect on our business, financial condition and results of operations. For more information regarding the regulatory environment in which we operate, see the discussion under the subheading “Supervision and Regulation” included in Item 1 of this report.
Significant legal and regulatory actions could subject us to uninsured liabilities, associated reputational risk, and reduced revenues.
From time to time, we are sued for damages or threatened with lawsuits relating to various aspects of our operations. We may also be subject to investigations and possibly substantial civil money penalties assessed by, or other actions of, federal or state regulators in connection with violations or alleged violations of applicable laws, regulations or standards. We may incur substantial attorney fees and expenses in the process of defending against lawsuits or regulatory actions and our insurance policies may not cover, or cover adequately, the costs of adverse judgments, civil money penalties, and attorney fees and expenses. As a result, we may be exposed to substantial uninsured liabilities, which could adversely affect our results of operations, financial condition, and regulatory capital.
We are subject to reputational risk, which is the potential that negative publicity regarding our business practices, whether true or not, could cause a decline in our customer base, stock price, or general reputation in the markets in which we operate. Reputational risk is heightened in the instance of publicity surrounding lawsuits or regulatory actions. We are presently subject to regulatory agreements with the primary regulators for Bancorp and the Bank. These agreements restrict our activities and could negatively affect our reputation.
Payment systems revenue may be impacted by governmental or payment network action.
Effective October 1, 2011, the maximum permissible interchange fee that certain large banks (with more than $10 billion in assets) may charge merchants for various covered debit card transactions was limited by regulation. Even though we are not covered by the regulation, revenue derived from interchange fees may decrease if the Federal Reserve amends its regulations governing the amount of interchange fees. In addition, the payment card networks may change the amount of interchange fees paid to issuers. The Bank is a Visa debit card issuer and derives noninterest income in the form of interchange fees from its debit cards. A decrease in the amount of interchange fees paid to Bank could have a material adverse effect on our business and results of operations.
12
Customers may elect to move their accounts to other depository institutions as a result of our new monthly service fees, which may negatively affect our liquidity and fee income.
The Bank offers deposit products to its customers, including checking accounts and money market accounts that provide an important source of liquidity and fee income to the Bank. In the first quarter of 2012 the Bank notified customers that it would begin charging a monthly service fee for checking accounts and money market accounts unless minimum balances were maintained. Customer acceptance of these new features is unknown and it is possible that customers will elect to move their account balances to other depository institutions, which could have an adverse effect on our business and results of operations.
We may fail to realize the anticipated cost savings and other financial benefits of our expense reduction initiatives.
During 2011 Bancorp and the Bank undertook a number of initiatives to reduce expenses. These initiatives included closing five branches, prepaying certain FHLB debt and restructuring a number of contracts with third party vendors. We may not realize the anticipated cost savings of these initiatives. If we fail to do so, there could be an adverse effect on our results of operations and prospects.
Impairment of investment securities could negatively impact our results of operations.
At December 31, 2011, our investment securities portfolio included several securities with unrecognized losses, including, among those, four pooled trust preferred securities with a total amortized cost of $13.8 million and a fair market value of $8.0 million. One of these pooled trust preferred securities was considered other-than-temporarily impaired at December 31, 2011. For additional detail regarding these securities, see Note 2 “Investment Securities” to the Company’s audited financial consolidated statements included under the section “Financial Statements and Supplementary Data” in Item 8 of this report. We evaluate the securities portfolio, including expected cash values and the value of any collateral, each reporting period as required by generally accepted accounting principles to determine whether a particular security is other-than-temporary impaired. There can be no assurance that we will not recognize one or more impairment charges in future periods with respect to these or other investment securities. The impact of these impairment matters could have a material adverse effect on our business and results of operations.
Bancorp is restricted from paying cash dividends on its Common Stock, and these restrictions may continue for a significant period of time.
Pursuant to Bancorp’s Written Agreement with the Reserve Bank and the DFCS, Bancorp is prohibited, without prior consent of the Reserve Bank, the Federal Reserve Director and the DFCS, from paying dividends, making payments on its junior subordinated securities, or extending credit or otherwise supplying funds to or engaging in certain transactions with the Bank. Additionally, even if Bancorp obtains regulatory approval to pay dividends on Common Stock, we may not pay any such cash dividends unless we are current on interest payments on our junior subordinated debentures issued in connection with our trust preferred securities. For these and other reasons, Bancorp may not resume paying cash dividends on its Common Stock for some time into the future, if at all.
Bancorp is a separate and distinct legal entity from its subsidiaries. Substantially all of Bancorp’s funds and revenue are received as dividends from the Bank, which is currently restricted from paying dividends. The Bank may not pay dividends to Bancorp in the near future.
Substantially all of Bancorp’s funds and revenue are received as dividends paid from the Bank. Pursuant to the MOU the Bank is prohibited from paying dividends to Bancorp without the consent of the FDIC and the DFCS. We do not know when the FDIC and DFCS would consent to a request from the Bank to pay dividends to Bancorp. In the event the Bank continues to be unable to pay dividends to Bancorp, Bancorp may not be able to service debt or pay other obligations. The inability to receive dividends from the Bank could have a material adverse effect on Bancorp’s business, financial condition, including liquidity, and results of operations.
During the third quarter of 2009, we began deferring regularly scheduled interest payments on the junior subordinated debentures issued in connection with our trust preferred securities. Under the terms of the junior subordinated debentures and the trust documents, we have the contractual right to defer payments of interest for up to 20 consecutive quarterly periods without default. During the deferral period, the respective trusts will likewise suspend the declaration and payment of dividends on the trust preferred securities. If the Company fails to bring the deferred payments current prior to the end of the deferral period, then we may be deemed to be in default under the terms of the debentures and subject to various penalties. Commencing in the second quarter of 2011, the Company, with regulatory approval, paid all previously deferred interest and resumed making interest payments on its junior subordinated debentures. There is no assurance that future regulatory approval to make such interest payments will be granted.
13
Rapidly changing interest rates or prolonged low interest rates could reduce our net interest margin, net interest income, and net income.
Interest and fees on loans and investment securities, net of interest paid on deposits and borrowings, are the principal source of our revenues and thus a driver an important driver of net income. Interest rates and changes in those influence our net interest margin and are subject to many factors beyond our control. As interest rates change, net interest income is affected. It could also lead to decreased demand for loans and other products that are priced based on interest rates. Rapid increases in interest rates could result in interest expense increasing faster than interest income because of mismatches in financial instrument maturities. Rapid decreases in interest rates could result in interest income decreasing faster than interest expense, for example, if management is unable to match decreases in earning assets yields, with reduced rates paid on deposits or borrowings. Additionally, extended periods of low market interest rates, such as we have today and are likely to continue for the near future based on the Federal Reserve’s announcements regarding monetary policy, may adversely affect our net interest spread and net interest income because our earning assets yield decreases and stays low during a time that our cost of interest bearing liabilities is already low and cannot be correspondingly reduced further.For more information regarding interest rates, see the discussion under the section “Quantitative and Qualitative Disclosures about Market Risk” in the Item 7A of this report.
We face liquidity risks in the operation of our business.
Liquidity is crucial to the operation of Bancorp and the Bank. Liquidity risk is the potential that Bancorp or the Bank will be unable to fund increases in assets or meet payment obligations, including obligations to the Bank’s depositors, as they become due because of an inability to obtain adequate funding or liquidate assets at a reasonable cost. Funding illiquidity may arise at the Bank if we are unable to, at reasonable terms, attract and retain deposits, secure or renew borrowings from the overnight inter-bank market, the FHLB, or the Federal Reserve discount window, or access other sources of liquidity, as described in more detail under the heading “Liquidity and Sources of Funds” in Item 7 of this report. Changes or disruptions to the FHLB system could adversely impact our ability to meet our short-term and long-term liquidity requirements. If we fail to monitor and control our liquidity risks, there may be materially adverse effects on our results of operations and financial condition.
We face operational risks that may result in unexpected losses.
We face various operational risks that arise from the potential that inadequate information systems, operational problems, failures in internal controls, breaches of our security systems, fraud, the execution of unauthorized transactions by employees, or any number of other unforeseen events could result in unexpected losses. Additionally, third party vendors provide key components of our business infrastructure such as internet connections, network access, data reporting, and data processing. Any problems caused by third parties could adversely affect our ability to deliver products and services to our customers and our revenues, expenses, and earnings. Replacing third party vendors, should that be necessary, may entail significant delay and expense.
Our information systems may experience an interruption or breach in security.
The Bank relies on its computer information systems in the conduct of its business. The Bank has policies and procedures in place to protect against and reduce the occurrences of failures, interruptions, or breaches of security of these systems, however, there can be no assurance that these policies and procedures will eliminate the occurrence of failures, interruptions or breaches of security or that they will adequately restore or minimize any such events. The occurrence of a failure, interruption or breach of security of the Bank's computer information systems could result in a loss of information, business or regulatory scrutiny, or other events, any of which could have a material adverse effect on our financial condition or results of operations.
The financial services industry is very competitive and failure to develop, implement, and distribute competitive products to generate profitable revenue sources or to implement expense reduction initiatives, while maintaining revenues and efficiencies, could affect our net income.
We face competition in attracting and retaining deposits, making loans and providing other financial services. Our competitors include other community banks, larger banking institutions, and a wide range of other financial institutions, such as credit unions, government-sponsored enterprises, mutual fund companies, insurance companies and other non-bank businesses. Many of these competitors have substantially greater resources than us. The challenging real estate market conditions and modest loan demand over the past few years have caused intense pricing pressures for loans to qualified borrowers, which impacts spreads we obtain on loans. For a more complete discussion of our competitive environment, see the discussion under the heading “Competition” included in Item 1 of this report. If we are unable to compete effectively, we will lose market share, and income from loans and other products may be reduced.
Inability to hire or retain key professionals, management and staff could adversely affect our revenues and net income.
We rely on key personnel to manage and operate our business, including, but not limited to, major revenue generating functions such as our loan and deposit portfolios. The loss of key staff may adversely affect our ability to maintain and manage these portfolios effectively, which could negatively affect our revenues and earnings.
14
Market and other constraints on our loan origination volumes may lead to continued pressure on our interest and fee income.
Due to the continued weak economic conditions in the markets in which we operate and other factors, we expect continued pressure on new loan origination volumes in the near term, particularly with respect to construction loans, relative to such volumes generated in the pre-recession period. If we are unable to increase loan volumes, there will be continued pressure on our interest income and fees generated from our lending operations. Unless we are able to offset the lower interest income and fees with increased activity in other areas of our operations, our total revenues may decline relative to our total noninterest expenses. We expect that it may be difficult to find new revenue sources in the near term.
Our products and services are delivered on a technological platform that is subject to rapid change and transformation.
The financial services industry is undergoing rapid technological change and we face constant evolution of customer demand for technology-driven financial and banking products and services. Many of our competitors have substantially greater resources to invest in technological improvement and product development, marketing, and implementation. Any failure to successfully keep pace with and fund technological innovation in the markets in which we compete could have a material adverse impact on our business and results of operations.
Our Common Stock trades in relatively limited volumes and a significant percentage continues to be owned by investors in the October 2009 private capital raise, which may result in a share price that is volatile and which may be subject to downward pricing pressure in the event significant shareholders decide to dispose of shares of our Common Stock.
Our Common Stock trades on the NASDAQ Global Select Market under the symbol “WCBO" and trading volume is modest. The limited trading market for our Common Stock may lead to exaggerated fluctuations in market prices and possible market inefficiencies, as compared to a more actively traded stock. It may also make it more difficult to dispose of our shares at expected prices, especially for holders seeking to dispose of a large number of our shares. In addition, if a large shareholder or group of investors in our private capital raise elects to sell their shares, such sales or attempted sales could result in significant downward pressure on the market price of our Common Stock and actual price declines.
Natural disasters could affect our ability to operate.
Our market areas are located in earthquake zones and our coastal markets are located in areas that are susceptible to tsunamis. Natural disasters can disrupt our operations, result in damage to our market areas and negatively affect the local economies in which we operate.
We cannot predict whether or to what extent damage caused by future earthquakes or tsunamis will affect our operations or the economies in our market areas, but such events could result in an inability to continue business operations or cause a decline in loan originations, a decline in the value or destruction of properties securing our loans and an increase in the risk of delinquencies, foreclosures or loan losses.
15
ITEM 1B.UNRESOLVED STAFF COMMENTS
None.
ITEM 2.PROPERTIES
The principal properties owned by the Bank include a 40,000-square-foot office and branch facility in downtown Salem, Oregon, a 15,600-square-foot office and branch facility in Newport, Oregon, and a 12,000-square-foot branch and office facility in Lacey, Washington. In total, the Bank owns 26 buildings, primarily to house branch offices. The Bank leases the land under seven buildings and owns the land under 19 buildings. In addition, the Bank leases 41 office spaces and buildings for branch locations.
Other non-branch office facilities are located in leased office space, including our headquarters office in Lake Oswego, Oregon, office and processing space in Salem, Oregon, where the Bank’s data center is located, space in Wilsonville, Oregon, where its loan servicing and operations center is located, space in Vancouver, Washington, and Lake Oswego, Oregon, where we have lending personnel and a branch office, and space in downtown Portland, where we have commercial banking personnel, West Coast Investment Services and West Coast Trust. In addition, we lease two smaller office spaces for lending personnel in Tukwila and Tacoma, Washington.
The aggregate monthly rental on 48 leased properties is approximately $366,000.
ITEM 3.LEGAL PROCEEDINGS
On June 24, 2009, West Coast Trust was served with an Objection to Personal Representative's Petition and Petition for Surcharge of Personal Representative in Linn County Circuit Court. The petition was filed by the beneficiaries of the estate of Archie Q. Adams, for which West Coast Trust acts as the personal representative. The petitioners allege a breach of fiduciary duty with respect to West Coast Trust's prior sale of real property owned by the Adams estate and sought relief in the form of a surcharge to West Coast Trust of $215,573,115.60, the amount of the alleged loss to the estate. West Coast Trust filed a motion to dismiss on July 2, 2009, which was granted in a letter ruling dated September 15, 2009. Petitioners appealed and briefs have been filed. The Company believes the appeal and underlying petition are without merit.
Bancorp and its subsidiaries are periodically party to litigation arising in the ordinary course of business. Based on information currently known to management, although there are uncertainties inherent in litigation, we do not believe there is any legal action to which Bancorp or any of its subsidiaries is a party that, individually or in the aggregate, will have a materially adverse effect on Bancorp’s financial condition and results of operations, cash flows, or liquidity.
ITEM 4.RESERVED
16
PART II
| ITEM 5. | | MARKET FOR REGISTRANT’S COMMON EQUITY, RELATED STOCKHOLDER MATTERS AND ISSUER PURCHASES OF EQUITY SECURITIES |
Stock Price and Dividends
Bancorp Common Stock trades on the NASDAQ Global Select Market under the symbol “WCBO.” The high and low closing sale prices per share of our Common Stock for each quarter during the last two years are shown in the table below, together with dividend information for each period. The prices below do not include retail mark-ups, mark-downs or commissions, may not represent actual transactions and are not adjusted for dividends. As of December 31, 2011, there were approximately 1,600 holders of record of our Common Stock.
| | | | 2011 | | 2010 |
| | | Market Price | | Market Price |
| | | High | | Low | | High | | Low |
| 1st Quarter | | $ | 17.90 | | $ | 14.55 | | $ | 15.00 | | $ | 10.25 |
| 2nd Quarter | | $ | 18.25 | | $ | 15.00 | | $ | 17.20 | | $ | 12.75 |
| | 3rd Quarter | | $ | 18.03 | | $ | 12.96 | | $ | 13.75 | | $ | 10.30 |
| 4th Quarter | | $ | 16.74 | | $ | 13.75 | | $ | 14.70 | | $ | 12.25 |
Bancorp dividends are limited under federal and Oregon laws and regulations pertaining to Bancorp’s financial condition. Payment of dividends by the Bank is also subject to limitation under state and federal banking laws and by actions of state and federal banking regulators. The Company has not paid any dividends to stockholders since second quarter 2009. For more information on this topic, see the discussion under the section “Supervision and Regulation” included in Item 1 of this report and the section “Liquidity and Sources of Funds” included in Item 7 of this report.
Under Bancorp’s Written Agreement with the Reserve Bank and the DFCS, Bancorp may not pay cash dividends without prior regulatory approval. Similarly, the Bank may not pay dividends to Bancorp without consent of the FDIC and DFCS.
Information regarding securities authorized for issuance under equity compensation plans is incorporated by reference from Part III, Item 12 of this report.
Issuer Purchases of Equity Securities
The following table provides information about purchases of Common Stock by the Company during the quarter ended December 31, 2011:
| | | | | | | | | Total Number of Shares | | Maximum Number of Shares Remaining |
| | | Total Number of Shares | | Average Price Paid | | Purchased as Part of Publicly | | at Period End that May Be Purchased |
| | Period | | Purchased/Cancelled1 | | per Share | | Announced Plans or Programs2 | | Under the Plans or Programs |
| | 10/1/11 - 10/31/11 | | (947 | ) | | $ | 14.46 | | - | | 1,051,821 |
| 11/1/11 - 11/30/11 | | - | | | $ | 0.00 | | - | | 1,051,821 |
| 12/1/11 - 12/31/11 | | (463 | ) | | $ | 14.82 | | - | | 1,051,821 |
| Total for quarter | | (1,410 | ) | | | | | - | | |
| 1 | | Shares repurchased by Bancorp during the quarter include shares repurchased from employees in connection with cancellation of restricted stock to pay withholding taxes totaling 947 shares, 0 shares, and 463 shares, respectively, for the periods indicated. There were no shares repurchased in the periods indicated pursuant to the Company’s corporate stock repurchase program publicly announced in July 2000 (the “Repurchase Program”) and described in footnote 2 below. |
| 2 | | Under the Repurchase Program, the board of directors originally authorized the Company to purchase up to 330,000 common shares, which amount was increased by 550,000 shares in September 2000, by 1.0 million shares in September 2001, by 1.0 million shares in September 2002, and by 1.0 million shares in April 2004, and by 1.0 million shares in September 2007 for a total authorized repurchase amount as of December 31, 2011, of approximately 4.9 million shares, 1.05 million shares remain available for repurchase under the plan. Regulatory approval is required for share repurchases. |
17
Five Year Stock Performance Graph
The following chart compares the yearly percentage change in the cumulative shareholder return on our Common Stock during the five years ended December 31, 2011, with (1) the Total Return Index for the NASDAQ Stock Market (U.S. Companies) and (2) the Total Return Index for NASDAQ Bank Stocks. This comparison assumes $100.00 was invested on December 31, 2006, in our Common Stock and the comparison groups and assumes the reinvestment of all cash dividends prior to any tax effect and retention of all stock dividends. Bancorp’s total cumulative return was -89.2% over the five year period ended December 31, 2011, compared to -46.0% and 13.1% for the NASDAQ Bank Stocks and NASDAQ composite, respectively.
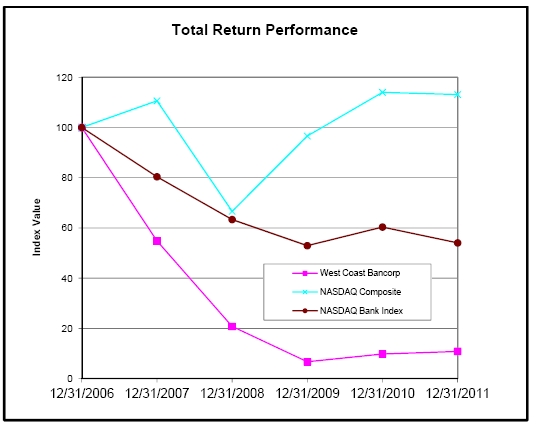
| Period Ended |
| Index | 12/31/06 | 12/31/07 | 12/31/08 | 12/31/09 | 12/31/10 | 12/31/11 |
| West Coast Bancorp | 100 | 54.8 | 20.8 | 6.7 | 9.8 | 10.8 |
| NASDAQ Composite | 100 | 110.6 | 66.6 | 96.6 | 114.0 | 113.1 |
| NASDAQ Bank Index | 100 | 80.4 | 63.3 | 52.9 | 60.4 | 54.0 |
18
ITEM 6. SELECTED FINANCIAL DATA
Consolidated Five Year Financial Data
The following selected consolidated five year financial data should be read in conjunction with Bancorp’s audited consolidated financial statements and the related notes to those statements presented in Item 8 of this report.
| (Dollars in thousands, except per share data) | | | As of and For the Year ended December 31, |
| | 2011 | | 2010 | | 2009 | | 2008 | | 2007 |
| Interest income | $ | 98,675 | | | $ | 105,576 | | | $ | 112,150 | | | $ | 140,846 | | | $ | 183,190 | |
| Interest expense | | 17,921 | | | | 22,269 | | | | 33,423 | | | | 48,696 | | | | 68,470 | |
| Net interest income | | 80,754 | | | | 83,307 | | | | 78,727 | | | | 92,150 | | | | 114,720 | |
| Provision for credit losses | | 8,133 | | | | 18,652 | | | | 90,057 | | | | 40,367 | | | | 38,956 | |
| Net interest income (loss) after provision for credit losses | | 72,621 | | | | 64,655 | | | | (11,330 | ) | | | 51,783 | | | | 75,764 | |
| Noninterest income | | 31,819 | | | | 32,697 | | | | 9,129 | | | | 24,629 | | | | 33,498 | |
| Noninterest expense | | 90,875 | | | | 90,337 | | | | 108,288 | | | | 90,323 | | | | 85,299 | |
| Income (loss) before income taxes | | 13,565 | | | | 7,015 | | | | (110,489 | ) | | | (13,911 | ) | | | 23,963 | |
| Provision (benefit) for income taxes | | (20,212 | ) | | | 3,790 | | | | (19,276 | ) | | | (7,598 | ) | | | 7,121 | |
| Net income (loss) | $ | 33,777 | | | $ | 3,225 | | | $ | (91,213 | ) | | $ | (6,313 | ) | | $ | 16,842 | |
| |
| Net interest income on a tax equivalent basis2 | $ | 81,870 | | | $ | 84,478 | | | $ | 80,222 | | | $ | 93,901 | | | $ | 116,361 | |
| |
| Per share data: | | | | | | | | | | | | | | | | | | | |
| Basic earnings (loss) per share | $ | 1.65 | | | $ | 0.16 | | | $ | (29.15 | ) | | $ | (2.05 | ) | | $ | 5.40 | |
| Diluted earnings (loss) per share | $ | 1.58 | | | $ | 0.16 | | | $ | (29.15 | ) | | $ | (2.05 | ) | | $ | 5.20 | |
| Cash dividends | $ | - | | | $ | - | | | $ | 0.10 | | | $ | 1.45 | | | $ | 2.55 | |
| Period end book value per common share | $ | 15.20 | | | $ | 13.04 | | | $ | 35.10 | | | $ | 63.15 | | | $ | 66.75 | |
| Weighted average common shares outstanding | | 19,007 | | | | 17,460 | | | | 3,102 | | | | 3,094 | | | | 3,101 | |
| Weighted average diluted shares outstanding | | 19,940 | | | | 18,059 | | | | 3,102 | | | | 3,094 | | | | 3,209 | |
| |
| Total assets | $ | 2,429,887 | | | $ | 2,461,059 | | | $ | 2,733,547 | | | $ | 2,516,140 | | | $ | 2,646,614 | |
| Total deposits | $ | 1,915,569 | | | $ | 1,940,522 | | | $ | 2,146,884 | | | $ | 2,024,379 | | | $ | 2,094,832 | |
| Total long-term borrowings | $ | 120,000 | | | $ | 168,599 | | | $ | 250,699 | | | $ | 91,059 | | | $ | 83,100 | |
| Total loans, net | $ | 1,466,089 | | | $ | 1,496,053 | | | $ | 1,686,352 | | | $ | 2,035,876 | | | $ | 2,125,752 | |
| Stockholders’ equity | $ | 314,479 | | | $ | 272,560 | | | $ | 249,058 | | | $ | 198,187 | | | $ | 208,241 | |
| Financial ratios: | | | | | | | | | | | | | | | | | | | |
| Return on average assets | | 1.37 | % | | | 0.13 | % | | | -3.49 | % | | | -0.25 | % | | | 0.66 | % |
| Return on average equity | | 11.79 | % | | | 1.21 | % | | | -45.66 | % | | | -3.06 | % | | | 7.93 | % |
| Average equity to average assets | | 11.64 | % | | | 10.32 | % | | | 7.64 | % | | | 8.04 | % | | | 8.37 | % |
| Dividend payout ratio | | 0.00 | % | | | 0.00 | % | | | -0.34 | % | | | -70.73 | % | | | 47.51 | % |
| Efficiency ratio1 | | 80.44 | % | | | 78.14 | % | | | 122.34 | % | | | 72.79 | % | | | 56.90 | % |
| Net loans to assets | | 60.34 | % | | | 60.79 | % | | | 61.69 | % | | | 80.91 | % | | | 80.33 | % |
| Average yields earned2 | | 4.29 | % | | | 4.40 | % | | | 4.71 | % | | | 5.92 | % | | | 7.72 | % |
| Average rates paid | | 1.15 | % | | | 1.27 | % | | | 1.76 | % | | | 2.60 | % | | | 3.76 | % |
| Net interest spread2 | | 3.14 | % | | | 3.13 | % | | | 2.95 | % | | | 3.32 | % | | | 3.96 | % |
| Net interest margin2 | | 3.52 | % | | | 3.48 | % | | | 3.33 | % | | | 3.90 | % | | | 4.86 | % |
| Nonperforming assets to total assets | | 2.94 | % | | | 4.09 | % | | | 5.59 | % | | | 7.86 | % | | | 1.12 | % |
| Allowance for loan losses to total loans | | 2.35 | % | | | 2.62 | % | | | 2.23 | % | | | 1.40 | % | | | 2.16 | % |
| Allowance for credit losses to total loans | | 2.40 | % | | | 2.67 | % | | | 2.29 | % | | | 1.45 | % | | | 2.53 | % |
| Net loan charge-offs to average loans | | 0.87 | % | | | 1.05 | % | | | 4.21 | % | | | 3.04 | % | | | 0.34 | % |
| Allowance for credit losses to nonperforming loans | | 88.63 | % | | | 67.07 | % | | | 39.68 | % | | | 23.46 | % | | | 207.75 | % |
| Allowance for loan losses to nonperforming loans | | 86.73 | % | | | 65.68 | % | | | 38.74 | % | | | 22.67 | % | | | 177.53 | % |
| 1 | | The efficiency ratio has been computed as noninterest expense divided by the sum of net interest income on a tax equivalent basis and noninterest income excluding gains/losses on sales of securities. |
| 2 | | Interest earned on nontaxable securities has been computed on a 35% tax equivalent basis. |
19
Consolidated Quarterly Financial Data
The following table presents selected consolidated quarterly financial data for each quarter of 2010 and 2011. The financial information contained in this table reflects all adjustments, which, in the opinion of management, are necessary for a fair presentation of the results of the interim periods.
| 2011 | | | | | | | | | | | | | | | |
| (Dollars in thousands, except per share data) | December 31, | | September 30, | | June 30, | | March 31, |
| Interest income | $ | 23,932 | | | $ | 24,721 | | | $ | 25,104 | | | $ | 24,918 | |
| Interest expense | | 5,992 | | | | 5,380 | | | | 3,143 | | | | 3,406 | |
| Net interest income | | 17,940 | | | | 19,341 | | | | 21,961 | | | | 21,512 | |
| Provision for credit losses | | 1,499 | | | | 1,132 | | | | 3,426 | | | | 2,076 | |
| Noninterest income | | 6,419 | | | | 8,414 | | | | 8,070 | | | | 8,916 | |
| Noninterest expense | | 22,744 | | | | 22,620 | | | | 22,958 | | | | 22,553 | |
| Income before income taxes | | 116 | | | | 4,003 | | | | 3,647 | | | | 5,799 | |
| Provision (benefit) for income taxes | | (17,646 | ) | | | (2,273 | ) | | | (987 | ) | | | 694 | |
| Net income | $ | 17,762 | | | $ | 6,276 | | | $ | 4,634 | | | $ | 5,105 | |
| |
| Earnings per share: | | | | | | | | | | | | | | | |
| Basic | $ | 0.87 | | | $ | 0.31 | | | $ | 0.23 | | | $ | 0.25 | |
| Diluted | $ | 0.83 | | | $ | 0.29 | | | $ | 0.22 | | | $ | 0.25 | |
| |
| Return on average assets1 | | 2.88 | % | | | 1.00 | % | | | 0.76 | % | | | 0.84 | % |
| Return on average equity1 | | 23.68 | % | | | 8.55 | % | | | 6.58 | % | | | 7.56 | % |
| |
| 1 Ratios have been annualized. | | | | | | | | | | | | | | | |
| |
| 2010 | | | | | | | | | | | | | | | |
| (Dollars in thousands, except per share data) | December 31, | | September 30, | | June 30, | | March 31, |
| Interest income | $ | 25,509 | | | $ | 26,053 | | | $ | 26,816 | | | $ | 27,198 | |
| Interest expense | | 3,620 | | | | 4,178 | | | | 7,906 | | | | 6,565 | |
| Net interest income | | 21,889 | | | | 21,875 | | | | 18,910 | | | | 20,633 | |
| Provision for credit losses | | 1,693 | | | | 1,567 | | | | 7,758 | | | | 7,634 | |
| Noninterest income | | 8,595 | | | | 8,069 | | | | 9,625 | | | | 6,408 | |
| Noninterest expense | | 23,330 | | | | 23,003 | | | | 22,909 | | | | 21,095 | |
| Income (loss) before income taxes | | 5,461 | | | | 5,374 | | | | (2,132 | ) | | | (1,688 | ) |
| Provision (benefit) for income taxes | | 3,549 | | | | (676 | ) | | | 1,717 | | | | (800 | ) |
| Net income (loss) | $ | 1,912 | | | $ | 6,050 | | | $ | (3,849 | ) | | $ | (888 | ) |
| |
| Earnings (loss) per share: | | | | | | | | | | | | | | | |
| Basic | $ | 0.09 | | | $ | 0.30 | | | | ($0.20 | ) | | | ($0.05 | ) |
| Diluted | $ | 0.09 | | | $ | 0.29 | | | | ($0.20 | ) | | | ($0.05 | ) |
| |
| Return on average assets1 | | 0.31 | % | | | 0.96 | % | | | -0.58 | % | | | -0.13 | % |
| Return on average equity1 | | 2.75 | % | | | 8.84 | % | | | -5.92 | % | | | -1.42 | % |
1 Ratios have been annualized.
20
| ITEM 7. | MANAGEMENT’S DISCUSSION AND ANALYSIS OF FINANCIAL CONDITION ANDRESULTS OFOPERATIONS |
The following discussion should be read in conjunction with the audited consolidated financial statements and related notes to those statements during the periods included in the consolidated financial statements of West Coast Bancorp and its subsidiaries that appear in Item 8 “Financial Statements and Supplementary Data” of this report. References to “we,” “our” or “us” refer to West Coast Bancorp and its subsidiaries.
Forward-Looking Statement Disclosure
Statements in this Annual Report of West Coast Bancorp (“Bancorp” or the “Company”) regarding future events or performance are “forward-looking statements” within the meaning of the Private Securities Litigation Reform Act of 1995 (the “PSLRA”) and are made pursuant to the safe harbors of the PSLRA. The Company’s actual results could be quite different from those expressed or implied by the forward-looking statements. Words such as “could,” “may,” “should,” “plans,” “believes,” “anticipates,” “estimates,” “predicts,” “expects,” “projects,” “potential,” or “continue,” or words of similar meaning, often help identify “forward-looking statements,” which include any statements that expressly or implicitly predict future events, results, or performance. Factors that could cause events, results or performance to differ from those expressed or implied by our forward-looking statements include, among others, risks discussed in Item 1A, “Risk Factors” of this report, risks discussed elsewhere in the text of this report, as well as the following specific factors:
General economic conditions, whether national or regional, and conditions in real estate markets, that may hinder our ability to increase lending activities or have an adverse effect on the demand for our loans and other products, our credit quality and related levels of nonperforming assets and loan losses, and the value and salability of the real estate that we own or that is the collateral for many of our loans;
Changing bank regulatory conditions, policies, or programs, whether arising as new legislation or regulatory initiatives, that could lead to restrictions on activities of banks generally or West Coast Bank (the “Bank”) in particular, increased costs, including deposit insurance premiums, price controls on debit card interchange, regulation or prohibition of certain income producing activities, or changes in the secondary market for bank loan and other products;
Competitive factors, including competition with community, regional and national financial institutions, that may lead to pricing pressures that reduce yields the Bank earns on loans and increase rates the Bank pays on deposits, the loss of our most valued customers, defection of key employees or groups of employees, or other losses;
Increasing or decreasing interest rate environments, including changes in the slope and level of the yield curve, which may be caused by the Federal Reserve Bank’s public comments about future direction and level of interest rates, that could lead to decreases in net interest margin, lower net interest and fee income, including lower gains on sales of loans, and changes in the value of our investment securities;
Failure to develop, implement, and distribute competitive and client value added products, that may adversely affect our ability to generate profitable revenue sources;
Any failure to successfully implement expense reduction initiatives and realize expected efficiencies, while retaining revenues, that may result in us realizing less benefits from our cost reduction initiatives than expected; and
Changes or failures in technology or third party vendor relationships in important revenue production or service areas or increases in required investments in technology that could reduce our revenues, increase our costs, or lead to disruptions in our business.
Furthermore, forward-looking statements are subject to risks and uncertainties related to the Company’s ability to, among other things: dispose of properties or other assets obtained through foreclosures at expected prices and within a reasonable period of time; attract and retain key personnel; generate loan and deposit balances at projected spreads; sustain fee generation including gains on sales of loans; maintain asset quality and control risk; limit the amount of net loan charge-offs; adapt to changing customer deposit, investment and borrowing behaviors; control expenses; and monitor and manage its financial reporting, operating and disclosure control environments.
Readers are cautioned not to place undue reliance on our forward-looking statements, which reflect management’s analysis only as of the date of the statements. We do not intend to publicly revise or update forward-looking statements to reflect events or circumstances that arise after the date of this report.
Readers should carefully review all disclosures we file from time to time with the Securities and Exchange Commission (“SEC”).
21
Overview
2011 Financial review
The Company’s operating results in 2011 show several favorable trends. During 2011, we recorded:
Net income of $33.8 million compared to $3.2 million in 2010;
A return on average assets of 1.37%, an increase from .13% in 2010;
A reversal of the Company’s deferred tax asset valuation allowance in the fourth quarter of 2011, which was the most significant factor in the Company recording a benefit for income taxes of $20.2 million in 2011 compared to a provision for income taxes of $3.8 million in 2010;
An average rate paid on total deposits of .26%, a decline from .60% in 2010;
A provision for credit losses of $8.1 million, down $10.6 million from $18.7 million in 2010;
Net loan charge-offs of $13.2 million, a decline from $17.0 million in 2010; and
Net Other Real Estate Owned (“OREO”) valuation adjustments and gains and losses on sales of $3.2 million, a reduction from $4.4 million in 2010.
The financial condition of Bancorp and the Bank also continued to strengthen in 2011, as evidenced by:
Increasing the Bank’s Total and Tier 1 risk-based capital ratios to 19.92% and 18.66%, respectively, at December 31, 2011, up from 18.05% and 16.79% at December 31, 2010;
Improving the Bank’s leverage ratio to 14.09% at December 31, 2011, from 12.51% a year ago; and
Reducing total nonperforming assets by 29% or $29.3 million over the past twelve months to $71.4 million at year end.
In addition, the Bank completed a number of expense reduction initiatives in 2011, with related one-time expense of $1.3 million, which are expected to reduce our expenses by $2.6 to $2.8 million in 2012. Also, the Bank prepaid its $168.6 million in term Federal Home Loan Bank (“FHLB”) borrowings resulting in a prepayment charge of $7.1 million, an action that will reduce interest expense approximately $3.2 million in 2012 and also in future years. Concurrently with the prepayment of the borrowings, the Bank elected to enter into $120.0 million of new term borrowings with FHLB in an effort to maintain the interest rate sensitivity position within its balance sheet. The duration of the new term borrowings increased to approximately three and a half years compared to two years for the borrowing that were prepaid.
Regulatory Order.
On October 18, 2011, the Bank received a regulatory order (“Order”) from the Federal Deposit Insurance Corporation (“FDIC”) relating to its overdraft practices. As part of the order, the Bank agreed to implement certain procedural improvements relating to its compliance function and overdraft program, require certain customers who previously elected to opt-in to allow the Bank to pay overdrafts resulting from ATM and point of sale transactions to opt-in again in order for the Bank to continue paying such overdrafts, to pay a civil money penalty of $390,000, and make restitution payments to certain customers totaling $246,000. Many of the procedural improvements required by the Order are underway or have been completed. For information regarding the risks facing the Bank, see the discussion under the section “Risk Factors” in Item 1A of this report.
For more information, see the discussion under the subheading “Current Regulatory Actions” in the section “Supervision and Regulation” included in Item 1 of this report.
22
Income Statement Overview
Our net income for the full year 2011 was $33.8 million, compared to $3.2 million in 2010 and a net loss of $91.2 million in 2009. Earnings per diluted share for the years ended December 31, 2011, and 2010, was $1.58 and $.16, respectively, while the loss per diluted share for the year ended December 31, 2009, was $29.15. Return on average equity improved to 11.8% in 2011 from 1.2% in 2010 and -45.7% in 2009. As discussed below, the improved year-over-year net income was primarily due to a reversal of the Company’s deferred tax asset valuation allowance and a reduction in provision for credit losses in 2011.
Net Interest Income, Average Balances, Yields Earned, and Rates Paid. The following table displays information on net interest income, average yields earned and rates paid, as well as net interest spread and margin information on a tax equivalent basis for the periods indicated. The adjustment to a taxable equivalent basis increases interest income by an estimate of the additional yield that would have been received by the Company if its tax-exempt securities had been taxable at the statutory rate. This information can be used to follow the changes in our yields and rates and the changes in our earning assets and liabilities over the past three years:
| (Dollars in thousands) | Year Ended December 31, | | Increase (Decrease) | | Percentage Change |
| 2011 | | 2010 | | 2009 | | 11-10 | | 10-09 | | 11-10 | | 10-09 |
| Interest and fee income1 | $ | 99,791 | | | $ | 106,747 | | | $ | 113,645 | | | ($6,956 | ) | | ($6,898 | ) | | -6.5 | % | | -6.1 | % |
| Interest expense | $ | 17,921 | | | $ | 22,269 | | | $ | 33,423 | | | ($4,348 | ) | | ($11,154 | ) | | -19.5 | % | | -33.4 | % |
| Net interest income1 | $ | 81,870 | | | $ | 84,478 | | | $ | 80,222 | | | ($2,608 | ) | | $4,256 | | | -3.1 | % | | 5.3 | % |
| |
| Average interest earning assets | $ | 2,324,016 | | | $ | 2,425,073 | | | $ | 2,410,755 | | | ($101,057 | ) | | $14,318 | | | -4.2 | % | | 0.6 | % |
| Average interest bearing liabilities | $ | 1,558,434 | | | $ | 1,751,296 | | | $ | 1,897,170 | | | ($192,862 | ) | | ($145,874 | ) | | -11.0 | % | | -7.7 | % |
| |
| Average interest earning assets/ | | | | | | | | | | | | | | | | | | | | | | | |
| Average interest bearing liabilities | | 149.13 | % | | | 138.47 | % | | | 127.07 | % | | 10.65 | % | | 11.40 | % | | | | | | |
| Average yield earned1 | | 4.29 | % | | | 4.40 | % | | | 4.71 | % | | -0.11 | % | | -0.31 | % | | | | | | |
| Average rate paid | | 1.15 | % | | | 1.27 | % | | | 1.76 | % | | -0.12 | % | | -0.49 | % | | | | | | |
| Net interest spread1 | | 3.14 | % | | | 3.13 | % | | | 2.95 | % | | 0.01 | % | | 0.18 | % | | | | | | |
| Net interest margin1 | | 3.52 | % | | | 3.48 | % | | | 3.33 | % | | 0.04 | % | | 0.15 | % | | | | | | |
1 Interest earned on nontaxable securities has been computed on a 35% tax equivalent basis.
Net interest income on a tax equivalent basis totaled $81.9 million for the year ended December 31, 2011, a decrease of $2.6 million or 3.1% from $84.5 million in 2010. The net interest margin increased four basis points to 3.52% in 2011 from 3.48% in 2010. Adjusting for the FHLB borrowing prepayment charges of $7.1 million in 2011 and $2.3 million in 2010, the net interest margin in 2011 was 3.83%, up from 3.58% in 2010. The increase in net interest income and margin from 2010 to 2011, after the adjustment to remove the effects of the prepayment charges, was mainly due to lower rates paid on interest bearing deposits, a change in deposit mix to lower cost demand deposits, as well as lower cash balances at the Federal Reserve. The combined favorable effect from these factors more than offset the impact from lower loan balances and lower yields on total earning assets in 2011 compared to 2010. In 2009, net interest income on a tax equivalent basis was $80.2 million and the net interest margin was 3.33%. The $4.3 million increase in net interest income and 15 basis point increase in net interest margin from 2009 to 2010 was mainly due to lower rates paid on interest bearing deposits, a change in deposit mix to lower cost demand deposits, as well as lower cash balances at the Federal Reserve and lower nonaccrual loan balances. These trends more than offset lower loan balances, a significant shift in the Company’s earning assets mix from loan to investment securities balances, lower yield on earning assets, and the $2.3 million charge associated with prepaying a portion of our FHLB debt in 2010.
Changing interest rate environments, including the slope, level of, and changes in the yield curve, competitive pricing pressure, and changing economic conditions, could lead to higher deposit costs, lower loan yields, reduced net interest margin and spread and lower loan fees, all of which could lead to additional pressure on our net interest income. For more information regarding interest rates, see the discussion under the section “Quantitative and Qualitative Disclosures about Market Risk” in the Item 7A of this report.
As of December 31, 2011, the Bank had $729.7 million in floating and adjustable rate loans with interest rate floors, with $550.9 million of these loans at their floor rate. At year end 2010, $668.4 million in floating and adjustable rate loans had interest rate floors, with $444.3 million at their floor rate. The floors have benefited the Company’s loan yield and net interest income and margin over the past few years given the extremely low market interest rate environment. If interest rates rise, the Company anticipates yields on loans at floors will lag underlying changes in market interest rates, although the overall effect will depend on how quickly and dramatically market interest rates rise, as well as how the slope of the market yield curve changes.
Until our loan balances begin to expand and become a larger component of our overall earning assets balance and the value of non-interest bearing deposit balances increase, we project continued pressure on the Company’s yield on earning assets and net interest income and margin. Whether we will be able to expand our loan portfolio in 2012 will be primarily dependent on increased economic activity and market conditions, including the effects of competitive pressures, all of which will affect loan demand from qualified clients and credit quality.
23
The following table sets forth, for the periods indicated, information with regard to (1) average balances of assets and liabilities, (2) the total dollar amounts of interest income on interest earning assets and interest expense on interest bearing liabilities, (3) resulting yields and rates, (4) net interest income and (5) net interest spread. Nonaccrual loans have been included in the tables as loans carrying a zero yield. Loan fees are recognized as income using the interest method over the life of the loan.
| Year Ended December 31, |
| (Dollars in thousands) | 2011 | | 2010 | | 2009 |
| Average | | Interest | | | | | Average | | Interest | | | | | Average | | Interest | | | |
| Outstanding | | Earned/ | | Yield/ | | Outstanding | | Earned/ | | Yield/ | | Outstanding | | Earned/ | | Yield/ |
| Balance | | Paid | | Rate1 | | Balance | | Paid | | Rate1 | | Balance | | Paid | | Rate1 |
| ASSETS: | | | | | | | | | | | | | | | | | | | | | | | | | | | | | |
| Interest earning balances | | | | | | | | | | | | | | | | | | | | | | | | | | | | | |
| due from banks | $ | 67,332 | | | $ | 184 | | 0.27 | % | | $ | 188,925 | | | $ | 493 | | 0.26 | % | | $ | 136,944 | | | $ | 366 | | 0.27 | % |
| Federal funds sold | | 3,796 | | | | 3 | | 0.08 | % | | | 6,194 | | | | 6 | | 0.09 | % | | | 6,673 | | | | 6 | | 0.09 | % |
| Taxable securities2 | | 677,840 | | | | 16,177 | | 2.39 | % | | | 547,960 | | | | 14,493 | | 2.64 | % | | | 276,852 | | | | 8,646 | | 3.12 | % |
| Nontaxable securities3 | | 57,053 | | | | 3,190 | | 5.59 | % | | | 58,139 | | | | 3,346 | | 5.76 | % | | | 72,770 | | | | 4,270 | | 5.87 | % |
| Loans, including fees4 | | 1,517,995 | | | | 80,237 | | 5.29 | % | | | 1,623,855 | | | | 88,409 | | 5.44 | % | | | 1,917,516 | | | | 100,357 | | 5.23 | % |
| Total interest earning assets | | 2,324,016 | | | | 99,791 | | 4.29 | % | | | 2,425,073 | | | | 106,747 | | 4.40 | % | | | 2,410,755 | | | | 113,645 | | 4.71 | % |
| |
| Allowance for loan losses | | (38,456 | ) | | | | | | | | | (42,003 | ) | | | | | | | | | (37,363 | ) | | | | | | |
| Premises and equipment | | 25,919 | | | | | | | | | | 27,517 | | | | | | | | | | 31,309 | | | | | | | |
| Other assets | | 149,315 | | | | | | | | | | 165,284 | | | | | | | | | | 210,575 | | | | | | | |
| Total assets | $ | 2,460,794 | | | | | | | | | $ | 2,575,871 | | | | | | | | | $ | 2,615,276 | | | | | | | |
| |
| LIABILITIES AND | | | | | | | | | | | | | | | | | | | | | | | | | | | | | |
| STOCKHOLDERS' EQUITY: | | | | | | | | | | | | | | | | | | | | | | | | | | | | | |
| Interest bearing demand | $ | 362,334 | | | $ | 226 | | 0.06 | % | | $ | 335,134 | | | $ | 447 | | 0.13 | % | | $ | 298,002 | | | $ | 776 | | 0.26 | % |
| Savings | | 112,385 | | | | 125 | | 0.11 | % | | | 103,531 | | | | 278 | | 0.27 | % | | | 89,903 | | | | 714 | | 0.79 | % |
| Money market | | 654,329 | | | | 1,723 | | 0.26 | % | | | 659,542 | | | | 3,939 | | 0.60 | % | | | 617,881 | | | | 8,194 | | 1.33 | % |
| Time deposits | | 217,149 | | | | 2,899 | | 1.34 | % | | | 388,500 | | | | 7,466 | | 1.92 | % | | | 587,299 | | | | 14,758 | | 2.51 | % |
| Short-term borrowings5 | | 14,653 | | | | 1,004 | | 6.85 | % | | | 7,570 | | | | 494 | | 6.52 | % | | | 44,220 | | | | 806 | | 1.82 | % |
| Long-term borrowings5 6 | | 197,584 | | | | 11,944 | | 6.05 | % | | | 257,019 | | | | 9,645 | | 3.75 | % | | | 259,865 | | | | 8,175 | | 3.15 | % |
| Total interest bearing | | | | | | | | | | | | | | | | | | | | | | | | | | | | | |
| liabilities | | 1,558,434 | | | | 17,921 | | 1.15 | % | | | 1,751,296 | | | | 22,269 | | 1.27 | % | | | 1,897,170 | | | | 33,423 | | 1.76 | % |
| Demand deposits | | 592,630 | | | | | | | | | | 540,280 | | | | | | | | | | 499,283 | | | | | | | |
| Other liabilities | | 23,332 | | | | | | | | | | 18,486 | | | | | | | | | | 19,044 | | | | | | | |
| Total liabilities | | 2,174,396 | | | | | | | | | | 2,310,062 | | | | | | | | | | 2,415,497 | | | | | | | |
| Stockholders' equity | | 286,398 | | | | | | | | | | 265,809 | | | | | | | | | | 199,779 | | | | | | | |
| Total liabilities and | | | | | | | | | | | | | | | | | | | | | | | | | | | | | |
| stockholders' equity | $ | 2,460,794 | | | | | | | | | $ | 2,575,871 | | | | | | | | | $ | 2,615,276 | | | | | | | |
| Net interest income | | | | | $ | 81,870 | | | | | | | | | $ | 84,478 | | | | | | | | | $ | 80,222 | | | |
| Net interest spread | | | | | | | | 3.14 | % | | | | | | | | | 3.13 | % | | | | | | | | | 2.95 | % |
| |
| Net interest margin | | | | | | | | 3.52 | % | | | | | | | | | 3.48 | % | | | | | | | | | 3.33 | % |
| 1 | | Yield/rate calculations have been based on more detailed information and therefore may not recompute exactly due to rounding. |
| 2 | | 2011 and 2010 do not include Federal Home Loan Bank stock balances. In 2011 and 2010, FHLB stock is included in other assets. 2009 investment securities includes Federal Home Loan Bank stock balances. |
| 3 | | Interest earned on nontaxable securities has been computed on a 35% tax equivalent basis. The tax equivalent basis adjustment for the years ended December 31, 2011, 2010, and 2009, was $1.1 million, $1.2 million, and $1.5 million, respectively. |
| 4 | | Includes balances of loans held for sale and nonaccrual loans. |
| 5 | | Includes portion of $7.1 million prepayment fee in connection with prepaying $168.6 million in FHLB borrowings in the year 2011. The maximum amount of short-term borrowings held during the year was $39.2 million and $17.6 million for the years ended December 31, 2011 and 2010, respectively. |
| 6 | | Includes junior subordinated debentures with average balance of $51.0 million for 2011, 2010, and 2009. |
24
Net Interest Income – Changes Due to Rate and Volume.The following table sets forth the dollar amounts of the changes in consolidated net interest income attributable to changes in volume and to changes in interest rates. Changes not due solely to volume or rate and changes due to new product lines, if any, are allocated to volume.
| Year Ended December 31, |
| 2011 compared to 2010 | | 2010 compared to 2009 |
| (Dollars in thousands) | Increase (Decrease) due to: | | Total Increase | | Increase (Decrease) due to: | | Total Increase |
| Volume | | Yield/Rate | | (Decrease) | | Volume | | Yield/Rate | | (Decrease) |
| Interest income: | | | | | | | | | | | | | | | | | | | | | | | |
| Interest earning balances due | | | | | | | | | | | | | | | | | | | | | | | |
| from banks | $ | (317 | ) | | $ | 8 | | | $ | (309 | ) | | $ | 98 | | | $ | 29 | | | $ | 127 | |
| Federal funds sold | | (2 | ) | | | (1 | ) | | | (3 | ) | | | - | | | | - | | | | - | |
| Investment security income: | | | | | | | | | | | | | | | | | | | | | | | |
| Interest on taxable securities | | 3,903 | | | | (2,219 | ) | | | 1,684 | | | | 8,637 | | | | (2,789 | ) | | | 5,848 | |
| Interest on nontaxable securities1 | | (63 | ) | | | (93 | ) | | | (156 | ) | | | (859 | ) | | | (66 | ) | | | (925 | ) |
| Loans, including fees on loans | | (4,699 | ) | | | (3,473 | ) | | | (8,172 | ) | | | (12,182 | ) | | | 234 | | | | (11,948 | ) |
| Total interest income1 | | (1,178 | ) | | | (5,778 | ) | | | (6,956 | ) | | | (4,306 | ) | | | (2,592 | ) | | | (6,898 | ) |
| |
| Interest expense: | | | | | | | | | | | | | | | | | | | | | | | |
| Interest bearing demand | | 36 | | | | (257 | ) | | | (221 | ) | | | 97 | | | | (425 | ) | | | (328 | ) |
| Savings | | 24 | | | | (177 | ) | | | (153 | ) | | | 108 | | | | (545 | ) | | | (437 | ) |
| Money market | | (31 | ) | | | (2,185 | ) | | | (2,216 | ) | | | 552 | | | | (4,807 | ) | | | (4,255 | ) |
| Time deposits | | (3,446 | ) | | | (1,121 | ) | | | (4,567 | ) | | | (4,618 | ) | | | (2,674 | ) | | | (7,292 | ) |
| Short-term borrowings2 | | 462 | | | | 48 | | | | 510 | | | | (668 | ) | | | 356 | | | | (312 | ) |
| Long-term borrowings2 3 | | (2,231 | ) | | | 4,530 | | | | 2,299 | | | | (90 | ) | | | 1,560 | | | | 1,470 | |
| Total interest expense | | (5,186 | ) | | | 838 | | | | (4,348 | ) | | | (4,619 | ) | | | (6,535 | ) | | | (11,154 | ) |
| Increase (decrease) in net interest income1 | $ | 4,008 | | | $ | (6,616 | ) | | $ | (2,608 | ) | | $ | 313 | | | $ | 3,943 | | | $ | 4,256 | |
| 1 | | Tax exempt income has been adjusted to a tax-equivalent basis using a 35% tax equivalent basis. |
| 2 | | Includes portion of $7.1 million prepayment fee in connection with prepaying $168.6 million in FHLB borrowings in the year 2011. The year ending 2010 includes a $2.3 million prepayment fee in connection with prepaying $99.1 million in FHLB borrowings. |
| 3 | | Long-term borrowings include junior subordinated debentures. |
For the year ended December 31, 2011, lower loan balances and yield on those balances were the main drivers of the $7.0 million decline in interest income as compared to 2010. Reduced interest expense in 2011, principally caused by a decline in time deposit balances and lower deposit rates, in money market and time deposits categories more than offset the decline in interest income. However, the $7.1 million charge associated with prepaying FHLB borrowings in 2011 compared to $2.3 million in such charges in 2010 caused net interest income to decline $2.6 million year-over-year. The $6.9 million decline in interest income during 2010 compared to 2009 was chiefly due to lower loan balances. However, lower interest expense in 2010 caused by a decline in time deposit balances and lower deposit rates, primarily in money market and time deposits categories, more than offset the decline in interest income and the 2010 FHLB prepayment charge resulting in a $4.3 million increase in net interest income in 2010 compared to 2009.
Provision for Credit Losses. The provision for credit losses is comprised of two primary components, a provision for loan losses related to outstanding loans and a provision for losses related to unfunded commitments. The provision for credit losses reflects changes in the credit quality of the entire loan portfolio. The provision for credit losses is recorded to bring the allowance for loan losses and the reserve for unfunded commitments to amounts considered appropriate by management based on factors which are described in the “Credit Management” and “Allowance for Credit Losses and Net Loan Charge-offs” sections in this Item 7 of this report.
The provision for credit losses was $8.1 million, $18.7 million, and $90.1 million for the years ended December 31, 2011, 2010 and 2009, respectively, while net loan charge-offs were $13.2 million, $17.0 million, and $80.6 million, over those same years. The provision for credit losses decreased $10.6 million in 2011 compared to 2010, primarily due to a significant reduction in unfavorable loan risk rating migration within the Company’s loan portfolio and lower net loan charge-offs in the commercial, residential real estate construction, and mortgage categories, as well as in nonstandard mortgages, which was only partially offset by higher home equity and commercial real estate net charge-offs.
25
The $18.7 million provision for credit losses in 2010 was significantly lower than the $90.1 million provision for credit losses in 2009. The 2009 provision reflected a substantial unfavorable loan risk rating migration and material net charge-offs within the loan portfolio in 2009, which resulted in, among other things, a substantial increase in the general valuation allowances within the allowance for credit losses model during 2009 and also in 2010.
The level of the Company’s future provisioning will be heavily dependent on the local real estate market for both residential and commercial properties, general economic conditions nationally and in the areas in which we do business, and the effects of any changes in interest rates.
Noninterest Income. Our noninterest income for the year ended December 31, 2011, was $31.8 million down $.9 million or 3% compared to $32.7 million in 2010. As a result of implementing the FDIC guidance on overdraft programs in second quarter 2011, deposit service charges in 2011 declined $2.3 million or 15% from 2010. Payment systems related revenues increased $.9 million in 2011 compared to 2010 mainly as a result of an increase in number of deposit transaction accounts and associated cards as well as higher transaction volumes. Trust and investment service revenue increased 6% or $.2 million in 2011 compared to 2010. In 2011, gains on sales of loans were $1.3 million, up 12% from $1.2 million for 2010. This increase was due to a higher volume of sales of residential mortgage loans. The Company recorded net gains on sales of securities of $.7 million in 2011 compared to $1.6 million in 2010. The $1.2 million decrease in OREO valuation adjustments, which is a component of noninterest income, compared to 2010 was primarily due to a reduction in OREO property balances as well as a slower decline in residential real estate property values within our markets in 2011. Total noninterest income before the effects of OREO losses was $35.1 million in 2011 compared to $37.1 million in 2010.
Our noninterest income for the year ended December 31, 2010, was $32.7 million up $23.6 million or 258%, compared to $9.1 million in 2009. The 2010 increase predominantly reflected a $22.5 million decrease in losses related to OREO property sales and valuation adjustments from 2009. In the fourth quarter of 2009, the Company also sold 69 OREO properties with a book value of $18.9 million in a bulk sale. The Company recorded a loss on sale of $6.7 million associated with this transaction.
Our ability to increase noninterest income in the future will be dependent on many factors, including the effects of legislation, pricing changes by the payment card networks, or regulations limiting bank activities. Our ability to retain and grow deposit balances, level of interest rates, and the success in developing and distributing new products could also be impacted by the factors noted above. For example, if the payment card networks were to lower debit or credit card interchange rates the Company’s revenues in its payment systems business could be materially and adversely affected. Additional OREO valuation adjustments and competitive factors could also adversely affect our noninterest income.
The following table illustrates the components and change in noninterest income for the periods shown:
| (Dollars in thousands) | Full year | | Full year | | 2011 to 2010 | | Full year | | 2010 to 2009 |
| 2011 | | 2010 | | Change | | 2009 | | Change |
| Noninterest income | | | | | | | | | | | | | | | | | | | |
| Service charges on deposit accounts | $ | 13,353 | | | $ | 15,690 | | | $ | (2,337 | ) | | $ | 15,765 | | | $ | (75 | ) |
| Payment systems related revenue | | 12,381 | | | | 11,393 | | | | 988 | | | | 9,399 | | | | 1,994 | |
| Trust and investment services revenues | | 4,503 | | | | 4,267 | | | | 236 | | | | 4,101 | | | | 166 | |
| Gains on sales of loans | | 1,335 | | | | 1,197 | | | | 138 | | | | 1,738 | | | | (541 | ) |
| Other | | 2,949 | | | | 3,003 | | | | (54 | ) | | | 4,438 | | | | (1,435 | ) |
| Other-than-temporary impairment losses | | (179 | ) | | | - | | | | (179 | ) | | | (192 | ) | | | 192 | |
| Gain on sales of securities, net | | 713 | | | | 1,562 | | | | (849 | ) | | | 833 | | | | 729 | |
| Total | | 35,055 | | | | 37,112 | | | | (2,057 | ) | | | 36,082 | | | | 1,030 | |
| |
| OREO gains (losses) on sale, net | | 1,596 | | | | 2,234 | | | | (638 | ) | | | (1,725 | ) | | | 3,959 | |
| OREO valuation adjustments | | (4,832 | ) | | | (6,649 | ) | | | 1,817 | | | | (18,562 | ) | | | 11,913 | |
| OREO loss on bulk sale | | - | | | | - | | | | - | | | | (6,666 | ) | | | 6,666 | |
| Total | | (3,236 | ) | | | (4,415 | ) | | | 1,179 | | | | (26,953 | ) | | | 22,538 | |
| |
| Total noninterest income | $ | 31,819 | | | $ | 32,697 | | | $ | (878 | ) | | $ | 9,129 | | | $ | 23,568 | |
26
Noninterest Expense.Total noninterest expense of $90.9 million in 2011, increased $.6 million, or .6%, from $90.3 million in 2010. The $2.7 million increase in salaries and employee benefits expense was largely caused by higher incentive and commission expenses as well as $1.3 million in expense related to cost reduction initiatives, which we anticipate will reduce our expense base in 2012. The increase in salaries and benefits was nearly offset by a decrease in other noninterest expense which was attributable, in part, to decreases in FDIC insurance premiums and OREO expenses as well as an accrual for a contingent liability made in 2010 which was partially reversed in 2011.
Additionally, equipment and occupancy expenses collectively decreased $.4 million in 2011 compared to 2010 partly as a result of cost savings associated with five branch closures in 2011. Payment system related expenses increased $.4 million in 2011 over 2010 due to higher transaction volumes.
Noninterest expense in 2010 decreased $18.0 million, or 17%, from $108.3 million in 2009, primarily due to a $13.1 million goodwill impairment charge taken in the first quarter 2009 and a $3.4 million decrease in the Company’s FDIC insurance premiums in 2010. The decrease in FDIC insurance expense in 2010 was due to a combination of an industry wide special assessment charge of $1.2 million in 2009 and a decrease in our insurance premium assessment rate in 2010.
Changing business conditions, increased costs in connection with retention of, or a failure to retain key employees, lower loan production volumes causing deferred loan origination costs to decline, unexpected increases in OREO expenses, or a failure to manage our operating and control environments could adversely affect our ability to limit expense growth in the future.
The following table illustrates the components and changes in noninterest expense for the periods shown:
| (Dollars in thousands) | Full year | | Full year | | 2011 to 2010 | | Full year | | 2010 to 2009 |
| 2011 | | 2010 | | Change | | 2009 | | Change |
| Noninterest expense | | | | | | | | | | | | | | | | |
| Salaries and employee benefits | $ | 48,587 | | $ | 45,854 | | $ | 2,733 | | | $ | 44,608 | | $ | 1,246 | |
| Equipment | | 6,113 | | | 6,247 | | | (134 | ) | | | 8,120 | | | (1,873 | ) |
| Occupancy | | 8,674 | | | 8,894 | | | (220 | ) | | | 9,585 | | | (691 | ) |
| Payment systems related expense | | 5,141 | | | 4,727 | | | 414 | | | | 4,036 | | | 691 | |
| Professional fees | | 4,118 | | | 3,991 | | | 127 | | | | 4,342 | | | (351 | ) |
| Postage, printing and office supplies | | 3,265 | | | 3,148 | | | 117 | | | | 3,201 | | | (53 | ) |
| Marketing | | 3,003 | | | 3,086 | | | (83 | ) | | | 2,990 | | | 96 | |
| Communications | | 1,549 | | | 1,525 | | | 24 | | | | 1,574 | | | (49 | ) |
| Goodwill impairment | | - | | | - | | | - | | | | 13,059 | | | (13,059 | ) |
| Other noninterest expense | | 10,425 | | | 12,865 | | | (2,440 | ) | | | 16,773 | | | (3,908 | ) |
| Total noninterest expense | $ | 90,875 | | $ | 90,337 | | $ | 538 | | | $ | 108,288 | | $ | (17,951 | ) |
27
Income Taxes. The Company recorded a benefit for income taxes of $20.2 million for the full year 2011 compared to a provision of $3.8 million for 2010. The tax benefit for 2011 was primarily the result of fully reversing the Company’s deferred tax asset valuation allowance. The Company recorded a tax benefit of $19.3 million in 2009.
The following table shows the components of the tax provision (benefit) for the periods shown:
| (Dollars in thousands) | | | | | | | | | 2011 to 2010 | | | | | | 2010 to 2009 |
| Full year 2011 | | Full year 2010 | | Change | | Full year 2009 | | Change |
| Provision (benefit) for income taxes net of reversal | | | | | | | | | | | | | | | | | | | |
| (establishment) of deferred tax asset valuation allowance | $ | 3,252 | | | $ | - | | | $ | (3,252 | ) | | $ | (40,275 | ) | | $ | (40,275 | ) |
| Provision (benefit) for income taxes from deferred | | | | | | | | | | | | | | | | | | - | |
| tax asset valuation allowance: | | | | | | | | | | | | | | | | | | - | |
| Establishment of deferred tax asset valuation allowance | | - | | | | - | | | | - | | | | 23,296 | | | | 23,296 | |
| Reversal of deferred tax asset valuation allowance | | (23,464 | ) | | | - | | | | 23,464 | | | | - | | | | - | |
| Unrealized loss on securities | | - | | | | (1,197 | ) | | | (1,197 | ) | | | (2,297 | ) | | | (1,100 | ) |
| Change in deferred tax assets-tax return adjustments | | - | | | | 4,987 | | | | 4,987 | | | | - | | | | (4,987 | ) |
| Total provision (benefit) for income taxes | $ | (20,212 | ) | | $ | 3,790 | | | $ | 24,002 | | | $ | (19,276 | ) | | $ | (23,066 | ) |
As of December 31, 2009, the Company determined that it was appropriate to establish a deferred tax asset valuation allowance of $21.0 million, reducing the Company’s net deferred tax asset to $3.2 million. The net deferred tax asset was the amount that the Company determined was more likely than not to be realized. As of December 31, 2010, following adjustments during the year, the Company’s deferred tax asset valuation allowance had increased to $23.5 million against the deferred tax asset balance of $29.3 million for a net deferred tax asset of $5.8 million. As of December 31, 2011, the Company determined it was appropriate to fully reverse the deferred tax asset valuation allowance. Based on the analysis of positive and negative evidence at December 31, 2011, including the Company’s return to profitability over the past six quarters, no deferred tax asset valuation allowance was deemed necessary as of December 31, 2011.
The reconciliation between the Company’s effective tax rate on income (loss) and the statutory rate is as follows:
| (Dollars in thousands) | Year ended December 31, |
| 2011 | | 2010 | | 2009 |
| Expected federal income tax (benefit) provision1 | $ | 4,612 | | | $ | 2,385 | | | $ | (38,671 | ) |
| State income tax, net of federal income tax effect | | 422 | | | | 66 | | | | (3,504 | ) |
| Interest on obligations of state and political subdivisions | | | | | | | | | | | |
| exempt from federal tax | | (755 | ) | | | (901 | ) | | | (1,148 | ) |
| Federal low income housing tax credits | | (535 | ) | | | (427 | ) | | | (972 | ) |
| Bank owned life insurance | | (305 | ) | | | (302 | ) | | | (307 | ) |
| Goodwill impairment | | - | | | | - | | | | 4,570 | |
| Change in deferred tax asset valuation allowance | | (23,464 | ) | | | 2,465 | | | | 20,999 | |
| Other, net | | (187 | ) | | | 504 | | | | (243 | ) |
| Total (benefit) provision for income taxes | $ | (20,212 | ) | | $ | 3,790 | | | $ | (19,276 | ) |
1 | | Federal income tax provision applied at 34% in 2011 and 2010 and 35% in 2009. |
For more information regarding the Company’s income taxes, see Note 16 “Income Taxes” to the Company’s audited consolidated financial statements included under the section “Financial Statements and Supplementary Data” in Item 8 of this report.
28
Balance Sheet Overview
Balance sheet highlights are as follows:
- Total assets were $2.4 billion as of December 31, 2011, down slightly from $2.5 billion at December 31, 2010;
- Total loans remained relatively unchanged at $1.5 billion as compared to loan balances a year ago;
- The combined balance of total cash and cash equivalents and investment securities was substantial at $822.1 million at December 31, 2011, and represented 36% of earning assets at year end, as compared to $824.1 million and 35%, respectively, at December 31, 2010;
- Time deposits declined $102 million in 2011 while noninterest bearing and interest bearing demand deposits collectively grew by $115 million, causing total deposits to remain relatively unchanged at $1.9 billion at December 30, 2011, as compared to year end 2010.
Our balance sheet management efforts are now focused on:
- Shifting our earning asset mix toward loan balances by increasing new loan origination production within our concentration parameters to targeted customer segments as opportunities arise;
- Continuing to resolve nonaccrual loans and dispose of OREO properties; and
- Managing the size of our balance sheet and continuing to maintain strong capital ratios and liquidity position until we have more certainty regarding economic conditions.
Given the continued weak commercial and residential real estate markets in our operating area, we expect our real estate construction loan originations and balances to remain at modest levels in 2012. We do, however, anticipate more opportunities for growth within the term commercial real estate and commercial loan categories. Our ability to achieve loan growth will be dependent on many factors, including the effects of competition, health of the real estate market, economic conditions in our markets, retention of key personnel and valued customers, and our ability to close loans in the pipeline.
Cash and Cash Equivalents
Total cash and cash equivalents balances of $92.2 million at December 31, 2011, decreased $85.8 million from $178.0 million at December 31, 2010. This decrease was primarily due to the investment of cash into our investment securities portfolio in 2011.
| (Dollars in thousands) | Dec.31, | | % of | | Dec. 31, | | % of | | Change | | Dec. 31, | | % of |
| 2011 | | total | | 2010 | | total | | Amount | | % | | 2009 | | total |
| Cash and Cash equivalents: | | | | | | | | | | | | | | | | | | | | | | | | |
| Cash and due from banks | $ | 59,955 | | 65 | % | | $ | 42,672 | | 24 | % | | $ | 17,283 | | | 41 | % | | $ | 47,708 | | 16 | % |
| Federal funds sold | | 4,758 | | 5 | % | | | 3,367 | | 2 | % | | | 1,391 | | | 41 | % | | | 20,559 | | 7 | % |
| Interest-bearing deposits in other banks | | 27,514 | | 30 | % | | | 131,952 | | 74 | % | | | (104,438 | ) | | -79 | % | | | 234,830 | | 77 | % |
| Total cash and cash equivalents | $ | 92,227 | | 100 | % | | $ | 177,991 | | 100 | % | | $ | (85,764 | ) | | -48 | % | | | 303,097 | | 100 | % |
29
Investment Portfolio
The following table shows the amortized cost and fair value of Bancorp’s investment portfolio. At December 31, 2011, Bancorp had no securities classified as held to maturity.
| December 31, 2011 | | December 31, 2010 |
| | | | | | Net | | | | | | | Net |
| (Dollars in thousands) | Amortized | | | | Unrealized | | Amortized | | | | Unrealized |
| | Cost | | Fair Value | | Gain/(Loss) | | Cost | | Fair Value | | Gain/(Loss) |
| U.S. Treasury securities | $ | 200 | | $ | 203 | | | 3 | | | $ | 14,347 | | $ | 14,392 | | | 45 | |
| U.S. Government agency securities | | 216,211 | | | 219,631 | | | 3,420 | | | | 193,901 | | | 194,230 | | | 329 | |
| Corporate securities | | 14,351 | | | 8,507 | | | (5,844 | ) | | | 14,499 | | | 9,392 | | | (5,107 | ) |
| Mortgage-backed securities | | 419,510 | | | 428,725 | | | 9,215 | | | | 359,965 | | | 363,618 | | | 3,653 | |
| Obligations of state and political subdivisions | | 56,003 | | | 60,732 | | | 4,729 | | | | 51,111 | | | 52,645 | | | 1,534 | |
| Equity investments and other securities | | 11,318 | | | 12,046 | | | 728 | | | | 11,423 | | | 11,835 | | | 412 | |
| Total Investment Portfolio | $ | 717,593 | | $ | 729,844 | | $ | 12,251 | | | $ | 645,246 | | $ | 646,112 | | $ | 866 | |
At December 31, 2011, the estimated fair value of the investment portfolio was $729.8 million, an increase of $83.7 million or 13% from $646.1 million at year end 2010. The estimated net unrealized gain on the investment portfolio at December 31, 2011, was $12.3 million, or 1.7% of the total portfolio, compared to $.9 million and ..1% respectively, at year end 2010. During 2011 the net unrealized gain on the mortgage-backed securities increased by $5.6 million from $9.2 million while the net unrealized gains in the U.S. Government agency and obligations of state and political subdivisions categories increased by $3.1 million and $3.2 million, respectively.
During 2011, in terms of amortized cost, we increased our investment securities balance by $72.4 million principally due to our efforts to reduce cash balances. The purchases over the past year were primarily of US Government agency securities with 3 to 5 year maturities and 10 to 15 year fully amortizing US Agency mortgage backed securities. Our U.S. Government agency securities balance increased by $25.4 million during 2011, as part of our efforts to maintain portfolio diversification, provide collateral for public funds and borrowings sources, and to reduce low yielding cash and cash equivalent balances.
For more information regarding the Company’s fair value calculations, see Note 18 “Fair Value Measurement and Fair Value of Financial Instruments” to the Company’s audited consolidated financial statements included under the section “Financial Statements and Supplementary Data” in Item 8 of this report.
At December 31, 2011, the corporate securities portfolio included four pooled trust preferred securities with amortized cost of $13.8 million and an estimated fair market value of $8.0 million resulting in an estimated $5.8 million unrealized loss. This unrealized loss was associated with the decline in market value since purchase of our investments in pooled trust preferred securities issued by banks and insurance companies. Continued wide credit and liquidity spreads contributed to the unrealized loss associated with these securities.
In the second quarter of 2011, the Company recorded a credit related OTTI charge of $.2 million pretax related to one of the pooled trust preferred securities which also was placed on nonaccrual status at the same time. We do not intend to sell this security, and it is not likely that we will be required to sell this security, but we do not expect to recover the entire amortized cost basis of the security. The amount of OTTI related to credit losses recognized in earnings represents the amortized cost of the security that we do not expect to recover and is based on the estimated cash flow expected from the security, discounted by the estimated future coupon rates of the security. We estimate cash flows based on the performance of the underlying collateral for the security and the overall structure of the security. Factors considered in the performance of underlying collateral include current default and deferral rates, estimated future default, deferral and recovery rates, and prepayment rates. Factors considered in the overall structure of the security include the impact of the underlying collateral cash flow on debt coverage tests and subordination levels. The remaining impairment on this security that is related to all other factors is recognized in other comprehensive income. Given regulatory guidelines on expectation of full payment of interest and principal as well as extended principal in kind payments, this pooled trust preferred security was placed on nonaccrual status. In addition, in October 2011 the Company placed a second pooled trust preferred security with principal in kind payments on nonaccrual status. While this security had an impairment loss of $1.6 million at December 31, 2011, based on our projections of future interest and principal payments, this security had no credit related OTTI as of December 31, 2011. At year end 2011, the pooled trust preferred securities were rated C or better by the rating agencies that cover these securities. They have several features that reduce credit risk, including seniority over certain tranches in the same pool and the benefit of certain collateral coverage tests.
30
At December 31, 2011, our mortgage-backed securities portfolio, which grew by $59.5 million in 2011, had an amortized cost base of $419.5 million and a fair market value of $428.7 million. This portfolio consisted of U.S. Agency backed mortgages with an amortized cost of $332.3 million and U.S. Government backed mortgage securities with an amortized cost of $87.3 million. Floating or adjustable rate securities represented $20.5 million of this portfolio while the remainder consisted of fixed rate securities. Ten and fifteen year pass-through mortgages, with a projected average life of 3.1 years represented the majority of fixed rate securities within this portfolio. Mortgage backed securities are subject to prepayment risk. Rising prepayments reduces the projected average life and accelerates the amortization of premium thus reducing the income from this portfolio. At December 31, 2011, the bank owned no privately issued mortgage backed securities.
Our portfolio of securities representing obligations of state and political subdivisions had a fair value of $60.7 million, with an amortized cost of $56.0 million, indicating an unrealized gain of $4.7 million. At December 31, 2011, the ratings associated with the securities in this segment were: 7% AAA, 74% AA, 10% A, 7% BBB, and 2% non-rated. At December 31, 2010, the ratings associated with the securities in this segment were: 9% AAA, 59% AA, 18% A, 9% BBB and 5% non-rated.
At December 31, 2011, our equity and other investment securities had a fair value of $12.0 million and consisted of three investments in mutual fund shares and three investments in government backed Housing and Urban Development (“HUD”) Bonds. In addition to interest income, these investments provide the Bank with a Community Reinvestment Act (“CRA”) benefits.
The following table summarizes the contractual maturities and weighted average yields on Bancorp’s investment securities:
| | | | | | | After | | | | | After | | | | | | | | | | | | | | | |
| (Dollars in thousands) | One year | | | | One through | | | | | Five through | | | | | Due after | | | | | | | | | |
| or less | | Yield | | five years | | Yield | | ten years | | Yield | | ten years | | Yield | | Total | | Yield |
| U.S. Treasury securities | $ | 203 | | 4.50 | % | | $ | - | | - | | | $ | - | | - | | | $ | - | | - | | | $ | 203 | | 4.50 | % |
| U.S. Government agency securities | | 502 | | 0.63 | % | | | 189,062 | | 2.25 | % | | | 30,067 | | 2.21 | % | | | - | | - | | | | 219,631 | | 2.24 | % |
| Obligations of state and | | | | | | | | | | | | | | | | | | | | | | | | | | | | | |
| political subdivisions1 | | 1,107 | | 6.40 | % | | | 17,391 | | 5.44 | % | | | 31,584 | | 6.33 | % | | | 10,650 | | 5.22 | % | | | 60,732 | | 5.88 | % |
| Other securities2 | | 4 | | 6.00 | % | | | 2,535 | | 4.24 | % | | | 160,371 | | 2.93 | % | | | 286,368 | | 3.58 | % | | | 449,278 | | 3.35 | % |
| Total1 | $ | 1,816 | | 4.59 | % | | $ | 208,988 | | 2.54 | % | | $ | 222,022 | | 3.32 | % | | $ | 297,018 | | 3.64 | % | | $ | 729,844 | | 2.64 | % |
| 1 | | Yields are stated on a federal tax equivalent basis at 35%. |
| 2 | | Contractual maturities do not reflect prepayments on mortgage-backed and asset-backed securities.
Actual durations are anticipated to be significantly shorter than contractual maturities. |
The projected average life, or expected duration, based upon maturity date and estimated prepayment speeds, of Bancorp’s investment portfolio decreased from 3.3 years at December 31, 2010 to 2.5 years at December 31, 2011. While the investment portfolio grew during 2011, the Company elected to maintain a relatively short expected duration in light of the historically low market interest rate environment. Management may consider selling certain securities and realizing gains and/or losses in the Company’s investment portfolio on an on-going basis as part of Bancorp’s overall business strategy. For more information regarding Bancorp’s investment securities, see Note 2 “Investment Securities” to the Company’s audited consolidated financial statements included under the section “Financial Statements and Supplementary Data” in Item 8 of this report.
31
FHLB Securities
At December 31, 2011, Bancorp owned FHLB stock of $12.1 million, unchanged from year end 2010. The FHLB stock is carried at amortized cost which equals its par value because the shares can only be redeemed with the FHLB at par. The Bank is required to maintain a minimum level of investment in FHLB stock based on specific percentages of its outstanding mortgages and FHLB advances. Stock redemptions are at the discretion of the FHLB or of the Company upon prior notice to the FHLB of five years for FHLB Class B stock or six months for FHLB Class A stock. The Company analyzes FHLB stock for OTTI. The evaluation of OTTI on FHLB stock is based on an assessment of the ultimate recoverability of cost rather than recognizing temporary declines in value. The Company analyzed FHLB stock for OTTI and concluded that no impairment existed at December 31, 2011.
Loan Portfolio
The following table provides the composition of the loan portfolio and the balance of our allowance for loan losses as of the dates shown:
| December 31, |
| (Dollars in thousands) | 2011 | | 2010 | | 2009 | | 2008 | | 2007 |
| Amount | | Percent | | Amount | | Percent | | Amount | | Percent | | Amount | | Percent | | Amount | | Percent |
| Commercial | $ | 299,766 | | | 20 | % | | $ | 309,327 | | | 20 | % | | $ | 370,077 | | | 21 | % | | $ | 482,405 | | | 23 | % | | $ | 504,101 | | | 23 | % |
| Real estate construction | | 30,162 | | | 2 | % | | | 44,085 | | | 3 | % | | | 99,310 | | | 6 | % | | | 285,149 | | | 14 | % | | | 517,988 | | | 24 | % |
| Real estate mortgage | | 324,994 | | | 22 | % | | | 349,016 | | | 23 | % | | | 374,668 | | | 22 | % | | | 393,208 | | | 19 | % | | | 330,803 | | | 15 | % |
| Commercial real estate | | 832,767 | | | 55 | % | | | 818,577 | | | 53 | % | | | 862,193 | | | 50 | % | | | 882,092 | | | 43 | % | | | 796,622 | | | 37 | % |
| Installment and other | | | | | | | | | | | | | | | | | | | | | | | | | | | | | | | | | | |
| consumer | | 13,612 | | | 1 | % | | | 15,265 | | | 1 | % | | | 18,594 | | | 1 | % | | | 21,942 | | | 1 | % | | | 23,155 | | | 1 | % |
| Total loans | | 1,501,301 | | | 100 | % | | | 1,536,270 | | | 100 | % | | | 1,724,842 | | | 100 | % | | | 2,064,796 | | | 100 | % | | | 2,172,669 | | | 100 | % |
| |
| Allowance for loan losses | | (35,212 | ) | | 2.35 | % | | | (40,217 | ) | | 2.62 | % | | | (38,490 | ) | | 2.23 | % | | | (28,920 | ) | | 1.40 | % | | | (46,917 | ) | | 2.16 | % |
| |
| Total loans, net | $ | 1,466,089 | | | | | | $ | 1,496,053 | | | | | | $ | 1,686,352 | | | | | | $ | 2,035,876 | | | | | | $ | 2,125,752 | | | | |
The Company’s loan portfolio of $1.5 billion at December 31, 2011, decreased $35.0 million or 2% from December 31, 2010. The most significant decline within the loan portfolio occurred in the real estate mortgage and real estate construction loan categories. Total real estate construction loans represented 2% of the loan portfolio at the end of 2011, a reduction from 3% at December 31, 2010, and down from 24% at its peak at year end 2007. At 55% of the loan portfolio, commercial real estate represented the largest component of the loan portfolio at year end 2011, as has been the case historically. Interest and fees earned on our loan portfolio is our primary source of revenue, and the decline in loan balances has had a significant negative impact on interest income and loan fees earned. A decline in loan balances may have a material adverse impact on the Company’s revenues and results of operations.
32
Loans held for sale at December 31, 2011 were $3.3 million compared to $3.1 million at December 31, 2010. The majority of our loan sales involve residential real estate mortgage loans. These loan sales have no recourse, however sales are subject to proper compliance with standard underwriting rules that if not met, may allow the secondary market buyer to require the Company to repurchase the note. To date, the Company has received few requests to repurchase notes from secondary market purchasers and related expenses have not been material. However, there can be no assurance that we will not receive additional and increased requests to repurchase loans, in which case possible losses to the Bank could be material to results of operations. Also, from time to time, the Company sells the guaranteed portions of SBA loans with servicing rights and obligations usually retained.
At December 31, 2011, and 2010, we had $5.6 million and $5.0 million, respectively, in outstanding loans to persons serving as directors, senior officers, principal stockholders and their related interests. These loans were made substantially on the same terms, including interest rates, maturities and collateral, as those made to other customers of the Bank. At December 31, 2011, and 2010, the Bank had no banker’s acceptances.
The following table presents the maturity distribution and interest rate sensitivity of the Company’s loan portfolio by category at December 31, 2011:
| (Dollars in thousands) | Commercial | | Real estate | | Real estate | | Commercial | | Installment | | | |
| loans | | construction | | mortgage | | real estate | | and other | | Total |
| Maturity distribution: 1 | | | | | | | | | | | | | | | | | |
| Due within one year | $ | 159,576 | | $ | 27,756 | | $ | 12,431 | | $ | 54,006 | | $ | 4,121 | | $ | 257,890 |
| Due after one through five years | | 100,356 | | | 2,406 | | | 104,712 | | | 235,550 | | | 3,791 | | | 446,815 |
| Due after five years | | 39,834 | | | - | | | 207,851 | | | 543,211 | | | 5,700 | | | 796,596 |
| Total | $ | 299,766 | | $ | 30,162 | | $ | 324,994 | | $ | 832,767 | | $ | 13,612 | | $ | 1,501,301 |
| Interest rate sensitivity: | | | | | | | | | | | | | | | | | |
| Fixed-interest rate loans | $ | 82,841 | | $ | 7,517 | | $ | 78,050 | | $ | 221,468 | | $ | 6,382 | | $ | 396,258 |
| Floating or adjustable interest rate loans 2 | | 216,925 | | | 22,645 | | | 246,944 | | | 611,299 | | | 7,230 | | | 1,105,043 |
| Total | $ | 299,766 | | $ | 30,162 | | $ | 324,994 | | $ | 832,767 | | $ | 13,612 | | $ | 1,501,301 |
1 | | The table is based on stated maturities, not expected maturities or durations. |
2 | | Certain loans contain provisions which place maximum or minimum limits on interest rates or interest rate changes. Adjustable rate loans include all loans whose rates could change prior to maturity. |
The table above breaks down our loan portfolio by stated maturity and interest rate type. Most of our loans have maturity dates beyond five years. However, only 26% of our loans are at a fixed rate until their maturity date. The remaining 74% of our loans have interest rates which adjust prior to the stated maturity. The above table does not take into account unscheduled payment of principal which could occur prior to the stated maturity or scheduled interest rate adjustments.
Below is a discussion of our loan portfolio by category.
Commercial.The composition of commercial loans as of December 31, 2011, and December 31, 2010 was as follows:
| (Dollars in thousands) | | | Percent | | | | Percent | | | | | Percent |
| December 31, 2011 | | of total | | December 31, 2010 | | of total | | Change | | change |
| Commercial lines of credit: | | | | | | | | | | | | | | | | | | | | |
| Total commitment | $ | 450,414 | | | | | | $ | 448,042 | | | | | | $ | 2,372 | | | 1 | % |
| Outstanding balance | | 187,899 | | | 63 | % | | | 187,983 | | | 61 | % | | | (84 | ) | | 0 | % |
| Utilization % | | 41.7 | % | | | | | | 42.0 | % | | | | | | | | | | |
| |
| Commercial term loans: | | | | | | | | | | | | | | | | | | | | |
| Total commitment | $ | 111,867 | | | | | | $ | 121,344 | | | | | | $ | (9,477 | ) | | -8 | % |
| Outstanding balance | | 111,867 | | | 37 | % | | | 121,344 | | | 39 | % | | | (9,477 | ) | | -8 | % |
| |
| Total commercial lines and loans: | | | | | | | | | | | | | | | | | | | | |
| Total commitment | $ | 562,281 | | | | | | $ | 569,386 | | | | | | $ | (7,105 | ) | | -1 | % |
| Outstanding balance | | 299,766 | | | 100 | % | | | 309,327 | | | 100 | % | | | (9,561 | ) | | -3 | % |
33
At December 31, 2011, total commercial loans and lines of credit at $299.8 million represented approximately 20% of the Company’s total loan portfolio. The total commercial loan and line balance declined $9.6 million or 3% from $309.3 million at year end 2010. This decline was due to a reduction in commercial term loan balances during 2011. At year end 2011, commercial term loans accounted for $111.9 million or 37% of the total commercial outstanding balance as compared to $121.3 million a year ago. Commercial lines of credit accounted for $187.9 million or 63% of this portfolio. While origination of commercial term loan and line originations increased in 2011 compared to 2010, the weak economic environment has caused loan origination volumes to lag pre-recession levels. Commercial line utilization also remained relatively unchanged from year end 2010 to year end 2011, towards the low end of our customers’ historical utilization range. Commercial term loans are typically intermediate to long-term (two to ten years) secured credit used to finance capital equipment while commercial lines of credit are generally revolving loans typically used to finance short-term or seasonal working capital needs.
Since the onset of the recessionary environment the Company elected to limit new loan originations to customers in certain sectors, including businesses related to the housing industry, and to exit certain high risk client relationships. However, in terms of our long term strategy, we continue to expect commercial businesses to be an important contributor to growth in loan balances and future revenues.
In originating commercial loans and lines, our underwriting standards may include maximum loan to value ratios, minimum target levels for debt service coverage and other financial covenants specific to the loan and the borrower. Common forms of collateral pledged to secure our commercial loans are real estate, accounts receivable, inventory, equipment, agricultural crops and/or livestock and marketable securities. Commercial loans and lines of credit typically have maximum terms of one to ten years and loan to value ratios in the range of 50% to 80% at origination.
Real Estate Construction.The composition of our real estate construction portfolio as of December 31, 2011, 2010, and 2009, is presented in the following table:
| (Dollars in thousands) | December 31, 2011 | | December 31, 2010 | | Change | | December 31, 2009 |
| Amount | | Percent | | Amount | | Percent | | Amount | | Percent | | Amount | | Percent |
| Commercial construction | $ | 17,538 | | | 58 | % | | $ | 19,781 | | | 45 | % | | $ | (2,243 | ) | | -11 | % | | $ | 29,615 | | | 30 | % |
| Two-step residential construction loans | | 628 | | | 2 | % | | | 1,132 | | | 3 | % | | | (504 | ) | | -45 | % | | | 2,407 | | | 2 | % |
| Residential construction to builders | | 6,162 | | | 20 | % | | | 12,301 | | | 28 | % | | | (6,139 | ) | | -50 | % | | | 44,786 | | | 45 | % |
| Residential subdivision or site development | | 5,935 | | | 20 | % | | | 10,903 | | | 24 | % | | | (4,968 | ) | | -46 | % | | | 22,590 | | | 23 | % |
| Net deferred fees | | (101 | ) | | 0 | % | | | (32 | ) | | 0 | % | | | (69 | ) | | -216 | % | | | (88 | ) | | 0 | % |
| Total real estate construction loans | $ | 30,162 | | | 100 | % | | $ | 44,085 | | | 100 | % | | $ | (13,923 | ) | | -32 | % | | $ | 99,310 | | | 100 | % |
At December 31, 2011, the balance of real estate construction loans was $30.2 million, down $13.9 million or 32% from $44.1 million at December 31, 2010, which in turn was down from $99.3 million at December 31, 2009. Our construction loan portfolio has contracted dramatically as a result of weak real estate market conditions and our efforts to work through problem credits within this portfolio.
34
Real estate construction loans to builders are generally secured by the property underlying the project that is being financed. Construction loans to builders and developers typically have terms from 12 to 24 months and initial loan to value ratios in the range of 60% to 80% based on the estimated “as-is” and “as-proposed” values of the project at the time of loan origination.
At December 31, 2011, the Bank’s real estate construction concentration was 14% relative to Tier 1 capital and allowance for credit losses and was well within the Interagency Guidelines for Real Estate Lending and the Commercial Real Estate Lending Joint Guidance policy guidelines which set forth a 100% limit for such ratio. New loan origination activity in this loan category has been and continues to be limited due to the prolonged weakness in real estate market conditions.
Real Estate Mortgage.The following table presents the components of our real estate mortgage loan portfolio:
| (Dollars in thousands) | December 31, 2011 | | December 31, 2010 | | Change | | December 31, 2009 |
| Amount | | Percent | | Amount | | Percent | | Amount | | Percent | | Amount | | Percent |
| Mortgage | $ | 58,099 | | 18 | % | | $ | 67,525 | | 19 | % | | $ | (9,426 | ) | | -14 | % | | $ | 74,977 | | 20 | % |
| Nonstandard mortgage product | | 8,511 | | 3 | % | | | 12,523 | | 4 | % | | | (4,012 | ) | | -32 | % | | | 20,108 | | 5 | % |
| Home equity loans and lines of credit | | 258,384 | | 79 | % | | | 268,968 | | 77 | % | | | (10,584 | ) | | -4 | % | | | 279,583 | | 75 | % |
| Total real estate mortgage | $ | 324,994 | | 100 | % | | $ | 349,016 | | 100 | % | | $ | (24,022 | ) | | -7 | % | | $ | 374,668 | | 100 | % |
The total real estate mortgage loan portfolio was $325.0 million or approximately 22% of the Company’s total loan portfolio at December 31, 2011, a reduction of $24.0 million from $349.0 million twelve months earlier. This included a $4.0 million or 32% decline in our nonstandard mortgage product to $8.5 million, primarily due to transfers to OREO. At December 31, 2011, mortgage loans measured $58.1 million, of which $29.4 million consisted of standard residential mortgage loans to homeowners. The remaining $28.7 million was associated with commercial interests utilizing residences as collateral. Such commercial interests included $18.6 million related to businesses, $1.6 million related to condominiums, and $4.3 million related to residential land.
At year end 2011, home equity lines and loans of $258.4 million, which declined $10.6 million from $269.0 million a year earlier, represented 79% of the real estate mortgage portfolio. The Bank’s home equity portfolio was almost entirely generated within our market area and through our branch network. The home equity portfolio peaked at year end 2009 but the balances have trended lower as new loan and line originations within this portfolio slowed significantly over the past few years. This was a result of the Bank’s ongoing analysis of market conditions and corresponding adjustments made to our pricing and underwriting standards as well as reduced customer demand. As shown below, the year end 2011 home equity line utilization percentage for loans originated in 2011 averaged approximately 50%, which was below that of loans originated in prior years.
| (Dollars in thousands) | Year of Origination |
| | | | | | | | | | | | | | | | | | | | | | | | | 2005& | | | | |
| 2011 | | 2010 | | 2009 | | 2008 | | 2007 | | 2006 | | Earlier | | Total |
| Home equity lines | | | | | | | | | | | | | | | | | | | | | | | | | | | | | | | |
| Commitments | $ | 21,721 | | | $ | 22,320 | | | $ | 27,278 | | | $ | 52,963 | | | $ | 66,152 | | | $ | 69,236 | | | $ | 126,317 | | | $ | 385,987 | |
| Outstanding balance | | 10,901 | | | | 11,685 | | | | 15,076 | | | | 33,705 | | | | 44,570 | | | | 46,458 | | | | 73,589 | | | | 235,984 | |
| |
| Utilization at year end(1) | | 50.2 | % | | | 52.4 | % | | | 55.3 | % | | | 63.6 | % | | | 67.4 | % | | | 67.1 | % | | | 58.3 | % | | | 61.1 | % |
| |
| Home equity loans | | | | | | | | | | | | | | | | | | | | | | | | | | | | | | | |
| Outstanding balance | | 827 | | | | 1,153 | | | | 2,737 | | | | 6,521 | | | | 4,566 | | | | 2,683 | | | | 2,760 | | | | 21,247 | |
| | | | | | | | | | | | | | | | | | | | | | | | | | | | | | | | |
| Total home equity outstanding | $ | 11,728 | | | $ | 12,838 | | | $ | 17,813 | | | $ | 40,226 | | | $ | 49,136 | | | $ | 49,141 | | | $ | 76,349 | | | $ | 257,231 | |
| (1) | | For the purposes of utilization percentages, the outstanding balance does not include deferred costs and fees of $1.3 million |
Approximately 40% of the Bank’s home equity portfolio is in first lien position at year end 2011, and this collateral position helps mitigate overall portfolio risk. There were other types of loans as well as deposits derived from our home equity borrowers at year end 2011, which we believe were a result of our home equity line and loan portfolios being sourced to relationship customers through the Company’s branch network.
35
The following table shows home equity lines of credit and loans by metropolitan service. The majority of our home equity lines and loans are secured by homes in the Portland-Beaverton, Oregon, Vancouver, Washington and Salem, Oregon markets, where the majority of our branches are also located.
| (Dollars in thousands) | | December 31, 2011 | | December 31, 2010 |
| | | | | Percent of | | | | | Percent of |
| Region | | Amount | | total | | Amount | | total |
| Portland-Beaverton, Oregon / Vancouver, Washington | | | 122,543 | | 47.4 | % | | | 127,479 | | 47.4 | % |
| Salem, Oregon | | | 61,019 | | 23.6 | % | | | 62,533 | | 23.2 | % |
| Oregon non-metropolitan area | | | 27,419 | | 10.6 | % | | | 27,615 | | 10.3 | % |
| Olympia, Washington | | | 17,268 | | 6.7 | % | | | 17,236 | | 6.4 | % |
| Washington non-metropolitan area | | | 12,859 | | 5.0 | % | | | 14,489 | | 5.4 | % |
| Bend, Oregon | | | 4,377 | | 1.7 | % | | | 5,692 | | 2.1 | % |
| Other | | | 12,899 | | 5.0 | % | | | 13,924 | | 5.2 | % |
| Total home equity loan and line portfolio | | $ | 258,384 | | 100.0 | % | | $ | 268,968 | | 100.0 | % |
Commercial Real Estate.The composition of commercial real estate loan types based on collateral is as follows:
| (Dollars in thousands) | | December 31, 2011 | | December 31, 2010 |
| | Amount | | Percent | | Amount | | Percent |
| Office Buildings | | $ | 173,295 | | 20.8 | % | | $ | 182,376 | | 22.3 | % |
| Retail Facilities | | | 118,678 | | 14.3 | % | | | 108,874 | | 13.3 | % |
| Industrial parks and related | | | 55,392 | | 6.7 | % | | | 59,493 | | 7.3 | % |
| Multi-Family - 5+ Residential | | | 63,027 | | 7.6 | % | | | 58,606 | | 7.2 | % |
| Medical Offices | | | 60,993 | | 7.3 | % | | | 55,294 | | 6.8 | % |
| Commercial/Agricultural | | | 60,094 | | 7.2 | % | | | 54,361 | | 6.6 | % |
| Manufacturing Plants | | | 51,852 | | 6.2 | % | | | 47,341 | | 5.8 | % |
| Hotels/Motels | | | 35,893 | | 4.3 | % | | | 35,724 | | 4.4 | % |
| Assisted Living | | | 22,040 | | 2.6 | % | | | 25,669 | | 3.1 | % |
| Mini Storage | | | 19,037 | | 2.3 | % | | | 24,678 | | 3.0 | % |
| Land Development and Raw Land | | | 17,278 | | 2.1 | % | | | 19,534 | | 2.4 | % |
| Food Establishments | | | 19,054 | | 2.3 | % | | | 16,370 | | 2.0 | % |
| Other | | | 136,134 | | 16.3 | % | | | 130,257 | | 15.8 | % |
| Total commercial real estate loans | | $ | 832,767 | | 100.0 | % | | $ | 818,577 | | 100.0 | % |
The commercial real estate portfolio increased $14.2 million or 2% during 2011. At year end 2011, office buildings represented the largest collateral segment, and accounted for 21% of the collateral securing the commercial real estate portfolio, a slight decline from year end 2010. Retail facilities, which accounted for the second largest collateral segment, increased slightly to 14% during 2011. Commercial real estate markets continue to be vulnerable to financial and valuation pressures that may limit refinance options and negatively impact borrowers’ ability to perform under existing loan agreements. Declining values of commercial real estate or higher market interest rates may have a further adverse effect on the ability of borrowers with maturing loans to satisfy loan to value ratios required to renew such loans. The Company’s underwriting of commercial real estate loans generally includes loan to value ratios at origination not exceeding 75% and debt service coverage ratios at 120% or better.
The composition of the commercial real estate loan portfolio by occupancy type is as follows:
| December 31, | | December 31, | | Change |
| (Dollars in thousands) | 2011 | | 2010 | | | | | Mix |
| Amount | | Percent | | Amount | | Percent | | Amount | | Percent |
| Owner occupied | $ | 390,589 | | 47 | % | | $ | 383,047 | | 47 | % | | $ | 7,542 | | 2 | % |
| Non-owner occupied | | 442,178 | | 53 | % | | | 435,530 | | 53 | % | | | 6,648 | | 2 | % |
| Total commercial real estate loans | $ | 832,767 | | 100 | % | | $ | 818,577 | | 100 | % | | $ | 14,190 | | | |
36
The owner occupied and non-owner occupied categories of the Company’s commercial real estate portfolio increased by 2% in 2011 and the mix between owner occupied and non-owner occupied collateral types within the total commercial real estate portfolio remained unchanged from year end 2010 at 47% and 53%, respectively. Given the relative modest new originations over the past few years, we believe our commercial real estate portfolio to be a relatively mature portfolio. At December 31, 2011, the Bank’s commercial real estate concentration, at 123% relative to Tier 1 capital and allowance for credit losses, was well within the Interagency Guidelines for Real Estate Lending and the Commercial Real Estate Lending Joint Guidance policy guidelines which set forth a 300% limit for such ratio.
The following table shows the commercial real estate portfolio by current property location:
| (Dollars in thousands) | | December 31, 2011 |
| | | | | | | | | | Percent of |
| | | | | Number of | | Percent of total | | branches by |
| Region | | Amount | | loans | | loans by market | | market |
| Portland-Beaverton, Oregon / Vancouver, Washington | | $ | 429,806 | | 721 | | 51.6 | % | | 41.7 | % |
| Salem, Oregon | | | 156,033 | | 386 | | 18.8 | % | | 35.0 | % |
| Oregon non-metropoliton area | | | 53,548 | | 157 | | 6.4 | % | | 8.3 | % |
| Seattle-Tacoma-Bellevue, Washington | | | 38,363 | | 48 | | 4.6 | % | | 0.0 | % |
| Washington non-metropoliton area | | | 30,116 | | 103 | | 3.6 | % | | 0.0 | % |
| Olympia, Washington | | | 31,116 | | 77 | | 3.7 | % | | 15.0 | % |
| Bend, Oregon | | | 24,316 | | 24 | | 2.9 | % | | 0.0 | % |
| Other | | | 69,469 | | 105 | | 8.4 | % | | 0.0 | % |
| Total commercial real estate loans | | $ | 832,767 | | 1,621 | | 100.0 | % | | 100.0 | % |
As shown in the table above, the properties within our commercial real estate portfolio at year end 2011 are predominantly located in geographic areas where we have branch presence. At year end 2011 the average loan balance in our commercial real estate portfolio was approximately $.5 million.
The following table shows the commercial real estate portfolio by year of stated maturity:
| | December 31, 2011 |
| | | | | Number of | | Percent of |
| (Dollars in thousands) | | Amount | | loans | | total |
| 2012 | | $ | 54,006 | | 92 | | 6.5 | % |
| 2013 | | | 56,025 | | 113 | | 6.7 | % |
| 2014 and after | | | 722,736 | | 1,416 | | 86.8 | % |
| Total commercial real estate loans | | $ | 832,767 | | 1,621 | | 100.0 | % |
At year end 2011, the stated loan maturities in 2012 and 2013 totaled $110.0 million or 13.2% of the $832.8 million total commercial real estate portfolio.
37
Credit Management.
Credit risk is inherent in our lending activities. We manage the general risks in the loan portfolio by following loan policies and underwriting practices designed to result in prudent lending activities. In addition, we attempt to manage our risk through our credit administration and credit review functions that are designed to help confirm our credit standards are being followed. Through the credit review function we monitor credit related policies and practices on a post approval basis. Significant findings and periodic reports are communicated to the chief credit officer and chief executive officer and, in certain cases, to the Loan, Investment, & Asset/Liability Committee, which is comprised of certain directors. Credit risk in the loan portfolio can be amplified by loan concentrations. We manage our concentration risk on an ongoing basis by establishing a maximum amount of credit that may be extended to any one borrower and by employing concentration limits that regulate exposure levels by product type and portfolio category. We also employ concentration limits by geography for certain commercial and residential real estate loans.
Our residential construction portfolio, consisting of developers and builders, is a portfolio we consider to have higher risk. The prolonged downturn in residential real estate has slowed land, lot and home sales within our markets and has resulted in lengthening the absorption period for completed homes and has negatively affected borrower liquidity and collateral values. We have continued to reduce our exposure to residential construction by controlling origination activity and managing down loans to existing borrowers. Until our regional economy generates and sustains higher levels of overall business activity and employment levels, financial pressures will continue to challenge borrowers in many industry segments. We are closely monitoring our credit exposure in both owner occupied and non-owner occupied term real estate. An important component of managing risk in the commercial real estate portfolio involves stress testing, at both a portfolio and individual borrower level. Our stress test for individual commercial real estate borrowers focuses on examining project performance relative to cash flow and collateral value under a range of assumptions that include interest rates, absorption, unit sales prices, and capitalization rates. This level of risk monitoring assists the Bank to identify potential problem loans early and develop action plans on a timely basis, which may include requiring borrowers to provide curtailments, pledge additional collateral, or transfer the borrowing relationship to our special asset team for closer monitoring.
The prolonged duration of the economic downturn coupled with elevated unemployment levels has also impacted our portfolio of home equity loans and lines. We analyze our home equity portfolio on an ongoing basis. Our process typically involves updating credit scores, tracking past dues, line utilization rates, and assessing collateral exposure. Based on our analysis we may request certain borrowers to consider restructuring their credit facility with the Bank.
Current economic conditions continue to challenge the banking industry. Consequently, we are tightly focused on monitoring and managing credit risk across all of our loan portfolios. As part of our ongoing lending process, a risk analysis is prepared for each primary credit action with the borrower before the funds are advanced. Most borrowers are assigned individual risk ratings which are based on our assessment of the borrower’s credit worthiness and the quality of our collateral position at the time a particular loan is made. Thereafter, credit risk ratings are evaluated on an ongoing basis focusing on our interpretation of relevant risk factors known to us at the time of each evaluation. Large credit relationships have their credit risk rating reviewed at least annually, and given current economic conditions, risk rating evaluations may occur more frequently. Our relationship managers play a critical role in this process by evaluating the ongoing financial condition of each borrower in their respective portfolio of loans. These activities include, but are not limited to, maintaining open communication channels with borrowers, analyzing periodic financial statements and cash flow projections, tracking financial trends, evaluating collateral, monitoring covenant compliance, and evaluating the financial capacity of guarantors. Collectively, these activities represent an ongoing process that results in an assessment of credit risk associated with each commercial, real estate construction and commercial real estate loan consistent with our internal risk rating guidelines. Our risk rating process is a central component in estimating the required allowance for credit losses, as discussed in the Allowance for Credit Losses section which follows. Credit files are also examined periodically on a sample test basis by our credit review department and internal auditors, as well as by regulatory examiners.
Although a risk of nonpayment exists with respect to all loans, certain specific types of risks are associated with different types of loans. The expected source of repayment of loans is generally the cash flow of a particular project, income from the borrower's business, conversion of trading assets to cash, proceeds from the sale of real property, proceeds of refinancing, or personal income. Real estate is frequently a material component of collateral for our loans. Risks associated with loans secured by real estate include the risks of decreasing land and property values, material increases in interest rates, deterioration in local economic conditions, changes in tax policies, and tightening credit or refinancing markets. A concentration of loans within any one market area may increase these risks.
38
Nonperforming Assets, Troubled Debt Restructurings, OREO and Delinquencies
Nonperforming assets.The following table presents information with respect to nonperforming assets as of the dates shown:
| | December 31, |
| (Dollars in thousands) | | 2011 | | 2010 | | 2009 | | 2008 | | 2007 |
| Nonperforming loans: | | | | | | | | | | | | | | | | | | |
| Commercial | | $ | 7,750 | | | $ | 13,377 | | | $ | 36,211 | | | $ | 6,250 | | | $ | 2,401 | |
| Real estate construction: | | | | | | | | | | | | | | | | | | | | |
| Commercial real estate construction | | | 3,750 | | | | 4,077 | | | | 1,488 | | | | 2,922 | | | | - | |
| Residential real estate construction | | | 2,073 | | | | 6,615 | | | | 22,373 | | | | 90,712 | | | | 22,121 | |
| Total real estate construction | | | 5,823 | | | | 10,692 | | | | 23,861 | | | | 93,634 | | | | 22,121 | |
| Real estate mortgage: | | | | | | | | | | | | | | | | | | | | |
| Mortgage | | | 6,161 | | | | 9,318 | | | | 11,563 | | | | 8,283 | | | | 552 | |
| Nonstandard mortgage | | | 3,463 | | | | 5,223 | | | | 8,752 | | | | 15,229 | | | | - | |
| Home equity loans and lines of credit | | | 2,325 | | | | 950 | | | | 2,036 | | | | 1,043 | | | | - | |
| Real estate mortgage | | | 11,949 | | | | 15,491 | | | | 22,351 | | | | 24,555 | | | | 552 | |
| Commercial real estate | | | 15,070 | | | | 21,671 | | | | 16,778 | | | | 3,145 | | | | 1,353 | |
| Installment and other consumer | | | 5 | | | | - | | | | 144 | | | | 6 | | | | - | |
| Total loans on nonaccrual status | | | 40,597 | | | | 61,231 | | | | 99,345 | | | | 127,590 | | | | 26,427 | |
| Loans past due 90 days or more but not on | | | | | | | | | | | | | | | | | | | | |
| nonaccrual status | | | - | | | | - | | | | - | | | | - | | | | - | |
| Other real estate owned | | | 30,823 | | | | 39,459 | | | | 53,594 | | | | 70,110 | | | | 3,255 | |
| Total nonperforming assets | | $ | 71,420 | | | $ | 100,690 | | | $ | 152,939 | | | $ | 197,700 | | | $ | 29,682 | |
| Percentage of nonperforming assets to | | | | | | | | | | | | | | | | | | | | |
| total assets | | | 2.94 | % | | | 4.09 | % | | | 5.60 | % | | | 7.86 | % | | | 1.12 | % |
| |
| Total assets | | $ | 2,429,887 | | | $ | 2,461,059 | | | $ | 2,733,547 | | | $ | 2,516,140 | | | $ | 2,646,614 | |
Nonperforming assets consist of nonaccrual loans, loans past due more than 90 days and still accruing interest, and OREO. At December 31, 2011, total nonperforming assets were $71.4 million, or 2.9% of total assets, which was down from $100.7 million, or 4.1% of total assets, at December 31, 2010. The balance of total nonperforming assets reflected write downs totaling $47.0 million or 40% from the original loan principal balance compared to write downs of 35% twelve months ago. The decline in total nonperforming assets in 2011 was primarily caused by the combination of OREO sales, nonaccrual loan pay-downs and payoffs, and net charge-offs exceeding the inflow of additional nonaccrual loans. Total nonaccrual loans declined by $20.6 million or 34%, to $40.6 million at December 31, 2011, from $61.2 million at year end 2010. During 2011, nonaccrual loan balances declined across all major loan categories.
Generally, loans are placed on nonaccrual status and no interest is accrued when factors indicate collection of interest or principal in accordance with the contractual terms is doubtful or when the principal or interest payment becomes 90 days past due. For such loans, previously accrued but uncollected interest is reversed and charged against current earnings and additional income is only recognized to the extent payments are subsequently received and the loan is placed back on an interest accruing status. Interest income foregone on nonaccrual loans was approximately $4.1 million, $6.5 million, and $10.7 million in 2011, 2010, and 2009, respectively.
A loan is considered to be impaired when it is probable that we will be unable to collect all amounts due according to the contractual terms of the loan agreement or when it has been restructured in a troubled debt restructuring. At December 31, 2011, 2010, and 2009, Bancorp had loans that were considered to be impaired, which include troubled debt restructurings, of $56.4 million, $76.7 million, and $98.8 million, respectively. Impaired loans are measured based on the present value of expected future cash flows, discounted at the loan’s effective interest rate or, as a practical expedient, at the loan’s observable market price or the fair market value of the collateral less selling costs if the loan is collateral dependent. Loans that are measured at lower of cost or fair value and certain large groups of smaller balance homogeneous loans collectively measured for impairment are excluded from impairment measurement. Impaired loans are charged off promptly to the allowance for loan losses when management believes, after considering economic, market, and business conditions, collection efforts, collateral position, and other factors deemed relevant, that the borrower’s financial condition is such that collection of principal and interest is not probable.
For the years ended December 31, 2011, 2010, and 2009, interest income recognized on impaired loans totaled $1,035,000, $568,000, and $526,000, respectively. Interest income on loans is accrued daily on the principal balance outstanding.
Troubled Debt Restructurings.At December 31, 2011, Bancorp had $37.6 million in loans classified as troubled debt restructurings of which $15.8 million was on an interest accruing status, with the remaining $21.8 million on nonaccrual status. Troubled debt restructurings were $57.8 million at December 31, 2010, of which $15.5 million was on an interest accruing status, with the remaining $42.3 million on nonaccrual status. All troubled debt restructurings were considered impaired at year end 2011 and 2010. The modifications granted on troubled debt restructurings were due to borrower financial difficulty, and generally provide for a modification of loan terms. The decrease in troubled debt restructurings reflects a decrease in the number of loan modifications in 2011. For more information regarding Bancorp’s troubled debt restructurings and loans, see Note 3 “Loans and Allowance for Credit Losses” to the Company’s audited consolidated financial statements included under the section “Financial Statements and Supplementary Data” in Item 8 of this report.
39
Other Real Estate Owned.The following table presents activity in the total OREO portfolio for the periods shown:
| (Dollars in thousands) | | December 31, 2011 | | December 31, 2010 |
| | Amount | | # of properties | | Amount | | # of properties |
| Beginning balance | | $ | 39,459 | | | 402 | | | $ | 53,594 | | | 672 | |
| Additions to OREO | | | 21,139 | | | 74 | | | | 25,199 | | | 123 | |
| Capitalized improvements | | | 523 | | | - | | | | 3,185 | | | - | |
| Valuation adjustments | | | (4,832 | ) | | - | | | | (6,649 | ) | | - | |
| Disposition of OREO properties | | | (25,466 | ) | | (212 | ) | | | (35,870 | ) | | (393 | ) |
| Ending balance | | $ | 30,823 | | | 264 | | | $ | 39,459 | | | 402 | |
OREO is real property that the Bank has taken possession of either through a deed-in-lieu of foreclosure, non-judicial foreclosure, judicial foreclosure or similar process in full or partial satisfaction of a loan or loans. During 2011, the Company remained focused on OREO property disposition activities, resulting in the sale of $25.5 million in OREO property compared to $35.9 million in 2010. The Company assumed $21.1 million in additional OREO properties in 2011, down from $25.2 million in 2010. Reflecting lower OREO balances as well as a slowing trend in declines in local residential real estate market values, OREO valuation adjustments fell to $4.8 million in 2011 from $6.6 million in 2010. At December 31, 2011, the OREO portfolio consisted of 264 properties valued at $30.8 million. At December 31, 2011, OREO balances reflected write-downs totaling 53% from the original loan principal, essentially unchanged from a year ago. The largest categories of the OREO balance at December 31, 2011, were attributable to income producing properties followed by homes and land, all of which are located within our footprint. The residential site development balance and number of such properties declined in 2011 due to continued lot sales and significantly fewer new such properties taken under possession during the year compared to recent years.
OREO is recorded at the lower of the carrying amount of the loan or fair value less estimated costs to sell. Management is responsible for estimating the fair market value of OREO and utilizes appraisals and internal judgments in its assessment of fair market value and estimated selling costs. This estimate becomes the property’s book value at the time it is taken into OREO. If the estimate is below the carrying value of the related loan, the amount of the required adjustment is charged to the allowance for loan losses at the time the property is taken into OREO. Management then periodically reviews OREO to determine whether the property continues to be carried at the lower of its recorded book value or fair value, net of estimated costs to sell. Any further OREO valuation adjustments or subsequent gains or losses upon final disposition of OREO are charged to other noninterest income.
Expenses from the acquisition, maintenance and disposition of OREO properties are included in other noninterest expense in the consolidated statements of income (loss). It will be critical to our operating results for us to dispose of OREO properties in a timely fashion and at valuations that are consistent with our expectations. Continued decline in market values in our area would lead to additional valuation adjustments, which would have an adverse effect on our results of operations.
The following table presents categories of the OREO portfolio for the periods shown:
| (Dollars in thousands) | | December 31, | | # of | | December 31, | | # of |
| | 2011 | | properties | | 2010 | | properties |
| Income producing properties | | $ | 10,282 | | 15 | | $ | 5,162 | | 7 |
| Homes | | | 6,008 | | 17 | | | 17,297 | | 69 |
| Land | | | 5,049 | | 16 | | | 5,135 | | 12 |
| Residential site developments | | | 3,506 | | 146 | | | 7,340 | | 245 |
| Lots | | | 2,932 | | 51 | | | 3,700 | | 56 |
| Condominiums | | | 2,252 | | 9 | | | 128 | | 2 |
| Multifamily | | | 428 | | 4 | | | 697 | | 11 |
| Commercial site developments | | | 366 | | 6 | | | - | | - |
| Total | | $ | 30,823 | | 264 | | $ | 39,459 | | 402 |
In addition to OREO sales, the Bank also completed 13 short sales in 2011 for total proceeds of $3.2 million. Short sales occur when we accept an agreement with a borrower to sell the Bank's collateral on a loan that produces net proceeds that are less than what is owed. The obligor receives no proceeds; however, the debt is fully extinguished. A short sale is an alternative to foreclosure. The losses on short sales and valuation adjustments on loans prior to taking property into OREO are recorded directly to the allowance for loan losses.
40
Delinquencies.Bancorp also monitors delinquencies, defined as balances 30-89 days past due, not in nonaccrual status, as an important indicator for future nonperforming assets. Total delinquencies were $4.3 million or 0.28% of total loans at December 31, 2011, up from $2.7 million or 0.18% at December 31, 2010, and reduction from $8.4 million or .49% at year end 2009. The largest increases in delinquencies were in the commercial and commercial real estate portfolios. The amount of delinquencies and the percentage of categories or total loans represented by delinquencies may increase or decrease by a fair amount from period to period and not necessarily reflect a negative or positive trend in the underlying credit quality of the loan portfolio.
The following table summarizes total delinquent loan balances by type of loan for the periods shown:
| | December 31, |
| (Dollars in thousands) | | 2011 | | % of | | 2010 | | % of | | 2009 | | % of |
| | Amount | | category | | Amount | | category | | Amount | | category | |
| Commercial | | $ | 683 | | | 0.23 | % | | $ | 52 | | | 0.02 | % | | $ | 1,151 | | | 0.31 | % |
| Real estate construction | | | - | | | 0.00 | % | | | - | | | 0.00 | % | | | 606 | | | 0.61 | % |
| Real estate mortgage | | | 2,389 | | | 0.74 | % | | | 2,062 | | | 0.59 | % | | | 2,649 | | | 0.71 | % |
| Commercial real estate | | | 1,145 | | | 0.14 | % | | | 555 | | | 0.07 | % | | | 3,962 | | | 0.46 | % |
| Installment and other consumer | | | 56 | | | 0.41 | % | | | 52 | | | 0.34 | % | | | 59 | | | 0.32 | % |
| Total loans 30-89 days past due, | | | | | | | | | | | | | | | | | | | | | |
| not in nonaccrual status | | $ | 4,273 | | | | | | $ | 2,721 | | | | | | $ | 8,427 | | | | |
| |
| Delinquent loans to total loans | | | 0.28 | % | | | | | | 0.18 | % | | | | | | 0.49 | % | | | |
41
Allowance for Credit Losses and Net Loan Charge-offs
Allowance for Credit Losses.An allowance for credit losses has been established based on management’s best estimate, as of the balance sheet date, of probable losses inherent in the loan portfolio. The actual losses may vary significantly from the estimated amounts. For more information regarding the Company’s allowance for credit losses, see the discussion under the subheading “Allowance for Credit Losses” in the section “Critical Accounting Policies” included in Item 7 of this report below. The allowance for credit losses is comprised of two primary components: the allowance for loan losses, which is the sum of the specific reserve, formula and unallocated allowance relating to loans in the loan portfolio, and the reserve for unfunded commitments. Our methodology for determining the allowance for credit losses consists of several key elements, which include:
- Specific Reserve Allowances.Specific reserve allowances may be established when management can estimate the amount of an impairment of a loan, typically on a non real estate collateralized loan or to address the unique risks associated with a group of loans or particular type of credit exposure. The Company does not establish specific reserve allowances on collateral dependent impaired loans. Impairment amounts related to these loans are charged off to the allowance for credit losses when impairment is established.
- Formula Allowance. The formula allowance is calculated by applying loss factors to individual loans based on the assignment of risk ratings, or through the assignment of loss factors to homogenous pools of loans. Changes in risk ratings of both performing and nonperforming loans affect the amount of the formula allowance. Loss factors are based on our historical loss experience and such other data as management believes to be pertinent, and may be adjusted for significant factors that, in management’s judgment, affect the collectability of the portfolio as of the evaluation date.
- Unallocated Allowance.The unallocated loan loss allowance represents an amount for imprecision or uncertainty that is inherent in estimates used to determine the allowance. In determining whether to carry an unallocated allowance and, if so, the amount of the allowance, management considers a variety of qualitative factors, including regional economic and business conditions that impact important categories of our portfolio, loan growth rates, the depth and skill of lending staff, the interest rate environment, and the results of bank regulatory examinations and findings of our internal credit analysts.
- Reserve for Unfunded Commitments.A reserve for unfunded commitments is maintained at a level that, in the opinion of management, is adequate to absorb probable losses associated with commitments to lend funds under existing agreements; for example, the Bank’s commitment to fund advances under lines of credit. The reserve amount for unfunded commitments is determined based on our methodologies described above with respect to the formula allowance. As our unfunded commitments decrease due to the transition to a funded loan, the corresponding reserve for unfunded commitments will decrease.
At December 31, 2011, the allowance for credit losses was $36.0 million or 2.40% of total loans, consisting of a $30.3 million formula allowance, a $4.4 million unallocated allowance, a $.5 million specific reserve allowance and a $.8 million reserve for unfunded commitments. The $.5 million specific reserve allowance was maintained on performing, impaired loans considered to be troubled debt restructurings that are on an interest accruing status. At December 31, 2011, within the formula allowance, the Company had $.7 million allocated to overdrafts. At December 31, 2010, the allowance for credit losses was $41.1 million or 2.67% of total loans, consisting of a $33.5 million formula allowance, a $6.2 million unallocated allowance and a $.6 million specific reserve allowance and a $.8 million reserve for unfunded commitments.
During 2011, our net charge-offs exceeded provision for credit losses by $5.1 million, decreasing the allowance for credit losses. This partly reflected a lower risk profile of the loan portfolio and also the Company releasing reserves as certain loans moved from being included in the formula valuation allowance to being individually measured for impairment.
Overall, we believe that the allowance for credit losses is adequate to absorb losses in the loan portfolio at December 31, 2011. The process for determining the adequacy of the allowance for credit losses is critical to our financial results. It requires difficult, qualitative and complex judgments as a result of the need to make estimates about the effect of matters that are uncertain. Therefore, we cannot provide assurance that, in any particular period, we will not have sizeable credit losses in relation to the amount reserved. We may later need to significantly adjust the allowance for credit losses considering factors in existence at such time, including economic, market, or business conditions and the results of ongoing internal and external examination processes.
42
Changes in the total allowance for credit losses for full years ended December 31, 2011, through December 31, 2007, are presented in the following table:
| | December 31, |
| (Dollars in thousands) | | 2011 | | 2010 | | 2009 | | 2008 | | 2007 |
| Loans outstanding at end of period | | $ | 1,501,301 | | | $ | 1,536,270 | | | $ | 1,724,842 | | | $ | 2,064,796 | | | $ | 2,172,669 | |
| Average loans outstanding during the period | | $ | 1,516,409 | | | $ | 1,622,445 | | | $ | 1,914,975 | | | $ | 2,146,870 | | | $ | 2,094,977 | |
| |
| Allowance for credit losses, beginning of period | | $ | 41,067 | | | $ | 39,418 | | | $ | 29,934 | | | $ | 54,903 | | | $ | 23,017 | |
| Allowance for loan losses, from acquisition | | | - | | | | - | | | | - | | | | - | | | | - | |
| Loans charged off: | | | | | | | | | | | | | | | | | | | | |
| Commercial | | | (3,393 | ) | | | (5,229 | ) | | | (22,411 | ) | | | (6,464 | ) | | | (3,798 | ) |
| Commercial real estate construction | | | (1,321 | ) | | | (811 | ) | | | (325 | ) | | | (1,422 | ) | | | - | |
| Residential real estate construction | | | (736 | ) | | | (2,211 | ) | | | (28,287 | ) | | | (10,105 | ) | | | - | |
| Two-step residential construction | | | (31 | ) | | | (554 | ) | | | (6,963 | ) | | | (42,483 | ) | | | (2,540 | ) |
| Total real estate construction | | | (2,088 | ) | | | (3,576 | ) | | | (35,575 | ) | | | (54,010 | ) | | | (2,540 | ) |
| Mortgage | | | (816 | ) | | | (2,430 | ) | | | (10,022 | ) | | | (1,811 | ) | | | - | |
| Nonstandard mortgage | | | (488 | ) | | | (2,224 | ) | | | (3,666 | ) | | | (3,036 | ) | | | - | |
| Home equity | | | (4,467 | ) | | | (2,807 | ) | | | (3,394 | ) | | | (249 | ) | | | (71 | ) |
| Total real estate mortgage | | | (5,771 | ) | | | (7,461 | ) | | | (17,082 | ) | | | (5,096 | ) | | | (71 | ) |
| Commercial real estate | | | (2,526 | ) | | | (1,321 | ) | | | (5,383 | ) | | | (826 | ) | | | - | |
| Installment and consumer | | | (539 | ) | | | (706 | ) | | | (840 | ) | | | (531 | ) | | | (254 | ) |
| Overdraft | | | (1,093 | ) | | | (1,183 | ) | | | (1,054 | ) | | | (1,328 | ) | | | (1,050 | ) |
| Total loans charged off | | | (15,410 | ) | | | (19,476 | ) | | | (82,345 | ) | | | (68,255 | ) | | | (7,713 | ) |
| Recoveries: | | | | | | | | | | | | | | | | | | | | |
| Commercial | | | 1,336 | | | | 1,073 | | | | 1,005 | | | | 203 | | | | 269 | |
| Commercial real estate construction | | | 88 | | | | | | | | - | | | | - | | | | - | |
| Residential real estate construction | | | 190 | | | | 697 | | | | 44 | | | | - | | | | - | |
| Two-step residential construction | | | - | | | | | | | | 241 | | | | 2,339 | | | | 7 | |
| Total real estate construction | | | 278 | | | | 697 | | | | 285 | | | | 2,339 | | | | 7 | |
| Mortgage | | | 133 | | | | 247 | | | | 11 | | | | - | | | | - | |
| Nonstandard mortgage | | | 6 | | | | 5 | | | | 1 | | | | 38 | | | | - | |
| Home equity | | | 84 | | | | 128 | | | | 35 | | | | 32 | | | | 33 | |
| Total real estate mortgage | | | 223 | | | | 380 | | | | 47 | | | | 70 | | | | 33 | |
| Commercial real estate | | | 48 | | | | 28 | | | | 151 | | | | - | | | | 2 | |
| Installment and consumer | | | 61 | | | | 92 | | | | 65 | | | | 78 | | | | 112 | |
| Overdraft | | | 247 | | | | 203 | | | | 219 | | | | 229 | | | | 220 | |
| Total recoveries | | | 2,193 | | | | 2,473 | | | | 1,772 | | | | 2,919 | | | | 643 | |
| Net loans charged off | | | (13,217 | ) | | | (17,003 | ) | | | (80,573 | ) | | | (65,336 | ) | | | (7,070 | ) |
| Provision for credit losses loans other than two-step loans | | | 8,101 | | | | 18,098 | | | | 83,756 | | | | 30,867 | | | | 7,976 | |
| Provision for credit losses two-step loans | | | 32 | | | | 554 | | | | 6,301 | | | | 9,500 | | | | 30,980 | |
| Total provision for credit losses | | | 8,133 | | | | 18,652 | | | | 90,057 | | | | 40,367 | | | | 38,956 | |
| Allowance for credit losses, end of period | | $ | 35,983 | | | $ | 41,067 | | | $ | 39,418 | | | $ | 29,934 | | | $ | 54,903 | |
| |
| Components of allowance for credit losses | | | | | | | | | | | | | | | | | | | | |
| Allowance for loan losses | | $ | 35,212 | | | $ | 40,217 | | | $ | 38,490 | | | $ | 28,920 | | | $ | 46,917 | |
| Reserve for unfunded commitments | | | 771 | | | | 850 | | | | 928 | | | | 1,014 | | | | 7,986 | |
| Total allowance for credit losses | | $ | 35,983 | | | $ | 41,067 | | | $ | 39,418 | | | $ | 29,934 | | | $ | 54,903 | |
| |
| Ratio of net loans charged off to average | | | | | | | | | | | | | | | | | | | | |
| loans outstanding | | | 0.87 | % | | | 1.05 | % | | | 4.21 | % | | | 3.04 | % | | | 0.34 | % |
| Ratio of allowance for loan losses to end of | | | | | | | | | | | | | | | | | | | | |
| period loans | | | 2.35 | % | | | 2.62 | % | | | 2.23 | % | | | 1.40 | % | | | 2.16 | % |
| Ratio of allowance for credit losses to end of | | | | | | | | | | | | | | | | | | | | |
| period loans | | | 2.40 | % | | | 2.67 | % | | | 2.29 | % | | | 1.45 | % | | | 2.53 | % |
43
Net Loan Charge-offs.During 2011, total net loan charge-offs were $13.2 million, a decline from $17.0 million in 2010, and a significant reduction from $80.6 million in 2009. Net loan charge-offs reflect the realization of net losses in the loan portfolio that were recognized previously through the provision for credit losses. The total net loan charge-off to total average loans outstanding was ..87% for the year ended 2011, down from 1.05% in 2010 and 4.21% in 2009. Net charge-offs increased in home equity and commercial real estate categories in 2011, but were more than offset by the declines in net charge-offs in commercial, residential real estate construction, mortgage and nonstandard mortgage categories.
The following table summarizes net loan charge-offs by type of loan for the periods shown:
| (Dollars in thousands) | | December 31, 2011 | | December 31, 2010 |
| | Net loan charge- | | % of average loan | | Net loan charge- | | % of average loan |
| | offs | | category | | offs | | category |
| Commercial | | | 2,057 | | 0.69 | % | | | 4,156 | | 1.26 | % |
| Commercial real estate construction | | | 1,233 | | 7.39 | % | | | 811 | | 3.61 | % |
| Residential real estate construction | | | 577 | | 3.35 | % | | | 2,068 | | 4.00 | % |
| Total real estate construction | | | 1,810 | | 5.34 | % | | | 2,879 | | 3.88 | % |
| Mortgage | | | 683 | | 1.10 | % | | | 2,183 | | 3.16 | % |
| Nonstandard mortgage | | | 482 | | 4.59 | % | | | 2,219 | | 15.27 | % |
| Home equity | | | 4,383 | | 1.66 | % | | | 2,679 | | 0.96 | % |
| Total real estate mortgage | | | 5,548 | | 1.65 | % | | | 7,081 | | 1.95 | % |
| Commercial real estate | | | 2,478 | | 0.30 | % | | | 1,293 | | 0.15 | % |
| Installment and consumer | | | 478 | | 3.67 | % | | | 614 | | 4.12 | % |
| Overdraft | | | 846 | | 64.99 | % | | | 980 | | 68.87 | % |
| Total loan net charge-offs | | $ | 13,217 | | 0.87 | % | | $ | 17,003 | | 1.05 | % |
44
Deposits and Borrowings
We predominantly rely on customer deposits complemented by FHLB borrowings to fund earning assets. The composition of our funding mix has and will continue to depend on our funding needs, customer demand for various deposit products, interest rate risk position, funding costs of the various alternatives, the level and shape of the yield curve, collateral requirements for borrowings, the relative cost and availability of other funding sources including government lending or investment programs, and credit market conditions. Borrowings may be used to manage short-term and long-term funding needs when they are less expensive than deposits, or when necessary to adjust our interest rate risk position.
The following table summarizes the average amount of, and the average rate paid on, each of the deposit and borrowing categories for the periods shown:
| | 2011 | | 2010 | | 2009 |
| (Dollars in thousands) | | Average Balance | | Percent
of total | | Rate
Paid | | Average Balance | | Percent
of total | | Rate
Paid | | Average Balance | | Percent
of total | | Rate
Paid |
| Demand deposits | | $ | 592,630 | | 30.6 | % | | - | | | $ | 540,280 | | 26.7 | % | | - | | | $ | 499,283 | | 23.9 | % | | - | |
| Interest bearing demand | | | 362,334 | | 18.7 | % | | 0.06 | % | | | 335,134 | | 16.5 | % | | 0.13 | % | | | 298,002 | | 14.2 | % | | 0.26 | % |
| Savings | | | 112,385 | | 5.8 | % | | 0.11 | % | | | 103,531 | | 5.1 | % | | 0.27 | % | | | 89,903 | | 4.3 | % | | 0.79 | % |
| Money market | | | 654,329 | | 33.7 | % | | 0.26 | % | | | 659,542 | | 32.5 | % | | 0.60 | % | | | 617,881 | | 29.5 | % | | 1.33 | % |
| Total non-time deposits | | | 1,721,678 | | 88.8 | % | | 0.12 | % | | | 1,638,487 | | 80.8 | % | | 0.28 | % | | | 1,505,069 | | 71.9 | % | | 0.64 | % |
| Time deposits | | | 217,149 | | 11.2 | % | | 1.34 | % | | | 388,500 | | 19.2 | % | | 1.92 | % | | | 587,299 | | 28.1 | % | | 2.51 | % |
| Total deposits | | | 1,938,827 | | 100 | % | | 0.26 | % | | | 2,026,987 | | 100 | % | | 0.60 | % | | | 2,092,368 | | 100 | % | | 1.17 | % |
| |
| Short-term borrowings | | | 14,653 | | | | | 6.85 | % | | | 7,570 | | | | | 6.52 | % | | | 44,220 | | | | | 1.82 | % |
| Long-term borrowings1 | | | 197,584 | | | | | 6.05 | % | | | 257,019 | | | | | 3.75 | % | | | 259,865 | | | | | 3.15 | % |
| Total borrowings | | | 212,237 | | | | | 6.10 | % | | | 264,589 | | | | | 3.83 | % | | | 304,085 | | | | | 2.95 | % |
| | | | | | | | | | | | | | | | | | | | | | | | | | | | |
| Total deposits and borrowings | | $ | 2,151,064 | | | | | 1.15 | % | | $ | 2,291,576 | | | | | 1.27 | % | | $ | 2,396,453 | | | | | 1.76 | % |
| 1 | | Long-term borrowings include junior subordinated debentures. |
Average total deposits in 2011 decreased 4.3% or $88.2 million from 2010, and the average rate paid on total deposits was .26% in 2011 a decline of 34 basis points from .60% in 2010. The increase in rates paid on long-term borrowings to 6.05% for 2011, from 3.75% in 2010, was due to the $7.1 million prepayment charge associated with the prepayment of $168.6 million in FHLB borrowings in 2011.
Deposit funding obtained from depositors within our market area remains a key strategic focus for us, and our marketing efforts are primarily focused on long-term growth in business and consumer relationships with deposit accounts and balances in lower cost categories such as demand deposits, interest bearing demand, savings and money market accounts. Whether we will be successful maintaining and growing our deposit base, and particularly our low cost deposit base, will depend on various risk factors including deposit pricing, the effects of changing product pricing and of competitive pricing pressure, changing customer deposit behavior, regulatory changes, consumer’s evaluation of bank stability, market interest rates and our success in competing for deposits in uncertain economic and market conditions. Adverse developments with respect to any of these risk factors could limit our ability to attract or retain deposits.
The time deposits category predominantly includes certificates of deposit originated at our branches with, as discussed below, a modest amount of time deposits obtained from internet listing services, and through brokers. During 2011, we reduced total time deposit balances by $171.4 million or 44.1% as we elected to reduce higher rate funding in light of lower loan balances and excess balance sheet liquidity at very low yields.
45
At December 31, 2011, brokered deposits totaled $6.0 million, or an immaterial .3% of period end total deposits, of which all were wholesale brokered deposits compared to $30.4 million in total brokered deposits at December 31, 2010, of which $29.9 million were wholesale brokered deposits and $.5 million were reciprocal deposits arising out of the Company’s participation in the Certificate of Deposit Account Registry Service (“CDARS”) network. CDARS deposits are treated as brokered deposits for regulatory purposes. While as of year end 2011, the Company had no plans to renew maturing brokered deposits, we may consider taking wholesale brokered deposits and CDARS deposits in the future if management determines that it is appropriate to maintain or grow our deposit funding base in such manner.
As of December 31, 2011, time deposits are presented below at the earlier of the next repricing date or maturity:
| | Time deposits | | | | | | | | |
| (Dollars in thousands) | | of $100,000 or more | | Other time deposits | | Total time deposits |
| | Amount | | Percent | | Amount | | Percent | | Amount | | Percent |
| Reprice/mature in 3 months or less | | $ | 20,511 | | 37.7 | % | | $ | 38,760 | | 32.6 | % | | $ | 59,271 | | 34.3 | % |
| Reprice/mature after 3 months through 6 months | | | 9,147 | | 16.8 | % | | | 22,421 | | 18.9 | % | | | 31,568 | | 18.2 | % |
| Reprice/mature after 6 months through one year | | | 12,037 | | 22.1 | % | | | 29,504 | | 24.9 | % | | | 41,541 | | 24.0 | % |
| Reprice/mature after one year through five years | | | 12,755 | | 23.4 | % | | | 27,982 | | 23.6 | % | | | 40,737 | | 23.5 | % |
| Reprice/mature after five years | | | - | | 0.0 | % | | | - | | 0.0 | % | | | - | | 0.0 | % |
| Total | | $ | 54,450 | | 100.0 | % | | $ | 118,667 | | 100.0 | % | | $ | 173,117 | | 100.0 | % |
Approximately 76% of our time deposits will mature and reprice in the next 12 months. Historically, the Company has been able to retain and or expand time deposits by increasing rates paid, which increases our funding cost when such strategies are implemented. The level of time deposits in the future depends on customer preferences for time deposits, market interest rates and the slope of the yield curve, our need for deposit funding volume, customer perceptions of the Bank, as well as the pricing required to retain and attract time deposits relative to other funding alternatives including borrowings from the FHLB.
| | December 31, | | December 31, |
| (Dollars in thousands) | | 2011 | | 2010 |
| Time deposits less than $100,000 | | $ | 118,667 | | 69 | % | | $ | 187,423 | | 68 | % |
| Time deposits $100,000 to $250,000 | | | 37,357 | | 21 | % | | | 64,528 | | 23 | % |
| Time deposits greater than $250,000 | | | 17,093 | | 10 | % | | | 23,460 | | 9 | % |
| Total time deposits | | $ | 173,117 | | 100 | % | | $ | 275,411 | | 100 | % |
As shown above, time deposits of $100,000 or more represented about 31% of total time deposits at year end 2011, down from 32% at December 31, 2010. This was caused primarily by time deposits moving into other deposit products or leaving the bank.
As of December 31, 2011, long-term and short-term borrowings through the FHLB had the following terms remaining to their contractual maturities:
| (Dollars in thousands) | | Due in three | | Three months | | Due after one year | | Due after | | | |
| | months or less | | through one year | | through five years | | five years | | Total |
| Short-term borrowings | | $ | - | | $ | - | | $ | - | | $ | - | | $ | - |
| Long-term borrowings1 | | | - | | | - | | | 120,000 | | | - | | | 120,000 |
| Total borrowings | | $ | - | | $ | - | | $ | 120,000 | | $ | - | | $ | 120,000 |
| 1 | | Based on contractual maturities. |
46
Average total borrowings decreased $52.5 million in 2011 compared to 2010. This was largely due to the prepayment of about $168.6 million of FHLB borrowings in the third and fourth quarters of 2011, of which $120.0 million was re-borrowed. The Bank is paying a rate of 1.05% on the new borrowings down from 3.19% on the amount prepaid.
At December 31, 2011, six wholly-owned subsidiary grantor trusts established by Bancorp had issued and sold $51.0 million of trust preferred securities that remain outstanding. Trust preferred securities accrue and pay distributions periodically at specified annual rates as provided in each indenture. The trusts used all of the net proceeds from each sale of trust preferred securities to purchase a like amount of junior subordinated debentures of the Company. The junior subordinated debentures are the sole assets of the trusts. The Company’s obligations under the junior subordinated debentures and related documents, taken together, constitute a full and unconditional guarantee by the Company of the obligations of the trusts. The trust preferred securities are mandatorily redeemable upon the maturity of the junior subordinated debentures and may be subject to earlier redemption as provided in the indentures. The Company has the right to redeem the junior subordinated debentures in whole (but not in part) on or after specific dates, at a redemption price specified in the indentures plus any accrued but unpaid interest to the redemption date. At December 31, 2011, the Company had no plans to redeem these junior subordinated debentures.
The following table is a summary of outstanding trust preferred securities at December 31, 2011:
| (Dollars in thousands) | | | | | | | | | | | | | | | | | |
| | | | Preferred security | | Rate | | | | | Rate at | | | | Next possible |
| Issuance Trust | | Issuance date | | amount | | type1 | | Initial rate | | 12/31/11 | | Maturity date | | redemption date2 |
| West Coast Statutory Trust III | | September 2003 | | $ | 7,500 | | Variable | | 6.75 | % | | 3.51 | % | | September 2033 | | Currently redeemable |
| West Coast Statutory Trust IV | | March 2004 | | $ | 6,000 | | Variable | | 5.88 | % | | 3.35 | % | | March 2034 | | Currently redeemable |
| West Coast Statutory Trust V | | April 2006 | | $ | 15,000 | | Variable | | 6.79 | % | | 1.98 | % | | June 2036 | | Currently redeemable |
| West Coast Statutory Trust VI | | December 2006 | | $ | 5,000 | | Variable | | 7.04 | % | | 2.23 | % | | December 2036 | | Currently redeemable |
| West Coast Statutory Trust VII | | March 2007 | | $ | 12,500 | | Variable | | 6.90 | % | | 2.10 | % | | June 2037 | | June 2012 |
| West Coast Statutory Trust VIII | | June 2007 | | $ | 5,000 | | Variable | | 6.74 | % | | 1.93 | % | | June 2037 | | June 2012 |
| | Total | | $ | 51,000 | | | | Weighted rate | | | 2.41 | % | | | | |
| 1 | | The variable rate preferred securities reprice quarterly. |
| 2 | | Securities are redeemable at the option of Bancorp following these dates. |
The interest rates on all issued trust preferred securities reset quarterly and are tied to the London Interbank Offered Rate (“LIBOR”) rate. There were no purchases, redemptions, or maturities of trust preferred securities in 2011. The Company exercised its right to defer regularly scheduled interest payments on junior subordinated debentures related to its trust preferred securities in the third quarter of 2009. During the second quarter of 2011, the holding company paid all previously deferred interest on its trust preferred securities while commencing to pay quarterly interest payments due. The average balance of junior subordinated debentures in 2011 was $51.0 million, unchanged from 2010.
47
Capital Resources
The Federal Reserve and the FDIC have established minimum requirements for capital adequacy for bank holding companies and state non-member banks. For more information on this topic, see the discussion under the subheading “Capital Adequacy Requirements” in the section “Supervision and Regulation” included in Item 1 of this report. The following table summarizes the capital measures of Bancorp and the Bank at December 31, 2011:
| | | | | | | | | | | | | | | | | | Bank-level |
| | West Coast Bancorp | | West Coast Bank | | guideline requirements |
| | December 31, | | December 31, | | Adequately | | Well |
| | 2011 | | 2010 | | 2011 | | 2010 | | Capitalized | | Capitalized |
| Tier 1 risk-based capital ratio | | | 19.36 | % | | | 17.47 | % | | | 18.66 | % | | | 16.79 | % | | 4.00 | % | | 6.00 | % |
| Total risk-based capital ratio | | | 20.62 | % | | | 18.74 | % | | | 19.92 | % | | | 18.05 | % | | 8.00 | % | | 10.00 | % |
| Leverage ratio | | | 14.61 | % | | | 13.02 | % | | | 14.09 | % | | | 12.51 | % | | 4.00 | % | | 5.00 | % |
| |
| Total stockholders' equity | | $ | 314,479 | | | $ | 272,560 | | | $ | 352,187 | | | $ | 310,487 | | | | | | | |
Bancorp’s total risk-based capital ratio improved to 20.62% at December 31, 2011, up from 18.74% at December 31, 2010. During 2011, Bancorp's Tier 1 risk-based capital ratio increased to 19.36% from 17.47%, while its leverage ratio increased to 14.61% from 13.02%. The total capital ratio at the Bank improved to 19.92% at December 31, 2011, from 18.05% at December 31, 2010, while the Bank’s Tier 1 capital ratio increased from 16.79% to 18.66% over the same period. The leverage ratio at the Bank improved to 14.09% at December 31, 2011, from 12.51% at December 31, 2010. Bancorp and the Bank capital ratios improved over year end 2010 principally as a result of 2011 operating profitability and the impact of the reversal of the deferred tax asset valuation allowance in the fourth quarter 2011.
The total risk based capital ratios of Bancorp included $51.0 million of junior subordinated debentures, all of which qualifies as Tier 1 capital at December 31, 2011, and 2010, under guidance issued by the Federal Reserve. The $51 million in junior subordinated debentures was grandfathered in as qualifying for Tier 1 capital under the Dodd-Frank Act which specified that for bank holding companies under $15 billion in total assets, debt and equity instruments under certain conditions will qualify for Tier 1 treatment. Bancorp expects to continue to rely on common equity and junior subordinated debentures to remain well capitalized, although it does not expect to issue additional junior subordinated debentures in the near term.
The Company closely monitors and manages its equity and regulatory capital position. Bancorp’s stockholders’ equity was $314.5 million at December 31, 2011, up from $272.6 million at December 31, 2010. Total equity increased by $41.9 million in 2011 due primarily to net income of $33.8 million, and an increase in unrealized gains on investment securities during the year. As a result of a rights offering with net proceeds in the amount of $9.3 million, a discretionary equity issuance program with aggregate gross sales proceeds of $7.9 million, as well as net income of $3.2 million in 2010, capital grew by $23.5 million that year. During 2009, the Company raised $155.0 million in gross proceeds through a private capital raise, and it also suspended its quarterly shareholder cash dividend, which cannot be reinstated without regulatory consent. For additional steps the Company has taken to increase and preserve capital, see the discussion under the heading “Historical Information” in Item 1 of this report.
Bancorp believes its capital at the present time is sufficient and has no current plan to raise additional capital. Notwithstanding this, Bancorp may take steps to raise additional capital in the future, and the Company may offer and issue equity, hybrid equity or debt instruments, including convertible preferred stock or subordinated debt in that process. Any equity or debt financing, if available at all, may be dilutive to existing shareholders or include covenants or other restrictions that limit the Company’s activities.
48
Liquidity and Sources of Funds
The Bank’s primary sources of funds include available cash, customer deposits, advances from the FHLB, maturities of investment securities, sales of “Available for Sale” securities, loan and OREO sales, loan repayments, net income, if any, and loans taken out at the Federal Reserve discount window. Scheduled loan repayments and investment securities maturities are a relatively stable source of funds, while deposit inflows, loan and OREO sales and unscheduled loan prepayments are not. Deposit inflows, loan and OREO sales and unscheduled loan prepayments are influenced by general interest rate levels, interest rates available on other investments, client behavior, competition, investment alternatives, market and general economic factors.
Deposits are the primary source of new funds. Total deposits were $1.9 billion at December 31, 2011, relatively unchanged from year end 2010. Over the past 12 months the Company’s loan to deposit ratio remained relatively unchanged and measured 78% at December 31, 2011, as reductions in time deposit balances offset increased non-time deposit balances and the decline in the loan portfolio. At December 31, 2011, the investment securities portfolio was $729.8 million and represented 32% of total earning assets. In light of the substantial liquidity position, a portion of which carried a higher cost of funds than amounts being earned and therefore has an adverse impact on net interest income and operating results, we reduced time deposits, including brokered and internet deposits, and FHLB borrowings during 2011.
The following table summarizes the Bank’s primary liquidity, on balance sheet liquidity, and net non-core funding dependency ratios for the periods shown. The primary liquidity ratio represents the sum of net cash, short-term and marketable assets and available borrowing lines divided by total deposits. The on-balance sheet liquidity ratio consists of the sum of net cash, short-term and marketable assets divided by total deposits. The net non-core funding dependency ratio is non-core liabilities less short-term investments divided by long-term assets. The Bank’s primary liquidity and on-balance sheet liquidity ratio increased during 2011 and together with the net non-core funding dependency were strong at December 31, 2011.
| | December 31, |
| | 2011 | | 2010 |
| Primary liquidity | | 45 | % | | 37 | % |
| On-balance sheet liquidity | | 26 | % | | 15 | % |
| Net non-core funding dependency | | 6 | % | | 6 | % |
At December 31, 2011, the Bank had outstanding borrowings of $120.0 million against its $440.4 million in established borrowing capacity with the FHLB. The Bank’s borrowing facility at year end 2011 was subject to collateral and stock ownership requirements. Additionally, at December 31, 2011, the Bank had an available discount window credit line with the Federal Reserve of approximately $40.3 million with no balance outstanding. As with the other lines, each advance under the credit arrangement with the Federal Reserve is subject to prior Federal Reserve consent. For more information regarding the Company’s outstanding borrowings, see Note 9 “Borrowings” to the Company’s audited consolidated financial statements included under the section “Financial Statements and Supplementary Data” in Item 8 of this report.
The holding company is a separate entity from the Bank and must provide for its own liquidity. Substantially all of the holding company’s liquidity, which is required to pay interest on Bancorp’s junior subordinated debentures, shareholder cash dividends, if any, and other expenses, comes from dividends declared and paid by the Bank. In addition, the holding company may receive cash from the exercise of options and the issuance of equity securities. Under the Written Agreement, Bancorp may not directly or indirectly take dividends or other forms of payment representing a reduction in capital from the Bank without the prior written approval of the Reserve Bank and the DFCS. Also, under our MOU, the Bank may not pay dividends to the holding company without the consent of the FDIC and the DFCS. At December 31, 2011, the holding company did not have any borrowing arrangements of its own.
Management expects to continue relying on customer deposits, cash flow from investment securities, and sales of “Available for Sale” securities, as its most important sources of liquidity. In addition, the Bank may from time to time obtain additional liquidity from loan and OREO sales, loan repayments, federal funds markets, brokered deposits, internet deposit listing services, the Federal Reserve discount window, and other borrowings as well as from net income. Borrowings may be used on a short-term and long-term basis to compensate for reductions in other sources of funds. Borrowings may also be used on a long-term basis to support expanded lending activities and to match maturities, duration, or repricing intervals of assets. The sources of such funds may include, but are not limited to, Federal Funds purchased, reverse repurchase agreements and borrowings from the FHLB.
For more information on this topic, see the discussion under the section “Risk Factors” included in Item 1A of this report.
49
Off Balance Sheet Arrangements
At December 31, 2011, the Bank had commitments to extend credit of $574.3 million, which was substantially unchanged from $571.6 million at December 31, 2010. For additional information regarding off balance sheet arrangements and future financial commitments, see Note 19 “Financial Instruments with Off Balance Sheet Risk” to the Company’s audited consolidated financial statements included under the section “Financial Statements and Supplementary Data” in Item 8 of this report. We are party to many contractual financial obligations, including repayment of borrowings, operating lease payments and commitments to extend credit.
The table below presents certain future financial obligations including payments required under retirement plans which are included in “Other long-term liabilities:”
| | Payments due within time period at December 31, 2011 |
| (Dollars in thousands) | | | | | | | | | | | Due After Five | | | |
| | 0-12 Months | | 1-3 Years | | 4-5 Years | | Years | | Total |
| Operating leases1 | | $ | 4,134 | | $ | 7,810 | | $ | 5,764 | | $ | 8,027 | | $ | 25,735 |
| Junior subordinated debentures2 3 | | | 2,893 | | | 2,207 | | | 2,207 | | | 72,799 | | | 80,106 |
| Long-term borrowings3 | | | 5,345 | | | 133,160 | | | 42,690 | | | - | | | 181,195 |
| Other long-term liabilities | | | 213 | | | 413 | | | 416 | | | 1,055 | | | 2,097 |
| Total | | $ | 12,585 | | $ | 143,590 | | $ | 51,077 | | $ | 81,881 | | $ | 289,133 |
| 1 | | Operating leases do not include increases in common area charges. |
| 2 | | Junior subordinated debenture obligations reflect contractual maturities which are 30 years from origination and do not reflect possible call dates. |
| 3 | | Long-term borrowings and junior subordinated debenture obligations reflect interest payment obligations based on December 31, 2011 contractual interest rates. |
50
Critical Accounting Policies
We have identified our accounting policies related to our estimation of the allowance for credit losses, valuation of other real estate owned (“OREO”), and estimates relating to income taxes as policies that are most critical to an understanding of our financial condition and operating results. Application of these policies and calculation of these amounts involve difficult, subjective, and complex judgments, and often involve estimates about matters that are inherently uncertain. These policies are discussed in greater detail below, as well as in Note 1 “Summary of Significant Accounting Policies” to the Company’s audited consolidated financial statements included under the section “Financial Statements and Supplementary Data” Item 8 of this report.
Allowance for Credit Losses.Our methodology for establishing the allowance for credit losses considers a series of risk factors, both quantitative and qualitative, to reflect changes in the collectability of the portfolio not captured solely by the historical loss data. These factors augment actual loss experience and help to estimate the probability of loss within the loan portfolio based upon emerging or inherent risk trends. Qualitative factors include concentration, past due, non-accrual/adversely classified and troubled debt restructuring trends. New products and expansion into new geographic regions can increase the uncertainties in management’s evaluation of the factors that are part of establishment of an allowance for credit losses that is believed to be adequate. Changes in any of the above factors could have a significant effect on the calculation of the allowance for credit losses in any given period. This discussion should be read in conjunction with our audited consolidated financial statements and related notes included in Item 8 of this report, and the section “Allowance for Credit Losses and Net Loan Charge-offs” in this Item 7 of this report.
Valuation of OREO.The Bank takes possession of OREO as part of its lending business, as real estate serves as collateral for many of the Bank’s loans. OREO is initially recorded in our financial statements at the lower of the carrying amount of the loan or fair value of the property less the estimated costs to sell the property. Management considers third party appraisals as well as independent fair market value assessments from realtors or persons involved in selling OREO in determining the fair value of particular properties. Accordingly, the valuation of OREO is subject to significant external and internal judgment. If there is a difference between management’s assessment of fair value less estimated cost to sell and the carrying value of the loan at the date a particular property is transferred into OREO, the difference is charged to the allowance for credit losses. Thereafter, management periodically assesses its estimate of fair value, often by means of new appraisals or reduction of property listing price. Any resulting decreases in the fair value of OREO are considered valuation adjustments and trigger a corresponding charge to the line item “Other real estate owned sales and valuation adjustments and (loss) gain on sales” within total noninterest income of the consolidated statements of income (loss). At December 31, 2011, the Bank had $30.8 million of OREO.
Income Taxes.We are subject to the income tax laws of the United States and primarily the state of Oregon. We account for income taxes using the asset and liability method in accordance with Financial Accounting Standards Board (“FASB”) Accounting Standards Codification (“ASC”) 740, “Income Taxes.” Our income tax benefit or expense is estimated and reported in the Consolidated Statements of Income (Loss) and includes both current and deferred tax expense or benefits and reflects taxes to be paid or refunded for the current period. Current taxes payable represent the Company’s expected federal and state tax liability and are reported in other liabilities on the consolidated balance sheets.
We determine our deferred income taxes using the balance sheet method, under which the net deferred tax asset or liability is based on the tax effects of the differences between the book and tax bases of assets and liabilities, and changes in tax rates and laws are recognized in the period in which they occur. Deferred income tax expense or benefit is recorded based on changes in deferred tax assets and liabilities between periods. The Company records net deferred tax assets to the extent these assets will more likely than not be realized. In making the determination whether a deferred tax asset is more likely than not to be realized, management seeks to evaluate all available positive and negative evidence including the possibility of future reversals of existing taxable temporary differences, projected future taxable income, tax planning strategies and recent financial results. A deferred tax asset valuation allowance is established to reduce the net carrying amount of deferred tax assets if it is determined to be more likely than not that all or some portion of the deferred tax asset will not be realized.
A significant element of objective evidence is the Company’s demonstrated return to profitability over consecutive quarters and positive projected financial results. Based on its evaluation of the positive and negative evidence, management determined it was appropriate to establish a deferred tax asset valuation allowance of $21 million as of December 31, 2009, and an allowance of $23.5 million as of December 31, 2010. Based on the analysis of positive and negative evidence at December 31, 2011, including the Company’s return to profitability over the last six consecutive quarters, no deferred tax asset valuation allowance was deemed necessary as of December 31, 2011. As a result, the deferred tax asset valuation allowance of $23.5 million was reversed in the fourth quarter of 2011. Going forward, management will review the deferred tax asset on a quarterly basis.
The income tax laws of the jurisdictions in which we operate are complex and subject to different interpretations. In establishing a provision for income tax expense or benefit, we make judgments and interpretations about the application of these complex tax laws. Our interpretations are subject to change and may be subject to external review during examination by taxing authorities. Disputes may arise over our tax positions. See Note 16 “Income Taxes” to the Company’s audited consolidated financial statements included under the section “Financial Statements and Supplementary Data” in Item 8 of this report.
51
ITEM 7A.QUANTITATIVE AND QUALITATIVE DISCLOSURES ABOUT MARKET RISK
Market Risk
Interest rate, credit and operations risks are the most significant market risks impacting our performance. Other types of market risk, such as foreign currency exchange rate risk and commodity price risk, do not arise in the normal course of our business activities. We rely on loan reviews, prudent loan underwriting standards and an adequate allowance for credit losses to attempt to mitigate credit risk. Interest rate risk is reviewed at least quarterly by the Asset Liability Management Committee (“ALCO”) which includes senior management representatives. The ALCO manages our balance sheet to maintain net interest income and present value of equity within acceptable ranges.
Asset/liability management simulation models are used to measure interest rate risk. The models quantify interest rate risk by simulating forecasted net interest income over a 12-month time horizon under various rate scenarios, as well as monitoring the change in the present value of equity under the same rate scenarios. The present value of equity is defined as the difference between the market value of current assets less current liabilities. By measuring the change in the present value of equity under different rate scenarios, management can identify interest rate risk that may not be evident in simulating changes in forecasted net interest income. Readers are referred to the sections, “Forward Looking Statement Disclosure” and “Risk Factors” of this report in connection with this discussion of market risks.
The following table shows the approximate percentage changes in forecasted net interest income over a 12-month period and in the present value of equity under several rate scenarios. For the net interest income analysis, three rate scenarios are compared to a stable (unchanged from December 31, 2011) rate scenario:
| Stable rate scenario compared to: | Percent Change in
Net Interest Income
2011 | Percent Change in
Net Interest Income
2010 |
| Up 200 basis points | 2.5% | 1.9% |
| Up 100 basis points | 1.4% | .1% |
| Down 100 basis points | -5.3% | -1.4% |
As illustrated in the above table, we estimate our balance sheet was slightly asset sensitive over a 12 month horizon at December 31, 2011, meaning that interest earning assets are expected to mature or reprice more quickly than interest-bearing liabilities in a given period. A decrease in market rates of interest could adversely affect net interest income, while an increase in market rates may increase net interest income slightly. At December 31, 2010, we also estimated that our balance sheet was slightly asset sensitive. We attempt to limit our interest rate risk through managing the repricing characteristics of our assets and liabilities.
For the present value of equity analysis, the results are compared to the net present value of equity using the yield curve as of December 31, 2011. This curve is then shifted up and down and the net present value of equity is computed. The net present value of equity is the difference between the present value of assets and the present value of liabilities. It is useful for assessing longer term interest rate risk. This table does not include flattening or steepening yield curve effects.
December 31, 2011
Change in Interest Rates | Percent Change in
Present Value of Equity |
| Up 200 basis points | -3.8% |
| Up 100 basis points | -2.2% |
| Down 100 basis points | -5.3% |
It should be noted that the simulation model does not take into account future management actions that could be undertaken should a change occur in actual market interest rates during the year. Also, certain assumptions are required to perform modeling simulations that may have a significant impact on the results. These include important assumptions regarding the level of interest rates and balance changes on deposit products that do not have stated maturities, as well as the relationship between loan yields and deposit rates relative to market interest rates. These assumptions have been developed through a combination of industry standards and future expected pricing behavior but could be significantly influenced by future competitor pricing behavior. The model also includes assumptions about the composition of the balance sheet. The results derived from the simulation model could vary significantly due to external factors such as changes in the prepayment assumptions, early withdrawals of deposits and competition. Any transaction activity will also have an impact on the asset/liability position as new assets are acquired and added.
52
Interest Rate Sensitivity (Gap) Table
The primary objective of our asset/liability management is to maximize net interest income while maintaining acceptable levels of interest-rate sensitivity. We seek to meet this objective through influencing the maturity and repricing characteristics of our assets and liabilities.
The following table sets forth the estimated maturity and repricing and the resulting interest rate gap between interest earning assets and interest bearing liabilities at December 31, 2011. The amounts in the table are derived from internal Bank data regarding maturities and next repricing dates including contractual repayments.
| | Estimated Maturity or Repricing at December 31, 2011 |
| (Dollars in thousands) | | | | | | | | | | | | | | Due After | | | | |
| | 0-3 Months | | 4-12 Months | | 1-5 Years | | Five Years | | Total |
| Interest Earning Assets: | | | | | | | | | | | | | | | | | | | | |
| Interest earning balances due from banks | | $ | 27,514 | | | $ | - | | | $ | - | | | $ | - | | | $ | 27,514 | |
| Federal funds sold | | | 4,758 | | | | - | | | | - | | | | - | | | | 4,758 | |
| Trading assets | | | 747 | | | | - | | | | - | | | | - | | | | 747 | |
| Investments available for sale 1 2 | | | 55,103 | | | | 96,911 | | | | 377,502 | | | | 200,328 | | | | 729,844 | |
| Loans held for sale | | | 3,281 | | | | - | | | | - | | | | - | | | | 3,281 | |
| Loans, including fees | | | 568,300 | | | | 201,426 | | | | 627,293 | | | | 104,282 | | | | 1,501,301 | |
| Total interest earning assets | | $ | 659,703 | | | $ | 298,337 | | | $ | 1,004,795 | | | $ | 304,610 | | | | 2,267,445 | |
| Allowance for loan losses | | | | | | | | | | | | | | | | | | | (35,212 | ) |
| Cash and due from banks | | | | | | | | | | | | | | | | | | | 59,955 | |
| Other assets | | | | | | | | | | | | | | | | | | | 137,699 | |
| Total assets | | | | | | | | | | | | | | | | | | $ | 2,429,887 | |
| |
| Interest Bearing Liabilities: | | | | | | | | | | | | | | | | | | | | |
| Savings,interest bearing demand | | | | | | | | | | | | | | | | | | | | |
| and money markets3 | | $ | 53,500 | | | $ | 135,964 | | | $ | 447,354 | | | $ | 483,672 | | | $ | 1,120,490 | |
| Time deposits | | | 59,268 | | | | 73,112 | | | | 40,737 | | | | - | | | | 173,117 | |
| Borrowings2 | | | - | | | | - | | | | 120,000 | | | | - | | | | 120,000 | |
| Junior subordinated debentures | | | 51,000 | | | | - | | | | - | | | | - | | | | 51,000 | |
| Total interest bearing liabilities | | $ | 163,768 | | | $ | 209,076 | | | $ | 608,091 | | | $ | 483,672 | | | | 1,464,607 | |
| Other liabilities | | | | | | | | | | | | | | | | | | | 650,801 | |
| Total liabilities | | | | | | | | | | | | | | | | | | | 2,115,408 | |
| Stockholders' equity | | | | | | | | | | | | | | | | | | | 314,479 | |
| Total liabilities & stockholders' equity | | | | | | | | | | | | | | | | | | $ | 2,429,887 | |
| |
| Interest sensitivity gap | | $ | 495,935 | | | $ | 89,261 | | | $ | 396,704 | | | $ | (179,062 | ) | | $ | 802,838 | |
| Cumulative interest sensitivity gap | | $ | 495,935 | | | $ | 585,196 | | | $ | 981,900 | | | $ | 802,838 | | | | | |
| Cumulative interest sensitivity gap | | | | | | | | | | | | | | | | | | | | |
| as a percentage of total assets | | | 20 | % | | | 24 | % | | | 40 | % | | | 33 | % | | | | |
| 1 | | Equity investments have been placed in the 0-3 month category. |
| 2 | | Repricing is based on anticipated call dates and may vary from contractual maturities. |
| 3 | | Repricing is based on estimated average lives. |
Certain shortcomings are inherent in the method of analysis presented in the foregoing table. For example, savings, interest bearing demand and money market deposit accounts will very likely experience a change in deposit rates more frequently than in their estimated average lives. Additionally, although certain assets and liabilities may have similar maturities and periods of repricing, they may react differently to changes in market interest rates and be impacted by loans that have reached their floor. Also, interest rates on assets and liabilities may fluctuate in advance of changes in market interest rates, while interest rates on other assets and liabilities may follow changes in market interest rates. Given these shortcomings, management believes that rate risk is best measured by simulation modeling as opposed to measuring interest rate risk through interest rate gap measurement.
53
ITEM 8. FINANCIAL STATEMENTS AND SUPPLEMENTARY DATA
The following audited consolidated financial statements and related documents are set forth in this Annual Report on Form 10-K on the pages indicated:
| REPORT OF INDEPENDENT REGISTERED PUBLIC ACCOUNTING FIRM | | 55 |
| CONSOLIDATED BALANCE SHEETS | | 56 |
| CONSOLIDATED STATEMENTS OF INCOME (LOSS) | | 57 |
| CONSOLIDATED STATEMENTS OF COMPREHENSIVE INCOME (LOSS) | | 58 |
| CONSOLIDATED STATEMENTS OF CASH FLOWS | | 59 |
| CONSOLIDATED STATEMENTS OF CHANGES IN STOCKHOLDERS’ EQUITY | | 60 |
| NOTES TO CONSOLIDATED FINANCIAL STATEMENTS | | 61 |
54
REPORT OF INDEPENDENT REGISTERED PUBLIC ACCOUNTING FIRM
To the Board of Directors and Stockholders of
West Coast Bancorp
Lake Oswego, Oregon
We have audited the accompanying consolidated balance sheets of West Coast Bancorp and subsidiaries (the “Company”) as of December 31, 2011 and 2010, and the related consolidated statements of income (loss), comprehensive income (loss), changes in stockholders' equity, and cash flows for each of the three years in the period ended December 31, 2011. These consolidated financial statements are the responsibility of the Company's management. Our responsibility is to express an opinion on these consolidated financial statements based on our audits.
We conducted our audits in accordance with the standards of the Public Company Accounting Oversight Board (United States). Those standards require that we plan and perform the audit to obtain reasonable assurance about whether the consolidated financial statements are free of material misstatement. An audit includes examining, on a test basis, evidence supporting the amounts and disclosures in the consolidated financial statements. An audit also includes assessing the accounting principles used and significant estimates made by management, as well as evaluating the overall financial statement presentation. We believe that our audits provide a reasonable basis for our opinion.
In our opinion, such consolidated financial statements present fairly, in all material respects, the financial position of West Coast Bancorp and subsidiaries as of December 31, 2011 and 2010, and the results of their operations and their cash flows for each of the three years in the period ended December 31, 2011, in conformity with accounting principles generally accepted in the United States of America.
We have also audited, in accordance with the standards of the Public Company Accounting Oversight Board (United States), the Company's internal control over financial reporting as of December 31, 2011, based on the criteria established inInternal Control — Integrated Framework issued by the Committee of Sponsoring Organizations of the Treadway Commission and our report dated February 24, 2012 expressed an unqualified opinion on the Company's internal control over financial reporting.
/s/ DELOITTE & TOUCHE LLP
Portland, Oregon
February 24, 2012
55
WEST COAST BANCORP
CONSOLIDATED BALANCE SHEETS
| As of December 31 (Dollars and shares in thousands) | | 2011 | | 2010 |
| ASSETS | | | | | | | | |
| |
| Cash and cash equivalents: | | | | | | | | |
| Cash and due from banks | | $ | 59,955 | | | $ | 42,672 | |
| Federal funds sold | | | 4,758 | | | | 3,367 | |
| Interest-bearing deposits in other banks | | | 27,514 | | | | 131,952 | |
| Total cash and cash equivalents | | | 92,227 | | | | 177,991 | |
| Trading securities | | | 747 | | | | 808 | |
| Investment securities available for sale, at fair value | | | | | | | | |
| (amortized cost: $717,593 and $645,246, respectively) | | | 729,844 | | | | 646,112 | |
| Federal Home Loan Bank stock, held at cost | | | 12,148 | | | | 12,148 | |
| Loans held for sale | | | 3,281 | | | | 3,102 | |
| Loans | | | 1,501,301 | | | | 1,536,270 | |
| Allowance for loan losses | | | (35,212 | ) | | | (40,217 | ) |
| Loans, net | | | 1,466,089 | | | | 1,496,053 | |
| Premises and equipment, net | | | 24,374 | | | | 26,774 | |
| Other real estate owned, net | | | 30,823 | | | | 39,459 | |
| Core deposit intangible, net | | | - | | | | 358 | |
| Bank owned life insurance | | | 26,228 | | | | 25,313 | |
| Other assets | | | 44,126 | | | | 32,941 | |
| Total assets | | $ | 2,429,887 | | | $ | 2,461,059 | |
| |
| LIABILITIES AND STOCKHOLDERS' EQUITY | | | | | | | | |
| |
| Deposits: | | | | | | | | |
| Demand | | $ | 621,962 | | | $ | 555,766 | |
| Savings and interest bearing demand | | | 495,117 | | | | 445,878 | |
| Money market | | | 625,373 | | | | 663,467 | |
| Time deposits | | | 173,117 | | | | 275,411 | |
| Total deposits | | | 1,915,569 | | | | 1,940,522 | |
| |
| Long-term borrowings | | | 120,000 | | | | 168,599 | |
| Junior subordinated debentures | | | 51,000 | | | | 51,000 | |
| Reserve for unfunded commitments | | | 771 | | | | 850 | |
| Other liabilities | | | 28,068 | | | | 27,528 | |
| Total liabilities | | | 2,115,408 | | | | 2,188,499 | |
| |
| Commitments and contingent liabilities (Notes 12 and 19) | | | | | | | | |
| |
| Stockholders' equity: | | | | | | | | |
| Preferred stock: no par value, 10,000 shares authorized; | | | | | | | | |
| Series B issued and outstanding: 121 at December 31, 2011 and December 31, 2010 | | | 21,124 | | | | 21,124 | |
| Common stock: no par value, 50,000 shares authorized; | | | | | | | | |
| issued and outstanding: 19,298 at December 31, 2011 and 19,286 at December 31, 2010 | | | 230,966 | | | | 229,722 | |
| Retained earnings | | | 54,952 | | | | 21,175 | |
| Accumulated other comprehensive income | | | 7,437 | | | | 539 | |
| Total stockholders' equity | | | 314,479 | | | | 272,560 | |
| Total liabilities and stockholders' equity | | $ | 2,429,887 | | | $ | 2,461,059 | |
See notes to consolidated financial statements.
56
WEST COAST BANCORP
CONSOLIDATED STATEMENTS OF INCOME (LOSS)
| Years ended December 31 (Dollars and shares in thousands, except per share amounts) | | 2011 | | 2010 | | 2009 |
| INTEREST INCOME: | | | | | | | | | | | | |
| Interest and fees on loans | | $ | 80,237 | | | $ | 88,409 | | | $ | 100,356 | |
| Interest on taxable investment securities | | | 16,177 | | | | 14,493 | | | | 8,646 | |
| Interest on nontaxable investment securities | | | 2,074 | | | | 2,175 | | | | 2,776 | |
| Interest on deposits in other banks | | | 184 | | | | 493 | | | | 366 | |
| Interest on federal funds sold | | | 3 | | | | 6 | | | | 6 | |
| Total interest income | | | 98,675 | | | | 105,576 | | | | 112,150 | |
| |
| INTEREST EXPENSE: | | | | | | | | | | | | |
| Savings, interest bearing demand deposits and money market | | | 2,074 | | | | 4,664 | | | | 9,684 | |
| Time deposits | | | 2,899 | | | | 7,466 | | | | 14,758 | |
| Short-term borrowings | | | 1,004 | | | | 494 | | | | 806 | |
| Long-term borrowings | | | 3,626 | | | | 6,176 | | | | 6,693 | |
| Borrowings prepayment charge | | | 7,140 | | | | 2,326 | | | | - | |
| Junior subordinated debentures | | | 1,178 | | | | 1,143 | | | | 1,482 | |
| Total interest expense | | | 17,921 | | | | 22,269 | | | | 33,423 | |
| Net interest income | | | 80,754 | | | | 83,307 | | | | 78,727 | |
| Provision for credit losses | | | 8,133 | | | | 18,652 | | | | 90,057 | |
| Net interest income (loss) after provision for credit losses | | | 72,621 | | | | 64,655 | | | | (11,330 | ) |
| |
| NONINTEREST INCOME: | | | | | | | | | | | | |
| Service charges on deposit accounts | | | 13,353 | | | | 15,690 | | | | 15,765 | |
| Payment systems related revenue | | | 12,381 | | | | 11,393 | | | | 9,399 | |
| Trust and investment services revenue | | | 4,503 | | | | 4,267 | | | | 4,101 | |
| Gains on sales of loans | | | 1,335 | | | | 1,197 | | | | 1,738 | |
| Other real estate owned valuation adjustments and (loss) gain on sales | | | (3,236 | ) | | | (4,415 | ) | | | (26,953 | ) |
| Gain (loss) on securities, net: | | | | | | | | | | | | |
| Gains on sales of securities, net | | | 713 | | | | 1,562 | | | | 833 | |
| Other-than-temporary impairment losses on securities | | | (1,636 | ) | | | - | | | | (6,738 | ) |
| Portion of other-than-temporary, non-credit related losses | | | | | | | | | | | | |
| recognized in other comprehensive income | | | 1,457 | | | | - | | | | 6,546 | |
| Total net gains on securities | | | 534 | | | | 1,562 | | | | 641 | |
| Other noninterest income | | | 2,949 | | | | 3,003 | | | | 4,438 | |
| Total noninterest income | | | 31,819 | | | | 32,697 | | | | 9,129 | |
| |
| NONINTEREST EXPENSE: | | | | | | | | | | | | |
| Salaries and employee benefits | | | 48,587 | | | | 45,854 | | | | 44,608 | |
| Equipment | | | 6,113 | | | | 6,247 | | | | 8,120 | |
| Occupancy | | | 8,674 | | | | 8,894 | | | | 9,585 | |
| Payment systems related expense | | | 5,141 | | | | 4,727 | | | | 4,036 | |
| Professional fees | | | 4,118 | | | | 3,991 | | | | 4,342 | |
| Postage, printing and office supplies | | | 3,265 | | | | 3,148 | | | | 3,201 | |
| Marketing | | | 3,003 | | | | 3,086 | | | | 2,990 | |
| Communications | | | 1,549 | | | | 1,525 | | | | 1,574 | |
| Goodwill impairment | | | - | | | | - | | | | 13,059 | |
| Other noninterest expense | | | 10,425 | | | | 12,865 | | | | 16,773 | |
| Total noninterest expense | | | 90,875 | | | | 90,337 | | | | 108,288 | |
| |
| INCOME (LOSS) BEFORE INCOME TAXES | | | 13,565 | | | | 7,015 | | | | (110,489 | ) |
| PROVISION (BENEFIT) FOR INCOME TAXES | | | (20,212 | ) | | | 3,790 | | | | (19,276 | ) |
| NET INCOME (LOSS) | | $ | 33,777 | | | $ | 3,225 | | | $ | (91,213 | ) |
| |
| Basic earnings (loss) per share | | $ | 1.65 | | | $ | 0.16 | | | | ($29.15 | ) |
| Diluted earnings (loss) per share | | $ | 1.58 | | | $ | 0.16 | | | | ($29.15 | ) |
| |
| Weighted average common shares | | | 19,007 | | | | 17,460 | | | | 3,102 | |
| Weighted average diluted shares | | | 19,940 | | | | 18,059 | | | | 3,102 | |
57
WEST COAST BANCORP
CONSOLIDATED STATEMENTS OF COMPREHENSIVE INCOME (LOSS)
| Years ended December 31 (Dollars in thousands) | | 2011 | | 2010 | | 2009 |
| Net income (loss) | | | | | $ | 33,777 | | | | | $ | 3,225 | | | | | $ | (91,213 | ) |
| Other comprehensive income, net of tax: | | | | | | | | | | | | | | | | | | | |
| Unrealized holding gains on securities: | | | | | | | | | | | | | | | | | | | |
| Unrealized holding gains arising during the year | | 11,920 | | | | | | 4,766 | | | | | | 4,082 | | | | | |
| Tax provision | | (4,695 | ) | | | | | (1,888 | ) | | | | | (1,538 | ) | | | | |
| Unrealized holding gains arising during the year, net of tax | | 7,225 | | | | | | 2,878 | | | | | | 2,544 | | | | | |
| |
| Less: Reclassification adjustment for net other-than-temporary | | | | | | | | | | | | | | | | | | | |
| impairment losses on securities | | 179 | | | | | | - | | | | | | 192 | | | | | |
| Tax benefit | | (70 | ) | | | | | - | | | | | | (74 | ) | | | | |
| Net impairment losses on securities, net of tax | | 109 | | | | | | - | | | | | | 118 | | | | | |
| |
| Less: Reclassification adjustment for net | | | | | | | | | | | | | | | | | | | |
| gains on sales of securities | | (713 | ) | | | | | (1,562 | ) | | | | | (833 | ) | | | | |
| Tax provision | | 277 | | | | | | 609 | | | | | | 320 | | | | | |
| Net realized gains, net of tax | | (436 | ) | | | | | (953 | ) | | | | | (513 | ) | | | | |
| Other comprehensive income, net of tax | | | | | | 6,898 | | | | | | 1,925 | | | | | | 2,149 | |
| Total net comprehensive income (loss) | | | | | $ | 40,675 | | | | | $ | 5,150 | | | | | $ | (89,064 | ) |
See notes to consolidated financial statements.
58
WEST COAST BANCORP
CONSOLIDATED STATEMENTS OF CASH FLOWS
| Years ended December 31 (Dollars in thousands) | | 2011 | | 2010 | | 2009 |
| CASH FLOWS FROM OPERATING ACTIVITIES: | | | | | | | | | | | | |
| Net income (loss) | | $ | 33,777 | | | $ | 3,225 | | | $ | (91,213 | ) |
| Adjustments to reconcile net income (loss) to net cash provided by operating activities: | | | | | | | | | | | | |
| Depreciation, amortization and accretion | | | 8,994 | | | | 8,778 | | | | 8,281 | |
| Amortization of tax credits | | | 848 | | | | 1,085 | | | | 1,320 | |
| Deferred income tax provision (benefit) | | | (21,661 | ) | | | (2,540 | ) | | | 11,926 | |
| Amortization of intangibles | | | 358 | | | | 279 | | | | 358 | |
| Provision for credit losses | | | 8,133 | | | | 18,652 | | | | 90,057 | |
| Goodwill impairment | | | - | | | | - | | | | 13,059 | |
| Decrease in accrued interest receivable | | | 158 | | | | 892 | | | | 591 | |
| Decrease (increase) in other assets | | | 1,740 | | | | 30,070 | | | | (15,350 | ) |
| Net other-than-temporary impairment losses on securities | | | 179 | | | | - | | | | 192 | |
| Gains on sales of securities, net | | | (713 | ) | | | (1,562 | ) | | | (833 | ) |
| Net loss on disposal of premises and equipment | | | 1,219 | | | | 61 | | | | 186 | |
| Net other real estate owned valuation adjustments and loss (gain) on sales | | | 3,236 | | | | 4,415 | | | | 26,953 | |
| Gains on sale of loans | | | (1,335 | ) | | | (1,197 | ) | | | (1,738 | ) |
| Origination of loans held for sale | | | (40,815 | ) | | | (34,927 | ) | | | (66,485 | ) |
| Proceeds from sales of loans held for sale | | | 41,971 | | | | 34,198 | | | | 69,907 | |
| Increase (decrease) in interest payable | | | (2,164 | ) | | | 504 | | | | 359 | |
| Increase (decrease) in other liabilities | | | (1,024 | ) | | | 1,294 | | | | 3,345 | |
| Increase in cash surrender value of bank owned life insurance | | | (915 | ) | | | (896 | ) | | | (892 | ) |
| Stock based compensation expense | | | 1,899 | | | | 2,089 | | | | 1,520 | |
| Excess tax benefit associated with stock plans | | | (66 | ) | | | - | | | | - | |
| Decrease (increase) in trading securities | | | 61 | | | | (77 | ) | | | 815 | |
| Net cash provided by operating activities | | | 33,880 | | | | 64,343 | | | | 52,358 | |
| |
| CASH FLOWS FROM INVESTING ACTIVITIES: | | | | | | | | | | | | |
| Proceeds from maturities of available for sale securities | | | 298,490 | | | | 288,050 | | | | 69,140 | |
| Proceeds from sales of available for sale securities | | | 45,283 | | | | 77,551 | | | | 36,189 | |
| Purchase of available for sale securities | | | (421,154 | ) | | | (449,665 | ) | | | (467,360 | ) |
| Purchase of Federal Home Loan Bank stock | | | - | | | | - | | | | (1,305 | ) |
| Investments in tax credits | | | - | | | | - | | | | (9 | ) |
| Loans made to customers less than principal collected on loans | | | 692 | | | | 138,459 | | | | 185,293 | |
| Proceeds from the sale of other real estate owned | | | 27,062 | | | | 38,106 | | | | 68,670 | |
| Capital expenditures on other real estate owned | | | (528 | ) | | | (3,234 | ) | | | (4,881 | ) |
| Capital expenditures on premises and equipment | | | (2,216 | ) | | | (2,265 | ) | | | (1,275 | ) |
| Net cash provided (used) by investing activities | | | (52,371 | ) | | | 87,002 | | | | (115,538 | ) |
| |
| CASH FLOWS FROM FINANCING ACTIVITIES: | | | | | | | | | | | | |
| Net increase in demand, savings and interest | | | | | | | | | | | | |
| bearing transaction accounts | | | 84,050 | | | | 42,752 | | | | 182,273 | |
| Net decrease in time deposits | | | (102,294 | ) | | | (249,114 | ) | | | (59,768 | ) |
| Proceeds from issuance of short-term borrowings | | | 168,918 | | | | - | | | | 347,600 | |
| Repayment of short-term borrowings | | | (208,118 | ) | | | (17,600 | ) | | | (479,600 | ) |
| Proceeds from issuance of long-term borrowings | | | 120,000 | | | | 4,400 | | | | 192,240 | |
| Repayment of long-term borrowings | | | (129,399 | ) | | | (81,500 | ) | | | (20,000 | ) |
| Proceeds from issuance of preferred stock, net of costs | | | - | | | | - | | | | 139,248 | |
| Proceeds from secured borrowings | | | - | | | | 7,991 | | | | - | |
| Proceeds from issuance of common stock-Rights Offering | | | - | | | | 10,000 | | | | - | |
| Costs of issuance of common stock-Rights Offering | | | - | | | | (650 | ) | | | - | |
| Proceeds from issuance of common stock-Discretionary Program | | | - | | | | 7,856 | | | | - | |
| Costs of issuance of common stock-Discretionary Program | | | - | | | | (817 | ) | | | - | |
| Activity in deferred compensation plan | | | (27 | ) | | | 262 | | | | (1 | ) |
| Proceeds from issuance of common stock-stock options | | | 80 | | | | 4 | | | | - | |
| Fractional share payment | | | (18 | ) | | | - | | | | - | |
| Redemption of stock pursuant to stock plans | | | (531 | ) | | | (35 | ) | | | (22 | ) |
| Excess tax benefits associated with stock plans | | | 66 | | | | - | | | | - | |
| Cash dividends paid | | | - | | | | - | | | | (471 | ) |
| Net cash provided (used) by financing activities | | | (67,273 | ) | | | (276,451 | ) | | | 301,499 | |
| |
| NET INCREASE (DECREASE) IN CASH AND CASH EQUIVALENTS | | | (85,764 | ) | | | (125,106 | ) | | | 238,319 | |
| CASH AND CASH EQUIVALENTS AT BEGINNING OF YEAR | | | 177,991 | | | | 303,097 | | | | 64,778 | |
| CASH AND CASH EQUIVALENTS AT END OF YEAR | | $ | 92,227 | | | $ | 177,991 | | | $ | 303,097 | |
See notes to consolidated financial statements.
59
WEST COAST BANCORP
CONSOLIDATED STATEMENTS OF CHANGES IN STOCKHOLDERS’ EQUITY
| | | | | | | | | | | | | | | | Accumulated | | | | |
| | | | | | | | | | | | | | | | Other | | | | |
| (Shares and dollars in thousands) | | Preferred | | Common Stock | | Retained | | Comprehensive | | | | |
| | | Stock | | Shares | | Amount | | Earnings | | Income (Loss) | | Total |
| BALANCE, January 1, 2009 | | - | | | 3,139 | | | | 92,245 | | | | 107,542 | | | | (1,600 | ) | | | 198,187 | |
| |
| Net loss | | - | | | - | | | | - | | | | (91,213 | ) | | | - | | | $ | (91,213 | ) |
| Other comprehensive income, net of tax: | | - | | | - | | | | - | | | | - | | | | 2,149 | | | | 2,149 | |
| Cumulative effect of adopting ASC 320 | | - | | | - | | | | - | | | | 1,935 | | | | (1,935 | ) | | | - | |
| Cash dividends, $.10 per common share | | - | | | - | | | | - | | | | (314 | ) | | | - | | | | (314 | ) |
| Redemption of stock pursuant to stock plans | | - | | | (2 | ) | | | (22 | ) | | | - | | | | - | | | | (22 | ) |
| Issuance of Series A preferred stock, net of costs | | 118,124 | | | - | | | | - | | | | - | | | | - | | | | 118,124 | |
| |
| Issuance of Series B preferred stock and warrant, net of costs | | 21,124 | | | - | | | | - | | | | - | | | | - | | | | 21,124 | |
| Activity in deferred compensation plan | | - | | | (9 | ) | | | (1 | ) | | | - | | | | - | | | | (1 | ) |
| Stock based compensation expense | | - | | | - | | | | 1,520 | | | | - | | | | - | | | | 1,520 | |
| Tax adjustment associated with stock plans | | - | | | - | | | | (496 | ) | | | - | | | | - | | | | (496 | ) |
| BALANCE, December 31, 2009 | | 139,248 | | | 3,128 | | | | 93,246 | | | | 17,950 | | | | (1,386 | ) | | $ | 249,058 | |
| |
| Net income | | - | | | - | | | | - | | | | 3,225 | | | | - | | | $ | 3,225 | |
| Other comprehensive income, net of tax: | | - | | | - | | | | - | | | | - | | | | 1,925 | | | | 1,925 | |
| Redemption of stock pursuant to stock plans | | - | | | (12 | ) | | | (35 | ) | | | - | | | | - | | | | (35 | ) |
| Conversion of Series A preferred stock | | (118,124 | ) | | 14,288 | | | | 118,124 | | | | - | | | | - | | | | - | |
| Issuance of common stock-Rights Offering, | | | | | | | | | | | | | | | | | | | | | | |
| net of costs | | | | | 1,000 | | | | 9,350 | | | | - | | | | - | | | | 9,350 | |
| Issuance of common stock-Discretionary Program, | | | | | | | | | | | | | | | | | | | | | | |
| net of costs | | | | | 561 | | | | 7,039 | | | | - | | | | - | | | | 7,039 | |
| Activity in deferred compensation plan | | - | | | (3 | ) | | | 262 | | | | - | | | | - | | | | 262 | |
| Issuance of common stock-stock options | | - | | | 1 | | | | 4 | | | | - | | | | - | | | | 4 | |
| Issuance of common stock-restricted stock | | - | | | 323 | | | | - | | | | - | | | | - | | | | - | |
| Stock based compensation expense | | - | | | - | | | | 2,089 | | | | - | | | | - | | | | 2,089 | |
| Tax adjustment associated with stock plans | | - | | | - | | | | (357 | ) | | | - | | | | - | | | | (357 | ) |
| BALANCE, December 31, 2010 | | 21,124 | | | 19,286 | | | $ | 229,722 | | | $ | 21,175 | | | $ | 539 | | | $ | 272,560 | |
| |
| Net income | | - | | | - | | | | - | | | | 33,777 | | | | - | | | $ | 33,777 | |
| Other comprehensive income, net of tax | | - | | | - | | | | - | | | | - | | | | 6,898 | | | | 6,898 | |
| Redemption of stock pursuant to stock plans | | - | | | (55 | ) | | | (531 | ) | | | - | | | | - | | | | (531 | ) |
| Activity in deferred compensation plan | | - | | | (3 | ) | | | (27 | ) | | | - | | | | - | | | | (27 | ) |
| Issuance of common stock-stock options | | - | | | 7 | | | | 80 | | | | - | | | | - | | | | 80 | |
| Issuance of common stock-restricted stock | | - | | | 64 | | | | - | | | | - | | | | - | | | | - | |
| Stock based compensation expense | | - | | | - | | | | 1,899 | | | | - | | | | - | | | | 1,899 | |
| Tax adjustment associated with stock plans | | - | | | - | | | | (159 | ) | | | - | | | | - | | | | (159 | ) |
| Fractional share payment | | - | | | (1 | ) | | | (18 | ) | | | - | | | | - | | | | (18 | ) |
| BALANCE, December 31, 2011 | | 21,124 | | | 19,298 | | | $ | 230,966 | | | $ | 54,952 | | | $ | 7,437 | | | $ | 314,479 | |
See notes to consolidated financial statements.
60
WEST COAST BANCORP
NOTES TO CONSOLIDATED FINANCIAL STATEMENTS
1. SUMMARY OF SIGNIFICANT ACCOUNTING POLICIES
Nature of Operations. West Coast Bancorp (“Bancorp” or “the Company”) provides a full range of financial services including lending and depository services through West Coast Bank and its 60 branch banking offices in Oregon and Washington. West Coast Trust Company, Inc. (“West Coast Trust”) provides fiduciary, agency, trust and related services, and life insurance products.
Principles of Consolidation.The accompanying consolidated financial statements include the accounts of Bancorp, and its wholly-owned subsidiaries, West Coast Bank (the “Bank”), West Coast Trust and Totten, Inc., after elimination of material intercompany transactions and balances. West Coast Statutory Trusts III, IV, V, VI, VII and VIII are considered related parties to Bancorp and their financial results are not consolidated in Bancorp’s financial statements. Junior subordinated debentures issued by the Company to West Coast Statutory Trusts are included on the Company’s balance sheet as junior subordinated debentures.
Basis of Financial Statement Presentation and the Use of Estimates in the Financial Statements. The accompanying consolidated financial statements have been prepared in accordance with accounting principles generally accepted in the United States (“GAAP”) and with prevailing practices within the banking and securities industries. Management is required to make certain estimates and assumptions when preparing the financial statements that affect the reported amounts of assets and liabilities and disclosure of contingent assets and liabilities as of the date of the balance sheet and the amounts of income and expense for the reporting period. Actual results could differ significantly from management’s estimates. Certain material estimates subject to significant change relate to the determination of the allowance for credit losses, the provision or benefit for income taxes, and the fair value of investments and other real estate owned. Immaterial reclassifications related to prior year amounts of excess tax deficiencies associated with stock plans in the operating activities section of the consolidated statement of cash flows have been made to conform to current presentation.
Subsequent Events.The Company has evaluated events and transactions for potential recognition or disclosure through the day the financial statements were issued.
Cash and Cash Equivalents. Cash and cash equivalents include cash on hand, interest bearing deposits in other banks, amounts due from banks and federal funds sold. Generally, federal funds are purchased or sold for one-day periods.
Reverse Stock Split.On May 19, 2011, Bancorp implemented a one-for-five reverse split of its common stock (the "Reverse Stock Split"), pursuant to an amendment to its Restated Articles of Incorporation approved by shareholders at the Company’s annual meeting of shareholders held on April 26, 2011. All share and per share related amounts in this report have been restated to reflect the Reverse Stock Split.
As a result of the Reverse Stock Split, every five shares of the Company's common stock issued and outstanding at the end of the effective date of May 19, 2011, were combined and reclassified into 1 share of common stock. Bancorp did not issue fractional shares of common stock and paid cash in lieu of fractional shares resulting from the Reverse Stock Split. Cash payments for fractional shares were determined on the basis of the stock's average closing price on the NASDAQ Global Select Market for the five trading days immediately preceding May 19, 2011, as adjusted for the Reverse Stock Split.
As a result of the Reverse Stock Split, the number of outstanding shares of common stock declined from 96.4 million shares to 19.3 million shares. The number of authorized shares of common stock was reduced from 250 million to 50 million. Proportional adjustments have also been made to the conversion or exercise rights under the Company's outstanding stock incentive plans, preferred stock, restricted stock, stock options and warrants.
61
1. SUMMARY OF SIGNIFICANT ACCOUNTING POLICIES
Supplemental Cash Flow Information.The following table presents supplemental cash flow information for the years ended December 31, 2011, 2010, and 2009.
| (Dollars in thousands) | | December 31, |
| | 2011 | | 2010 | | 2009 |
| Supplemental cash flow information: | | | | | | | | | | | | |
| Cash (received) paid in the year for: | | | | | | | | | | | | |
| Interest | | $ | 20,085 | | | $ | 21,765 | | | $ | 33,063 | |
| Income taxes, net | | | 6,550 | | | | (27,742 | ) | | | (14,585 | ) |
| |
| Noncash investing and financing activities: | | | | | | | | | | | | |
| Change in unrealized gain on available | | | | | | | | | | | | |
| for sale securities, net of tax | | $ | 6,898 | | | $ | 1,925 | | | $ | 2,149 | |
| Sale of SBA loans - transfer to other assets | | | - | | | | 7,991 | | | | - | |
| Settlement of secured borrowings | | | (3,085 | ) | | | (4,906 | ) | | | - | |
| Transfer of long term debt to short term debt | | | 39,200 | | | | 5,000 | | | | - | |
| OREO and premises and equipment expenditures | | | | | | | | | | | | |
| accrued in other liabilities | | | 111 | | | | 74 | | | | 242 | |
| Transfer of loans to OREO | | | 21,139 | | | | 25,199 | | | | 74,174 | |
Trading Securities.Debt and equity securities that are bought and held principally for the purpose of selling them in the near term are classified as trading securities and reported at fair value, with realized and unrealized gains and losses included in noninterest income. Trading securities held at December 31, 2011, and 2010, are related solely to assets held in a rabbi trust for the benefit of the Company’s deferred compensation plans.
Investment Securities Available for Sale.Investment securities classified as available for sale are not trading securities but may be sold before maturity in response to changes in the Company’s interest rate risk profile, funding needs or demand for collateralized deposits by public entities. Available for sale securities are carried at fair value with unrealized gains and losses, net of any tax effect, reported within accumulated other comprehensive income (loss) in stockholders’ equity. Premiums and discounts are amortized or accreted over the estimated life of the investment security as an adjustment to the yield. For purposes of computing realized gains and losses, the cost of securities sold is determined using the specific identification method. The Company analyzes investment securities for other-than-temporary impairment (“OTTI”) on a quarterly basis. For equity securities where declines in fair value are deemed other-than-temporary and the Company does not have the ability and intent to hold the securities until recovery, OTTI is recognized in noninterest income. The Company considers whether a debt security will be sold or if it is likely to be required to be sold prior to the recovery of any unrealized loss. Intent to sell or a requirement to sell debt securities prior to recovery would result in recognizing the entire impairment as OTTI in noninterest income. If the Company does not intend to sell impaired debt securities, will not be required to sell them prior to recovery, and the Company does not expect to recover its entire amortized cost basis of the securities, the portion of impairment loss specifically related to credit losses is recognized in noninterest income. The portion of impairment loss related to all other factors is recognized as a separate category in other comprehensive income (loss).
Valuation of Investment Securities Available for Sale. Investment securities are valued utilizing a number of methods including quoted prices in active markets, quoted prices for similar assets, quoted prices for securities in inactive markets and inputs derived principally from or corroborated by observable market data by correlation or other means. In addition, certain investment securities are valued based on the Company’s own assumptions using the best information available using a discounted cash flow model.
Federal Home Loan Bank Stock.Federal Home Loan Bank of Seattle (the “FHLB”) stock is carried at cost which equals its par value because the shares can only be redeemed with the FHLB at par and it lacks a market. The Bank is required to maintain a minimum level of investment in FHLB stock based on specific percentages of its outstanding mortgages and FHLB advances. Stock redemptions are at the discretion of the FHLB or of the Company, upon prior notice to the FHLB of five years for FHLB B stock or six months for FHLB A stock. The Bank considers FHLB stock a restricted security. The Company periodically analyzes FHLB stock for OTTI. The evaluation of OTTI on FHLB stock is based on an assessment of the ultimate recoverability of cost rather than recognizing temporary declines in value. The determination of whether a decline affects the ultimate recoverability of cost is influenced by criteria such as (a) the significance of any decline in net assets of the FHLB as compared to the capital stock amount for the FHLB and the length of time this situation has persisted, (b) commitments by the FHLB to make payments required by law or regulation and the level of such payments in relation to the operating performance of the FHLB, (c) the impact of legislative and regulatory changes on institutions and, accordingly, the customer base of the FHLB, and (d) the liquidity position of the FHLB. The Company analyzed FHLB stock for OTTI and concluded that no impairment exists at December 31, 2011.
62
1. SUMMARY OF SIGNIFICANT ACCOUNTING POLICIES
Loans Held for Sale.Loans held for sale includes mortgage loans that are carried at the lower of cost or market value. Market value generally approximates cost because of the short duration these assets are held by us. Gains and infrequent losses are recognized in the consolidated statement of income (loss) as the proceeds from sale less the net book value of the loan including unamortized fees and capitalized direct costs. Servicing rights are typically not retained. In addition, we originate loans to customers under Small Business Administration (“SBA”) programs that generally provide for SBA guarantees of 50% to 85% of each loan. We periodically sell the guaranteed portion of certain SBA loans to investors and retain the unguaranteed portion and servicing rights in our loan portfolio. SBA loans are recorded and held within the loan portfolio until designated to be sold. Gains on these sales are earned through the sale of the guaranteed portion of the loan for an amount in excess of the adjusted carrying value of the portion of the loan sold. We allocate the carrying value of such loans between the portion sold, the portion retained and a value assigned to the right to service the loan. The difference between the adjusted carrying value of the portion retained and the face amount of the portion retained is amortized to interest income over the life of the related loan using a straight-line method over the anticipated lives of the pool of SBA loans. We record a gain on sale of SBA loans at the date of transfer of the loan.
Loans.Loans are reported at the amount of unpaid principal balance outstanding net of unearned income and deferred fees and costs. Loan and commitment fees and certain direct loan origination costs are deferred and recognized over the life of the loan and/or commitment period as yield adjustments. Interest income on loans is accrued daily on the unpaid principal balance outstanding as earned.
Nonaccrual Loans.Loans (including impaired loans) are placed on nonaccrual status when the collection of interest or principal has become 90 days past due or is otherwise considered doubtful. When a loan is placed on nonaccrual status, the Company stops accruing interest and unpaid accrued interest is reversed. In addition, the Company stops amortizing deferred fees and costs. For certain real estate construction loans accrued unpaid interest as well as qualifying capitalized interest is reversed. When management determines that the ultimate collectability of principal is in doubt, cash receipts on nonaccrual loans are applied to reduce the principal balance on a cash-basis method until the loans qualify for return to interest accruing status. Loans are returned to interest accruing status when management expects collection of contractual loan payments and the borrower has demonstrated six months of compliance with the contractual terms of the loan.
63
1.SUMMARY OF SIGNIFICANT ACCOUNTING POLICIES
Impaired Loans.A loan is considered to be impaired when, based on current information and events, it is probable that the Company will be unable to collect all amounts due (both interest and principal) according to the contractual terms of the loan agreement. Impaired loans are measured based on the present value of expected future cash flows discounted at the loan’s effective interest rate or, as a practical expedient, at the loan’s observable market price or the fair market value of the collateral less selling costs if the loan is collateral dependent. For loans that are collateral dependent the Company charges off the amount of impairment at the time of impairment, rather than placing the impaired loan amount in a specific reserve allowance. Known impairments on non-real estate secured loans are charged off immediately rather than recording a specific reserve allowance in the allowance for loan losses.
Troubled Debt Restructurings.A loan is accounted for as a troubled debt restructuring if the Company, for economic or legal reasons related to the borrower’s financial difficulties, grants a concession to the borrower that it would not otherwise consider. A troubled debt restructuring typically involves a modification of terms such as a reduction of the stated interest rate or face amount of the loan, a reduction of accrued interest, or an extension of the maturity date(s) at a stated interest rate lower than the current market rate for a new loan with similar risk. Troubled debt restructurings are considered impaired loans and as such are measured based on the present value of expected future cash flows discounted at the loan’s effective interest rate or, as a practical expedient, at the loan’s observable market price or the fair market value of the collateral less selling costs if the loan is collateral dependent. Performing troubled debt restructurings not on nonaccrual status are measured based on the present value of expected future cash flows discounted at the loan’s effective interest rate based on a current documented evaluation supporting management’s expectation of performance.
Allowance for Credit Losses.The allowance for credit losses is comprised of two components, the allowance for loan losses and the reserve for unfunded commitments. The allowance for loan losses is a calculation applied to outstanding loan balances, while the reserve for unfunded commitments is based upon a calculation applied to that portion of total loan commitments not yet funded for the period reported.
The allowance for credit losses is based on management’s estimates. Management determines the adequacy of the allowance for credit losses based on evaluations of the loan portfolio, recent loss experience and other factors, including economic conditions. The Company determines the amount of the allowance for credit losses required for certain sectors based on relative risk characteristics of the loan portfolio. Actual losses may vary from current estimates. These estimates are reviewed periodically and, as adjustments become necessary, are reported in earnings in the periods in which they become known. The allowance for credit losses is increased by provisions for credit losses in earnings. Loan charge-offs reduce the allowance while recoveries are credited to the allowance.
Commitments to Extend Credit.Unfunded loan commitments are generally related to providing credit facilities to customers of the bank and are not actively traded financial instruments. These unfunded commitments are disclosed as commitments to extend credit in Note 19 “Financial Instruments with Off Balance Sheet Risk” in the notes to consolidated financial statements.
Reserve for Unfunded Commitments.As a component of allowance for credit losses, a reserve for unfunded commitments is maintained at a level that, in the opinion of management, is adequate to absorb losses associated with the Bank’s commitment to lend funds under existing agreements such as letters or lines of credit or construction loans. Management determines the adequacy of the reserve for unfunded commitments based upon reviews of individual credit facilities, current economic conditions, the risk characteristics of the various categories of commitments as well as pooled commitments with similar risk characteristics and other relevant factors. The reserve is based on estimates, and ultimate losses may vary from the current estimates. These estimates are evaluated on a regular basis and, as adjustments become necessary, they are reported in the provision for credit losses in the income statement in the periods in which they become known.
Other Real Estate Owned (“OREO”).OREO is real property of which the Bank has taken possession or that has been deeded to the Bank through a deed-in-lieu of foreclosure, non-judicial foreclosure, judicial foreclosure or similar process in partial or full satisfaction of a loan or loans. In addition, the Bank owns a closed branch building that is considered OREO. OREO is initially recorded at the lower of the carrying amount of the loan or fair value of the property less estimated costs to sell. This amount becomes the property’s new basis. Management considers third party appraisals as well as independent fair market value assessments from realtors or persons involved in selling OREO in determining the fair value of particular properties. Accordingly, the valuation of OREO is subject to significant external and internal judgment. Management also periodically reviews OREO to determine whether the property continues to be carried at the lower of its recorded book value or fair value, net of estimated costs to sell. Any further OREO valuation adjustments or subsequent gains or losses on the final disposition of OREO are charged to other real estate owned valuation adjustments and (loss) gain on sales. Expenses from the maintenance and operations of OREO are included in other noninterest expense in the statements of income (loss).
64
1. SUMMARY OF SIGNIFICANT ACCOUNTING POLICIES
Premises and Equipment.Premises and equipment are stated at cost, less accumulated depreciation and amortization. Land is carried at cost. Depreciation is computed on the straight-line method over the estimated useful lives of the related assets. In general, furniture and equipment is amortized over a useful life of 3 to 10 years, software and computer related equipment is amortized over 3 to 5 years and buildings are amortized over periods up to 40 years. Leasehold improvements are amortized over the life of the related lease, or the life of the related assets, whichever is shorter. Expenditures for major renovations and betterments of the Company’s premises and equipment are capitalized. Improvements are capitalized and depreciated over their estimated useful lives. Minor repairs, maintenance and improvements are charged to operations as incurred. When property is replaced or otherwise disposed of, the cost of such assets and the related accumulated depreciation are removed from their respective accounts. Related gain or loss, if any, is recorded in current operations.
Goodwill and Intangible Assets.At March 31, 2009, based on management’s analysis and continued deteriorating economic conditions and the length of time and amount by which the Company’s book value per share had exceeded its market value per share, the Company determined it was appropriate to write off the entire $13.1 million of goodwill related to its acquisition of Mid-Valley Bank in June, 2006. The Company had no goodwill or intangible assets at December 31, 2011.
Income Taxes. Income taxes are accounted for using the asset and liability method. Under this method, a deferred tax asset or liability is determined based on the enacted tax rates that will be in effect when the differences between the financial statement carrying amounts and tax basis of existing assets and liabilities are expected to be reported in Bancorp’s income tax returns. The deferred tax provision (benefit) for the year is equal to the net change in the net deferred tax asset from the beginning to the end of the year, less amounts applicable to the change in value related to investment securities available for sale. The effect on deferred taxes of a change in tax rates is recognized in income in the period that includes the enactment date. The Company records net deferred tax assets to the extent these assets will more likely than not be realized. In making such determination, the Company assesses the available positive and negative evidence including future reversals of existing taxable temporary differences, projected future taxable income, tax planning strategies and recent financial results. A deferred tax asset valuation allowance is established to reduce the net carrying amount of deferred tax assets if it is determined to be more likely than not, that all or some portion of the potential deferred tax asset will not be realized. The Company’s accounting policy is to exclude deferred tax assets related to unrealized losses on its available for sale debt securities as these losses are expected to reverse and realization of the related deferred tax asset is not dependent on future taxable income. The Company determined that no deferred tax asset valuation allowance was required at December 31, 2011. It is the Company’s accounting policy to include interest expense and penalties related to income taxes as a component of provision (benefit) for income taxes. See Note 16 “Income taxes” of the notes to consolidated financial statements for more detail.
Operating Segments.Public enterprises are required to report certain information about their operating segments in the financial statements. The basis for determining the Company’s operating segments is the way in which management operates the businesses. Bancorp has identified two reportable segments, “banking” and “other” which include West Coast Trust. See Note 21, “Segment and Related Information” of the notes to consolidated financial statements for more detail.
Trust Company Assets.Assets (other than cash deposits) held by West Coast Trust in fiduciary or agency capacities for its trust customers are not included in the accompanying consolidated balance sheets, because such items are not assets of West Coast Trust.
Borrowings. Federal funds purchased and securities sold under agreements to repurchase generally mature within one to four days from the transaction date. Other short-term borrowed funds mature within one year from the date of this financial statement. Long-term borrowed funds extend beyond one year and are reclassed to short-term borrowings when the long term borrowed funds mature within one year and there is no intent to refinance.
Earnings (Loss) Per Share.Earnings (loss) per share is calculated under the two-class method. The two-class method is an earnings allocation formula that determines earnings (loss) per share for each class of common stock and participating security according to dividends declared (or accumulated) and participation rights in undistributed earnings. A participating security is an instrument that may participate in undistributed earnings with common stock. The Company has issued restricted stock that qualifies as a participating security. Basic earnings (loss) per share is computed by dividing net income (loss) available to common shareholders by the weighted average number of shares of common stock outstanding during the period. Diluted earnings (loss) per share is computed in the same manner as basic earnings (loss) per share except that the denominator is increased to include the number of additional common shares that would have been outstanding if certain shares issuable upon exercise of options, warrants, conversion of preferred stock, and unvested restricted stock were included unless those additional shares would have been anti-dilutive. For the diluted earnings (loss) per share computation, the treasury stock method is applied and compared to the two-class method and whichever method results in a more dilutive impact is utilized to calculate diluted earnings per share.
Service Charges on Deposit Accounts.Service charges on deposit accounts primarily represent monthly fees based on minimum balances or transaction-based fees. These fees are recognized as earned or as transactions occur and services are provided.
65
1. SUMMARY OF SIGNIFICANT ACCOUNTING POLICIES
Payment Systems Revenue.Payment systems revenue includes interchange income from credit and debit cards, annual fees, and other transaction and account management fees. Interchange income is a fee paid by a merchant bank to the card-issuing bank through the interchange network. Interchange fees are set by the credit card associations and are based on cardholder purchase volumes. The Company records interchange income as transactions occur. Transaction and account management fees are recognized as transactions occur or services are provided, except for annual fees, which are recognized over the applicable period. Volume-related payments to partners and credit card associations and expenses for rewards programs are also recorded within payment systems revenue. Payments to partners and expenses related to rewards programs are recorded when earned by the partner or customer. Merchant processing services revenue consists principally of transaction and account management fees charged to merchants for the electronic processing of transactions, net of interchange fees paid to the credit card issuing bank, card association assessments, and revenue sharing amounts, and are all recognized at the time the merchant’s transactions are processed or other services are performed. The Company may enter into revenue sharing agreements with referral partners or in connection with purchases of merchant contracts from sellers. The revenue sharing amounts are determined primarily on sales volume processed or revenue generated for a particular group of merchants. Merchant processing revenue also includes revenues related to point-of-sale equipment recorded as sales when the equipment is shipped or as earned for equipment rentals.
Trust and Investment Services Revenue.Trust and investment management fees are recognized over the period in which services are performed and are based on a percentage of the fair value of the assets under management or administration, fixed based on account type, or transaction-based fees.
New Accounting Pronouncements.In December 2010, the Financial Accounting Standards Board (“FASB”) issued guidance within the Accounting Standards Update (“ASU”) 2010-20 “Disclosures about the Credit Quality of Financing Receivables and the Allowance for Credit Losses.” ASU 2010-20 requires entities to provide disclosures designed to facilitate financial statement users’ evaluation of (i) the nature of credit risk inherent in the entity’s portfolio of financing receivables, (ii) how that risk is analyzed and assessed in arriving at the allowance for credit losses and (iii) the changes and reasons for those changes in the allowance for credit losses. Disclosures must be disaggregated by portfolio segment, the level at which an entity develops and documents a systematic method for determining its allowance for credit losses, and class of financing receivable, which is generally a disaggregation of portfolio segment. The required disclosures include, among other things, a roll forward of the allowance for credit losses as well as information about modified, impaired, nonaccrual and past due loans and credit quality indicators. ASU 2010-20 became effective for the Company’s financial statements as of December 31, 2010, as it relates to disclosures required as of the end of a reporting period. Disclosures that relate to activity during a reporting period are required for the Company’s financial statements that include periods beginning on or after January 1, 2011. The adoption of this guidance did not have any impact on the Company’s consolidated statement of income (loss), its consolidated balance sheet, or its consolidated statement of cash flows.
In April 2011, the FASB issued guidance within the ASU 2011-02 “A Creditor’s Determination of Whether a Restructuring is a Troubled Debt Restructuring.” ASU 2011-02 clarifies when a loan modification or restructuring is considered a troubled debt restructuring. The adoption of this guidance did not have a material impact on the Company’s consolidated statement of income (loss), its consolidated balance sheet, or its consolidated statement of cash flows.
In April 2011, the FASB issued guidance within the ASU 2011-04, “Amendments to Achieve Common Fair Value Measurement and Disclosure Requirements in U.S. GAAP and IFRSs”. This ASU amends existing guidance regarding the highest and best use and valuation assumption by clarifying these concepts are only applicable to measuring the fair value of nonfinancial assets. The ASU also clarifies that the fair value measurement of financial assets and financial liabilities which have offsetting market risks or counterparty credit risks that are managed on a portfolio basis, when several criteria are met, can be measured at the net risk position. Additional disclosures about Level 3 fair value measurements are required including a quantitative disclosure of the unobservable inputs and assumptions used in the measurement, a description of the valuation process in place, and discussion of the sensitivity of fair value changes in unobservable inputs and interrelationships about those inputs as well disclosure of the level of the fair value of items that are not measured at fair value in the financial statements but disclosure of fair value is required. ASU 2011-04 is effective for the Company’s reporting period beginning after December 15, 2011, and will be applied prospectively. The Company is currently evaluating the impact of this ASU and does not expect this guidance to have a material impact on the Company’s consolidated statement of income, its consolidated balance sheet, or its consolidated statement of cash flows.
In June 2011, the FASB issued guidance within ASU 2011-05, “Presentation of Comprehensive Income”. This ASU amends current guidance to allow a company the option of presenting the total of comprehensive income, the components of net income, and the components of other comprehensive income either in a single continuous statement of comprehensive income or in two separate but consecutive statements. The guidance does not change the items that must be reported in other comprehensive income or when an item of other comprehensive income must be reclassified to net income. The amendments do not change the option for a company to present components of other comprehensive income either net of related tax effects or before related tax effects, with one amount shown for the aggregate income tax expense (benefit) related to the total of other comprehensive income items. The amendments do not affect how earnings per share is calculated or presented. The provisions of ASU 2011-05 are effective for the Company’s reporting period beginning after December 15, 2011, and will be applied retrospectively. The Company has adopted this guidance and the adoption of this guidance did not have any impact on the Company’s consolidated statement of income (loss), its consolidated balance sheet, or its consolidated statement of cash flows.
66
2. INVESTMENT SECURITIES
The following table presents the available for sale investment securities as of December 31, 2011, and 2010:
| (Dollars in thousands) | | | | | | | | | | | | | |
| December 31, 2011 | | Amortized | | Unrealized | | Unrealized | | | |
| | Cost | | Gross Gains | | Gross Losses | | Fair Value |
| U.S. Treasury securities | | $ | 200 | | $ | 3 | | $ | - | | | $ | 203 |
| U.S. Government agency securities | | | 216,211 | | | 3,453 | | | (33 | ) | | | 219,631 |
| Corporate securities | | | 14,351 | | | - | | | (5,844 | ) | | | 8,507 |
| Mortgage-backed securities | | | 419,510 | | | 9,351 | | | (136 | ) | | | 428,725 |
| Obligations of state and political subdivisions | | | 56,003 | | | 4,736 | | | (7 | ) | | | 60,732 |
| Equity investments and other securities | | | 11,318 | | | 749 | | | (21 | ) | | | 12,046 |
| Total | | $ | 717,593 | | $ | 18,292 | | $ | (6,041 | ) | | $ | 729,844 |
| |
| (Dollars in thousands) | | | | | | | | | | | | | |
| December 31, 2010 | | Amortized | | Unrealized | | Unrealized | | | |
| | Cost | | Gross Gains | | Gross Losses | | Fair Value |
| U.S. Treasury securities | | $ | 14,347 | | $ | 45 | | $ | - | | | $ | 14,392 |
| U.S. Government agency securities | | | 193,901 | | | 836 | | | (507 | ) | | | 194,230 |
| Corporate securities | | | 14,499 | | | - | | | (5,107 | ) | | | 9,392 |
| Mortgage-backed securities | | | 359,965 | | | 5,853 | | | (2,200 | ) | | | 363,618 |
| Obligations of state and political subdivisions | | | 51,111 | | | 1,789 | | | (255 | ) | | | 52,645 |
| Equity investments and other securities | | | 11,423 | | | 437 | | | (25 | ) | | | 11,835 |
| Total | | $ | 645,246 | | $ | 8,960 | | $ | (8,094 | ) | | $ | 646,112 |
| | | | | | | | | | | | | |
At December 31, 2011, the estimated fair value of the investment portfolio was $729.8 million, an increase of $83.7 million or 13% from $646.1 million at year end 2010. The estimated net unrealized gain on the investment portfolio at December 31, 2011, was $12.3 million, or 1.7% of the total portfolio, compared to $.9 million and .1% respectively, at year end 2010. During 2011 the net unrealized gain on the mortgage-backed securities increased by $5.6 million to $9.2 million while the net unrealized gains in the U.S Government agency and obligations of state and political subdivisions categories increased by $3.1 million and $3.2 million, respectively.
At December 31, 2011, the corporate securities portfolio included four pooled trust preferred securities with amortized cost of $13.8 million and an estimated fair market value of $8.0 million resulting in an estimated $5.8 million unrealized loss. This unrealized loss was associated with the decline in market value since purchase of our investments in pooled trust preferred securities issued by banks and insurance companies. Continued wide credit and liquidity spreads contributed to the unrealized loss associated with these securities. These pooled trust preferred securities are rated C or better by the rating agencies that cover these securities and they have several features that reduce credit risk, including seniority over certain tranches in the same pool and the benefit of certain collateral coverage tests.
Gross realized gains on the sale of investment securities included in earnings in 2011, 2010, and 2009 were $1,022,000, $1,562,000, and $833,000, respectively. Gross realized losses were $309,000 in 2011 and there were no such losses in 2010 and 2009.
Dividends on equity investments for the years 2011, 2010, and 2009 were $100,000, $105,000, and $106,000, respectively.
67
During 2011, in terms of amortized cost, we increased our investment securities balance by $72.4 million principally due to our efforts reducing cash balances. The purchases over the past year were primarily of US Government agency securities with 3 to 5 year maturities and 10 to 15 year fully amortizing US Agency mortgage backed securities. Our U.S. Government agency securities increased by $25.4 million from December 31, 2010, to December 31, 2011, as part of our effort to maintain liquidity and portfolio diversification as well as to provide collateral for public funds and borrowing sources such as the FHLB.
Our mortgage-backed securities portfolio had a fair value of $428.7 million, an increase of $65.1 million from $363.6 one year ago. This segment of our portfolio primarily consists solely of U.S. Government agency ten and fifteen year fully amortizing mortgage backed securities with limited extension risk. This portfolio consisted of U.S. Agency backed mortgages with an amortized cost of $332.3 million and U.S. Government backed mortgage securities with an amortized cost of $87.3 million. Floating or adjustable rate securities represented $20.5 million of this portfolio while the remainder consisted of fixed rate securities. Ten and fifteen year pass-through mortgages with a projected average life of 3.1 years represented the majority of fixed rate securities with in this portfolio. Mortgage backed securities are subject to prepayment risk. Rising prepayments reduces the projected average life and accelerates the amortization of premium thus reducing the income from this portfolio. At December 31, 2011 the bank owned no privately issued mortgage backed securities.
Our portfolio of securities representing obligations of state and political subdivisions had a fair value of $60.7 million, with an amortized cost of $56.0 million, indicating an unrealized gain of $4.7 million.
At December 31, 2011, our equity and other investment securities had a fair value of $12.0 million and consisted of three investments in mutual fund shares and three investments in government backed Housing and Urban Development (“HUD”) Bonds. In addition to interest income, these investments provide the Bank with a Community Reinvestment Act (“CRA”) benefits.
68
2. INVESTMENT SECURITIES
The following tables provide the fair value and gross unrealized losses on securities available for sale, aggregated by category and length of time the individual securities have been in a continuous unrealized loss position:
| (Dollars in thousands) | | Less than 12 months | | 12 months or more | | Total |
| | | | | Unrealized | | | | | Unrealized | | | | | Unrealized |
| As of December 31, 2011 | | Fair Value | | Losses | | Fair Value | | Losses | | Fair Value | | Losses |
| U.S. Government agency securities | | $ | 14,627 | | $ | (33 | ) | | $ | - | | $ | - | | | | 14,627 | | | (33 | ) |
| Corporate securities | | | - | | | - | | | | 8,007 | | | (5,844 | ) | | | 8,007 | | | (5,844 | ) |
| Mortgage-backed securities | | | 26,416 | | | (130 | ) | | | 9,538 | | | (6 | ) | | | 35,954 | | | (136 | ) |
| Obligations of state and political subdivisions | | | 234 | | | (7 | ) | | | - | | | - | | | | 234 | | | (7 | ) |
| Equity and other securities | | | 598 | | | (2 | ) | | | 1,182 | | | (19 | ) | | | 1,780 | | | (21 | ) |
| Total | | $ | 41,875 | | $ | (172 | ) | | $ | 18,727 | | $ | (5,869 | ) | | $ | 60,602 | | $ | (6,041 | ) |
| |
| |
| (Dollars in thousands) | | Less than 12 months | | 12 months or more | | Total |
| | | | | Unrealized | | | | | Unrealized | | | | | Unrealized |
| As of December 31, 2010 | | Fair Value | | Losses | | Fair Value | | Losses | | Fair Value | | Losses |
| U.S. Government agency securities | | $ | 40,528 | | $ | (507 | ) | | $ | - | | $ | - | | | | 40,528 | | | (507 | ) |
| Corporate securities | | | - | | | - | | | | 8,892 | | | (5,107 | ) | | | 8,892 | | | (5,107 | ) |
| Mortgage-backed securities | | | 110,414 | | | (2,088 | ) | | | 978 | | | (112 | ) | | | 111,392 | | | (2,200 | ) |
| Obligations of state and political subdivisions | | | 4,084 | | | (255 | ) | | | - | | | - | | | | 4,084 | | | (255 | ) |
| Equity and other securities | | | 1,776 | | | (24 | ) | | | 1 | | | (1 | ) | | | 1,777 | | | (25 | ) |
| Total | | $ | 156,802 | | $ | (2,874 | ) | | $ | 9,871 | | $ | (5,220 | ) | | $ | 166,673 | | $ | (8,094 | ) |
| | | | | | | | | | | | | | | | | | | | | |
There were six investment securities with a 12 month or greater continuous unrealized loss in the investment portfolio at December 31, 2011, with a total unrealized loss of $5.9 million. In comparison, at December 31, 2010, there were six investment securities with a 12 month or greater continuous unrealized loss in the investment portfolio, with a total unrealized loss of $5.2 million. The unrealized loss on these investment securities was primarily due to continued increased credit and liquidity spreads and an extension of expected cash flow causing a decline in the fair market value of our pooled trust preferred securities (corporate security category). These securities had a fair value of $8.0 million compared to a $13.8 million amortized cost at December 31, 2011. The value of most of our securities fluctuates as market interest rates change.
There were a total of eight securities in Bancorp’s investment portfolio at December 31, 2011, that have been in a continuous unrealized loss position for less than 12 months, with an amortized cost of $42.0 million and a total unrealized loss of $.2 million. At December 31, 2010, there were a total of 28 securities in Bancorp’s investment portfolio that have been in a continuous unrealized loss position for less than 12 months, with an amortized cost of $159.7 million and a total unrealized loss of $2.9 million. The fair value of these securities fluctuates as market interest rates change.
69
2. INVESTMENT SECURITIES
Management reviews and evaluates the Company’s debt securities on an ongoing basis for the presence of other-than-temporary impairment (“OTTI”). Our analysis takes into consideration current market conditions, length and severity of impairment, extent and nature of the change in fair value, issuer ratings, and whether or not the Company intends to, or may be required to, sell debt securities before recovering any unrealized losses.
In the first quarter of 2009, the Company recorded OTTI charges totaling $.2 million pretax consisting of $.1 million relating to a Lehman Brothers bond held in our corporate securities portfolio and $.1 for the investment in Freddie Mac preferred stock held in our equity and other securities portfolio. Both of these investments were sold in the second quarter of 2009 for no additional gain or loss.
In the second quarter of 2011, the Company recorded a credit related OTTI charge of $.2 million pretax related to a pooled trust preferred security in our investment portfolio which also was placed on nonaccrual status at the same time. We do not intend to sell this security, and it is not likely that we will be required to sell this security, but we do not expect to recover the entire amortized cost basis of the security. The amount of OTTI related to credit losses recognized in earnings represents the amortized cost of the security that we do not expect to recover and is based on the estimated cash flow expected from the security, discounted by the estimated future coupon rates of the security. We estimate cash flows based on the performance of the underlying collateral for the security and the overall structure of the security. Factors considered in the performance of underlying collateral include current default and deferral rates, estimated future default, deferral and recovery rates, and prepayment rates. Factors considered in the overall structure of the security include the impact of the underlying collateral cash flow on debt coverage tests and subordination levels. The remaining impairment on this security that is related to all other factors is recognized in other comprehensive income. Given regulatory guidelines on expectation of full payment of interest and principal as well as extended principal in kind payments, this pooled trust preferred security was placed on nonaccrual status. In addition, in October 2011 the Company placed another pooled trust preferred security with principal in kind payments on nonaccrual status. While this security had an impairment loss of $1.6 million at December 31, 2011, based on our projections of future interest and principal payments, this security had no credit related OTTI as of December 31, 2011. At year end 2011, these securities were rated C or better by the rating agencies that cover these securities. They have several features that reduce credit risk, including seniority over certain tranches in the same pool and the benefit of certain collateral coverage tests.
The following table presents a summary of the significant inputs utilized to measure the other-than-temporary impairment related to credit losses associated with the above pooled trust preferred security at December 31, 2011 and 2010:
| (Dollars in thousands) | | | | | |
| December 31, 2011 | | December 31, 2010 |
| Default Rate | 0.75 | % | | 0.75 | % |
| Recovery Rate | 15.00 | % | | 15.00 | % |
| Prepayments | 1.00 | % | | 1.00 | % |
The following table presents information about the securities with OTTI losses for the years ended December 31, 2011, and 2010:
| (Dollars in thousands) | | | | | | | | | | | |
| | Year to date December 31, |
| | 2011 | | 2010 | | 2009 |
| Other-than-temporary impairment losses on securities | | $ | (1,636 | ) | | $ | - | | $ | (6,738 | ) |
| Portion of other-than temporary, non-credit related losses | | | | | | | | | | | |
| recognized in other comprehensive income | | | 1,457 | | | | - | | | 6,546 | |
| Net other-than-temporary impairment losses on securities | | $ | (179 | ) | | $ | - | | $ | (192 | ) |
70
2. INVESTMENT SECURITIES
The following table presents a tabular roll forward of the amount of credit related OTTI recognized in earnings for years ended December 31, 2011, and 2010:
| (Dollars in thousands) | | | | | | | |
| | Year ended December 31, |
| | 2011 | | | 2010 |
| Balance of net other-than-temporary impairment losses on securities, beginning of period | | $ | - | | | $ | - |
| Net other-than-temporary impairment losses on securities in the period | | | (179 | ) | | | - |
| Balance of net other-than-temporary impairment losses on securities, end of period | | $ | (179 | ) | | $ | - |
| | | | | | | |
At December 31, 2011, and 2010, the Company had $291.0 and $504.0 million, respectively, in investment securities being provided as collateral to the FHLB, the Federal Reserve Bank of San Francisco (the “Reserve Bank”), the State of Oregon and the State of Washington, and others for our borrowings and certain public fund deposits. At December 31, 2011, and December 31, 2010, Bancorp had no reverse repurchase agreements.
The follow table presents the maturities of the investment portfolio at December 31, 2011:
| (Dollars in thousands) | | Available for sale |
| | Amortized cost | | Fair value |
| U.S. Treasury securities | | | | | | |
| One year or less | | $ | 200 | | $ | 203 |
| After one year through five years | | | - | | | - |
| After five through ten years | | | - | | | - |
| Due after ten years | | | - | | | - |
| Total | | | 200 | | | 203 |
| |
| U.S. Government agency securities: | | | | | | |
| One year or less | | | 499 | | | 502 |
| After one year through five years | | | 185,726 | | | 189,062 |
| After five through ten years | | | 29,986 | | | 30,067 |
| Due after ten years | | | - | | | - |
| Total | | | 216,211 | | | 219,631 |
| |
| Corporate securities: | | | | | | |
| One year or less | | | - | | | - |
| After one year through five years | | | 500 | | | 500 |
| After five through ten years | | | - | | | - |
| Due after ten years | | | 13,851 | | | 8,007 |
| Total | | | 14,351 | | | 8,507 |
| |
| Obligations of state and political subdivisions: | | | | | | |
| One year or less | | | 1,065 | | | 1,107 |
| After one year through five years | | | 16,394 | | | 17,391 |
| After five through ten years | | | 28,686 | | | 31,584 |
| Due after ten years | | | 9,858 | | | 10,650 |
| Total | | | 56,003 | | | 60,732 |
| | | | | | | |
| Sub-total | | | 286,765 | | | 289,073 |
| |
| Mortgage-backed securities | | | 419,510 | | | 428,725 |
| Equity investments and other securities | | | 11,318 | | | 12,046 |
| Total securities | | $ | 717,593 | | $ | 729,844 |
| | | | | | |
Mortgage-backed securities, including collateralized mortgage obligations and asset-backed securities, have maturities that will differ from contractual maturities because borrowers may have the right to call or prepay obligations with or without call or prepayment penalties.
71
3. LOANS AND ALLOWANCE FOR CREDIT LOSSES
The following table presents the loan portfolio as of December 31, 2011 and 2010:
| (Dollars in thousands) | | December 31, |
| | 2011 | | 2010 |
| Commercial | | $ | 299,766 | | | $ | 309,327 | |
| Real estate construction | | | 30,162 | | | | 44,085 | |
| Real estate mortgage | | | 324,994 | | | | 349,016 | |
| Commercial real estate | | | 832,767 | | | | 818,577 | |
| Installment and other consumer | | | 13,612 | | | | 15,265 | |
| Total loans | | | 1,501,301 | | | | 1,536,270 | |
| Allowance for loan losses | | | (35,212 | ) | | | (40,217 | ) |
| Total loans, net | | $ | 1,466,089 | | | $ | 1,496,053 | |
| | | | | | | | |
Total loans decreased by 2% or $35 million from the balance at December 31, 2010, and the decrease reflected the continued challenges in local residential real estate markets, consumers de-leveraging and uncertainties with respect to the strength of the economy. Commercial, real estate construction, and real estate mortgage loan balances declined from year end and more than offset growth in commercial real estate loan balances. At December 31, 2011, and 2010, Bancorp had $.8 million and $1.3 million, respectively, of overdrafts classified as loans in the installment and other consumer loan category.
The Company has lending policies and underwriting processes in place that are designed to make loans within an acceptable level of risk for the estimated return. Management reviews and approves these policies and processes on a regular basis. Management frequently reviews reports related to loan production, loan quality, loan delinquencies and nonperforming and potential problem loans. Diversification in the loan portfolio is a means of managing risk associated with fluctuations in economic conditions.
Commercial loans are underwritten after evaluating and understanding the borrower’s ability to operate profitably and prudently execute its business. Underwriting standards are designed to promote relationship banking rather than transactional banking. The Company’s lending officers examine current and projected cash flows to determine the ability of the borrower to repay their obligations as agreed. Commercial loans are primarily made based on the identified cash flows of the borrower and secondarily on the underlying collateral provided by the borrower. The cash flows of borrowers, however, may not be as expected and the collateral securing these loans may fluctuate in value. Management monitors and evaluates commercial loans based on collateral, geography and risk rating criteria. Most commercial loans are secured by the assets being financed or other business assets such as accounts receivable or inventory and typically incorporate a personal guarantee; however, some short-term loans may be made on an unsecured basis. In the case of loans secured by accounts receivable, the availability of funds for the repayment of these loans may be substantially dependent on the ability of the borrower to collect amounts due from its customers.
Commercial real estate loans are subject to underwriting standards and processes similar to commercial loans. These loans are viewed primarily as cash flow loans and secondarily as loans secured by real estate. Commercial real estate lending typically involves higher loan principal amounts and the repayment of these loans is generally largely dependent on the successful lease-up of the property securing the loan or the business conducted on the property securing the loan. Commercial real estate loans may be more adversely affected by conditions in the real estate markets or in the general economy. Management monitors and evaluates commercial real estate loans based on collateral, geography, and risk rating criteria. As a general rule, the Company avoids financing single purpose projects unless other underwriting factors are present to help mitigate risk. The Company also utilizes third parties to provide insight and guidance about economic conditions and trends affecting market areas it serves.
Our residential and commercial construction portfolios are portfolios we consider to have higher risk. Construction loans are underwritten utilizing independent appraisal reviews, sensitivity analysis of absorption and lease rates financial analysis of the developers, property owners, and investors as well as on a selective basis, feasibility studies. Construction loans are generally based upon estimates of costs and value associated with the complete project. These estimates may be inaccurate. Construction loans often involve the disbursement of substantial funds with repayment substantially dependent on the success of the ultimate project. Sources of repayment for these types of loans may be pre-committed permanent loans from the Company or other approved third party long-term lenders, sales of developed property or an interim loan commitment from the Company until permanent financing is obtained. These loans are closely monitored by on-site inspections and are considered to have higher risks than other real estate loans due to their ultimate repayment being sensitive to interest rate changes, governmental regulation of real property, pre-leasing that does not materialize, general economic conditions, the availability of long-term financing, and completion of construction within timelines and costs originally set forth.
72
3.LOANS AND ALLOWANCE FOR CREDIT LOSSES
The Bank originates fixed and adjustable rate residential mortgages. These residential loans are typically sold on the secondary market with the servicing responsibility released by the Company. These loan sales have no recourse, however sales are subject to proper compliance with standard underwriting rules that if not met, may allow the secondary market buyer to require the Company to repurchase the note. Upon origination, these residential mortgage loans are recorded as loans held for sale until the sale has closed.
The Bank originates home equity loans and lines through an online application system in which all applications are centrally reviewed with underwriting and verifications completed by an experienced underwriter. Monthly loan portfolio reports provide home equity loan performance monitoring. Annual review of credit policies document the acceptance of policy and procedure changes as needed. Credit risk is minimized by accepting borrowers with a proven credit history, verified income sources for repayment and owner occupied properties as acceptable collateral. Portfolio balances, performance and underwriting standards can be influenced by regional economic cycles related to unemployment levels, de-leveraging by borrowers, and market values for residential properties.
The Company originates consumer loans utilizing a computer-based credit scoring analysis to supplement the underwriting process. To monitor and manage consumer loan risk, policies and procedures are developed and modified, as needed, jointly by line and staff personnel. This activity, coupled with relatively small loan amounts that are spread across many individual borrowers, minimizes risk. Additionally, trend and outlook reports are reviewed by management on a regular basis.
The Company maintains credit administration and credit review functions that are designed to help confirm our credit standards are being followed. Significant findings and periodic reports are communicated to the Chief Credit Officer and Chief Executive Officer and, in certain cases, to the Loan, Investment & Asset/Liability Committee, which is comprised of certain directors. The loan review process complements and reinforces the risk identification and assessment decisions made by lenders and credit personnel, as well as the Company’s policies and procedures.
Loans greater than 90 days past due are classified into nonaccrual status. The following table presents an age analysis of the loan portfolio as of December 31, 2011 and 2010:
| (Dollars in thousands) | | December 31, 2011 |
| | 30 - 89 days | | Greater than | | Total | | Current | | Total |
| | past due | | 90 days past due | | past due | | loans | | loans |
| Commercial | | $ | 849 | | $ | 5,692 | | $ | 6,541 | | $ | 293,225 | | $ | 299,766 |
| Real estate construction | | | - | | | 5,522 | | | 5,522 | | | 24,640 | | | 30,162 |
| Real estate mortgage | | | 3,787 | | | 6,226 | | | 10,013 | | | 314,981 | | | 324,994 |
| Commercial real estate | | | 3,619 | | | 6,328 | | | 9,947 | | | 822,820 | | | 832,767 |
| Installment and other consumer | | | 56 | | | 1 | | | 57 | | | 13,555 | | | 13,612 |
| Total | | $ | 8,311 | | $ | 23,769 | | $ | 32,080 | | $ | 1,469,221 | | $ | 1,501,301 |
| |
| (Dollars in thousands) | | December 31, 2010 |
| | 30 - 89 days | | Greater than | | Total | | Current | | Total |
| | past due | | 90 days past due | | past due | | loans | | loans |
| Commercial | | $ | 953 | | $ | 9,984 | | $ | 10,937 | | $ | 298,390 | | $ | 309,327 |
| Real estate construction | | | 2,098 | | | 4,039 | | | 6,137 | | | 37,948 | | | 44,085 |
| Real estate mortgage | | | 4,662 | | | 5,669 | | | 10,331 | | | 338,685 | | | 349,016 |
| Commercial real estate | | | 3,988 | | | 12,157 | | | 16,145 | | | 802,432 | | | 818,577 |
| Installment and other consumer | | | 53 | | | - | | | 53 | | | 15,212 | | | 15,265 |
| Total | | $ | 11,754 | | $ | 31,849 | | $ | 43,603 | | $ | 1,492,667 | | $ | 1,536,270 |
| | | | | | | | | | | | | | | |
73
3. LOANS AND ALLOWANCE FOR CREDIT LOSSES
The following table presents an analysis of impaired loans as of December 31, 2011, and 2010:
| | | | | | | | | | | | | | | | | Year ended |
| (Dollars in thousands) | | December 31, 2011 | | December 31, 2011 |
| | Unpaid principal | | Impaired loans | | Impaired loans | | Total impaired | | Related | | Average impaired |
| | balance 1 | | with no allowance | | with allowance | | loan balance | | allowance | | loan balance |
| Commercial | | $ | 18,736 | | $ | 7,750 | | $ | 224 | | $ | 7,974 | | $ | 1 | | $ | 10,504 |
| Real estate construction | | | 9,716 | | | 5,823 | | | 41 | | | 5,864 | | | - | | | 8,405 |
| Real estate mortgage | | | 30,732 | | | 11,949 | | | 6,779 | | | 18,728 | | | 329 | | | 20,892 |
| Commercial real estate | | | 25,426 | | | 15,070 | | | 8,604 | | | 23,674 | | | 173 | | | 25,969 |
| Installment and other consumer | | | 1,812 | | | 5 | | | 175 | | | 180 | | | - | | | 54 |
| Total | | $ | 86,422 | | $ | 40,597 | | $ | 15,823 | | $ | 56,420 | | $ | 503 | | $ | 65,824 |
| |
| | | | | | | | | | | | | | | | | Year ended |
| (Dollars in thousands) | | December 31, 2010 | | December 31, 2010 |
| | Unpaid principal | | Impaired loans | | Impaired loans | | Total impaired | | Related | | Average impaired |
| | balance 1 | | with no allowance | | with allowance | | loan balance | | allowance | | loan balance |
| Commercial | | $ | 22,692 | | $ | 13,377 | | $ | 1,679 | | $ | 15,056 | | $ | 2 | | $ | 19,992 |
| Real estate construction | | | 15,570 | | | 10,692 | | | 323 | | | 11,015 | | | 2 | | | 20,191 |
| Real estate mortgage | | | 28,856 | | | 15,491 | | | 7,828 | | | 23,319 | | | 443 | | | 20,610 |
| Commercial real estate | | | 28,717 | | | 21,648 | | | 5,634 | | | 27,282 | | | 103 | | | 17,187 |
| Installment and other consumer | | | - | | | - | | | - | | | - | | | - | | | 45 |
| Total | | $ | 95,835 | | $ | 61,208 | | $ | 15,464 | | $ | 76,672 | | $ | 550 | | $ | 78,025 |
| | | | | | | | | | | | | | | | | | |
| 1 | | The unpaid principal balance on impaired loans represents the amount owed by the borrower. The carrying value of impaired loans is lower than the unpaid principal balance due to charge-offs. |
At December 31, 2011, and 2010, Bancorp’s recorded investment in loans that were considered to be impaired was $56.4 million and $76.7 million, respectively. A loan is considered to be impaired when, based on current information and events, it is probable that the Company will be unable to collect all amounts due including both interest and principal according to the contractual terms of the loan agreement. For loans that are collateral dependent; the Company charges off the amount of impairment at the time of impairment. At December 31, 2011, a specific reserve allowance in the amount of $.5 million was established related to $15.8 million of impaired loans which were considered to be troubled debt restructurings (“TDR”) that were on interest accruing status, compared to a specific reserve allowance in the amount of $.6 million was established related to $15.5 million of impaired loans which were considered to be troubled debt restructurings and were on an interest accruing status at December 31, 2010.
The average recorded investment in impaired loans for the years ended December 31, 2011, 2010, and 2009, was approximately, $65.8 million, $78.0 million and $134.3 million, respectively. For the years ended December 31, 2011, 2010, and 2009, interest income recognized on impaired loans totaled $1,035,000, $568,000, and $526,000, respectively.
74
3. LOANS AND ALLOWANCE FOR CREDIT LOSSES
A loan is accounted for as a TDR if the Company, for economic or legal reasons related to the borrower’s financial difficulties, grants a concession to the borrower that it would not otherwise consider granting. A TDR typically involves a modification of terms such as a reduction of the stated interest rate or face amount of the loan, a reduction of accrued interest, or an extension of the maturity date(s) at a stated interest rate lower than the current market rate for a new loan with similar risk.
The following table presents an analysis of TDRs for the periods ended December 31, 2011, and 2010:
| | (Dollars in thousands) | | TDRs recorded for the twelve months ending | | TDRs recorded in the twelve months prior to December 31, 2011 that |
| | | December 31, 2011 | | subsequently defaulted in the twelve months ending December 31, 2011 |
| | | Number of | | Pre-TDR outstanding | | Post-TDR outstanding | | Number of | | Pre-TDR outstanding | | Amount Defaulted |
| | | loans | | recorded investment | | recorded investment | | loans | | recorded investment | | | |
| Commercial | | 11 | | $ | 949 | | $ | 949 | | 2 | | $ | 115 | | $ | 97 |
| | Real estate construction | | 1 | | | 744 | | | 744 | | - | | | - | | | - |
| Real estate mortgage | | 9 | | | 2,653 | | | 2,653 | | 1 | | | 59 | | | 49 |
| Commercial real estate | | 7 | | | 1,603 | | | 1,520 | | 1 | | | 374 | | | 374 |
| Consumer loans | | 3 | | | 225 | | | 225 | | - | | | - | | | - |
| Total | | 31 | | $ | 6,174 | | $ | 6,091 | | 4 | | $ | 548 | | $ | 520 |
| |
| (Dollars in thousands) | | TDRs recorded for the twelve months ending | | TDRs recorded in the twelve months prior to December 31, 2010 that |
| | | December 31, 2010 | | subsequently defaulted in the twelve months ending December 31, 2010 |
| | | Number of | | Pre-TDR outstanding | | Post-TDR outstanding | | Number of | | Pre-TDR outstanding | | Amount Defaulted |
| | | loans | | recorded investment | | recorded investment | | loans | | recorded investment | | | |
| Commercial | | 36 | | $ | 16,144 | | $ | 15,304 | | - | | $ | - | | $ | - |
| Real estate construction | | 16 | | | 7,479 | | | 7,479 | | 7 | | | 1,916 | | | 1,666 |
| Real estate mortgage | | 17 | | | 7,554 | | | 7,554 | | - | | | - | | | - |
| Commercial real estate | | 22 | | | 22,078 | | | 21,586 | | - | | | - | | | - |
| Total | | 91 | | $ | 53,255 | | $ | 51,923 | | 7 | | $ | 1,916 | | $ | 1,666 |
| | | | | | | | | | | | | | | | | |
For TDRs that are collateral dependent, the Company charges off the amount of impairment at the time of impairment, rather than creating a specific reserve allowance for the impaired amount. TDRs that are performing and on an interest accruing status are measured for impairment based on the present value of expected future cash flows discounted at the loan’s effective interest rate. Impairment resulting from this measurement is recorded as a specific reserve allowance in the allowance for credit losses.
The following table presents nonaccrual loans by category as of December 31, 2011, and 2010:
| | | | December 31, |
| (Dollars in thousands) | | 2011 | | 2010 |
| | Commercial | | $ | 7,750 | | $ | 13,377 |
| Real estate construction | | | 5,823 | | | 10,692 |
| Real estate mortgage | | | 11,949 | | | 15,491 |
| Commercial real estate | | | 15,070 | | | 21,671 |
| Installment and other consumer | | | 5 | | | - |
| Total loans on nonaccrual status | | $ | 40,597 | | $ | 61,231 |
Loans on which the accrual of interest has been discontinued were approximately $40.6 million, $61.2 million and $99.3 million at December 31, 2011, 2010, and 2009, respectively. Interest income foregone on nonaccrual loans was approximately $4.1 million, $6.5 million and $10.7 million in 2011, 2010, and 2009, respectively.
75
3. LOANS AND ALLOWANCE FOR CREDIT LOSSES
The Company uses a risk rating matrix to assign a risk rating to loans not evaluated on a homogenous pool level. At December 31, 2011, $1.10 billion of loans were risk rated and $397.6 million were evaluated on a homogeneous pool basis. Individually risk rated loans are rated on a scale of 1 to 10. A description of the general characteristics of the 10 risk ratings is as follows:
- Ratings 1, 2 and 3 - These ratings include loans to very high credit quality borrowers of investment or near investment grade. These borrowers have significant capital strength, moderate leverage, stable earnings and growth, and readily available financing alternatives. Smaller entities, regardless of strength, would generally not fit in these ratings. These ratings also include loans that are collateralized by U. S. Government securities and certificates of deposits.
- Rating 4 - These ratings include loans to borrowers of solid credit quality with moderate risk. Borrowers in these ratings are differentiated from higher ratings on the basis of size (capital and/or revenue), leverage, asset quality and the stability of the industry or market area.
- Ratings 5 and 6 - These ratings include “pass rating” loans to borrowers of acceptable credit quality and risk. Such borrowers are differentiated from Rating 4 in terms of size, secondary sources of repayment or they are of lesser stature in other key credit metrics in that they may be over-leveraged, undercapitalized, inconsistent in performance or in an industry or an economic area that is known to have a higher level of risk, volatility, or susceptibility to weaknesses in the economy. However, no material adverse trends are evident with borrowers in these pass ratings.
- Rating 7 - This rating includes loans on management’s “watch list” and is intended to be utilized on a temporary basis for pass rating borrowers where a significant risk-modifying action is anticipated in the near term.
- Rating 8 - This rating includes “Substandard” loans, in accordance with regulatory guidelines, for which the accrual of interest may or may not be discontinued. By definition under regulatory guidelines, a “Substandard” loan has defined weaknesses which make payment default or principal exposure likely, but not yet certain. Such loans are apt to be dependent upon collateral liquidation, a secondary source of repayment, or an event outside of the normal course of business.
- Rating 9 - This rating includes “Doubtful” loans in accordance with regulatory guidelines. Such loans are placed on nonaccrual status and may be dependent upon collateral having a value that is difficult to determine or upon some near-term event which lacks certainty.
- Rating 10 - This rating includes “Loss” loans in accordance with regulatory guidelines. Such loans are to be charged-off or charged-down when payment is acknowledged to be uncertain or when the timing or value of payments cannot be determined. “Loss” is not intended to imply that the loan or some portion of it will never be paid, nor does it in any way imply that there has been a forgiveness of debt.
The Company considers loans assigned a risk rating 8 through 10 to be classified loans. The weighted average risk ratings did not exhibit material change from December 31, 2010, to December 31, 2011. Overall classified loan balances have decreased, however, both in total and as a percentage of the total loan portfolio. The following table presents weighted average risk ratings of the loan portfolio and classified loans by category:
| | (Dollars in thousands) | | December 31, 2011 | | December 31, 2010 |
| | | Weighted average | | Classified | | Weighted average | | Classified |
| | | risk rating | | loans | | risk rating | | loans |
| Commercial | | | 5.84 | | $ | 22,401 | | | 5.89 | | $ | 32,895 |
| Real estate construction | | | 6.99 | | | 13,159 | | | 7.33 | | | 24,131 |
| Real estate mortgage | | | 6.50 | | | 24,004 | | | 6.34 | | | 20,913 |
| | Commercial real estate | | | 5.67 | | | 35,255 | | | 5.75 | | | 42,045 |
| Installment and other consumer 1 | | | 7.87 | | | 358 | | | 7.41 | | | 137 |
| Total | | | | | $ | 95,177 | | | | | $ | 120,121 |
| |
| Total loans risk rated | | $ | 1,103,713 | | | | | $ | 1,096,859 | | | |
| 1 | | Installment and other consumer loans are primarily evaluated on a homogenous pool level and generally not individually risk rated unless certain factors are met. |
76
3. LOANS AND ALLOWANCE FOR CREDIT LOSSES
Important credit quality metrics for this portfolio include nonaccrual and past due status. Total loans evaluated on a homogeneous pool basis were $397.6 million and $439.4 million at December 31, 2011 and 2010, respectively. The following table presents loans by category that the credit risk is evaluated on a portfolio basis. The real estate mortgage category includes home equity lines of credit and home equity loans and certain small business loans:
| | (Dollars in thousands) | | December 31, 2011 | | December 31, 2010 |
| | | Current | | Nonaccrual | | 30 - 89 days | | Current | | Nonaccrual | | 30 - 89 days |
| | | status | | status | | past due | | status | | status | | past due |
| Commercial | | $ | 46,774 | | $ | 11 | | $ | 112 | | $ | 54,217 | | $ | 245 | | $ | 7 |
| Real estate construction | | | - | | | 4 | | | - | | | - | | | 1,136 | | | - |
| Real estate mortgage | | | 254,107 | | | 13 | | | 1,480 | | | 269,862 | | | 4,958 | | | 1,931 |
| Commercial real estate | | | 81,601 | | | 1 | | | 283 | | | 90,782 | | | 1,334 | | | 8 |
| | Installment and other consumer | | | 13,146 | | | - | | | 56 | | | 14,878 | | | - | | | 52 |
| Total | | $ | 395,628 | | $ | 29 | | $ | 1,931 | | $ | 429,739 | | $ | 7,673 | | $ | 1,998 |
| | | | | | | | | | | | | | | | | | | |
The allowance for credit losses is a reserve established through a provision for credit losses charged to expense, which represents management’s best estimate as of the balance sheet date, of probable losses that have been incurred within the existing loan portfolio. The allowance for credit losses is based on historical loss experience by type of credit and internal risk rating, specific homogeneous risk pools and specific loss allocations, with adjustments for current events and conditions. The Company’s process for determining the appropriate amount of the allowance for credit losses is designed to account for credit deterioration as it occurs. The provision for credit losses is reflective of loan quality trends, and considers trends related to nonaccrual loans, past due loans, potential problem loans, criticized loans and net charge-offs or recoveries, among other factors. The provision for credit losses also reflects the totality of actions taken on all loans for a particular period.
The allowance for credit losses reflects management’s continuing evaluation of industry concentrations, specific credit risks, loan loss experience, current loan portfolio quality, present economic, political and regulatory conditions and unidentified losses inherent in the current loan portfolio. Portions of the allowance may be allocated for specific loans; however, the entire allowance is available for any loan that, in management’s judgment, should be charged off. While management utilizes its best judgment and information available, the ultimate adequacy of the allowance is dependent upon a variety of factors beyond the Company’s control, including, among other things, the performance of the overall loan portfolio, the economy, changes in interest rates and the view of the regulatory authorities toward loan classifications.
The Company’s allowance for loan losses consists of three key elements: specific reserve allowances, formula allowance, and an unallocated allowance that represents an amount to capture risk associated with qualitative factors and uncertainty that is inherent in estimates used to determine the allowance.
Specific reserve allowances may be established when management can estimate the amount of an impairment of a loan, typically on a non real estate collateralized loan or to address the unique risks associated with a group of loans or particular type of credit exposure. The Company does not establish specific reserve allowances on collateral dependent impaired loans. Impairment on these loans is charged off to the allowance for credit losses when impairment is established.
The formula allowance is calculated by applying loss factors to individual loans based on the assignment of risk ratings, or through the assignment of loss factors to homogenous pools of loans. Changes in risk ratings of both performing and nonperforming loans affect the amount of the formula allowance. Loss factors are based on our historical loss experience and such other data as management believes to be pertinent, and may be adjusted for significant factors that, in management’s judgment, affect the collectability of the portfolio as of the evaluation date. At December 31, 2011, and 2010, the allowance for loan losses was $35.2 million and $40.2 million, respectively, while the reserve for unfunded commitments was $.8 million for both years ended 2011 and 2010.
The unallocated loan loss allowance represents an amount for imprecision or uncertainty that is inherent in estimates used to determine the allowance. In determining whether to carry an unallocated allowance and, if so, the amount of the allowance, management considers a variety of qualitative factors, including regional economic and business conditions that impact important categories of our portfolio, loan growth rates, the depth and skill of lending staff, the interest rate environment, and the results of bank regulatory examinations and findings of our internal credit examiners. Currently, we have an unallocated allowance for loan losses that is the result of our judgment about risks inherent in the loan portfolio due to economic uncertainties, as well as our evaluation of historical loss experience relative to current trends, and other subjective factors.
77
3. LOANS AND ALLOWANCE FOR CREDIT LOSSES
The following is an analysis of the changes in the allowance for credit losses:
| | (Dollars in thousands) | | Year Ended December 31, |
| | | 2011 | | 2010 | | 2009 |
| Balance, beginning of period | | $ | 41,067 | | | $ | 39,418 | | | $ | 29,934 | |
| | Provision for credit losses | | | 8,133 | | | | 18,652 | | | | 90,057 | |
| Losses charged to the allowance | | | (15,410 | ) | | | (19,476 | ) | | | (82,345 | ) |
| Recoveries credited to the allowance | | | 2,193 | | | | 2,473 | | | | 1,772 | |
| Balance, end of period | | $ | 35,983 | | | $ | 41,067 | | | $ | 39,418 | |
| |
| Components of allowance for credit losses | | | | | | | | | | | | |
| Allowance for loan losses | | $ | 35,212 | | | $ | 40,217 | | | $ | 38,490 | |
| Reserve for unfunded commitments | | | 771 | | | | 850 | | | | 928 | |
| Total allowance for credit losses | | $ | 35,983 | | | $ | 41,067 | | | $ | 39,418 | |
| | | | | | | | | | | | | |
The provision for credit losses was $8.1 million, $18.7 million, and $90.1 million for the years ended December 31, 2011, 2010 and 2009, respectively, while net loan charge-offs were $13.2 million, $17.0 million, and $80.6 million, over those same years. The provision for credit losses decreased $10.6 million in 2011 compared to 2010, primarily due to a significant reduction in unfavorable loan risk rating migration within the Company’s loan portfolio and lower net loan charge-offs in the commercial, residential real estate construction, and mortgage categories, as well as in nonstandard mortgages, which was only partially offset by higher home equity and commercial real estate net charge-offs.
The 2009 provision for credit losses reflected a substantial unfavorable loan risk rating migration and material net charge-offs within the loan portfolio in 2009, which resulted in, among other things, a substantial increase in the general valuation allowances within the allowance for credit losses model during 2009 and 2010.
The following table presents summary account activity of the allowance for credit losses by loan category as of December 31, 2011, and 2010:
| | (Dollars in thousands) | | December 31, 2011 |
| | | | | | | Real estate | | Real estate | | Commercial | | Installment and | | | | | | | | |
| | | Commercial | | construction | | mortgage | | real estate | | other consumer | | Unallocated | | Total |
| Balance, beginning of period | | $ | 8,541 | | | $ | 4,474 | | | $ | 8,156 | | | $ | 12,462 | | | $ | 1,273 | | | $ | 6,161 | | | $ | 41,067 | |
| Provision for credit losses | | | 1,262 | | | | (174 | ) | | | 5,853 | | | | 1,849 | | | | 1,118 | | | | (1,775 | ) | | | 8,133 | |
| Losses charged to the allowance | | | (3,393 | ) | | | (2,088 | ) | | | (5,771 | ) | | | (2,526 | ) | | | (1,632 | ) | | | - | | | | (15,410 | ) |
| Recoveries credited to the allowance | | | 1,336 | | | | 278 | | | | 223 | | | | 48 | | | | 308 | | | | - | | | | 2,193 | |
| Balance, end of period | | $ | 7,746 | | | $ | 2,490 | | | $ | 8,461 | | | $ | 11,833 | | | $ | 1,067 | | | $ | 4,386 | | | $ | 35,983 | |
| |
| Loans valued for impairment: | | | | | | | | | | | | | | | | | | | | | | | | | | | | |
| Individually | | $ | 7,974 | | | $ | 5,864 | | | $ | 18,728 | | | $ | 23,674 | | | $ | 180 | | | $ | - | | | $ | 56,420 | |
| Collectively | | | 291,792 | | | | 24,298 | | | | 306,266 | | | | 809,093 | | | | 13,432 | | | | - | | | | 1,444,881 | |
| Total | | $ | 299,766 | | | $ | 30,162 | | | $ | 324,994 | | | $ | 832,767 | | | $ | 13,612 | | | $ | - | | | $ | 1,501,301 | |
| | |
| (Dollars in thousands) | | December 31, 2010 |
| | | | | | | Real estate | | Real estate | | Commercial | | Installment and | | | | |
| | | Commercial | | construction | | mortgage | | real estate | | other consumer | | Unallocated | | Total |
| Balance, beginning of period | | $ | 8,224 | | | $ | 7,240 | | | $ | 8,211 | | | $ | 9,492 | | | $ | 1,294 | | | $ | 4,957 | | | $ | 39,418 | |
| Provision for credit losses | | | 4,474 | | | | 113 | | | | 7,025 | | | | 4,262 | | | | 1,574 | | | | 1,204 | | | | 18,652 | |
| Losses charged to the allowance | | | (5,229 | ) | | | (3,576 | ) | | | (7,461 | ) | | | (1,321 | ) | | | (1,889 | ) | | | - | | | | (19,476 | ) |
| Recoveries credited to the allowance | | | 1,072 | | | | 697 | | | | 381 | | | | 29 | | | | 294 | | | | - | | | | 2,473 | |
| Balance, end of period | | $ | 8,541 | | | $ | 4,474 | | | $ | 8,156 | | | $ | 12,462 | | | $ | 1,273 | | | $ | 6,161 | | | $ | 41,067 | |
| |
| Loans valued for impairment: | | | | | | | | | | | | | | | | | | | | | | | | | | | | |
| Individually | | $ | 15,056 | | | $ | 11,015 | | | $ | 23,319 | | | $ | 27,282 | | | $ | - | | | $ | - | | | $ | 76,672 | |
| Collectively | | | 294,271 | | | | 33,070 | | | | 325,697 | | | | 791,295 | | | | 15,265 | | | | - | | | | 1,459,598 | |
| Total | | $ | 309,327 | | | $ | 44,085 | | | $ | 349,016 | | | $ | 818,577 | | | $ | 15,265 | | | $ | - | | | $ | 1,536,270 | |
| | | | | | | | | | | | | | | | | | | | | | | | | | | | | |
78
4. PREMISES AND EQUIPMENT
Premises and equipment consists of the following:
| | (Dollars in thousands) | | December 31, |
| | | 2011 | | 2010 |
| | Land | | $ | 4,273 | | | $ | 4,439 | |
| Buildings and improvements | | | 29,937 | | | | 31,002 | |
| Furniture and equipment | | | 28,663 | | | | 28,917 | |
| Construction in progress | | | 272 | | | | 398 | |
| | | | 63,145 | | | | 64,756 | |
| Accumulated depreciation | | | (38,771 | ) | | | (37,982 | ) |
| Total | | $ | 24,374 | | | $ | 26,774 | |
| | | | | | | | | |
Depreciation included in occupancy and equipment expense amounted to $3.4 million, $3.8 million, and $5.9 million for the years ended December 31, 2011, 2010, and 2009, respectively. Depreciation for all premises and equipment is calculated using the straight-line method. The Company periodically reviews the recorded value of its long-lived assets, specifically premises and equipment, to determine whether impairment exists. In 2011, the Company recorded impairment of $.1 million in conjunction with a Bank branch that was closed and $.5 million of leasehold improvement charge-offs associated with Bank branch closures. No material impairments associated with premises and equipment were recorded during 2010 or 2009.
5. GOODWILL AND INTANGIBLE ASSETS
The following table summarizes the change in Bancorp’s core deposit intangible asset for the periods shown:
| | (Dollars in thousands) | | Core deposit |
| | | intangible |
| Balance, January 1, 2010 | | $ | 637 | |
| Amortization | | | (279 | ) |
| | Balance, December 31, 2010 | | | 358 | |
| Amortization | | | (358 | ) |
| Balance, December 31, 2011 | | $ | - | |
| | | | | |
6. OTHER REAL ESTATE OWNED, NET
The following table summarizes Bancorp’s OREO for the years ended December 31, 2011, and 2010:
| | (Dollars in thousands) | | December 31, |
| | | 2011 | | 2010 |
| Balance, beginning period | | $ | 39,459 | | | $ | 53,594 | |
| Additions to OREO | | | 21,662 | | | | 28,384 | |
| Disposition of OREO | | | (25,466 | ) | | | (35,870 | ) |
| | Valuation adjustments in the period | | | (4,832 | ) | | | (6,649 | ) |
| Total OREO | | $ | 30,823 | | | $ | 39,459 | |
| | | | | | | | | |
The following table summarizes Bancorp’s OREO valuation allowance for the years ended December 31, 2011, and 2010:
| | (Dollars in thousands) | | December 31, |
| | | | 2011 | | 2010 | | 2009 |
| Balance, beginning period | | $ | 7,584 | | | $ | 9,489 | | | $ | 3,920 | |
| Valuation adjustments in the period | | | 4,832 | | | | 6,649 | | | | 18,562 | |
| Deductions from the valuation allowance due to disposition | | | (4,265 | ) | | | (8,554 | ) | | | (12,993 | ) |
| Total OREO valuation allowance | | $ | 8,151 | | | $ | 7,584 | | | $ | 9,489 | |
79
7.OTHER ASSETS
The following table summarizes Bancorp’s other assets for the years ended December 31, 2011, and 2010:
| | (Dollars in thousands) | | December 31, |
| | | 2011 | | 2010 |
| Deferred tax assets, net | | $ | 22,964 | | $ | 5,789 |
| Accrued interest receivable | | | 9,364 | | | 9,522 |
| | Investment in affordable housing tax credits | | | 3,251 | | | 3,915 |
| Income taxes receivable | | | 863 | | | - |
| Other | | | 7,684 | | | 13,715 |
| Total other assets | | $ | 44,126 | | $ | 32,941 |
| | | | | | | |
Bancorp has invested in two limited partnerships that operate qualified affordable housing properties. Tax credits and tax deductions from operating losses are passed through the partnerships to Bancorp. The Company accounts for these investments using the equity method.
8. BALANCES WITH THE FEDERAL RESERVE BANK
The Bank is required to maintain cash reserves or deposits with the Federal Reserve Bank equal to a percentage of reservable deposits. The average required cash reserve for the Bank was $6.5 million during both of the years ended December 31, 2011, and 2010.
9. BORROWINGS
The following table summarizes Bancorp’s borrowings as of December 31, 2011, and 2010:
| | (Dollars in thousands) | | December 31, |
| | | 2011 | | 2010 |
| Long-term borrowings: | | | | | | |
| FHLB non-putable advances | | $ | 120,000 | | $ | 138,599 |
| | FHLB putable advances | | | - | | | 30,000 |
| Total long-term borrowings | | | 120,000 | | | 168,599 |
| Total borrowings | | $ | 120,000 | | $ | 168,599 |
| | | | | | | |
The decrease in long-term borrowings of $48.6 million during 2011 was due to the prepayment of $168.6 million in long-term FHLB borrowings in the third and fourth quarter of 2011 offset in part by new long-term FHLB borrowings in the period of $120 million. As a result of the long-term borrowing prepayments, the Company incurred a prepayment charge of $7.14 million for the period ending December 31, 2011, compared to a prepayment charge of $2.3 million associated with the prepayment of $99.1 million in 2010.
At December 31, 2011, Bancorp’s long-term borrowings consisted of nine fixed rate, fixed maturity notes with rates ranging from 0.81% to 1.43%. Principal payments due at the scheduled maturities of Bancorp’s long-term borrowings at December 31, 2011, were $50.0 million in 2013, $30.0 million in 2014, $29.3 million in 2015, and $10.7 million in 2016.
Long-term borrowings at December 31, 2010 consisted of notes with fixed maturities and putable advances with the FHLB totaling $168.6 million at interest rates ranging from 2.32% to 5.03%. Total long-term borrowings with fixed maturities were $138.6 million at December 31, 2010. The Bank had three putable advances totaling $30.0 million with original terms of five years, and final maturities in February 2013, August 2013, and March 2014. The FHLB may under certain circumstances require repayment of these putable advances prior to their scheduled maturities.
FHLB advances are collateralized, as provided for in an “Advances, Security and Deposit Agreement” with the FHLB, by investment securities and qualifying loans. At December 31, 2011, the Company had additional borrowing capacity available at the FHLB of $320.4 million based on pledged collateral. Bancorp had no outstanding Federal Funds purchased from correspondent banks, borrowings from the discount window, or reverse repurchase agreements at December 31, 2011, and 2010.
80
10. JUNIOR SUBORDINATED DEBENTURES
At December 31, 2011, six wholly-owned subsidiary grantor trusts established by Bancorp had issued and sold $51 million of trust preferred securities. Trust preferred securities accrue and pay distributions periodically at specified annual rates as provided in each indenture. The trusts used all of the net proceeds from each sale of trust preferred securities to purchase a like amount of junior subordinated debentures of the Company. The junior subordinated debentures are the sole assets of the trusts. The Company’s obligations under the junior subordinated debentures and related documents, taken together, constitute a full and unconditional guarantee by the Company of the obligations of the trusts. The trust preferred securities are mandatorily redeemable upon the maturity of the junior subordinated debentures and may be subject to earlier redemption by the Company as provided in the indentures. The Company has the right to redeem the junior subordinated debentures in whole (but not in part) on or after specific dates, at a redemption price specified in the indentures plus any accrued but unpaid interest to the redemption date. During the second quarter of 2011, the Company paid all previously deferred interest on its trust preferred securities and continues to pay quarterly interest payments as they become due. Under the Company’s December 2009 agreement with the Oregon Department of Consumer and Business Services, Division of Finance and Corporate Securities (“DFCS”) and the Federal Reserve Bank (“Reserve Bank”), the Company must request regulatory approval prior to making payments on our trust preferred securities.
The following table is a summary of outstanding trust preferred securities at December 31, 2011:
| | (Dollars in thousands) | | | | | | | | | | | | | | | | | |
| | | | | Preferred security | | | | | | | Rate at | | | | Next possible |
| Issuance Trust | | Issuance date | | amount | | Rate type1 | | Initial rate | | 12/31/11 | | Maturity date | | redemption date2 |
| West Coast Statutory Trust III | | September 2003 | | $ | 7,500 | | Variable | | 6.75 | % | | 3.51 | % | | September 2033 | | Currently redeemable |
| West Coast Statutory Trust IV | | March 2004 | | $ | 6,000 | | Variable | | 5.88 | % | | 3.35 | % | | March 2034 | | Currently redeemable |
| | West Coast Statutory Trust V | | April 2006 | | $ | 15,000 | | Variable | | 6.79 | % | | 1.98 | % | | June 2036 | | Currently redeemable |
| West Coast Statutory Trust VI | | December 2006 | | $ | 5,000 | | Variable | | 7.04 | % | | 2.23 | % | | December 2036 | | Currently redeemable |
| West Coast Statutory Trust VII | | March 2007 | | $ | 12,500 | | Variable | | 6.90 | % | | 2.10 | % | | June 2037 | | June 2012 |
| West Coast Statutory Trust VIII | | June 2007 | | $ | 5,000 | | Variable | | 6.74 | % | | 1.93 | % | | June 2037 | | June 2012 |
| | | Total | | $ | 51,000 | | | | Weighted rate | | 2.41 | % | | | | |
| 1 | | The variable rate preferred securities reprice quarterly. |
| 2 | | Securities are redeemable at the option of Bancorp following these dates. |
The weighted average interest rate on the trust preferred securities was 2.41% at December 31, 2011. The interest rate on each security resets quarterly and is tied to the London Interbank Offered Rate (“LIBOR”) rate. The junior subordinated debentures issued by Bancorp to the grantor trust are reflected in our consolidated balance sheet in the liabilities section at December 31, 2011, and 2010, as junior subordinated debentures. Bancorp records interest expense on the corresponding junior subordinated debentures in the consolidated statements of income (loss). The common capital securities issued by the trusts are recorded within other assets in the consolidated balance sheets, and totaled $1.6 million at December 31, 2011, and 2010.
81
11. EMPLOYEE BENEFIT PLANS
Bancorp employee benefits include a plan established under section 401(k) of the Internal Revenue Code for certain qualified employees (the “401(k) plan”). Employee contributions up to 100 percent of salaries under the Internal Revenue Code guidelines can be made under the 401(k) plan, of which Bancorp may match 50 percent of the employees’ contributions up to a maximum of three percent of the employees’ eligible compensation. Bancorp may also elect to make discretionary contributions to the plan. In 2011 and 2010, Bancorp made qualified, non-elective, discretionary contributions into employee 401(k) plans. Bancorp’s 401(k) related discretionary contributions expenses for 2011, 2010, and 2009 were $.3 million, $.1 million, and $0, respectively. Employees vest immediately in their own contributions and earnings, and vest in Bancorp’s matching contributions over five years of eligible service. Bancorp had no 401(k) plan related expenses in 2011, 2010, and 2009 related to the Company’s 401(k) plan match.
Bancorp provides separate non-qualified deferred compensation plans for directors and executive officers (collectively, “Deferred Compensation Plans”) as supplemental benefit plans which permit directors and selected officers to elect to defer receipt of all or any portion of their future salary, bonus or directors’ fees, including with respect to officers, amounts they otherwise might not be able to defer under the 401(k) plan due to specified Internal Revenue Code restrictions on the maximum deferral that may be allowed under that plan. Under the Deferred Compensation Plans, an amount equal to compensation being deferred by participants is placed in a rabbi trust, the assets of which is available to Bancorp’s creditors and recorded as trading securities in our consolidated balance sheets, and invested consistent with the participants’ direction among a variety of investment alternatives. A deferred compensation liability of $1.6 million was included in other liabilities as of December 31, 2011, relatively unchanged from December 31, 2010.
Bancorp has multiple supplemental executive retirement agreements with former and current executives. The following table reconciles the accumulated liability for the benefit obligation of these agreements:
| | (Dollars in thousands) | | Year ended December 31, |
| | | 2011 | | 2010 |
| Beginning balance | | $ | 2,618 | | | $ | 2,514 | |
| Benefit expense | | | 878 | | | | 209 | |
| | Benefit payments | | | (132 | ) | | | (105 | ) |
| Ending balance | | $ | 3,364 | | | $ | 2,618 | |
| | | | | | | | | |
Bancorp’s obligations under supplemental executive retirement agreements are unfunded plans and have no plan assets. The benefit obligation represents the vested net present value of future payments to individuals under the agreements. Bancorp’s benefit expense, as specified in the agreements for the entire year 2012, is expected to be $.4 million. The benefits expected to be paid are presented in the following table:
| | (Dollars in thousands) | | | |
| |
| | | Benefits expected to |
| Year | | be paid |
| | 2012 | | $ | 80 |
| 2013 | | | 81 |
| 2014 | | | 81 |
| 2015 | | | 85 |
| 2016 | | | 83 |
| 2017 through 2021 | | | 1,690 |
82
12. COMMITMENTS AND CONTINGENT LIABILITIES
The Company leases land and office space under 48 leases, of which 45 are long-term operating leases that expire between 2012 and 2024. At the end of most of the respective lease terms, Bancorp has the option to renew the leases at fair market value. At December 31, 2011, minimum future lease payments under these leases and other operating leases were:
| | (Dollars in thousands) | | Minimum Future |
| Year | | Lease Payments |
| 2012 | | $ | 4,134 |
| 2013 | | | 4,031 |
| 2014 | | | 3,779 |
| 2015 | | | 3,149 |
| | 2016 | | | 2,615 |
| Thereafter | | | 8,027 |
| Total | | $ | 25,735 |
| | | | |
Rental expense for all operating leases was $4.5 million, $4.2 million, and $4.2 million for the years ended December 31, 2011, 2010, and 2009, respectively.
Bancorp is periodically party to litigation arising in the ordinary course of business. Based on information currently known to management, although there are uncertainties inherent in litigation, we do not believe there is any legal action to which Bancorp or any of its subsidiaries is a party that, individually or in the aggregate, will have a materially adverse effect on Bancorp’s financial condition and results of operations, cash flows, or liquidity.
13. STOCKHOLDERS’ EQUITY AND REGULATORY CAPITAL
All share amounts have been restated to reflect the Reverse Stock Split. Authorized capital stock of Bancorp at December 31, 2011, included 50,000,000 shares of Common Stock, no par value, and 10,000,000 shares of Preferred Stock, no par value, of which 2,000,000 shares had been designated as Mandatorily Convertible Cumulative Participating Preferred Stock, Series A (“Series A Preferred Stock”) and 600,000 shares had been designated as Mandatorily Convertible Cumulative Participating Preferred Stock, Series B (“Series B Preferred Stock”).
Preferred Stock.Following the receipt of shareholder approvals on January 20, 2010, 1,428,849 shares of Series A Preferred Stock issued in connection with Bancorp's private capital raise and outstanding at December 31, 2009, automatically converted into an aggregate of 14,288,490 shares of Common Stock. As of December 31, 2011, there are no shares of Series A Preferred Stock currently outstanding.
Bancorp also issued an aggregate of 121,328 shares of Series B Preferred Stock in the private capital raise all of which remains outstanding. These shares will automatically convert into an aggregate of 1,213,280 shares of Common Stock upon transfer of the Series B Preferred Stock to third parties in a widely dispersed offering.
The Series B Preferred Stock is not subject to the operation of a sinking fund and has no participation rights. The Series B Preferred Stock is not redeemable by the Company and is perpetual with no maturity. The holders of Series B Preferred Stock have no general voting rights. If the Board of Directors declares and pays a dividend in respect of Common Stock, it must declare and pay to the holders of the Series B Preferred Stock on the same date a dividend in an amount per share of the Series B Preferred Stock determined in accordance with the Restated Articles of Incorporation that is intended to provide such holders’ dividends in the amount they would have received if shares of Series B Preferred Stock had been converted into Common Stock as of that date. There are no accrued dividends or dividends in arrears on Series B Preferred Stock at December 31, 2011.
Warrants to Purchase Series B Preferred Stock.In October 2009, as part of a private capital raise, Bancorp issued Class C Warrants to purchase an aggregate of 240,000 shares of Series B Preferred Stock at an exercise price of $100.00 per share or $24 million in aggregate. The Warrants were immediately exercisable and will expire on October 23, 2016. Shares of Series B Preferred Stock issuable upon exercise of the Warrants will automatically convert into an aggregate of 2.4 million shares of Common Stock upon transfer of the Series B Preferred Stock to third parties in a widely dispersed offering.
The Company allocated the proceeds of $21.1 million from the issuance of the Series B Preferred Stock and Warrants between the two based on their relative fair values. The fair value allocated to the warrants was $11.1 million.
The Company maintains a stock repurchase plan. Under the Company’s stock repurchase plan, the Company can purchase up to 980,000 shares of the Company’s Common Stock. The Company did not repurchase any shares under this plan in 2011 nor does it anticipate repurchasing any shares in the foreseeable future. Total shares available for repurchase under this plan are 210,400 at December 31, 2011.
83
13. STOCKHOLDERS’ EQUITY AND REGULATORY CAPITAL
Regulatory Capital.The Federal Reserve and Federal Deposit Insurance Corporation (“FDIC”) have established minimum requirements for capital adequacy for bank holding companies and nonmember banks. Under capital adequacy guidelines and the regulatory framework for prompt corrective action, Bancorp and the Bank must meet specific capital guidelines that involve quantitative measures of assets, liabilities and certain off balance sheet items. The Federal Reserve and FDIC risk based capital guidelines require banks and bank holding companies to have a ratio of Tier 1 capital to total risk weighted assets of at least 4%, and a ratio of total capital to total risk weighted assets of 8% or greater. In addition, the leverage ratio of Tier 1 capital to total average assets less intangibles is required to be at least 4%. Bancorp and its bank subsidiary’s capital components, classification, risk weightings and other factors are also subject to qualitative judgments by regulators. Failure to meet minimum capital requirements can initiate certain action by regulators that, if undertaken, could have a material effect on Bancorp’s financial statements.
Bancorp’s total risk-based capital ratio improved to 20.62% at December 31, 2011, up from 18.74% at December 31, 2010, while Bancorp's Tier 1 risk-based capital ratio increased to 19.36% at December 31, 2011, from 17.47% at December 31, 2010. Bancorp’s capital ratios improved over year end 2010 principally as a result of the consistent improvement in the core operating performance of the Company over the past two years, the impact of the reversal of the deferred tax asset valuation allowance and a reduction in the Company’s risk weighted assets over the past 12 months also contributed to improved capital ratios at Bancorp.
The following table presents the capital measures of Bancorp and the Bank as of December 31, 2011, and 2010:
| | 2011 | | 2010 |
| | | | | | | | Amount | | Percent | | | | | | | | Amount | | Percent |
| | | | | | | | Required For | | required for | | | | | | | | Required For | | required for |
| | | | | | | | Minimum | | Minimum | | | | | | | | Minimum | | Minimum |
| (Dollars in thousands) | | | | | | | | Capital | | Capital | | | | | | | | Capital | | Capital |
| | Amount | | Ratio | | Adequacy | | Adequacy | | Amount | | Ratio | | Adequacy | | Adequacy |
| Tier 1 risk-based capital | | | | | | | | | | | | | | | | | | | | | | | | |
| West Coast Bancorp | | $ | 355,498 | | 19.36 | % | | $ | 73,461 | | 4 | % | | $ | 322,648 | | 17.47 | % | | $ | 73,859 | | 4 | % |
| West Coast Bank | | | 342,213 | | 18.66 | % | | | 73,367 | | 4 | % | | | 309,578 | | 16.79 | % | | | 73,765 | | 4 | % |
| Total risk-based capital | | | | | | | | | | | | | | | | | | | | | | | | |
| West Coast Bancorp | | $ | 378,616 | | 20.62 | % | | $ | 146,923 | | 8 | % | | $ | 345,951 | | 18.74 | % | | $ | 147,718 | | 8 | % |
| West Coast Bank | | | 365,301 | | 19.92 | % | | | 146,733 | | 8 | % | | | 332,852 | | 18.05 | % | | | 147,530 | | 8 | % |
| Leverage ratio | | | | | | | | | | | | | | | | | | | | | | | | |
| West Coast Bancorp | | $ | 355,498 | | 14.61 | % | | $ | 97,301 | | 4 | % | | $ | 322,648 | | 13.02 | % | | $ | 99,088 | | 4 | % |
| West Coast Bank | | | 342,213 | | 14.09 | % | | | 97,119 | | 4 | % | | | 309,578 | | 12.51 | % | | | 98,975 | | 4 | % |
84
14. STOCK PLANS
At December 31, 2011, Bancorp maintained one stock plan, the 2002 Stock Incentive Plan (“2002 Plan”) which is shareholder approved and authorizes the grant of stock options, restricted stock awards and certain other stock based awards. The 2002 Plan permits the grant of stock options and restricted stock awards for up to 820,000 shares. As of December 31, 2011, 67,550 shares remained available for issuance, of which 53,287 shares may be allocated to restricted stock awards. Proportional adjustments were made to the per share and related amounts of shares, as well as the conversion and exercise rights of stock options and other awards made under the 2002 Plan, in connection with the Reverse Stock Split.
It is Bancorp’s policy to issue new shares for stock option exercises and restricted stock awards. Bancorp expenses stock options and restricted stock on a straight line basis over the applicable vesting term. Restricted stock granted under the 2002 Plan generally vests over a two to four year vesting period; however, certain grants have been made that vested immediately or over a one year period, including grants to directors.
All outstanding stock options have an exercise price that was equal to the closing market value of Bancorp’s stock on the date the options were granted. Options granted under the 2002 Plan generally vest over a two to four year vesting period; however, certain grants have been made that vested immediately, including grants to directors. Stock options have a 10 year maximum term. The following table presents information on stock options outstanding for the periods shown:
| | | | | | | 2011 | | | | | 2010 | | | | | 2009 |
| | | | | | Weighted | | | | | Weighted | | | | | Weighted |
| | | 2011 Common | | Avg. Ex. | | 2010 Common | | Avg. Ex. | | 2009 Common | | Avg. Ex. |
| | | Shares | | Price | | Shares | | Price | | Shares | | Price |
| Balance, beginning of year | | 306,527 | | | $ | 66.89 | | 349,350 | | | $ | 65.38 | | 281,503 | | | $ | 82.05 |
| Granted | | - | | | | - | | 190 | | | | 13.15 | | 84,380 | | | | 11.55 |
| | Exercised | | (6,917 | ) | | | 11.55 | | -305 | | | | 11.55 | | - | | | | - |
| Forfeited/expired | | (42,530 | ) | | | 56.33 | | (42,709 | ) | | | 54.78 | | (16,533 | ) | | | 74.48 |
| Balance, end of year | | 257,080 | | | $ | 70.12 | | 306,527 | | | $ | 66.89 | | 349,350 | | | $ | 65.38 |
| Exercisable, end of year | | 250,462 | | | | | | 258,796 | | | | | | 249,027 | | | | |
The average fair value of stock options granted is estimated on the date of grant using the Black-Scholes option-pricing model. There were no stock options granted in 2011. The following table presents the assumptions used in the fair value calculation for 2010 and 2009:
| | | | 2010 | | 2009 |
| | Risk Free interest rates | | | 1.43 | % | | | 1.64 | % |
| Expected dividend | | | 0.00 | % | | | 0%-1.22 | % |
| Expected lives, in years | | | 4 | | | | 4 | |
| Expected volatility | | | 38 | % | | | 37 | % |
| Fair value of options granted | | $ | 4.16 | | | $ | 3.27 | |
As of December 31, 2011, outstanding stock options consist of the following:
| | | | | | | | | | Weighted Avg. | | | | | | | | |
| | | | | | | | Options | | Remaining Years to | �� | Weighted Avg. | | | | Weighted Avg. |
| Exercise Price Range | | Outstanding | | Maturity | | Exercise Price | | Options Exercisable | | Exercise Price |
| $ | 11.55 | - | $ | 50.10 | | 71,928 | | $ | 7.08 | | $ | 11.66 | | 71,733 | | $ | 11.63 |
| | 50.10 | - | | 63.75 | | 31,140 | | | 6.20 | | | 63.72 | | 24,717 | | | 63.72 |
| | 63.75 | - | | 103.20 | | 99,499 | | | 1.60 | | | 85.53 | | 99,499 | | | 85.53 |
| | 103.20 | - | | 170.65 | | 54,513 | | | 3.27 | | | 122.78 | | 54,513 | | | 122.78 |
| | Total | | | | | 257,080 | | $ | 4.05 | | $ | 70.12 | | 250,462 | | $ | 70.32 |
85
14. STOCK PLANS
The following table presents information on stock options outstanding for the periods shown, less estimated forfeitures:
| | (Dollars in thousands, except share and per share data) | | Year ended December 31, |
| | | 2011 | | 2010 | | 2009 |
| |
| | Intrinsic value of options exercised in the period | | $ | 34 | | $ | - | | $ | - |
| | | | | | | | | | |
| Stock options fully vested and expected to vest: | | | | | | | | | |
| Number | | | 250,734 | | | 298,918 | | | 340,890 |
| Weighted average exercise price | | $ | 70.12 | | $ | 66.90 | | $ | 65.40 |
| Aggregate intrinsic value | | $ | 282 | | $ | 190 | | $ | - |
| Weighted average contractual term of options | | | 4.1 years | | | 4.7 years | | | 5.5 years |
| | | | | | | | | | |
| Stock options vested and currently exercisable | | | | | | | | | |
| Number | | | 250,462 | | | 258,796 | | | 249,027 |
| Weighted average exercise price | | $ | 70.32 | | $ | 73.90 | | $ | 78.53 |
| Aggregate intrinsic value | | $ | 289 | | $ | 123 | | $ | - |
| Weighted average contractual term of options | | | 4.0 years | | | 4.1 years | | | 4.0 years |
| |
| Unearned compensation related to stock options | | $ | 15 | | $ | 110 | | $ | 323 |
Bancorp grants restricted stock periodically as a part of the 2002 Plan for the benefit of employees and directors. Restricted stock grants are made at the discretion of the Board of Directors, except with regard to grants to certain Company officers, which are made at the discretion of the Board’s Compensation & Personnel Committee. Compensation expense for restricted stock is based on the market price of the Company stock at the date of the grant and amortized on a straight-line basis over the vesting period which is currently one, three or four years for all grants. Recipients of restricted stock do not pay any cash consideration to the Company for the shares, have the right to vote all shares subject to such grant and receive all dividends with respect to such shares, whether or not the shares have vested, except in the case of performance awards granted in 2008 for which dividends are collected and will be forfeited if performance conditions are not met.
Restricted stock consists of the following for the years ended December 31, 2011, 2010, and 2009:
| | | | | | | Weighted | | | | | Weighted | | | | | Weighted |
| | | | | | Avg. Grant | | | | | Avg. Grant | | | | | Avg. Grant |
| | | 2011 Restricted | | Date Fair | | 2010 Restricted | | Date Fair | | 2009 Restricted | | Date Fair |
| | | Shares | | Value | | Shares | | Value | | Shares | | Value |
| Balance, beginning of year | | 327,396 | | | $ | 18.99 | | 27,336 | | | $ | 85.02 | | 42,154 | | | $ | 91.95 |
| Granted | | 63,659 | | | | 16.77 | | 322,561 | | | | 16.22 | | - | | | | - |
| Vested | | (101,273 | ) | | | 22.07 | | (13,342 | ) | | | 84.18 | | (14,237 | ) | | | 104.36 |
| Forfeited | | (25,151 | ) | | | 22.11 | | (9,159 | ) | | | 23.29 | | (581 | ) | | | 111.85 |
| | Balance, end of year | | 264,631 | | | $ | 16.98 | | 327,396 | | | $ | 18.99 | | 27,336 | | | $ | 85.02 |
| |
| Weighted avg. remaining | | | | | | | | | | | | | | | | | | |
| recognition period | | 2.33 years | | | | | | 3.03 years | | | | | | 1.29 years | | | | |
The following table presents stock-based compensation expense for employees and directors related to restricted stock and stock options for the periods shown:
| | | | Twelve months ended December 31, |
| (Dollars in thousands) | | 2011 | | 2010 | | 2009 |
| | Restricted stock expense | | $ | 1,819 | | $ | 1,883 | | $ | 1,106 |
| Stock option expense | | | 80 | | | 205 | | | 414 |
| Total stock-based compensation expense | | $ | 1,899 | | $ | 2,088 | | $ | 1,520 |
| |
| Tax benefit recognized on share-based expense | | $ | 722 | | $ | 793 | | $ | 578 |
The balance of unearned compensation related to unvested restricted stock granted as of December 31, 2011, and 2010, was $3.3 million and $4.5 million, respectively. The unearned compensation balance at December 31, 2011 is expected to be recognized over a weighted average period of 2.3 years. The Company received cash in the amount of $79,891 and $3,523 from stock option exercises for the twelve months ended December 31, 2011, and 2010, respectively. The Company had $69,350 and $0 tax benefits from disqualifying dispositions involving incentive stock options, the exercise of non-qualified stock options, and the vesting and release of restricted stock for the twelve months ended December 31, 2011, and 2010.
86
15. EARNINGS (LOSS) PER SHARE
Earnings per share is calculated under the two-class method. The two-class method is an earnings allocation formula that determines earnings per share for each class of common stock and participating security according to dividends declared (or accumulated) and participation rights in undistributed earnings. A participating security is an instrument that may participate in undistributed earnings with common stock. The Company has issued restricted stock and preferred stock that qualifies as a participating security. Basic earnings per share is computed by dividing net income available to common shareholders by the weighted average number of shares of common stock outstanding during the period.
Diluted earnings per share is computed in the same manner as basic earnings per share except that the denominator is increased to include the number of additional common shares that would have been outstanding if certain shares issuable upon exercise of options and warrants, conversion of preferred stock, and unvested restricted stock were included, unless those additional shares would have been anti-dilutive. For the diluted earnings per share computation, the treasury stock method is applied and compared to the two-class method and whichever method results in a more dilutive impact is utilized to calculate diluted earnings per share. The two-class method was utilized to calculate diluted earnings per share for the year ended December 31, 2011.
On May 19, 2011, Bancorp implemented the Reverse Stock Split. All share and per share related amounts have been restated to reflect the Reverse Stock Split. The following table reconciles the numerator and denominator of the basic and diluted earnings per share computations for the year ended December 31, 2011, 2010, and 2009:
| | (Dollars and shares in thousands, except per share amounts) | | Year ended December 31, |
| | | 2011 | | 2010 | | 2009 |
| Net income (loss) | | $ | 33,777 | | $ | 3,225 | | $ | (91,213 | ) |
| Less: Net income (loss) allocated to participating securities-basic: | | | | | | | | | | |
| Preferred stock | | | 1,998 | | | 367 | | | - | |
| Unvested restricted stock | | | 477 | | | 37 | | | (728 | ) |
| | Net income (loss) available to common stock holders-basic | | | 31,302 | | | 2,821 | | | (90,485 | ) |
| Add: Net income (loss) allocated per two-class method-diluted: | | | | | | | | | | |
| Stock options and Class C warrants | | | 108 | | | 12 | | | - | |
| Net income (loss) available to common stockholders-diluted | | $ | 31,410 | | $ | 2,833 | | $ | (90,485 | ) |
| |
| Weighted average common shares outstanding-basic | | | 19,007 | | | 17,460 | | | 3,102 | |
| Common stock equivalents from: | | | | | | | | | | |
| Stock options | | | 20 | | | 6 | | | - | |
| Class C Warrants | | | 913 | | | 593 | | | - | |
| Weighted average common shares outstanding-diluted | | | 19,940 | | | 18,059 | | | 3,102 | |
| |
| Basic earnings (loss) per share | | $ | 1.65 | | $ | 0.16 | | $ | (29.15 | ) |
| Diluted earnings (loss) per share | | $ | 1.58 | | $ | 0.16 | | $ | (29.15 | ) |
| |
| Common stock equivalent shares excluded due to anti-dilutive effect | | | 199 | | | 441 | | | 377 | |
87
16. INCOME TAXES
The components of the provision (benefit) for income taxes for the last three years were:
| | (Dollars in thousands) | | Year ended December 31, |
| | | 2011 | | 2010 | | 2009 |
| Current | | | | | | | | | | | | |
| Federal | | $ | 1,349 | | | $ | 6,230 | | | $ | (24,220 | ) |
| State | | | 100 | | | | 100 | | | | (6,982 | ) |
| | | | 1,449 | | | | 6,330 | | | | (31,202 | ) |
| Deferred | | | | | | | | | | | | |
| Federal | | | (20,206 | ) | | | (2,483 | ) | | | 10,335 | |
| State | | | (1,455 | ) | | | (57 | ) | | | 1,591 | |
| | | | (21,661 | ) | | | (2,540 | ) | | | 11,926 | |
| Total | | | | | | | | | | | | |
| Federal | | | (18,857 | ) | | | 3,747 | | | | (13,885 | ) |
| State | | | (1,355 | ) | | | 43 | | | | (5,391 | ) |
| Total provision (benefit) for income taxes | | $ | (20,212 | ) | | $ | 3,790 | | | $ | (19,276 | ) |
The deferred Federal and State tax expense includes a benefit from the full reversal of the deferred tax asset valuation allowance of $23.5 million for the year ended December 31, 2011.
The reconciliation between the Company’s effective tax rate on income (loss) and the statutory rate is as follows:
| | (Dollars in thousands) | | Year ended December 31, |
| | | 2011 | | 2010 | | 2009 |
| Expected federal income tax (benefit) provision1 | | $ | 4,612 | | | $ | 2,385 | | | $ | (38,671 | ) |
| State income tax, net of federal income tax effect | | | 422 | | | | 66 | | | | (3,504 | ) |
| Interest on obligations of state and political subdivisions | | | | | | | | | | | | |
| exempt from federal tax | | | (755 | ) | | | (901 | ) | | | (1,148 | ) |
| Federal low income housing tax credits | | | (535 | ) | | | (427 | ) | | | (972 | ) |
| Bank owned life insurance | | | (305 | ) | | | (302 | ) | | | (307 | ) |
| Goodwill impairment | | | - | | | | - | | | | 4,570 | |
| Change in deferred tax asset valuation allowance | | | (23,464 | ) | | | 2,465 | | | | 20,999 | |
| Other, net | | | (187 | ) | | | 504 | | | | (243 | ) |
| Total (benefit) provision for income taxes | | $ | (20,212 | ) | | $ | 3,790 | | | $ | (19,276 | ) |
| | 1 | | Federal income tax provision applied at 34% in 2011 and 2010 and 35% in 2009. |
Based on evaluation of the positive and negative evidence, management determined it was appropriate to establish a deferred tax asset valuation allowance of $21.0 million as of December 31, 2009, and an allowance of $23.5 million as of December 31, 2010. Based on the analysis of positive and negative evidence at December 31, 2011, including the Company’s return to profitability over the last six consecutive quarters, no deferred tax asset valuation allowance was deemed necessary as of December 31, 2011. As a result, the deferred tax asset valuation allowance of $23.5 million was reversed in the fourth quarter of 2011.
88
16. INCOME TAXES
Net deferred taxes are included in other assets on the Company’s balance sheet. The tax effect of temporary differences that give rise to significant components of deferred tax assets and deferred tax liabilities as of December 31, 2011, and 2010, are presented below:
| (Dollars in thousands) | | December 31, |
| | | 2011 | | 2010 |
| | Deferred tax assets: | | | | | | | |
| Allowance for loan losses | | $ | 13,532 | | $ | 15,455 | |
| Reserve for unfunded commitments | | | 296 | | | 327 | |
| Deferred employee benefits | | | 2,247 | | | 1,768 | |
| Stock option and restricted stock | | | 732 | | | 973 | |
| Valuation allowance on OREO | | | 3,133 | | | 2,914 | |
| Capitalized OREO expenses | | | 1,050 | | | 988 | |
| Taxable interest on nonaccrual loans | | | 2,646 | | | 2,207 | |
| State net operating loss carryforwards | | | 3,093 | | | 3,195 | |
| State business energy and low income housing tax credits | | | 770 | | | 631 | |
| Federal low income housing tax credits | | | 1,776 | | | 2,313 | |
| Other | | | 3,085 | | | 3,514 | |
| Total gross deferred tax assets | | | 32,360 | | | 34,285 | |
| |
| Deferred tax liabilities: | | | | | | | |
| Accumulated depreciation | | | 957 | | | 868 | |
| Net unrealized gain on investments available for sale | | | 4,813 | | | 327 | |
| Loan origination costs | | | 1,610 | | | 1,645 | |
| Federal Home Loan Bank stock dividends | | | 1,893 | | | 1,893 | |
| Intangible assets | | | - | | | 138 | |
| Other | | | 123 | | | 161 | |
| Total gross deferred tax liabilities | | | 9,396 | | | 5,032 | |
| Net deferred tax assets before valuation allowance | | | 22,964 | | | 29,253 | |
| Deferred tax asset valuation allowance | | | - | | | (23,464 | ) |
| Net deferred tax assets | | $ | 22,964 | | $ | 5,789 | |
Primarily as a result of the Company reversing its deferred tax asset valuation allowance in 2011, the Company’s net deferred tax asset increased by $17.2 million to $23.0 million at December 31, 2011.
At December 31, 2011, the Company has state tax net operating loss carryforwards of $3.1 million and state tax credit carryforwards of $.8 million. In addition, the Company has $1.8 million of federal tax credits. The following table summarizes the expiration dates of federal tax credits and state net operating loss and tax credit carryforwards:
| (Dollars in thousands) | | | |
| | Year of expiration | | Type | | Amount |
| 2023-2026 | | State net operating losses | | $ | 3,093 |
| 2016-2019 | | State tax credits- business energy | | | 654 |
| 2013-2016 | | State tax credits- low income housing | | | 116 |
| 2028-2031 | | Federal tax credits- low income housing | | | 1,776 |
Bancorp is subject to U.S. federal income taxes and State of Oregon income taxes. The years 2008 through 2011 remain open to examination for federal income taxes, and years 2008 through 2011 remain open for State examination. As of December 31, 2011, and 2010, Bancorp had no unrecognized tax benefits or uncertain tax positions. Bancorp had no accrued interest or penalties as of December 31, 2011.
17. TIME DEPOSITS
Included in time deposits are deposits in denominations of $100,000 or greater, totaling $54.5 million and $87.9 million at December 31, 2011, and 2010, respectively. Interest expense relating to time deposits in denominations of $100,000 or greater was $1.0 million, $2.7 million, and $5.9 million for the years ended December 31, 2011, 2010, and 2009, respectively. Maturity amounts on Bancorp’s time deposits include $132.4 million in 2012, $25.7 million in 2013, $8.8 million in 2014, $2.4 million in 2015, and $3.8 million in 2016. Included in the maturity amounts are $1.9 million in variable rate time deposits that reprice monthly with maturities in the first quarter of 2012.
89
18. FAIR VALUE MEASUREMENT AND FAIR VALUES OF FINANCIAL INSTRUMENTS
A financial instrument is defined as cash, evidence of an ownership interest in an entity, or a contract that conveys or imposes the contractual right or obligation to either receive or deliver cash or another financial instrument. Examples of financial instruments included in Bancorp’s balance sheet are cash, federal funds sold, debt and equity securities, loans, demand, savings and other interest-bearing deposits, notes and debentures. Examples of financial instruments which are not included in the Bancorp balance sheet are commitments to extend credit and standby letters of credit.
Fair value is defined asthe price that would be received to sell an asset or paid to transfer a liability in an orderly transaction between market participants at the measurement date.
Accounting standards require the fair value of deposit liabilities with no stated maturity, such as demand deposits, NOW and money market accounts, to equal the carrying value of these financial instruments and does not allow for the recognition of the inherent value of core deposit relationships when determining fair value.
Bancorp has estimated fair value based on quoted market prices where available. In cases where quoted market prices were not available, fair values were based on the quoted market price of a financial instrument with similar characteristics, the present value of expected future cash flows or other valuation techniques that utilize assumptions which are subjective and judgmental in nature. Subjective factors include, among other things, estimates of cash flows, the timing of cash flows, risk and credit quality characteristics, interest rates and liquidity premiums or discounts. Accordingly, the results may not be precise, and modifying the assumptions may significantly affect the values derived. Further, fair values may or may not be realized if a significant portion of the financial instruments are sold in a bulk transaction or a forced liquidation. Therefore, any aggregate unrealized gains or losses should not be interpreted as a forecast of future earnings or cash flows. Furthermore, the fair values disclosed should not be interpreted as the aggregate current value of Bancorp.
The following methods and assumptions were used to estimate the fair value of each class of financial instruments for which it is practicable to estimate that value:
Cash and cash equivalents - The carrying amount is a reasonable estimate of fair value.
Trading securities–Trading securities held at December 31, 2011, are related solely to bonds, equity securities and mutual funds held in a rabbi trust for benefit of the Company’s deferred compensation plans. Fair values for trading securities are based on quoted market prices.
Investment securities - For substantially all securities within the categories U.S. Treasuries, U.S. Government agencies, mortgage-backed, obligations of state and political subdivisions, and equity investments and other securities held for investment purposes, fair values are based on quoted market prices or dealer quotes if available. When quoted market prices are not readily accessible or available, the use of alternative approaches, such as matrix or model pricing or indicators from market makers, is used. If a quoted market price is not available due to illiquidity, fair value is estimated using quoted market prices for similar securities or other modeling techniques. If neither a quoted market price nor market prices for similar securities are available, fair value is estimated by discounting expected cash flows using a market derived discount rate as of the valuation date.
Our level 3 assets consist of pooled trust preferred securities, certain municipal securities and auction rate securities. The fair values of these securities were estimated using the discounted cash flow method. The fair value for these securities used inputs for base case default, recovery and prepayment rates to estimate the probable cash flows for the security. The estimated cash flows were discounted using a rate for comparably rated securities adjusted for an additional liquidity premium.
Loans - The fair value of loans is estimated by discounting the future cash flows using the current rate at which similar loans would be made to borrowers with similar credit ratings and for the same remaining maturities. An additional liquidity discount is also incorporated to more closely align the fair value with observed market prices.
90
18. FAIR VALUE MEASUREMENT AND FAIR VALUES OF FINANCIAL INSTRUMENTS
Impaired loans- A loan is considered to be impaired when, based on current information and events, it is probable that the Company will be unable to collect all amounts due (both interest and principal) according to the contractual terms of the loan agreement. Impaired loans are measured based on the present value of expected future cash flows discounted at the loan’s effective interest rate or, as a practical expedient, at the loan’s observable market price or the fair market value of the collateral. A significant portion of the Bank's impaired loans are measured using the fair market value of the collateral.
Bank owned life insurance - The carrying amount is the cash surrender value of all policies, which approximates fair value.
Other real estate owned- Management obtains third party appraisals as well as independent fair market value assessments from realtors or persons involved in selling OREO in determining the fair value of particular properties. Accordingly, the valuation of OREO is subject to significant external and internal judgment. Management periodically reviews OREO and obtains periodic appraisals to determine whether the property continues to be carried at the lower of its recorded book value or fair value less estimated selling costs.
Goodwill–The method used to determine the impairment charge taken first quarter 2009 involved a two-step process. The first step estimated fair value using a combination of quoted market price and an estimate of a control premium. It was determined that the fair value of the Company’s Banking reporting unit was less than its book value and the carrying amount of the Company’s Banking reporting unit goodwill exceeded its implied fair value. The second step calculated the implied fair value of goodwill which required allocation of the fair value to all of the assets and liabilities of the reporting unit, including any unrecognized intangible assets, in a hypothetical analysis.
Deposit liabilities - The fair value of demand deposits, savings accounts and other deposits is the amount payable on demand at the reporting date. The fair value of time deposits is estimated using the rates currently offered for deposits of similar remaining maturities.
Short-term borrowings - The carrying amount is a reasonable estimate of fair value given the short-term nature of these financial instruments.
Long-term borrowings - The fair value of the long-term borrowings is estimated by discounting the future cash flows using the current rate at which similar borrowings with similar remaining maturities could be made.
Junior subordinated debentures - The fair value of the variable rate junior subordinated debentures issued in connection with our trust preferred securities approximates the pricing of a preferred security at current market prices.
Commitments to extend credit, standby letters of credit and financial guarantees - The majority of our commitments to extend credit carry current market interest rates if converted to loans.
The tables below present fair value information on certain assets broken down by recurring or nonrecurring measurement status. Recurring assets are initially measured at fair value and are required to be reflected at fair value in the financial statements at each reporting date. Assets measured on a nonrecurring basis are assets that due to an event or circumstance were required to be re-measured at fair value after initial recognition in the financial statements at some time during the reporting period.
Assets are classified as level 1-3 based on the lowest level of input that has a significant effect on fair value. The following definitions describe the level 1-3 categories for inputs used in the tables presented below.
Quoted prices in active markets for identical assets (Level 1): Inputs that are quoted unadjusted prices in active markets for identical assets that the Company has the ability to access at the measurement date. An active market for the asset is a market in which transactions for the asset or liability occur with sufficient frequency and volume to provide pricing information on an ongoing basis.
Other observable inputs (Level 2): Inputs that reflect the assumptions market participants would use in pricing the asset or liability developed based on market data obtained from sources independent of the reporting entity including quoted prices for similar assets, quoted prices for securities in inactive markets and inputs derived principally from or corroborated by observable market data by correlation or other means.
Significant unobservable inputs (Level 3): Inputs that reflect the reporting entity's own estimates about the assumptions market participants would use in pricing the asset or liability developed based on the best information available in the circumstances.
91
18. FAIR VALUE MEASUREMENT AND FAIR VALUES OF FINANCIAL INSTRUMENTS
The following table presents fair value measurements for assets that are measured at fair value on a recurring basis subsequent to initial recognition:
| | | | | | | Fair value measurements at December 31, 2011, using |
| | | | | | Quoted prices in active | | Other observable | | Significant |
| | | Total fair value | | markets for identical assets | | inputs | | unobservable inputs |
| (Dollars in thousands) | | December 31, 2011 | | (Level 1) | | (Level 2) | | (Level 3) |
| Trading securities | | $ | 747 | | $ | 747 | | $ | - | | $ | - |
| Available for sale securities: | | | | | | | | | | | | |
| U.S. Treasury securities | | | 203 | | | - | | | 203 | | | - |
| U.S. Government agency securities | | | 219,631 | | | - | | | 219,631 | | | - |
| Corporate securities | | | 8,507 | | | - | | | - | | | 8,507 |
| Mortgage-backed securities | | | 428,725 | | | - | | | 428,725 | | | - |
| Obligations of state and political subdivisions | | | 60,732 | | | - | | | 60,732 | | | - |
| Equity investments and other securities | | | 12,046 | | | 1,980 | | | 10,066 | | | - |
| Total recurring assets measured at fair value | | $ | 730,591 | | $ | 2,727 | | $ | 719,357 | | $ | 8,507 |
| | | | | | | Fair value measurements at December 31, 2010, using |
| | | | | | Quoted prices in active | | Other observable | | Significant |
| | | Total fair value | | markets for identical assets | | inputs | | unobservable inputs |
| (Dollars in thousands) | | December 31, 2010 | | (Level 1) | | (Level 2) | | (Level 3) |
| Trading securities | | $ | 808 | | $ | 808 | | $ | - | | $ | - |
| Available for sale securities: | | | | | | | | | | | | |
| U.S. Treasury securities | | | 14,392 | | | - | | | 14,392 | | | - |
| U.S. Government agency securities | | | 194,230 | | | - | | | 194,230 | | | - |
| Corporate securities | | | 9,392 | | | - | | | - | | | 9,392 |
| Mortgage-backed securities | | | 363,618 | | | - | | | 363,618 | | | - |
| Obligations of state and political subdivisions | | | 52,645 | | | - | | | 51,688 | | | 957 |
| Equity investments and other securities | | | 11,835 | | | 1 | | | 11,834 | | | - |
| Total recurring assets measured at fair value | | $ | 646,920 | | $ | 809 | | $ | 635,762 | | $ | 10,349 |
During second quarter 2011, the Company transferred $2.0 million in equity investments and other securities from a level 2 instrument to a level 1 instrument. The Company transferred $14.4 million in U.S. Treasury securities from a level 1 instrument to a level 2 instrument at December 31, 2010. In addition, the Company had no material changes in valuation techniques for recurring and nonrecurring assets measured at fair value during the year ended December 31, 2011.
92
18. FAIR VALUE MEASUREMENT AND FAIR VALUES OF FINANCIAL INSTRUMENTS
The following table represents a reconciliation of level 3 instruments for assets that are measured at fair value on a recurring basis for the full year 2011 and 2010:
| | | | Twelve months ended December 31, 2011 |
| (Dollars in thousands) | | Balance January
1, 2011 | | Gains (loss)
included in other
comprehensive
income (loss) | | Reclassification of
losses from adjustment
for impairment of
securities | | Purchases, Issuances,
and Sales | | Balance
December 31,
2011 |
| Corporate securities | | $ | 9,392 | | $ | (1,064 | ) | | $ | 179 | | $ | - | | | $ | 8,507 |
| Obligations of state and political | | | | | | | | | | | | | | | | | |
| subdivisions | | | 957 | | | (109 | ) | | | - | | | (848 | ) | | | - |
| Fair value | | $ | 10,349 | | $ | (1,173 | ) | | $ | 179 | | $ | (848 | ) | | $ | 8,507 |
| |
| | | | Twelve months ended December 31, 2010 |
| (Dollars in thousands) | | Balance January
1, 2010 | | Gains (loss)
included in other
comprehensive
income (loss) | | Reclassification of
losses from adjustment
for impairment of
securities | | Purchases, Issuances,
and Sales | | Balance
December 31,
2010 |
| Corporate securities | | $ | 9,753 | | $ | (361 | ) | | $ | - | | $ | - | | | $ | 9,392 |
| Obligations of state and political | | | | | | | | | | | | | | | | | |
| subdivisions | | | 973 | | | (16 | ) | | | - | | | - | | | | 957 |
| Fair value | | $ | 10,726 | | $ | (377 | ) | | $ | - | | $ | - | | | $ | 10,349 |
The losses from adjustments for OTTI of securities were recognized in noninterest income in the consolidated income statement.
Certain assets and liabilities are measured at fair value on a nonrecurring basis after initial recognition such as loans held for sale, loans measured for impairment and OREO. For the twelve months ended December 31, 2011, and 2010, loans held for sale were subject to the lower of cost or market method of accounting. There was no impairment recognized on loans held for sale at December 31, 2011, or 2010. For the twelve months ended December 31, 2011, loans amounting to $56.4 million in Bancorp’s loan portfolio were deemed impaired. OREO that was taken into possession during 2011 was measured at fair value less sales expense. In addition, during 2011, certain properties were written down $4.8 million to reflect additional decreases in their fair market value after initial recognition at the time the property was placed into OREO.
There were no nonrecurring level 1 or 2 fair value measurements in 2011 or 2010. The following table represents the level 3 fair value measurements for nonrecurring assets for the periods presented:
| | | | Twelve months ended December 31, 2011 |
| (Dollars in thousands) | | Impairment | | Fair Value1 |
| Loans measured for impairment | | $ | 15,410 | | $ | 68,466 |
| OREO | | | 4,832 | | | 60,491 |
| Total nonrecurring assets measured at fair value | | $ | 20,242 | | $ | 128,957 |
| |
| |
| | | Twelve months ended December 31, 2010 |
| (Dollars in thousands) | | Impairment | | Fair Value1 |
| Loans measured for impairment | | $ | 19,476 | | $ | 82,910 |
| OREO | | | 6,649 | | | 74,146 |
| Total nonrecurring assets measured at fair value | | $ | 26,125 | | $ | 157,056 |
| 1 | | Fair value excludes costs to sell collateral. |
93
18. FAIR VALUE MEASUREMENT AND FAIR VALUES OF FINANCIAL INSTRUMENTS
The fair values of financial instruments at December 31, 2011, are as follows:
| (Dollars in thousands) | | Carrying Value | | Fair Value |
| | FINANCIAL ASSETS: | | | | | | |
| Cash and cash equivalents | | $ | 92,227 | | $ | 92,227 |
| Trading securities | | | 747 | | | 747 |
| Investment securities available for sale | | | 729,844 | | | 729,844 |
| Federal Home Loan Bank stock | | | 12,148 | | | 12,148 |
| Net loans (net of allowance for loan losses | | | | | | |
| and including loans held for sale) | | | 1,469,370 | | | 1,394,586 |
| Bank owned life insurance | | | 26,228 | | | 26,228 |
| |
| FINANCIAL LIABILITIES: | | | | | | |
| Deposits | | $ | 1,915,569 | | $ | 1,916,030 |
| Long-term borrowings | | | 120,000 | | | 120,032 |
| |
| Junior subordinated debentures-variable | | | 51,000 | | | 27,350 |
The fair values of financial instruments at December 31, 2010, are as follows:
| (Dollars in thousands) | | Carrying Value | | Fair Value |
| | FINANCIAL ASSETS: | | | | | | |
| Cash and cash equivalents | | $ | 177,991 | | $ | 177,991 |
| Trading securities | | | 808 | | | 808 |
| Investment securities available for sale | | | 646,112 | | | 646,112 |
| Federal Home Loan Bank stock | | | 12,148 | | | 12,148 |
| Net loans (net of allowance for loan losses | | | | | | |
| and including loans held for sale) | | | 1,499,155 | | | 1,407,366 |
| Bank owned life insurance | | | 25,313 | | | 25,313 |
| | |
| FINANCIAL LIABILITIES: | | | | | | |
| Deposits | | $ | 1,940,522 | | $ | 1,942,301 |
| Long-term borrowings | | | 168,599 | | | 175,305 |
| | |
| Junior subordinated debentures-variable | | | 51,000 | | | 26,597 |
94
19. FINANCIAL INSTRUMENTS WITH OFF BALANCE SHEET RISK
The Bank has financial instruments with off balance sheet risk in the normal course of business to meet the financing needs of its customers. These financial instruments include commitments to extend credit and standby letters of credit. Those instruments involve, to varying degrees, elements of credit and interest rate risk in excess of the amount recognized in the consolidated balance sheets.
The Bank’s exposure to credit loss in the event of nonperformance by the other party to the financial instrument for commitments to extend credit and standby letters of credit is represented by the contractual notional amount of those instruments. The Bank uses the same credit policies in making commitments and conditional obligations as for on-balance sheet instruments. As of December 31, 2011, and 2010, outstanding commitments consist of the following:
| | | Contract or | | Contract or |
| | Notional Amount | | Notional Amount |
| | (Dollars in thousands) | December 31, 2011 | | December 31, 2010 |
| Financial instruments whose contract amounts represent credit risk: | | | | | |
| Commitments to extend credit in the form of loans | | | | | |
| Commercial | $ | 251,105 | | $ | 246,702 |
| Real estate construction | | 23,932 | | | 10,568 |
| Real estate mortgage | | | | | |
| Mortgage | | 3,419 | | | 4,265 |
| Home equity line of credit | | 150,196 | | | 154,073 |
| Total real estate mortgage loans | | 153,615 | | | 158,338 |
| Commercial real estate | | 10,993 | | | 7,756 |
| Installment and consumer | | 9,907 | | | 10,734 |
| Other1 | | 12,803 | | | 10,395 |
| Standby letters of credit and financial guarantees | | 8,349 | | | 8,531 |
| Account overdraft protection instruments | | 103,642 | | | 118,596 |
| Total | $ | 574,346 | | $ | 571,620 |
| 1 | | The category “other” represents commitments extended to clients or borrowers that have been extended but not yet fully executed. These extended commitments are not yet classified nor have they been placed into our loan system. |
Commitments to extend credit are agreements to lend to a customer, as long as there is no violation of any condition established in the contract. Commitments generally have fixed expiration dates or other termination clauses and may require payment of a fee. Many of the commitments may expire without being drawn upon; therefore total commitment amounts do not necessarily represent future cash requirements. Each customer’s creditworthiness is evaluated on a case-by-case basis. The amount of collateral obtained, if deemed necessary upon extension of credit, is based on the Bank’s credit evaluation of the customer. Collateral held varies, but may include real property, accounts receivable, inventory, property, plant and equipment, and income-producing commercial properties.
Total outstanding commitments of $574.3 million at December 31, 2011, increased by $2.7 million since December 31, 2010. Outstanding commitments for real estate construction increased by $13.4 million while outstanding commitments for account overdraft protection instruments decreased by $15.0 million in 2011, primarily as a result of an increase in the number of customers who have elected to not participate in our overdraft protection program for ATM and one time debit card transactions.
Standby letters of credit are conditional commitments issued to support a customer’s performance or payment obligation to a third party. The credit risk involved in issuing letters of credit is essentially the same as that involved in extending loan facilities to customers.
Interest rates on residential 1-4 family mortgage loan applications are typically rate locked during the application stage for periods ranging from 15 to 45 days, the most typical period being 30 days. These loans are locked with various qualified investors under a best-efforts delivery program. The Company makes every effort to deliver these loans before their rate locks expire. This arrangement generally requires the Bank to deliver the loans prior to the expiration of the rate lock. Delays in funding the loans may require a lock extension. The cost of a lock extension at times is borne by the borrower and at times by the Bank. These lock extension costs paid by the Bank are not expected to have a material impact on operations. This activity is managed daily.
95
20. PARENT COMPANY ONLY FINANCIAL DATA
The following sets forth the condensed financial information of West Coast Bancorp on a stand-alone basis:
WEST COAST BANCORP
UNCONSOLIDATED BALANCE SHEETS
| | As of December 31 (Dollars in thousands) | | 2011 | | 2010 |
| Assets: | | | | | | |
| Cash and cash equivalents | | $ | 8,696 | | $ | 10,910 |
| | Investment in bank subsidiary | | | 352,187 | | | 309,951 |
| Investment in other subsidiaries | | | 4,914 | | | 5,223 |
| Other assets | | | 1,901 | | | 1,892 |
| Total assets | | $ | 367,698 | | $ | 327,976 |
| |
| Liabilities and stockholders’ equity: | | | | | | |
| Junior subordinated debentures | | $ | 51,000 | | $ | 51,000 |
| Other liabilities | | | 2,219 | | | 4,416 |
| Total liabilities | | | 53,219 | | | 55,416 |
| Stockholders’ equity | | | 314,479 | | | 272,560 |
| Total liabilities and stockholders’ equity | | $ | 367,698 | | $ | 327,976 |
WEST COAST BANCORP
UNCONSOLIDATED STATEMENTS OF INCOME (LOSS)
| | Year ended December 31 (Dollars in thousands) | | 2011 | | 2010 | | 2009 |
| Income: | | | | | | | | | | | | |
| Cash dividends from Bank | | $ | - | | | $ | - | | | $ | - | |
| | Other income | | | 12 | | | | 10 | | | | 10 | |
| Total income | | | 12 | | | | 10 | | | | 10 | |
| Expenses: | | | | | | | | | | | | |
| Interest expense | | | 1,178 | | | | 1,143 | | | | 1,483 | |
| Other expense | | | 887 | | | | 961 | | | | 905 | |
| Total expense | | | 2,065 | | | | 2,104 | | | | 2,388 | |
| Loss before income taxes and equity in | | | | | | | | | | | | |
| undistributed earnings (loss) of the subsidiaries | | | (2,053 | ) | | | (2,094 | ) | | | (2,378 | ) |
| Income tax benefit | | | 801 | | | | 816 | | | | 927 | |
| Net loss before equity in undistributed | | | | | | | | | | | | |
| earnings (loss) of the subsidiaries | | | (1,252 | ) | | | (1,278 | ) | | | (1,451 | ) |
| Equity in undistributed earnings (loss) of the subsidiaries | | | 35,029 | | | | 4,503 | | | | (89,762 | ) |
| Net income (loss) | | $ | 33,777 | | | $ | 3,225 | | | $ | (91,213 | ) |
96
20. PARENT COMPANY ONLY FINANCIAL DATA
WEST COAST BANCORP
UNCONSOLIDATED STATEMENTS OF CASH FLOWS
| | Year ended December 31 (Dollars in thousands) | | 2011 | | 2010 | | 2009 |
| CASH FLOWS FROM OPERATING ACTIVITIES: | | | | | | | | | | | | |
| Net income (loss) | | $ | 33,777 | | | $ | 3,225 | | | $ | (91,213 | ) |
| Adjustments to reconcile net income (loss) to net cash | | | | | | | | | | | | |
| | provided by operating activities: | | | | | | | | | | | | |
| Undistributed (earnings) loss of subsidiaries | | | (35,029 | ) | | | (4,503 | ) | | | 89,762 | |
| (Increase) decrease in other assets | | | (168 | ) | | | (892 | ) | | | 1,137 | |
| Increase (decrease) in other liabilities | | | (2,197 | ) | | | (1,294 | ) | | | 3,222 | |
| Excess tax benefit associated with stock plans | | | (66 | ) | | | - | | | | - | |
| Stock based compensation expense | | | 1,899 | | | | 2,089 | | | | 1,520 | |
| Net cash (used) provided by operating activities | | | (1,784 | ) | | | (1,375 | ) | | | 4,428 | |
| |
| CASH FLOWS FROM INVESTING ACTIVITIES: | | | | | | | | | | | | |
| Capital contribution to subsidiaries | | | - | | | | (15,300 | ) | | | (134,248 | ) |
| Net cash used in investing activities | | | - | | | | (15,300 | ) | | | (134,248 | ) |
| |
| CASH FLOWS FROM FINANCING ACTIVITIES: | | | | | | | | | | | | |
| Activity in deferred compensation plan | | | (27 | ) | | | 262 | | | | (1 | ) |
| Proceeds from issuance of common stock | | | 80 | | | | 16,393 | | | | - | |
| Fractional share payment | | | (18 | ) | | | - | | | | - | |
| Redemption of stock pursuant to stock plans | | | (531 | ) | | | (35 | ) | | | (22 | ) |
| Excess tax benefit associated with stock plans | | | 66 | | | | - | | | | - | |
| Proceeds from issuance of preferred stock, net of costs | | | - | | | | - | | | | 139,248 | |
| Cash dividends paid | | | - | | | | - | | | | (471 | ) |
| Net cash provided by (used in) financing activities | | | (430 | ) | | | 16,620 | | | | 138,754 | |
| |
| Net increase (decrease) in cash and cash equivalents | | | (2,214 | ) | | | (55 | ) | | | 8,934 | |
| Cash and cash equivalents at beginning of year | | | 10,910 | | | | 10,965 | | | | 2,031 | |
| Cash and cash equivalents at end of year | | $ | 8,696 | | | $ | 10,910 | | | $ | 10,965 | |
During the year ended December 31, 2010, the Parent Company made non-cash capital contributions of $.53 million to the Bank in the form of an intercompany tax settlement. No such contributions were made during the year ended December 31, 2011.
97
21. SEGMENT AND RELATED INFORMATION
Bancorp accounts for intercompany fees and services at a fair value according to regulatory requirements for the service provided. Intercompany items relate primarily to the use of accounting, human resources, data processing and marketing services provided by the Bank, West Coast Trust, and the holding company. All other accounting policies are the same as those described in the summary of significant accounting policies.
Summarized financial information concerning Bancorp’s reportable segments and the reconciliation to Bancorp’s consolidated results is shown in the following table. The “Other” column includes West Coast Trust’s operations and holding company related items including activity relating to trust preferred securities. Investment in subsidiaries is netted out of the presentations below. The “Intercompany” column identifies the intercompany activities of revenues, expenses and other assets, between the “Banking” and “Other” segment.
| | | | As of and for the year ended |
| (Dollars in thousands) | | December 31, 2011 |
| | | Banking | | Other | | Intercompany | | Consolidated |
| Interest income | | $ | 98,629 | | | $ | 46 | | | $ | - | | | $ | 98,675 | |
| | Interest expense | | | 16,743 | | | | 1,178 | | | | - | | | | 17,921 | |
| Net interest income (loss) | | | 81,886 | | | | (1,132 | ) | | | - | | | | 80,754 | |
| Provision for credit losses | | | 8,133 | | | | - | | | | - | | | | 8,133 | |
| Noninterest income | | | 29,796 | | | | 3,105 | | | | (1,082 | ) | | | 31,819 | |
| Noninterest expense | | | 88,298 | | | | 3,659 | | | | (1,082 | ) | | | 90,875 | |
| Income (loss) before income taxes | | | 15,251 | | | | (1,686 | ) | | | - | | | | 13,565 | |
| Provision (benefit) for income taxes | | | (19,555 | ) | | | (657 | ) | | | - | | | | (20,212 | ) |
| Net income (loss) | | $ | 34,806 | | | $ | (1,029 | ) | | $ | - | | | $ | 33,777 | |
| |
| Depreciation, amortization and accretion | | $ | 8,964 | | | $ | 30 | | | $ | - | | | $ | 8,994 | |
| Assets | | $ | 2,424,832 | | | $ | 15,636 | | | $ | (10,581 | ) | | $ | 2,429,887 | |
| Loans, net | | $ | 1,466,089 | | | $ | - | | | $ | - | | | $ | 1,466,089 | |
| Deposits | | $ | 1,925,567 | | | $ | - | | | $ | (9,998 | ) | | $ | 1,915,569 | |
| Equity | | $ | 352,188 | | | $ | (37,709 | ) | | $ | - | | | $ | 314,479 | |
| |
| | | As of and for the year ended |
| (Dollars in thousands) | | December 31, 2010 |
| | | Banking | | Other | | Intercompany | | Consolidated |
| Interest income | | $ | 105,510 | | | $ | 66 | | | $ | - | | | $ | 105,576 | |
| Interest expense | | | 21,126 | | | | 1,143 | | | | - | | | | 22,269 | |
| Net interest income (loss) | | | 84,384 | | | | (1,077 | ) | | | - | | | | 83,307 | |
| Provision for credit losses | | | 18,652 | | | | - | | | | - | | | | 18,652 | |
| Noninterest income | | | 30,789 | | | | 3,053 | | | | (1,145 | ) | | | 32,697 | |
| Noninterest expense | | | 87,841 | | | | 3,641 | | | | (1,145 | ) | | | 90,337 | |
| Loss before income taxes | | | 8,680 | | | | (1,665 | ) | | | - | | | | 7,015 | |
| Benefit for income taxes | | | 4,439 | | | | (649 | ) | | | - | | | | 3,790 | |
| Net income (loss) | | $ | 4,241 | | | $ | (1,016 | ) | | $ | - | | | $ | 3,225 | |
| |
| Depreciation, amortization and accretion | | $ | 8,742 | | | $ | 36 | | | $ | - | | | $ | 8,778 | |
| Assets | | $ | 2,456,223 | | | $ | 17,650 | | | $ | (12,814 | ) | | $ | 2,461,059 | |
| Loans, net | | $ | 1,496,053 | | | $ | - | | | $ | - | | | $ | 1,496,053 | |
| Deposits | | $ | 1,952,780 | | | $ | - | | | $ | (12,258 | ) | | $ | 1,940,522 | |
| Equity | | $ | 310,487 | | | $ | (37,927 | ) | | $ | - | | | $ | 272,560 | |
98
21. SEGMENT AND RELATED INFORMATION
| | | | As of and for the year ended |
| (Dollars in thousands) | | December 31, 2009 |
| | | Banking | | Other | | Intercompany | | Consolidated |
| | Interest income | | $ | 112,068 | | | $ | 82 | | | $ | - | | | $ | 112,150 | |
| Interest expense | | | 31,941 | | | | 1,482 | | | | - | | | | 33,423 | |
| Net interest income (loss) | | | 80,127 | | | | (1,400 | ) | | | - | | | | 78,727 | |
| Provision for credit losses | | | 90,057 | | | | - | | | | - | | | | 90,057 | |
| Noninterest income | | | 7,208 | | | | 3,032 | | | | (1,111 | ) | | | 9,129 | |
| Noninterest expense | | | 105,917 | | | | 3,482 | | | | (1,111 | ) | | | 108,288 | |
| Loss before income taxes | | | (108,639 | ) | | | (1,850 | ) | | | - | | | | (110,489 | ) |
| Benefit for income taxes | | | (18,555 | ) | | | (721 | ) | | | - | | | | (19,276 | ) |
| Net loss | | $ | (90,084 | ) | | $ | (1,129 | ) | | $ | - | | | $ | (91,213 | ) |
| |
| Depreciation, amortization and accretion | | $ | 8,253 | | | $ | 28 | | | $ | - | | | $ | 8,281 | |
| Assets | | $ | 2,729,453 | | | $ | 17,370 | | | $ | (13,276 | ) | | $ | 2,733,547 | |
| Loans, net | | $ | 1,686,352 | | | $ | - | | | $ | - | | | $ | 1,686,352 | |
| Deposits | | $ | 2,159,342 | | | $ | - | | | $ | (12,458 | ) | | $ | 2,146,884 | |
| Equity | | $ | 288,477 | | | $ | (39,419 | ) | | $ | - | | | $ | 249,058 | |
22. RELATED PARTY TRANSACTIONS
As of December 31, 2011, the Bank had loan commitments to directors, senior officers, principal stockholders and their related interests totaling $6.3 million, unchanged from December 31, 2010. These commitments and the loan balances below were made substantially on the same terms in the course of ordinary banking business, including interest rates, maturities and collateral as those made to other customers of the Bank.
The following table presents a summary of outstanding balances for loans made to directors, senior officers, and principal stockholders of the Company and their related interests:
| (Dollars in thousands) | | December 31, |
| | 2011 | | 2010 |
| Balance, beginning of period | | $ | 5,039 | | | $ | 3,893 | |
| New loans and advances | | | 587 | | | | 1,237 | |
| Principal payments and payoffs | | | (74 | ) | | | (91 | ) |
| Balance, end of period | | $ | 5,552 | | | $ | 5,039 | |
99
23. QUARTERLY FINANCIAL INFORMATION (unaudited)
| | 2011 | | | | | | | | | | | | | | | | |
| (Dollars in thousands, except per share data) | | December 31, | | September 30, | | June 30, | | March 31, |
| Interest income | | $ | 23,932 | | | $ | 24,721 | | | $ | 25,104 | | | $ | 24,918 | |
| Interest expense | | | 5,992 | | | | 5,380 | | | | 3,143 | | | | 3,406 | |
| | Net interest income | | | 17,940 | | | | 19,341 | | | | 21,961 | | | | 21,512 | |
| Provision for credit losses | | | 1,499 | | | | 1,132 | | | | 3,426 | | | | 2,076 | |
| Noninterest income | | | 6,419 | | | | 8,414 | | | | 8,070 | | | | 8,916 | |
| Noninterest expense | | | 22,744 | | | | 22,620 | | | | 22,958 | | | | 22,553 | |
| Income before income taxes | | | 116 | | | | 4,003 | | | | 3,647 | | | | 5,799 | |
| Provision (benefit) for income taxes | | | (17,646 | ) | | | (2,273 | ) | | | (987 | ) | | | 694 | |
| Net income | | $ | 17,762 | | | $ | 6,276 | | | $ | 4,634 | | | $ | 5,105 | |
| |
| Earnings per share: | | | | | | | | | | | | | | | | |
| Basic | | $ | 0.87 | | | $ | 0.31 | | | $ | 0.23 | | | $ | 0.25 | |
| Diluted | | $ | 0.83 | | | $ | 0.29 | | | $ | 0.22 | | | $ | 0.25 | |
| |
| 2010 | | | | | | | | | | | | |
| (Dollars in thousands, except per share data) | | December 31, | | September 30, | | June 30, | | March 31, |
| Interest income | | $ | 25,509 | | | $ | 26,053 | | | $ | 26,816 | | | $ | 27,198 | |
| Interest expense | | | 3,620 | | | | 4,178 | | | | 7,906 | | | | 6,565 | |
| Net interest income | | | 21,889 | | | | 21,875 | | | | 18,910 | | | | 20,633 | |
| Provision for credit losses | | | 1,693 | | | | 1,567 | | | | 7,758 | | | | 7,634 | |
| Noninterest income | | | 8,595 | | | | 8,069 | | | | 9,625 | | | | 6,408 | |
| Noninterest expense | | | 23,330 | | | | 23,003 | | | | 22,909 | | | | 21,095 | |
| Income (loss) before income taxes | | | 5,461 | | | | 5,374 | | | | (2,132 | ) | | | (1,688 | ) |
| Provision (benefit) for income taxes | | | 3,549 | | | | (676 | ) | | | 1,717 | | | | (800 | ) |
| Net income (loss) | | $ | 1,912 | | | $ | 6,050 | | | $ | (3,849 | ) | | $ | (888 | ) |
| |
| Earnings (loss) per common share: | | | | | | | | | | | | | | | | |
| Basic | | $ | 0.09 | | | $ | 0.30 | | | ($ | 0.20 | ) | | ($ | 0.05 | ) |
| Diluted | | $ | 0.09 | | | $ | 0.29 | | | ($ | 0.20 | ) | | ($ | 0.05 | ) |
100
| ITEM 9. | | CHANGES IN AND DISAGREEMENTS WITH ACCOUNTANTS ON ACCOUNTING AND FINANCIAL DISCLOSURE. |
None.
ITEM 9A.CONTROLS AND PROCEDURES
Disclosure Controls and Procedures
Our disclosure controls and procedures are designed to ensure that information the Company must disclose in its reports filed or submitted under the Securities Exchange Act of 1934, as amended (the “Exchange Act”), is recorded, processed, summarized, and reported within the time periods specified in the Securities and Exchange Commission’s rules and forms and accumulated and communicated to our management, including our CEO and CFO, as appropriate to allow timely decisions regarding required disclosure. Our management has evaluated, with the participation and under the supervision of our chief executive officer (“CEO”) and chief financial officer (“CFO”), the effectiveness of our disclosure controls and procedures (as defined in Rules 13a-15(e) and 15d-15(e) of the Exchange Act) as of the end of the period covered by this report. Based on this evaluation, our CEO and CFO have concluded that, as of such date, the Company’s disclosure controls and procedures are effective in ensuring that information relating to the Company, including its consolidated subsidiaries, required to be disclosed in reports that it files under the Exchange Act is (1) recorded, processed, summarized and reported within the time periods specified in the Securities and Exchange Commission’s rules and forms, and (2) accumulated and communicated to our management, including our CEO and CFO, as appropriate to allow timely decisions regarding required disclosure.
Material Changes in Internal Control over Financial Reporting
None.
Management’s Report on Internal Control Over Financial Reporting
The Company’s management is responsible for establishing and maintaining adequate internal control over financial reporting. The Company’s internal control system is designed to provide reasonable assurance regarding the preparation, reliability and fair presentation of published financial statements for external purposes in accordance with accounting principles generally accepted in the United States of America. Management is also responsible for ensuring compliance with the federal laws and regulations concerning loans to insiders and the federal and state laws and regulations concerning dividend restrictions, both of which are designated by the Federal Deposit Insurance Corporation (“FDIC”) as safety and soundness laws and regulations. Nonetheless, all internal control systems, no matter how well designed, have inherent limitations. Even systems determined to be effective as of a particular date can provide only reasonable assurance with respect to financial statement preparation and presentation and may not eliminate the need for restatements.
The Company’s management assessed the effectiveness of the Company’s internal control over financial reporting as of December 31, 2011. In making this assessment, management used the criteria set forth by the Committee of Sponsoring Organizations of the Treadway Commission inInternal Control—Integrated Framework. Based on our assessment, we believe that, as of December 31, 2011, the Company’s internal control over financial reporting is effective based on those criteria.
The Company’s management has assessed its compliance with the designated safety and soundness laws and regulations and has maintained records of its determinations and assessments as required by the FDIC. Based on this assessment, management believes that West Coast Bancorp has complied, in all material respects, with the designated safety and soundness laws and regulations for the year ended December 31, 2011.
The Company’s independent registered public accounting firm has audited the Company’s internal control over financial reporting as of December 31, 2011, as stated in their report appearing below.
101
REPORT OF INDEPENDENT REGISTERED PUBLIC ACCOUNTING FIRM
To the Board of Directors and Stockholders of
West Coast Bancorp
Lake Oswego, Oregon
We have audited the internal control over financial reporting of West Coast Bancorp and subsidiaries (the "Company") as of December 31, 2011, based oncriteria established inInternal Control — Integrated Frameworkissued by the Committee of Sponsoring Organizations of the Treadway Commission. Because management's assessment and our audit were conducted to meet the reporting requirements of Section 112 of the Federal Deposit Insurance Corporation Improvement Act (FDICIA), management's assessment and our audit of the Company's internal control over financial reporting included controls over the preparation of the schedules equivalent to the basic financial statements in accordance with the instructions for the Consolidated Financial Statements for Bank Holding Companies (Form FR Y-9C). The Company's management is responsible for maintaining effective internal control over financial reporting and for its assessment of the effectiveness of internal control over financial reporting, included in the accompanying management’s report on internal control over financial reporting. Our responsibility is to express an opinion on the Company's internal control over financial reporting based on our audit.
We conducted our audit in accordance with the standards of the Public Company Accounting Oversight Board (United States). Those standards require that we plan and perform the audit to obtain reasonable assurance about whether effective internal control over financial reporting was maintained in all material respects. Our audit included obtaining an understanding of internal control over financial reporting, assessing the risk that a material weakness exists, testing and evaluating the design and operating effectiveness of internal control based on the assessed risk, and performing such other procedures as we considered necessary in the circumstances. We believe that our audit provides a reasonable basis for our opinion.
A company's internal control over financial reporting is a process designed by, or under the supervision of, the company's principal executive and principal financial officers, or persons performing similar functions, and effected by the company's board of directors, management, and other personnel to provide reasonable assurance regarding the reliability of financial reporting and the preparation of financial statements for external purposes in accordance with generally accepted accounting principles. A company's internal control over financial reporting includes those policies and procedures that (1) pertain to the maintenance of records that, in reasonable detail, accurately and fairly reflect the transactions and dispositions of the assets of the company; (2) provide reasonable assurance that transactions are recorded as necessary to permit preparation of financial statements in accordance with generally accepted accounting principles, and that receipts and expenditures of the company are being made only in accordance with authorizations of management and directors of the company; and (3) provide reasonable assurance regarding prevention or timely detection of unauthorized acquisition, use, or disposition of the company's assets that could have a material effect on the financial statements.
Because of the inherent limitations of internal control over financial reporting, including the possibility of collusion or improper management override of controls, material misstatements due to error or fraud may not be prevented or detected on a timely basis. Also, projections of any evaluation of the effectiveness of the internal control over financial reporting to future periods are subject to the risk that the controls may become inadequate because of changes in conditions, or that the degree of compliance with the policies or procedures may deteriorate.
In our opinion, the Company maintained, in all material respects, effective internal control over financial reporting as of December 31, 2011, based on the criteria established inInternal Control — Integrated Frameworkissued by the Committee of Sponsoring Organizations of the Treadway Commission.
We have not examined and, accordingly, we do not express an opinion or any other form of assurance on management's statement referring to compliance with laws and regulations.
We have also audited, in accordance with the standards of the Public Company Accounting Oversight Board (United States), the consolidated financial statements as of and for the year ended December 31, 2011 of the Company and our report dated February 24, 2012 expressed an unqualified opinion on those consolidated financial statements.
/s/ DELOITTE & TOUCHE LLP
Portland, Oregon
February 24, 2012
102
ITEM 9B.OTHER INFORMATION
None.
PART III
ITEM 10.DIRECTORS, EXECUTIVE OFFICERS AND CORPORATE GOVERNANCE
Information concerning directors and executive officers of Bancorp required to be included in this item is set forth under the headings “Election of Directors,” “Section 16(a) Beneficial Ownership Reporting Compliance,” and “Management” in Bancorp’s Proxy Statement for its 2012 Annual Meeting of Shareholders to be filed within 120 days of Bancorp’s fiscal year end of December 31, 2011 (the “Proxy Statement”), and is incorporated into this report by reference.
Audit and Compliance Committee
Bancorp has a separately-designated standing Audit and Compliance Committee established in accordance with Section 3(a)(58)(A) of the Exchange Act. The members of the Audit and Compliance Committee are David Dietzler (Chair), Nancy Wilgenbusch, and Lloyd Ankeny, each of whom is independent as independence for audit committee members is defined under NASDAQ listing standards applicable and SEC rules to the Company.
Audit Committee Financial Expert
Bancorp’s Board of Directors has determined that David Dietzler is an audit committee financial expert as defined in Item 407(d)(5) of Regulation S-K of the Exchange Act and is independent as independence for audit committee members is defined under NASDAQ listing standards and SEC rules applicable to the Company.
Code of Ethics
We have adopted a code of ethics (the “Code of Ethics”), for our CEO, CFO, principal accounting officer, and persons performing similar functions, entitled the West Coast Bancorp Code of Ethics for Senior Financial Officers. The Code of Ethics is available on our website at www.wcb.com under the tab for investor relations. Stockholders may request a free copy of the Code of Ethics from:
West Coast Bancorp
Attention: Secretary
5335 Meadows Road, Suite 201
Lake Oswego, Oregon 97035
(503) 684-0884
ITEM 11.EXECUTIVE COMPENSATION
Information concerning executive and director compensation and certain matters regarding participation in Bancorp’s Compensation & Personnel Committee required by this item is set forth under the headings “Executive Compensation” and “Board of Directors” in the Proxy Statement and is incorporated into this report by reference.
103
| ITEM 12. | | SECURITY OWNERSHIP OF CERTAIN BENEFICIAL OWNERS AND MANAGEMENT AND RELATED STOCK HOLDER MATTERS |
Security Ownership
Information concerning the security ownership of certain beneficial owners and management required by this item is set forth under the heading “Security Ownership of Certain Beneficial Owners and Management” in the Proxy Statement and is incorporated into this report by reference.
Equity Compensation Plan Information
Information concerning Bancorp’s equity compensation plans, required by this item is set forth under the heading “Executive Compensation—Equity Compensation Plan Information” in the Proxy Statement and is incorporated into this report by reference.
ITEM 13.CERTAIN RELATIONSHIPS AND RELATED TRANSACTIONS, AND DIRECTORINDEPENDENCE
Certain Relationships and Related Transactions
Information concerning certain relationships and related transactions required by this item is set forth under the heading “Transactions with Related Persons” in the Proxy Statement and is incorporated into this report by reference.
Director Independence
Information concerning the independence of Bancorp directors required by this item is set forth under the heading “Election of Directors” in the Proxy Statement and is incorporated into this report by reference.
ITEM 14.PRINCIPAL ACCOUNTANT FEES AND SERVICES
Information concerning fees paid to our accountants required by this item is included under the heading “Matters Related to our Auditors—Fees Paid to Independent Registered Public Accounting Firm” in the Proxy Statement and is incorporated into this report by reference.
104
PART IV
ITEM 15.EXHIBITS AND FINANCIAL STATEMENT SCHEDULES
| | (a) (1) | | Financial Statements: |
| | | | |
| | The financial statements and related documents listed in the Index set forth in Item 8 of this report are filed as part of this report. |
| | | | |
| | (2) | | Financial Statements Schedules: |
| | | | |
| | None. |
| | | | |
| | (3) | | Exhibits: |
| | | | |
| | The response to this portion of Item 15 is submitted as a separate section of this report appearing immediately following the signature page and entitled “Index to Exhibits.” |
105
SIGNATURES
Pursuant to the requirements of Section 13 or 15(d) of the Securities Exchange Act of 1934, the registrant has duly caused this report to be signed on its behalf by the undersigned, thereunto duly authorized, on February 24, 2012.
| | WEST COAST BANCORP |
| | |
| | (Registrant) |
| | |
| | By: | /s/ Robert D. Sznewajs | |
| | | Robert D. Sznewajs |
| | | President and CEO |
Pursuant to the requirements of the Securities Exchange Act of 1934, this report has been signed below by the following persons on behalf of the registrant and in the capacities indicated on February 24, 2012.
| Principal Executive Officer: | | |
| | | |
| /s/ Robert D. Sznewajs | | President and CEO and Director |
| Robert D. Sznewajs | | |
| | | |
| Principal Financial Officer: | | |
| | | |
| /s/ Anders Giltvedt | | Executive Vice President and Chief Financial Officer |
| Anders Giltvedt | | |
| | | |
| Principal Accounting Officer: | | |
| | | |
| /s/ Kevin M. McClung | | Senior Vice President and Controller |
| Kevin M. McClung | | |
| | | |
| Remaining Directors: | | |
| | | |
| *Lloyd D. Ankeny, Chairman | | |
| | | |
| *David A. Dietzler | | |
| | | |
| *Henchy R. Enden | | |
| | | |
| *Shmuel (“Sam”) Levinson | | |
| | | |
| *Steven J. Oliva | | |
| | | |
| *John T. Pietrzak | | |
| | | |
| *Steven N. Spence | | |
| | | |
| *Nancy A. Wilgenbusch, PhD. | | |
| | | |
| *By | /s/ Robert D. Sznewajs | | |
| | Robert D. Sznewajs | | |
| | Attorney-in-Fact | | |
106
INDEX TO EXHIBITS
| Exhibit No. | | Exhibit | |
| 3.1 | | Restated Articles of Incorporation (as amended through January 20, 2010). Incorporated by reference to Exhibit 3.1 to the Company’s Annual Report on Form 10-K for the year ended December 31, 2009. |
| |
| 3.2 | | Articles of Amendment of Restated Articles of Incorporation (effective May 19, 2011). Incorporated by reference to Exhibit 3.1 to the Company’s Current Report on Form 8-K dated May 18, 2011, and filed with the Securities and Exchange Commission on dated May 20, 2011. |
| |
| 3.3 | | Amended and Restated Bylaws of the Company (as amended through February 9, 2010). Incorporated by reference to Exhibit 3.2 to the Company’s Annual Report on Form 10-K for the year ended December 31, 2009. |
| | |
| 4.1 | | Form of Class C Warrant. Incorporated by reference to Exhibit 4.2 to the Company's Current Report on Form 8-K dated October 22, 2009, and filed with the Securities and Exchange Commission on October 28, 2009 (the "October 2009 8-K"). |
| |
| 4.2 | | Tax Benefit Preservation Plan, dated as of October 23, 2009, between West Coast Bancorp and Wells Fargo Bank, National Association. Incorporated by reference to Exhibit 4.4 to the October 8-K. |
| |
| 4.3 | | The Company has incurred long-term indebtedness as to which the amount involved is less than ten percent of the total assets of the Company and its subsidiaries on a consolidated basis. The Company agrees to furnish instruments relating to such indebtedness to the Commission upon its request. |
| |
| 10.1 | | Form of Indemnification Agreement for all directors and executive officers. Incorporated by reference to Exhibit 10.1 to the Company's Annual Report on Form 10-K for the year ended December 31, 2008 (the "2008 10-K").* |
| |
| 10.2 | | Change in Control Agreement between the Company and Robert D. Sznewajs dated January 1, 2004, and amended and restated December 30, 2008. Incorporated by reference to Exhibit 10.2 to the 2008 10-K.* |
| |
| 10.3 | | Change in Control Agreement between the Company and Anders Giltvedt dated January 1, 2004, and amended and restated December 30, 2008. Incorporated by reference to Exhibit 10.3 to the 2008 10-K.* |
| |
| 10.4 | | Change in Control Agreement between the Company and Xandra McKeown dated January 1, 2004, and amended and restated December 30, 2008. Incorporated by reference to Exhibit 10.4 to the 2008 10-K.* |
| |
| 10.5 | | Change in Control Agreement between the Company and Hadley Robbins dated March 5, 2007 and amended and restated December 30, 2008. Incorporated by reference to Exhibit 10.6 to the 2008 10-K.* |
| |
| 10.6 | | Supplemental Executive Retirement Plan adopted by West Coast Bank, the Company and Robert D. Sznewajs dated August 1, 2003, and amended and restated as of January 1, 2011. Incorporated by reference to Exhibit 10.2 to the Company's Current Report on Form 8-K dated January 12, 2011, and filed with the Securities and Exchange Commission on dated January 14, 2011.* |
| |
| 10.7 | | Supplemental Executive Retirement Plan adopted by West Coast Bank, the Company and Anders Giltvedt dated August 1,2003, and amended and restated as of January 1, 2009. Incorporated by reference to Exhibit 10.8 to the 2008 10-K.* |
| |
| 10.8 | | Supplemental Executive Retirement Plan adopted by West Coast Bank, the Company and Xandra McKeown dated August 1, 2003, and amended and restated as of January 1, 2009. Incorporated by reference to Exhibit 10.9 to the 2008 10-K.* |
*Indicates a management contract or compensatory plan, contract or arrangement.
107
INDEX TO EXHIBITS (continued)
| Exhibit No. | | Exhibit | |
| 10.9 | | Supplemental Executive Retirement Plan adopted by West Coast Bank, the Company and Hadley Robbins dated April 1, 2007, and amended and restated as of January 1, 2009. Incorporated by reference to Exhibit 10.11 to the 2008 10-K.* |
| | | |
| 10.10 | | 401(k) Profit Sharing Plan. Incorporated by reference to Exhibit 99.1 to the Company’s Registration Statement on Form S-8 (Reg. No. 333-01649) filed March 12, 1996.* |
| | |
| 10.11 | | Directors’ Deferred Compensation Plan. Incorporated by reference to Exhibit 10.13 to the 2008 10-K.* |
| |
| 10.12 | | Executives’ Deferred Compensation Plan. Incorporated by reference to Exhibit 10.14 to the 2008 10-K.* |
| |
| 10.13 | | 2002 Stock Incentive Plan, as amended. Incorporated by reference to Exhibit 10.1 to the Company’s Quarterly Report on Form 10-Q for the quarter ended March 31, 2010.* |
| |
| 10.14 | | Forms of Option Agreements, Restricted Stock Agreements and Restricted Stock Performance Award Agreement under the 2002 Stock Incentive Plan. Incorporated by reference to Exhibits 10.3 through 10.7 to the September 2006 10-Q and Exhibit 10.1 to the Company's Quarterly Report on Form 10-Q for the quarter ended June 30, 2008. |
| |
| 10.15 | | Employment Agreement dated effective as of January 1, 2011, between Robert D. Sznewajs and the Company. Incorporated by reference to Exhibit 10.1 to the Company's Current Report on Form 8-K dated January 12, 2011, and filed with the Securities and Exchange Commission on dated January 14, 2011.* |
| |
| 10.16 | | Form of Investment Agreement, dated as of October 23, 2009 by and between West Coast Bancorp and the investors party thereto. Incorporated by reference to Exhibit 10.1 to the October 2009 8-K. |
| |
| 10.17 | | Written Agreement, dated as of December 18, 2009, by and among West Coast Bancorp, the Federal Reserve Bank of San Francisco and the Oregon Department of Consumer and Business Services, Division of Finance and Corporate Securities. Incorporated by reference to Exhibit 10.1 to the Company's Current Report on Form 8-K dated December 18, 2009 and filed with the Securities and Exchange Commission on December 21, 2009. |
| |
| 10.18 | | Stipulation and Consent to Issuance of a Consent Order, Order for Restitution, and Order to Pay, between the Bank and the FDIC. Incorporated by reference to Exhibit 10.1 to the Company's Current Report on Form 8-K dated October 18, 2011 and filed with the Securities and Exchange Commission on October 24, 2011 (the “2011 8-K”). |
| |
| 10.19 | | Consent Order, Order for Restitution, and Order to Pay, issued by the FDIC, effective as of October 11, 2011. Incorporated by reference to Exhibit 10.2 to the 2011 8-K. |
| |
| 21 | | Subsidiaries of the Company. |
| |
| 23 | | Consent of Deloitte & Touche LLP. |
| |
| 24 | | Power of Attorney. |
| | | |
| EX-101.INS | | XBRL Instance Document |
| | | |
| EX-101.SCH | | XBRL Taxonomy Extension Schema |
| | | |
| EX-101.PRE | | XBRL Taxonomy Extension Presentation Linkbase |
| | | |
| EX-101.LAB | | XBRL Taxonomy Extension Label Linkbase |
| | | |
| EX-101.CAL | | XBRL Taxonomy Extension Calculation Linkbase |
| | | |
| EX-101.DEF | | XBRL Taxonomy Extension Definition Linkbase |
*Indicates a management contract or compensatory plan, contract or arrangement.
108