UNITED STATES
SECURITIES AND EXCHANGE COMMISSION
Washington, D.C. 20549 |
CERTIFIED SHAREHOLDER REPORT OF REGISTERED MANAGEMENT
INVESTMENT COMPANIES |
| Investment Company Act file number | | 811-3700 |
The Dreyfus/Laurel Tax-Free Municipal Funds
(Exact name of Registrant as specified in charter) |
c/o The Dreyfus Corporation
200 Park Avenue
New York, New York 10166
(Address of principal executive offices) (Zip code) |
Michael A. Rosenberg, Esq.
200 Park Avenue
New York, New York 10166
(Name and address of agent for service) |
| Registrant's telephone number, including area code: | | (212) 922-6000 |
| Date of fiscal year end: | | 06/30 |
| Date of reporting period: | | 06/30/09 |
| Item 1. | | Reports to Stockholders. |
Save time. Save paper. View your next shareholder report online as soon as it’s available. Log into www.dreyfus.com and sign up for Dreyfus eCommunications. It’s simple and only takes a few minutes.
The views expressed in this report reflect those of the portfolio manager only through the end of the period covered and do not necessarily represent the views of Dreyfus or any other person in the Dreyfus organization. Any such views are subject to change at any time based upon market or other conditions and Dreyfus disclaims any responsibility to update such views.These views may not be relied on as investment advice and, because investment decisions for a Dreyfus fund are based on numerous factors, may not be relied on as an indication of trading intent on behalf of any Dreyfus fund.

| | Contents |
| |
| | THE FUND |
| |
| 2 | A Letter from the Chairman and CEO |
| |
| 3 | Discussion of Fund Performance |
| |
| 6 | Understanding Your Fund’s Expenses |
| |
| 6 | Comparing Your Fund’s Expenses With Those of Other Funds |
| |
| 7 | Statement of Investments |
| |
| 15 | Statement of Assets and Liabilities |
| |
| 16 | Statement of Operations |
| |
| 17 | Statement of Changes in Net Assets |
| |
| 18 | Financial Highlights |
| |
| 19 | Notes to Financial Statements |
| |
| 26 | Report of Independent Registered Public Accounting Firm |
| |
| 27 | Important Tax Information |
| |
| 28 | Information About the Review and Approval of the Fund’s Investment Management Agreement |
| |
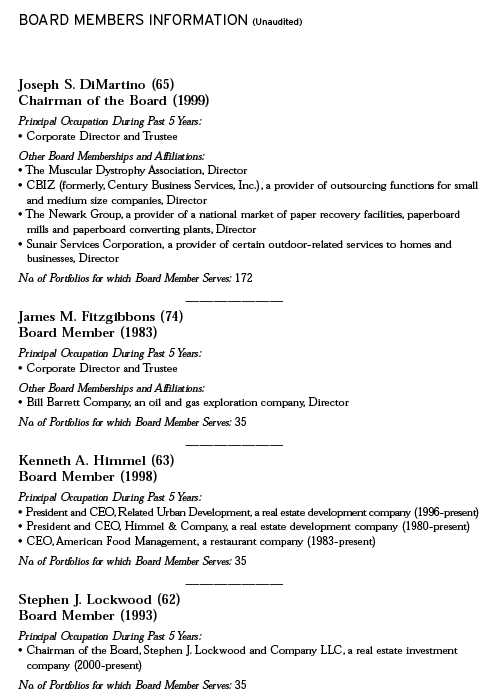
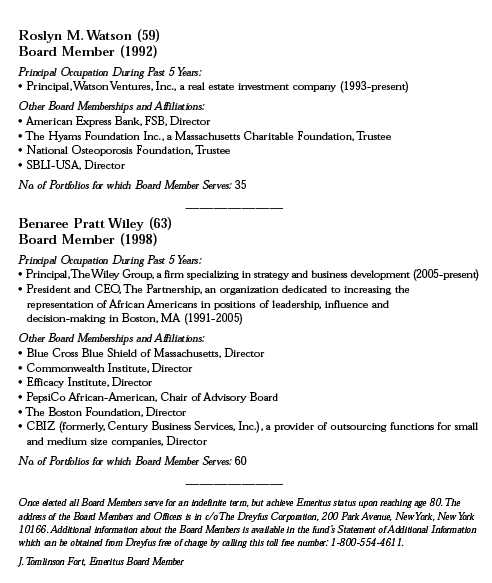
| 32 | Board Members Information |
| |
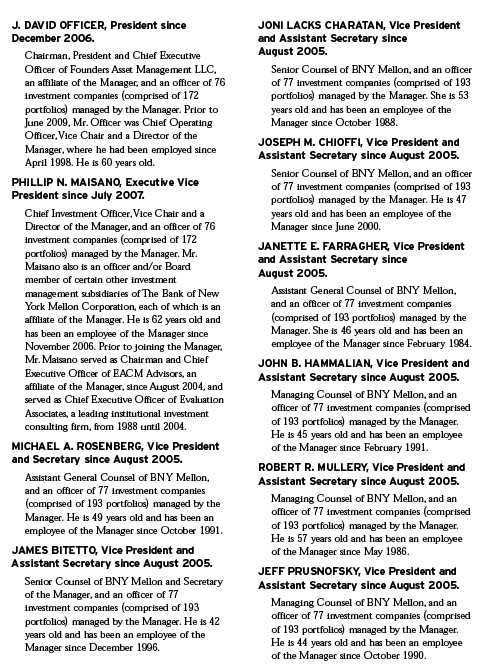
| 34 | Officers of the Fund |
| |
| | FOR MORE INFORMATION |
| |
| | Back Cover |
| |
Dreyfus BASIC
California Municipal
Money Market Fund |

A LETTER FROM THE CHAIRMAN AND CEO
Dear Shareholder:
We are pleased to present this annual report for Dreyfus BASIC California Municipal Money Market Fund, covering the 12-month period from July 1, 2008, through June 30, 2009.
The severe recession and banking crisis that punished the financial markets beginning in 2008 appear to have eased somewhat as of mid-year 2009. Previously frozen credit markets have thawed, giving businesses access to the capital they need to grow. After reaching multi-year lows early in 2009, equities and higher-yielding bonds have generally staged impressive rallies.Yet, the Federal Reserve Board has steadfastly maintained a highly accommodative monetary policy, keeping its target for short-term interest rates at close to 0.00%. Consequently, money market yields have declined to record lows.
Although recent developments in the financial markets give us reasons for optimism, we remain cautious due to the speed and magnitude of the markets’ rebound. Indeed, the markets’ advance was led mainly by lower-quality securities when investors developed renewed appetites for risk.We would prefer to see a steadier rise in asset prices supported by more concrete economic data, as the rapid rise increases the possibility that profit-taking could move the markets lower. In uncertain markets such as these, even the most seasoned investors can benefit from professional counsel. To determine how both your long-term investments and current liquid assets should be allocated for the challenges and opportunities that lie ahead, we continue to stress that you talk regularly with your financial advisor.
For information about how the fund performed during the reporting period, as well as market perspectives, we have provided a Discussion of Fund Performance given by the Portfolio Manager.
Thank you for your continued confidence and support.

Jonathan R. Baum
Chairman and Chief Executive Officer
The Dreyfus Corporation
July 15, 2009 |
2

DISCUSSION OF FUND PERFORMANCE
For the period of July 1, 2008, through June 30, 2009, as provided by Joseph Irace, Senior Portfolio Manager
Fund and Market Performance Overview
For the 12-month period ended June 30, 2009, Dreyfus BASIC California Municipal Money Market Fund produced a yield of 1.03%. Taking into account the effects of compounding, the fund produced an effective yield of 1.04%.1
Yields of tax-exempt money market instruments fell to historically low levels during the reporting period as the Federal Reserve Board (the “Fed”) reduced short-term interest rates aggressively to combat a faltering U.S. economy and financial crisis.
The Fund’s Investment Approach
The fund seeks to provide a high level of current income exempt from federal and California state income taxes to the extent consistent with the preservation of capital and the maintenance of liquidity. To pursue this objective, we attempt to add value by selecting the individual tax-exempt money market instruments from high-quality California exempt issuers that we believe are most likely to provide high tax-exempt current income.We also actively manage the fund’s weighted average maturity in anticipation of interest-rate and supply-and-demand changes in California’s short-term municipal marketplace.
The management of the fund’s weighted average maturity uses a more tactical approach. If we expect the supply of securities to increase temporarily, we may reduce the fund’s weighted average maturity to make cash available for the purchase of higher-yielding securities.This is due to the fact that yields tend to rise if issuers are competing for investor interest. If we expect demand to surge at a time when we anticipate little issuance and therefore lower yields, we may increase the fund’s average weighted maturity to maintain current yields for as long as we deem practical. At other times, we try to maintain a neutral average weighted maturity.
The Fund 3
| DISCUSSION OF FUND PERFORMANCE (continued) |
Money Market Yields Plunged During the Downturn
U.S. economic conditions deteriorated sharply over the second half of 2008 as a result of weakness in housing markets, rising unemployment and declining consumer confidence. In addition, an ongoing credit crisis escalated into a full-blown global financial crisis in the wake of the failures of major financial institutions. Dealers and insurers of municipal money market instruments were punished during the downturn by severe investment losses and lack of investor confidence. In this environment, the Fed reduced its target for the federal funds rate from 2.00% at the start of the reporting period to a record low of 0.00% to 0.25% by the end of 2008. As a result, tax-exempt money market yields also fell to historically low levels.
The Fed left its low interest rate target unchanged over the first six months of 2009. During the first quarter of the year, the U.S. economy continued to show evidence of deterioration, losing more than 650,000 jobs per month in February and March. Meanwhile, the Conference Board’s Consumer Confidence Index reached the lowest level since its inception in 1967. In response, the U.S. government passed the $787 billion American Recovery and Reinvestment Act in an effort to retain and create jobs, provide budget relief to states and localities, maintain social programs and offer tax relief to businesses and individuals.
Investor sentiment began to improve in March amid early signs that the economic downturn might be decelerating. A decline in the three-month London Interbank Offered Rate (LIBOR) below 1.00% provided evidence of improvement in the global credit markets, and the U.S. stock market staged an impressive rebound from multi-year lows.
The financial crisis and economic downturn put severe pressure on the fiscal conditions of many states and municipalities, which faced reduced tax collections and intensifying demands on social services programs. The state of California was particularly hard-hit by job losses and plunging home prices. Moreover, the state government has so far proved unable to come to an agreement on how to bridge an estimated $40 billion budget gap, leading to credit-rating downgrades of some state debt obligations.
4
Amid Turmoil, a Focus on Quality and Liquidity
We focused throughout the reporting period on direct, high-quality municipal obligations that have been independently approved by our credit analysts.We generally avoided money market instruments from California issuers that we regarded as vulnerable to the state’s budget problems, instead favoring those backed by pledged tax appropriations, stable revenue streams or private endowments.
We set the fund’s weighted average maturity in a range that was shorter than industry averages in case of unexpected liquidity needs. However, yield differences have remained relatively narrow along the market’s maturity range, so this conservative positioning did not detract materially from the fund’s performance.
Preserving Capital Is Our Priority
Yields of instruments from issuers with questionable credit profiles generally have been higher than yields from issuers who are relatively insulated from the downturn. Nonetheless, we believe the prudent course is to refrain from chasing higher yields, instead maintaining a conservative credit selection strategy with an emphasis on preservation of capital and liquidity.
July 15, 2009
| | | An investment in the fund is not insured or guaranteed by the FDIC or any other government |
| | | agency. Although the fund seeks to preserve the value of your investment at $1.00 per share, it is |
| | | possible to lose money by investing in the fund. |
| 1 | | Effective yield is based upon dividends declared daily and reinvested monthly. Past performance is |
| | | no guarantee of future results.Yields fluctuate. Income may be subject to state and local taxes for |
| | | non-California residents, and some income may be subject to the federal alternative minimum tax |
| | | (AMT) for certain investors. |
The Fund 5
UNDERSTANDING YOUR FUND’S EXPENSES (Unaudited)
As a mutual fund investor, you pay ongoing expenses, such as management fees and other expenses. Using the information below, you can estimate how these expenses affect your investment and compare them with the expenses of other funds.You also may pay one-time transaction expenses, including sales charges (loads) and redemption fees, which are not shown in this section and would have resulted in higher total expenses. For more information, see your fund’s prospectus or talk to your financial adviser.
Review your fund’s expenses
The table below shows the expenses you would have paid on a $1,000 investment in Dreyfus BASIC California Municipal Money Market Fund from January 1, 2009 to June 30, 2009. It also shows how much a $1,000 investment would be worth at the close of the period, assuming actual returns and expenses.
| | Expenses and Value of a $1,000 Investment
assuming actual returns for the six months ended June 30, 2009 |
| Expenses paid per $1,000† | | $2.48 |
| Ending value (after expenses) | | $1,002.00 |
| | COMPARING YOUR FUND’S EXPENSES
WITH THOSE OF OTHER FUNDS (Unaudited) |
Using the SEC’s method to compare expenses
The Securities and Exchange Commission (SEC) has established guidelines to help investors assess fund expenses. Per these guidelines, the table below shows your fund’s expenses based on a $1,000 investment, assuming a hypothetical 5% annualized return. You can use this information to compare the ongoing expenses (but not transaction expenses or total cost) of investing in the fund with those of other funds.All mutual fund shareholder reports will provide this information to help you make this comparison. Please note that you cannot use this information to estimate your actual ending account balance and expenses paid during the period.
| | Expenses and Value of a $1,000 Investment
assuming a hypothetical 5% annualized return for the six months ended June 30, 2009 |
| Expenses paid per $1,000† | | $2.51 |
| Ending value (after expenses) | | $1,022.32 |
| † Expenses are equal to the fund’s annualized expense ratio of .50%, multiplied by the average account value over the |
| period, multiplied by 181/365 (to reflect the one-half year period). |
6
| STATEMENT OF INVESTMENTS |
| June 30, 2009 |
| Short-Term | | Coupon | | Maturity | | Principal | | | |
| Investments—99.8% | | Rate (%) | | Date | | Amount ($) | | | Value ($) |
| |
| |
| |
|
| |
|
| California—94.9% | | | | | | | | | |
| ABAG Finance Authority for | | | | | | | | | |
| Nonprofit Corporations, Revenue | | | | | | | | | |
| (Northbay Healthcare Group) | | | | | | | | | |
| (LOC; JPMorgan Chase Bank) | | 0.25 | | 7/7/09 | | 7,000,000 | a | | 7,000,000 |
| ABAG Finance Authority for | | | | | | | | | |
| Nonprofit Corporations, | | | | | | | | | |
| Revenue, Refunding (Eskaton | | | | | | | | | |
| Properties, Inc.) (LOC; Bank | | | | | | | | | |
| of America) | | 0.25 | | 7/7/09 | | 1,600,000 | a | | 1,600,000 |
| Alameda County Industrial | | | | | | | | | |
| Development Authority, Revenue | | | | | | | | | |
| (P.J.’s Lumber, Inc. Project) | | | | | | | | | |
| (LOC; Comerica Bank) | | 1.00 | | 7/7/09 | | 2,005,000 | a | | 2,005,000 |
| Auburn Union School District, | | | | | | | | | |
| GO Notes, TRAN | | 2.00 | | 9/9/09 | | 1,400,000 | | | 1,401,002 |
| California, | | | | | | | | | |
| Economic Recovery Bonds | | 3.50 | | 7/1/09 | | 100,000 | | | 100,000 |
| California, | | | | | | | | | |
| Economic Recovery Bonds | | 5.00 | | 7/1/09 | | 1,000,000 | | | 1,000,000 |
| California, | | | | | | | | | |
| Economic Recovery Bonds | | 5.00 | | 7/1/09 | | 5,500,000 | | | 5,500,000 |
| California, | | | | | | | | | |
| Economic Recovery Bonds | | | | | | | | | |
| (Insured; FSA and Liquidity | | | | | | | | | |
| Facility; Dexia Credit Locale) | | 1.00 | | 7/7/09 | | 7,000,000 | a | | 7,000,000 |
| California, | | | | | | | | | |
| Economic Recovery Bonds | | | | | | | | | |
| (Insured; FSA and Liquidity | | | | | | | | | |
| Facility; Dexia Credit Locale) | | 1.00 | | 7/7/09 | | 3,900,000 | a | | 3,900,000 |
| California, | | | | | | | | | |
| GO Notes (Kindergarten-University) | | | | | | | | | |
| (LOC: California State Teachers | | | | | | | | | |
| Retirement System and | | | | | | | | | |
| Citibank NA) | | 0.18 | | 7/1/09 | | 1,500,000 | a | | 1,500,000 |
| California, | | | | | | | | | |
| GO Notes (LOC: Bank of | | | | | | | | | |
| America, Bank of Nova | | | | | | | | | |
| Scotia and Landesbank | | | | | | | | | |
| Hessen-Thuringen Girozentrale) | | 0.19 | | 7/7/09 | | 6,000,000 | a | | 6,000,000 |
The Fund 7
| STATEMENT OF INVESTMENTS (continued) |
| Short-Term | | Coupon | | Maturity | | Principal | | | |
| Investments (continued) | | Rate (%) | | Date | | Amount ($) | | | Value ($) |
| |
| |
| |
|
| |
|
| California (continued) | | | | | | | | | |
| California Department of Water | | | | | | | | | |
| Resources, Power Supply | | | | | | | | | |
| Revenue (Insured; FSA and | | | | | | | | | |
| Liquidity Facility; Dexia | | | | | | | | | |
| Credit Locale) | | 0.70 | | 7/7/09 | | 4,000,000 | a | | 4,000,000 |
| California Educational Facilities | | | | | | | | | |
| Authority, Revenue (University | | | | | | | | | |
| of San Francisco) (LOC; Allied | | | | | | | | | |
| Irish Banks) | | 0.40 | | 7/7/09 | | 2,200,000 | a | | 2,200,000 |
| California Educational Facilities | | | | | | | | | |
| Authority, Revenue, CP | | | | | | | | | |
| (Stanford University) | | 0.40 | | 2/25/10 | | 2,100,000 | | | 2,100,000 |
| California Infrastructure and | | | | | | | | | |
| Economic Development Bank, IDR | | | | | | | | | |
| (Bonny Doon Winery, Inc. | | | | | | | | | |
| Project) (LOC; Comerica Bank) | | 1.00 | | 7/7/09 | | 2,910,000 | a | | 2,910,000 |
| California Infrastructure and | | | | | | | | | |
| Economic Development Bank, IDR | | | | | | | | | |
| (Hydro System, Inc. Project) | | | | | | | | | |
| (LOC; Comerica Bank) | | 1.00 | | 7/7/09 | | 1,460,000 | a | | 1,460,000 |
| California Infrastructure and | | | | | | | | | |
| Economic Development Bank, IDR | | | | | | | | | |
| (Starter and Alternator | | | | | | | | | |
| Exchange, Inc. Project) (LOC; | | | | | | | | | |
| California State Teachers | | | | | | | | | |
| Retirement System) | | 0.69 | | 7/7/09 | | 1,100,000 | a | | 1,100,000 |
| California Infrastructure and | | | | | | | | | |
| Economic Development Bank, | | | | | | | | | |
| Revenue (India Community | | | | | | | | | |
| Center, Inc.) (LOC; | | | | | | | | | |
| Bank of America) | | 0.25 | | 7/1/09 | | 5,820,000 | a | | 5,820,000 |
| California Infrastructure and | | | | | | | | | |
| Economic Development Bank, | | | | | | | | | |
| Revenue (Southern California | | | | | | | | | |
| Public Radio Project) (LOC; | | | | | | | | | |
| Allied Irish Banks) | | 0.55 | | 7/1/09 | | 3,000,000 | a | | 3,000,000 |
| California Pollution Control | | | | | | | | | |
| Financing Authority, PCR | | | | | | | | | |
| (Southdown, Inc. Project) | | | | | | | | | |
| (LOC; Wachovia Bank) | | 0.50 | | 7/30/09 | | 9,800,000 | a | | 9,800,000 |
8
| Short-Term | | Coupon | | Maturity | | Principal | | | |
| Investments (continued) | | Rate (%) | | Date | | Amount ($) | | | Value ($) |
| |
| |
| |
|
| |
|
| California (continued) | | | | | | | | | |
| California Pollution Control | | | | | | | | | |
| Financing Authority, SWDR | | | | | | | | | |
| (GreenWaste Recovery, Inc. | | | | | | | | | |
| Project) (LOC; Comerica Bank) | | 1.00 | | 7/7/09 | | 2,400,000 | a | | 2,400,000 |
| California Pollution Control | | | | | | | | | |
| Financing Authority, SWDR | | | | | | | | | |
| (Metropolitan Recycling Inc.) | | | | | | | | | |
| (LOC; Comerica Bank) | | 1.00 | | 7/7/09 | | 2,695,000 | a | | 2,695,000 |
| California Pollution Control | | | | | | | | | |
| Financing Authority, SWDR | | | | | | | | | |
| (Metropolitan Recycling Inc.) | | | | | | | | | |
| (LOC; Comerica Bank) | | 1.00 | | 7/7/09 | | 495,000 | a | | 495,000 |
| California Pollution Control | | | | | | | | | |
| Financing Authority, SWDR | | | | | | | | | |
| (Northern Recycling and Waste | | | | | | | | | |
| Services, LLC Project) (LOC; | | | | | | | | | |
| Union Bank of California) | | 0.55 | | 7/7/09 | | 3,335,000 | a | | 3,335,000 |
| California Pollution Control | | | | | | | | | |
| Financing Authority, SWDR | | | | | | | | | |
| (Pena’s Disposal, Inc. | | | | | | | | | |
| Project) (LOC; Comerica Bank) | | 1.00 | | 7/7/09 | | 2,325,000 | a | | 2,325,000 |
| California Pollution Control | | | | | | | | | |
| Financing Authority, SWDR | | | | | | | | | |
| (South Tahoe Refuse | | | | | | | | | |
| Company Project) (LOC; | | | | | | | | | |
| Union Bank of California) | | 0.55 | | 7/7/09 | | 5,540,000 | a | | 5,540,000 |
| California Pollution Control | | | | | | | | | |
| Financing Authority, SWDR | | | | | | | | | |
| (Sunset Waste Paper, Inc. | | | | | | | | | |
| Project) (LOC; Comerica Bank) | | 1.00 | | 7/7/09 | | 3,800,000 | a | | 3,800,000 |
| California Pollution Control | | | | | | | | | |
| Financing Authority, SWDR | | | | | | | | | |
| (Valley Vista Services, Inc. | | | | | | | | | |
| Project) (LOC; Comerica Bank) | | 1.00 | | 7/7/09 | | 2,000,000 | a | | 2,000,000 |
| California School Boards | | | | | | | | | |
| Association Finance | | | | | | | | | |
| Corporation, COP, TRAN | | | | | | | | | |
| (California School Cash Reserve | | | | | | | | | |
| Program) (LOC; U.S. Bank NA) | | 3.00 | | 7/6/09 | | 6,000,000 | | | 6,001,095 |
The Fund 9
| STATEMENT OF INVESTMENTS (continued) |
| Short-Term | | Coupon | | Maturity | | Principal | | | |
| Investments (continued) | | Rate (%) | | Date | | Amount ($) | | | Value ($) |
| |
| |
| |
|
| |
|
| California (continued) | | | | | | | | | |
| California Statewide Commission | | | | | | | | | |
| Development Authority, | | | | | | | | | |
| Revenue, CP (Kaiser Permanente) | | 0.37 | | 12/10/09 | | 7,000,000 | | | 7,000,000 |
| Concord, | | | | | | | | | |
| MFMR (Arcadian Apartments) | | | | | | | | | |
| (LOC; FNMA) | | 0.28 | | 7/7/09 | | 3,100,000 | a | | 3,100,000 |
| Deutsche Bank Spears/Lifers Trust | | | | | | | | | |
| (Anaheim Redevelopment Agency, | | | | | | | | | |
| Tax Allocation Revenue, | | | | | | | | | |
| Refunding (Anaheim Merged | | | | | | | | | |
| Redevelopment Project Area)) | | | | | | | | | |
| (Liquidity Facility; Deutsche Bank | | | | | | | | | |
| AG and LOC; Deutsche Bank AG) | | 0.22 | | 7/7/09 | | 5,200,000 | a,b | | 5,200,000 |
| Eastern Municipal Water District, | | | | | | | | | |
| Water and Sewer Revenue, COP | | | | | | | | | |
| (Installment Sale Agreement | | | | | | | | | |
| with Eastern Municipal Water | | | | | | | | | |
| District Facilities Corporation) | | | | | | | | | |
| (Liquidity Facility; Citibank NA) | | 0.30 | | 7/7/09 | | 3,000,000 | a,b | | 3,000,000 |
| Fremont Public Financing | | | | | | | | | |
| Authority, COP (Financing | | | | | | | | | |
| Project) (LOC; Allied Irish Banks) | | 0.60 | | 7/7/09 | | 15,000,000 | a | | 15,000,000 |
| Fresno, | | | | | | | | | |
| Sewer System Revenue (Insured; | | | | | | | | | |
| Assured Guaranty and Liquidity | | | | | | | | | |
| Facility; Citibank NA) | | 0.40 | | 7/7/09 | | 4,000,000 | a,b | | 4,000,000 |
| Golden State Tobacco | | | | | | | | | |
| Securitization Corporation, | | | | | | | | | |
| Enhanced Tobacco Settlement | | | | | | | | | |
| Asset-Backed Bonds (Insured; | | | | | | | | | |
| Berkshire Hathaway Assurance | | | | | | | | | |
| Corporation and Liquidity | | | | | | | | | |
| Facility; Citibank NA) | | 0.40 | | 7/7/09 | | 5,505,000 | a,b | | 5,505,000 |
| Irvine Assessment District Number | | | | | | | | | |
| 97-16, Limited Obligation | | | | | | | | | |
| Improvement Bonds (LOC; State | | | | | | | | | |
| Street Bank and Trust Co.) | | 0.25 | | 7/1/09 | | 1,100,000 | a | | 1,100,000 |
| Kern County Board of Education, | | | | | | | | | |
| TRAN | | 2.00 | | 9/8/09 | | 1,000,000 | | | 1,000,781 |
10
| Short-Term | | Coupon | | Maturity | | Principal | | | |
| Investments (continued) | | Rate (%) | | Date | | Amount ($) | | | Value ($) |
| |
| |
| |
|
| |
|
| California (continued) | | | | | | | | | |
| Loomis Union School District, | | | | | | | | | |
| GO Notes, TRAN | | 2.00 | | 9/9/09 | | 2,300,000 | | | 2,301,645 |
| Los Angeles Municipal Improvement | | | | | | | | | |
| Corporation, LR, CP (LOC; Bank | | | | | | | | | |
| of America) | | 0.39 | | 8/27/09 | | 1,000,000 | | | 1,000,000 |
| Los Angeles Unified School | | | | | | | | | |
| District, GO Notes, TRAN | | 3.00 | | 7/30/09 | | 5,000,000 | | | 5,005,804 |
| Metropolitan Water District of | | | | | | | | | |
| Southern California, Water | | | | | | | | | |
| Revenue, Refunding | | 3.00 | | 7/1/09 | | 1,000,000 | | | 1,000,000 |
| Puttable Floating Option Tax | | | | | | | | | |
| Exempt Receipts (California | | | | | | | | | |
| Statewide Communities | | | | | | | | | |
| Development Authority, MFHR | | | | | | | | | |
| (La Mision Village Apartments | | | | | | | | | |
| Project)) (Liquidity Facility; | | | | | | | | | |
| FHLMC and LOC; FHLMC) | | 0.46 | | 7/7/09 | | 2,250,000 | a,b | | 2,250,000 |
| Richmond, | | | | | | | | | |
| Wastewater Revenue, Refunding | | | | | | | | | |
| (LOC; Union Bank of California) | | 0.23 | | 7/7/09 | | 755,000 | a | | 755,000 |
| Sequoia Union High School | | | | | | | | | |
| District, GO Notes | | 3.00 | | 7/1/09 | | 1,900,000 | | | 1,900,000 |
| Southern California Public Power | | | | | | | | | |
| Authority, Transmission | | | | | | | | | |
| Project Revenue, Refunding | | | | | | | | | |
| (Southern Transmission | | | | | | | | | |
| Project) (Insured; FSA | | | | | | | | | |
| and Liquidity Facility; | | | | | | | | | |
| Westdeutsche Landesbank) | | 1.50 | | 7/7/09 | | 1,815,000 | a | | 1,815,000 |
| Tustin Community Redevelopment | | | | | | | | | |
| Agency, Revenue (Liquidity | | | | | | | | | |
| Facility; Citigroup NA and | | | | | | | | | |
| LOC; Citigroup NA) | | 0.86 | | 7/7/09 | | 645,000 | a,b | | 645,000 |
| University of California, | | | | | | | | | |
| Revenue, CP | | 0.35 | | 10/14/09 | | 3,000,000 | | | 3,000,000 |
| Victorville Joint Powers Financing | | | | | | | | | |
| Authority, LR (Cogeneration | | | | | | | | | |
| Facility Project) (LOC; Fortis Bank) | | 1.75 | | 7/7/09 | | 9,770,000 | a | | 9,770,000 |
The Fund 11
| STATEMENT OF INVESTMENTS (continued) |
| Short-Term | | Coupon | | Maturity | | Principal | | | |
| Investments (continued) | | Rate (%) | | Date | | Amount ($) | | | Value ($) |
| |
| |
| |
|
| |
|
| California (continued) | | | | | | | | | |
| Wells Fargo Stage Trust | | | | | | | | | |
| (City and County of San | | | | | | | | | |
| Francisco, COP (Multiple | | | | | | | | | |
| Capital Improvement Projects)) | | | | | | | | | |
| (Liquidity Facility; Wells | | | | | | | | | |
| Fargo Bank and LOC; Wells | | | | | | | | | |
| Fargo Bank) | | 0.33 | | 7/7/09 | | 2,000,000 | a,b | | 2,000,000 |
| Wells Fargo Stage Trust | | | | | | | | | |
| (San Diego Public Facilities | | | | | | | | | |
| Financing Authority, Senior | | | | | | | | | |
| Sewer Revenue) (Liquidity | | | | | | | | | |
| Facility; Wells Fargo Bank and | | | | | | | | | |
| LOC; Wells Fargo Bank) | | 0.34 | | 7/7/09 | | 8,000,000 | a,b | | 8,000,000 |
| West Covina Public Financing | | | | | | | | | |
| Authority, LR, Refunding | | | | | | | | | |
| (Public Facilities Project) | | | | | | | | | |
| (LOC; California State | | | | | | | | | |
| Teachers Retirement System) | | 0.34 | | 7/7/09 | | 2,600,000 | a | | 2,600,000 |
| U.S. Related—4.9% | | | | | | | | | |
| Puerto Rico Sales Tax Financing | | | | | | | | | |
| Corporation, Sales Tax Revenue | | | | | | | | | |
| (Liquidity Facility; Citibank NA) | | 0.45 | | 7/7/09 | | 5,000,000 | a,b | | 5,000,000 |
| Puttable Floating Option Tax | | | | | | | | | |
| Exempt Receipts (Puerto Rico | | | | | | | | | |
| Highways and Transportation | | | | | | | | | |
| Authority, Highway Revenue) | | | | | | | | | |
| (Liquidity Facility; Dexia | | | | | | | | | |
| Credit Locale and LOC; Dexia | | | | | | | | | |
| Credit Locale) | | 1.74 | | 7/7/09 | | 4,480,000 | a,b | | 4,480,000 |
| |
| Total Investments (cost $194,415,327) | | | | | | 99.8% | | | 194,415,327 |
| |
| Cash and Receivables (Net) | | | | | | .2% | | | 370,001 |
| |
| Net Assets | | | | | | 100.0% | | | 194,785,328 |
| a Variable rate demand note—rate shown is the interest rate in effect at June 30, 2009. Maturity date represents the |
| next demand date, or the ultimate maturity date if earlier. |
| b Securities exempt from registration under Rule 144A of the Securities Act of 1933.These securities may be resold in |
| transactions exempt from registration, normally to qualified institutional buyers. At June 30, 2009, these securities |
| amounted to $40,080,000 or 20.6% of net assets. |
12
| Summary of Abbreviations | | | | |
| |
| ABAG | | Association of Bay Area Governments | | ACA | | American Capital Access |
| AGC | | ACE Guaranty Corporation | | AGIC | | Asset Guaranty Insurance Company |
| AMBAC | | American Municipal Bond | | | | |
| | | Assurance Corporation | | ARRN | | Adjustable Rate Receipt Notes |
| BAN | | Bond Anticipation Notes | | BIGI | | Bond Investors Guaranty Insurance |
| BPA | | Bond Purchase Agreement | | CGIC | | Capital Guaranty Insurance Company |
| CIC | | Continental Insurance Company | | CIFG | | CDC Ixis Financial Guaranty |
| CMAC | | Capital Markets Assurance Corporation | | COP | | Certificate of Participation |
| CP | | Commercial Paper | | EDR | | Economic Development Revenue |
| EIR | | Environmental Improvement Revenue | | FGIC | | Financial Guaranty Insurance |
| | | | | | | Company |
| FHA | | Federal Housing Administration | | FHLB | | Federal Home Loan Bank |
| FHLMC | | Federal Home Loan Mortgage | | FNMA | | Federal National |
| | | Corporation | | | | Mortgage Association |
| FSA | | Financial Security Assurance | | GAN | | Grant Anticipation Notes |
| GIC | | Guaranteed Investment Contract | | GNMA | | Government National |
| | | | | | | Mortgage Association |
| GO | | General Obligation | | HR | | Hospital Revenue |
| IDB | | Industrial Development Board | | IDC | | Industrial Development Corporation |
| IDR | | Industrial Development Revenue | | LOC | | Letter of Credit |
| LOR | | Limited Obligation Revenue | | LR | | Lease Revenue |
| MFHR | | Multi-Family Housing Revenue | | MFMR | | Multi-Family Mortgage Revenue |
| PCR | | Pollution Control Revenue | | PILOT | | Payment in Lieu of Taxes |
| RAC | | Revenue Anticipation Certificates | | RAN | | Revenue Anticipation Notes |
| RAW | | Revenue Anticipation Warrants | | RRR | | Resources Recovery Revenue |
| SAAN | | State Aid Anticipation Notes | | SBPA | | Standby Bond Purchase Agreement |
| SFHR | | Single Family Housing Revenue | | SFMR | | Single Family Mortgage Revenue |
| SONYMA | | State of New York Mortgage Agency | | SWDR | | Solid Waste Disposal Revenue |
| TAN | | Tax Anticipation Notes | | TAW | | Tax Anticipation Warrants |
| TRAN | | Tax and Revenue Anticipation Notes | | XLCA | | XL Capital Assurance |
The Fund 13
| STATEMENT OF INVESTMENTS (continued) |
| Summary of Combined Ratings (Unaudited) | | |
| |
| Fitch | | or | | Moody’s | | or | | Standard & Poor’s | | Value (%)† |
| |
| |
| |
| |
| |
|
| F1+,F1 | | | | VMIG1,MIG1,P1 | | | | SP1+,SP1,A1+,A1 | | 94.3 |
| AAA,AA,Ac | | | | Aaa,Aa,Ac | | | | AAA,AA,Ac | | 4.9 |
| Not Ratedd | | | | Not Ratedd | | | | Not Ratedd | | .8 |
| | | | | | | | | | | 100.0 |
| † Based on total investments. |
| c Notes which are not F, MIG and SP rated are represented by bond ratings of the issuers. |
| d Securities which, while not rated by Fitch, Moody’s and Standard & Poor’s, have been determined by the Manager to |
| be of comparable quality to those rated securities in which the fund may invest. |
| See notes to financial statements. |
14
| STATEMENT OF ASSETS AND LIABILITIES |
| June 30, 2009 |
| | | Cost | | Value |
| |
| |
|
| Assets ($): | | | | |
| Investments in securities—See Statement of Investments | | 194,415,327 | | 194,415,327 |
| Interest receivable | | | | 764,526 |
| Prepaid expenses | | | | 23,796 |
| | | | | 195,203,649 |
| Liabilities ($): | | | | |
| Due to The Dreyfus Corporation and affiliates—Note 2 | | | | 76,335 |
| Cash overdraft due to Custodian | | | | 255,587 |
| Dividend payable | | | | 51,397 |
| Payable for shares of Beneficial redeemed | | | | 35,002 |
| | | | | 418,321 |
| Net Assets ($) | | | | 194,785,328 |
| Composition of Net Assets ($): | | | | |
| Paid-in capital | | | | 194,784,525 |
| Accumulated net realized gain (loss) on investments | | | | 803 |
| Net Assets ($) | | | | 194,785,328 |
| Shares Outstanding | | | | |
| (unlimited number of shares of Beneficial Interest authorized) | | | | 194,784,525 |
| Net Asset Value, offering and redemption price per share ($) | | | | 1.00 |
| |
| See notes to financial statements. | | | | |
The Fund 15
| STATEMENT OF OPERATIONS |
| Year Ended June 30, 2009 |
| Investment Income ($): | | |
| Interest Income | | 3,774,391 |
| Expenses: | | |
| Management fee—Note 2 | | 1,084,453 |
| Treasury insurance expense—Note 1(f) | | 88,043 |
| Trustees’ fees—Note 2 | | 15,325 |
| Total Expenses | | 1,187,821 |
| Less—Trustees’ fees reimbursed by the Manager—Note 2 | | (15,325) |
| Net Expenses | | 1,172,496 |
| Investment Income—Net | | 2,601,895 |
| Net Realized Gain (Loss) on Investments—Note 1(b) ($) | | 803 |
| Net Increase in Net Assets Resulting from Operations | | 2,602,698 |
| |
| See notes to financial statements. | | |
16
STATEMENT OF CHANGES IN NET ASSETS
| | | | | Year Ended June 30, |
| | |
| |
|
| | | 2009 | | 2008 |
| |
| |
|
| Operations ($): | | | | |
| Investment income—net | | 2,601,895 | | 5,253,002 |
| Net realized gain (loss) on investments | | 803 | | 6,762 |
| Net Increase (Decrease) in Net Assets | | | | |
| Resulting from Operations | | 2,602,698 | | 5,259,764 |
| Dividends to Shareholders from ($): | | | | |
| Investment income—net | | (2,608,657) | | (5,292,379) |
| Beneficial Interest Transactions ($1.00 per share): | | | | |
| Net proceeds from shares sold | | 511,133,170 | | 785,737,822 |
| Dividends reinvested | | 551,087 | | 1,230,486 |
| Cost of shares redeemed | | (576,575,702) | | (635,245,659) |
| Increase (Decrease) in Net Assets from | | | | |
| Beneficial Interest Transactions | | (64,891,445) | | 151,722,649 |
| Total Increase (Decrease) in Net Assets | | (64,897,404) | | 151,690,034 |
| Net Assets ($): | | | | |
| Beginning of Period | | 259,682,732 | | 107,992,698 |
| End of Period | | 194,785,328 | | 259,682,732 |
| |
| See notes to financial statements. | | | | |
The Fund 17
FINANCIAL HIGHLIGHTS
The following table describes the performance for the fiscal periods indicated. Total return shows how much your investment in the fund would have increased (or decreased) during each period, assuming you had reinvested all dividends and distributions.These figures have been derived from the fund’s financial statements.
| | | | | Year Ended June 30, | | |
| | |
| |
| |
|
| | | 2009 | | 2008 | | 2007 | | 2006 | | 2005 |
| |
| |
| |
| |
| |
|
| Per Share Data ($): | | | | | | | | | | |
| Net asset value, beginning of period | | 1.00 | | 1.00 | | 1.00 | | 1.00 | | 1.00 |
| Investment Operations: | | | | | | | | | | |
| Investment income—net | | .010 | | .027 | | .032 | | .025 | | .014 |
| Distributions: | | | | | | | | | | |
| Dividends from investment income—net | | (.010) | | (.027) | | (.032) | | (.025) | | (.014) |
| Net asset value, end of period | | 1.00 | | 1.00 | | 1.00 | | 1.00 | | 1.00 |
| Total Return (%) | | 1.04 | | 2.72 | | 3.21 | | 2.50 | | 1.34 |
| Ratios/Supplemental Data (%): | | | | | | | | | | |
| Ratio of total expenses | | | | | | | | | | |
| to average net assets | | .49 | | .46 | | .45 | | .45 | | .46 |
| Ratio of net expenses | | | | | | | | | | |
| to average net assets | | .49a | | .45 | | .45 | | .45 | | .45 |
| Ratio of net investment income | | | | | | | | | | |
| to average net assets | | 1.08 | | 2.57 | | 3.16 | | 2.49 | | 1.37 |
| Net Assets, end of period ($ x 1,000) | | 194,785 | | 259,683 | | 107,993 | | 72,067 | | 72,141 |
| |
| a Expense waivers and/or reimbursements amounted to less than .01%. | | | | | | |
| See notes to financial statements. | | | | | | | | | | |
18
NOTES TO FINANCIAL STATEMENTS
NOTE 1—Significant Accounting Policies:
Dreyfus BASIC California Municipal Money Market Fund (the “fund”) is a separate non-diversified series of The Dreyfus/Laurel Tax-Free Municipal Funds (the “Trust”) which is registered under the Investment Company Act of 1940, as amended (the “Act”), as an open-end management investment company and operates as a series company, currently offering three series including the fund. The fund’s investment objective is to provide a high level of current income exempt from federal and California income taxes to the extent consistent with the preservation of capital and the maintenance of liquidity. The Dreyfus Corporation (the “Manager” or “Dreyfus”), a wholly-owned subsidiary of The Bank of New York Mellon Corporation (“BNY Mellon”), serves as the fund’s investment adviser. MBSC Securities Corporation (the “Distributor”), a wholly-owned subsidiary of the Manager, is the distributor of the fund’s shares, which are sold without a sales charge.
Effective July 1, 2008, BNY Mellon reorganized and consolidated a number of its banking and trust company subsidiaries.As a result of the reorganization, any services previously provided to the fund by Mellon Bank, N.A. or Mellon Trust of New England, N.A. are now provided by The Bank of NewYork Mellon (formerly,The Bank of NewYork).
It is the fund’s policy to maintain a continuous net asset value per share of $1.00 for the fund; the fund has adopted certain investment, portfolio valuation and dividend and distribution policies to enable it to do so. There is no assurance, however, that the fund will be able to maintain a stable net asset value per share of $1.00.
The fund’s financial statements are prepared in accordance with U.S. generally accepted accounting principles, which may require the use of management estimates and assumptions. Actual results could differ from those estimates.
The Fund 19
| NOTES TO FINANCIAL STATEMENTS (continued) |
(a) Portfolio valuation: Investments in securities are valued at amortized cost in accordance with Rule 2a-7 of the Act, which has been determined by the Board of Trustees to represent the fair value of the fund’s investments.
The fund adopted Statement of Financial Accounting Standards No. 157 “FairValue Measurements” (“FAS 157”). FAS 157 establishes an authoritative definition of fair value, sets out a framework for measuring fair value, and requires additional disclosures about fair value measurements.
Various inputs are used in determining the value of the fund’s investments relating to FAS 157.These inputs are summarized in the three broad levels listed below.
| | Level 1—quoted prices in active markets for identical investments.
Level 2—other significant observable inputs (including quoted
prices for similar securities, interest rates, prepayment speeds,
credit risk, etc.).
Level 3—significant unobservable inputs (including the fund’s own
assumptions in determining the fair value of investments). |
The inputs or methodology used for valuing securities are not necessarily an indication of the risk associated with investing in those securities. For example, money market securities are valued using amortized cost, in accordance with rules under the Act. Generally, amortized cost approximates the current fair value of a security, but since the value is not obtained from a quoted price in an active market, such securities are reflected as Level 2.
The following is a summary of the inputs used as of June 30, 2009 in valuing the fund’s investments:
| | | Investments in |
| Valuation Inputs | | Securities ($) |
| |
|
| Level 1—Quoted Prices | | — |
| Level 2—Other Significant Observable Inputs | | 194,415,327 |
| Level 3—Significant Unobservable Inputs | | — |
| Total | | 194,415,327 |
20
(b) Securities transactions and investment income: Securities transactions are recorded on a trade date basis. Interest income, adjusted for accretion of discount and amortization of premium on investments, is earned from settlement date and recognized on the accrual basis. Realized gains and losses from securities transactions are recorded on the identified cost basis. Cost of investments represents amortized cost.
(c) Concentration of risk: The fund follows an investment policy of investing primarily in municipal obligations of one state. Economic changes affecting the state and certain of its public bodies and municipalities may affect the ability of issuers within the state to pay interest on, or repay principal of, municipal obligations held by the fund.
All cash balances were maintained with the Custodian,The Bank of New York Mellon, a subsidiary of BNY Mellon and an affiliate of Dreyfus.
(d) Dividends to shareholders: It is the policy of the fund to declare dividends daily from investment income-net; such dividends are paid monthly. Dividends from net realized capital gains, if any, are normally declared and paid annually, but the fund may make distributions on a more frequent basis to comply with the distribution requirements of the Internal Revenue Code of 1986, as amended, (the “Code”).To the extent that net realized capital gains can be offset by capital loss carryovers, it is the policy of the fund not to distribute such gains.
(e) Federal income taxes: It is the policy of the fund to continue to qualify as a regulated investment company, which can distribute tax exempt dividends, by complying with the applicable provisions of the Code, and to make distributions of income and net realized capital gain sufficient to relieve it from substantially all federal income and excise taxes.
As of and during the period ended June 30, 2009, the fund did not have any liabilities for any uncertain tax positions.The fund recognizes interest and penalties, if any, related to uncertain tax positions as
The Fund 21
| NOTES TO FINANCIAL STATEMENTS (continued) |
income tax expense in the Statement of Operations. During the period, the fund did not incur any interest or penalties.
Each of the tax years in the four-year period ended June 30, 2009 remains subject to examination by the Internal Revenue Service and state taxing authorities.
At June 30, 2009, the components of accumulated earnings on a tax basis were substantially the same as for financial reporting purposes.
The tax character of distributions paid to shareholders during the fiscal periods ended June 30, 2009 and June 30, 2008, were as follows: tax exempt income $2,601,895 and $5,253,002, ordinary income $0 and $39,377 and long-term capital gains $6,762 and $0, respectively.
During the period ended June 30, 2009, as a result of permanent book to tax differences, primarily due to dividend reclassification, the fund increased accumulated undistributed investment income-net by $6,762 and decreased accumulated net realized gain (loss) on investments by the same amount. Net assets and net asset value per share were not affected by this reclassification.
At June 30, 2009, the cost of investments for federal income tax purposes was substantially the same as the cost for financial reporting purposes (see the Statement of Investments).
(f) Treasury’s Temporary Guarantee Program: The fund has entered into a Guarantee Agreement with the United States Department of the Treasury (the “Treasury”) to participate in the Treasury’s Temporary Guarantee Program for Money Market Funds (the “Program”).
Under the Program, the Treasury guarantees the share price of shares of the fund held by shareholders as of September 19, 2008 at $1.00 per share if the fund’s net asset value per share falls below $0.995 (a “Guarantee Event”) and the fund liquidates. Recovery under the Program is subject to certain conditions and limitations.
22
Fund shares acquired by investors after September 19, 2008 that increase the number of fund shares the investor held at the close of business on September 19, 2008 are not eligible for protection under the Program. In addition, fund shares acquired by investors who did not hold fund shares at the close of business on September 19, 2008 are not eligible for protection under the Program.
The Program, which was originally set to expire on December 18, 2008, was initially extended by the Treasury until April 30, 2009 and has been further extended by the Treasury until September 18, 2009, after which the Secretary of the Treasury will review the need for, and terms of, the Program. Participation in the initial term and the extended periods of the Program required a payment to the Treasury in the amount of .01%, .015% and .015%, respectively, of the fund’s shares outstanding as of September 19, 2008 (valued at $1.00 per share).This expense is being borne by the fund without regard to any expense limitation currently in effect.
NOTE 2—Investment Management Fee and Other Transactions with Affiliates:
Pursuant to an investment management agreement with the Manager, the Manager provides or arranges for one or more third parties and/or affiliates to provide investment advisory, administrative, custody, fund accounting and transfer agency services to the fund.The Manager also directs the investments of the fund in accordance with its investment objective, policies and limitations. For these services, the fund is contractually obligated to pay the Manager a fee, calculated daily and paid monthly, at the annual rate of .45% of the value of the fund’s average daily net assets. Out of its fee, the Manager pays all of the expenses of the fund except brokerage fees, taxes, interest, fees and expenses of non-interested Trustees (including counsel fees) and extraordinary expenses. In addition, the Manager is required to reduce its fee in an amount equal
The Fund 23
| NOTES TO FINANCIAL STATEMENTS (continued) |
to the fund’s allocable portion of fees and expenses of the non-interested Trustees (including counsel fees).EachTrustee receives $45,000 per year, plus $6,000 for each joint Board meeting of The Dreyfus/Laurel Funds, Inc., the Trust, The Dreyfus/Laurel Funds Trust (collectively, the “Dreyfus/Laurel Funds”) and Dreyfus Investment Funds attended, $2,000 for separate in-person committee meetings attended which are not held in conjunction with a regularly scheduled Board meeting and $1,500 for Board meetings and separate committee meetings attended that are conducted by telephone and is reimbursed for travel and out-of-pocket expenses. With respect to Board meetings, the Chairman of the Board receives an additional 25% of such compensation (with the exception of reimbursable amounts). With respect to compensation committee meetings, the Chair of the compensation committee receives $900 per meeting. In the event that there is an in-person joint committee or a joint telephone meeting of the Dreyfus/Laurel Funds, Dreyfus Investment Funds and Dreyfus High Yield Strategies Fund, the $2,000 or $1,500 fee,as applicable,will be allocated between the Dreyfus/Laurel Funds, Dreyfus Investment Funds and Dreyfus High Yield Strategies Fund.These fees and expenses are charged and allocated to each series based on net assets.Amounts required to be paid by the Trust directly to the non-interested Trustees, that would be applied to offset a portion of the management fee payable to the Manager, are in fact paid directly by the Manager to the non-interested Trustees.
The Manager has undertaken to reimburse expenses in the event that current yields drop below a certain level.This undertaking is voluntary and not contractual and may be terminated at any time. During the period ended June 30, 2009, there was no reduction in expenses pursuant to the undertaking.
The components of “Due to The Dreyfus Corporation and affiliates” in the Statement of Assets and Liabilities consist of: management fees $76,335.
24
NOTE 3—Bank Line of Credit:
The fund participated with other Dreyfus-managed funds in a $300 million unsecured line of credit provided by The Bank of New York Mellon (the “BNYM Facility”), primarily to be utilized for temporary or emergency purposes, including the financing of redemptions. The terms of the BNYM Facility limit the amount of individual fund borrowings. Interest is charged to the fund based on prevailing market rates in effect at the time of borrowing. Effective October 15, 2008, the $300 million unsecured line of credit was terminated. During the period ended June 30, 2009, the fund did not borrow under the line of credit.
NOTE 4—Subsequent Events Evaluation:
Dreyfus has evaluated the need for disclosures and/or adjustments resulting from subsequent events through August 18, 2009, the date the financial statements were available to be issued. This evaluation did not result in any subsequent events that necessitated disclosures and/or adjustments.
The Fund 25
REPORT OF INDEPENDENT REGISTERED
PUBLIC ACCOUNTING FIRM |
The Board of Trustees and Shareholders of
The Dreyfus/Laurel Tax-Free Municipal Funds: |
We have audited the accompanying statement of assets and liabilities of Dreyfus BASIC California Municipal Money Market Fund (the “Fund”), a series of The Dreyfus/Laurel Tax-Free Municipal Funds, including the statement of investments, as of June 30, 2009, and the related statement of operations for the year then ended, the statement of changes in net assets for each of the years in two-year period then ended, and the financial highlights for each of the years in the five-year period then ended.These financial statements and financial highlights are the responsibility of the Fund’s management. Our responsibility is to express an opinion on these financial statements and financial highlights based on our audits.
We conducted our audits in accordance with the standards of the Public Company Accounting Oversight Board (United States).Those standards require that we plan and perform the audit to obtain reasonable assurance about whether the financial statements and financial highlights are free of material misstatement.An audit also includes examining, on a test basis, evidence supporting the amounts and disclosures in the financial statements. Our procedures included confirmation of securities owned as of June 30, 2009, by correspondence with the custodian and brokers. An audit also includes assessing the accounting principles used and significant estimates made by management, as well as evaluating the overall financial statement presentation.We believe that our audits provide a reasonable basis for our opinion.
In our opinion, the financial statements and financial highlights referred to above present fairly, in all material respects, the financial position of Dreyfus BASIC California Municipal Money Market Fund of The Dreyfus/Laurel Tax-Free Municipal Funds as of June 30, 2009, and the results of its operations for the year then ended, the changes in its net assets for each of the years in the two-year period then ended, and the financial highlights for each of the years in the five-year period then ended, in conformity with accounting principles generally accepted in the United States of America.

| | New York, New York
August 18, 2009 |
26
IMPORTANT TAX INFORMATION (Unaudited)
In accordance with federal tax law, the fund hereby designates all the dividends paid from investment income-net during the fiscal year ended June 30, 2009 as “exempt-interest dividends” (not subject to regular Federal and, for individuals who are California residents, California personal income taxes), except $6,762 that is being designated as a long-term capital distribution for reporting purposes. As required by federal tax law rules, shareholders will receive notification of their portion of the fund’s exempt-interest dividends paid for the 2009 calendar year on Form 1099-INT, which will be mailed by early 2010.
The Fund 27
| INFORMATION ABOUT THE REVIEW AND APPROVAL OF THE |
| FUND’S INVESTMENT MANAGEMENT AGREEMENT (Unaudited) |
At a meeting of the fund’s Board of Trustees held on February 9 and 10, 2009, the Board considered the re-approval of the fund’s Investment Management Agreement (“Management Agreement”), pursuant to which the Manager provides the fund with investment advisory and administrative services.The Board members, none of whom are “interested persons” (as defined in the Investment Company Act of 1940, as amended) of the fund, were assisted in their review by independent legal counsel and met with counsel in executive session separate from representatives of the Manager.
Analysis of Nature, Extent and Quality of Services Provided to the Fund.The Board members considered information previously provided to them in a presentation from representatives of the Manager regarding services provided to the fund and other funds in the Dreyfus fund complex, and representatives of the Manager confirmed that there had been no material changes in this information. The Board also discussed the nature, extent and quality of the services provided to the fund pursuant to its Management Agreement.The Manager’s representatives reviewed the fund’s distribution of accounts and the relationships the Manager has with various intermediaries and the different needs of each.The Manager’s representatives noted the distribution channels for the fund as well as the diversity of distribution among the funds in the Dreyfus fund complex, and the Manager’s corresponding need for broad, deep, and diverse resources to be able to provide ongoing shareholder services to each distribution channel, including those of the fund.The Manager provided the number of shareholder accounts in the fund, as well as the fund’s asset size.
The Board members also considered the Manager’s research and portfolio management capabilities and that the Manager also provides oversight of day-to-day fund operations, including fund accounting and administration and assistance in meeting legal and regulatory requirements.The Board members also considered the Manager’s extensive administrative, accounting and compliance infrastructure.
28
Comparative Analysis of the Fund’s Performance and Management Fee and Expense Ratio. The Board members reviewed the fund’s performance and comparisons to a group of retail, no-load California tax-exempt money market funds (the “Performance Group”) and to a larger universe of funds, consisting of all retail and institutional California tax-exempt money market funds (the “Performance Universe”) selected and provided by Lipper, Inc., an independent provider of investment company data.The Board was provided with a description of the methodology Lipper used to select the Performance Group and Performance Universe, as well as the Expense Group and Expense Universe (discussed below). The Board members discussed the results of the comparisons for various periods ended December 31, 2008, and noted that the fund’s total return performance was above the Performance Group and Performance Universe medians for each of the periods.The Board also noted that the fund was the top performer in the Performance Group for each of the periods, except the ten-year period ended December 31, 2008, when the fund was ranked second among its Performance Group.
The Board members also discussed the fund’s contractual and actual management fee and expense ratio and reviewed the range of management fees and expense ratios of a comparable group of funds (the “Expense Group”) and a broader group of funds (the “Expense Universe”), each selected and provided by Lipper. Noting the fund’s “unitary fee” structure, the Board noted that the fund’s contractual management fee was below the Expense Group median, the fund’s actual management fee was above the Expense Group and Expense Universe medians, and the fund’s expense ratio was below the Expense Group and Expense Universe medians.
Representatives of the Manager reviewed with the Board members the fees paid to the Manager or its affiliates by mutual funds managed by the Manager or its affiliates with similar investment objectives, policies and
The Fund 29
| INFORMATION ABOUT THE REVIEW AND APPROVAL OF THE FUND’S |
| INVESTMENT MANAGEMENT AGREEMENT (Unaudited) (continued) |
strategies, and included in the same Lipper category as the fund (the “Similar Funds”). They also noted that there were no other accounts managed by the Manager or its affiliates with similar investment objec-tives,policies and strategies as the fund.The Manager’s representatives also reviewed the costs associated with distribution through intermediaries. The Board analyzed differences in fees paid to the Manager and discussed the relationship of the fees paid in light of the services provided, noting the fund’s“unitary fee”structure.The Board members considered the relevance of the fee information provided for the Similar Funds to evaluate the appropriateness and reasonableness of the fund’s management fee.
Analysis of Profitability and Economies of Scale. The Manager’s representatives reviewed the dollar amount of expenses allocated and profit received by the Manager and the method used to determine such expenses and profit. The Board previously had been provided with information prepared by an independent consulting firm regarding the Manager’s approach to allocating costs to, and determining the profitability of, individual funds and the entire Dreyfus mutual fund complex.The Board also was informed that the methodology had also been reviewed by an independent registered public accounting firm which, like the consultant, found the methodology to be reasonable. The consulting firm also analyzed where any economies of scale might emerge in connection with the management of the fund.The Board members evaluated the profitability analysis in light of the relevant circumstances for the fund and the extent to which economies of scale would be realized if the fund grows and whether fee levels reflect these economies of scale for the benefit of fund shareholders. The Board members also considered potential benefits to the Manager from acting as investment adviser and noted that there were no soft dollar arrangements with respect to trading the fund’s portfolio.
It was noted that the Board members should consider the Manager’s profitability with respect to the fund as part of their evaluation of whether the fees under the Management Agreement bear a reasonable relationship to the mix of services provided by the Manager, including the nature, extent and quality of such services, and that a discussion of
30
economies of scale is predicated on increasing assets and that, if a fund’s assets had been decreasing, the possibility that the Manager may have realized any economies of scale would be less. It also was noted that the profitability percentage for managing the fund was within the range determined by appropriate court cases to be reasonable given the services rendered and generally superior service levels provided by the Manager.
At the conclusion of these discussions, the Board agreed that it had been furnished with sufficient information to make an informed business decision with respect to continuation of the fund’s Management Agreement. Based on the discussions and considerations as described above, the Board made the following conclusions and determinations.
- The Board concluded that the nature, extent and quality of the services provided by the Manager are adequate and appropriate.
- The Board was satisfied with the fund’s relative performance.
- The Board concluded that the fee paid by the fund to the Manager was reasonable in light of the services provided, comparative perfor- mance, expense and advisory fee information, costs of the services provided and profits to be realized and benefits derived or to be derived by the Manager from its relationship with the fund.
- The Board determined that the economies of scale which may accrue to the Manager and its affiliates in connection with the management of the fund had been adequately considered by the Manager in con- nection with the management fee rate charged to the fund and that, to the extent in the future it were determined that material economies of scale had not been shared with the fund, the Board would seek to have those economies of scale shared with the fund.
The Board members considered these conclusions and determinations, along with information received on a routine and regular basis throughout the year, and, without any one factor being dispositive, the Board determined that re-approval of the fund’s Management Agreement was in the best interests of the fund and its shareholders and that the Management Agreement would be renewed through April 4, 2010.
The Fund 31
32
The Fund 33
OFFICERS OF THE FUND (Unaudited)
34
The Fund 35
NOTES
Save time. Save paper. View your next shareholder report online as soon as it’s available. Log into www.dreyfus.com and sign up for Dreyfus eCommunications. It’s simple and only takes a few minutes.
The views expressed in this report reflect those of the portfolio managers only through the end of the period covered and do not necessarily represent the views of Dreyfus or any other person in the Dreyfus organization. Any such views are subject to change at any time based upon market or other conditions and Dreyfus disclaims any responsibility to update such views.These views may not be relied on as investment advice and, because investment decisions for a Dreyfus fund are based on numerous factors, may not be relied on as an indication of trading intent on behalf of any Dreyfus fund.

| | Contents |
| |
| | THE FUND |
| |
| 2 | A Letter from the Chairman and CEO |
| |
| 3 | Discussion of Fund Performance |
| |
| 6 | Understanding Your Fund’s Expenses |
| |
| 6 | Comparing Your Fund’s Expenses With Those of Other Funds |
| |
| 7 | Statement of Investments |
| |
| 14 | Statement of Assets and Liabilities |
| |
| 15 | Statement of Operations |
| |
| 16 | Statement of Changes in Net Assets |
| |
| 17 | Financial Highlights |
| |
| 18 | Notes to Financial Statements |
| |
| 25 | Report of Independent Registered Public Accounting Firm |
| |
| 26 | Important Tax Information |
| |
| 27 | Information About the Review and Approval of the Fund’s Investment Management Agreement |
| |
| 31 | Board Members Information |
| |
| 33 | Officers of the Fund |
| |
| | FOR MORE INFORMATION |
| |
| | Back Cover |
| |
| Dreyfus BASIC |
| Massachusetts Municipal |
| Money Market Fund |

A LETTER FROM THE CHAIRMAN AND CEO
Dear Shareholder:
We are pleased to present this annual report for Dreyfus BASIC Massachusetts Municipal Money Market Fund, covering the 12-month period from July 1, 2008, through June 30, 2009.
The severe recession and banking crisis that punished the financial markets beginning in 2008 appear to have eased somewhat as of mid-year 2009. Previously frozen credit markets have thawed, giving businesses access to the capital they need to grow. After reaching multi-year lows early in 2009, equities and higher-yielding bonds have generally staged impressive rallies.Yet, the Federal Reserve Board has steadfastly maintained a highly accommodative monetary policy, keeping its target for short-term interest rates at close to 0.00%. Consequently, money market yields have declined to record lows.
Although recent developments in the financial markets give us reasons for optimism, we remain cautious due to the speed and magnitude of the markets’ rebound. Indeed, the markets’ advance was led mainly by lower-quality securities when investors developed renewed appetites for risk.We would prefer to see a steadier rise in asset prices supported by more concrete economic data, as the rapid rise increases the possibility that profit-taking could move the markets lower. In uncertain markets such as these, even the most seasoned investors can benefit from professional counsel. To determine how both your long-term investments and current liquid assets should be allocated for the challenges and opportunities that lie ahead, we continue to stress that you talk regularly with your financial advisor.
For information about how the fund performed during the reporting period, as well as market perspectives, we have provided a Discussion of Fund Performance given by the Portfolio Managers.
Thank you for your continued confidence and support.

Jonathan R. Baum
Chairman and Chief Executive Officer
The Dreyfus Corporation
July 15, 2009 |
2

DISCUSSION OF FUND PERFORMANCE
For the period of July 1, 2008, through June 30, 2009, as provided by J. Christopher Nicholl and John F. Flahive, Portfolio Managers
Fund and Market Performance Overview
For the 12-month period ended June 30, 2009, Dreyfus BASIC Massachusetts Municipal Money Market Fund produced a yield of 0.95%.Taking into account the effects of compounding, the fund also produced an effective yield of 0.95%.1
Yields of tax-exempt money market instruments declined toward historical lows, as the Federal Reserve Board (the “Fed”) reduced short-term interest rates to nearly zero in an attempt to stimulate a faltering U.S. economy and address a global financial crisis.
The Fund’s Investment Approach
The fund seeks to provide a high level of current income exempt from federal and Massachusetts state income taxes to the extent consistent with the preservation of capital and the maintenance of liquidity. To pursue its goal, the fund normally invests substantially all of its assets in short-term, high quality municipal obligations that provide income exempt from federal and Massachusetts state income taxes. When the fund manager believes that acceptable Massachusetts municipal obligations are unavailable for investment, the fund may invest temporarily in securities that provide income subject to Massachusetts state personal income taxes, but not federal income tax. In addition, the fund may invest temporarily in high quality, taxable money market instruments when acceptable municipal obligations are not available for investment.
The fund may also invest in high quality short-term structured notes, which are derivative instruments whose value is tied to underlying municipal obligations.
The Fund 3
| DISCUSSION OF FUND PERFORMANCE (continued) |
Interest Rates Fall to Historic Lows
U.S. economic conditions already had begun to deteriorate by the start of the reporting period as a result of slumping housing markets, rising unemployment and declining consumer confidence.
Meanwhile, an ongoing credit crunch escalated over the summer of 2008 into a global financial crisis. In the ensuing tumult, some mortgage agencies and insurers were nationalized, a major investment bank filed for bankruptcy, other major financial institutions were sold to former rivals and municipal bond insurers lost the confidence of investors.
In response, the U.S. Department of the Treasury launched the $700 billion Troubled Assets Relief Program (TARP) and the Temporary Guarantee Program for Money Market Funds, and the Fed responded with the Term Asset-Backed Securities Loan Facility (TALF).The Fed also reduced its target for the federal funds rate from 2% at the start of the reporting period to a record low of 0% to 0.25% by the end of 2008. Yields of tax-exempt money market funds generally declined along with short-term interest rates.
When 2009 began, the economic downturn continued to gain momentum. More than 650,000 jobs per month were lost in February and March, and the Conference Board’s Consumer Confidence Index reached the lowest level since its inception in 1967. In an effort to stem the decline, the U.S. government enacted the $787 billion American Recovery and Reinvestment Act.
After hitting multi-year lows in early March, the U.S. stock market and corporate bond market staged impressive rebounds through the reporting period’s end. The markets were buoyed by signs that the credit markets were stabilizing, and investors began to look forward to better economic times. However, the Fed maintained its low target for short-term interest rates amid few signs of actual economic improvement, including a June rise in the unemployment rate to 9.5%, its highest level in 26 years.The economic downturn put severe pressure
4
on the fiscal conditions of most states and municipalities, including Massachusetts, which encountered reduced sales and income tax collections and intensifying demands on social services programs.
Independent Research Helps Avoid Credit Problems
As always, we invested exclusively in high-quality municipal obligations. In light of the issues confronting the market, we maintained a conservative credit selection strategy, removing a number of banks from our approved list and focusing on direct municipal obligations over those with third-party credit enhancements. Because of a lack of Massachusetts instruments meeting our stringent criteria, we complemented the fund’s core holdings with instruments issued by other states. In addition, we gradually increased the fund’s weighted average maturity, which ended the reporting period in a range that was longer than industry averages, primarily due to increased exposure to municipal notes and reduced holdings of variable-rate demand notes.
Maintaining a Conservative Investment Posture
As of the reporting period’s end, the Fed has indicated that it intends to keep interest rates at low levels for some time.Therefore, we intend to maintain the fund’s conservative credit selection strategy, which we believe is a prudent course in today’s challenging economic environment.
July 15, 2009
| | | An investment in the fund is not insured or guaranteed by the FDIC or any other government |
| | | agency. Although the fund seeks to preserve the value of your investment at $1.00 per share, it is |
| | | possible to lose money by investing in the fund. |
| 1 | | Effective yield is based upon dividends declared daily and reinvested monthly. Past performance is |
| | | no guarantee of future results.Yields fluctuate. Income may be subject to state and local taxes for |
| | | non-Massachusetts residents, and some income may be subject to the federal alternative minimum |
| | | tax (AMT) for certain investors.Yields provided reflect the absorption of certain fund expenses by |
| | | The Dreyfus Corporation pursuant to an undertaking in effect that may be extended, terminated, |
| | | or modified at any time. Had these expenses not been absorbed, the annualized yield and |
| | | annualized effective yield would have been 0.93% and 0.93%, respectively. |
The Fund 5
UNDERSTANDING YOUR FUND’S EXPENSES (Unaudited)
As a mutual fund investor, you pay ongoing expenses, such as management fees and other expenses. Using the information below, you can estimate how these expenses affect your investment and compare them with the expenses of other funds.You also may pay one-time transaction expenses, including sales charges (loads) and redemption fees, which are not shown in this section and would have resulted in higher total expenses. For more information, see your fund’s prospectus or talk to your financial adviser.
Review your fund’s expenses
The table below shows the expenses you would have paid on a $1,000 investment in Dreyfus BASIC Massachusetts Municipal Money Market Fund from January 1, 2009 to June 30, 2009. It also shows how much a $1,000 investment would be worth at the close of the period, assuming actual returns and expenses.
| | Expenses and Value of a $1,000 Investment
assuming actual returns for the six months ended June 30, 2009 |
| Expenses paid per $1,000† | | $2.33 |
| Ending value (after expenses) | | $1,001.00 |
| | COMPARING YOUR FUND’S EXPENSES
WITH THOSE OF OTHER FUNDS (Unaudited) |
Using the SEC’s method to compare expenses
The Securities and Exchange Commission (SEC) has established guidelines to help investors assess fund expenses. Per these guidelines, the table below shows your fund’s expenses based on a $1,000 investment, assuming a hypothetical 5% annualized return. You can use this information to compare the ongoing expenses (but not transaction expenses or total cost) of investing in the fund with those of other funds.All mutual fund shareholder reports will provide this information to help you make this comparison. Please note that you cannot use this information to estimate your actual ending account balance and expenses paid during the period.
| | Expenses and Value of a $1,000 Investment
assuming a hypothetical 5% annualized return for the six months ended June 30, 2009 |
| Expenses paid per $1,000† | | $2.36 |
| Ending value (after expenses) | | $1,022.46 |
| † Expenses are equal to the fund’s annualized expense ratio of .47%, multiplied by the average account value over the |
| period, multiplied by 181/365 (to reflect the one-half year period). |
6
| STATEMENT OF INVESTMENTS |
| June 30, 2009 |
| Short-Term | | Coupon | | Maturity | | Principal | | | |
| Investments—97.9% | | Rate (%) | | Date | | Amount ($) | | | Value ($) |
| |
| |
| |
|
| |
|
| Georgia—3.0% | | | | | | | | | |
| Municipal Electric Authority of | | | | | | | | | |
| Georgia, Project One | | | | �� | | | | | |
| Subordinated Bonds (Insured; | | | | | | | | | |
| FSA and Liquidity Facility; | | | | | | | | | |
| Dexia Credit Locale) | | 1.65 | | 7/7/09 | | 4,000,000 | a | | 4,000,000 |
| Massachusetts—86.9% | | | | | | | | | |
| Andover, | | | | | | | | | |
| GO Notes, BAN | | 1.00 | | 3/25/10 | | 4,166,500 | | | 4,177,076 |
| Boston, | | | | | | | | | |
| GO Notes | | 2.25 | | 2/1/10 | | 530,000 | | | 534,608 |
| Braintree, | | | | | | | | | |
| GO Notes, BAN | | 2.50 | | 8/14/09 | | 3,700,000 | | | 3,703,972 |
| Massachusetts, | | | | | | | | | |
| Consolidated Loan (Liquidity | | | | | | | | | |
| Facility; Dexia Credit Locale) | | 1.50 | | 7/1/09 | | 5,400,000 | a | | 5,400,000 |
| Massachusetts Development Finance | | | | | | | | | |
| Agency, Higher Education | | | | | | | | | |
| Revenue, Refunding (Smith | | | | | | | | | |
| College Issue) | | 0.10 | | 7/7/09 | | 5,000,000 | a | | 5,000,000 |
| Massachusetts Development Finance | | | | | | | | | |
| Agency, Multi-Mode Revenue | | | | | | | | | |
| (Worcester Academy Project) | | | | | | | | | |
| (LOC; Allied Irish Banks) | | 0.51 | | 7/7/09 | | 1,300,000 | a | | 1,300,000 |
| Massachusetts Development Finance | | | | | | | | | |
| Agency, Revenue (Beaver | | | | | | | | | |
| Country Day School Issue) | | | | | | | | | |
| (LOC; Allied Irish Banks) | | 0.95 | | 7/7/09 | | 4,400,000 | a | | 4,400,000 |
| Massachusetts Development Finance | | | | | | | | | |
| Agency, Revenue (Boston | | | | | | | | | |
| University Issue) (LOC; Allied | | | | | | | | | |
| Irish Banks) | | 0.18 | | 7/1/09 | | 400,000 | a | | 400,000 |
| Massachusetts Development Finance | | | | | | | | | |
| Agency, Revenue (Boston University | | | | | | | | | |
| Issue) (LOC; BNP Paribas) | | 0.15 | | 7/7/09 | | 5,000,000 | a | | 5,000,000 |
| Massachusetts Development Finance | | | | | | | | | |
| Agency, Revenue (Exploration | | | | | | | | | |
| School, Inc. Issue) (LOC; TD Bank) | | 0.30 | | 7/7/09 | | 2,680,000 | a | | 2,680,000 |
| Massachusetts Development Finance | | | | | | | | | |
| Agency, Revenue (Fay School | | | | | | | | | |
| Issue) (LOC; TD Bank) | | 0.30 | | 7/7/09 | | 4,300,000 | a | | 4,300,000 |
The Fund 7
| STATEMENT OF INVESTMENTS (continued) |
| Short-Term | | Coupon | | Maturity | | Principal | | | |
| Investments (continued) | | Rate (%) | | Date | | Amount ($) | | | Value ($) |
| |
| |
| |
|
| |
|
| Massachusetts (continued) | | | | | | | | | |
| Massachusetts Development Finance | | | | | | | | | |
| Agency, Revenue (Harvard | | | | | | | | | |
| University Issue) | | 0.10 | | 7/7/09 | | 6,000,000 | a | | 6,000,000 |
| Massachusetts Development Finance | | | | | | | | | |
| Agency, Revenue (Saint | | | | | | | | | |
| Peter-Marian Issue) | | | | | | | | | |
| (LOC; Bank of America) | | 0.32 | | 7/7/09 | | 1,010,000 | a | | 1,010,000 |
| Massachusetts Development Finance | | | | | | | | | |
| Agency, Revenue (Sophia Snow | | | | | | | | | |
| House, Inc. Project) (LOC; | | | | | | | | | |
| Bank of America) | | 0.28 | | 7/7/09 | | 1,340,000 | a | | 1,340,000 |
| Massachusetts Development Finance | | | | | | | | | |
| Agency, Revenue (Worcester | | | | | | | | | |
| Academy Issue) (LOC; Allied | | | | | | | | | |
| Irish Banks) | | 0.83 | | 7/7/09 | | 3,000,000 | a | | 3,000,000 |
| Massachusetts Development Finance | | | | | | | | | |
| Agency, Revenue (Worcester | | | | | | | | | |
| Polytechnic Institute) | | | | | | | | | |
| (LOC; TD Bank) | | 0.25 | | 7/7/09 | | 2,500,000 | a | | 2,500,000 |
| Massachusetts Health and | | | | | | | | | |
| Educational Facilities | | | | | | | | | |
| Authority, Revenue | | | | | | | | | |
| (Amherst College Issue) | | 0.19 | | 7/1/09 | | 4,400,000 | a | | 4,400,000 |
| Massachusetts Health and | | | | | | | | | |
| Educational Facilities | | | | | | | | | |
| Authority, Revenue (Baystate | | | | | | | | | |
| Medical Center Issue) (LOC; | | | | | | | | | |
| JPMorgan Chase Bank) | | 0.33 | | 7/7/09 | | 1,000,000 | a | | 1,000,000 |
| Massachusetts Health and | | | | | | | | | |
| Educational Facilities | | | | | | | | | |
| Authority, Revenue (Bentley | | | | | | | | | |
| College Issue) (LOC; JPMorgan | | | | | | | | | |
| Chase Bank) | | 0.20 | | 7/7/09 | | 5,400,000 | a | | 5,400,000 |
| Massachusetts Health and | | | | | | | | | |
| Educational Facilities Authority, | | | | | | | | | |
| Revenue (Capital Asset Program | | | | | | | | | |
| Issue) (LOC; Bank of America) | | 0.30 | | 7/1/09 | | 700,000 | a | | 700,000 |
8
| Short-Term | | Coupon | | Maturity | | Principal | | | |
| Investments (continued) | | Rate (%) | | Date | | Amount ($) | | | Value ($) |
| |
| |
| |
|
| |
|
| Massachusetts (continued) | | | | | | | | | |
| Massachusetts Health and | | | | | | | | | |
| Educational Facilities | | | | | | | | | |
| Authority, Revenue (Great | | | | | | | | | |
| Brook Valley Health Center | | | | | | | | | |
| Issue) (LOC; TD Bank) | | 0.30 | | 7/7/09 | | 2,425,000 | a | | 2,425,000 |
| Massachusetts Health and | | | | | | | | | |
| Educational Facilities | | | | | | | | | |
| Authority, Revenue | | | | | | | | | |
| (Partners HealthCare | | | | | | | | | |
| System Issue) | | | | | | | | | |
| (LOC; Citibank NA) | | 0.18 | | 7/7/09 | | 6,000,000 | a | | 6,000,000 |
| Massachusetts Health and | | | | | | | | | |
| Educational Facilities | | | | | | | | | |
| Authority, Revenue (Peabody | | | | | | | | | |
| Essex Museum Issue) | | | | | | | | | |
| (LOC; Bank of America) | | 0.28 | | 7/7/09 | | 3,235,000 | a | | 3,235,000 |
| Massachusetts Health and | | | | | | | | | |
| Educational Facilities | | | | | | | | | |
| Authority, Revenue (Tufts | | | | | | | | | |
| University Issue) | | 0.25 | | 7/1/09 | | 1,500,000 | a | | 1,500,000 |
| Massachusetts Health and | | | | | | | | | |
| Educational Facilities | | | | | | | | | |
| Authority, Revenue (Tufts | | | | | | | | | |
| University Issue) (Liquidity | | | | | | | | | |
| Facility; Bank of America) | | 0.15 | | 7/1/09 | | 2,300,000 | a | | 2,300,000 |
| Massachusetts Health and | | | | | | | | | |
| Educational Facilities | | | | | | | | | |
| Authority, Revenue | | | | | | | | | |
| (Wellesley College Issue) | | 0.17 | | 7/7/09 | | 3,975,000 | a | | 3,975,000 |
| Massachusetts Health and | | | | | | | | | |
| Educational Facilities | | | | | | | | | |
| Authority, Revenue | | | | | | | | | |
| (Williams College Issue) | | 0.10 | | 7/7/09 | | 3,484,000 | a | | 3,484,000 |
| Massachusetts Health and | | | | | | | | | |
| Educational Facilities | | | | | | | | | |
| Authority, Revenue | | | | | | | | | |
| (Williams College Issue) | | 0.12 | | 7/7/09 | | 1,549,000 | a | | 1,549,000 |
The Fund 9
| STATEMENT OF INVESTMENTS (continued) |
| Short-Term | | Coupon | | Maturity | | Principal | | | |
| Investments (continued) | | Rate (%) | | Date | | Amount ($) | | | Value ($) |
| |
| |
| |
|
| |
|
| Massachusetts (continued) | | | | | | | | | |
| Massachusetts Health and | | | | | | | | | |
| Educational Facilities | | | | | | | | | |
| Authority, Revenue | | | | | | | | | |
| (Williams College Issue) | | 0.53 | | 4/7/10 | | 500,000 | | | 500,000 |
| Massachusetts Housing Finance | | | | | | | | | |
| Agency, Housing Revenue | | | | | | | | | |
| (Insured; FSA and Liquidity | | | | | | | | | |
| Facility; Dexia Credit Locale) | | 0.75 | | 7/7/09 | | 6,900,000 | a | | 6,900,000 |
| Massachusetts Industrial Finance | | | | | | | | | |
| Agency, Higher Education | | | | | | | | | |
| Revenue (Southern New England | | | | | | | | | |
| School of Law Issue) (LOC; | | | | | | | | | |
| Bank of America) | | 0.28 | | 7/7/09 | | 1,125,000 | a | | 1,125,000 |
| Massachusetts Industrial Finance | | | | | | | | | |
| Agency, IDR, Refunding | | | | | | | | | |
| (Nova Realty Trust) | | | | | | | | | |
| (LOC; Bank of America) | | 0.34 | | 7/7/09 | | 3,000,000 | a | | 3,000,000 |
| Massachusetts Water Resources | | | | | | | | | |
| Authority, Multi-Modal | | | | | | | | | |
| Subordinated General Revenue, | | | | | | | | | |
| Refunding (LOC; Landesbank | | | | | | | | | |
| Hessen-Thuringen Girozentrale) | | 0.35 | | 7/1/09 | | 2,640,000 | a | | 2,640,000 |
| Rockport, | | | | | | | | | |
| GO Notes, BAN | | 1.00 | | 6/25/10 | | 4,450,542 | | | 4,474,069 |
| Somerville, | | | | | | | | | |
| GO Notes, BAN | | 2.00 | | 12/18/09 | | 4,400,000 | | | 4,415,575 |
| Wellesley, | | | | | | | | | |
| GO Notes (Municipal | | | | | | | | | |
| Purpose Loan) | | 3.00 | | 6/1/10 | | 1,611,000 | | | 1,648,099 |
| Woburn, | | | | | | | | | |
| GO Notes, BAN | | 2.25 | | 7/24/09 | | 4,000,000 | | | 4,001,561 |
10
| Short-Term | | Coupon | | Maturity | | Principal | | |
| Investments (continued) | | Rate (%) | | Date | | Amount ($) | | Value ($) |
| |
| |
| |
| |
|
| New York—5.1% | | | | | | | | |
| Long Island Power Authority, | | | | | | | | |
| Electric System Subordinated | | | | | | | | |
| Revenue (LOC: JPMorgan Chase | | | | | | | | |
| Bank and Landesbank | | | | | | | | |
| Baden-Wurttemberg) | | 0.35 | | 7/7/09 | | 6,000,000 a | | 6,000,000 |
| Long Island Power Authority, | | | | | | | | |
| Electric System Subordinated | | | | | | | | |
| Revenue (LOC; Bayerische | | | | | | | | |
| Landesbank) | | 0.35 | | 7/1/09 | | 800,000 a | | 800,000 |
| North Carolina—2.9% | | | | | | | | |
| North Carolina Educational | | | | | | | | |
| Facilities Finance Agency, | | | | | | | | |
| Revenue (Johnson C. Smith | | | | | | | | |
| University) (LOC; Wells | | | | | | | | |
| Fargo Bank) | | 0.32 | | 7/7/09 | | 3,800,000 a | | 3,800,000 |
| |
| Total Investments (cost $130,017,960) | | | | | | 97.9% | | 130,017,960 |
| Cash and Receivables (Net) | | | | | | 2.1% | | 2,788,597 |
| Net Assets | | | | | | 100.0% | | 132,806,557 |
| a Variable rate demand note—rate shown is the interest rate in effect at June 30, 2009. Maturity date represents the |
| next demand date, or the ultimate maturity date if earlier. |
The Fund 11
| STATEMENT OF INVESTMENTS (continued) |
| Summary of Abbreviations | | | | |
| |
| ABAG | | Association of Bay Area Governments | | ACA | | American Capital Access |
| AGC | | ACE Guaranty Corporation | | AGIC | | Asset Guaranty Insurance Company |
| AMBAC | | American Municipal Bond | | | | |
| | | Assurance Corporation | | ARRN | | Adjustable Rate Receipt Notes |
| BAN | | Bond Anticipation Notes | | BIGI | | Bond Investors Guaranty Insurance |
| BPA | | Bond Purchase Agreement | | CGIC | | Capital Guaranty Insurance Company |
| CIC | | Continental Insurance Company | | CIFG | | CDC Ixis Financial Guaranty |
| CMAC | | Capital Markets Assurance Corporation | | COP | | Certificate of Participation |
| CP | | Commercial Paper | | EDR | | Economic Development Revenue |
| EIR | | Environmental Improvement Revenue | | FGIC | | Financial Guaranty Insurance |
| | | | | | | Company |
| FHA | | Federal Housing Administration | | FHLB | | Federal Home Loan Bank |
| FHLMC | | Federal Home Loan Mortgage | | FNMA | | Federal National |
| | | Corporation | | | | Mortgage Association |
| FSA | | Financial Security Assurance | | GAN | | Grant Anticipation Notes |
| GIC | | Guaranteed Investment Contract | | GNMA | | Government National |
| | | | | | | Mortgage Association |
| GO | | General Obligation | | HR | | Hospital Revenue |
| IDB | | Industrial Development Board | | IDC | | Industrial Development Corporation |
| IDR | | Industrial Development Revenue | | LOC | | Letter of Credit |
| LOR | | Limited Obligation Revenue | | LR | | Lease Revenue |
| MFHR | | Multi-Family Housing Revenue | | MFMR | | Multi-Family Mortgage Revenue |
| PCR | | Pollution Control Revenue | | PILOT | | Payment in Lieu of Taxes |
| RAC | | Revenue Anticipation Certificates | | RAN | | Revenue Anticipation Notes |
| RAW | | Revenue Anticipation Warrants | | RRR | | Resources Recovery Revenue |
| SAAN | | State Aid Anticipation Notes | | SBPA | | Standby Bond Purchase Agreement |
| SFHR | | Single Family Housing Revenue | | SFMR | | Single Family Mortgage Revenue |
| SONYMA | | State of New York Mortgage Agency | | SWDR | | Solid Waste Disposal Revenue |
| TAN | | Tax Anticipation Notes | | TAW | | Tax Anticipation Warrants |
| TRAN | | Tax and Revenue Anticipation Notes | | XLCA | | XL Capital Assurance |
12
| Summary of Combined Ratings (Unaudited) | | |
| |
| Fitch | | or | | Moody’s | | or | | Standard & Poor’s | | Value (%)† |
| |
| |
| |
| |
| |
|
| F1+,F1 | | | | VMIG1,MIG1,P1 | | | | SP1+,SP1,A1+,A1 | | 89.9 |
| AAA,AA,Ab | | | | Aaa,Aa,Ab | | | | AAA,AA,Ab | | 6.7 |
| Not Ratedc | | | | Not Ratedc | | | | Not Ratedc | | 3.4 |
| | | | | | | | | | | 100.0 |
| † Based on total investments. |
| b Notes which are not F, MIG and SP rated are represented by bond ratings of the issuers. |
| c Securities which, while not rated by Fitch, Moody’s and Standard & Poor’s, have been determined by the Manager to |
| be of comparable quality to those rated securities in which the fund may invest. |
| See notes to financial statements. |
The Fund 13
| STATEMENT OF ASSETS AND LIABILITIES |
| June 30, 2009 |
| | | Cost | | Value |
| |
| |
|
| Assets ($): | | | | |
| Investments in securities—See Statement of Investments | | 130,017,960 | | 130,017,960 |
| Cash | | | | 566,273 |
| Receivable for investment securities sold | | | | 2,000,000 |
| Interest receivable | | | | 240,097 |
| Prepaid expenses | | | | 13,847 |
| | | | | 132,838,177 |
| Liabilities ($): | | | | |
| Due to The Dreyfus Corporation and affiliates—Note 2 | | | | 31,616 |
| Dividend payable | | | | 4 |
| | | | | 31,620 |
| Net Assets ($) | | | | 132,806,557 |
| Composition of Net Assets ($): | | | | |
| Paid-in capital | | | | 132,806,542 |
| Accumulated net realized gain (loss) on investments | | | | 15 |
| Net Assets ($) | | | | 132,806,557 |
| Shares Outstanding | | | | |
| (unlimited number of shares of Beneficial Interest authorized) | | | | 132,817,627 |
| Net Asset Value, offering and redemption price per share ($) | | | | 1.00 |
| |
| See notes to financial statements. | | | | |
14
| STATEMENT OF OPERATIONS |
| Year Ended June 30, 2009 |
| Investment Income ($): | | |
| Interest Income | | 2,422,171 |
| Expenses: | | |
| Management fee—Note 2 | | 764,423 |
| Treasury insurance expense—Note 1(f) | | 51,234 |
| Trustees’ fees—Note 2 | | 10,448 |
| Total Expenses | | 826,105 |
| Less—reduction in expenses due to undertaking—Note 2 | | (20,173) |
| Less—Trustees’ fees reimbursed by the Manager—Note 2 | | (10,448) |
| Net Expenses | | 795,484 |
| Investment Income—Net | | 1,626,687 |
| Net Realized Gain (Loss) on Investments—Note 1(b) ($) | | 15 |
| Net Increase in Net Assets Resulting from Operations | | 1,626,702 |
| |
| See notes to financial statements. | | |
The Fund 15
STATEMENT OF CHANGES IN NET ASSETS
| | | | | Year Ended June 30, |
| | |
| |
|
| | | 2009 | | 2008 |
| |
| |
|
| Operations ($): | | | | |
| Investment income—net | | 1,626,687 | | 4,376,085 |
| Net realized gain (loss) on investments | | 15 | | 32,990 |
| Net Increase (Decrease) in Net Assets | | | | |
| Resulting from Operations | | 1,626,702 | | 4,409,075 |
| Dividends to Shareholders from ($): | | | | |
| Investment income—net | | (1,659,677) | | (4,377,135) |
| Beneficial Interest Transactions ($1.00 per share): | | | | |
| Net proceeds from shares sold | | 306,103,065 | | 464,381,058 |
| Dividends reinvested | | 227,602 | | 622,358 |
| Cost of shares redeemed | | (352,722,205) | | (447,865,845) |
| Increase (Decrease) in Net Assets from | | | | |
| Beneficial Interest Transactions | | (46,391,538) | | 17,137,571 |
| Total Increase (Decrease) in Net Assets | | (46,424,513) | | 17,169,511 |
| Net Assets ($): | | | | |
| Beginning of Period | | 179,231,070 | | 162,061,559 |
| End of Period | | 132,806,557 | | 179,231,070 |
| |
| See notes to financial statements. | | | | |
16
FINANCIAL HIGHLIGHTS
The following table describes the performance for the fiscal periods indicated. Total return shows how much your investment in the fund would have increased (or decreased) during each period, assuming you had reinvested all dividends and distributions.These figures have been derived from the fund’s financial statements.
| | | | | Year Ended June 30, | | |
| | |
| |
| |
|
| | | 2009 | | 2008 | | 2007 | | 2006 | | 2005 |
| |
| |
| |
| |
| |
|
| Per Share Data ($): | | | | | | | | | | |
| Net asset value, beginning of period | | 1.00 | | 1.00 | | 1.00 | | 1.00 | | 1.00 |
| Investment Operations: | | | | | | | | | | |
| Investment income—net | | .009 | | .026 | | .032 | | .024 | | .013 |
| Distributions: | | | | | | | | | | |
| Dividends from investment income—net | | (.009) | | (.026) | | (.032) | | (.024) | | (.013) |
| Net asset value, end of period | | 1.00 | | 1.00 | | 1.00 | | 1.00 | | 1.00 |
| Total Return (%) | | .95 | | 2.59 | | 3.21 | | 2.48 | | 1.34 |
| Ratios/Supplemental Data (%): | | | | | | | | | | |
| Ratio of total expenses | | | | | | | | | | |
| to average net assets | | .49 | | .46 | | .46 | | .46 | | .45 |
| Ratio of net expenses | | | | | | | | | | |
| to average net assets | | .47 | | .45 | | .45 | | .45 | | .45 |
| Ratio of net investment income | | | | | | | | | | |
| to average net assets | | .96 | | 2.51 | | 3.17 | | 2.46 | | 1.33 |
| Net Assets, end of period ($ x 1,000) | | 132,807 | | 179,231 | | 162,062 | | 130,286 | | 131,162 |
| |
| See notes to financial statements. | | | | | | | | | | |
The Fund 17
NOTES TO FINANCIAL STATEMENTS
NOTE 1—Significant Accounting Policies:
Dreyfus BASIC Massachusetts Municipal Money Market Fund (the “fund”) is a separate non-diversified series of The Dreyfus/Laurel Tax-Free Municipal Funds (the “Trust”) which is registered under the Investment Company Act of 1940, as amended (the “Act”), as an open-end management investment company and operates as a series company, currently offering three series including the fund.The fund’s investment objective is to provide a high level of current income exempt from federal and Massachusetts state income taxes to the extent consistent with the preservation of capital and the maintenance of liquidity.The Dreyfus Corporation (the “Manager” or “Dreyfus”), a wholly-owned subsidiary of The Bank of New York Mellon Corporation (“BNY Mellon”), serves as the fund’s investment adviser. MBSC Securities Corporation (the “Distributor”), a wholly-owned subsidiary of the Manager, is the distributor of the fund’s shares, which are sold without a sales charge.
Effective July 1, 2008, BNY Mellon reorganized and consolidated a number of its banking and trust company subsidiaries.As a result of the reorganization, any services previously provided to the fund by Mellon Bank, N.A. or Mellon Trust of New England, N.A. are now provided by The Bank of NewYork Mellon (formerly,The Bank of NewYork).
It is the fund’s policy to maintain a continuous net asset value per share of $1.00 for the fund; the fund has adopted certain investment, portfolio valuation and dividend and distribution policies to enable it to do so. There is no assurance, however, that the fund will be able to maintain a stable net asset value per share of $1.00.
The fund’s financial statements are prepared in accordance with U.S. generally accepted accounting principles, which may require the use of management estimates and assumptions. Actual results could differ from those estimates.
(a) Portfolio valuation: Investments in securities are valued at amortized cost in accordance with Rule 2a-7 of the Act, which has been
18
determined by the Board of Trustees to represent the fair value of the fund’s investments.
The fund adopted Statement of Financial Accounting Standards No. 157 “FairValue Measurements” (“FAS 157”). FAS 157 establishes an author itative definition of fair value, sets out a framework for measuring fair value, and requires additional disclosures about fair value measurements
Various inputs are used in determining the value of the fund’s invest ments relating to FAS 157.These inputs are summarized in the three broad levels listed below.
| | Level 1—quoted prices in active markets for identical investments.
Level 2—other significant observable inputs (including quoted
prices for similar securities, interest rates, prepayment speeds,
credit risk, etc.).
Level 3—significant unobservable inputs (including the fund’s own
assumptions in determining the fair value of investments). |
The inputs or methodology used for valuing securities are not necessarily an indication of the risk associated with investing in those securities. For example, money market securities are valued using amortized cost, in accordance with rules under the Act. Generally, amortized cost approximates the current fair value of a security, but since the value is not obtained from a quoted price in an active market, such securities are reflected as Level 2.
The following is a summary of the inputs used as of June 30, 2009 in valuing the fund’s investments:
| | | Investments in |
| Valuation Inputs | | Securities ($) |
| |
|
| Level 1—Quoted Prices | | — |
| Level 2—Other Significant Observable Inputs | | 130,017,960 |
| Level 3—Significant Unobservable Inputs | | — |
| Total | | 130,017,960 |
The Fund 19
| NOTES TO FINANCIAL STATEMENTS (continued) |
(b) Securities transactions and investment income: Securities transactions are recorded on a trade date basis. Interest income, adjusted for accretion of discount and amortization of premium on investments, is earned from settlement date and recognized on the accrual basis. Realized gains and losses from securities transactions are recorded on the identified cost basis. Cost of investments represents amortized cost.
(c) Concentration of risk: The fund follows an investment policy of investing primarily in municipal obligations of one state. Economic changes affecting the commonwealth and certain of its public bodies and municipalities may affect the ability of issuers within the state to pay interest on, or repay principal of, municipal obligations held by the fund.
All cash balances were maintained with the Custodian,The Bank of New York Mellon, a subsidiary of BNY Mellon and an affiliate of Dreyfus.
(d) Dividends to shareholders: It is the policy of the fund to declare dividends daily from investment income-net; such dividends are paid monthly. Dividends from net realized capital gains, if any, are normally declared and paid annually, but the fund may make distributions on a more frequent basis to comply with the distribution requirements of the Internal Revenue Code of 1986, as amended (the “Code”).To the extent that net realized capital gains can be offset by capital loss carryovers, it is the policy of the fund not to distribute such gains.
(e) Federal income taxes: It is the policy of the fund to continue to qualify as a regulated investment company, which can distribute tax exempt dividends, by complying with the applicable provisions of the Code, and to make distributions of income and net realized capital gain sufficient to relieve it from substantially all federal income and excise taxes.
As of and during the period ended June 30, 2009, the fund did not have any liabilities for any uncertain tax positions.The fund recognizes interest and penalties, if any, related to uncertain tax positions as income tax expense in the Statement of Operations. During the period, the fund did not incur any interest or penalties.
20
Each of the tax years in the four-year period ended June 30, 2009 remains subject to examination by the Internal Revenue Service and state taxing authorities.
At June 30, 2009, the components of accumulated earnings on a tax basis were substantially the same as for financial reporting purposes.
The tax character of distributions paid to shareholders during the fiscal periods ended June 30, 2009 and June 30, 2008, were as follows: tax exempt income $1,626,687 and $4,376,085, ordinary income $32,498 and $1,050 and long-term capital gains $492 and $0, respectively.
During the period ended June 30, 2009, as a result of permanent book to tax differences, primarily due to dividend reclassification, the fund increased accumulated undistributed investment income-net by $32,990 and decreased accumulated net realized gain (loss) on investments by the same amount. Net assets and net asset value per share were not affected by this reclassification.
At June 30, 2009, the cost of investments for federal income tax purposes was substantially the same as the cost for financial reporting purposes (see the Statement of Investments).
(f) Treasury’s Temporary Guarantee Program: The fund has entered into a Guarantee Agreement with the United States Department of the Treasury (the “Treasury”) to participate in the Treasury’s Temporary Guarantee Program for Money Market Funds (the “Program”).
Under the Program, the Treasury guarantees the share price of shares of the fund held by shareholders as of September 19, 2008 at $1.00 per share if the fund’s net asset value per share falls below $0.995 (a “Guarantee Event”) and the fund liquidates. Recovery under the Program is subject to certain conditions and limitations.
Fund shares acquired by investors after September 19, 2008 that increase the number of fund shares the investor held at the close of
The Fund 21
| NOTES TO FINANCIAL STATEMENTS (continued) |
business on September 19, 2008 are not eligible for protection under the Program. In addition, fund shares acquired by investors who did not hold fund shares at the close of business on September 19, 2008 are not eligible for protection under the Program.
The Program, which was originally set to expire on December 18, 2008, was initially extended by the Treasury until April 30, 2009 and has been further extended by the Treasury until September 18, 2009, after which the Secretary of the Treasury will review the need for, and terms of, the Program. Participation in the initial term and the extended periods of the Program required a payment to the Treasury in the amount of .01%, .015% and .015%, respectively, of the fund’s shares outstanding as of September 19, 2008 (valued at $1.00 per share).This expense is being borne by the fund without regard to any expense limitation currently in effect.
NOTE 2—Investment Management Fee And Other Transactions With Affiliates:
Pursuant to an investment management agreement with the Manager, the Manager provides or arranges for one or more third parties and/or affiliates to provide investment advisory, administrative, custody, fund accounting and transfer agency services to the fund.The Manager also directs the investments of the fund in accordance with its investment objective, policies and limitations. For these services, the fund is contractually obligated to pay the Manager a fee, calculated daily and paid monthly, at the annual rate of .45% of the value of the fund’s average daily net assets. Out of its fee, the Manager pays all of the expenses of the fund except brokerage fees, taxes, interest, fees and expenses of non-interested Trustees (including counsel fees) and extraordinary expenses. In addition, the Manager is required to reduce its fee in an amount equal to the fund’s allocable portion of fees and expenses of the non-interested Trustees (including counsel fees).EachTrustee receives $45,000 per year,
22
plus $6,000 for each joint Board meeting of The Dreyfus/Laurel Funds, Inc., the Trust,The Dreyfus/Laurel Funds Trust (collectively, the “Dreyfus/Laurel Funds”) and Dreyfus Investment Funds attended, $2,000 for separate in-person committee meetings attended which are not held in conjunction with a regularly scheduled Board meeting and $1,500 for Board meetings and separate committee meetings attended that are conducted by telephone and is reimbursed for travel and out-of-pocket expenses. With respect to Board meetings, the Chairman of the Board receives an additional 25% of such compensation (with the exception of reimbursable amounts). With respect to compensation committee meetings, the Chair of the compensation committee receives $900 per meeting. In the event that there is an in-person joint committee or a joint telephone meeting of the Dreyfus/Laurel Funds, Dreyfus Investment Funds and Dreyfus High Yield Strategies Fund, the $2,000 or $1,500 fee,as applicable,will be allocated between the Dreyfus/Laurel Funds, Dreyfus Investment Funds and Dreyfus High Yield Strategies Fund.These fees and expenses are charged and allocated to each series based on net assets.Amounts required to be paid by the Trust directly to the non-interested Trustees, that would be applied to offset a portion of the management fee payable to the Manager, are in fact paid directly by the Manager to the non-interested Trustees.
The Manager has undertaken to reimburse expenses in the event that current yields drop below a certain level.This undertaking is voluntary and not contractual and may be terminated at any time.The reduction in expenses, pursuant to the undertaking, amounted to $20,173 during the period ended June 30, 2009.
The components of “Due to The Dreyfus Corporation and affiliates” in the Statement of Assets and Liabilities consist of: management fees $31,616.
The Fund 23
| NOTES TO FINANCIAL STATEMENTS (continued) |
NOTE 3—Bank Line of Credit:
The fund participated with other Dreyfus-managed funds in a $300 million unsecured line of credit provided by The Bank of New York Mellon (the “BNYM Facility”), primarily to be utilized for temporary or emergency purposes, including the financing of redemptions. The terms of the BNYM Facility limit the amount of individual fund borrowings. Interest is charged to the fund based on prevailing market rates in effect at the time of borrowing. Effective October 15, 2008, the $300 million unsecured line of credit was terminated. During the period ended June 30, 2009, the fund did not borrow under the line of credit.
NOTE 4—Subsequent Events Evaluation:
Dreyfus has evaluated the need for disclosures and/or adjustments resulting from subsequent events through August 18, 2009, the date the financial statements were available to be issued. This evaluation did not result in any subsequent events that necessitated disclosures and/or adjustments.
24
| REPORT OF INDEPENDENT REGISTERED |
| PUBLIC ACCOUNTING FIRM |
The Board of Trustees and Shareholders of
The Dreyfus/Laurel Tax-Free Municipal Funds: |
We have audited the accompanying statement of assets and liabilities of Dreyfus BASIC Massachusetts Municipal Money Market Fund (the “Fund”), a series of The Dreyfus/Laurel Tax-Free Municipal Funds, including the statement of investments, as of June 30, 2009, and the related statement of operations for the year then ended, the statement of changes in net assets for each of the years in the two-year period then ended, and the financial highlights for each of the years in the five-year period then ended. These financial statements and financial highlights are the responsibility of the Fund’s management. Our responsibility is to express an opinion on these financial statements and financial highlights based on our audits.
We conducted our audits in accordance with the standards of the Public Company Accounting Oversight Board (United States). Those standards require that we plan and perform the audit to obtain reasonable assurance about whether the financial statements and financial highlights are free of material misstatement. An audit also includes examining, on a test basis, evidence supporting the amounts and disclosures in the financial statements. Our procedures included confirmation of securities owned as of June 30, 2009, by correspondence with the custodian and brokers. An audit also includes assessing the accounting principles used and significant estimates made by management, as well as evaluating the overall financial statement presentation. We believe that our audits provide a reasonable basis for our opinion.
In our opinion, the financial statements and financial highlights referred to above present fairly, in all material respects, the financial position of Dreyfus BASIC Massachusetts Municipal Money Market Fund of The Dreyfus/Laurel Tax-Free Municipal Funds as of June 30, 2009, and the results of its operations for the year then ended, the changes in its net assets for each of the years in the two-year period then ended, and the financial highlights for each of the years in the five-year period then ended, in conformity with accounting principles generally accepted in the United States of America.

| | New York, New York
August 18, 2009 |
The Fund 25
IMPORTANT TAX INFORMATION (Unaudited)
In accordance with federal tax law, the fund hereby designates all the dividends paid from investment income-net during the fiscal year ended June 30, 2009 as “exempt-interest dividends” (not subject to regular federal and, for individuals who are Massachusetts residents, Massachusetts personal income taxes), except $492 that is being designated as a long-term capital gain distribution and $32,498 that is being designated as an ordinary income distribution for reporting purposes. As required by federal tax law rules, shareholders will receive notification of their portion of the fund’s exempt-interest dividends paid for the 2009 calendar year on Form 1099-INT, which will be mailed by early 2010.
26
| INFORMATION ABOUT THE REVIEW AND APPROVAL OF THE |
| FUND’S INVESTMENT MANAGEMENT AGREEMENT (Unaudited) |
At a meeting of the fund’s Board of Trustees held on February 9 and 10, 2009, the Board considered the re-approval of the fund’s Investment Management Agreement (“Management Agreement”), pursuant to which the Manager provides the fund with investment advisory and administrative services.The Board members, none of whom are “interested persons” (as defined in the Investment Company Act of 1940, as amended) of the fund, were assisted in their review by independent legal counsel and met with counsel in executive session separate from representatives of the Manager.
Analysis of Nature, Extent and Quality of Services Provided to the Fund.The Board members considered information previously provided to them in a presentation from representatives of the Manager regarding services provided to the fund and other funds in the Dreyfus fund complex, and representatives of the Manager confirmed that there had been no material changes in this information.The Board also discussed the nature, extent and quality of the services provided to the fund pursuant to its Management Agreement. The Manager’s representatives reviewed the fund’s distribution of accounts and the relationships the Manager has with various intermediaries and the different needs of each.The Manager’s representatives noted the distribution channels for the fund as well as the diversity of distribution among the funds in the Dreyfus fund complex, and the Manager’s corresponding need for broad, deep, and diverse resources to be able to provide ongoing shareholder services to each distribution channel, including those of the fund.The Manager provided the number of shareholder accounts in the fund, as well as the fund’s asset size.
The Board members also considered the Manager’s research and portfolio management capabilities and that the Manager also provides oversight of day-to-day fund operations, including fund accounting and administration and assistance in meeting legal and regulatory requirements. The Board members also considered the Manager’s extensive administrative, accounting and compliance infrastructure.
The Fund 27
| INFORMATION ABOUT THE REVIEW AND APPROVAL OF THE |
| FUND’S INVESTMENT MANAGEMENT AGREEMENT (Unaudited) (continued) |
Comparative Analysis of the Fund’s Performance and Management Fee and Expense Ratio. The Board members reviewed the fund’s performance and comparisons to a group of retail, no-load Massachusetts tax-exempt money market funds (the “Performance Group”) and to a larger universe of funds, consisting of all retail and institutional Massachusetts tax-exempt money market funds (the “Performance Universe”) selected and provided by Lipper, Inc., an independent provider of investment company data.The Board was provided with a description of the methodology Lipper used to select the Performance Group and Performance Universe, as well as the Expense Group and Expense Universe (discussed below). The Board members discussed the results of the comparisons for various periods ended December 31, 2008, and noted that the fund’s total return performance was above the Performance Group and Performance Universe medians for each of the periods.
The Board members also discussed the fund’s contractual and actual management fee and expense ratio and reviewed the range of management fees and expense ratios of a comparable group of funds (the “Expense Group”) and a broader group of funds (the “Expense Universe”), each selected and provided by Lipper. Noting that the fund was the only fund in the Expense Group with a “unitary fee” structure, the Board noted that the fund’s contractual management fee was equal to the Expense Group median, the fund’s actual management fee was below the Expense Group median and equal to the Expense Universe median, and the fund’s expense ratio was below the Expense Group and Expense Universe medians.
Representatives of the Manager reviewed with the Board members the fees paid to the Manager or its affiliates by mutual funds managed by the Manager or its affiliates with similar investment objectives, policies and strategies, and included in the same Lipper category as the fund (the “Similar Funds”). They also noted that there were no other accounts managed by the Manager or its affiliates with similar investment objectives, policies and strategies as the fund. The Manager’s representatives also reviewed the costs associated with distribution through intermedi-
28
aries.The Board analyzed differences in fees paid to the Manager and discussed the relationship of the fees paid in light of the services provided, noting the fund’s “unitary fee” structure. The Board members considered the relevance of the fee information provided for the Similar Funds to evaluate the appropriateness and reasonableness of the fund’s management fee.
Analysis of Profitability and Economies of Scale. The Manager’s representatives reviewed the dollar amount of expenses allocated and profit received by the Manager and the method used to determine such expenses and profit. The Board previously had been provided with information prepared by an independent consulting firm regarding the Manager’s approach to allocating costs to, and determining the profitability of, individual funds and the entire Dreyfus mutual fund complex.The Board also was informed that the methodology had also been reviewed by an independent registered public accounting firm which, like the consultant, found the methodology to be reasonable. The consulting firm also analyzed where any economies of scale might emerge in connection with the management of the fund.The Board members evaluated the profitability analysis in light of the relevant circumstances for the fund and the extent to which economies of scale would be realized if the fund grows and whether fee levels reflect these economies of scale for the benefit of fund shareholders. The Board members also considered potential benefits to the Manager from acting as investment adviser and noted that there were no soft dollar arrangements with respect to trading the fund’s portfolio.
It was noted that the Board members should consider the Manager’s profitability with respect to the fund as part of their evaluation of whether the fees under the Management Agreement bear a reasonable relationship to the mix of services provided by the Manager, including the nature, extent and quality of such services and that a discussion of economies of scale is predicated on increasing assets and that, if a fund’s assets had been decreasing, the possibility that the Manager may have realized any economies of scale would be less. It also was noted that the
The Fund 29
| INFORMATION ABOUT THE REVIEW AND APPROVAL OF THE |
| FUND’S INVESTMENT MANAGEMENT AGREEMENT (Unaudited) (continued) |
profitability percentage for managing the fund was within the range determined by appropriate court cases to be reasonable given the services rendered and generally superior service levels provided by the Manager.
At the conclusion of these discussions, the Board agreed that it had been furnished with sufficient information to make an informed business decision with respect to continuation of the fund’s Management Agreement. Based on the discussions and considerations as described above, the Board made the following conclusions and determinations.
- The Board concluded that the nature, extent and quality of the ser- vices provided by the Manager are adequate and appropriate.
- The Board was satisfied with the fund’s relative performance.
- The Board concluded that the fee paid by the fund to the Manager was reasonable in light of the services provided, comparative perfor- mance, expense and advisory fee information, costs of the services provided and profits to be realized and benefits derived or to be derived by the Manager from its relationship with the fund.
- The Board determined that the economies of scale which may accrue to the Manager and its affiliates in connection with the man- agement of the fund had been adequately considered by the Manager in connection with the management fee rate charged to the fund and that, to the extent in the future it were determined that material economies of scale had not been shared with the fund, the Board would seek to have those economies of scale shared with the fund.
The Board members considered these conclusions and determinations, along with information received on a routine and regular basis throughout the year, and, without any one factor being dispositive, the Board determined that re-approval of the fund’s Management Agreement was in the best interests of the fund and its shareholders and that the Management Agreement would be renewed through April 4, 2010.
30
BOARD MEMBERS INFORMATION (Unaudited)
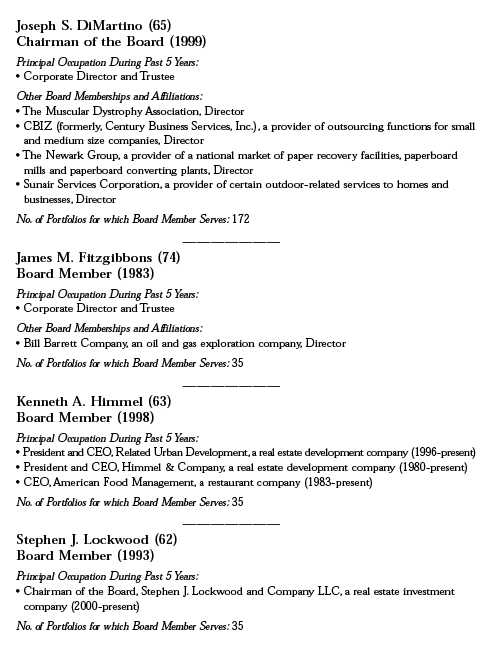
The Fund 31
BOARD MEMBERS INFORMATION (Unaudited) (continued)

32
OFFICERS OF THE FUND (Unaudited)
The Fund 33
OFFICERS OF THE FUND (Unaudited) (continued)
34
NOTES
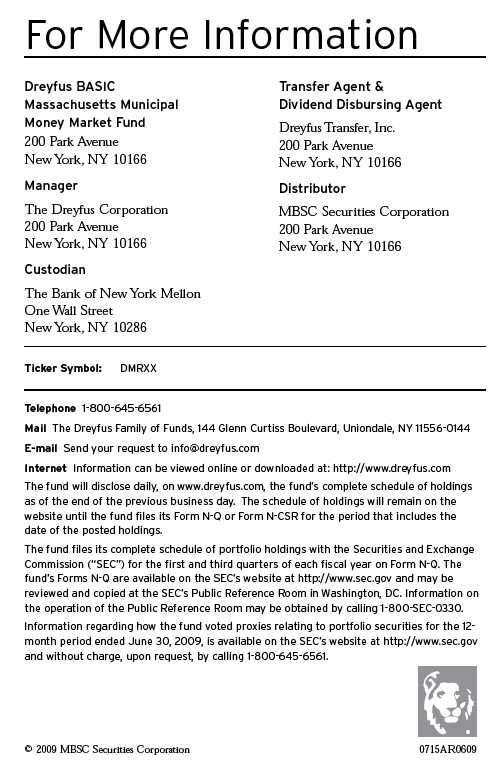
Save time. Save paper. View your next shareholder report online as soon as it’s available. Log into www.dreyfus.com and sign up for Dreyfus eCommunications. It’s simple and only takes a few minutes.
The views expressed in this report reflect those of the portfolio manager only through the end of the period covered and do not necessarily represent the views of Dreyfus or any other person in the Dreyfus organization. Any such views are subject to change at any time based upon market or other conditions and Dreyfus disclaims any responsibility to update such views.These views may not be relied on as investment advice and, because investment decisions for a Dreyfus fund are based on numerous factors, may not be relied on as an indication of trading intent on behalf of any Dreyfus fund.

| | Contents |
| |
| | THE FUND |
| |
| 2 | A Letter from the Chairman and CEO |
| |
| 3 | Discussion of Fund Performance |
| |
| 6 | Understanding Your Fund’s Expenses |
| |
| 6 | Comparing Your Fund’s Expenses With Those of Other Funds |
| |
| 7 | Statement of Investments |
| |
| 17 | Statement of Assets and Liabilities |
| |
| 18 | Statement of Operations |
| |
| 19 | Statement of Changes in Net Assets |
| |
| 20 | Financial Highlights |
| |
| 21 | Notes to Financial Statements |
| |
| 28 | Report of Independent Registered Public Accounting Firm |
| |
| 29 | Important Tax Information |
| |
| 30 | Information About the Review and Approval of the Fund’s Investment Management Agreement |
| |
| 35 | Board Members Information |
| |
| 37 | Officers of the Fund |
| |
| | FOR MORE INFORMATION |
| |
| | Back Cover |
| |
Dreyfus BASIC
New York Municipal
Money Market Fund |

A LETTER FROM THE CHAIRMAN AND CEO
Dear Shareholder:
We are pleased to present this annual report for Dreyfus BASIC New York Municipal Money Market Fund, covering the 12-month period from July 1, 2008, through June 30, 2009.
The severe recession and banking crisis that punished the financial markets beginning in 2008 appear to have eased somewhat as of mid-year 2009. Previously frozen credit markets have thawed, giving businesses access to the capital they need to grow. After reaching multi-year lows early in 2009, equities and higher-yielding bonds have generally staged impressive rallies.Yet, the Federal Reserve Board has steadfastly maintained a highly accommodative monetary policy, keeping its target for short-term interest rates at close to 0.00%. Consequently, money market yields have declined to record lows.
Although recent developments in the financial markets give us reasons for optimism, we remain cautious due to the speed and magnitude of the markets’rebound.Indeed,the markets’advance was led mainly by lower-quality securities when investors developed renewed appetites for risk. We would prefer to see a steadier rise in asset prices supported by more concrete economic data, as the rapid rise increases the possibility that profit-taking could move the markets lower. In uncertain markets such as these, even the most seasoned investors can benefit from professional counsel. To determine how both your long-term investments and current liquid assets should be allocated for the challenges and opportunities that lie ahead, we continue to stress that you talk regularly with your financial advisor.
For information about how the fund performed during the reporting period, as well as market perspectives, we have provided a Discussion of Fund Performance given by the Portfolio Manager.
Thank you for your continued confidence and support.
Jonathan R. Baum
Chairman and Chief Executive Officer
The Dreyfus Corporation
July 15, 2009 |
2

DISCUSSION OF FUND PERFORMANCE
For the period of July 1, 2008, through June 30, 2009, as provided by Joseph Irace, Senior Portfolio Manager
Fund and Market Performance Overview
For the 12-month period ended June 30, 2009, Dreyfus BASIC New York Municipal Money Market Fund produced a yield of 1.34%. Taking into account the effects of compounding, the fund produced an effective yield of 1.35%.1
Yields of tax-exempt money market instruments fell to historically low levels during the reporting period as the Federal Reserve Board (the “Fed”) reduced short-term interest rates aggressively to combat a faltering U.S. economy and financial crisis.
The Fund’s Investment Approach
The fund seeks to provide a high level of current income exempt from federal, New York state and New York city income taxes to the extent consistent with the preservation of capital and the maintenance of liquidity. To pursue this objective, we attempt to add value by selecting the individual tax-exempt money market instruments from high-quality NewYork-exempt issuers that we believe are most likely to provide high tax-exempt current income.We also actively manage the fund’s weighted average maturity in anticipation of interest-rate and supply-and-demand changes in NewYork’s short-term municipal marketplace.
The management of the fund’s weighted average maturity uses a more tactical approach. If we expect the supply of securities to increase temporarily, we may reduce the fund’s weighted average maturity to make cash available for the purchase of higher-yielding securities.This is due to the fact that yields tend to rise temporarily if issuers are competing for investor interest. If we expect demand to surge at a time when we anticipate little issuance and therefore lower yields, we may increase the fund’s weighted average maturity to maintain current yields for as long as we deem practical. At other times, we try to maintain a neutral weighted average maturity.
The Fund 3
| DISCUSSION OF FUND PERFORMANCE (continued) |
Money Market Yields Plunged During the Downturn
U.S. economic conditions deteriorated sharply over the second half of 2008 as a result of weakness in housing markets, rising unemployment and declining consumer confidence. In addition, an ongoing credit crisis escalated into a full-blown global financial crisis in the wake of the failures of major financial institutions. Dealers and insurers of municipal money market instruments were punished during the downturn by severe investment losses and lack of investor confidence. In this environment, the Fed reduced its target for the federal funds rate from 2.00% at the start of the reporting period to a record low of 0.00% to 0.25% by the end of 2008.As a result, tax-exempt money market yields also fell to historically low levels.
The Fed left its low interest rate target unchanged over the first six months of 2009. During the first quarter of the year, the U.S. economy continued to show evidence of deterioration, losing more than 650,000 jobs per month in February and March. Meanwhile, the Conference Board’s Consumer Confidence Index reached the lowest level since its inception in 1967. The U.S. government passed the $787 billion American Recovery and Reinvestment Act in an effort to retain and create jobs, provide budget relief to states and localities, maintain social programs and offer tax relief to businesses and individuals.
Investor sentiment began to improve in March amid early signs that the economic downturn might be decelerating. A decline in the three-month London Interbank Offered Rate (LIBOR) below 1.00% provided evidence of improvement in the global credit markets, and the U.S. stock market staged an impressive rebound from multi-year lows.
The financial crisis and economic downturn put severe pressure on the fiscal conditions of many states and municipalities, which faced reduced tax collections and intensifying demands on social services programs. Both the state and city of New York were particularly hard-hit by job losses in the financial services industry.Although the state and city have enacted balanced budgets for the current fiscal year, they face projected deficits in the future.
4
Amid Turmoil, a Focus on Quality and Liquidity
We focused throughout the reporting period on direct, high-quality municipal obligations that have been independently approved by our credit analysts.We generally avoided money market instruments from New York issuers that we regarded as vulnerable to the state’s budget problems, instead favoring those backed by pledged tax appropriations, stable revenue streams or private endowments.
We set the fund’s weighted average maturity in a range that was shorter than industry averages in case of unexpected liquidity needs. However, yield differences have remained relatively narrow along the market’s maturity range, so this conservative positioning did not detract materially from the fund’s performance.
Preserving Capital Is Our Priority
Yields of instruments from issuers with questionable credit profiles generally have been higher than yields from issuers who are relatively insulated from the downturn. Nonetheless, we believe the prudent course is to refrain from chasing higher yields, instead maintaining a conservative credit selection strategy with an emphasis on preservation of capital and liquidity.
July 15, 2009
| | | An investment in the fund is not insured or guaranteed by the FDIC or any other government |
| | | agency. Although the fund seeks to preserve the value of your investment at $1.00 per share, it is |
| | | possible to lose money by investing in the fund. |
| 1 | | Effective yield is based upon dividends declared daily and reinvested monthly. Past performance is |
| | | no guarantee of future results.Yields fluctuate. Income may be subject to state and local taxes for |
| | | non-NewYork residents, and some income may be subject to the federal alternative minimum tax |
| | | (AMT) for certain investors.Yields provided reflect the absorption of certain fund expenses by The |
| | | Dreyfus Corporation pursuant to an undertaking in effect that may be extended, terminated or |
| | | modified at any time. Had these expenses not been absorbed, the annualized yield and |
| | | annualized effective yield would have been 1.33% and 1.34%, respectively. |
The Fund 5
UNDERSTANDING YOUR FUND’S EXPENSES (Unaudited)
As a mutual fund investor, you pay ongoing expenses, such as management fees and other expenses. Using the information below, you can estimate how these expenses affect your investment and compare them with the expenses of other funds.You also may pay one-time transaction expenses, including sales charges (loads) and redemption fees, which are not shown in this section and would have resulted in higher total expenses. For more information, see your fund’s prospectus or talk to your financial adviser.
Review your fund’s expenses
The table below shows the expenses you would have paid on a $1,000 investment in Dreyfus BASIC New York Municipal Money Market Fund from January 1, 2009 to June 30, 2009. It also shows how much a $1,000 investment would be worth at the close of the period, assuming actual returns and expenses.
| | Expenses and Value of a $1,000 Investment
assuming actual returns for the six months ended June 30, 2009 |
| Expenses paid per $1,000† | | $2.43 |
| Ending value (after expenses) | | $1,003.40 |
COMPARING YOUR FUND’S EXPENSES
WITH THOSE OF OTHER FUNDS (Unaudited) |
Using the SEC’s method to compare expenses
The Securities and Exchange Commission (SEC) has established guidelines to help investors assess fund expenses. Per these guidelines, the table below shows your fund’s expenses based on a $1,000 investment, assuming a hypothetical 5% annualized return. You can use this information to compare the ongoing expenses (but not transaction expenses or total cost) of investing in the fund with those of other funds.All mutual fund shareholder reports will provide this information to help you make this comparison. Please note that you cannot use this information to estimate your actual ending account balance and expenses paid during the period.
| | Expenses and Value of a $1,000 Investment
assuming a hypothetical 5% annualized return for the six months ended June 30, 2009 |
| Expenses paid per $1,000† | | $2.46 |
| Ending value (after expenses) | | $1,022.36 |
| † Expenses are equal to the fund’s annualized expense ratio of .49%, multiplied by the average account value over the |
| period, multiplied by 181/365 (to reflect the one-half year period). |
6
| STATEMENT OF INVESTMENTS |
| June 30, 2009 |
| Short-Term | | Coupon | | Maturity | | Principal | | | |
| Investments—99.8% | | Rate (%) | | Date | | Amount ($) | | | Value ($) |
| |
| |
| |
|
| |
|
| New York—98.3% | | | | | | | | | |
| Albany County Airport Authority, | | | | | | | | | |
| Airport Revenue, Refunding | | | | | | | | | |
| (LOC; Bank of America) | | 0.49 | | 7/7/09 | | 4,300,000 | a | | 4,300,000 |
| Albany Housing Authority, | | | | | | | | | |
| Revenue (Nutgrove Garden | | | | | | | | | |
| Apartments Project) (LOC; | | | | | | | | | |
| Citizens Bank of Massachusetts) | | 3.50 | | 7/7/09 | | 1,445,000 | a | | 1,445,000 |
| Albany Industrial Development | | | | | | | | | |
| Agency, Civic Facility Revenue | | | | | | | | | |
| (Albany College of Pharmacy | | | | | | | | | |
| Project) (LOC; TD Bank) | | 0.23 | | 7/7/09 | | 2,300,000 | a | | 2,300,000 |
| Albany Industrial Development | | | | | | | | | |
| Agency, Civic Facility Revenue | | | | | | | | | |
| (CHF Holland Suites, L.L.C. | | | | | | | | | |
| Project) (LOC; TD Bank) | | 0.23 | | 7/7/09 | | 2,690,000 | a | | 2,690,000 |
| Albany Industrial Development | | | | | | | | | |
| Agency, Civic Facility Revenue | | | | | | | | | |
| (Corning Preserve/Hudson | | | | | | | | | |
| Riverfront Development | | | | | | | | | |
| Project) (LOC; Key Bank) | | 3.50 | | 7/7/09 | | 1,245,000 | a | | 1,245,000 |
| Amherst Industrial Development | | | | | | | | | |
| Agency, Multi-Mode Civic | | | | | | | | | |
| Facility Revenue (Daemen | | | | | | | | | |
| College Project) (LOC; | | | | | | | | | |
| Wachovia Bank) | | 0.30 | | 7/7/09 | | 4,400,000 | a | | 4,400,000 |
| Briarcliff Manor, | | | | | | | | | |
| GO Notes, BAN | | 2.75 | | 9/11/09 | | 1,468,800 | | | 1,470,785 |
| Dutchess County Industrial | | | | | | | | | |
| Development Agency, Civic | | | | | | | | | |
| Facility Revenue, Refunding | | | | | | | | | |
| (Lutheran Center at | | | | | | | | | |
| Poughkeepsie, Inc. Project) | | | | | | | | | |
| (LOC; Key Bank) | | 3.50 | | 7/7/09 | | 1,800,000 | a | | 1,800,000 |
| East Rochester Housing Authority, | | | | | | | | | |
| Housing Revenue (Park Ridge | | | | | | | | | |
| Nursing Home, Inc. Project) | | | | | | | | | |
| (LOC; JPMorgan Chase Bank) | | 0.33 | | 7/7/09 | | 4,375,000 | a | | 4,375,000 |
| Eastchester Union Free School | | | | | | | | | |
| District, GO Notes, TAN | | 1.00 | | 12/23/09 | | 1,400,000 | | | 1,403,331 |
The Fund 7
| STATEMENT OF INVESTMENTS (continued) |
| Short-Term | | Coupon | | Maturity | | Principal | | | |
| Investments (continued) | | Rate (%) | | Date | | Amount ($) | | | Value ($) |
| |
| |
| |
|
| |
|
| New York (continued) | | | | | | | | | |
| Erie County Industrial Development | | | | | | | | | |
| Agency, IDR (Luminescent | | | | | | | | | |
| System, Inc. Project) (LOC; | | | | | | | | | |
| HSBC Bank USA) | | 0.50 | | 7/7/09 | | 3,295,000 | a | | 3,295,000 |
| Erwin, | | | | | | | | | |
| GO Notes, BAN | | 2.75 | | 9/17/09 | | 2,955,000 | | | 2,958,704 |
| Hamburg Central School District, | | | | | | | | | |
| GO Notes, BAN | | 3.35 | | 7/2/09 | | 4,400,000 | | | 4,400,132 |
| Hamburg Central School District, | | | | | | | | | |
| GO Notes, RAN | | 1.50 | | 11/18/09 | | 1,200,000 | | | 1,202,272 |
| Hudson Yards Infrastructure | | | | | | | | | |
| Corporation, Hudson Yards | | | | | | | | | |
| Senior Revenue (LOC; Citibank | | | | | | | | | |
| NA and Liquidity Facility; | | | | | | | | | |
| Citibank NA) | | 0.59 | | 7/7/09 | | 5,000,000 | a,b | | 5,000,000 |
| Lancaster Industrial Development | | | | | | | | | |
| Agency, IDR (Jiffy-Tite | | | | | | | | | |
| Company, Inc. Project) | | | | | | | | | |
| (LOC; Key Bank) | | 3.65 | | 7/7/09 | | 1,035,000 | a | | 1,035,000 |
| Long Island Power Authority, | | | | | | | | | |
| Electric System General Revenue | | | | | | | | | |
| (Insured; FSA and Liquidity | | | | | | | | | |
| Facility; Dexia Credit Locale) | | 1.00 | | 7/7/09 | | 10,225,000 | a | | 10,225,000 |
| Long Island Power Authority, | | | | | | | | | |
| Electric System General | | | | | | | | | |
| Revenue (Insured; FSA and | | | | | | | | | |
| Liquidity Facility; Dexia | | | | | | | | | |
| Credit Locale) | | 1.00 | | 7/7/09 | | 2,000,000 | a | | 2,000,000 |
| Metropolitan Transportation | | | | | | | | | |
| Authority, Dedicated Tax Fund | | | | | | | | | |
| Revenue (Insured; FSA and | | | | | | | | | |
| Liquidity Facility; Dexia | | | | | | | | | |
| Credit Locale) | | 0.75 | | 7/7/09 | | 17,600,000 | a | | 17,600,000 |
| Metropolitan Transportation | | | | | | | | | |
| Authority, Transportation | | | | | | | | | |
| Revenue (LOC; Fortis Bank) | | 0.40 | | 7/7/09 | | 13,400,000 | a | | 13,400,000 |
| Metropolitan Transportation | | | | | | | | | |
| Authority, Transportation | | | | | | | | | |
| Revenue, Refunding (Insured; | | | | | | | | | |
| FSA and Liquidity Facility; | | | | | | | | | |
| Dexia Credit Locale) | | 0.90 | | 7/7/09 | | 1,000,000 | a | | 1,000,000 |
8
| Short-Term | | Coupon | | Maturity | | Principal | | | |
| Investments (continued) | | Rate (%) | | Date | | Amount ($) | | | Value ($) |
| |
| |
| |
|
| |
|
| New York (continued) | | | | | | | | | |
| Monroe County Industrial | | | | | | | | | |
| Development Agency, Civic | | | | | | | | | |
| Facility Revenue (YMCA of | | | | | | | | | |
| Greater Rochester Project) | | | | | | | | | |
| (LOC; M&T Bank) | | 0.70 | | 7/7/09 | | 2,400,000 | a | | 2,400,000 |
| Monroe County Industrial | | | | | | | | | |
| Development Agency, Civic | | | | | | | | | |
| Facility Revenue (YMCA of | | | | | | | | | |
| Greater Rochester Project) | | | | | | | | | |
| (LOC; M&T Bank) | | 0.70 | | 7/7/09 | | 5,150,000 | a | | 5,150,000 |
| Monroe County Industrial | | | | | | | | | |
| Development Agency, IDR | | | | | | | | | |
| (Mercury Print Productions, | | | | | | | | | |
| Inc. Facility) (LOC; M&T Bank) | | 2.40 | | 7/7/09 | | 165,000 | a | | 165,000 |
| Nassau County Industrial | | | | | | | | | |
| Development Agency, Civic | | | | | | | | | |
| Facility Revenue (North Shore | | | | | | | | | |
| Hebrew Academy High School | | | | | | | | | |
| Project) (LOC; Comerica Bank) | | 1.25 | | 7/7/09 | | 4,580,000 | a | | 4,580,000 |
| Nassau County Industrial | | | | | | | | | |
| Development Agency, Revenue | | | | | | | | | |
| (Rockville Centre Housing | | | | | | | | | |
| Project) (LOC; M&T Bank) | | 0.45 | | 7/7/09 | | 8,000,000 | a | | 8,000,000 |
| New York City, | | | | | | | | | |
| GO Notes (Liquidity Facility; | | | | | | | | | |
| Landesbank Hessen-Thuringen | | | | | | | | | |
| Girozentrale) | | 0.35 | | 7/1/09 | | 3,000,000 | a | | 3,000,000 |
| New York City, | | | | | | | | | |
| GO Notes (LOC; | | | | | | | | | |
| Bank of America) | | 0.28 | | 7/1/09 | | 10,000,000 | a | | 10,000,000 |
| New York City, | | | | | | | | | |
| GO Notes (LOC; | | | | | | | | | |
| Bank of America) | | 0.26 | | 7/7/09 | | 7,950,000 | a | | 7,950,000 |
| New York City, | | | | | | | | | |
| GO Notes (LOC; Fortis Bank) | | 0.25 | | 7/1/09 | | 1,900,000 | a | | 1,900,000 |
| New York City Industrial | | | | | | | | | |
| Development Agency, Civic | | | | | | | | | |
| Facility Revenue (Abraham | | | | | | | | | |
| Joshua Heschel High | | | | | | | | | |
| School Project) (LOC; | | | | | | | | | |
| Allied Irish Banks) | | 0.59 | | 7/7/09 | | 5,055,000 | a | | 5,055,000 |
The Fund 9
| | STATEMENT OF INVESTMENTS (continued) |
| Short-Term | | Coupon | | Maturity | | Principal | | | |
| Investments (continued) | | Rate (%) | | Date | | Amount ($) | | | Value ($) |
| |
| |
| |
|
| |
|
| New York (continued) | | | | | | | | | |
| New York City Industrial | | | | | | | | | |
| Development Agency, Civic | | | | | | | | | |
| Facility Revenue (Columbia | | | | | | | | | |
| Grammar and Preparatory School | | | | | | | | | |
| Project) (LOC; Allied Irish Banks) | | 1.10 | | 7/7/09 | | 4,500,000 | a | | 4,500,000 |
| New York City Industrial | | | | | | | | | |
| Development Agency, Civic | | | | | | | | | |
| Facility Revenue (Hewitt | | | | | | | | | |
| School Project) (LOC; | | | | | | | | | |
| Allied Irish Banks) | | 1.10 | | 7/7/09 | | 11,930,000 | a | | 11,930,000 |
| New York City Industrial | | | | | | | | | |
| Development Agency, | | | | | | | | | |
| Civic Facility Revenue | | | | | | | | | |
| (Spence-Chapin, Services to | | | | | | | | | |
| Families and Children Project) | | | | | | | | | |
| (LOC; Allied Irish Banks) | | 1.10 | | 7/7/09 | | 3,850,000 | a | | 3,850,000 |
| New York City Industrial | | | | | | | | | |
| Development Agency, | | | | | | | | | |
| Civic Facility Revenue (The | | | | | | | | | |
| Allen-Stevenson School Project) | | | | | | | | | |
| (LOC; Allied Irish Banks) | | 1.10 | | 7/7/09 | | 2,905,000 | a | | 2,905,000 |
| New York City Industrial | | | | | | | | | |
| Development Agency, Civic | | | | | | | | | |
| Facility Revenue, Refunding | | | | | | | | | |
| (Federation of Protestant | | | | | | | | | |
| Welfare Agencies, Inc. Project) | | | | | | | | | |
| (LOC; Allied Irish Banks) | | 1.10 | | 7/7/09 | | 2,755,000 | a | | 2,755,000 |
| New York City Industrial | | | | | | | | | |
| Development Agency, IDR (Novelty | | | | | | | | | |
| Crystal Corporation Project) | | | | | | | | | |
| (LOC; Commerce Bank NA) | | 0.55 | | 7/7/09 | | 3,475,000 | a | | 3,475,000 |
| New York City Industrial | | | | | | | | | |
| Development Agency, IDR | | | | | | | | | |
| (Super-Tek Products, Inc. | | | | | | | | | |
| Project) (LOC; Citibank NA) | | 0.60 | | 7/7/09 | | 4,890,000 | a | | 4,890,000 |
| New York City Industrial | | | | | | | | | |
| Development Agency, Special | | | | | | | | | |
| Facility Revenue (Air Express | | | | | | | | | |
| International Corporation | | | | | | | | | |
| Project) (LOC; Citibank NA) | | 0.32 | | 7/7/09 | | 5,000,000 | a | | 5,000,000 |
10
| Short-Term | | Coupon | | Maturity | | Principal | | | |
| Investments (continued) | | Rate (%) | | Date | | Amount ($) | | | Value ($) |
| |
| |
| |
|
| |
|
| New York (continued) | | | | | | | | | |
| New York City Municipal Water | | | | | | | | | |
| Finance Authority, CP | | | | | | | | | |
| (Liquidity Facility: | | | | | | | | | |
| Bayerische Landesbank and | | | | | | | | | |
| Westdeutsche Landesbank) | | 0.55 | | 7/6/09 | | 4,000,000 | | | 4,000,000 |
| New York City Municipal Water | | | | | | | | | |
| Finance Authority, Water and | | | | | | | | | |
| Sewer System Revenue (Liquidity | | | | | | | | | |
| Facility; Bank of America) | | 0.28 | | 7/1/09 | | 8,000,000 | a | | 8,000,000 |
| New York City Municipal Water | | | | | | | | | |
| Finance Authority, Water and | | | | | | | | | |
| Sewer System Second General | | | | | | | | | |
| Resolution Revenue (Liquidity | | | | | | | | | |
| Facility; Fortis Bank) | | 0.85 | | 7/7/09 | | 1,900,000 | a | | 1,900,000 |
| New York City Transitional Finance | | | | | | | | | |
| Authority, Future Tax Secured | | | | | | | | | |
| Revenue (Prerefunded) | | 6.00 | | 8/15/09 | | 1,400,000 | c | | 1,423,628 |
| New York State Dormitory | | | | | | | | | |
| Authority, Revenue (Ithaca | | | | | | | | | |
| College) (LOC; RBS Citizens NA) | | 2.40 | | 7/7/09 | | 2,500,000 | a | | 2,500,000 |
| New York State Dormitory | | | | | | | | | |
| Authority, Revenue (Mount | | | | | | | | | |
| Saint Mary College) (LOC; | | | | | | | | | |
| JPMorgan Chase Bank) | | 0.30 | | 7/7/09 | | 8,900,000 | a | | 8,900,000 |
| New York State Dormitory | | | | | | | | | |
| Authority, Revenue (Park Ridge | | | | | | | | | |
| Hospital, Inc.) (LOC; JPMorgan | | | | | | | | | |
| Chase Bank) | | 0.33 | | 7/7/09 | | 5,925,000 | a | | 5,925,000 |
| New York State Dormitory | | | | | | | | | |
| Authority, Revenue | | | | | | | | | |
| (Saint Lawrence University) | | | | | | | | | |
| (LOC; RBS Citizens NA) | | 2.40 | | 7/7/09 | | 10,000,000 | a | | 10,000,000 |
| New York State Housing Finance | | | | | | | | | |
| Agency, Housing Revenue (Baisley | | | | | | | | | |
| Park Gardens) (LOC; Citibank NA) | | 0.30 | | 7/7/09 | | 4,700,000 | a | | 4,700,000 |
| New York State Housing Finance | | | | | | | | | |
| Agency, Housing Revenue | | | | | | | | | |
| (Gateway to New Cassel) (LOC; | | | | | | | | | |
| JPMorgan Chase Bank) | | 0.38 | | 7/7/09 | | 7,500,000 | a | | 7,500,000 |
The Fund 11
| STATEMENT OF INVESTMENTS (continued) |
| Short-Term | | Coupon | | Maturity | | Principal | | | |
| Investments (continued) | | Rate (%) | | Date | | Amount ($) | | | Value ($) |
| |
| |
| |
|
| |
|
| New York (continued) | | | | | | | | | |
| New York State Thruway Authority, | | | | | | | | | |
| General Revenue (Liquidity | | | | | | | | | |
| Facility: Citibank NA and LOC; | | | | | | | | | |
| Citibank NA) | | 0.54 | | 7/7/09 | | 3,200,000 | a,b | | 3,200,000 |
| New York State Urban Development | | | | | | | | | |
| Corporation, COP (James A. | | | | | | | | | |
| Farley Post Office Project) | | | | | | | | | |
| (Liquidity Facility; Citigroup | | | | | | | | | |
| Financial Products, Inc. and | | | | | | | | | |
| LOC; Citigroup Financial | | | | | | | | | |
| Products, Inc.) | | 0.85 | | 7/7/09 | | 7,000,000 | a,b | | 7,000,000 |
| Newburgh Industrial Development | | | | | | | | | |
| Agency, Civic Facility | | | | | | | | | |
| Revenue (Community | | | | | | | | | |
| Development Properties | | | | | | | | | |
| Dubois Street II, Inc. | | | | | | | | | |
| Project) (LOC; Key Bank) | | 3.50 | | 7/7/09 | | 10,310,000 | a | | 10,310,000 |
| Newfane Central School District, | | | | | | | | | |
| GO Notes, BAN | | 2.75 | | 7/10/09 | | 2,500,000 | | | 2,500,331 |
| Ontario County Industrial | | | | | | | | | |
| Development Agency, Civic | | | | | | | | | |
| Facility Revenue (CHF-Finger | | | | | | | | | |
| Lakes, L.L.C. Civic Facility) | | | | | | | | | |
| (LOC; RBS Citizens NA) | | 2.50 | | 7/7/09 | | 1,025,000 | a | | 1,025,000 |
| Otsego County Industrial | | | | | | | | | |
| Development Agency, Civic | | | | | | | | | |
| Facility Revenue (Noonan | | | | | | | | | |
| Community Service Corporation | | | | | | | | | |
| Project) (LOC; FHLB) | | 0.59 | | 7/7/09 | | 1,100,000 | a | | 1,100,000 |
| Port Authority of New York and | | | | | | | | | |
| New Jersey, Equipment Notes | | 0.41 | | 7/7/09 | | 4,000,000 | a | | 4,000,000 |
| Port Authority of New York and | | | | | | | | | |
| New Jersey, Special Obligation | | | | | | | | | |
| Revenue (Versatile Structure | | | | | | | | | |
| Obligations) (Liquidity | | | | | | | | | |
| Facility; Bank of Nova Scotia) | | 0.36 | | 7/1/09 | | 1,500,000 | a | | 1,500,000 |
12
| Short-Term | | Coupon | | Maturity | | Principal | | | |
| Investments (continued) | | Rate (%) | | Date | | Amount ($) | | | Value ($) |
| |
| |
| |
|
| |
|
| New York (continued) | | | | | | | | | |
| Putnam County Industrial | | | | | | | | | |
| Development Agency, Civic Facility | | | | | | | | | |
| Revenue (United Cerebral Palsy of | | | | | | | | | |
| Putnam and Southern Dutchess | | | | | | | | | |
| Project) (LOC; Commerce Bank NA) | | 0.23 | | 7/7/09 | | 4,265,000 | a | | 4,265,000 |
| Rockland County Industrial | | | | | | | | | |
| Development Agency, Civic | | | | | | | | | |
| Facility Revenue (Dominican | | | | | | | | | |
| College of Blauvelt Project) | | | | | | | | | |
| (LOC; Commerce Bank NA) | | 0.26 | | 7/7/09 | | 1,215,000 | a | | 1,215,000 |
| Rockland County Industrial | | | | | | | | | |
| Development Agency, IDR | | | | | | | | | |
| (Intercos America, Inc. | | | | | | | | | |
| Project) (LOC; HSBC Bank USA) | | 0.45 | | 7/7/09 | | 3,400,000 | a | | 3,400,000 |
| Rockland County Industrial | | | | | | | | | |
| Development Authority, Revenue | | | | | | | | | |
| (Northern Manor Multicare | | | | | | | | | |
| Center, Inc. Project) (LOC; | | | | | | | | | |
| M&T Bank) | | 0.45 | | 7/7/09 | | 3,040,000 | a | | 3,040,000 |
| Sackets Harbor Central School | | | | | | | | | |
| District, GO Notes, BAN | | 3.00 | | 7/2/09 | | 2,594,437 | | | 2,594,486 |
| Saint Lawrence County Industrial | | | | | | | | | |
| Development Agency, Civic | | | | | | | | | |
| Facility Revenue (Canton-Potsdam | | | | | | | | | |
| Hospital Project) (LOC; Key Bank) | | 3.50 | | 7/7/09 | | 10,285,000 | a | | 10,285,000 |
| Seaford Union Free School | | | | | | | | | |
| District, GO Notes, BAN | | 2.75 | | 7/17/09 | | 1,000,000 | | | 1,000,322 |
| Syracuse Industrial Development | | | | | | | | | |
| Agency, Civic Facility Revenue | | | | | | | | | |
| (Crouse Health Hospital, Inc. | | | | | | | | | |
| Project) (LOC; Key Bank) | | 3.50 | | 7/7/09 | | 3,410,000 | a | | 3,410,000 |
| Tompkins County Industrial | | | | | | | | | |
| Development Agency, Civic | | | | | | | | | |
| Facility Revenue (Cortland | | | | | | | | | |
| College) (LOC; HSBC Bank USA) | | 3.00 | | 7/7/09 | | 3,735,000 | a | | 3,735,000 |
The Fund 13
| STATEMENT OF INVESTMENTS (continued) |
| Short-Term | | Coupon | | Maturity | | Principal | | |
| Investments (continued) | | Rate (%) | | Date | | Amount ($) | | Value ($) |
| |
| |
| |
| |
|
| New York (continued) | | | | | | | | |
| Westchester County Health Care | | | | | | | | |
| Corporation, CP (Liquidity | | | | | | | | |
| Facility; Landesbank | | | | | | | | |
| Hessen-Thuringen Girozentrale | | | | | | | | |
| and LOC; Westchester County) | | 1.70 | | 7/6/09 | | 5,000,000 | | 5,000,000 |
| U.S. Related—1.5% | | | | | | | | |
| Puerto Rico Industrial, Tourist, | | | | | | | | |
| Educational, Medical and | | | | | | | | |
| Environmental Control Facilities | | | | | | | | |
| Financing Authority, Environmental | | | | | | | | |
| Control Facilities Revenue | | | | | | | | |
| (Bristol-Myers Squibb | | | | | | | | |
| Company Project) | | 0.41 | | 7/7/09 | | 4,400,000 a | | 4,400,000 |
| |
| Total Investments (cost $302,878,991) | | | | | | 99.8% | | 302,878,991 |
| |
| Cash and Receivables (Net) | | | | | | .2% | | 559,582 |
| |
| Net Assets | | | | | | 100.0% | | 303,438,573 |
| a Variable rate demand note—rate shown is the interest rate in effect at June 30, 2009. Maturity date represents the |
| next demand date, or the ultimate maturity date if earlier. |
| b Securities exempt from registration under Rule 144A of the Securities Act of 1933.These securities may be resold in |
| transactions exempt from registration, normally to qualified institutional buyers. At June 30, 2009, these securities |
| amounted to $15,200,000 or 5.0% of net assets. |
| c This security is prerefunded; the date shown represents the prerefunded date. Bonds which are prerefunded are |
| collateralized by U.S. Government securities which are held in escrow and are used to pay principal and interest on |
| the municipal issue and to retire the bonds in full at the earliest refunding date. |
14
| Summary of Abbreviations | | | | |
| |
| ABAG | | Association of Bay Area Governments | | ACA | | American Capital Access |
| AGC | | ACE Guaranty Corporation | | AGIC | | Asset Guaranty Insurance Company |
| AMBAC | | American Municipal Bond | | | | |
| | | Assurance Corporation | | ARRN | | Adjustable Rate Receipt Notes |
| BAN | | Bond Anticipation Notes | | BIGI | | Bond Investors Guaranty Insurance |
| BPA | | Bond Purchase Agreement | | CGIC | | Capital Guaranty Insurance Company |
| CIC | | Continental Insurance Company | | CIFG | | CDC Ixis Financial Guaranty |
| CMAC | | Capital Markets Assurance Corporation | | COP | | Certificate of Participation |
| CP | | Commercial Paper | | EDR | | Economic Development Revenue |
| EIR | | Environmental Improvement Revenue | | FGIC | | Financial Guaranty Insurance |
| | | | | | | Company |
| FHA | | Federal Housing Administration | | FHLB | | Federal Home Loan Bank |
| FHLMC | | Federal Home Loan Mortgage | | FNMA | | Federal National |
| | | Corporation | | | | Mortgage Association |
| FSA | | Financial Security Assurance | | GAN | | Grant Anticipation Notes |
| GIC | | Guaranteed Investment Contract | | GNMA | | Government National |
| | | | | | | Mortgage Association |
| GO | | General Obligation | | HR | | Hospital Revenue |
| IDB | | Industrial Development Board | | IDC | | Industrial Development Corporation |
| IDR | | Industrial Development Revenue | | LOC | | Letter of Credit |
| LOR | | Limited Obligation Revenue | | LR | | Lease Revenue |
| MFHR | | Multi-Family Housing Revenue | | MFMR | | Multi-Family Mortgage Revenue |
| PCR | | Pollution Control Revenue | | PILOT | | Payment in Lieu of Taxes |
| RAC | | Revenue Anticipation Certificates | | RAN | | Revenue Anticipation Notes |
| RAW | | Revenue Anticipation Warrants | | RRR | | Resources Recovery Revenue |
| SAAN | | State Aid Anticipation Notes | | SBPA | | Standby Bond Purchase Agreement |
| SFHR | | Single Family Housing Revenue | | SFMR | | Single Family Mortgage Revenue |
| SONYMA | | State of New York Mortgage Agency | | SWDR | | Solid Waste Disposal Revenue |
| TAN | | Tax Anticipation Notes | | TAW | | Tax Anticipation Warrants |
| TRAN | | Tax and Revenue Anticipation Notes | | XLCA | | XL Capital Assurance |
The Fund 15
| STATEMENT OF INVESTMENTS (continued) |
| Summary of Combined Ratings (Unaudited) | | |
| |
| Fitch | | or | | Moody’s | | or | | Standard & Poor’s | | Value (%)† |
| |
| |
| |
| |
| |
|
| F1+,F1 | | | | VMIG1,MIG1,P1 | | | | SP1+,SP1,A1+,A1 | | 91.7 |
| AAA,AA,Ad | | | | Aaa,Aa,Ad | | | | AAA,AA,Ad | | 1.9 |
| Not Ratede | | | | Not Ratede | | | | Not Ratede | | 6.4 |
| | | | | | | | | | | 100.0 |
| † Based on total investments. |
| d Notes which are not F, MIG and SP rated are represented by bond ratings of the issuers. |
| e Securities which, while not rated by Fitch, Moody’s and Standard & Poor’s, have been determined by the Manager to |
| be of comparable quality to those rated securities in which the fund may invest. |
| See notes to financial statements. |
16
| STATEMENT OF ASSETS AND LIABILITIES |
| June 30, 2009 |
| | | Cost | | Value |
| |
| |
|
| Assets ($): | | | | |
| Investments in securities—See Statement of Investments | | 302,878,991 | | 302,878,991 |
| Cash | | | | 403,338 |
| Interest receivable | | | | 680,439 |
| Prepaid expenses | | | | 29,437 |
| | | | | 303,992,205 |
| Liabilities ($): | | | | |
| Due to The Dreyfus Corporation and affiliates—Note 2 | | | | 116,947 |
| Dividend payable | | | | 135,891 |
| Payable for shares of Beneficial Interest redeemed | | | | 300,794 |
| | | | | 553,632 |
| Net Assets ($) | | | | 303,438,573 |
| Composition of Net Assets ($): | | | | |
| Paid-in capital | | | | 303,438,573 |
| Net Assets ($) | | | | 303,438,573 |
| Shares Outstanding | | | | |
| (unlimited number of shares of Beneficial Interest authorized) | | | | 303,438,583 |
| Net Asset Value, offering and redemption price per share ($) | | | | 1.00 |
| |
| See notes to financial statements. | | | | |
The Fund 17
| STATEMENT OF OPERATIONS |
| Year Ended June 30, 2009 |
| Investment Income ($): | | |
| Interest Income | | 5,985,887 |
| Expenses: | | |
| Management fee—Note 2 | | 1,454,688 |
| Treasury insurance expense—Note 1(f) | | 108,887 |
| Trustees’ fees—Note 2 | | 23,895 |
| Total Expenses | | 1,587,470 |
| Less—Trustees’ fees reimbursed by the Manager—Note 2 | | (23,895) |
| Net Expenses | | 1,563,575 |
| Investment Income—Net, representing net increase | | |
| in net assets resulting from operations | | 4,422,312 |
| |
| See notes to financial statements. | | |
18
STATEMENT OF CHANGES IN NET ASSETS
| | | | | Year Ended June 30, |
| | |
| |
|
| | | 2009 | | 2008 |
| |
| |
|
| Operations ($): | | | | |
| Investment income—net | | 4,422,312 | | 9,088,802 |
| Net realized gain (loss) on investments | | — | | 24,489 |
| Net Increase (Decrease) in Net Assets | | | | |
| Resulting from Operations | | 4,422,312 | | 9,113,291 |
| Dividends to Shareholders from ($): | | | | |
| Investment income—net | | (4,446,801) | | (9,093,303) |
| Beneficial Interest Transactions ($1.00 per share): | | | | |
| Net proceeds from shares sold | | 300,382,134 | | 382,586,890 |
| Dividends reinvested | | 3,316,910 | | 7,621,024 |
| Cost of shares redeemed | | (364,356,807) | | (348,000,006) |
| Increase (Decrease) in Net Assets from | | | | |
| Beneficial Interest Transactions | | (60,657,763) | | 42,207,908 |
| Total Increase (Decrease) in Net Assets | | (60,682,252) | | 42,227,896 |
| Net Assets ($): | | | | |
| Beginning of Period | | 364,120,825 | | 321,892,929 |
| End of Period | | 303,438,573 | | 364,120,825 |
| |
| See notes to financial statements. | | | | |
The Fund 19
FINANCIAL HIGHLIGHTS
The following table describes the performance for the fiscal periods indicated. Total return shows how much your investment in the fund would have increased (or decreased) during each period, assuming you had reinvested all dividends and distributions.These figures have been derived from the fund’s financial statements.
| | | | | Year Ended June 30, | | |
| | |
| |
| |
|
| | | 2009 | | 2008 | | 2007 | | 2006 | | 2005 |
| |
| |
| |
| |
| |
|
| Per Share Data ($): | | | | | | | | | | |
| Net asset value, beginning of period | | 1.00 | | 1.00 | | 1.00 | | 1.00 | | 1.00 |
| Investment Operations: | | | | | | | | | | |
| Investment income—net | | .013 | | .026 | | .032 | | .025 | | .013 |
| Distributions: | | | | | | | | | | |
| Dividends from investment income—net | | (.013) | | (.026) | | (.032) | | (.025) | | (.013) |
| Net asset value, end of period | | 1.00 | | 1.00 | | 1.00 | | 1.00 | | 1.00 |
| Total Return (%) | | 1.35 | | 2.67 | | 3.25 | | 2.52 | | 1.34 |
| Ratios/Supplemental Data (%): | | | | | | | | | | |
| Ratio of total expenses | | | | | | | | | | |
| to average net assets | | .49 | | .46 | | .45 | | .45 | | .45 |
| Ratio of net expenses | | | | | | | | | | |
| to average net assets | | .48 | | .45 | | .45 | | .45 | | .45 |
| Ratio of net investment income | | | | | | | | | | |
| to average net assets | | 1.37 | | 2.61 | | 3.21 | | 2.49 | | 1.33 |
| Net Assets, end of period ($ x 1,000) | | 303,439 | | 364,121 | | 321,893 | | 286,993 | | 308,322 |
| |
| See notes to financial statements. | | | | | | | | | | |
20
NOTES TO FINANCIAL STATEMENTS
NOTE 1—Significant Accounting Policies:
Dreyfus BASIC New York Municipal Money Market Fund (the “fund”) is a separate non-diversified series of The Dreyfus/Laurel Tax-Free Municipal Funds (the “Trust”) which is registered under the Investment Company Act of 1940, as amended (the “Act”), as an open-end management investment company and operates as a series company, currently offering three series including the fund.The fund’s investment objective is to provide a high level of current income exempt from federal, NewYork state and NewYork city income taxes to the extent consistent with the preservation of capital and the maintenance of liquidity. The Dreyfus Corporation (the “Manager” or “Dreyfus”), a wholly-owned subsidiary of The Bank of New York Mellon Corporation (“BNY Mellon”), serves as the fund’s investment adviser. MBSC Securities Corporation (the “Distributor”), a wholly-owned subsidiary of the Manager, is the distributor of the fund’s shares, which are sold without a sales charge.
Effective July 1, 2008, BNY Mellon reorganized and consolidated a number of its banking and trust company subsidiaries.As a result of the reorganization, any services previously provided to the fund by Mellon Bank, N.A. or Mellon Trust of New England, N.A. are now provided by The Bank of NewYork Mellon (formerly,The Bank of NewYork).
It is the fund’s policy to maintain a continuous net asset value per share of $1.00 for the fund; the fund has adopted certain investment, portfolio valuation and dividend and distribution policies to enable it to do so. There is no assurance, however, that the fund will be able to maintain a stable net asset value per share of $1.00.
The fund’s financial statements are prepared in accordance with U.S. generally accepted accounting principles, which may require the use of management estimates and assumptions. Actual results could differ from those estimates.
The Fund 21
| NOTES TO FINANCIAL STATEMENTS (continued) |
(a) Portfolio valuation: Investments in securities are valued at amortized cost in accordance with Rule 2a-7 of the Act, which has been determined by the Board of Trustees to represent the fair value of the fund’s investments.
The fund adopted Statement of Financial Accounting Standards No. 157 “FairValue Measurements” (“FAS 157”). FAS 157 establishes an authoritative definition of fair value, sets out a framework for measuring fair value, and requires additional disclosures about fair value measurements.
Various inputs are used in determining the value of the fund’s investments relating to FAS 157.These inputs are summarized in the three broad levels listed below.
| | Level 1—quoted prices in active markets for identical investments.
Level 2—other significant observable inputs (including quoted
prices for similar securities, interest rates, prepayment speeds,
credit risk, etc.).
Level 3—significant unobservable inputs (including the fund’s own
assumptions in determining the fair value of investments). |
The inputs or methodology used for valuing securities are not necessarily an indication of the risk associated with investing in those securities. For example, money market securities are valued using amortized cost, in accordance with rules under the Act. Generally, amortized cost approximates the current fair value of a security, but since the value is not obtained from a quoted price in an active market, such securities are reflected as Level 2.
The following is a summary of the inputs used as of June 30, 2009 in valuing the fund’s investments:
| | | Investments in |
| Valuation Inputs | | Securities ($) |
| |
|
| Level 1—Quoted Prices | | — |
| Level 2—Other Significant Observable Inputs | | 302,878,991 |
| Level 3—Significant Unobservable Inputs | | — |
| Total | | 302,878,991 |
22
(b) Securities transactions and investment income: Securities transactions are recorded on a trade date basis. Interest income, adjusted for accretion of discount and amortization of premium on investments, is earned from settlement date and recognized on the accrual basis. Realized gains and losses from securities transactions are recorded on the identified cost basis. Cost of investments represents amortized cost.
(c) Concentration of risk: The fund follows an investment policy of investing primarily in municipal obligations of one state. Economic changes affecting the state and certain of its public bodies and municipalities may affect the ability of issuers within the state to pay interest on, or repay principal of, municipal obligations held by the fund.
All cash balances were maintained with the Custodian,The Bank of New York Mellon, a subsidiary of BNY Mellon and an affiliate of Dreyfus.
(d) Dividends to shareholders: It is the policy of the fund to declare dividends daily from investment income-net; such dividends are paid monthly. Dividends from net realized capital gains, if any, are normally declared and paid annually, but the fund may make distributions on a more frequent basis to comply with the distribution requirements of the Internal Revenue Code of 1986, as amended, (the “Code”).To the extent that net realized capital gains can be offset by capital loss carryovers, it is the policy of the fund not to distribute such gains.
(e) Federal income taxes: It is the policy of the fund to continue to qualify as a regulated investment company, which can distribute tax exempt dividends, by complying with the applicable provisions of the Code, and to make distributions of income and net realized capital gain sufficient to relieve it from substantially all federal income and excise taxes.
As of and during the period ended June 30, 2009, the fund did not have any liabilities for any uncertain tax positions.The fund recognizes interest and penalties, if any, related to uncertain tax positions as
The Fund 23
| NOTES TO FINANCIAL STATEMENTS (continued) |
income tax expense in the Statement of Operations. During the period, the fund did not incur any interest or penalties.
Each of the tax years in the four-year period ended June 30, 2009 remains subject to examination by the Internal Revenue Service and state taxing authorities.
At June 30, 2009, the components of accumulated earnings on a tax basis were substantially the same as for financial reporting purposes.
The tax character of distributions paid to shareholders during the fiscal periods ended June 30, 2009 and June 30, 2008, were as follows: tax exempt income $4,422,312 and $9,088,802 and ordinary income $24,489 and $4,501, respectively.
During the period ended June 30, 2009, as a result of permanent book to tax differences, primarily due to dividend reclassification, the fund increased accumulated undistributed investment income-net by $24,489 and decreased accumulated net realized gain (loss) on investments by the same amount. Net assets and net asset value per share were not affected by this reclassification.
At June 30, 2009, the cost of investments for federal income tax purposes was substantially the same as the cost for financial reporting purposes (see the Statement of Investments).
(f) Treasury’s Temporary Guarantee Program: The fund has entered into a Guarantee Agreement with the United States Department of the Treasury (the “Treasury”) to participate in the Treasury’s Temporary Guarantee Program for Money Market Funds (the “Program”).
Under the Program, the Treasury guarantees the share price of shares of the fund held by shareholders as of September 19, 2008 at $1.00 per share if the fund’s net asset value per share falls below $0.995 (a “Guarantee Event”) and the fund liquidates. Recovery under the Program is subject to certain conditions and limitations.
24
Fund shares acquired by investors after September 19, 2008 that increase the number of fund shares the investor held at the close of business on September 19, 2008 are not eligible for protection under the Program. In addition, fund shares acquired by investors who did not hold fund shares at the close of business on September 19, 2008 are not eligible for protection under the Program.
The Program, which was originally set to expire on December 18, 2008, was initially extended by the Treasury until April 30, 2009 and has been further extended by the Treasury until September 18, 2009, after which the Secretary of the Treasury will review the need for, and terms of, the Program. Participation in the initial term and the extended periods of the Program required a payment to the Treasury in the amount of .01%, .015% and .015%, respectively, of the fund’s shares outstanding as of September 19, 2008 (valued at $1.00 per share).This expense is being borne by the fund without regard to any expense limitation currently in effect.
NOTE 2—Investment Management Fee and Other Transactions with Affiliates:
Pursuant to an investment management agreement with the Manager, the Manager provides or arranges for one or more third parties and/or affiliates to provide investment advisory, administrative, custody, fund accounting and transfer agency services to the fund.The Manager also directs the investments of the fund in accordance with its investment objective, policies and limitations. For these services, the fund is contractually obligated to pay the Manager a fee, calculated daily and paid monthly, at the annual rate of .45% of the value of the fund’s average daily net assets. Out of its fee, the Manager pays all of the expenses of the fund except brokerage fees, taxes, interest, fees and expenses of non-interested Trustees (including counsel fees) and extraordinary expenses. In addition, the Manager is required to reduce its fee in an amount equal
The Fund 25
| NOTES TO FINANCIAL STATEMENTS (continued) |
to the fund’s allocable portion of fees and expenses of the non-interested Trustees (including counsel fees).EachTrustee receives $45,000 per year, plus $6,000 for each joint Board meeting of The Dreyfus/Laurel Funds, Inc., the Trust, The Dreyfus/Laurel Funds Trust (collectively, the “Dreyfus/Laurel Funds”) and Dreyfus Investment Funds attended, $2,000 for separate in-person committee meetings attended which are not held in conjunction with a regularly scheduled Board meeting and $1,500 for Board meetings and separate committee meetings attended that are conducted by telephone and is reimbursed for travel and out-of-pocket expenses. With respect to Board meetings, the Chairman of the Board receives an additional 25% of such compensation (with the exception of reimbursable amounts). With respect to compensation committee meetings, the Chair of the compensation committee receives $900 per meeting. In the event that there is an in-person joint committee or a joint telephone meeting of the Dreyfus/Laurel Funds, Dreyfus Investment Funds and Dreyfus High Yield Strategies Fund, the $2,000 or $1,500 fee,as applicable,will be allocated between the Dreyfus/Laurel Funds, Dreyfus Investment Funds and Dreyfus High Yield Strategies Fund.These fees and expenses are charged and allocated to each series based on net assets.Amounts required to be paid by the Trust directly to the non-interested Trustees, that would be applied to offset a portion of the management fee payable to the Manager, are in fact paid directly by the Manager to the non-interested Trustees.
The Manager has undertaken to reimburse expenses in the event that current yields drop below a certain level.This undertaking is voluntary and not contractual and may be terminate at any time. During the period ended June 30, 2009, there was no reduction in expenses pursuant to the undertaking.
The components of “Due to The Dreyfus Corporation and affiliates” in the Statement of Assets and Liabilities consist of: management fees $116,947.
26
NOTE 3—Bank Line of Credit:
The fund participated with other Dreyfus-managed funds in a $300 million unsecured line of credit provided by The Bank of New York Mellon (the “BNYM Facility”), primarily to be utilized for temporary or emergency purposes, including the financing of redemptions. The terms of the BNYM Facility limit the amount of individual fund borrowings. Interest is charged to the fund based on prevailing market rates in effect at the time of borrowing. Effective October 15, 2008, the $300 million unsecured line of credit was terminated. During the period ended June 30, 2009, the fund did not borrow under the line of credit.
NOTE 4—Subsequent Events Evaluation:
Dreyfus has evaluated the need for disclosures and/or adjustments resulting from subsequent events through August 18, 2009, the date the financial statements were available to be issued. This evaluation did not result in any subsequent events that necessitated disclosures and/or adjustments.
The Fund 27
REPORT OF INDEPENDENT REGISTERED
PUBLIC ACCOUNTING FIRM |
The Board of Trustees and Shareholders of
The Dreyfus/Laurel Tax-Free Municipal Funds |
We have audited the accompanying statement of assets and liabilities of Dreyfus BASIC New York Municipal Money Market Fund (the “Fund”), a series of The Dreyfus/Laurel Tax-Free Municipal Funds, including the statement of investments, as of June 30, 2009, and the related statement of operations for the year then ended, the statements of changes in net assets for each of the years in the two-year period then ended, and the financial highlights for each of the years in the five-year period then ended. These financial statements and financial highlights are the responsibility of the Fund’s management. Our responsibility is to express an opinion on these financial statements and financial highlights based on our audits.
We conducted our audits in accordance with the standards of the Public Company Accounting Oversight Board (United States).Those standards require that we plan and perform the audit to obtain reasonable assurance about whether the financial statements and financial highlights are free of material misstatement.An audit also includes examining, on a test basis, evidence supporting the amounts and disclosures in the financial statements. Our procedures included confirmation of securities owned as of June 30, 2009, by correspondence with the custodian and brokers. An audit also includes assessing the accounting principles used and significant estimates made by management, as well as evaluating the overall financial statement presentation.We believe that our audits provide a reasonable basis for our opinion.
In our opinion, the financial statements and financial highlights referred to above present fairly, in all material respects, the financial position of Dreyfus BASIC New York Municipal Money Market Fund of The Dreyfus/Laurel Tax-Free Municipal Funds as of June 30, 2009, and the results of its operations for the year then ended, changes in its net assets for each of the years in the two-year period then ended, and the financial highlights for each of the years in the five-year period then ended, in conformity with accounting principles generally accepted in the United States of America.

| | New York, New York
August 18, 2009 |
28
IMPORTANT TAX INFORMATION (Unaudited)
In accordance with federal tax law, the fund hereby designates all the dividends paid from investment income-net during the fiscal year ended June 30, 2009 as “exempt-interest dividends” (not subject to regular Federal and, for individuals who are NewYork residents, NewYork State and New York City personal income taxes), except $24,489 that is being designated as an ordinary income distribution for reporting purposes.As required by federal tax law rules, shareholders will receive notification of their portion of the fund’s exempt-interest dividends paid for the 2009 calendar year on Form 1099-INT, which will be mailed by early 2010.
The Fund 29
INFORMATION ABOUT THE REVIEW AND APPROVAL OF THE
FUND’S INVESTMENT MANAGEMENT AGREEMENT (Unaudited) |
At a meeting of the fund’s Board of Trustees held on February 9 and 10, 2009, the Board considered the re-approval of the fund’s Investment Management Agreement (“Management Agreement”), pursuant to which the Manager provides the fund with investment advisory and administrative services.The Board members, none of whom are “interested persons” (as defined in the Investment Company Act of 1940, as amended) of the fund, were assisted in their review by independent legal counsel and met with counsel in executive session separate from representatives of the Manager.
Analysis of Nature, Extent and Quality of Services Provided to the Fund.The Board members considered information previously provided to them in a presentation from representatives of the Manager regarding services provided to the fund and other funds in the Dreyfus fund complex, and representatives of the Manager confirmed that there had been no material changes in this information.The Board also discussed the nature, extent and quality of the services provided to the fund pursuant to its Management Agreement. The Manager’s representatives reviewed the fund’s distribution of accounts and the relationships the Manager has with various intermediaries and the different needs of each.The Manager’s representatives noted the distribution channels for the fund as well as the diversity of distribution among the funds in the Dreyfus fund complex, and the Manager’s corresponding need for broad, deep, and diverse resources to be able to provide ongoing shareholder services to each distribution channel, including those of the fund.The Manager provided the number of shareholder accounts in the fund, as well as the fund’s asset size.
The Board members also considered the Manager’s research and portfolio management capabilities and that the Manager also provides oversight of day-to-day fund operations, including fund accounting and adminis-
30
tration and assistance in meeting legal and regulatory requirements.The Board members also considered the Manager’s extensive administrative, accounting and compliance infrastructure.
Comparative Analysis of the Fund’s Performance and Management Fee and Expense Ratio. The Board members reviewed the fund’s performance and comparisons to a group of retail, no-load New York tax-exempt money market funds (the “Performance Group”) and to a larger universe of funds, consisting of all retail and institutional New York tax-exempt money market funds (the “Performance Universe”) selected and provided by Lipper, Inc., an independent provider of investment company data. The Board was provided with a description of the methodology Lipper used to select the Performance Group and Performance Universe, as well as the Expense Group and Expense Universe (discussed below). The Board members discussed the results of the comparisons for various periods ended December 31, 2008, and noted that the fund’s total return performance was above the Performance Group and Performance Universe medians for each of the periods.
The Board members also discussed the fund’s contractual and actual management fee and expense ratio and reviewed the range of management fees and expense ratios of a comparable group of funds (the “Expense Group”) and a broader group of funds (the “Expense Universe”), each selected and provided by Lipper. Noting the fund’s “unitary fee” structure, the Board noted that the fund’s contractual management fee was equal to the Expense Group median, the fund’s actual management fee was above the Expense Group and Expense Universe medians and the fund’s expense ratio was below the Expense Group and Expense Universe medians.
The Fund 31
INFORMATION ABOUT THE REVIEW AND APPROVAL OF THE FUND’S
INVESTMENT MANAGEMENT AGREEMENT (Unaudited) (continued) |
Representatives of the Manager reviewed with the Board members the fees paid to the Manager or its affiliates by mutual funds managed by the Manager or its affiliates with similar investment objectives, policies and strategies, and included in the same Lipper category as the fund (the “Similar Funds”). They also noted that there were no other accounts managed by the Manager or its affiliates with similar investment objectives, policies and strategies as the fund.The Manager’s representatives also reviewed the costs associated with distribution through intermediaries. The Board analyzed differences in fees paid to the Manager and discussed the relationship of the fees paid in light of the services provided, noting the fund’s “unitary fee” structure.The Board members considered the relevance of the fee information provided for the Similar Funds to evaluate the appropriateness and reasonableness of the fund’s management fee.
Analysis of Profitability and Economies of Scale. The Manager’s representatives reviewed the dollar amount of expenses allocated and profit received by the Manager and the method used to determine such expenses and profit. The Board previously had been provided with information prepared by an independent consulting firm regarding the Manager’s approach to allocating costs to, and determining the profitability of, individual funds and the entire Dreyfus mutual fund complex.The Board also was informed that the methodology had also been reviewed by an independent registered public accounting firm which, like the consultant, found the methodology to be reasonable. The consulting firm also analyzed where any economies of scale might emerge in connection with the management of the fund. The Board members evaluated the profitability analysis in light of the relevant circumstances for the fund and the extent to which economies of scale would be realized if the fund grows and whether fee levels reflect these economies of scale for the benefit of fund shareholders. The Board
32
members also considered potential benefits to the Manager from acting as investment adviser and noted there were no soft dollar arrangements with respect to trading the fund’s portfolio.
It was noted that the Board members should consider the Manager’s profitability with respect to the fund as part of their evaluation of whether the fees under the Management Agreement bear a reasonable relationship to the mix of services provided by the Manager, including the nature, extent and quality of such services, and that a discussion of economies of scale is predicated on increasing assets and that, if a fund’s assets had been decreasing, the possibility that the Manager may have realized any economies of scale would be less. It also was noted that the profitability percentage for managing the fund was within the range determined by appropriate court cases to be reasonable given the services rendered and generally superior service levels provided by the Manager.
At the conclusion of these discussions, the Board agreed that it had been furnished with sufficient information to make an informed business decision with respect to continuation of the fund’s Management Agreement. Based on the discussions and considerations as described above, the Board made the following conclusions and determinations.
- The Board concluded that the nature, extent and quality of the ser- vices provided by the Manager are adequate and appropriate.
- The Board was satisfied with the fund’s relative performance.
- The Board concluded that the fee paid by the fund to the Manager was reasonable in light of the services provided, comparative perfor- mance, expense and advisory fee information, costs of the services provided and profits to be realized and benefits derived or to be derived by the Manager from its relationship with the fund.
The Fund 33
INFORMATION ABOUT THE REVIEW AND APPROVAL OF THE FUND’S
INVESTMENT MANAGEMENT AGREEMENT (Unaudited) (continued) |
- The Board determined that the economies of scale which may accrue to the Manager and its affiliates in connection with the management of the fund had been adequately considered by the Manager in con- nection with the management fee rate charged to the fund and that, to the extent in the future it were determined that material economies of scale had not been shared with the fund, the Board would seek to have those economies of scale shared with the fund.
The Board members considered these conclusions and determinations, along with information received on a routine and regular basis throughout the year, and, without any one factor being dispositive, the Board determined that re-approval of the fund’s Management Agreement was in the best interests of the fund and its shareholders and that the Management Agreement would be renewed through April 4, 2010.
34
The Fund 35
36
OFFICERS OF THE FUND (Unaudited)
The Fund 37
OFFICERS OF THE FUND (Unaudited) (continued)
38
NOTES
Item 2. Code of Ethics.
The Registrant has adopted a code of ethics that applies to the Registrant's principal executive officer, principal financial officer, principal accounting officer or controller, or persons performing similar functions. There have been no amendments to, or waivers in connection with, the Code of Ethics during the period covered by this Report.
Item 3. Audit Committee Financial Expert.
The Registrant's Board has determined that Joseph S. DiMartino, a member of the Audit Committee of the Board, is an audit committee financial expert as defined by the Securities and Exchange Commission (the "SEC"). Joseph S. DiMartino is "independent" as defined by the SEC for purposes of audit committee financial expert determinations.
Item 4. Principal Accountant Fees and Services.
(a) Audit Fees. The aggregate fees billed for each of the last two fiscal years (the "Reporting Periods") for professional services rendered by the Registrant's principal accountant (the "Auditor") for the audit of the Registrant's annual financial statements, or services that are normally provided by the Auditor in connection with the statutory and regulatory filings or engagements for the Reporting Periods, were $76,800 in 2008 and $78,330 in 2009.
(b) Audit-Related Fees. The aggregate fees billed in the Reporting Periods for assurance and related services by the Auditor that are reasonably related to the performance of the audit of the Registrant's financial statements and are not reported under paragraph (a) of this Item 4 were $6,450 in 2008 and $6,645 in 2009. These services consisted of security counts required by Rule 17f-2 under the Investment Company Act of 1940, as amended.
The aggregate fees billed in the Reporting Periods for non-audit assurance and related services by the Auditor to the Registrant's investment adviser (not including any sub-investment adviser whose role is primarily portfolio management and is subcontracted with or overseen by another investment adviser), and any entity controlling, controlled by or under common control with the investment adviser that provides ongoing services to the Registrant ("Service Affiliates"), that were reasonably related to the performance of the annual audit of the Service Affiliate, which required pre-approval by the Audit Committee were $0 in 2008 and $0 in 2009.
(c) Tax Fees. The aggregate fees billed in the Reporting Periods for professional services rendered by the Auditor for tax compliance, tax advice and tax planning ("Tax Services") were $6,450 in 2008 and $6,645 in 2009. These services consisted of review or preparation of U.S. federal, state, local and excise tax returns.
The aggregate fees billed in the Reporting Periods for Tax Services by the Auditor to Service Affiliates which required pre-approval by the Audit Committee were $0 in 2008 and $0 in 2009.
(d) All Other Fees. The aggregate fees billed in the Reporting Periods for products and services provided by the Auditor, other than the services reported in paragraphs (a) through (c) of this Item, were $0 in 2008 and $0 in 2009.
The aggregate fees billed in the Reporting Periods for Non-Audit Services by the Auditor to Service Affiliates, other than the services reported in paragraphs (b) through (c) of this Item, which required pre-approval by the Audit Committee were $0 in 2008 and $0 in 2009.
Note: In each of (b) through (d) of this Item 4, 100% of all services provided by the Auditor were pre-approved as required.
Audit Committee Pre-Approval Policies and Procedures. The Registrant's Audit Committee has established policies and procedures (the "Policy") for pre-approval (within specified fee limits) of the Auditor's engagements for non-audit services to the Registrant and Service Affiliates without specific case-by-case consideration. Pre-approval considerations include whether the proposed services are compatible with maintaining the Auditor's independence. Pre-approvals pursuant to the Policy are considered annually.
Non-Audit Fees. The aggregate non-audit fees billed by the Auditor for services rendered to the Registrant, and rendered to Service Affiliates, for the Reporting Periods were $3,951,740 in 2008 and $5,372,392 in 2009.
Auditor Independence. The Registrant's Audit Committee has considered whether the provision of non-audit services that were rendered to Service Affiliates which were not pre-approved (not requiring pre-approval) is compatible with maintaining the Auditor's independence.
| Item 5. | | Audit Committee of Listed Registrants. |
| | | Not applicable. |
| Item 6. | | Investments. |
| (a) | | Not applicable. |
| Item 7. | | Disclosure of Proxy Voting Policies and Procedures for Closed-End Management |
| | | Investment Companies. |
| | | Not applicable. |
| Item 8. | | Portfolio Managers of Closed-End Management Investment Companies. |
| | | Not applicable. |
| Item 9. | | Purchases of Equity Securities by Closed-End Management Investment Companies and |
| | | Affiliated Purchasers. |
| | | Not applicable. |
| Item 10. | | Submission of Matters to a Vote of Security Holders. |
| There have been no material changes to the procedures applicable to Item 10. |
| Item 11. | | Controls and Procedures. |
(a) The Registrant's principal executive and principal financial officers have concluded, based on their evaluation of the Registrant's disclosure controls and procedures as of a date within 90 days of the filing date of this report, that the Registrant's disclosure controls and procedures are reasonably designed to ensure that information required to be disclosed by the Registrant on Form N-CSR is recorded, processed, summarized and reported within the required time periods and that information required to be disclosed by the Registrant in the reports that it files or submits on Form N-CSR is accumulated and communicated to the Registrant's
management, including its principal executive and principal financial officers, as appropriate to allow timely decisions regarding required disclosure.
(b) There were no changes to the Registrant's internal control over financial reporting that occurred during the second fiscal quarter of the period covered by this report that have materially affected, or are reasonably likely to materially affect, the Registrant's internal control over financial reporting.
Item 12. Exhibits.
(a)(1) Code of ethics referred to in Item 2.
(a)(2) Certifications of principal executive and principal financial officers as required by Rule 30a-2(a) under the Investment Company Act of 1940.
(a)(3) Not applicable.
(b) Certification of principal executive and principal financial officers as required by Rule 30a-2(b) under the Investment Company Act of 1940.
Pursuant to the requirements of the Securities Exchange Act of 1934 and the Investment Company Act of 1940, the Registrant has duly caused this Report to be signed on its behalf by the undersigned, thereunto duly authorized.
| The Dreyfus/Laurel Tax-Free Municipal Funds |
| |
| By: | | /s/ J. David Officer |
| | |
|
| | | J. David Officer |
| | | President |
| |
| Date: | | August 12, 2009 |
Pursuant to the requirements of the Securities Exchange Act of 1934 and the Investment Company Act of 1940, this Report has been signed below by the following persons on behalf of the Registrant and in the capacities and on the dates indicated.
| By: | | /s/ J. David Officer |
| | |
|
| | | J. David Officer |
| | President |
| |
| Date: | | August 12, 2009 |
| |
| By: | | /s/ James Windels |
| | |
|
| | | James Windels |
| | Treasurer |
| |
| Date: | | August 12, 2009 |
(a)(1) Code of ethics referred to in Item 2.
(a)(2) Certifications of principal executive and principal financial officers as required by Rule 30a 2(a) under the Investment Company Act of 1940. (EX-99.CERT)
(b) Certification of principal executive and principal financial officers as required by Rule 30a-2(b) under the Investment Company Act of 1940. (EX-99.906CERT)