 1 CREDIT SUISSECREDIT SUISSE 2121STSTANNUAL ENERGY SUMMITANNUAL ENERGY SUMMIT FEBRUARY 24, 2016FEBRUARY 24, 2016 ROGER JENKINS PRESIDENT & CHIEF EXECUTIVE OFFICER
 2 MURPHY OIL CORPORATION www.murphyoilcorp.com NYSE: MUR Cautionary Statement Cautionary Note to U.S. Investors –The United States Securities and Exchange Commission permits oil and gas companies, in their filings with the SEC, to disclose only proved, probable and possible reserves. We may use certain terms in this presentation, such as “resource”, “gross resource”, “recoverable resource”, “net risked PMEANresource”, “recoverable oil”, “resource base”, “EUR or estimated ultimate recovery” and similar terms that the SEC’s rules strictly prohibit us from including in filings with the SEC. Investors are urged to consider closely the oil and gas disclosures in Murphy’s 2014 Annual Report on Form 10-K on file with the SEC. Forward-Looking Statements –This presentation contains forward-looking statements as defined in the Private Securities Litigation Reform Act of 1995. Words such as “targets”, “expectations”, “plans”, “forecasts”, “projections”, and other comparable terminology often identify forward-looking statements. These statements, which express management’s current views concerning future events or results, are subject to inherent risks and uncertainties. Factors that could causeone or more of the events forecasted in this presentation not to occur include, but are not limited to, a deterioration in the business or prospects of Murphy, adverse developments in Murphy’s markets, or adverse developments in the U.S. or global capital markets, credit markets or economies generally. Factors that could cause actual results to differ materially from those expressed or implied in our forward-looking statements include, but are not limited to, the volatility and level of crude oil and natural gas prices, the level and success rate of our exploration programs, our ability to maintain production rates and replace reserves, political and regulatory instability, and uncontrollable natural hazards. For further discussionofrisk factors, see Murphy’s 2014 Annual Report on Form 10-K on file with the U.S. Securities and Exchange Commission. Murphy undertakes no duty to publicly update or revise any forward-looking statements.
 3 MURPHY OIL CORPORATION www.murphyoilcorp.com NYSE: MUR Agenda Business Update Progressing the Portfolio Takeaways
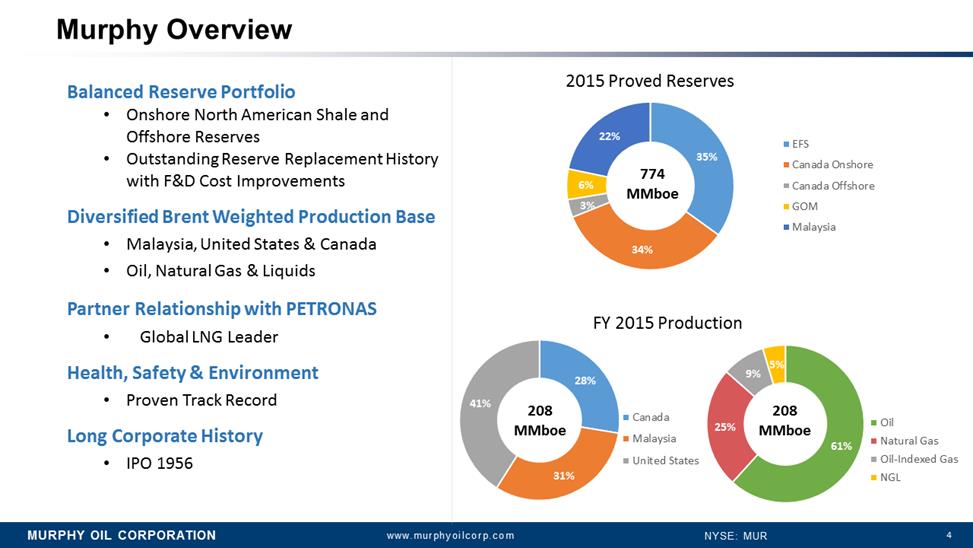 4 Murphy Overview 35% 34% 3% 6% 22% 2015 Proved Reserves EFS Canada Onshore Canada Offshore GOM Malaysia 28% 31% 41% Canada Malaysia United States 61% 25% 9% 5% Oil Natural Gas Oil-Indexed Gas NGL Balanced Reserve Portfolio •Onshore North American Shale and Offshore Reserves •Outstanding Reserve Replacement History with F&D Cost Improvements Diversified Brent Weighted Production Base •Malaysia, United States & Canada •Oil, Natural Gas & Liquids Partner Relationship with PETRONAS •Global LNG Leader Health, Safety & Environment •Proven Track Record Long Corporate History •IPO 1956 774 MMboe 208 MMboe 208 MMboe FY 2015 Production
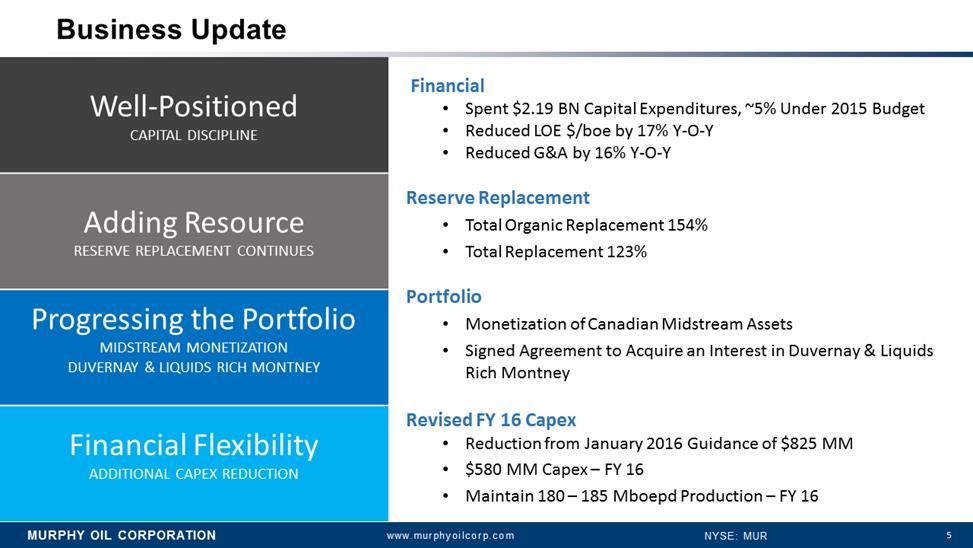 5 Business Update Financial •Spent $2.19 BN Capital Expenditures, ~5% Under 2015 Budget •Reduced LOE $/boeby 17% Y-O-Y •Reduced G&A by 16% Y-O-Y Reserve Replacement •Total Organic Replacement 154% •Total Replacement 123% Portfolio •Monetization of Canadian Midstream Assets •Signed Agreement to Acquire an Interest in Duvernay & Liquids Rich Montney Revised FY 16 Capex •Reduction from January 2016 Guidance of $825 MM •$580 MM Capex –FY 16 •Maintain 180 –185 MboepdProduction –FY 16 Well-Positioned CAPITALDISCIPLINE Adding Resource RESERVE REPLACEMENT CONTINUES Progressing the Portfolio MIDSTREAM MONETIZATION DUVERNAY & LIQUIDS RICH MONTNEY Financial Flexibility ADDITIONALCAPEX REDUCTION
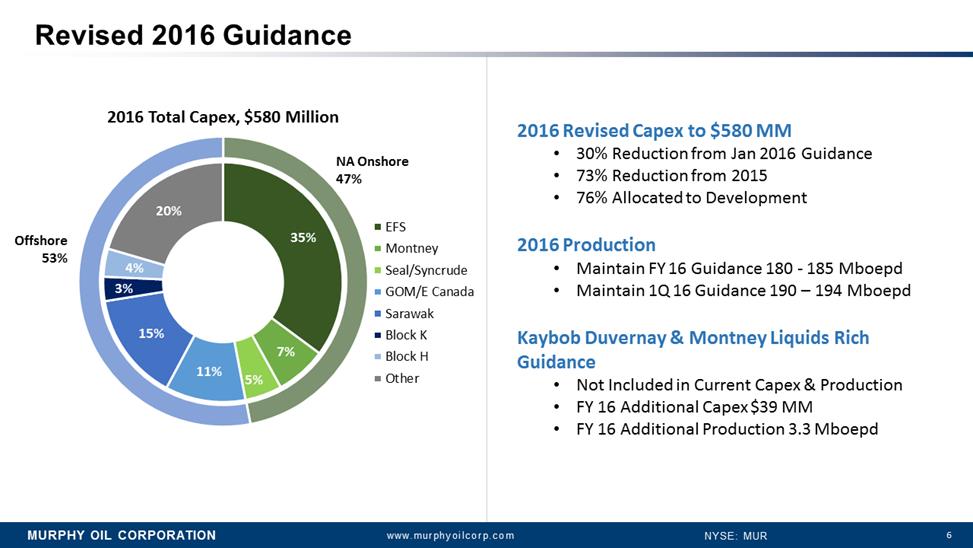 6 35% 7% 5% 11% 15% 3% 4% 20% EFS Montney Seal/Syncrude GOM/E Canada Sarawak Block K Block H Other 2016 Total Capex, $580 Million Revised 2016 Guidance NA Onshore 47% Offshore 53% 2016 Revised Capex to $580 MM •30% Reduction from Jan 2016 Guidance •73% Reduction from 2015 •76% Allocated to Development 2016 Production •Maintain FY 16 Guidance 180 -185 Mboepd •Maintain 1Q 16 Guidance 190 –194 Mboepd KaybobDuvernay& MontneyLiquids Rich Guidance •Not Included in Current Capex & Production •FY 16 Additional Capex $39 MM •FY 16 Additional Production 3.3 Mboepd
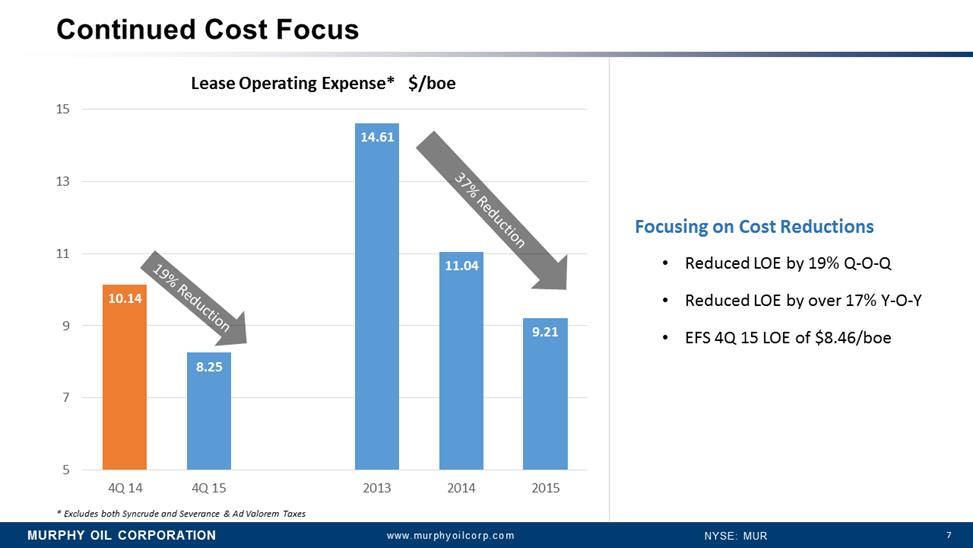 7 Continued Cost Focus 10.14 8.25 14.61 11.04 9.21 5 7 9 11 13 15 4Q 14 4Q 15 2013 2014 2015 Lease Operating Expense* $/boe 37% Reduction 19% Reduction Focusing on Cost Reductions •Reduced LOE by 19% Q-O-Q •Reduced LOE by over 17% Y-O-Y •EFS 4Q 15 LOE of $8.46/boe * Excludes both Syncrudeand Severance & Ad Valorem Taxes
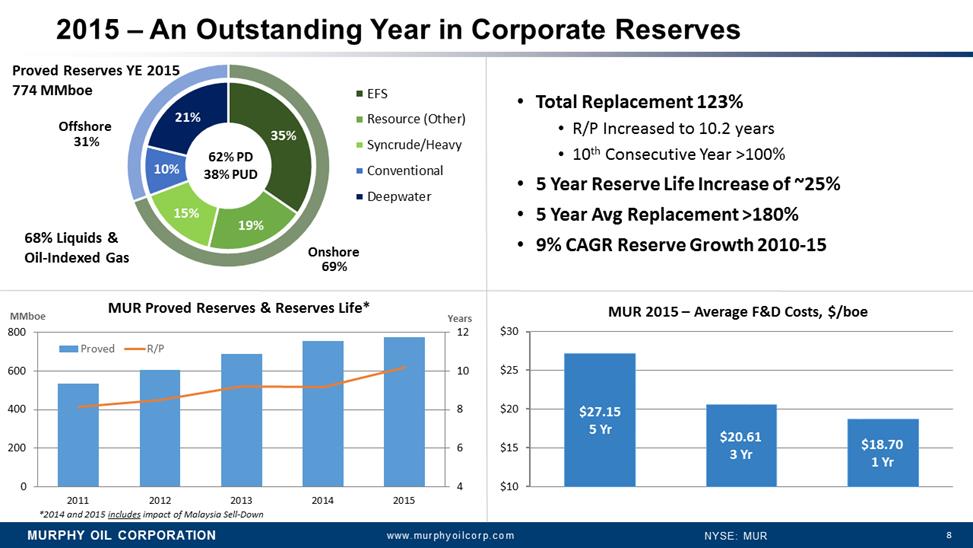 8 35% 19% 15% 10% 21% EFS Resource (Other) Syncrude/Heavy Conventional Deepwater Proved Reserves YE 2015 774 MMboe 2015 –An Outstanding Year in Corporate Reserves •Total Replacement 123% •R/P Increased to 10.2 years •10thConsecutive Year >100% •5 Year Reserve Life Increase of ~25% •5 Year AvgReplacement >180% •9% CAGR Reserve Growth 2010-15 MUR 63% PD 757 37% PUD 69% 31% Onshore Offshore $27.15 5 Yr $20.61 3 Yr $18.70 1 Yr $10 $15 $20 $25 $30 MUR 2015 –Average F&D Costs, $/boe 62% PD 38% PUD MUR 68% Liquids & Oil-Indexed Gas 4 6 8 10 12 0 200 400 600 800 2011 2012 2013 2014 2015 Years MMboe MUR Proved Reserves & Reserves Life* Proved R/P *2014 and 2015 includesimpact of Malaysia Sell-Down GLOBAL OFFSHORE
 GLOBAL OFFSHORE
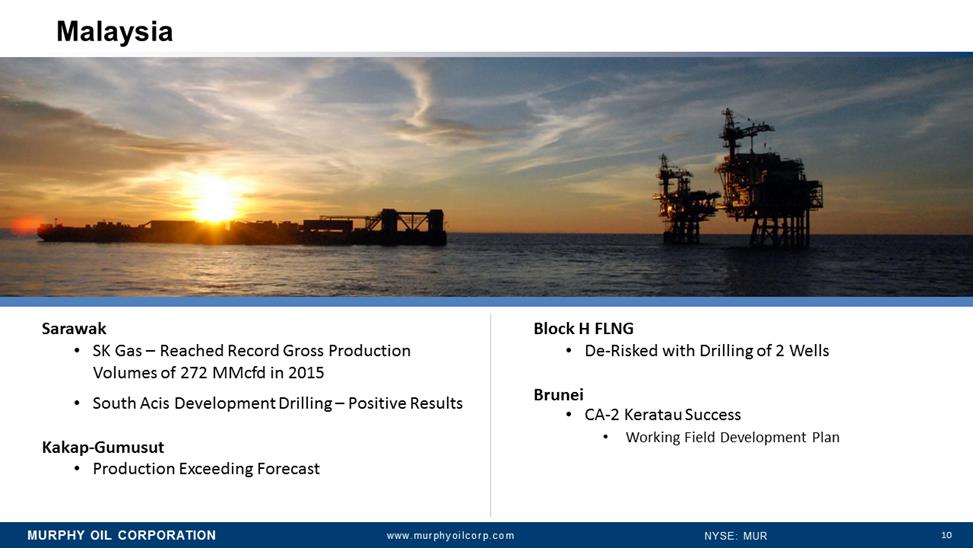 10 Malaysia Sarawak •SK Gas –Reached Record Gross Production Volumes of 272 MMcfdin 2015 •South AcisDevelopment Drilling –Positive Results Kakap-Gumusut •Production Exceeding Forecast Block H FLNG •De-Risked with Drilling of 2 Wells Brunei •CA-2 KeratauSuccess •Working Field Development Plan
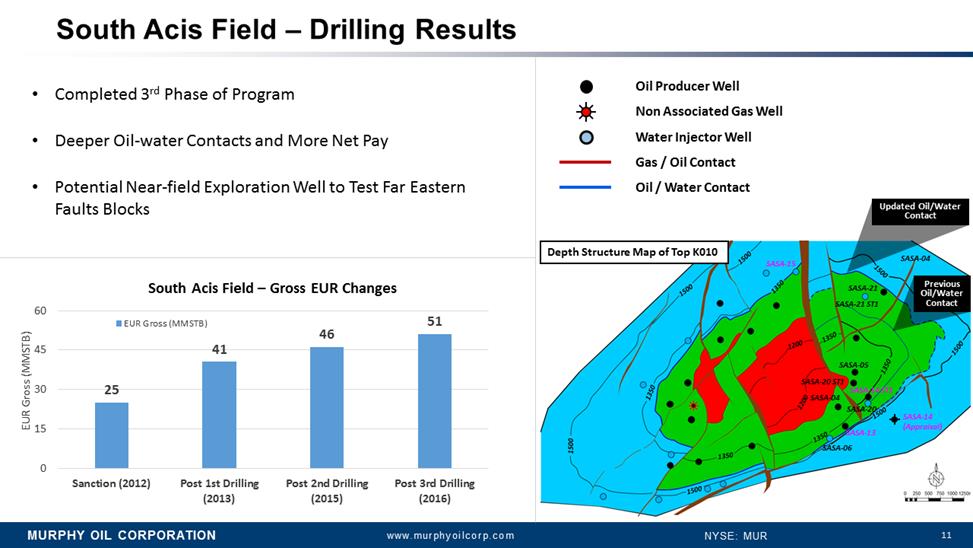 11 South Acis Field –Drilling Results •Completed 3rdPhase of Program •Deeper Oil-water Contacts and More Net Pay •Potential Near-field Exploration Well to Test Far Eastern Faults Blocks 25 41 46 51 0 15 30 45 60 Sanction (2012) Post 1st Drilling(2013) Post 2nd Drilling(2015) Post 3rd Drilling(2016) EUR Gross (MMSTB) South Acis Field –Gross EUR Changes EUR Gross (MMSTB) Oil Producer Well Non Associated Gas Well Water Injector Well SASA-04 SASA-21 SASA-21 ST1 SASA-05 SASA-20 ST1 SASA-04 SASA-14 ST1 SASA-13 SASA-06 SASA-20 SASA-15 Updated Oil/Water Contact Previous Oil/Water Contact Gas / Oil Contact Oil / Water Contact SASA-14 (Appraisal) Depth Structure Map of Top K010
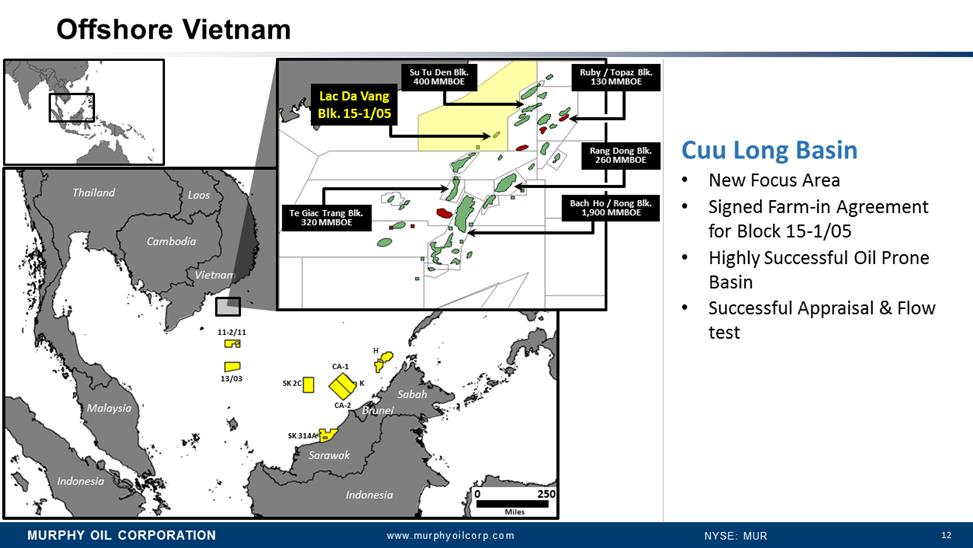 12 Offshore Vietnam CA-1 CA-2 K SK 314A H 144 145 11-2/11 13/03 Vietnam Cambodia Thailand Laos Sarawak Sabah Brunei Indonesia Malaysia Philippines Indonesia SK 2C 0 250 Miles Ruby / Topaz Blk. 130 MMBOE Rang Dong Blk. 260 MMBOE Bach Ho / RongBlk. 1,900 MMBOE TeGiacTrang Blk. 320 MMBOE Lac Da Vang Blk. 15-1/05 Su TuDen Blk. 400 MMBOE CuuLong Basin •New Focus Area •Signed Farm-in Agreement for Block 15-1/05 •Highly Successful Oil Prone Basin •Successful Appraisal & Flow test
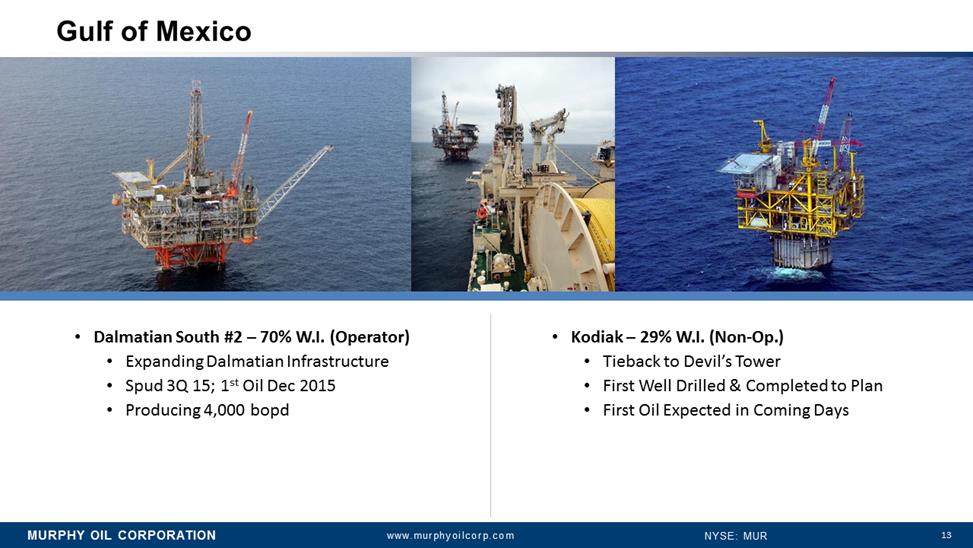 13 Gulf of Mexico •Dalmatian South #2 –70% W.I. (Operator) •Expanding Dalmatian Infrastructure •Spud 3Q 15; 1stOil Dec 2015 •Producing 4,000 bopd •Kodiak –29% W.I. (Non-Op.) •Tieback to Devil’s Tower •First Well Drilled & Completed to Plan •First Oil Expected in Coming Days
 NORTH AMERICA ONSHORE
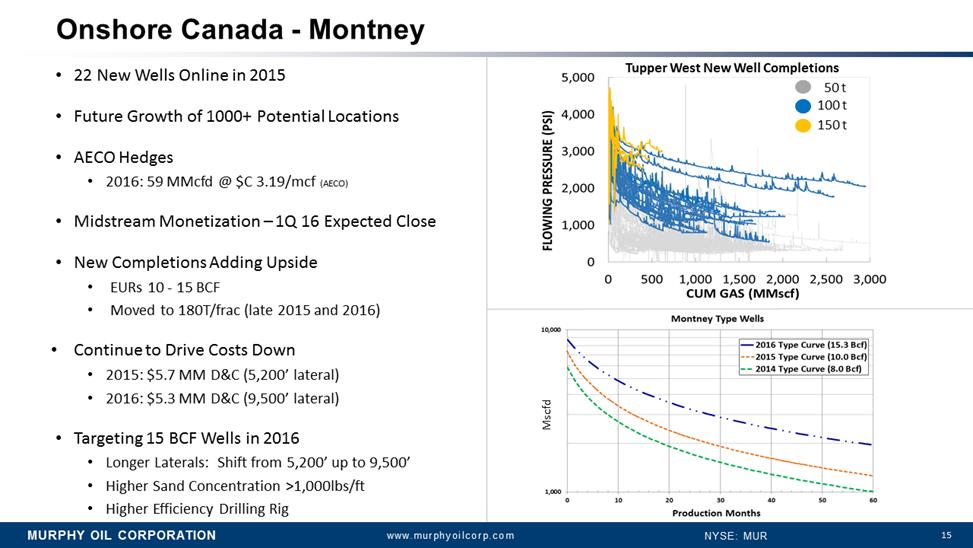 15 Onshore Canada -Montney image001 100 t 150 t 50 t •22 New Wells Online in 2015 •Future Growth of 1000+ Potential Locations •AECO Hedges •2016: 59 MMcfd@ $C 3.19/mcf(AECO) •Midstream Monetization –1Q 16 Expected Close •New Completions Adding Upside •EURs 10 -15 BCF •Moved to 180T/frac(late 2015 and 2016) •Continue to Drive Costs Down •2015: $5.7 MM D&C (5,200’ lateral) •2016: $5.3 MM D&C (9,500’ lateral) •Targeting 15 BCF Wells in 2016 •Longer Laterals: Shift from 5,200’ up to 9,500’ •Higher Sand Concentration >1,000lbs/ft •Higher Efficiency Drilling Rig Tupper West New Well Completions Mscfd
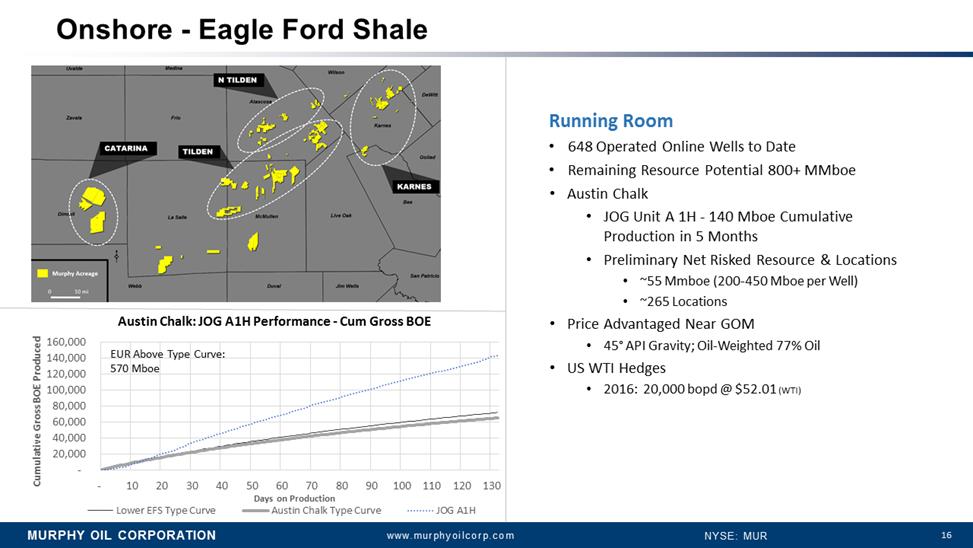 16 - 20,000 40,000 60,000 80,000 100,000 120,000 140,000 160,000 - 10 20 30 40 50 60 70 80 90 100 110 120 130 Cumulative Gross BOE Produced Days on Production Austin Chalk: JOG A1H Performance -Cum Gross BOE Lower EFS Type Curve Austin Chalk Type Curve JOG A1H Onshore -Eagle Ford Shale Running Room •648 Operated Online Wells to Date •Remaining Resource Potential 800+ MMboe •Austin Chalk •JOG Unit A 1H -140 MboeCumulative Production in 5 Months •Preliminary Net Risked Resource & Locations •~55 Mmboe (200-450 Mboe per Well) •~265 Locations •Price Advantaged Near GOM •45°API Gravity; Oil-Weighted 77% Oil •US WTI Hedges •2016: 20,000 bopd@ $
 PROGRESSING THE PORTFOLIO
 18 Montney Midstream Monetization •C$538 MM Divestiture of Montney Midstream Assets in British Columbia, Canada •100% Cash Proceeds •20 year Customary Fee Structure •Assets Include Natural Gas Processing Plants and Sales Pipelines for Tupper and Tupper West •Expected to Close First Quarter •Enbridge Will Own and Operate •Well-established Operator •Current Gross Capacity 320 MMcfpd •Opportunity for Plant Expansion •Cash Proceeds Allocated to: •Balance Sheet Cash –C$288 MM •Duvernay and Liquids Rich Montney Joint Venture –C$250 MM
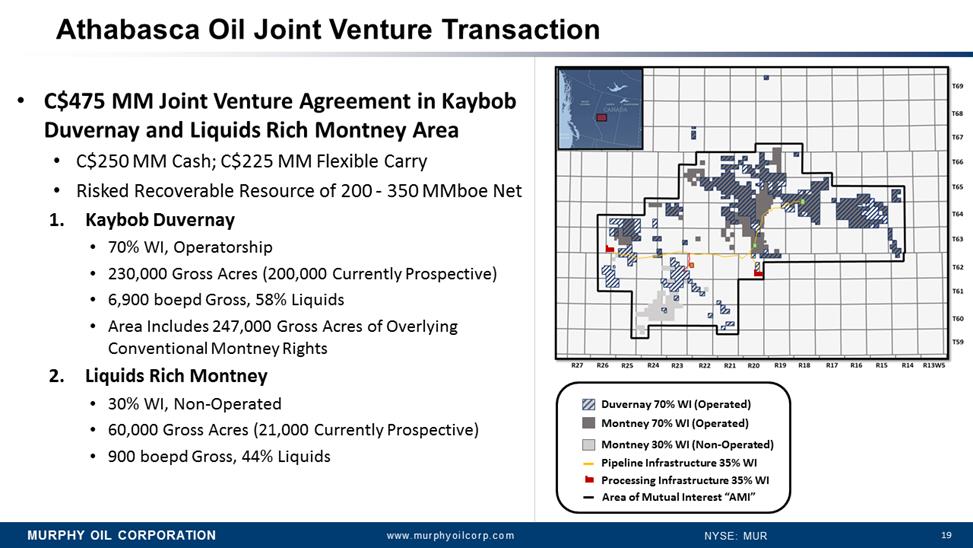 19 •C$475 MM Joint Venture Agreement in KaybobDuvernay and Liquids Rich Montney Area •C$250 MM Cash; C$225 MM Flexible Carry •Risked Recoverable Resource of 200 -350 MMboeNet 1.KaybobDuvernay •70% WI, Operatorship •230,000 Gross Acres (200,000 Currently Prospective) •6,900 boepdGross, 58% Liquids •Area Includes 247,000 Gross Acres of Overlying Conventional Montney Rights 2.Liquids Rich Montney •30% WI, Non-Operated •60,000 Gross Acres (21,000 Currently Prospective) •900 boepdGross, 44% Liquids Athabasca Oil Joint Venture Transaction Area of Mutual Interest “AMI” Montney 70% WI (Operated) Montney 30% WI (Non-Operated) Duvernay 70% WI (Operated) Pipeline Infrastructure 35% WI Processing Infrastructure 35% WI
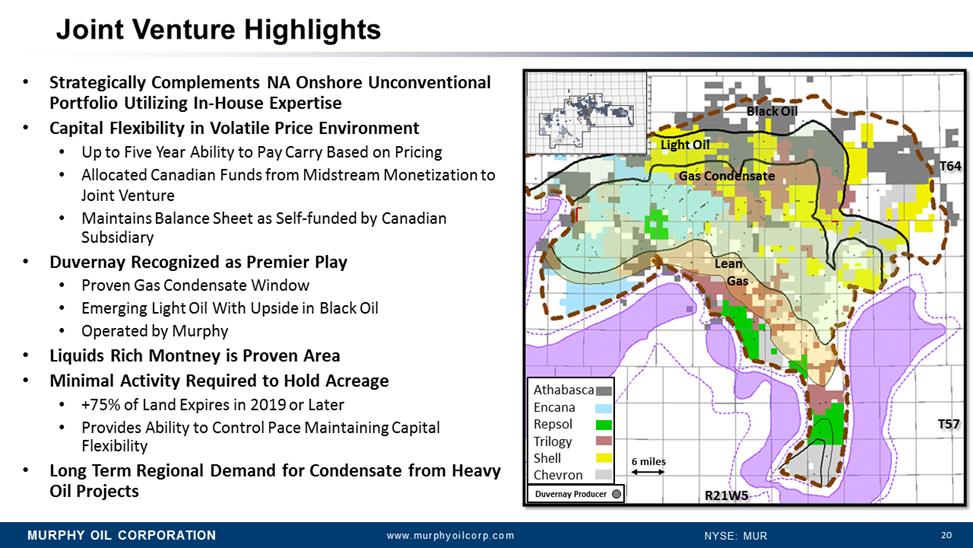 20 •Strategically Complements NA Onshore Unconventional Portfolio Utilizing In-House Expertise •Capital Flexibility in Volatile Price Environment •Up to Five Year Ability to Pay Carry Based on Pricing •Allocated Canadian Funds from Midstream Monetization to Joint Venture •Maintains Balance Sheet as Self-funded by Canadian Subsidiary •Duvernay Recognized as Premier Play •Proven Gas Condensate Window •Emerging Light Oil With Upside in Black Oil •Operated by Murphy •Liquids Rich Montneyis Proven Area •Minimal Activity Required to Hold Acreage •+75% of Land Expires in 2019 or Later •Provides Ability to Control Pace Maintaining Capital Flexibility •Long Term Regional Demand for Condensate from Heavy Oil Projects Joint Venture Highlights T64 T57 R21W5 6 miles DuvernayProducer Gas Condensate Light Oil Lean Gas Athabasca Encana Repsol Trilogy Shell Chevron Black Oil
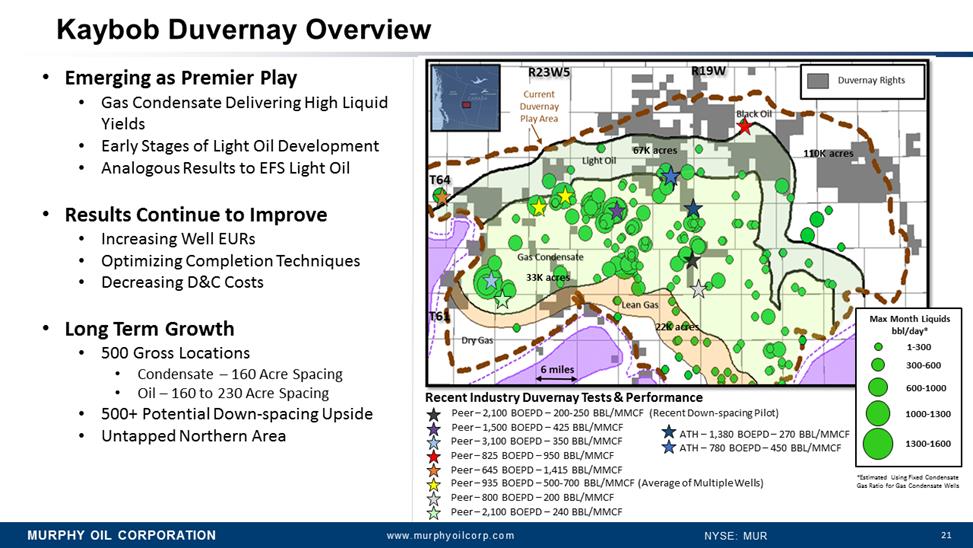 21 KaybobDuvernay Overview •Emerging as Premier Play •Gas Condensate Delivering High Liquid Yields •Early Stages of Light Oil Development •Analogous Results to EFS Light Oil •Results Continue to Improve •Increasing Well EURs •Optimizing Completion Techniques •Decreasing D&C Costs •Long Term Growth •500 Gross Locations •Condensate –160 Acre Spacing •Oil –160 to 230 Acre Spacing •500+ Potential Down-spacing Upside •Untapped Northern Area *Estimated Using Fixed Condensate Gas Ratio for Gas Condensate Wells Recent Industry DuvernayTests & Performance Peer –2,100 BOEPD –200-250 BBL/MMCF (Recent Down-spacing Pilot) Peer –1,500 BOEPD –425 BBL/MMCF Peer –935 BOEPD –500-700 BBL/MMCF (Average of Multiple Wells) Peer –3,100 BOEPD –350 BBL/MMCF Max Month Liquids bbl/day* 300-600 600-1000 1000-1300 1-300 1300-1600 Peer –825 BOEPD –950 BBL/MMCF Peer –645 BOEPD –1,415 BBL/MMCF 67K acres 110K acres 33K acres 22K acres Peer –800 BOEPD –200 BBL/MMCF Peer –2,100 BOEPD –240 BBL/MMCF ATH –1,380 BOEPD –270 BBL/MMCF ATH –780 BOEPD –450 BBL/MMCF
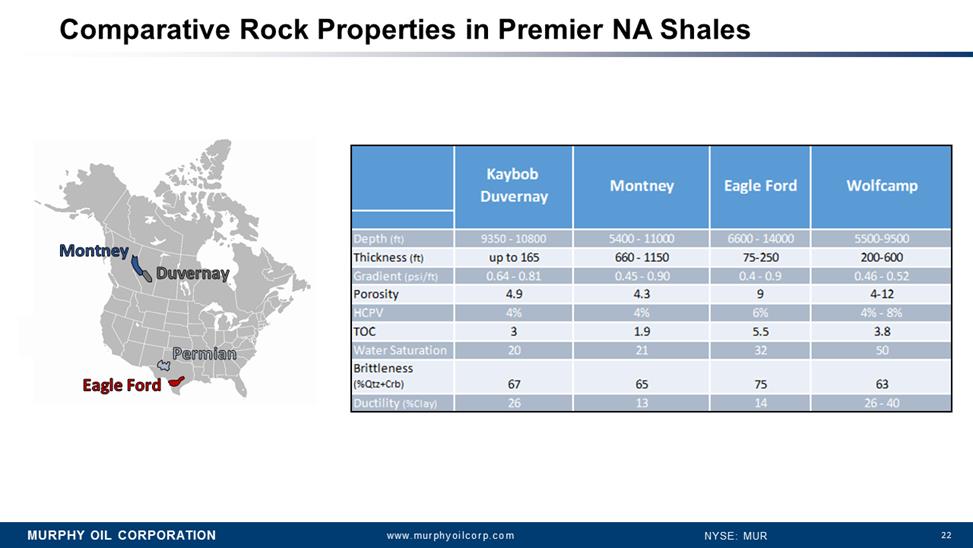 22 image001 Permian Duvernay Montney Eagle Ford Comparative Rock Properties in Premier NA Shales
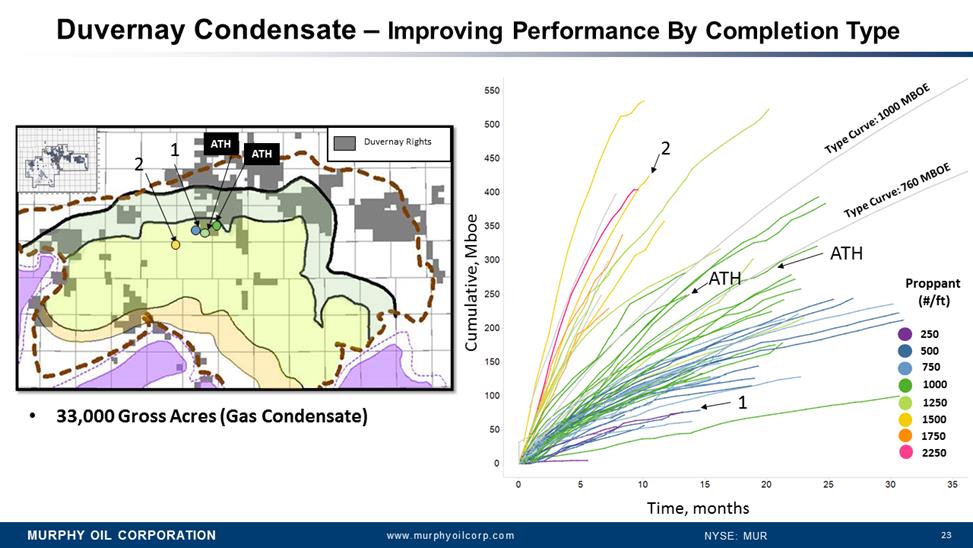 23 Duvernay Condensate –Improving Performance By Completion Type Cumulative, Mboe Time, months 1 2 ATH ATH Proppant (#/ft) 500 750 1000 1250 1500 1750 250 2250 Type Curve: 760 MBOE Type Curve: 1000 MBOE 2 1 ATH ATH •33,000 Gross Acres (Gas Condensate) DuvernayRights ATH ATH
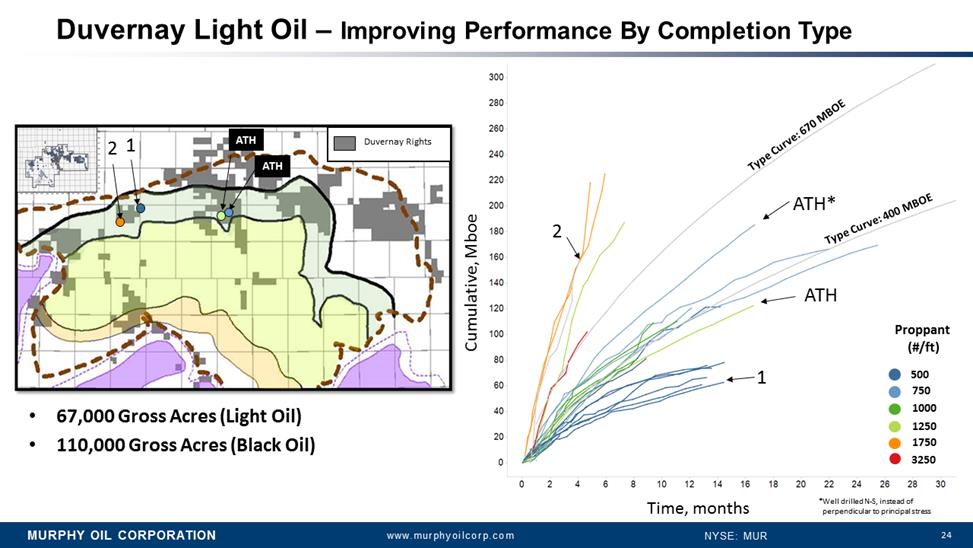 24 Duvernay Light Oil –Improving Performance By Completion Type Cumulative, Mboe Time, months Type Curve: 400 MBOE Type Curve: 670 MBOE 1 2 ATH* ATH Proppant (#/ft) 500 750 1000 1250 1750 3250 ATH ATH DuvernayRights •67,000 Gross Acres (Light Oil) •110,000 Gross Acres (Black Oil) 2 1 ATH ATH *Well drilled N-S, instead of perpendicular to principal stress
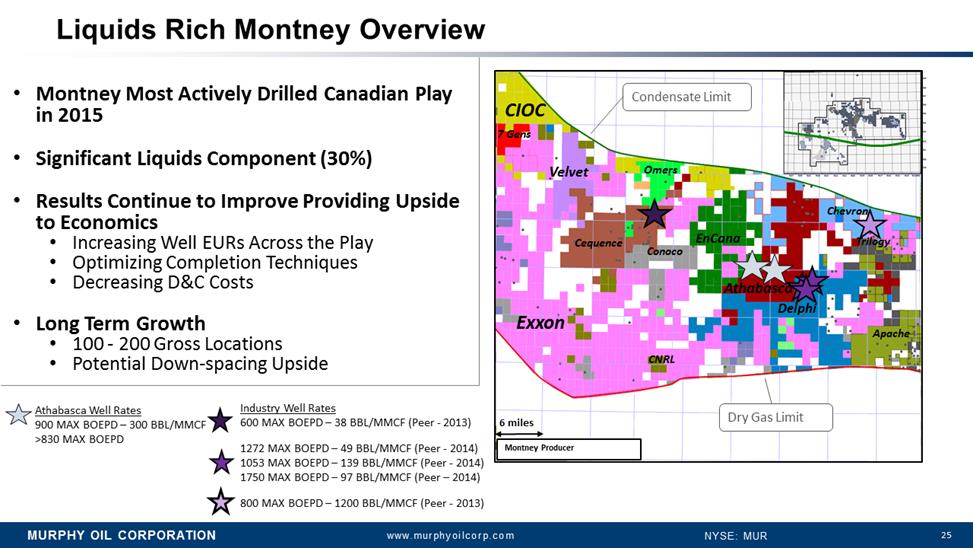 25 Liquids Rich Montney Overview •Montney Most Actively Drilled Canadian Play in 2015 •Significant Liquids Component (30%) •Results Continue to Improve Providing Upside to Economics •Increasing Well EURs Across the Play •Optimizing Completion Techniques •Decreasing D&C Costs •Long Term Growth •100 -200 Gross Locations •Potential Down-spacing Upside Industry Well Rates 600 MAX BOEPD –38 BBL/MMCF (Peer -2013) 1272 MAX BOEPD –49 BBL/MMCF (Peer -2014) 1053 MAX BOEPD –139 BBL/MMCF (Peer -2014) 1750 MAX BOEPD –97 BBL/MMCF (Peer –2014) 800 MAX BOEPD –1200 BBL/MMCF (Peer -2013) 6 miles Exxon Cequence Conoco Athabasca Delphi EnCana CIOC Velvet Chevron Omers Apache Trilogy Dry Gas Limit Condensate Limit Montney Producer 7 Gens CNRL Athabasca Well Rates 900 MAX BOEPD –300 BBL/MMCF >830 MAX BOEPD
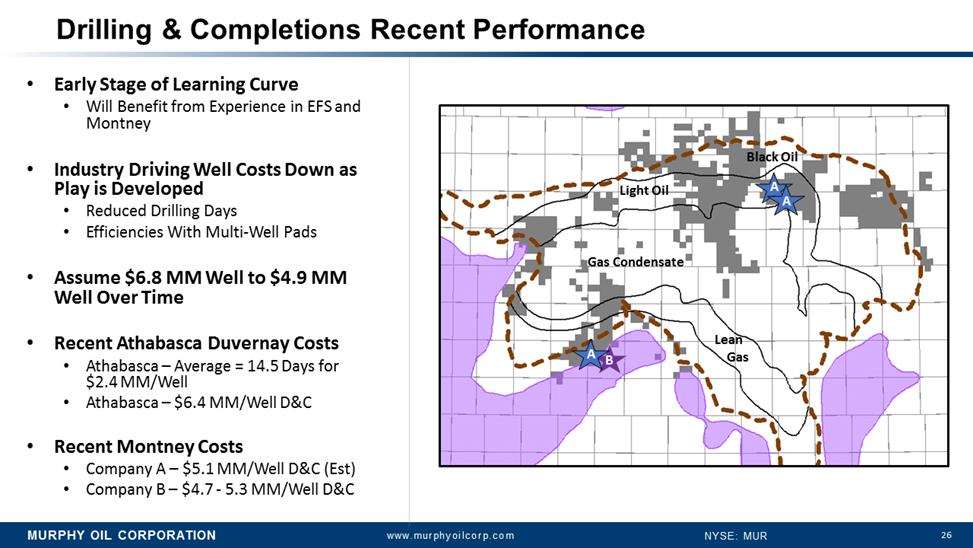 26 MURPHY OIL CORPORATION www.murphyoilcorp.com NYSE: MUR Drilling & Completions Recent Performance •Early Stage of Learning Curve •Will Benefit from Experience in EFS and Montney •Industry Driving Well Costs Down as Play is Developed •Reduced Drilling Days •Efficiencies With Multi-Well Pads •Assume $6.8 MM Well to $4.9 MM Well Over Time •Recent Athabasca Duvernay Costs •Athabasca –Average = 14.5 Days for $2.4 MM/Well •Athabasca –$6.4 MM/Well D&C •Recent Montney Costs •Company A –$5.1 MM/Well D&C (Est) •Company B –$4.7 -5.3 MM/Well D&C B Gas Condensate Light Oil Lean Gas Black Oil A A A
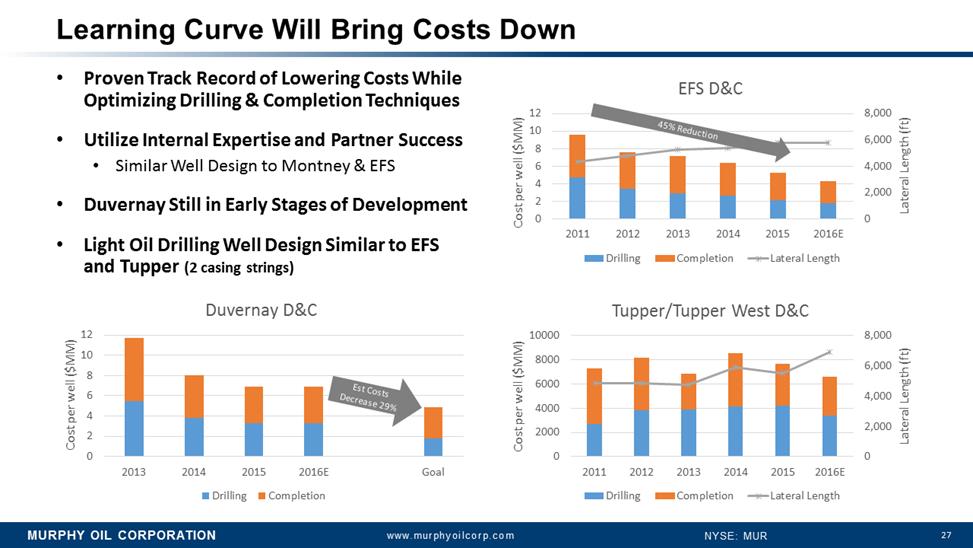 27 MURPHY OIL CORPORATION www.murphyoilcorp.com NYSE: MUR •Proven Track Record of Lowering Costs While Optimizing Drilling & Completion Techniques •Utilize Internal Expertise and Partner Success •Similar Well Design to Montney& EFS •DuvernayStill in Early Stages of Development •Light Oil Drilling Well Design Similar to EFS and Tupper (2 casing strings) 0 2 4 6 8 10 12 2013 2014 2015 2016E Goal Cost per well ($MM) Duvernay D&C Drilling Completion 0 2,000 4,000 6,000 8,000 0 2000 4000 6000 8000 10000 2011 2012 2013 2014 2015 2016E Lateral Length (ft) Cost per well ($MM) Tupper/Tupper West D&C Drilling Completion Lateral Length Learning Curve Will Bring Costs Down 0 2,000 4,000 6,000 8,000 0 2 4 6 8 10 12 2011 2012 2013 2014 2015 2016E Lateral Length (ft) Cost per well ($MM) EFS D&C Drilling Completion Lateral Length Est Costs Decrease 29% 45% Reduction
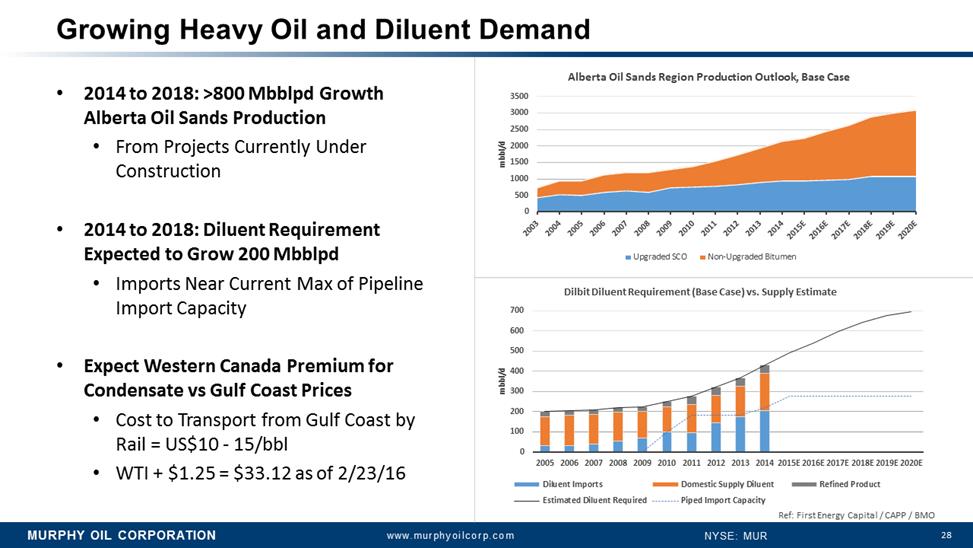 28 MURPHY OIL CORPORATION www.murphyoilcorp.com NYSE: MUR Growing Heavy Oil and Diluent Demand •2014 to 2018: >800 MbblpdGrowth Alberta Oil Sands Production •From Projects Currently Under Construction •2014 to 2018: Diluent Requirement Expected to Grow 200 Mbblpd •Imports Near Current Max of Pipeline Import Capacity •Expect Western Canada Premium for Condensate vs Gulf Coast Prices •Cost to Transport from Gulf Coast by Rail = US$10 -15/bbl •WTI + $1.25 = $33.12 as of 2/23/16 0 500 1000 1500 2000 2500 3000 3500 2003 2004 2005 2006 2007 2008 2009 2010 2011 2012 2013 2014 2015E 2016E 2017E 2018E 2019E 2020E mbbl/d Alberta Oil Sands Region Production Outlook, Base Case Upgraded SCO Non-Upgraded Bitumen 0 100 200 300 400 500 600 700 2005 2006 2007 2008 2009 2010 2011 2012 2013 2014 2015E 2016E 2017E 2018E 2019E 2020E mbbl/d DilbitDiluent Requirement (Base Case) vs. Supply Estimate Diluent Imports Domestic Supply Diluent Refined Product Estimated Diluent Required Piped Import Capacity Ref: First Energy Capital / CAPP / BMO
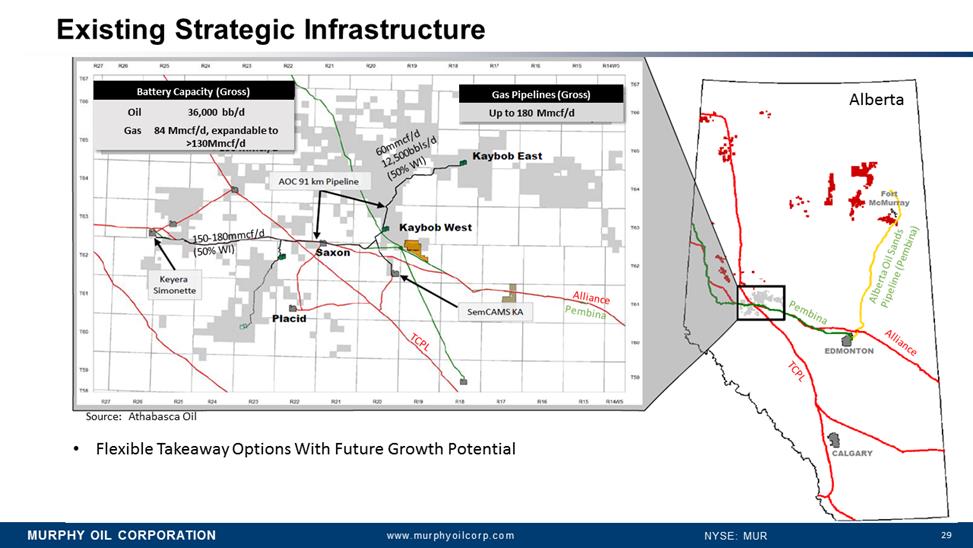 29 Existing Strategic Infrastructure Alberta 60mmcf/d 12,500bbls/d (50% WI) 150-180mmcf/d (50% WI) TCPL Alliance Pembina •Flexible Takeaway OptionsWith Future Growth Potential Gas Pipelines (Gross) Up to 180 Mmcf/d Battery Capacity (Gross) Oil 36,000 bb/d Gas 84 Mmcf/d, expandableto >130Mmcf/d Alliance Pembina TCPL Alberta Oil Sands Pipeline (Pembina) Source: Athabasca Oil
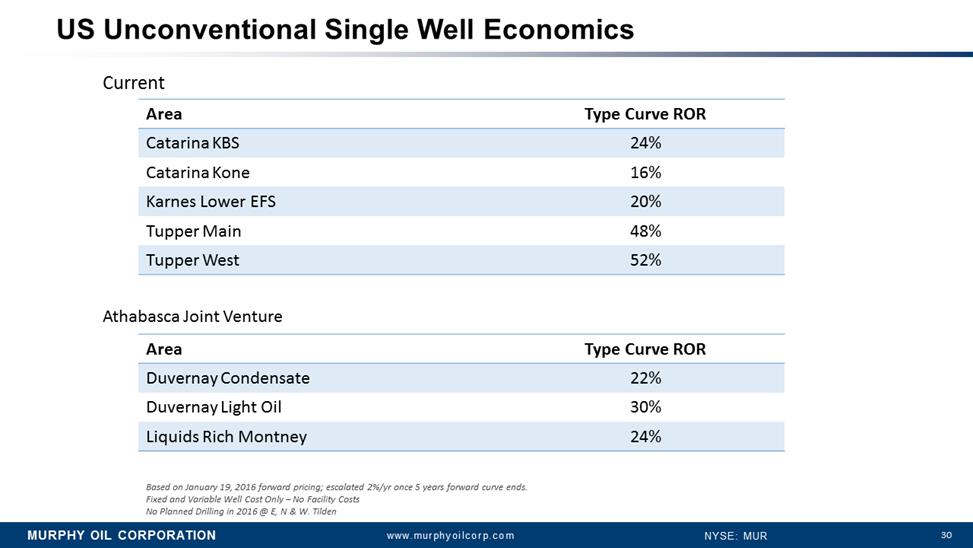 30 US Unconventional Single Well Economics Based on January 19, 2016 forward pricing; escalated 2%/yronce 5 years forward curve ends. Fixed and Variable Well Cost Only –No Facility Costs No Planned Drilling in 2016 @ E, N & W. Tilden Current Athabasca Joint Venture Area Type Curve ROR Catarina KBS 24% Catarina Kone 16% Karnes Lower EFS 20% TupperMain 48% Tupper West 52% Area Type Curve ROR DuvernayCondensate 22% DuvernayLight Oil 30% Liquids Rich Montney 24%
 31 FINANCIAL OUTLOOK
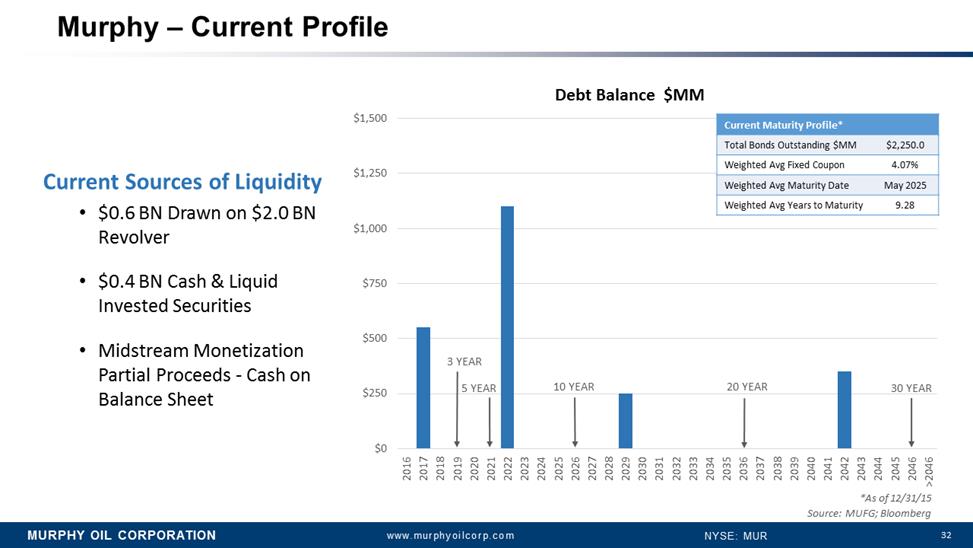 32 $0 $250 $500 $750 $1,000 $1,250 $1,500 2016 2017 2018 2019 2020 2021 2022 2023 2024 2025 2026 2027 2028 2029 2030 2031 2032 2033 2034 2035 2036 2037 2038 2039 2040 2041 2042 2043 2044 2045 2046 >2046 Debt Balance $MM 10 YEAR 20YEAR 30 YEAR Murphy –Current Profile Source: MUFG; Bloomberg 3 YEAR 5YEAR Current Maturity Profile* Total Bonds Outstanding $MM $2,250.0 Weighted AvgFixed Coupon 4.07% Weighted AvgMaturity Date May2025 Weighted AvgYears to Maturity 9.28 *As of 12/31/15 Current Sources of Liquidity •$0.6 BN Drawn on $2.0 BN Revolver •$0.4 BN Cash & Liquid Invested Securities •Midstream Monetization Partial Proceeds -Cash on Balance Sheet
 33 Managing the Balance Sheet •Reduced Capital to $580 MM, 73% from 2015 Including a 75%Reduction in the EFS •Securing Longer Tenor on Revolver •Dividend Review if Commodity Prices Remain at Current Levels •Non Core Asset Sales –Continue to Review Portfolio
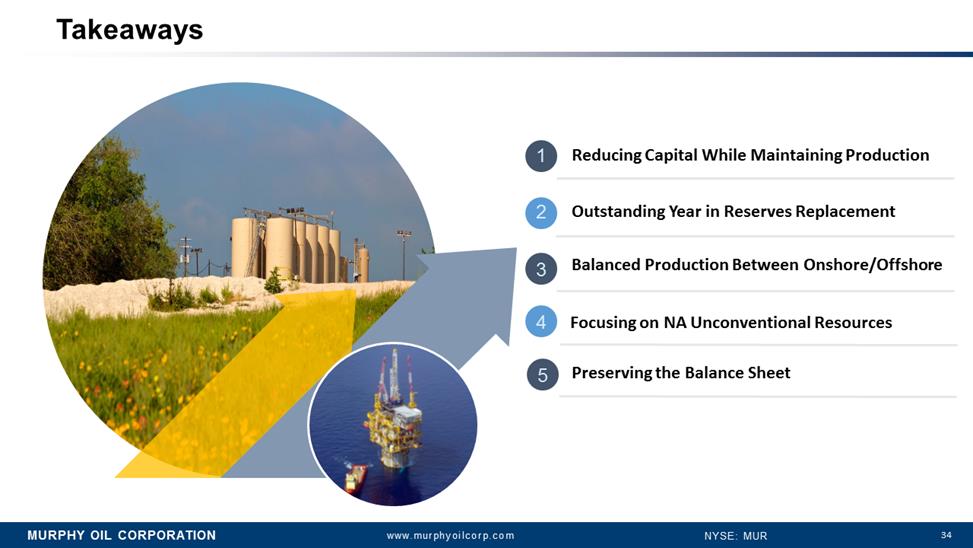 34 Preserving the Balance Sheet Outstanding Year in Reserves Replacement Takeaways 1 2 3 4 Reducing Capital While Maintaining Production Focusing on NA Unconventional Resources 5 Balanced Production Between Onshore/Offshore
 35 APPENDIX
 36 Appendix •Non-GAAPReconciliation •Abbreviations •Guidance •HedgingPositions
 37 Non-GAAP Financial Measure Definitions & Reconciliations ThefollowinglistofNon-GAAPfinancialmeasuredefinitionsandrelatedreconciliationsisintendedtosatisfytherequirementsofRegulationGoftheSecuritiesExchangeActof1934,asamended.Thisinformationishistoricalinnature.MurphyundertakesnoobligationtopubliclyupdateorreviseanyNon-GAAPfinancialmeasuredefinitionsandrelatedreconciliations.
 38 Non-GAAP Reconciliation ADJUSTEDEARNINGS Murphy defines Adjusted Earnings as net income adjusted to exclude discontinued operations and certain other items that affect comparability between periods. Adjusted Earnings is used by management to evaluate the Company’s operational performance and trends between periods and relative to its industry competitors. Adjusted Earnings, as reported by Murphy, may not be comparable to similarly titled measures used by other companies and it should be considered in conjunction with net income, cash flow from operations and other performance measures prepared in accordance with generally accepted accounting principles (GAAP). Adjusted Earnings has certain limitations regarding financial assessments because it excludes certain items that affect net income. Adjusted Earnings should not be considered in isolation or as a substitute for an analysis of Murphy's GAAP results as reported.
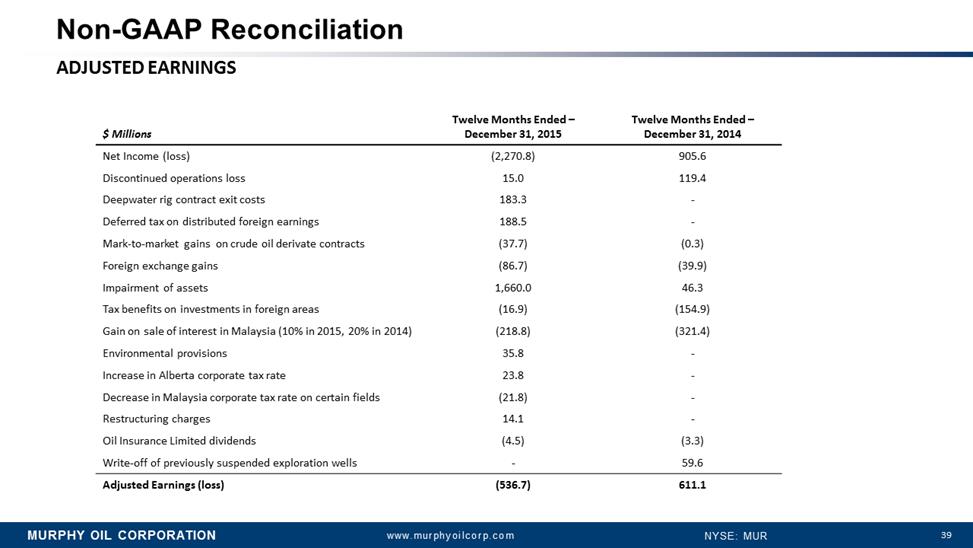 39 Non-GAAP Reconciliation ADJUSTEDEARNINGS $ Millions Twelve Months Ended –December 31, 2015 Twelve Months Ended –December 31, 2014 Net Income (loss) (2,270.8) 905.6 Discontinued operationsloss 15.0 119.4 Deepwater rig contract exit costs 183.3 - Deferred tax on distributed foreign earnings 188.5 - Mark-to-marketgains on crude oil derivate contracts (37.7) (0.3) Foreign exchange gains (86.7) (39.9) Impairment of assets 1,660.0 46.3 Tax benefitson investments in foreign areas (16.9) (154.9) Gain on sale of interest in Malaysia (10% in 2015, 20% in 2014) (218.8) (321.4) Environmentalprovisions 35.8 - Increase in Alberta corporate tax rate 23.8 - Decrease in Malaysia corporate tax rate on certain fields (21.8) - Restructuring charges 14.1 - OilInsurance Limited dividends (4.5) (3.3) Write-offof previously suspended exploration wells - 59.6 Adjusted Earnings (loss) (536.7) 611.1
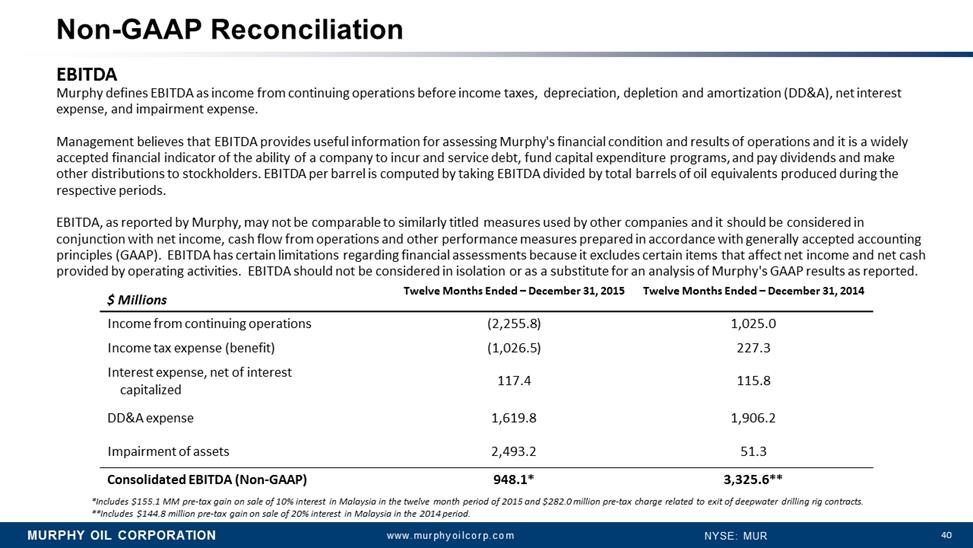 40 Non-GAAP Reconciliation EBITDA Murphy defines EBITDA as income from continuing operations before income taxes, depreciation, depletion and amortization (DD&A), net interest expense, and impairment expense. Management believes that EBITDA provides useful information for assessing Murphy's financial condition and results of operationsand it is a widely accepted financial indicator of the ability of a company to incur and service debt, fund capital expenditure programs, and pay dividends and make other distributions to stockholders. EBITDA per barrel is computed by taking EBITDA divided by total barrels of oil equivalents produced during the respective periods. EBITDA, as reported by Murphy, may not be comparable to similarly titled measures used by other companies and it should be considered in conjunction with net income, cash flow from operations and other performance measures prepared in accordance with generally accepted accounting principles (GAAP). EBITDA has certain limitations regarding financial assessments because it excludes certain items that affectnet income and net cash provided by operating activities. EBITDA should not be considered in isolation or as a substitute for an analysis of Murphy's GAAP results as reported. $ Millions Twelve Months Ended –December 31, 2015 Twelve Months Ended –December 31, 2014 Income from continuingoperations (2,255.8) 1,025.0 Incometax expense (benefit) (1,026.5) 227.3 Interest expense, net of interest capitalized 117.4 115.8 DD&Aexpense 1,619.8 1,906.2 Impairmentof assets 2,493.2 51.3 Consolidated EBITDA (Non-GAAP) 948.1* 3,325.6** *Includes $155.1 MM pre-tax gain on sale of 10% interest in Malaysia in the twelve month period of 2015and $282.0 million pre-tax charge related to exit of deepwaterdrilling rig contracts. **Includes $144.8 million pre-tax gain on sale of 20% interest in Malaysia in the 2014 period.
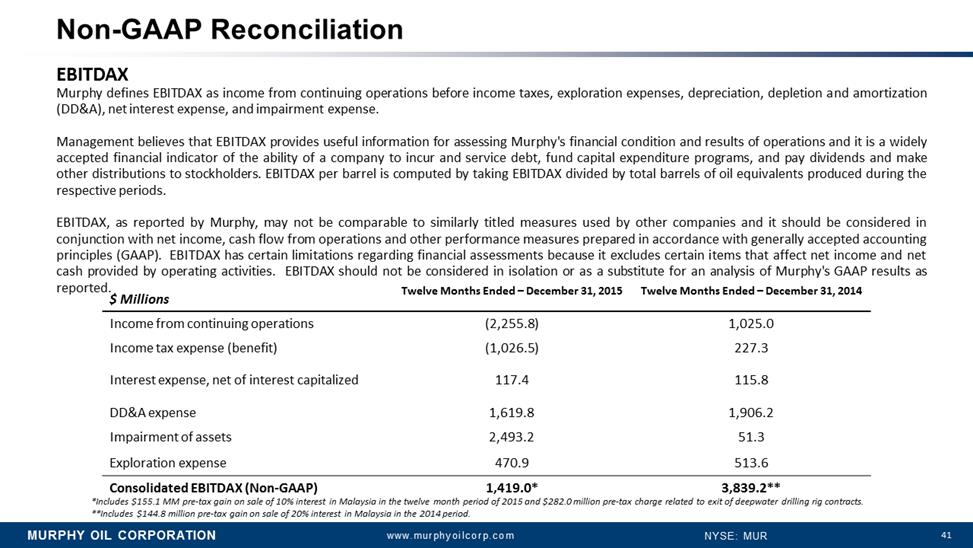 41 Non-GAAP Reconciliation EBITDAX MurphydefinesEBITDAXasincomefromcontinuingoperationsbeforeincometaxes,explorationexpenses,depreciation,depletionandamortization(DD&A),netinterestexpense,andimpairmentexpense. ManagementbelievesthatEBITDAXprovidesusefulinformationforassessingMurphy'sfinancialconditionandresultsofoperationsanditisawidelyacceptedfinancialindicatoroftheabilityofacompanytoincurandservicedebt,fundcapitalexpenditureprograms,andpaydividendsandmakeotherdistributionstostockholders.EBITDAXperbarreliscomputedbytakingEBITDAXdividedbytotalbarrelsofoilequivalentsproducedduringtherespectiveperiods. EBITDAX,asreportedbyMurphy,maynotbecomparabletosimilarlytitledmeasuresusedbyothercompaniesanditshouldbeconsideredinconjunctionwithnetincome,cashflowfromoperationsandotherperformancemeasurespreparedinaccordancewithgenerallyacceptedaccountingprinciples(GAAP).EBITDAXhascertainlimitationsregardingfinancialassessmentsbecauseitexcludescertainitemsthataffectnetincomeandnetcashprovidedbyoperatingactivities.EBITDAXshouldnotbeconsideredinisolationorasasubstituteforananalysisofMurphy'sGAAPresultsasreported. $ Millions Twelve Months Ended –December 31, 2015 Twelve Months Ended –December31, 2014 Income from continuingoperations (2,255.8) 1,025.0 Incometax expense (benefit) (1,026.5) 227.3 Interest expense, net of interest capitalized 117.4 115.8 DD&A expense 1,619.8 1,906.2 Impairmentof assets 2,493.2 51.3 Explorationexpense 470.9 513.6 Consolidated EBITDAX (Non-GAAP) 1,419.0* 3,839.2** *Includes $155.1 MM pre-tax gain on sale of 10% interest in Malaysia in the twelve month period of 2015and $282.0 million pre-tax charge related to exit of deepwaterdrilling rig contracts. **Includes $144.8 million pre-tax gain on sale of 20% interest in Malaysia in the 2014 period.
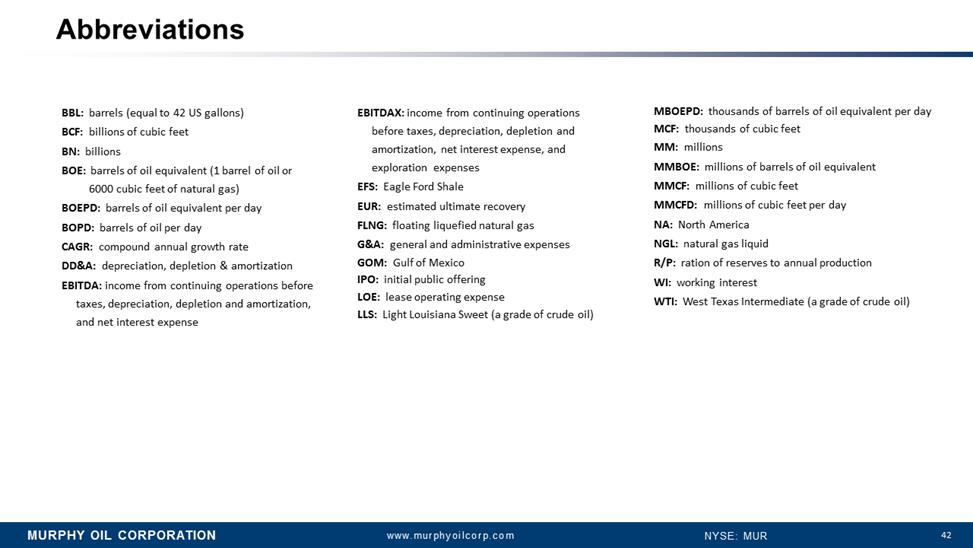 42 Abbreviations BBL: barrels (equal to 42 US gallons) BCF: billions of cubic feet BN: billions BOE: barrels of oil equivalent (1 barrel of oil or 6000 cubic feet of natural gas) BOEPD: barrels of oil equivalent per day BOPD: barrels of oil per day CAGR: compound annual growth rate DD&A:depreciation, depletion & amortization EBITDA: income from continuing operations before taxes, depreciation, depletion and amortization, and net interest expense MBOEPD: thousands of barrels of oil equivalent per day MCF: thousands of cubic feet MM: millions MMBOE: millions of barrels of oil equivalent MMCF: millions of cubic feet MMCFD: millions of cubic feet per day NA: North America NGL: natural gas liquid R/P: ration of reserves to annual production WI: working interest WTI: West Texas Intermediate (a grade of crude oil) EBITDAX: income from continuing operations before taxes, depreciation, depletion and amortization, net interest expense, and exploration expenses EFS: Eagle Ford Shale EUR: estimated ultimate recovery FLNG: floating liquefied natural gas G&A: general and administrative expenses GOM: Gulf of Mexico IPO: initial public offering LOE: lease operating expense LLS: Light Louisiana Sweet (a grade of crude oil)
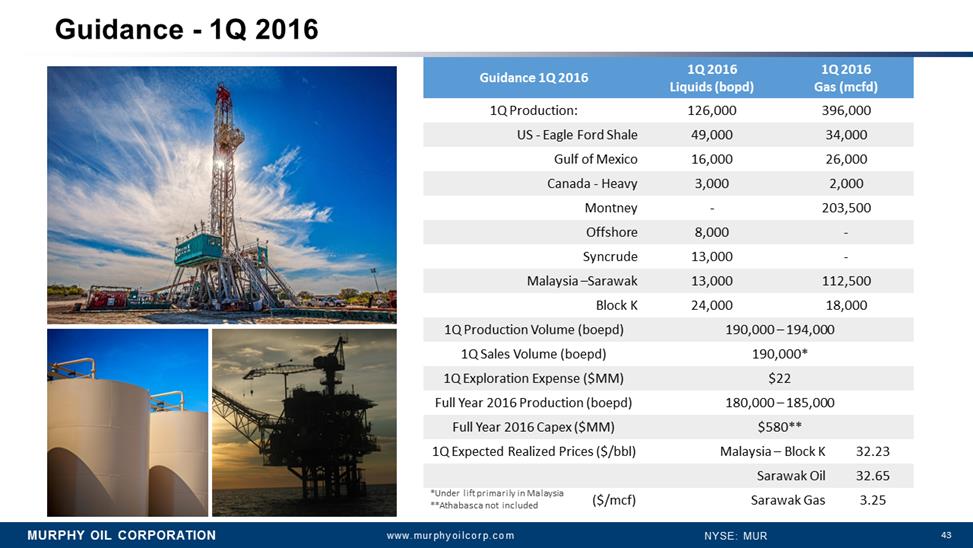 43 Guidance -1Q 2016 Guidance 1Q 2016 1Q 2016 Liquids (bopd) 1Q 2016 Gas (mcfd) 1Q Production: 126,000 396,000 US -EagleFord Shale 49,000 34,000 Gulfof Mexico 16,000 26,000 Canada -Heavy 3,000 2,000 Montney - 203,500 Offshore 8,000 - Syncrude 13,000 - Malaysia –Sarawak 13,000 112,500 BlockK 24,000 18,000 1Q Production Volume (boepd) 190,000 –194,000 1Q Sales Volume (boepd) 190,000* 1Q Exploration Expense ($MM) $22 FullYear 2016 Production(boepd) 180,000 –185,000 Full Year 2016 Capex ($MM) $580** 1Q Expected Realized Prices ($/bbl) Malaysia –Block K 32.23 Sarawak Oil 32.65 ($/mcf) Sarawak Gas 3.25 DSC01462.JPG _MG_5738.jpg *Under lift primarily in Malaysia **Athabasca not included
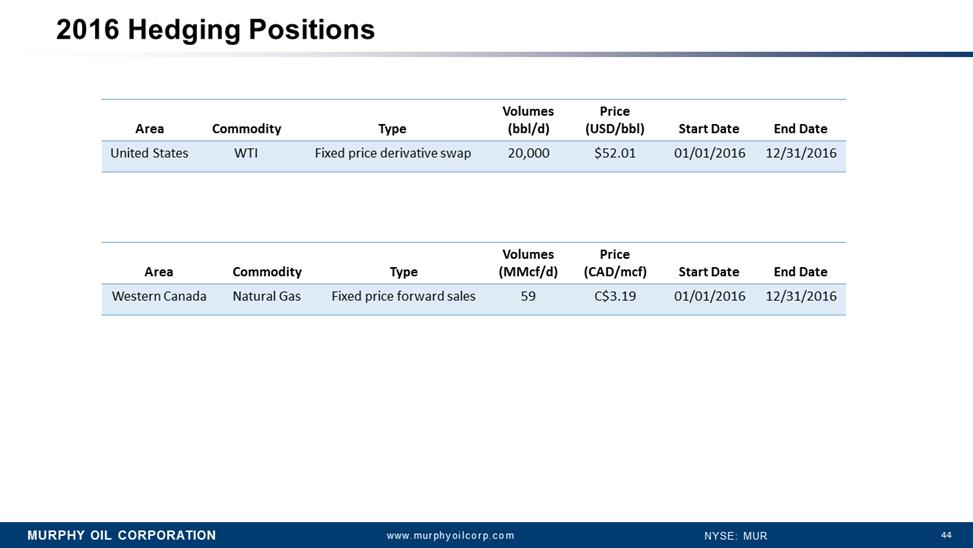 44 2016 Hedging Positions Area Commodity Type Volumes (bbl/d) Price (USD/bbl) Start Date End Date United States WTI Fixed price derivative swap 20,000 $52.01 01/01/2016 12/31/2016 Area Commodity Type Volumes(MMcf/d) Price (CAD/mcf) StartDate End Date WesternCanada Natural Gas Fixedprice forward sales 59 C$3.19 01/01/2016 12/31/2016