ANNUAL MEETING OF STOCKHOLDERS EL DORADO, ARKANSAS MAY 10, 2017 ROGER W. JENKINS PRESIDENT & CHIEF EXECUTIVE OFFICER MURPHY OIL CORPORATION
www.murphyoilcorp.com NYSE: MUR Cautionary Statement Cautionary Note to U.S. Investors –The United States Securities and Exchange Commission (SEC) requires oil and natural gas companies, in their filings with the SEC, to disclose proved reserves that a company has demonstrated by actual production or conclusive formation tests to be economically and legally producible under existing economic and operating conditions. We may use certain terms in this presentation, such as “resource”, “gross resource”, “recoverable resource”, “net risked PMEANresource”, “recoverable oil”, “resource base”, “EUR” or “estimated ultimate recovery” and similar terms that the SEC’s rules prohibit us from including in filings with the SEC. The SEC permits the optional disclosure of probable and possible reserves in our filings with the SEC. Investors are urged to consider closely the disclosures and risk factors in our most recent Annual Report on Form 10-K filed with the SEC and any subsequent Quarterly Report on Form 10-Q or Current Report on Form 8-K that we file, available from the SEC’s website and from Murphy Oil Corporation’s website at http://ir.murphyoilcorp.com. Forward-Looking Statements –This presentation contains forward-looking statements as defined in the Private Securities Litigation Reform Act of 1995. Forward-looking statements are generally identified through the inclusion of wordssuch as “aim”, “anticipate”, “believe”, “drive”, “estimate”, “expect”, “expressed confidence”, “forecast”, “future”, “goal”, “guidance”, “intend”, “may”, “objective”, “outlook”, “plan”, “position”, “potential”, “project”, “seek”, “should”, “strategy”, “target”, “will” or variations of such words and other similar expressions. These statements, which express management’s current views concerning future events or results, are subject to inherent risks and uncertainties. Factors that could causeone or more of these future events or results not to occur as implied by any forward-looking statement include, but are not limited to, increased volatilityor deterioration in the level of crude oil and natural gas prices, deterioration in the success rate of our exploration programs or in our ability tomaintain production rates and replace reserves, reduced customer demand for our products due to environmental, regulatory, technological or other reasons, adverse foreign exchange movements, political and regulatory instability in the markets where we do business, natural hazards impacting our operations, any other deterioration in our business, markets or prospects, any failure to obtain necessary regulatory approvals, any inability to service or refinance our outstanding debt or to access debt markets at acceptable prices, and adverse developments in the U.S. or global capital markets,credit markets or economies in general. For further discussion of factors that could cause one or more of these future events or results not tooccur as implied by any forward-looking statement, see “Risk Factors” in our most recent Annual Report on Form 10-K filed with the SEC and any subsequent Quarterly Report on Form 10-Q or Current Report on Form 8-K that we file, available from the SEC’s website and from Murphy Oil Corporation's website at http://ir.murphyoilcorp.com. Murphy undertakes no duty to publicly update or revise any forward-looking statements. MURPHY OIL CORPORATION www.murphyoilcorp.com NYSE: MUR
Agenda Business Environment Business Update Portfolio Review Looking Ahead MURPHY OIL CORPORATION www.murphyoilcorp.com NYSE: MUR

BUSINESS ENVIRONMENT
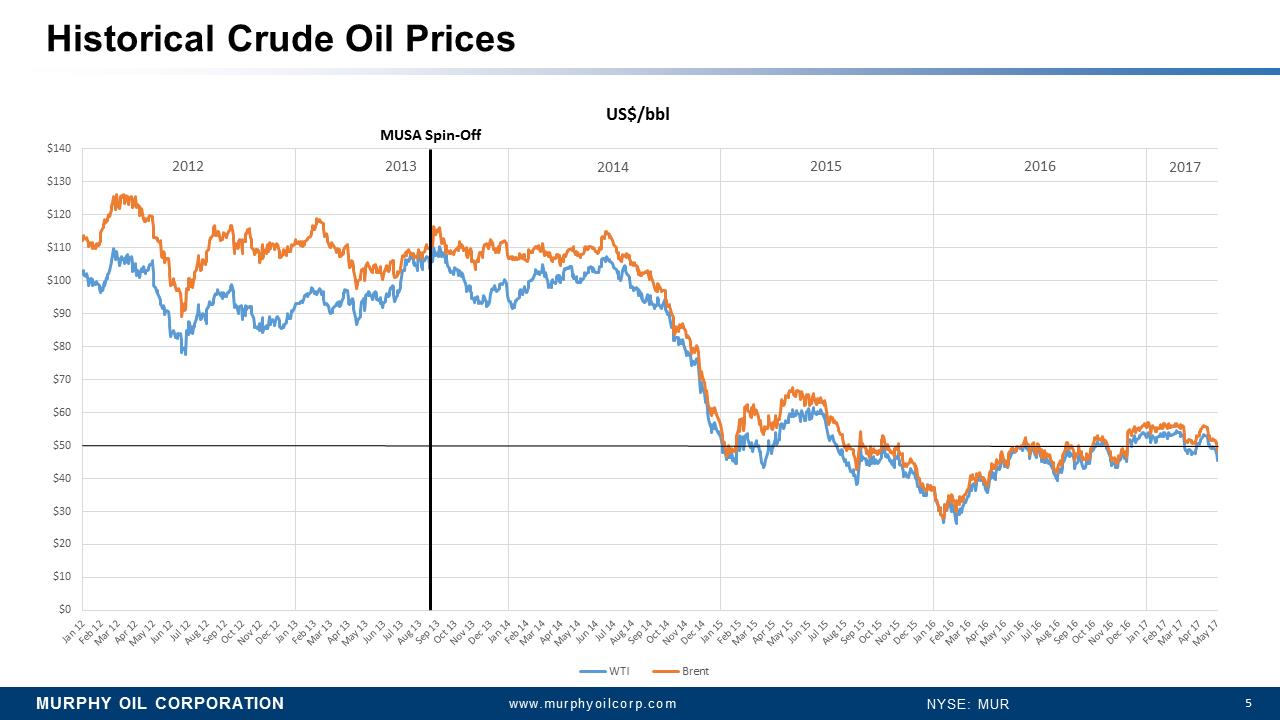
www.murphyoilcorp.com NYSE: MUR $0 $10 $20 $30 $40 $50 $60 $70 $80 $90 $100 $110 $120 $130 $140 Jan 12 Feb 12 Mar 12 Apr 12 May 12 Jun 12 Jul 12 Aug 12 Sep 12 Oct 12 Nov 12 Dec 12 Jan 13 Feb 13 Mar 13 Apr 13 May 13 Jun 13 Jul 13 Aug 13 Sep 13 Oct 13 Nov 13 Dec 13 Jan 14 Feb 14 Mar 14 Apr 14 May 14 Jun 14 Jul 14 Aug 14 Sep 14 Oct 14 Nov 14 Dec 14 Jan 15 Feb 15 Mar 15 Apr 15 May 15 Jun 15 Jul 15 Aug 15 Sep 15 Oct 15 Nov 15 Dec 15 Jan 16 Feb 16 Mar 16 Apr 16 May 16 Jun 16 Jul 16 Aug 16 Sep 16 Oct 16 Nov 16 Dec 16 Jan 17 Feb 17 Mar 17 Apr 17 May 17 US$/bbl WTI Brent Historical Crude Oil Prices MUSA Spin-Off 2012 2013 2014 2015 2016 2017
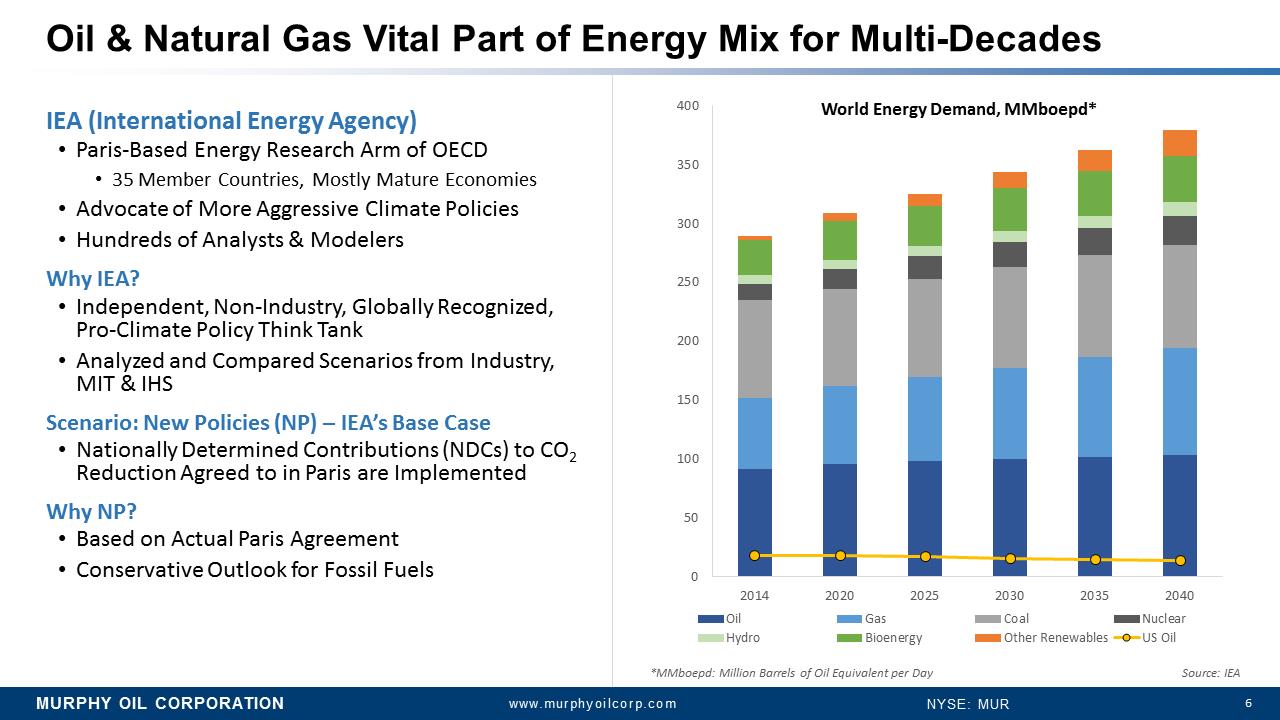
MURPHY OIL CORPORATION www.murphyoilcorp.com NYSE: MUR Oil & Natural Gas Vital Part of Energy Mix for Multi-Decades IEA (International Energy Agency) •Paris-Based Energy Research Arm of OECD •35 Member Countries, Mostly Mature Economies •Advocate of More Aggressive Climate Policies •Hundreds of Analysts & Modelers Why IEA? •Independent, Non-Industry, Globally Recognized, Pro-Climate Policy Think Tank •Analyzed and Compared Scenarios from Industry, MIT & IHS Scenario: New Policies (NP) –IEA’s Base Case •Nationally Determined Contributions (NDCs) to CO2Reduction Agreed to in Paris are Implemented Why NP? •Based on Actual Paris Agreement •Conservative Outlook for Fossil Fuels 0 50 100 150 200 250 300 350 400 2014 2020 2025 2030 2035 2040 World Energy Demand, MMboepd* Oil Gas Coal Nuclear Hydro Bioenergy Other Renewables US Oil *MMboepd: Million Barrels of Oil Equivalent per Day Source: IEA
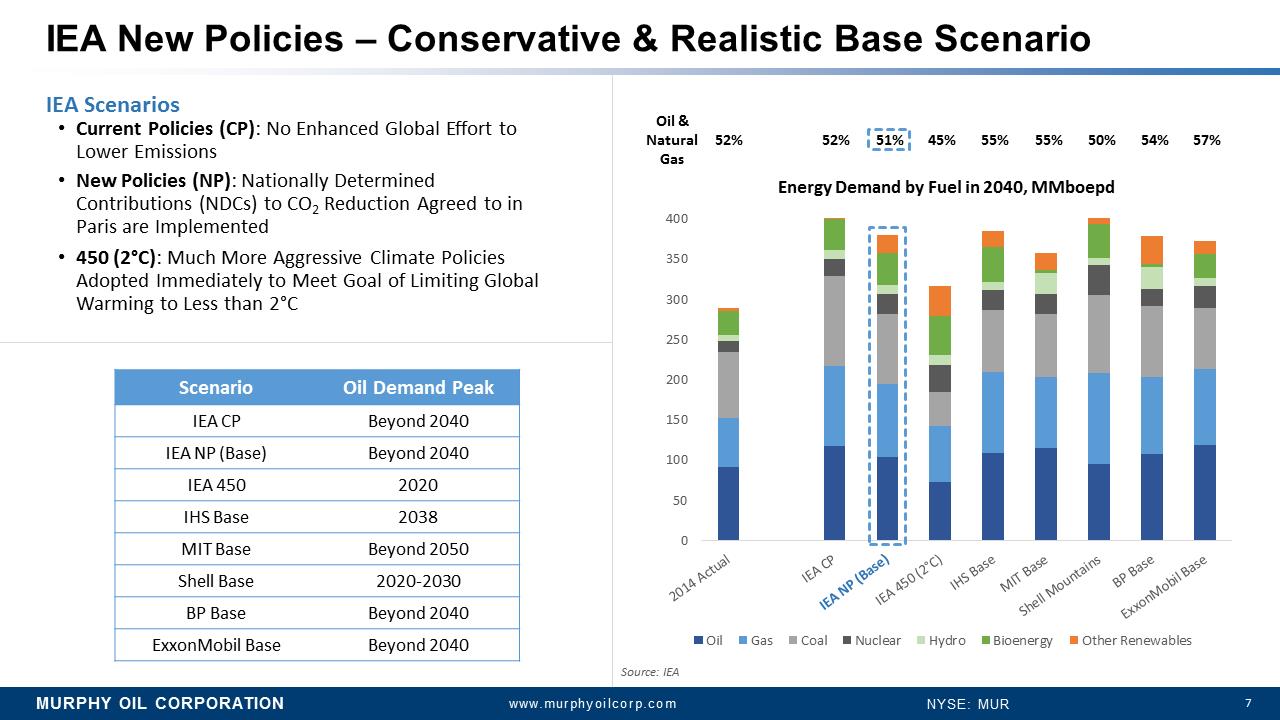
MURPHY OIL CORPORATION 7 www.murphyoilcorp.com NYSE: MUR IEA New Policies –Conservative & Realistic Base Scenario IEA Scenarios •Current Policies (CP): No Enhanced Global Effort to Lower Emissions •New Policies (NP): Nationally Determined Contributions (NDCs) to CO2Reduction Agreed to in Paris are Implemented •450 (2°C): Much More Aggressive Climate Policies Adopted Immediately to Meet Goal of Limiting Global Warming to Less than 2°C 0 50 100 150 200 250 300 350 400 2014 Actual - IEA CP IEA NP (Base) IEA 450 (2°C) IHS Base MIT Base Shell Mountains BP Base ExxonMobil Base Energy Demand by Fuel in 2040, MMboepd Oil Gas Coal Nuclear Hydro Bioenergy Other Renewables 45% 51% 55% 52% 55% 50% 54% 57% 52% Scenario Oil Demand Peak IEA CP Beyond 2040 IEANP (Base) Beyond2040 IEA 450 2020 IHS Base 2038 MIT Base Beyond2050 ShellBase 2020-2030 BP Base Beyond 2040 ExxonMobil Base Beyond2040 Source: IEA
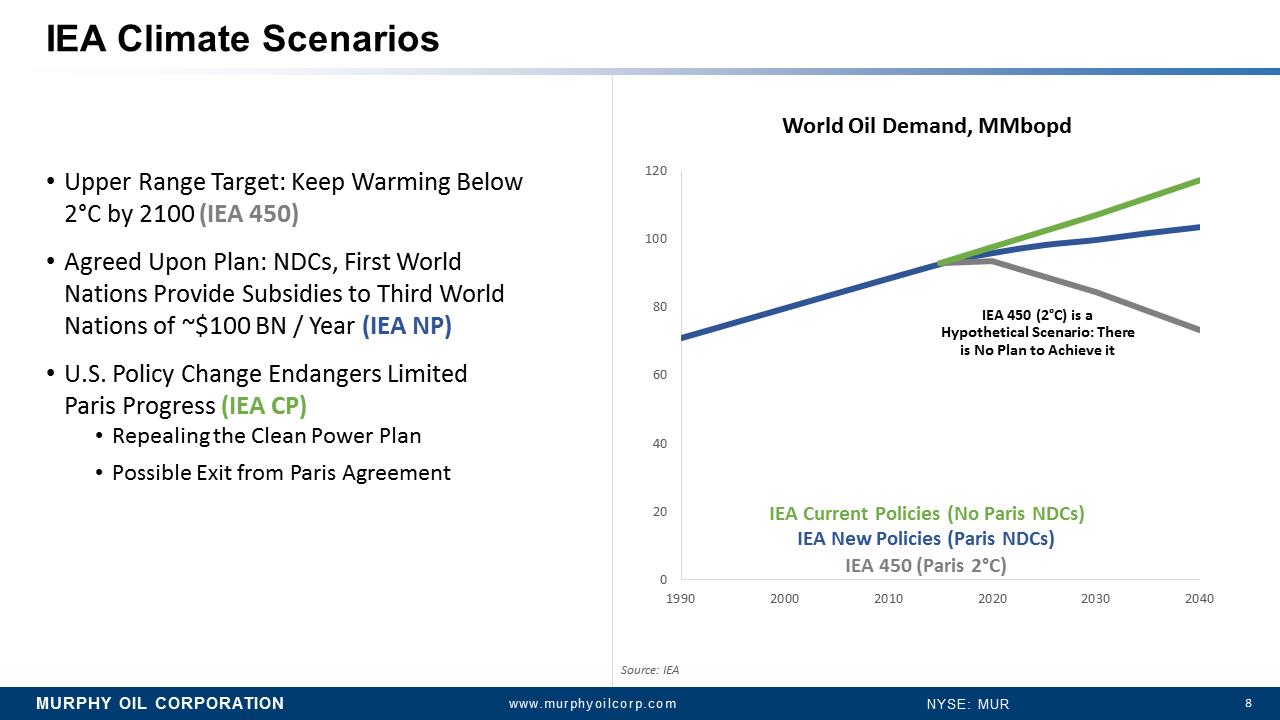
MURPHY OIL CORPORATION 8 www.murphyoilcorp.com NYSE: MUR 0 20 40 60 80 100 120 1990 2000 2010 2020 2030 2040 IEA Climate Scenarios •Upper Range Target: Keep Warming Below 2°C by 2100 (IEA 450) •Agreed Upon Plan: NDCs, First World Nations Provide Subsidies to Third World Nations of ~$100 BN / Year (IEA NP) •U.S. Policy Change Endangers Limited Paris Progress(IEA CP) •Repealing the Clean Power Plan •Possible Exit from Paris Agreement IEA Current Policies (No Paris NDCs) IEA New Policies (Paris NDCs) IEA 450 (Paris 2°C) Source: IEA IEA 450 (2°C) is a Hypothetical Scenario: There is No Plan to Achieve it World Oil Demand, MMbopd
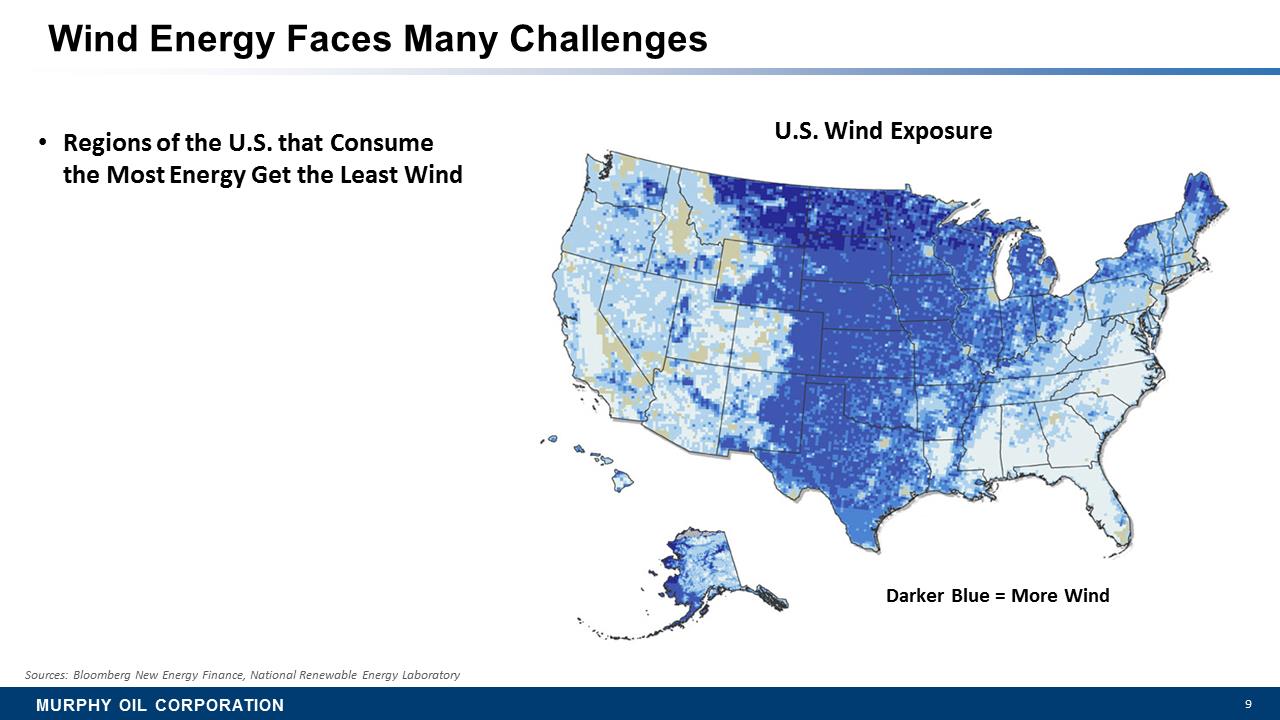
MURPHY OIL CORPORATION 9 Wind Energy Faces Many Challenges •Regions of the U.S. that Consume the Most Energy Get the Least Wind Sources: Bloomberg New Energy Finance, National Renewable Energy Laboratory U.S. Wind Exposure Darker Blue = More Wind
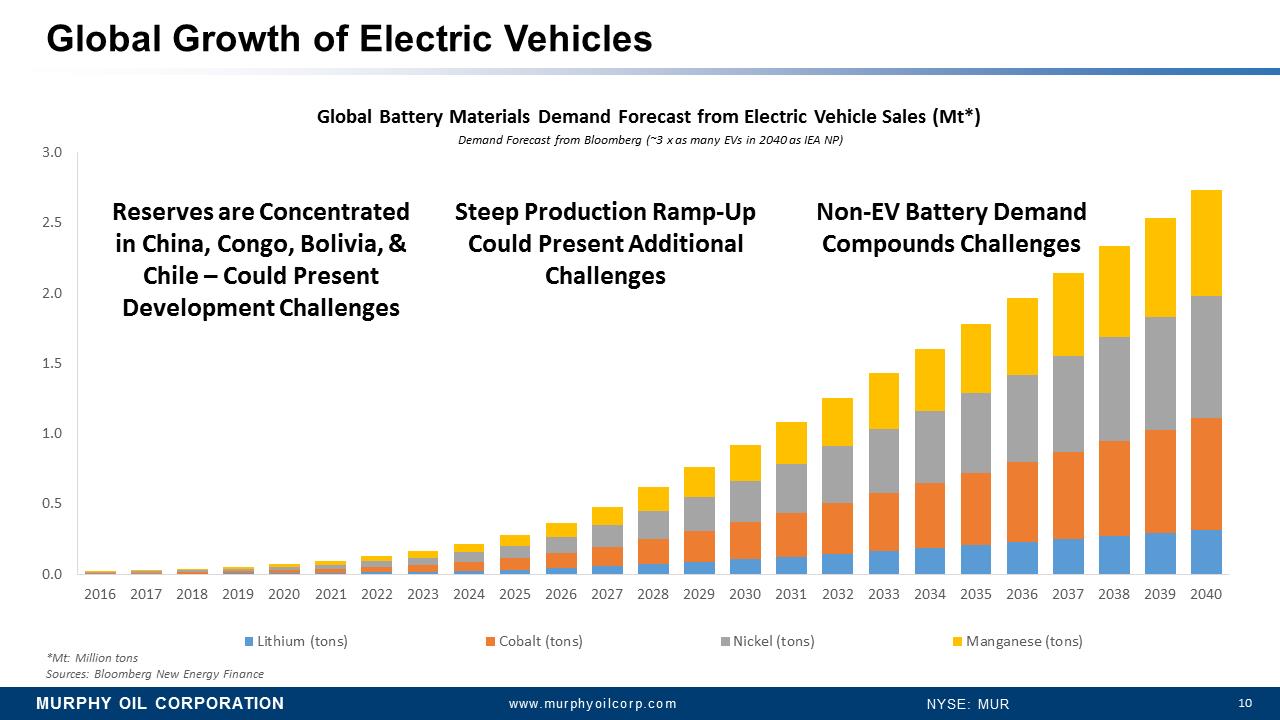
MURPHY OIL CORPORATION 10 www.murphyoilcorp.com NYSE: MUR 0.0 0.5 1.0 1.5 2.0 2.5 3.0 2016 2017 2018 2019 2020 2021 2022 2023 2024 2025 2026 2027 2028 2029 2030 2031 2032 2033 2034 2035 2036 2037 2038 2039 2040 Global Battery Materials Demand Forecast from Electric Vehicle Sales (Mt*) Lithium (tons) Cobalt (tons) Nickel (tons) Manganese (tons) Demand Forecast from Bloomberg (~3 x as many EVs in 2040 as IEA NP) Global Growth of Electric Vehicles Sources: Bloomberg New Energy Finance Reserves are Concentrated in China, Congo, Bolivia, & Chile –Could Present Development Challenges Steep Production Ramp-Up Could Present Additional Challenges Non-EV Battery Demand Compounds Challenges *Mt: Million tons
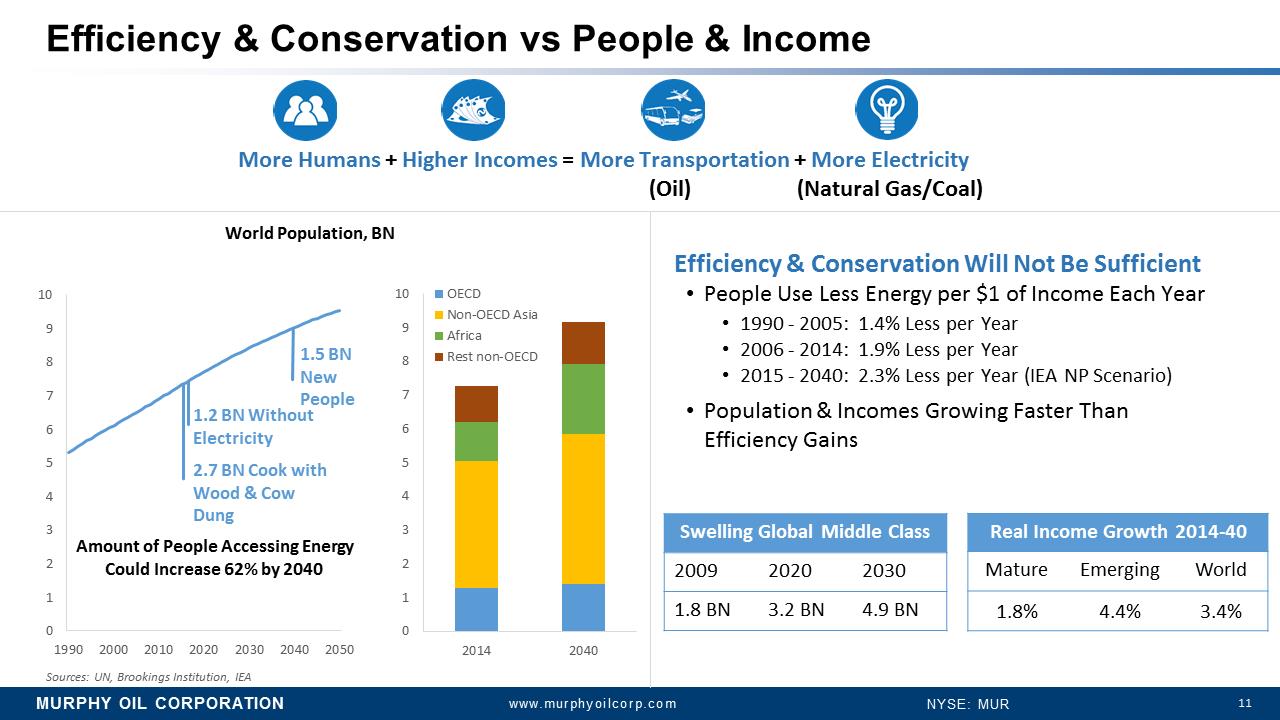
MURPHY OIL CORPORATION 11 www.murphyoilcorp.com NYSE: MUR Efficiency & Conservation vs People & Income More Humans + Higher Incomes = More Transportation + More Electricity (Oil) (Natural Gas/Coal) Swelling Global Middle Class 2009 2020 2030 1.8 BN 3.2 BN 4.9 BN Real Income Growth 2014-40 Mature Emerging World 1.8% 4.4% 3.4% Efficiency & Conservation Will Not Be Sufficient •People Use Less Energy per $1 of Income Each Year •1990 -2005: 1.4% Less per Year •2006 -2014: 1.9%Lessper Year •2015 -2040: 2.3%Lessper Year (IEA NP Scenario) •Population & Incomes Growing Faster Than Efficiency Gains Sources: UN, Brookings Institution, IEA 0 1 2 3 4 5 6 7 8 9 10 1990 2000 2010 2020 2030 2040 2050 1.5 BN New People 1.2 BN Without Electricity 2.7 BN Cook with Wood & Cow Dung Amount of People Accessing Energy Could Increase 62% by 2040 0 1 2 3 4 5 6 7 8 9 10 2014 2040 OECD Non-OECD Asia Africa Rest non-OECD World Population, BN
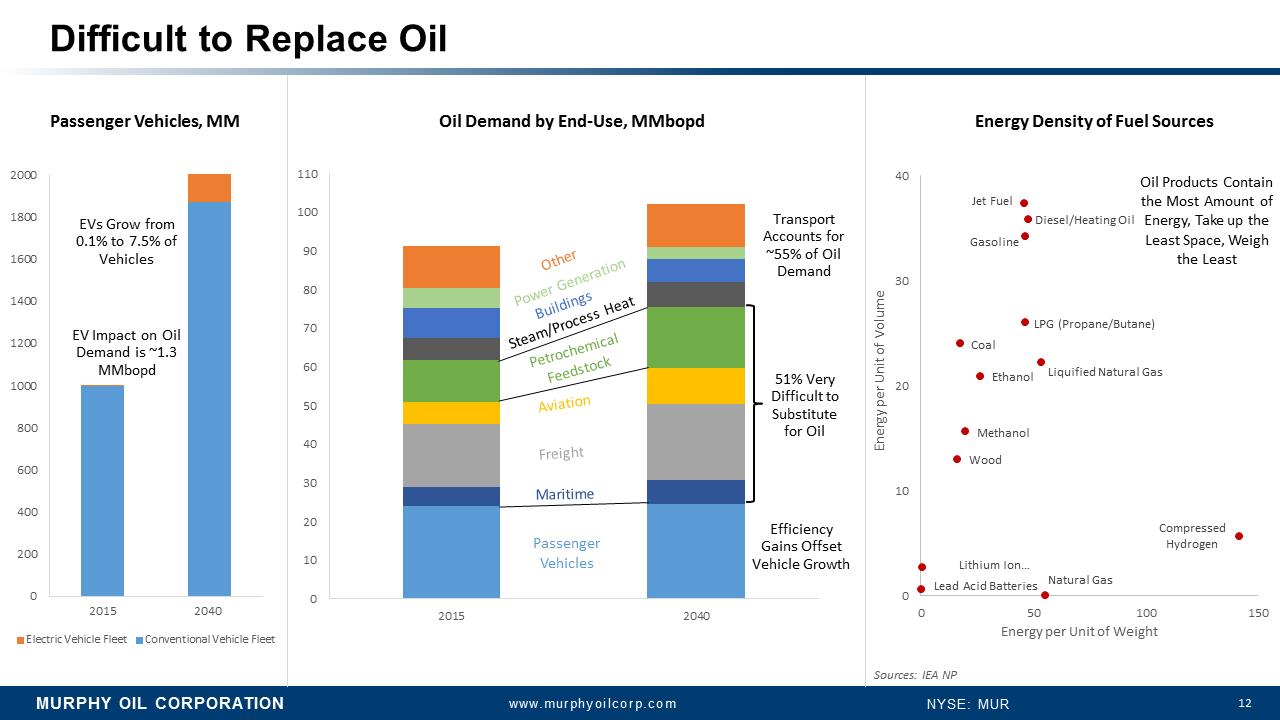
12 MURPHY OIL CORPORATION www.murphyoilcorp.com NYSE: MUR Passenger Vehicles Maritime Freight Aviation Petrochemical Feedstock 0 10 20 30 40 50 60 70 80 90 100 110 2015 2040 Steam/Process Heat Buildings Power Generation Other Difficult to Replace Oil �� Transport Accounts for ~55% of Oil Demand 0 200 400 600 800 1000 1200 1400 1600 1800 2000 Electric Vehicle Fleet Conventional Vehicle Fleet EV Impact on Oil Demand is ~1.3 MMbopd EVs Grow from 0.1% to 7.5% of Vehicles 2015 2040 Efficiency Gains Offset Vehicle Growth Sources: IEA NP 51% Very Difficult to Substitute for Oil Lithium Ion … Lead Acid Batteries Compressed Hydrogen Natural Gas Methanol Ethanol Liquified Natural Gas LPG (Propane/Butane) Gasoline Diesel/Heating Oil Jet Fuel Wood Coal 0 10 20 30 40 0 50 100 150 Energy per Unit of Volume Energy per Unit of Weight Oil Products Contain the Most Amount of Energy, Take up the Least Space, Weigh the Least Energy Density of Fuel Sources Oil Demand by End-Use, MMbopd Passenger Vehicles, MM
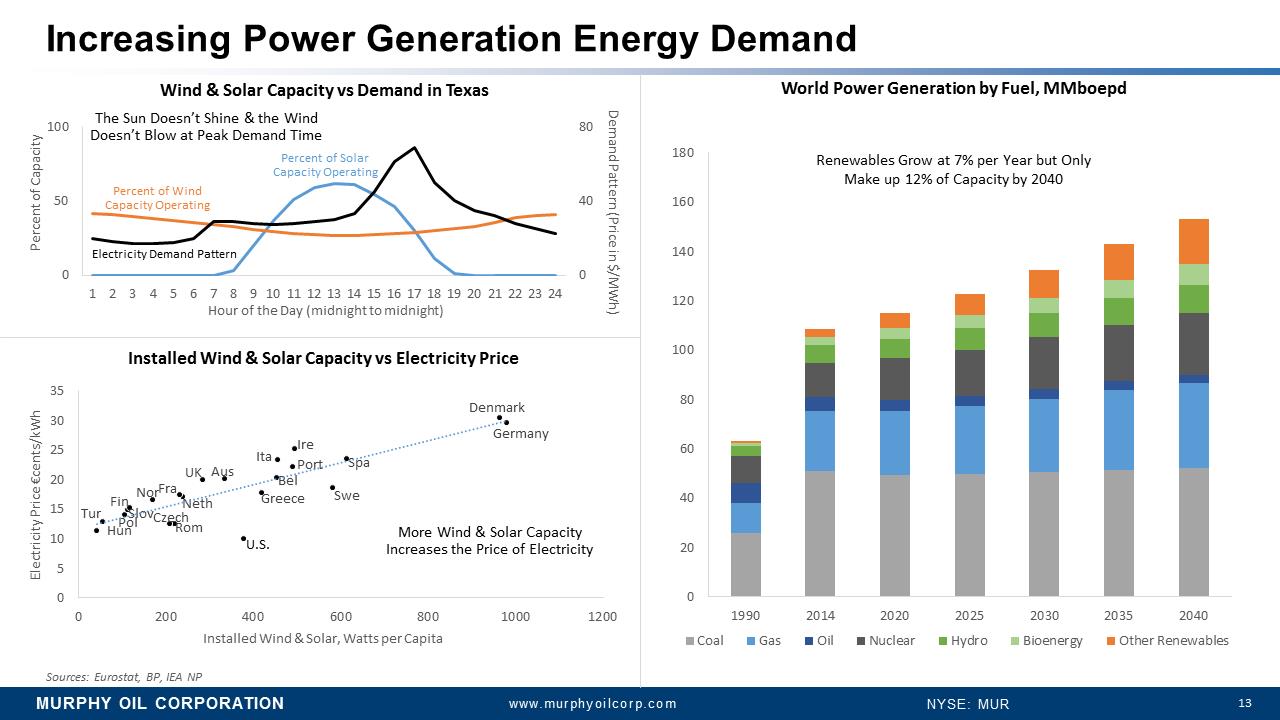
MURPHY OIL CORPORATION 13 www.murphyoilcorp.com NYSE: MUR Hun Tur Pol Slov Fin Nor Rom Czech Neth Fra UK Aus Greece Bel Port Ita Ire Swe Spa Denmark Germany 0 5 10 15 20 25 30 35 0 200 400 600 800 1000 1200 Electricity Price €cents/kWh U.S. 0 40 80 0 50 100 1 2 3 4 5 6 7 8 9 10 11 12 13 14 15 16 17 18 19 20 21 22 23 24 Percent of Capacity Hour of the Day (midnight to midnight) Percent of Solar Capacity Operating Percent of Wind Capacity Operating Electricity Demand Pattern Increasing Power Generation Energy Demand 0 20 40 60 80 100 120 140 160 180 1990 2014 2020 2025 2030 2035 2040 Coal Gas Oil Nuclear Hydro Bioenergy Other Renewables More Wind & Solar Capacity Increases the Price of Electricity The Sun Doesn’t Shine & the Wind Doesn’t Blow at Peak Demand Time Renewables Grow at 7% per Year but Only Make up 12% of Capacity by 2040 Sources: Eurostat, BP, IEA NP Demand Pattern (Price in $/MWh) Installed Wind & Solar, Watts per Capita Wind & Solar Capacity vs Demand in Texas Installed Wind & Solar Capacity vs Electricity Price World Power Generation by Fuel, MMboepd
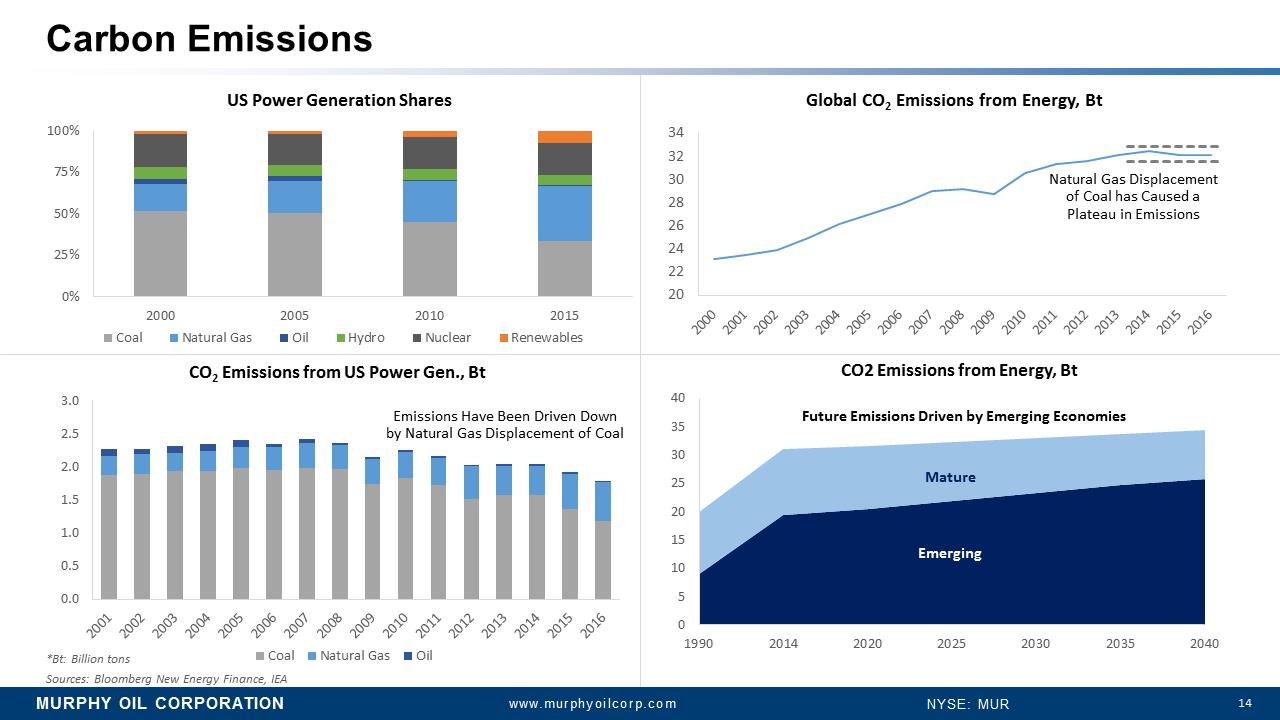
MURPHY OIL CORPORATION 14 www.murphyoilcorp.com NYSE: MUR Carbon Emissions 0% 25% 50% 75% 100% 2000 2005 2010 2015 Coal Natural Gas Oil Hydro Nuclear Renewables 0.0 0.5 1.0 1.5 2.0 2.5 3.0 2001 2002 2003 2004 2005 2006 2007 2008 2009 2010 2011 2012 2013 2014 2015 2016 Coal Natural Gas Oil 20 22 24 26 28 30 32 34 2000 2001 2002 2003 2004 2005 2006 2007 2008 2009 2010 2011 2012 2013 2014 2015 2016 Sources: Bloomberg New Energy Finance, IEA 0 5 10 15 20 25 30 35 40 1990 2014 2020 2025 2030 2035 2040 Mature Emerging Natural Gas Displacement of Coal has Caused a Plateau in Emissions Future Emissions Driven by Emerging Economies Emissions Have Been Driven Down by Natural Gas Displacement of Coal *Bt: Billion tons US Power Generation Shares Global CO2Emissions from Energy, Bt CO2 Emissions from Energy, Bt CO2Emissions from US Power Gen., Bt
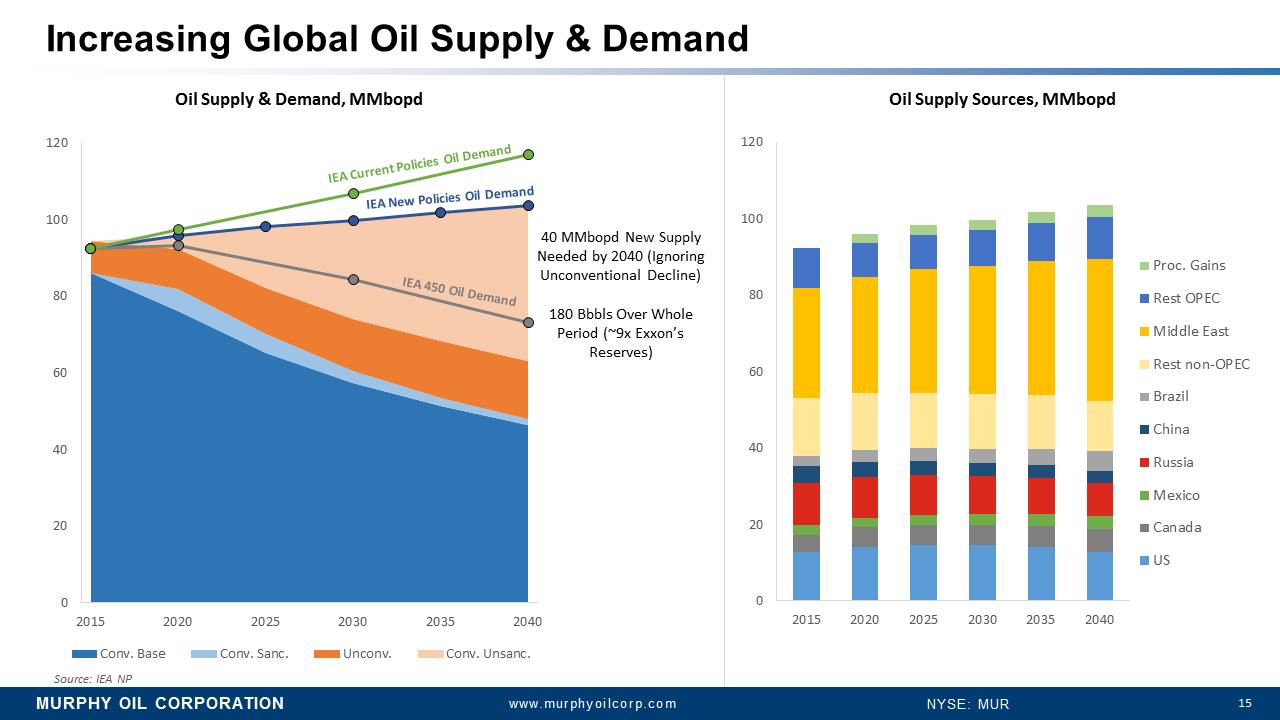
MURPHY OIL CORPORATION 15 www.murphyoilcorp.com NYSE: MUR Increasing Global Oil Supply & Demand Source: IEA NP 40 MMbopdNew Supply Needed by 2040 (Ignoring Unconventional Decline) 180 Bbbls Over Whole Period (~9x Exxon’s Reserves) 0 20 40 60 80 100 120 2015 2020 2025 2030 2035 2040 Conv. Base Conv. Sanc. Unconv. Conv. Unsanc. IEA New Policies Oil Demand IEA 450 Oil Demand IEA Current Policies Oil Demand 0 20 40 60 80 100 120 2015 2020 2025 2030 2035 2040 Proc. Gains Rest OPEC Middle East Rest non-OPEC Brazil China Russia Mexico Canada US Oil Supply & Demand, MMbopd Oil Supply Sources, MMbopd

MURPHY OIL CORPORATION 16 www.murphyoilcorp.com NYSE: MUR 21% 3% 54% 6% 16% Crude Oil NGLs Natural Gas Murphy Resources & Economics 2P Reserves & Risked Exploration 3.6 BNBOE2016 YE Onshore Liquids Break-Evens & Well Counts 322 759 864 293 175 795 0 200 400 600 800 1,000 <$30 $30-$35 $35-$40 $40-$45 $45-$50 >$50 Well Count WTI Break-Even Oil Price* ($/bbl) EFS Kaybob Placid $0 $2 $4 $6 $8 $10 $12 LOE ($/BOE) Source: Company Filings (CHK, COG, DVN, ECA, EOG, NFX, PXD, RRC, SWN, WLL, XEC) Note: Excludes Syncrude 0.0 0.5 1.0 1.5 2018 2019 2020 2021 2022 2023 2024 2025 2026 2027 2028 BCFD Montney Kaybob Placid Brunei Block H SK Gas N. Amer.Associated Net Risked Oil & Natural Gas Natural Gas in Murphy’s Long-Range Plan MUR Onshore 2016 Onshore E&P LOE $/BOE
MURPHY OIL CORPORATION 17 www.murphyoilcorp.com NYSE: MUR Oil & Natural Gas Vital Part of Energy Mix for Multi-Decades •Global Energy Demand Highly Likely to Continue to Grow •Oil & Natural Gas Will Be Needed to Enhance Lives of Growing Global Middle Class •Oil Has Unique Usefulness in Growing Heavy Transport and Petrochemicals •Natural Gas is the Lower-Carbon, Low-Cost Complement to Intermittent Renewables •Continued E&P Spending Will Be Required Primarily Due to Decline of Existing Wells Murphy Oil is Well-Positioned to Meet the World’s Energy Needs for Many Decades to Come With Its Diversified and Low-Cost Assets

MURPHY OIL CORPORATION www.murphyoilcorp.com NYSE: MUR 18 PORTFOLIO REVIEW BUSINESS UPDATE
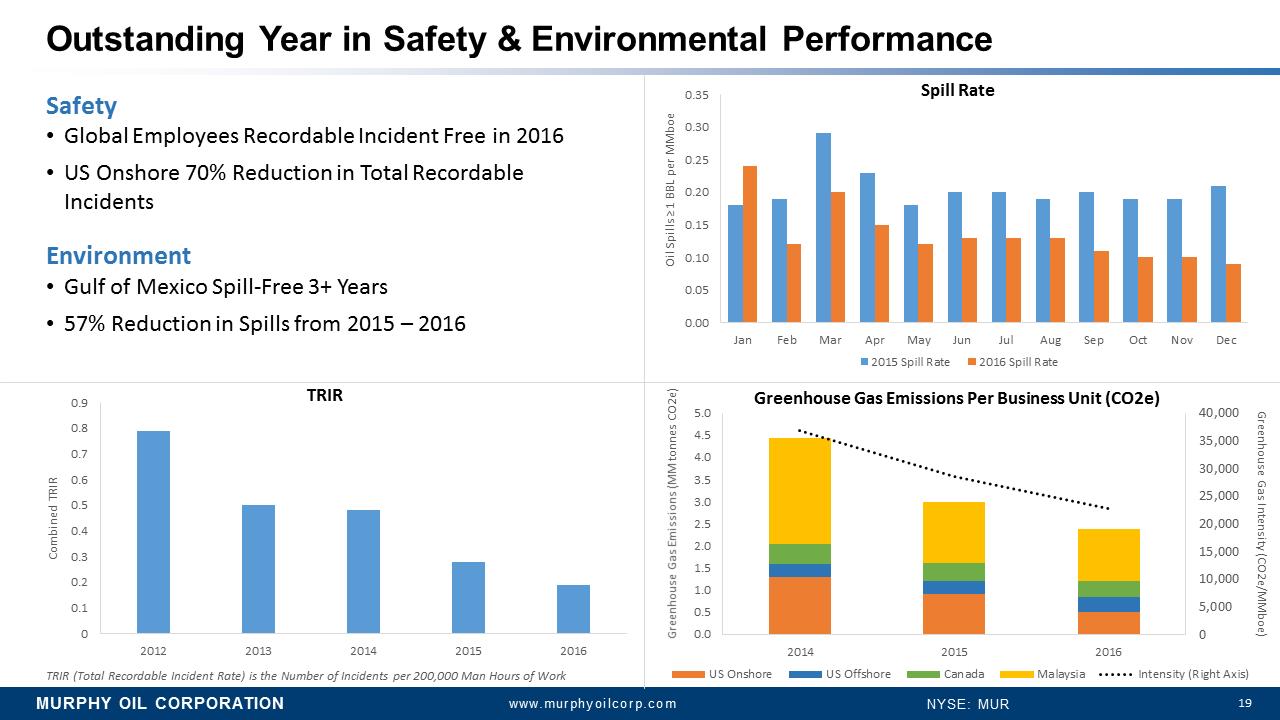
MURPHY OIL CORPORATION 19 www.murphyoilcorp.com NYSE: MUR 0.00 0.05 0.10 0.15 0.20 0.25 0.30 0.35 Jan Feb Mar Apr May Jun Jul Aug Sep Oct Nov Dec Oil Spills = 1 BBL per MMboe 2015 Spill Rate 2016 Spill Rate Outstanding Year in Safety & Environmental Performance Safety •Global Employees Recordable Incident Free in 2016 •US Onshore 70% Reduction in Total Recordable Incidents Environment •Gulf of Mexico Spill-Free 3+ Years •57% Reduction in Spills from 2015 –2016 0 5,000 10,000 15,000 20,000 25,000 30,000 35,000 40,000 0.0 0.5 1.0 1.5 2.0 2.5 3.0 3.5 4.0 4.5 5.0 2014 2015 2016 US Onshore US Offshore Canada Malaysia Intensity (Right Axis) Greenhouse Gas Emissions (MM tonnesCO2e) Greenhouse Gas Intensity (CO2e/MMboe) TRIR (Total Recordable Incident Rate) is the Number of Incidents per 200,000 Man Hours of Work Spill Rate Greenhouse Gas Emissions Per Business Unit (CO2e) TRIR 0 0.1 0.2 0.3 0.4 0.5 0.6 0.7 0.8 0.9 2012 2013 2014 2015 2016 Combined TRIR
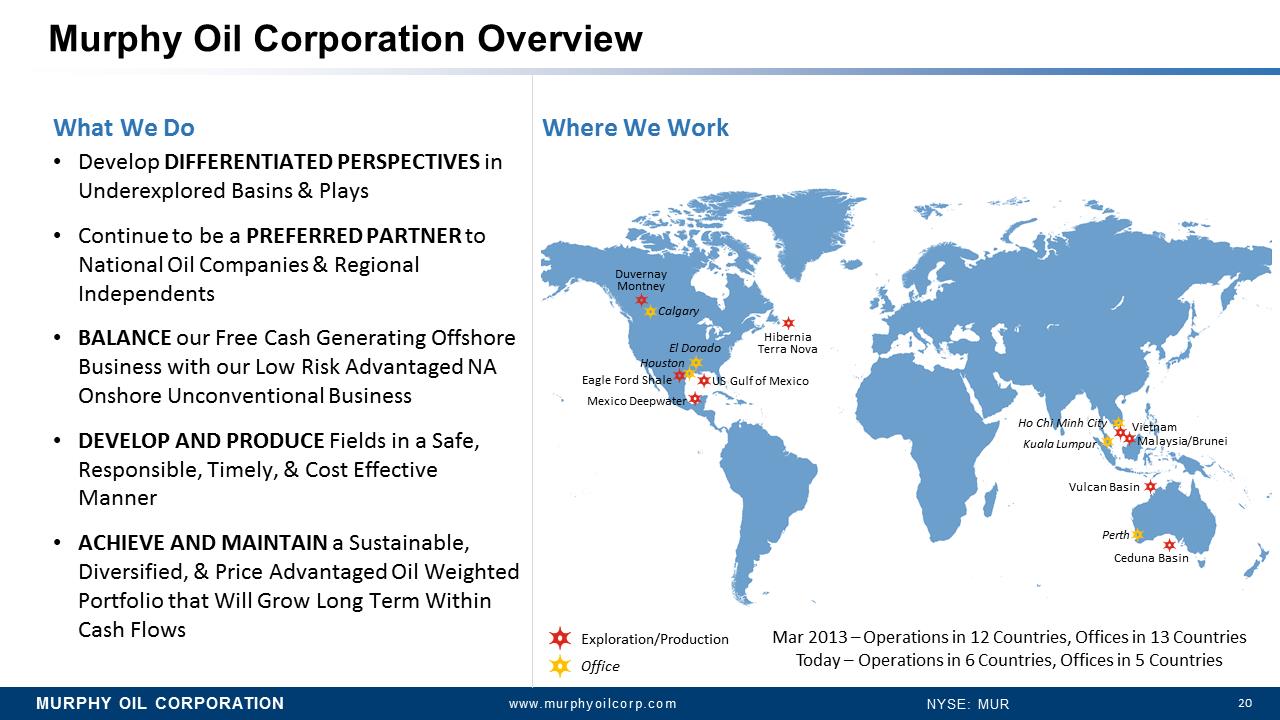
MURPHY OIL CORPORATION 20 www.murphyoilcorp.com NYSE: MUR Murphy Oil Corporation Overview What We Do •Develop DIFFERENTIATED PERSPECTIVES in Underexplored Basins & Plays •Continue to be a PREFERRED PARTNER to National Oil Companies & Regional Independents •BALANCEour Free Cash Generating Offshore Business with our Low Risk Advantaged NA Onshore Unconventional Business •DEVELOP AND PRODUCEFields in a Safe, Responsible, Timely, & Cost Effective Manner •ACHIEVE AND MAINTAIN a Sustainable, Diversified, & Price Advantaged Oil Weighted Portfolio that Will Grow Long Term Within Cash Flows Duvernay Montney Hibernia Terra Nova Eagle Ford Shale US Gulf of Mexico Malaysia/Brunei Ho Chi Minh City Perth Calgary El Dorado Kuala Lumpur Houston Mexico Deepwater Vietnam Vulcan Basin Ceduna Basin Exploration/Production Office Where We Work Mar 2013 –Operations in 12 Countries, Offices in 13 Countries Today –Operations in 6 Countries, Offices in 5 Countries
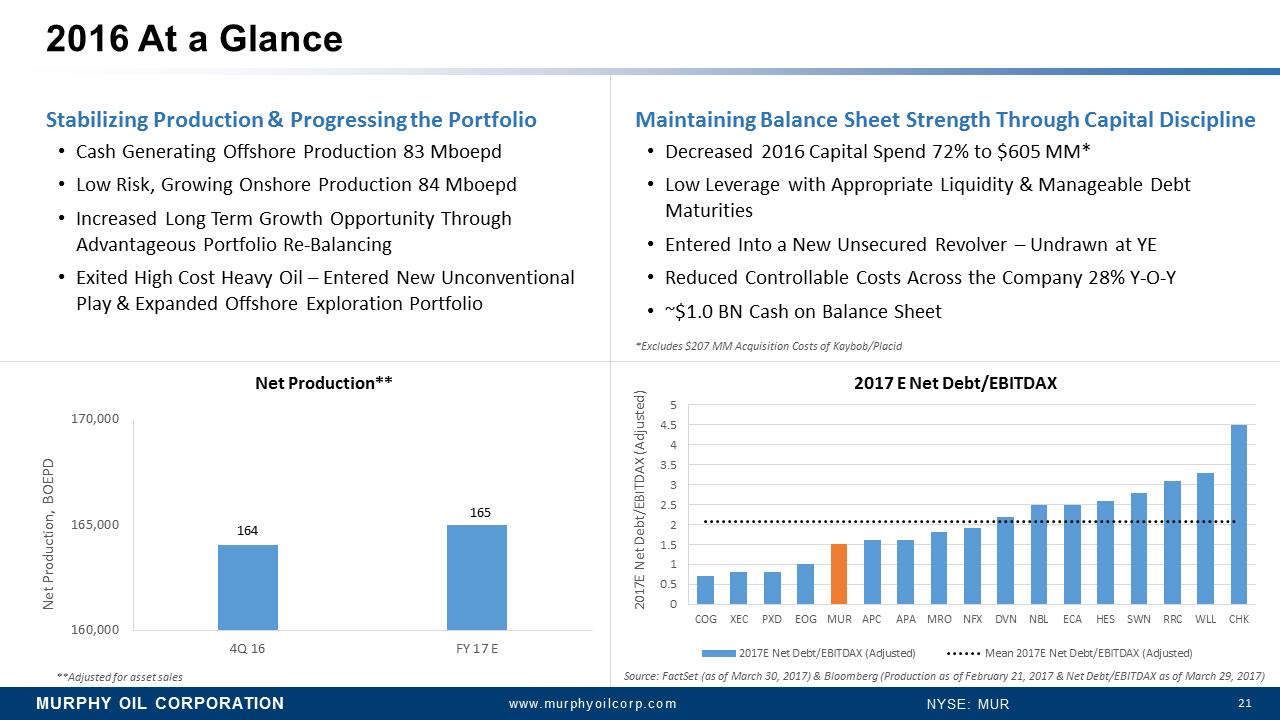
MURPHY OIL CORPORATION 21 www.murphyoilcorp.com NYSE: MUR 2016 At a Glance Stabilizing Production & Progressing the Portfolio •Cash Generating Offshore Production 83 Mboepd •Low Risk, Growing Onshore Production 84 Mboepd •Increased Long Term Growth Opportunity Through Advantageous Portfolio Re-Balancing •Exited High Cost Heavy Oil –Entered New Unconventional Play & Expanded Offshore Exploration Portfolio *Excludes $207 MM Acquisition Costs of Kaybob/Placid Maintaining Balance Sheet Strength Through Capital Discipline •Decreased 2016 Capital Spend 72% to $605 MM* •Low Leverage with Appropriate Liquidity & Manageable Debt Maturities •Entered Into a New Unsecured Revolver –Undrawn at YE •Reduced Controllable Costs Across the Company 28% Y-O-Y •~$1.0 BN Cash on Balance Sheet 160,000 165,000 170,000 4Q 16 FY 17 E Net Production, BOEPD 164 Net Production** **Adjusted for asset sales Source: FactSet(as of March 30, 2017) & Bloomberg (Production as of February 21, 2017 & Net Debt/EBITDAX as of March 29, 2017) 0 0.5 1 1.5 2 2.5 3 3.5 4 4.5 5 COG XEC PXD EOG MUR APC APA MRO NFX DVN NBL ECA HES SWN RRC WLL CHK 2017 E Net Debt/EBITDAX 2017E Net Debt/EBITDAX (Adjusted) Mean 2017E Net Debt/EBITDAX (Adjusted) 2017E Net Debt/EBITDAX (Adjusted) 165
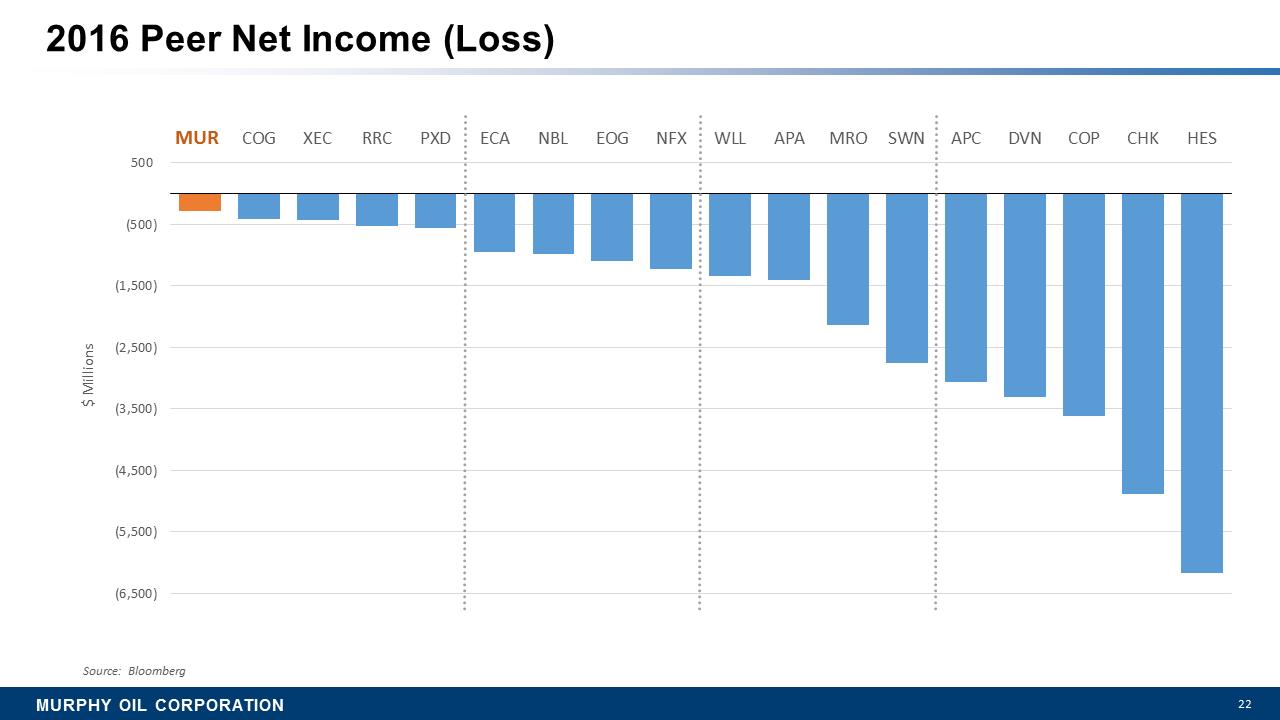
MURPHY OIL CORPORATION 22 2016 Peer Net Income (Loss) (6,500) (5,500) (4,500) (3,500) (2,500) (1,500) (500) 500 MUR COG XEC RRC PXD ECA NBL EOG NFX WLL APA MRO SWN APC DVN COP CHK HES $ Millions Source: Bloomberg
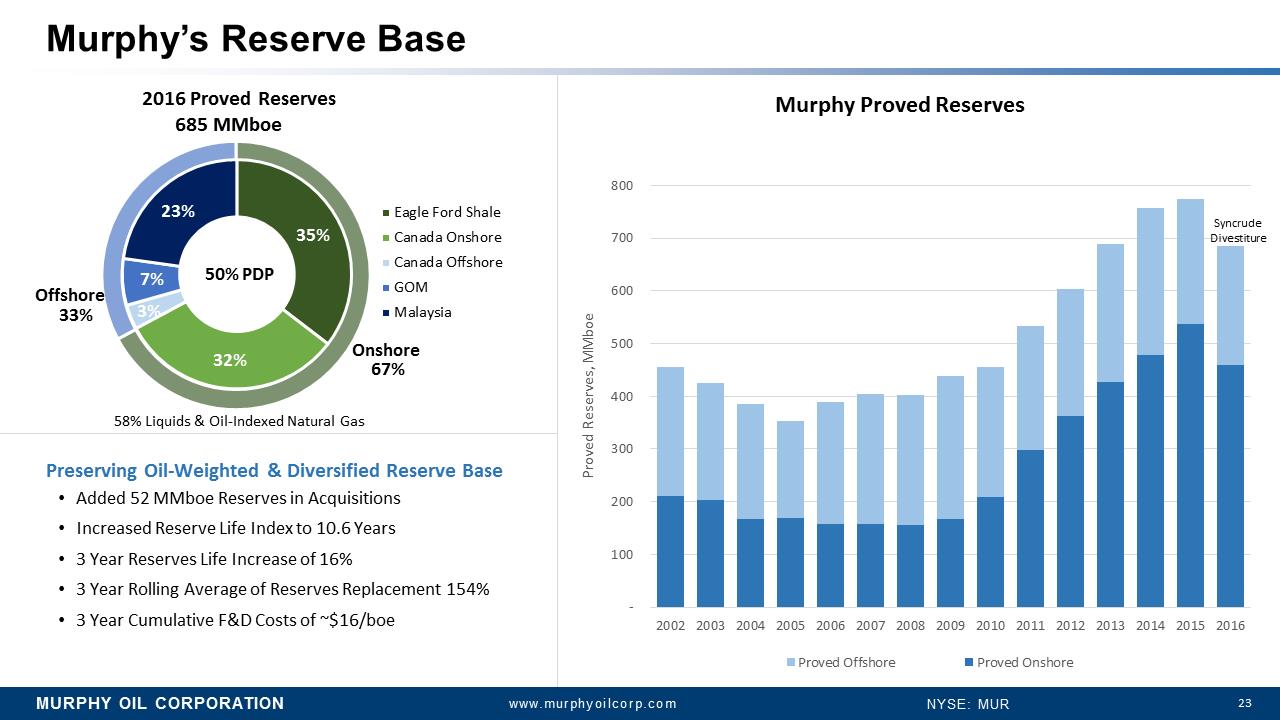
MURPHY OIL CORPORATION 23 www.murphyoilcorp.com NYSE: MUR 67% 33% 35% 32% 3% 7% 23% Eagle Ford Shale Canada Onshore Canada Offshore GOM Malaysia 2016 Proved Reserves 685 MMboe Murphy’s Reserve Base Onshore Offshore 50% PDP 58% Liquids & Oil-Indexed Natural Gas Preserving Oil-Weighted & Diversified Reserve Base •Added 52 MMboe Reserves in Acquisitions •Increased Reserve Life Index to 10.6 Years •3 Year Reserves Life Increase of 16% •3 Year Rolling Average of Reserves Replacement 154% •3 Year Cumulative F&D Costs of ~$16/boe - 100 200 300 400 500 600 700 800 2002 2003 2004 2005 2006 2007 2008 2009 2010 2011 2012 2013 2014 2015 2016 Proved Reserves, MMboe Murphy Proved Reserves Proved Offshore Proved Onshore Syncrude Divestiture
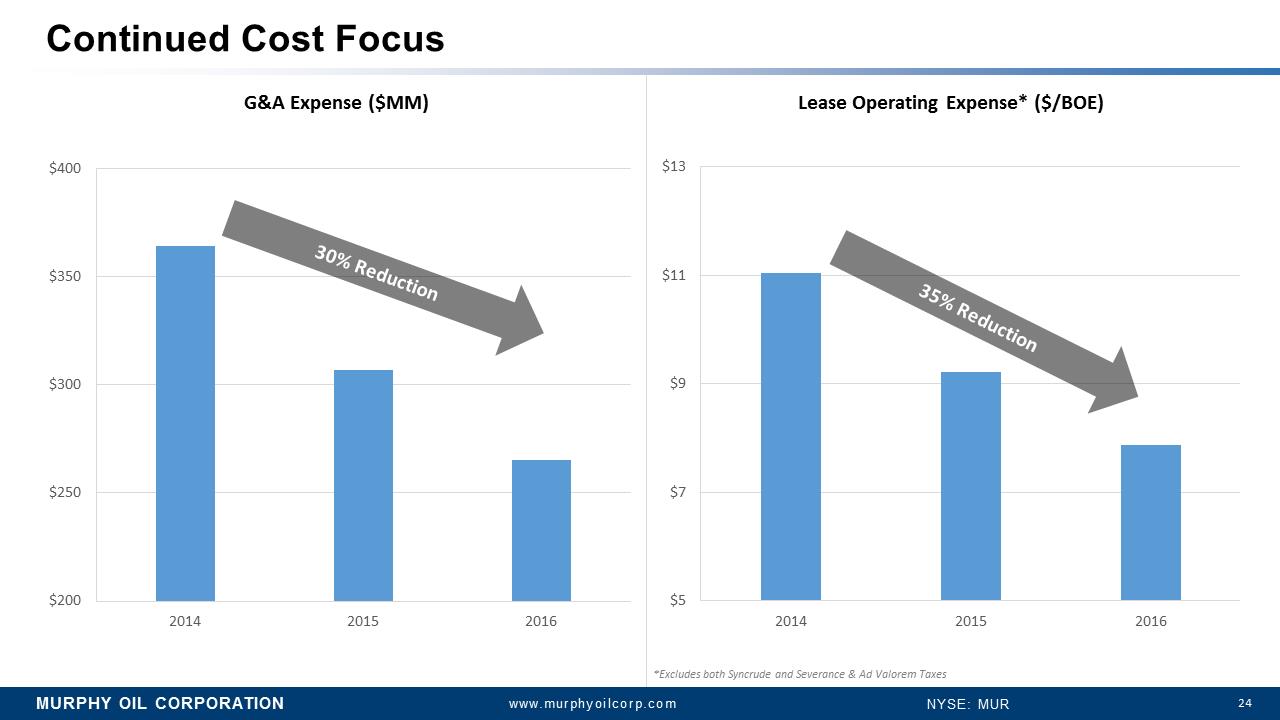
MURPHY OIL CORPORATION 24 www.murphyoilcorp.com NYSE: MUR Continued Cost Focus $5 $7 $9 $11 $13 2014 2015 2016 $200 $250 $300 $350 $400 2014 2015 2016 Lease Operating Expense* ($/BOE) *Excludes both Syncrude and Severance & Ad Valorem Taxes G&A Expense ($MM)
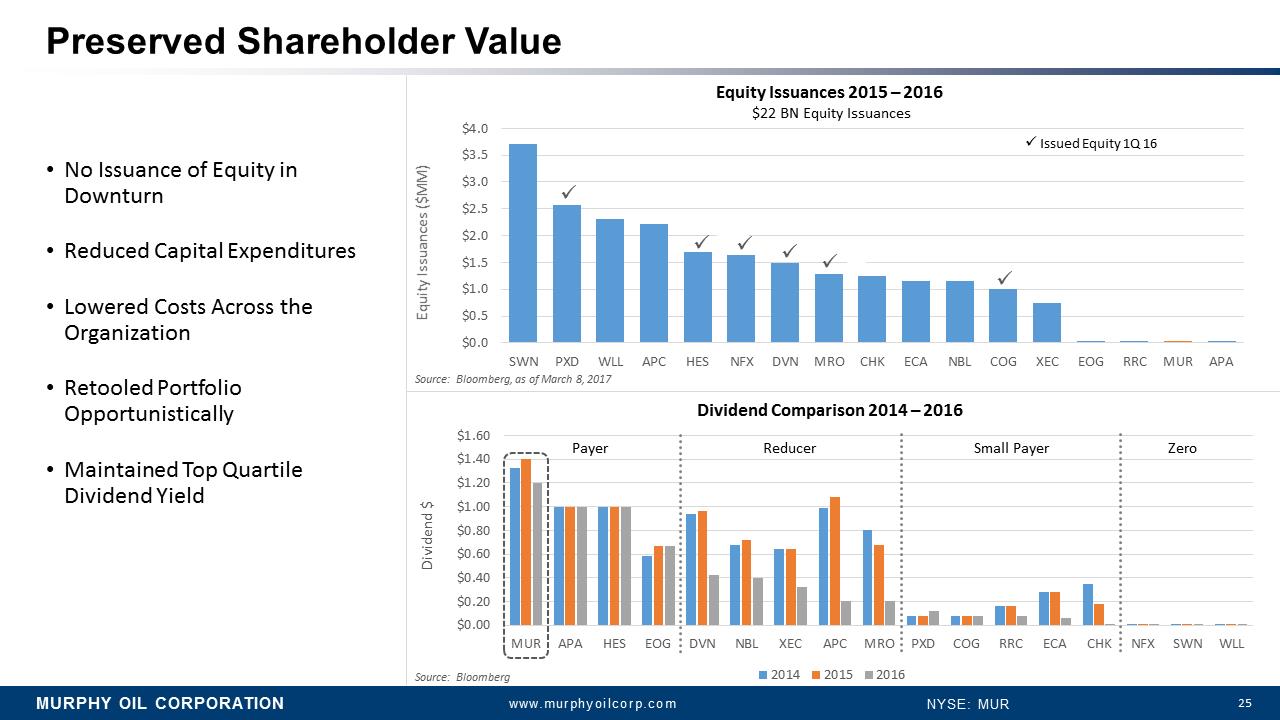
MURPHY OIL CORPORATION www.murphyoilcorp.com NYSE: MUR 25 $0.0 $0.5 $1.0 $1.5 $2.0 $2.5 $3.0 $3.5 $4.0 SWN PXD WLL APC HES NFX DVN MRO CHK ECA NBL COG XEC EOG RRC MUR APA Equity Issuances ($MM) Source: Bloomberg, as of March8, 2017 •No Issuance of Equity in Downturn •Reduced Capital Expenditures •Lowered Costs Across the Organization •Retooled Portfolio Opportunistically •Maintained Top Quartile Dividend Yield $0.00 $0.20 $0.40 $0.60 $0.80 $1.00 $1.20 $1.40 $1.60 MUR APA HES EOG DVN NBL XEC APC MRO PXD COG RRC ECA CHK NFX SWN WLL Dividend $ 2014 2015 2016 Source: Bloomberg Preserved Shareholder Value .I .I .I .I .I .I .Issued Equity 1Q 16 Payer Reducer Small Payer Zero Dividend Comparison 2014 –2016 Equity Issuances 2015 –2016 $22 BN Equity Issuances
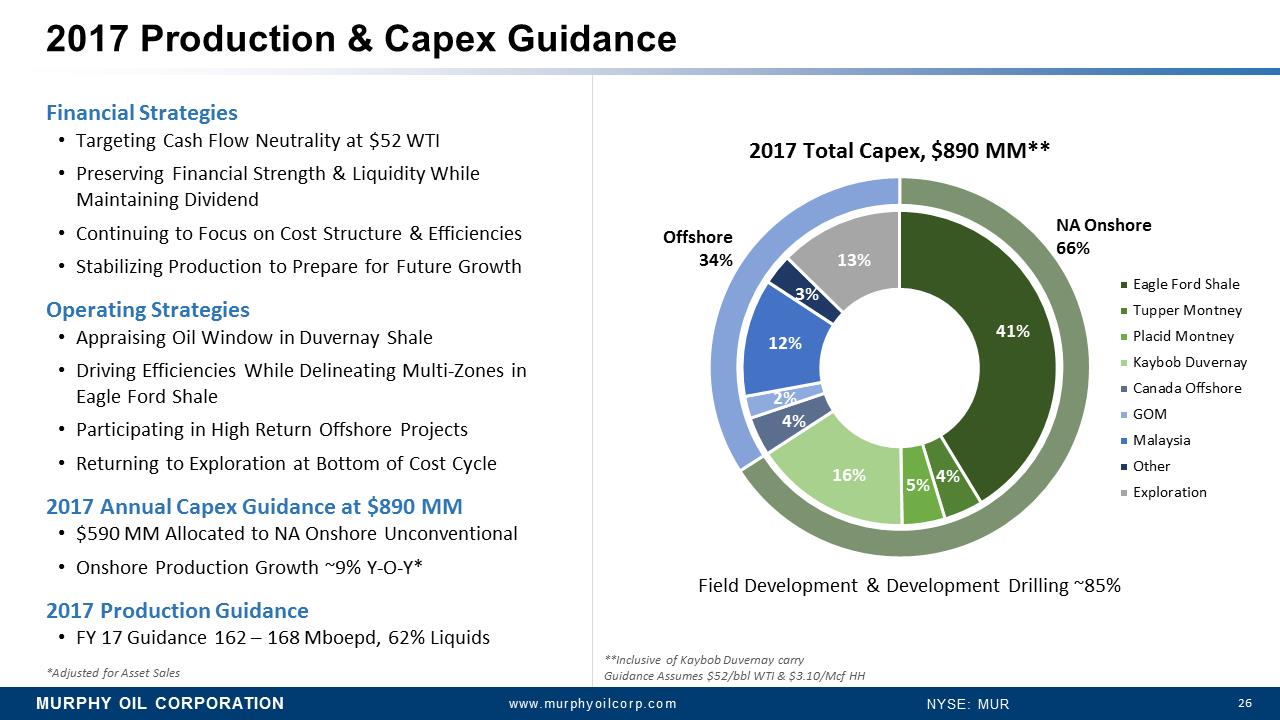
MURPHY OIL CORPORATION 26 www.murphyoilcorp.com NYSE: MUR 41% 4% 5% 16% 4% 2% 12% 3% 13% Eagle Ford Shale Tupper Montney Placid Montney Kaybob Duvernay Canada Offshore GOM Malaysia Other Exploration 2017 Total Capex, $890 MM** NA Onshore 66% Offshore 34% Field Development & Development Drilling ~85% **Inclusive of Kaybob Duvernay carry Guidance Assumes $52/bblWTI & $3.10/McfHH *Adjusted for AssetSales Financial Strategies •Targeting Cash Flow Neutrality at $52 WTI •Preserving Financial Strength & Liquidity While Maintaining Dividend •Continuing to Focus on Cost Structure & Efficiencies •Stabilizing Production to Prepare for Future Growth Operating Strategies •Appraising Oil Window in Duvernay Shale •Driving Efficiencies While Delineating Multi-Zones in Eagle Ford Shale •Participating in High Return Offshore Projects •Returning to Exploration at Bottom of Cost Cycle 2017 Annual Capex Guidance at $890 MM •$590 MM Allocated to NA Onshore Unconventional •Onshore Production Growth ~9% Y-O-Y* 2017 Production Guidance •FY 17 Guidance 162 –168 Mboepd, 62% Liquids 2017 Production & Capex Guidance

ONSHORE PORTFOLIO REVIEW
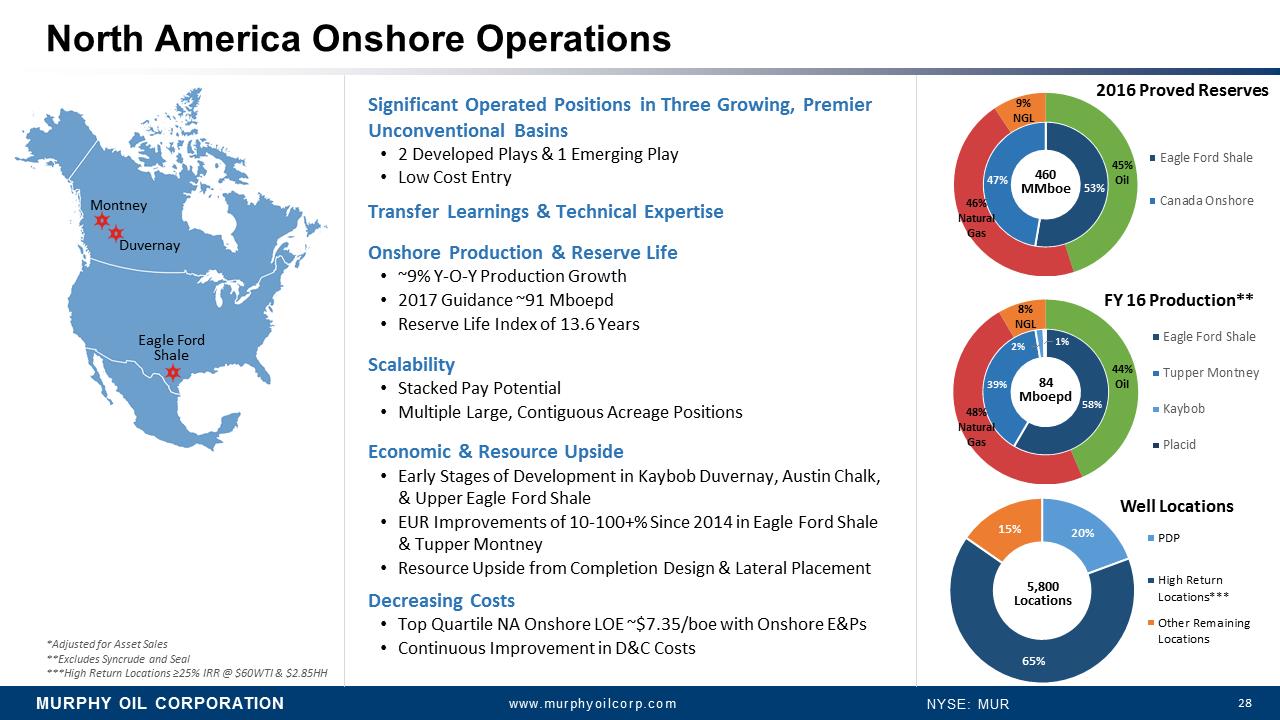
MURPHY OIL CORPORATION www.murphyoilcorp.com NYSE: MUR 28 North America Onshore Operations Significant Operated Positions in Three Growing, Premier Unconventional Basins •2 Developed Plays & 1 Emerging Play •Low Cost Entry Transfer Learnings & Technical Expertise Onshore Production & Reserve Life •~9% Y-O-Y Production Growth •2017 Guidance ~91 Mboepd •Reserve Life Index of 13.6 Years Scalability •Stacked Pay Potential •Multiple Large, Contiguous Acreage Positions Economic & Resource Upside •Early Stages of Development in Kaybob Duvernay, Austin Chalk, & Upper Eagle Ford Shale •EUR Improvements of 10-100+% Since 2014 in Eagle Ford Shale & Tupper Montney •Resource Upside from Completion Design & Lateral Placement Decreasing Costs •Top Quartile NA Onshore LOE ~$7.35/boe with Onshore E&Ps •Continuous Improvement in D&C Costs Montney Duvernay Eagle Ford Shale 58% 39% 2% 1% 44% Oil 48% Natural Gas 8% NGL Eagle Ford Shale Tupper Montney Kaybob Placid 53% 47% 45% Oil 46% Natural Gas 9% NGL Eagle Ford Shale Canada Onshore 460 MMboe *Adjusted for Asset Sales **Excludes Syncrudeand Seal ***High Return Locations =25% IRR @ $60WTI & $2.85HH 20% 65% 15% PDP High Return Locations*** Other Remaining Locations 5,800 Locations Well Locations 2016 Proved Reserves FY 16 Production** 84 Mboepd
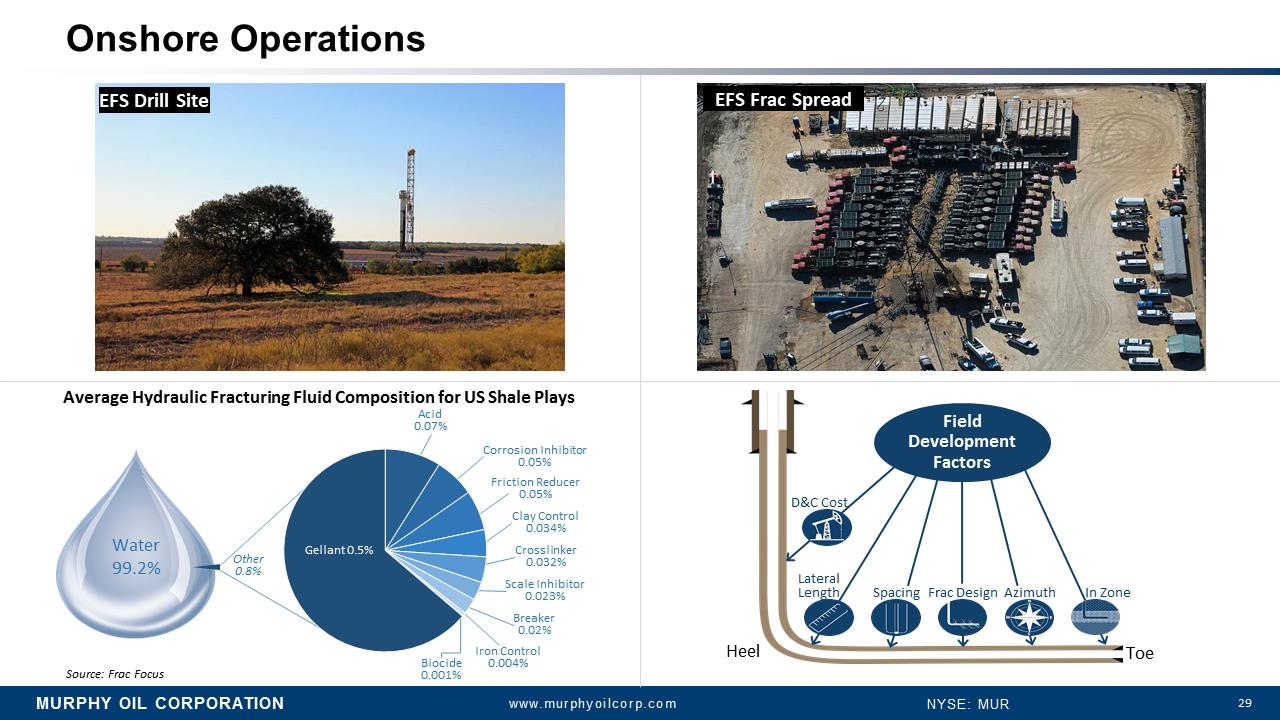
MURPHY OIL CORPORATION www.murphyoilcorp.com NYSE: MUR 29 Onshore Operations Water 99.2% Acid 0.07% Corrosion Inhibitor 0.05% Friction Reducer 0.05% Clay Control 0.034% Crosslinker 0.032% Scale Inhibitor 0.023% Breaker 0.02% Iron Control 0.004% Biocide 0.001% Gellant 0.5% Other 0.8% Average Hydraulic Fracturing Fluid Composition for US Shale Plays Source: Frac Focus Frac Design Lateral Length Toe Heel
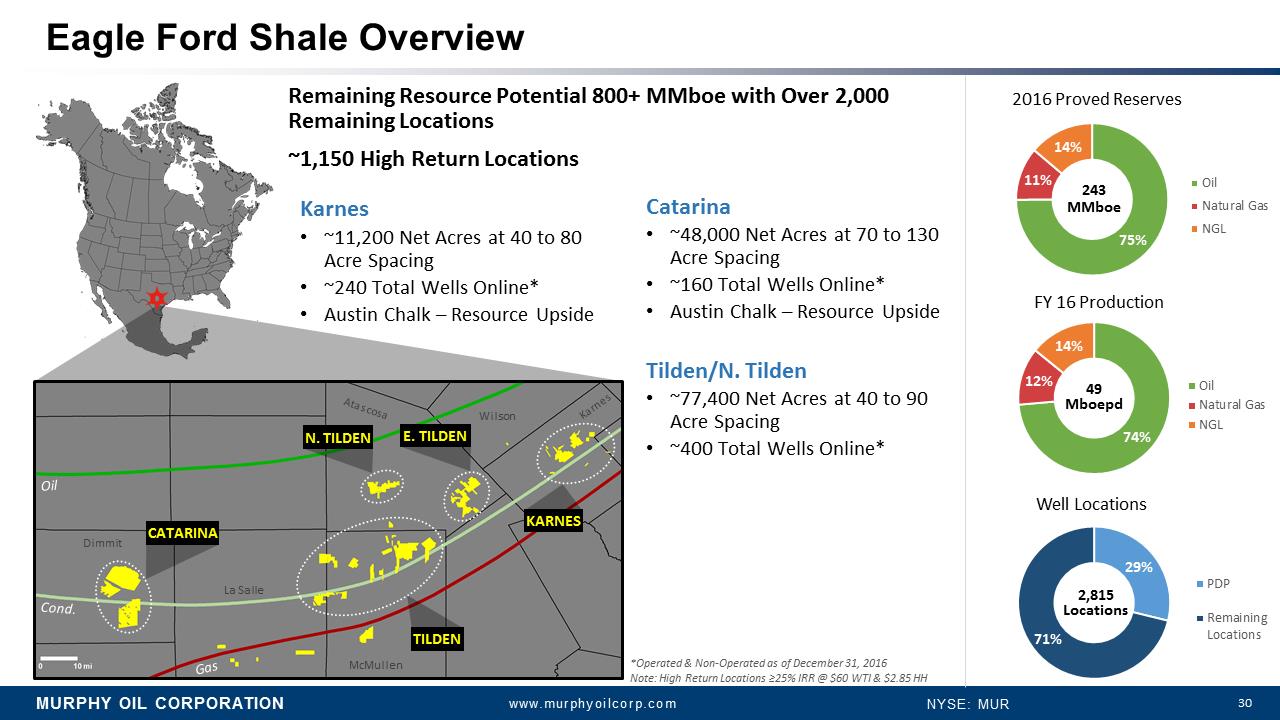
MURPHY OIL CORPORATION www.murphyoilcorp.com NYSE: MUR 30 Eagle Ford Shale Overview Oil Cond. Gas La Salle Atascosa McMullen Karnes Wilson Dimmit 74% 12% 14% Oil Natural Gas NGL 49 Mboepd FY 16 Production *Operated & Non-Operated as of December 31, 2016 Note: High Return Locations =25% IRR @ $60 WTI & $2.85 HH 75% 11% 14% 2016 Proved Reserves Oil Natural Gas NGL 243 MMboe 29% 71% Well Locations PDP Remaining Locations 2,815 Locations Remaining Resource Potential 800+ MMboewith Over 2,000 Remaining Locations ~1,150 High Return Locations Karnes •~11,200 Net Acres at 40 to 80 Acre Spacing •~240 Total Wells Online* •Austin Chalk –Resource Upside Catarina •~48,000 Net Acres at 70 to 130 Acre Spacing •~160 Total Wells Online* •Austin Chalk –Resource Upside Tilden/N. Tilden •~77,400 Net Acres at 40 to 90 Acre Spacing •~400 Total Wells Online*
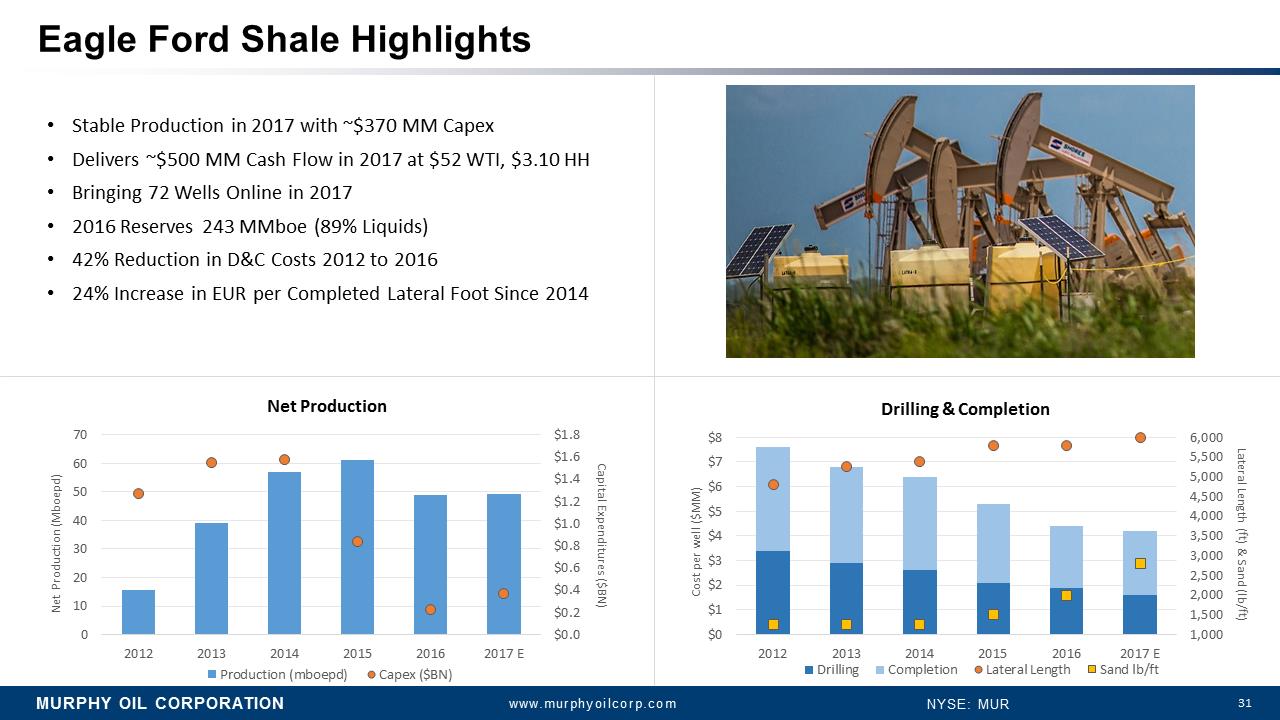
MURPHY OIL CORPORATION www.murphyoilcorp.com NYSE: MUR 31 Eagle Ford Shale Highlights $0.0 $0.2 $0.4 $0.6 $0.8 $1.0 $1.2 $1.4 $1.6 $1.8 0 10 20 30 40 50 60 70 2012 2013 2014 2015 2016 2017 E Capital Expenditures ($BN) Net Production (Mboepd) Net Production Production (mboepd) Capex ($BN) •Stable Production in 2017 with ~$370 MM Capex •Delivers ~$500 MM Cash Flow in 2017 at $52 WTI, $3.10 HH •Bringing 72 Wells Online in 2017 •2016 Reserves 243 MMboe (89% Liquids) •42% Reduction in D&C Costs 2012 to 2016 •24% Increase in EUR per Completed Lateral Foot Since 2014 1,000 1,500 2,000 2,500 3,000 3,500 4,000 4,500 5,000 5,500 6,000 $0 $1 $2 $3 $4 $5 $6 $7 $8 2012 2013 2014 2015 2016 2017 E Lateral Length (ft) & Sand (lb/ft) Cost per well ($MM) Drilling & Completion Drilling Completion Lateral Length Sand lb/ft
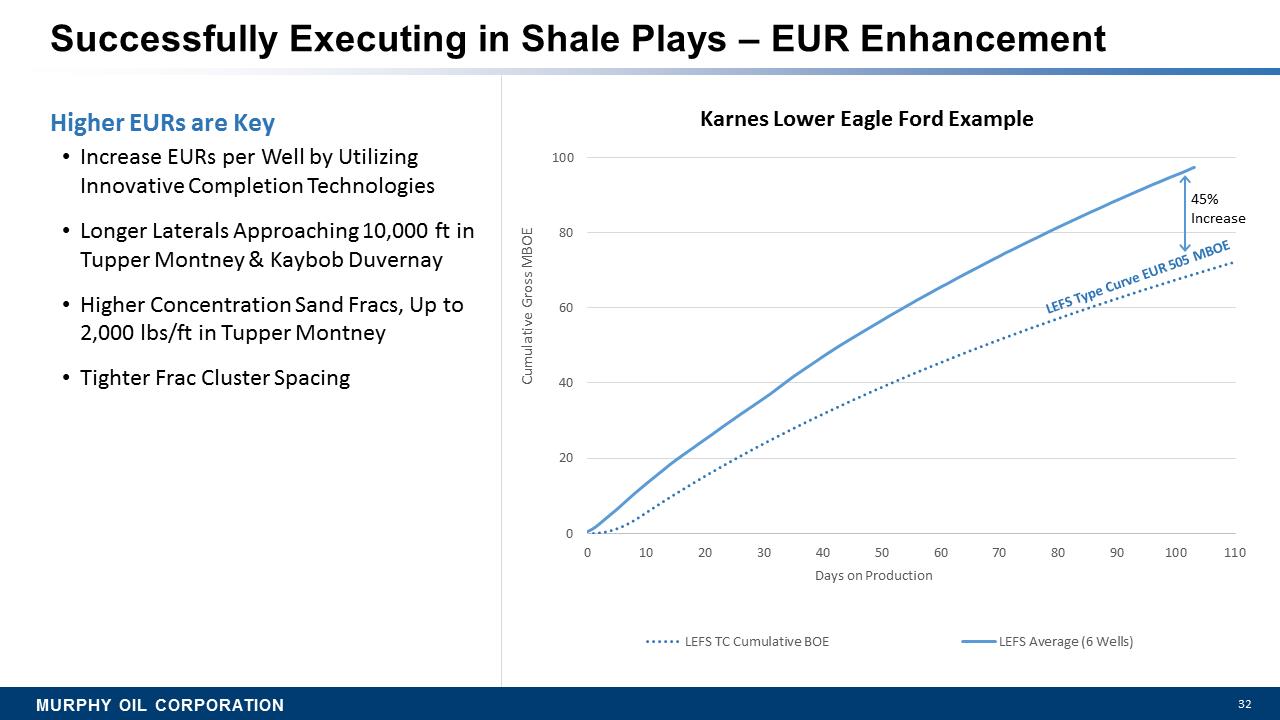
MURPHY OIL CORPORATION 32 Successfully Executing in Shale Plays –EUR Enhancement Higher EURs are Key •Increase EURs per Well by Utilizing Innovative Completion Technologies •Longer Laterals Approaching 10,000 ft in Tupper Montney & Kaybob Duvernay •Higher Concentration Sand Fracs, Up to 2,000 lbs/ft in Tupper Montney •Tighter Frac Cluster Spacing 0 20 40 60 80 100 0 10 20 30 40 50 60 70 80 90 100 110 Cumulative Gross MBOE Days on Production Karnes Lower Eagle Ford Example LEFS TC Cumulative BOE LEFS Average (6 Wells) LEFS Type Curve EUR 505 MBOE 45% Increase
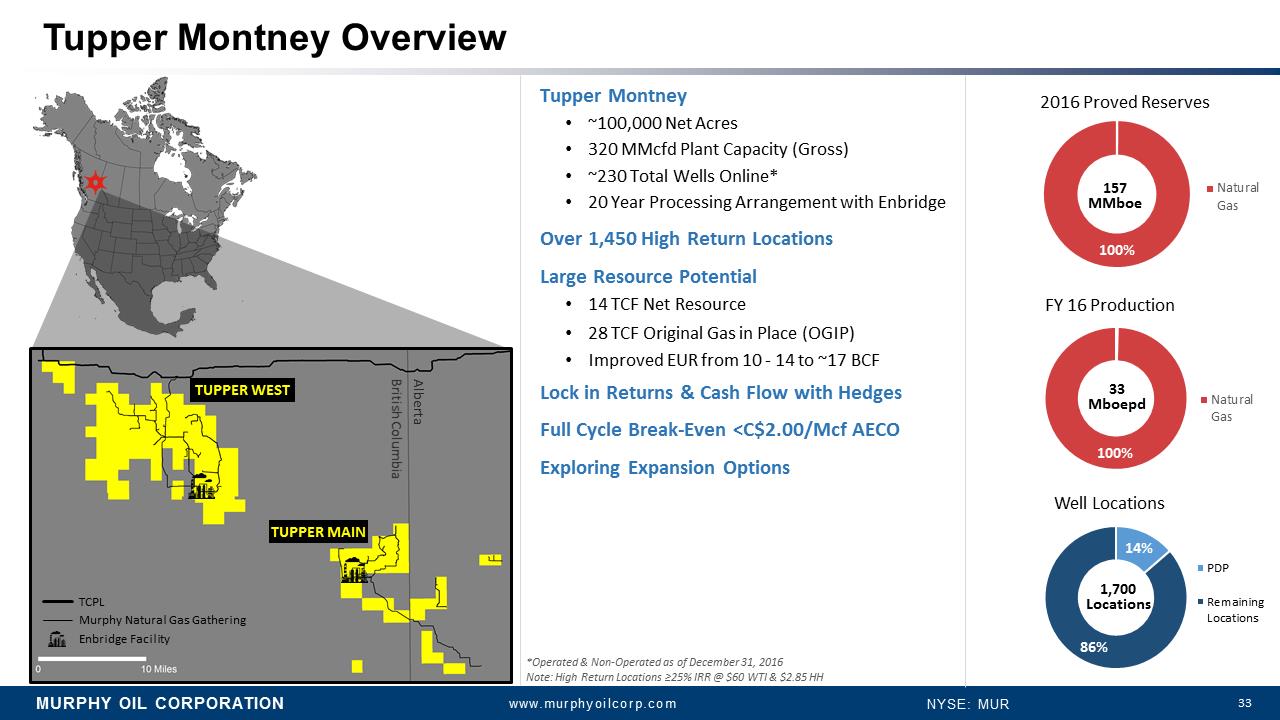
MURPHY OIL CORPORATION www.murphyoilcorp.com NYSE: MUR 33 Tupper Montney Overview British Columbia Alberta TCPL Murphy Natural Gas Gathering Enbridge Facility 100% 2016 Proved Reserves NaturalGas 157 MMboe 100% NaturalGas 33 Mboepd FY 16 Production 14% 86% PDP Remaining Locations 1,700 Locations Well Locations Tupper Montney •~100,000 Net Acres •320 MMcfdPlant Capacity (Gross) •~230 Total Wells Online* •20 Year Processing Arrangement with Enbridge Over 1,450 High Return Locations Large Resource Potential •14 TCF Net Resource •28 TCF Original Gas in Place (OGIP) •Improved EUR from 10 -14 to ~17 BCF Lock in Returns & Cash Flow with Hedges Full Cycle Break-Even <C$2.00/McfAECO Exploring Expansion Options *Operated & Non-Operated as of December 31, 2016 Note: High Return Locations =25% IRR @ $60 WTI & $2.85 HH
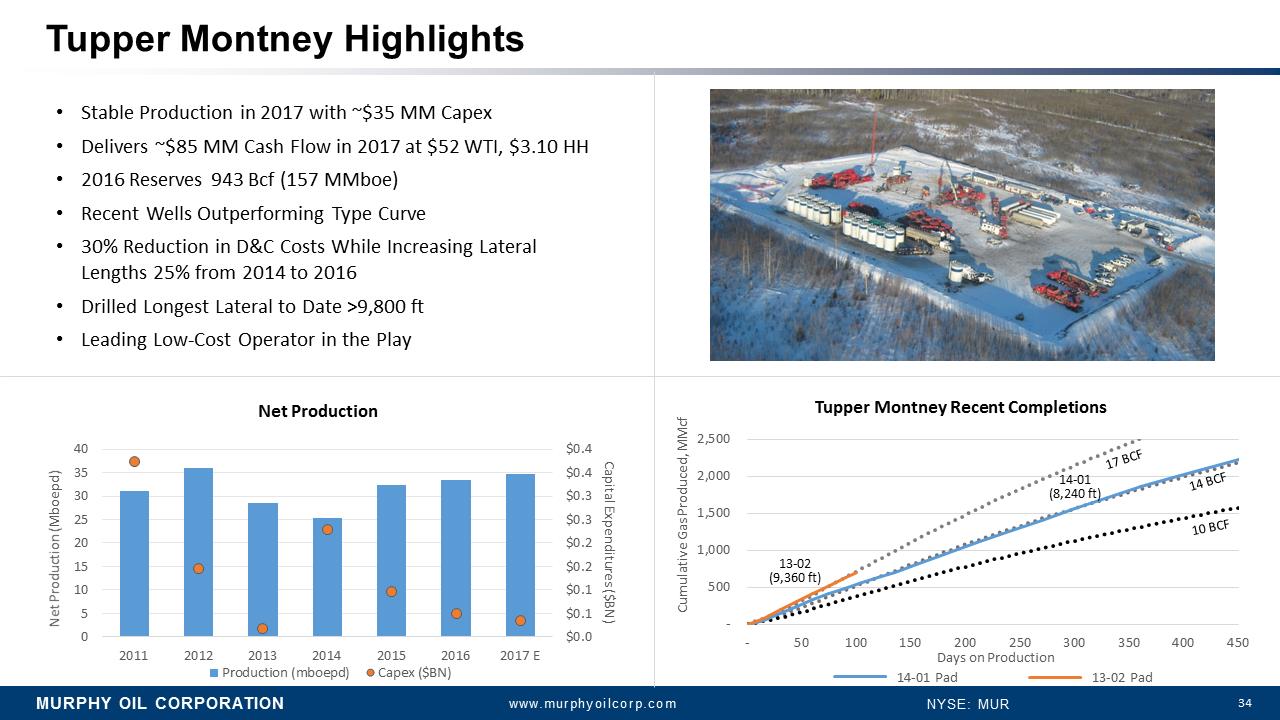
MURPHY OIL CORPORATION www.murphyoilcorp.com NYSE: MUR 34 Tupper MontneyHighlights $0.0 $0.1 $0.1 $0.2 $0.2 $0.3 $0.3 $0.4 $0.4 0 5 10 15 20 25 30 35 40 2011 2012 2013 2014 2015 2016 2017 E Capital Expenditures ($BN) Net Production (Mboepd) Net Production Production (mboepd) Capex ($BN) •Stable Production in 2017 with ~$35 MM Capex •Delivers ~$85 MM Cash Flow in 2017 at $52 WTI, $3.10 HH •2016 Reserves 943 Bcf (157 MMboe) •Recent Wells Outperforming Type Curve •30% Reduction in D&C Costs While Increasing Lateral Lengths 25% from 2014 to 2016 •Drilled Longest Lateral to Date >9,800 ft •Leading Low-Cost Operator in the Play - 500 1,000 1,500 2,000 2,500 - 50 100 150 200 250 300 350 400 450 Cumulative Gas Produced, MMcf Days on Production Tupper MontneyRecent Completions 14-01 Pad 13-02 Pad 13-02 (9,360 ft) 17 BCF 14 BCF 10 BCF 14-01 (8,240ft)
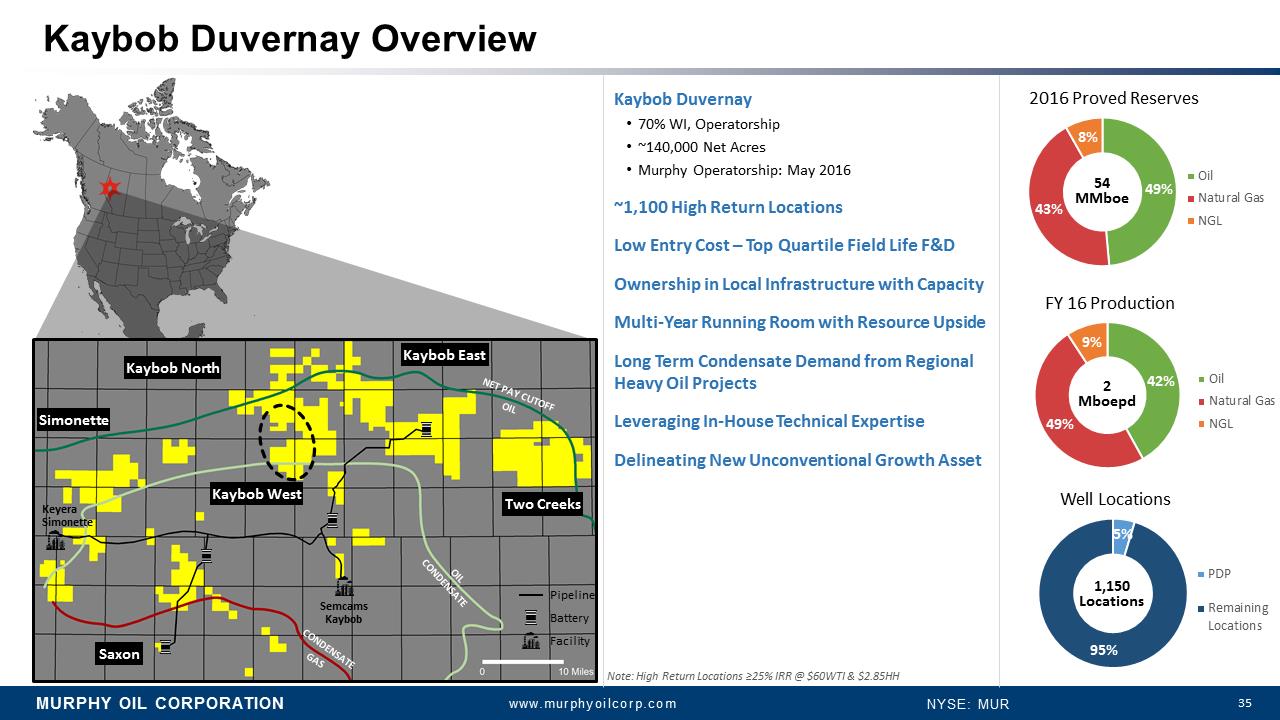
MURPHY OIL CORPORATION www.murphyoilcorp.com NYSE: MUR 35 49% 43% 8% 2016 Proved Reserves Oil Natural Gas NGL 54 MMboe KaybobDuvernay Overview Kaybob Duvernay •70% WI, Operatorship •~140,000 Net Acres •Murphy Operatorship: May 2016 ~1,100 High Return Locations Low Entry Cost –Top Quartile Field Life F&D Ownership in Local Infrastructure with Capacity Multi-Year Running Room with Resource Upside Long Term Condensate Demand from Regional Heavy Oil Projects Leveraging In-House Technical Expertise Delineating New Unconventional Growth Asset 42% 49% 9% Oil Natural Gas NGL 2 Mboepd FY 16 Production Note: High Return Locations =25% IRR @ $60WTI & $2.85HH 5% 95% PDP RemainingLocations 1,150 Locations Well Locations Keyera Simonette Semcams Kaybob Battery Facility Pipeline GAS CONDENSATE OIL CONDENSATE OIL NET PAY CUTOFF
MURPHY OIL CORPORATION www.murphyoilcorp.com NYSE: MUR 36 OFFSHORE PORTFOLIO REVIEW
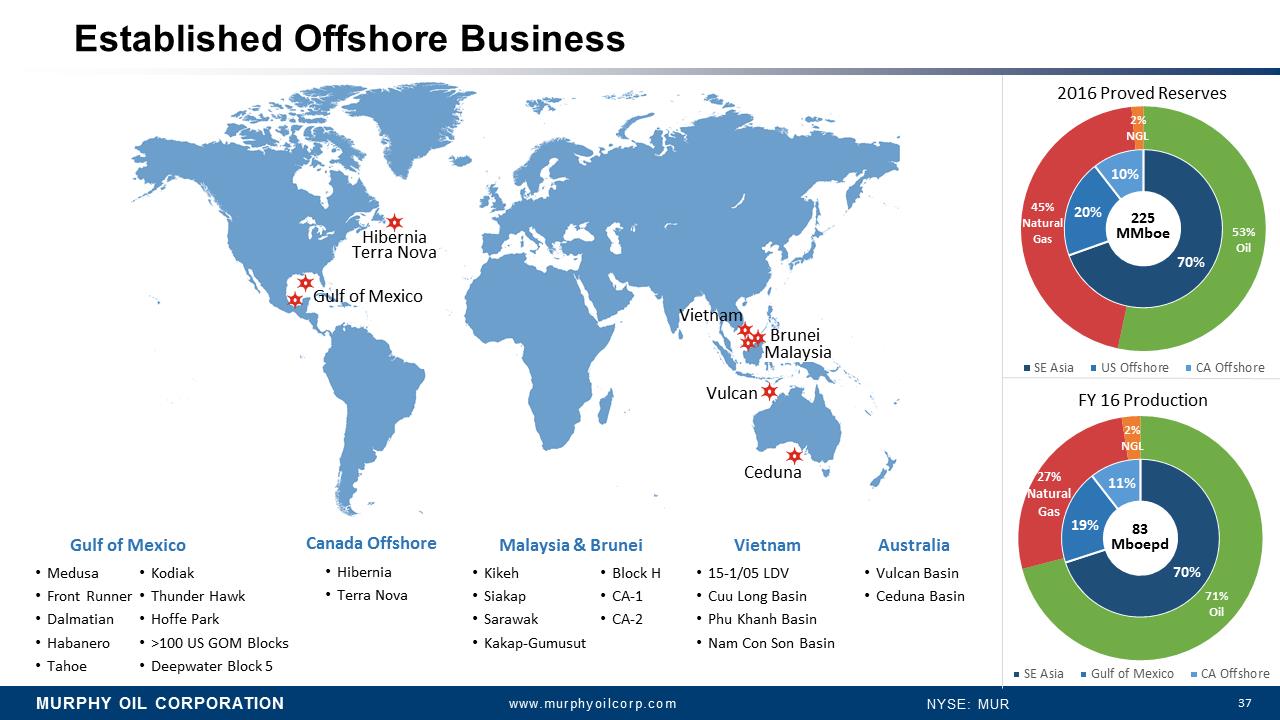
MURPHY OIL CORPORATION www.murphyoilcorp.com NYSE: MUR 37 70% 19% 11% 71% Oil 27% Natural Gas 2% NGL SE Asia Gulf of Mexico CA Offshore 83 Mboepd FY 16 Production Hibernia Terra Nova Gulf of Mexico 70% 20% 10% 53% Oil 45% Natural Gas 2% NGL 2016 Proved Reserves SE Asia US Offshore CA Offshore 225 MMboe Vietnam •Medusa •Front Runner •Dalmatian •Habanero •Tahoe •Kodiak •Thunder Hawk •Hoffe Park •>100 US GOM Blocks •Deepwater Block 5 Gulf of Mexico •Hibernia •Terra Nova Canada Offshore Malaysia & Brunei •Kikeh •Siakap •Sarawak •Kakap-Gumusut •BlockH •CA-1 •CA-2 •15-1/05 LDV •Cuu Long Basin •PhuKhanhBasin •Nam Con Son Basin Vietnam •Vulcan Basin •Ceduna Basin Australia Established Offshore Business
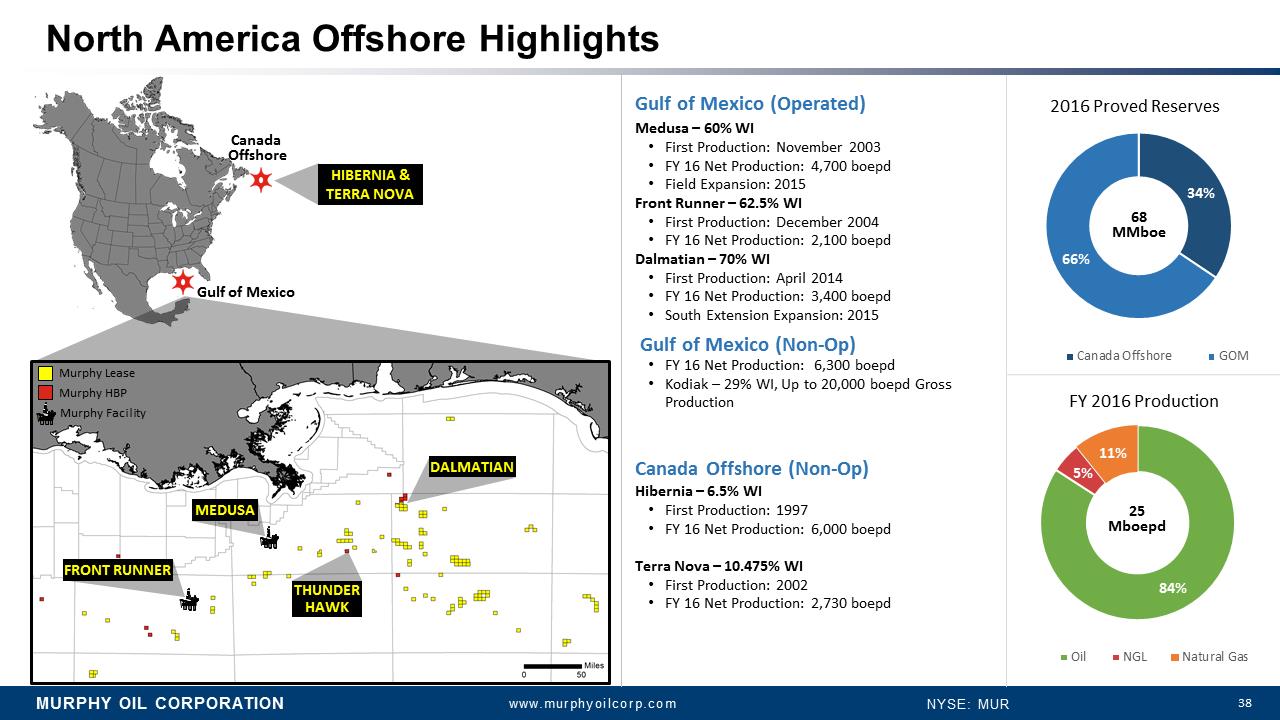
MURPHY OIL CORPORATION www.murphyoilcorp.com NYSE: MUR 38 84% 5% 11% Oil NGL Natural Gas 25 Mboepd FY 2016 Production 34% 66% 2016 Proved Reserves Canada Offshore GOM 68 MMboe North America Offshore Highlights Gulf of Mexico (Operated) Medusa –60% WI •First Production: November 2003 •FY 16 Net Production: 4,700 boepd •Field Expansion: 2015 Front Runner –62.5% WI •First Production: December 2004 •FY 16 Net Production: 2,100 boepd Dalmatian –70% WI •First Production: April 2014 •FY 16 Net Production:3,400 boepd •South Extension Expansion: 2015 Gulf of Mexico (Non-Op) •FY 16 Net Production: 6,300 boepd •Kodiak –29% WI,Up to 20,000 boepd Gross Production Canada Offshore (Non-Op) Hibernia –6.5% WI •First Production: 1997 •FY 16 Net Production:6,000 boepd Terra Nova –10.475% WI •First Production: 2002 •FY 16 Net Production:2,730 boepd Canada Offshore Gulf of Mexico Murphy Lease Murphy HBP Murphy Facility
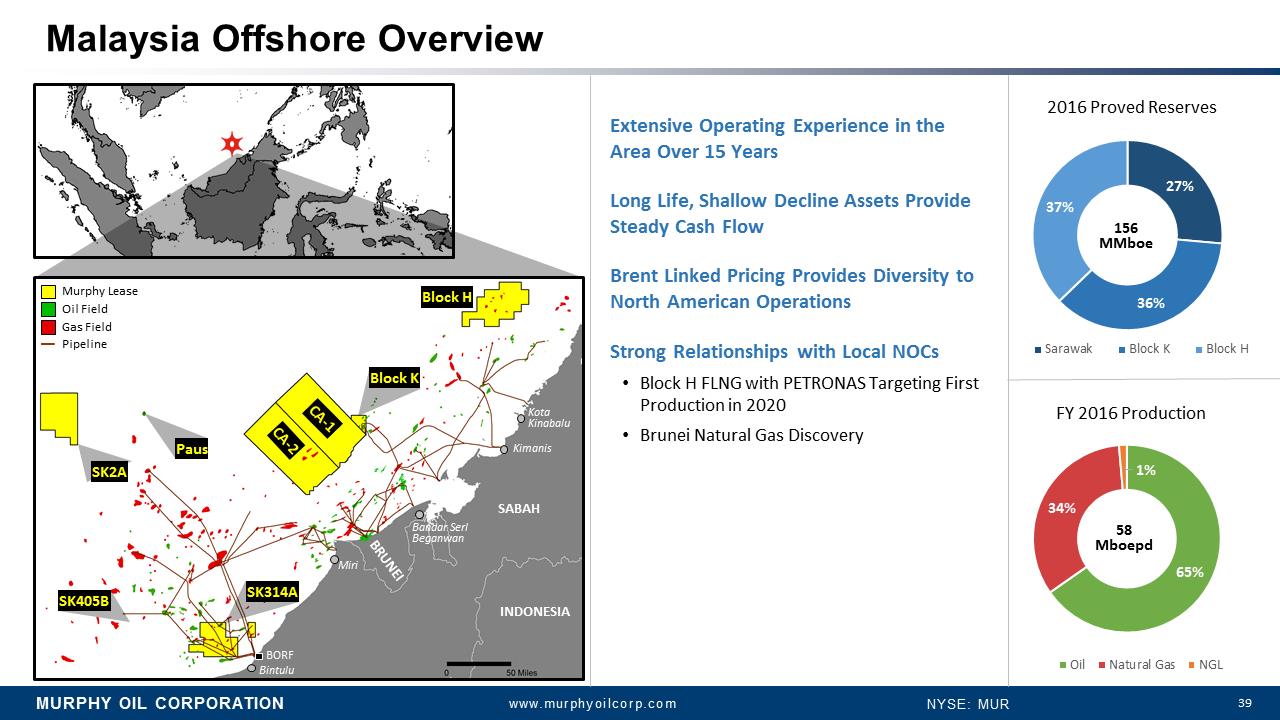
MURPHY OIL CORPORATION www.murphyoilcorp.com NYSE: MUR 39 Malaysia Offshore Overview Extensive Operating Experience in the Area Over 15 Years Long Life, Shallow Decline Assets Provide Steady Cash Flow Brent Linked Pricing Provides Diversity to North American Operations Strong Relationships with Local NOCs •Block H FLNG with PETRONAS Targeting First Production in 2020 •Brunei Natural Gas Discovery 27% 36% 37% 2016 Proved Reserves Sarawak Block K Block H 156 MMboe 65% 34% 1% Oil Natural Gas NGL 58 Mboepd FY 2016 Production SABAH Kota Kinabalu Kimanis Bandar SerlBeganwan Miri BRUNEI Bintulu BORF INDONESIA Murphy Lease Oil Field Gas Field Pipeline
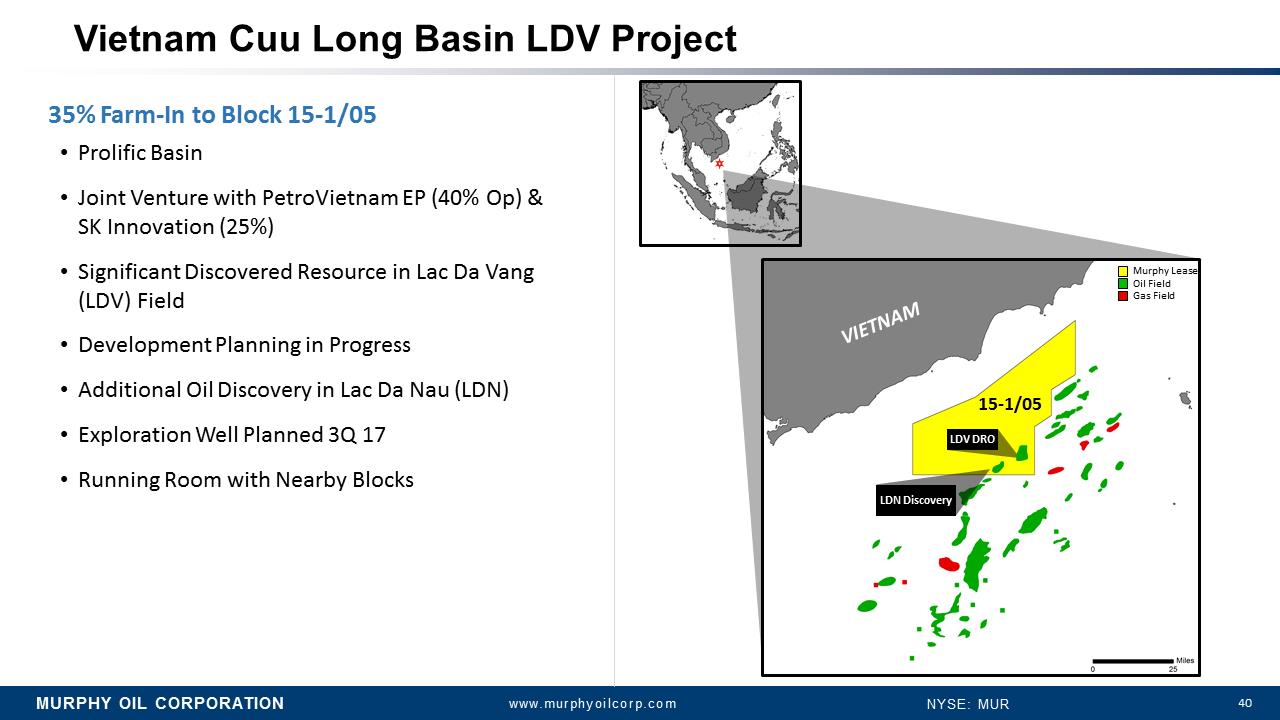
MURPHY OIL CORPORATION www.murphyoilcorp.com NYSE: MUR 40 35% Farm-In to Block 15-1/05 •Prolific Basin •Joint Venture with PetroVietnam EP (40% Op) & SK Innovation (25%) •Significant Discovered Resource in Lac Da Vang(LDV) Field •Development Planning in Progress •Additional Oil Discovery in Lac Da Nau (LDN) •Exploration Well Planned 3Q 17 •Running Room with Nearby Blocks VIETNAM 15-1/05 Murphy Lease Oil Field Gas Field Vietnam Cuu Long Basin LDV Project
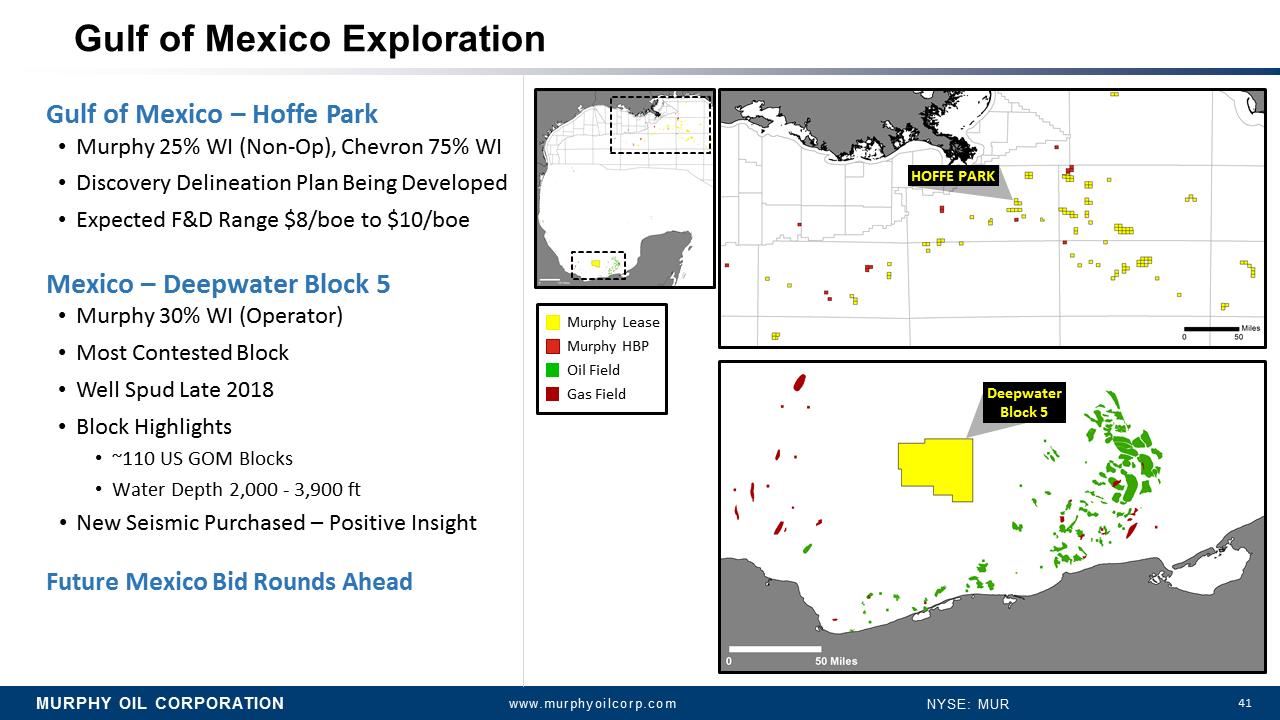
MURPHY OIL CORPORATION www.murphyoilcorp.com NYSE: MUR 41 Gulf of Mexico Exploration Gulf of Mexico –Hoffe Park •Murphy 25% WI (Non-Op), Chevron 75% WI •Discovery Delineation Plan Being Developed •Expected F&D Range $8/boe to $10/boe Mexico –Deepwater Block 5 •Murphy 30% WI (Operator) •Most Contested Block •Well Spud Late 2018 •Block Highlights •~110 US GOM Blocks •Water Depth 2,000 -3,900 ft •New Seismic Purchased –Positive Insight Future Mexico Bid Rounds Ahead Oil Field Gas Field Murphy Lease Murphy HBP
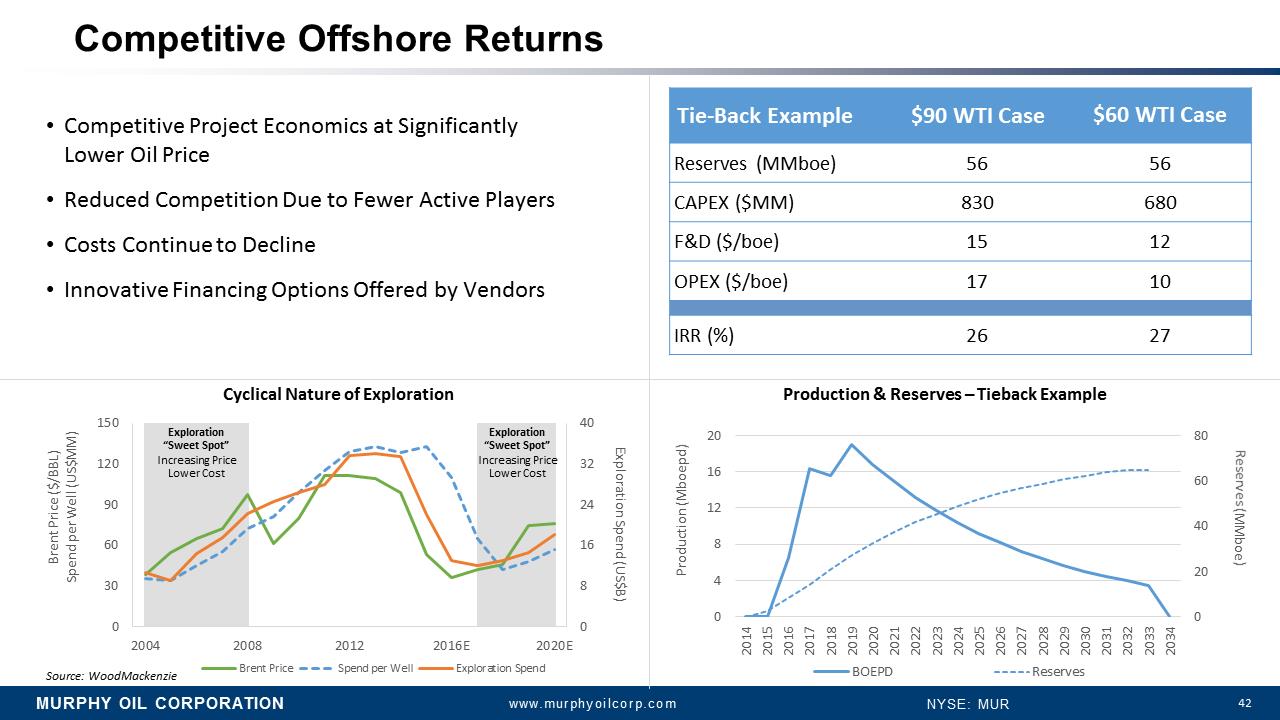
MURPHY OIL CORPORATION www.murphyoilcorp.com NYSE: MUR 42 Competitive Offshore Returns •Competitive Project Economics at Significantly Lower Oil Price •Reduced Competition Due to Fewer Active Players •Costs Continue to Decline •Innovative Financing Options Offered by Vendors Tie-Back Example $90 WTICase $60 WTI Case Reserves (MMboe) 56 56 CAPEX ($MM) 830 680 F&D ($/boe) 15 12 OPEX ($/boe) 17 10 IRR (%) 26 27 0 20 40 60 80 0 4 8 12 16 20 2014 2015 2016 2017 2018 2019 2020 2021 2022 2023 2024 2025 2026 2027 2028 2029 2030 2031 2032 2033 2034 Reserves (MMboe) Production (Mboepd) BOEPD Reserves Production & Reserves –Tieback Example Exploration “Sweet Spot” Increasing Price Lower Cost Exploration “Sweet Spot” Increasing Price Lower Cost 0 8 16 24 32 40 0 30 60 90 120 150 2004 2008 2012 2016E 2020E Exploration Spend (US$B) Brent Price ($/BBL) Spend per Well (US$MM) Brent Price Spend per Well Exploration Spend Source: WoodMackenzie Cyclical Nature of Exploration

MURPHY OIL CORPORATION www.murphyoilcorp.com NYSE: MUR 43 LOOKING AHEAD
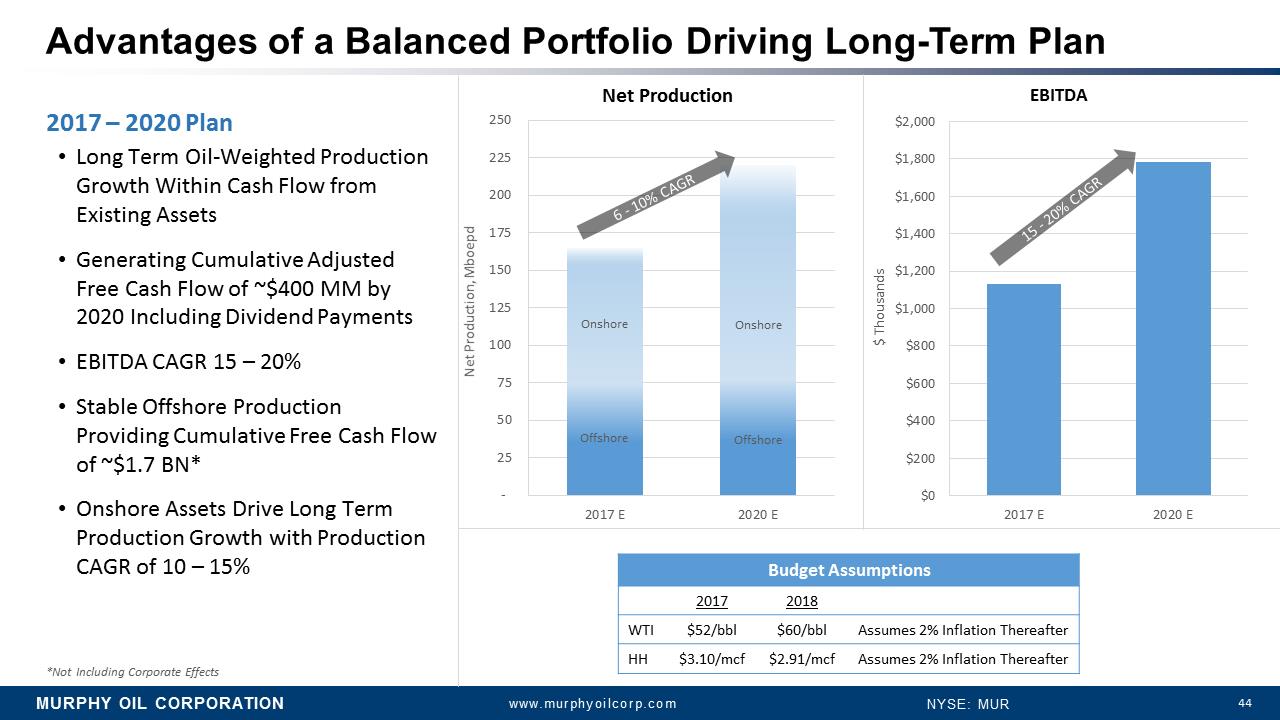
MURPHY OIL CORPORATION www.murphyoilcorp.com NYSE: MUR 44 - 25 50 75 100 125 150 175 200 225 250 2017 E 2020 E Net Production *Not Including Corporate Effects Onshore Net Production, Mboepd Budget Assumptions 2017 2018 WTI $52/bbl $60/bbl Assumes 2% Inflation Thereafter HH $3.10/mcf $2.91/mcf Assumes 2% Inflation Thereafter Advantages of a Balanced Portfolio Driving Long-Term Plan 2017 –2020 Plan •Long Term Oil-Weighted Production Growth Within Cash Flow from Existing Assets •Generating Cumulative Adjusted Free Cash Flow of ~$400 MM by 2020 Including Dividend Payments •EBITDA CAGR 15 –20% •Stable Offshore Production Providing Cumulative Free Cash Flow of ~$1.7 BN* •Onshore Assets Drive Long Term Production Growth with Production CAGR of 10 –15% Offshore Offshore Onshore $0 $200 $400 $600 $800 $1,000 $1,200 $1,400 $1,600 $1,800 $2,000 2017 E 2020 E $ Thousands EBITDA
MURPHY OIL CORPORATION www.murphyoilcorp.com NYSE: MUR 45 A Look Back at 2016
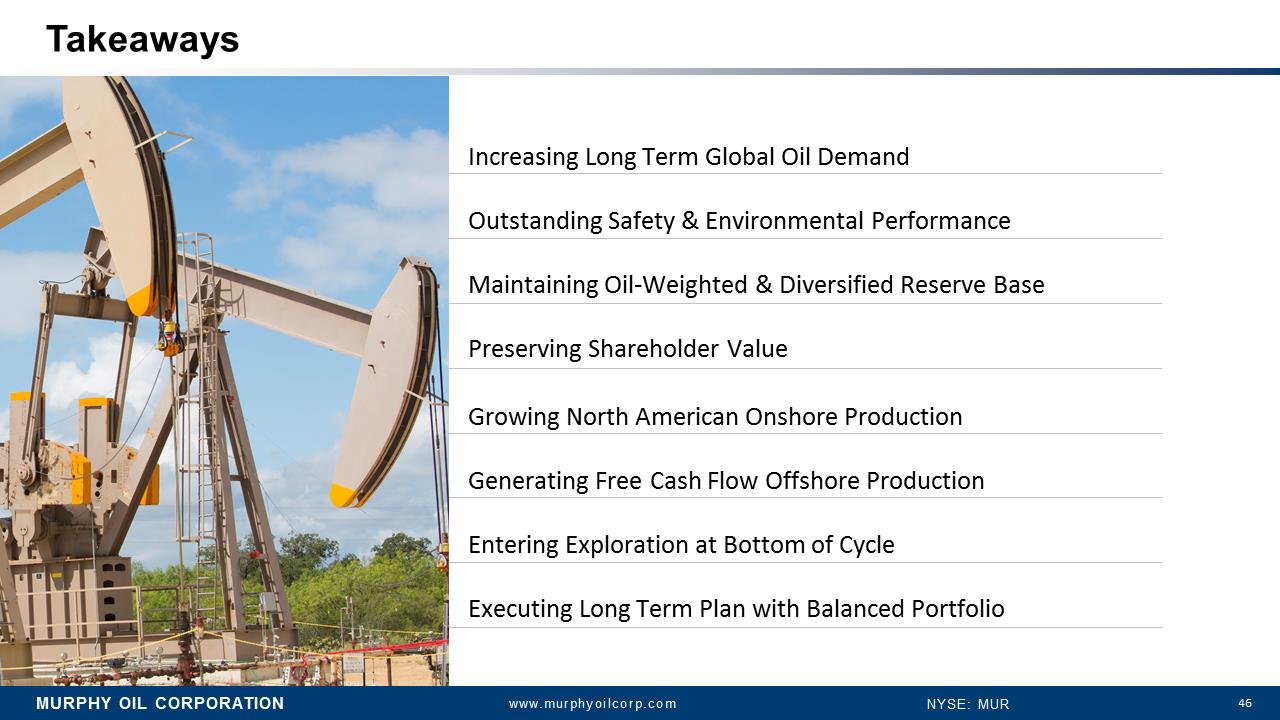
MURPHY OIL CORPORATION www.murphyoilcorp.com NYSE: MUR 46 Increasing Long Term Global Oil Demand Outstanding Safety& Environmental Performance Maintaining Oil-Weighted & Diversified Reserve Base Preserving Shareholder Value Growing North American Onshore Production Generating Free Cash Flow Offshore Production Entering Exploration at Bottom of Cycle Executing Long Term Plan with Balanced Portfolio Takeaways

MURPHY OIL CORPORATION www.murphyoilcorp.com NYSE: MUR 47 APPENDIX

MURPHY OIL CORPORATION www.murphyoilcorp.com NYSE: MUR 48 Appendix •Non-GAAP Reconciliation •Bloomberg Definitions •Abbreviations/Definitions •Additional Slides
MURPHY OIL CORPORATION www.murphyoilcorp.com NYSE: MUR 49 Non-GAAP Financial Measure Definitions & Reconciliations The following list of Non-GAAP financial measure definitions andrelatedreconciliationsisintendedtosatisfytherequirementsofRegulationGoftheSecuritiesExchangeActof1934,asamended.Thisinformationishistoricalinnature.MurphyundertakesnoobligationtopubliclyupdateorreviseanyNon- GAAP financial measure definitions and related reconciliations.
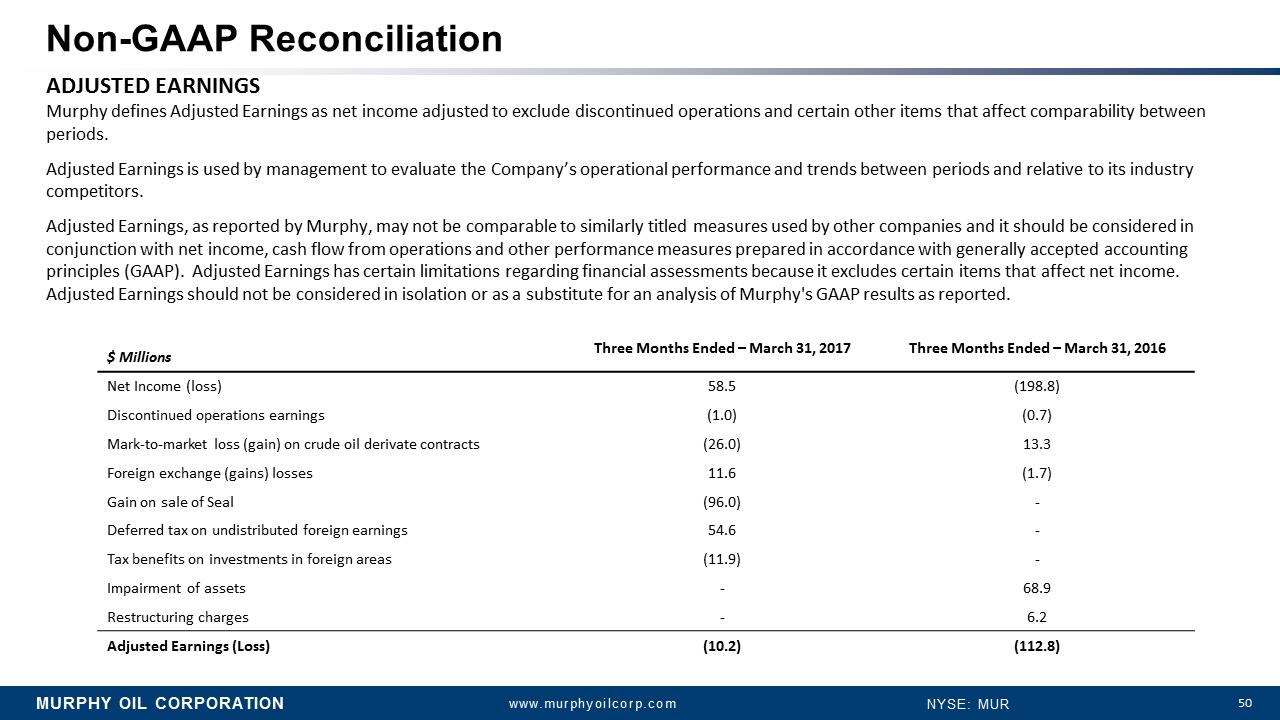
MURPHY OIL CORPORATION www.murphyoilcorp.com NYSE: MUR 50 Non-GAAP Reconciliation ADJUSTED EARNINGS Murphy defines Adjusted Earnings as net income adjusted to exclude discontinued operations and certain other items that affect comparability between periods. Adjusted Earnings is used by management to evaluate the Company’s operational performance and trends between periods and relative to its industry competitors. Adjusted Earnings, as reported by Murphy, may not be comparable to similarly titled measures used by other companies and it should be considered in conjunction with net income, cash flow from operations and other performance measures prepared in accordance with generally accepted accounting principles (GAAP). Adjusted Earnings has certain limitations regarding financial assessments because it excludes certain items that affect net income. Adjusted Earnings should not be considered in isolation or as a substitute for an analysis of Murphy's GAAP results as reported. $ Millions Three Months Ended –March 31, 2017 Three Months Ended –March 31, 2016 Net Income (loss) 58.5 (198.8) Discontinued operations earnings (1.0) (0.7) Mark-to-market loss (gain) on crude oil derivate contracts (26.0) 13.3 Foreign exchange (gains) losses 11.6 (1.7) Gain on sale of Seal (96.0) - Deferred tax on undistributed foreign earnings 54.6 - Tax benefits on investments in foreign areas (11.9) - Impairment of assets - 68.9 Restructuring charges - 6.2 Adjusted Earnings (Loss) (10.2) (112.8)
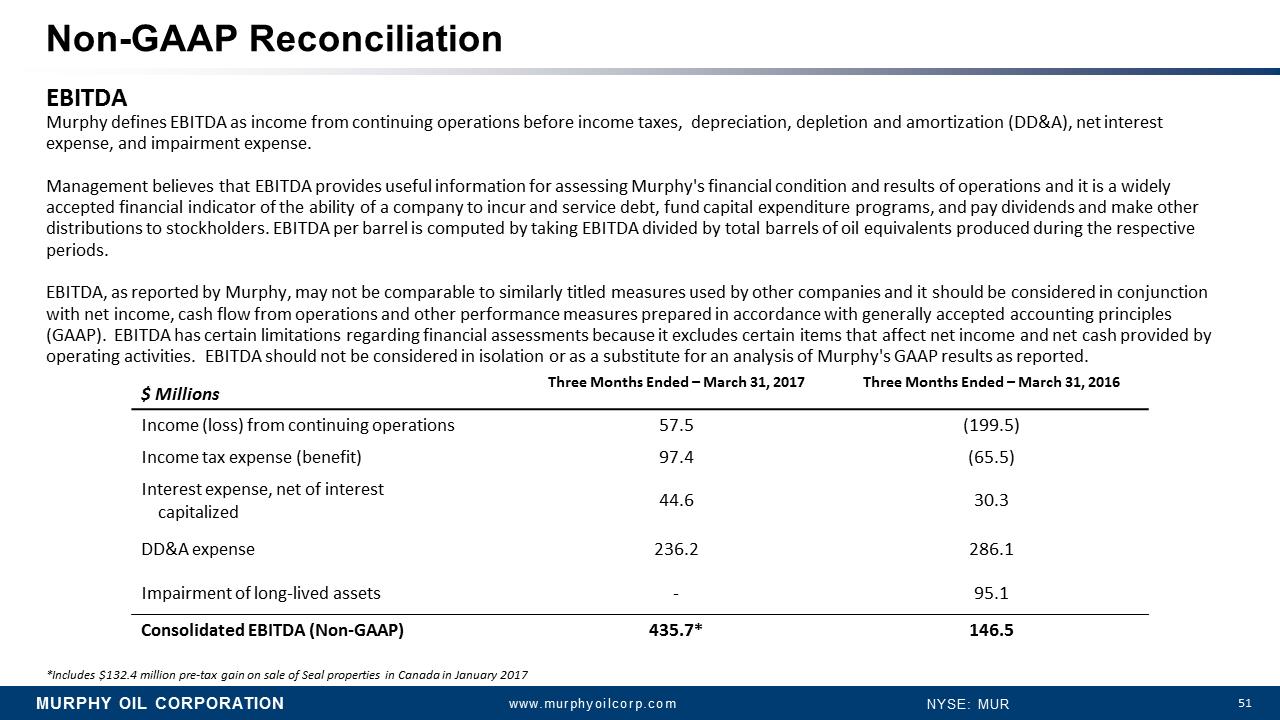
MURPHY OIL CORPORATION www.murphyoilcorp.com NYSE: MUR 51 Non-GAAP Reconciliation EBITDA Murphy defines EBITDA as income from continuing operations before income taxes, depreciation, depletion and amortization (DD&A), net interest expense, and impairment expense. Management believes that EBITDA provides useful information for assessing Murphy's financial condition and results of operations and it is a widely accepted financial indicator of the ability of a company to incur and service debt, fund capital expenditure programs, and pay dividends and make other distributions to stockholders. EBITDA per barrel is computed by taking EBITDA divided by total barrels of oil equivalents produced during the respective periods. EBITDA, as reported by Murphy, may not be comparable to similarly titled measures used by other companies and it should be considered in conjunction with net income, cash flow from operations and other performance measures prepared in accordance with generally accepted accounting principles (GAAP). EBITDA has certain limitations regarding financial assessments because it excludes certain items that affect net income and net cash provided by operating activities. EBITDA should not be considered in isolation or as a substitute for an analysis of Murphy's GAAP results as reported. $ Millions Three Months Ended –March 31, 2017 Three Months Ended –March 31, 2016 Income (loss) from continuing operations 57.5 (199.5) Income tax expense (benefit) 97.4 (65.5) Interest expense, net of interest capitalized 44.6 30.3 DD&A expense 236.2 286.1 Impairment of long-lived assets - 95.1 Consolidated EBITDA (Non-GAAP) 435.7* 146.5 *Includes $132.4 million pre-tax gain on sale of Seal properties in Canada in January 2017
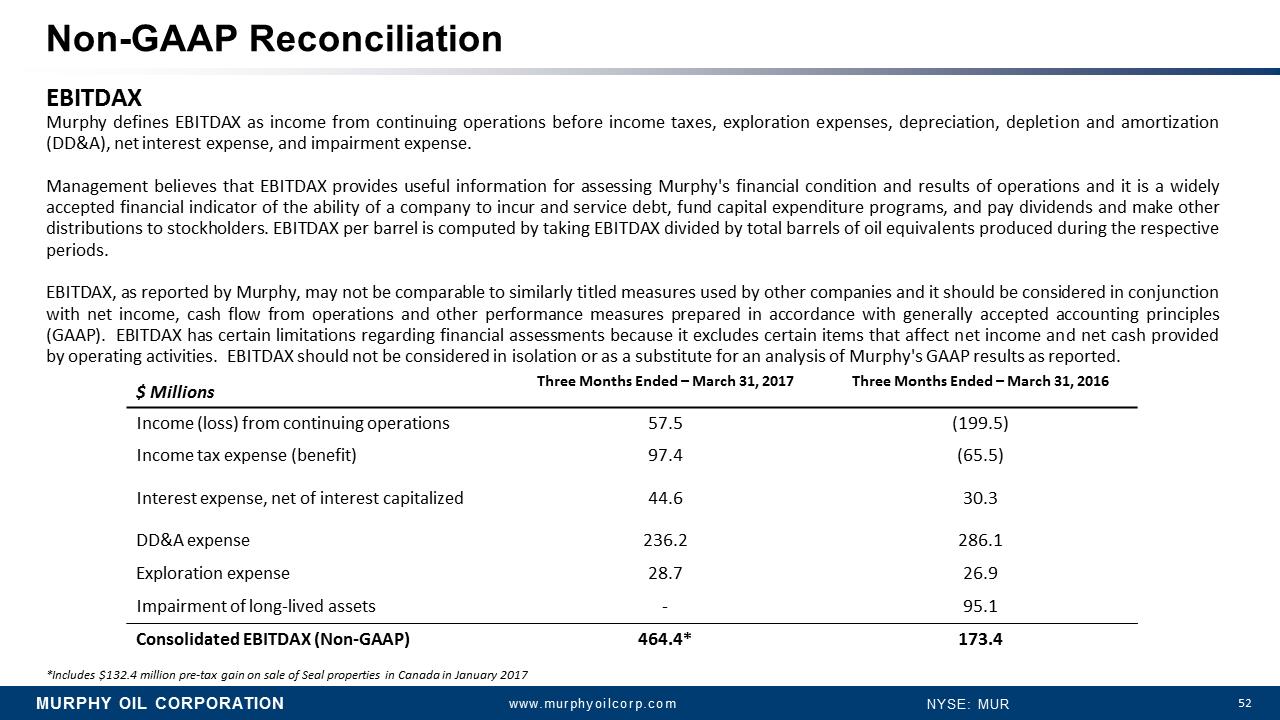
MURPHY OIL CORPORATION www.murphyoilcorp.com NYSE: MUR 52 Non-GAAP Reconciliation EBITDAX Murphy defines EBITDAX as income from continuing operations before income taxes, exploration expenses, depreciation, depletion and amortization (DD&A), net interest expense, and impairment expense. Management believes that EBITDAX provides useful information for assessing Murphy's financial condition and results of operations and it is a widely accepted financial indicator of the ability of a company to incur and service debt, fund capital expenditure programs, and pay dividends and make other distributions to stockholders. EBITDAX per barrel is computed by taking EBITDAX divided by total barrels of oil equivalents produced during the respective periods. EBITDAX, as reported by Murphy, may not be comparable to similarly titled measures used by other companies and it should be considered in conjunction with net income ,cash flow from operations and other performance measures prepared in accordance with generally accepted accounting principles (GAAP). EBITDAX has certain limitations regarding financial assessments because it excludes certain items that affect net income and net cash provided by operating activities. EBITDAX should not be considered in isolation or as a substitute for an analysis of Murphy's GAAP results as reported. $ Millions Three Months Ended –March 31, 2017 Three Months Ended –March 31, 2016 Income (loss) from continuing operations 57.5 (199.5) Income tax expense (benefit) 97.4 (65.5) Interest expense, net of interest capitalized 44.6 30.3 DD&A expense 236.2 286.1 Exploration expense 28.7 26.9 Impairment of long-lived assets - 95.1 Consolidated EBITDAX (Non-GAAP) 464.4* 173.4 *Includes $132.4 million pre-tax gain on sale of Seal properties in Canada in January 2017
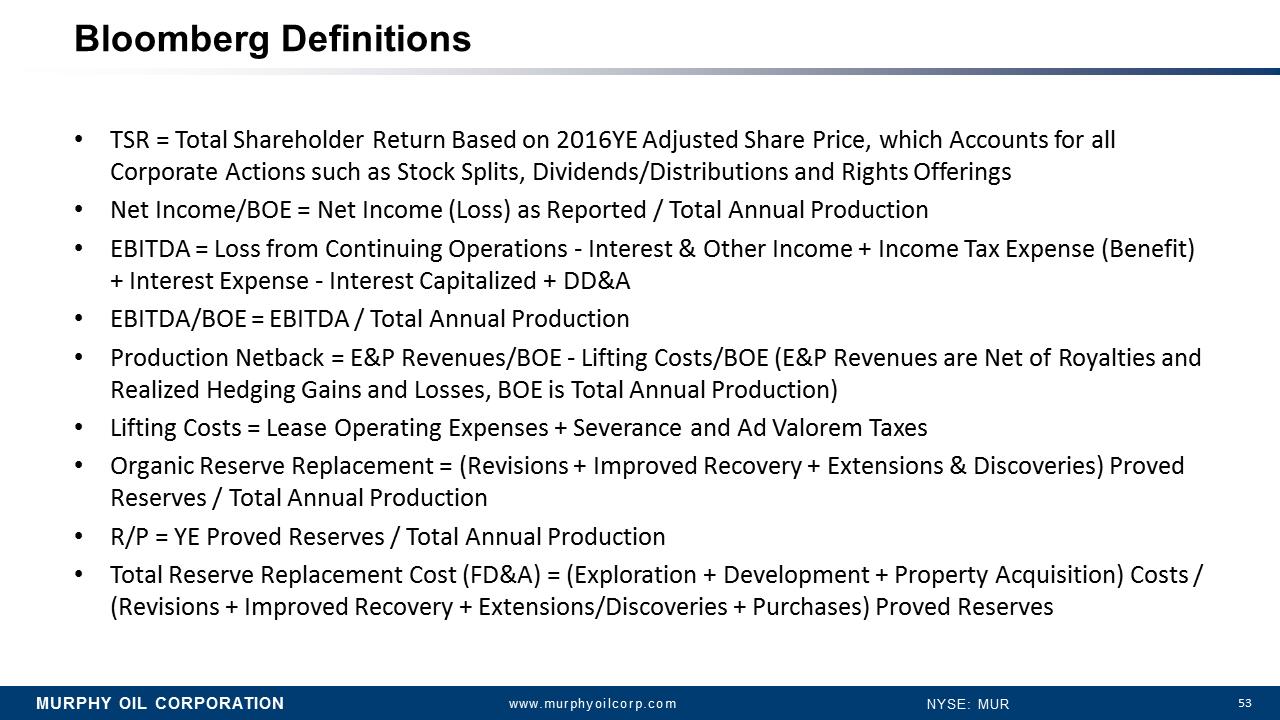
MURPHY OIL CORPORATION www.murphyoilcorp.com NYSE: MUR 53 Bloomberg Definitions •TSR = Total Shareholder Return Based on 2016YE Adjusted Share Price, which Accounts for all Corporate Actions such as Stock Splits, Dividends/Distributions and Rights Offerings •Net Income/BOE = Net Income (Loss) as Reported / Total Annual Production •EBITDA = Loss from Continuing Operations -Interest & Other Income + Income Tax Expense (Benefit) + Interest Expense -Interest Capitalized + DD&A •EBITDA/BOE = EBITDA / Total Annual Production •Production Netback = E&P Revenues/BOE -Lifting Costs/BOE (E&P Revenues are Net of Royalties and Realized Hedging Gains and Losses, BOE is Total Annual Production) •Lifting Costs = Lease Operating Expenses + Severance and Ad Valorem Taxes •Organic Reserve Replacement = (Revisions + Improved Recovery + Extensions & Discoveries) Proved Reserves / Total Annual Production •R/P = YE Proved Reserves / Total Annual Production •Total Reserve Replacement Cost (FD&A) = (Exploration + Development + Property Acquisition) Costs / (Revisions + Improved Recovery + Extensions/Discoveries + Purchases) Proved Reserves
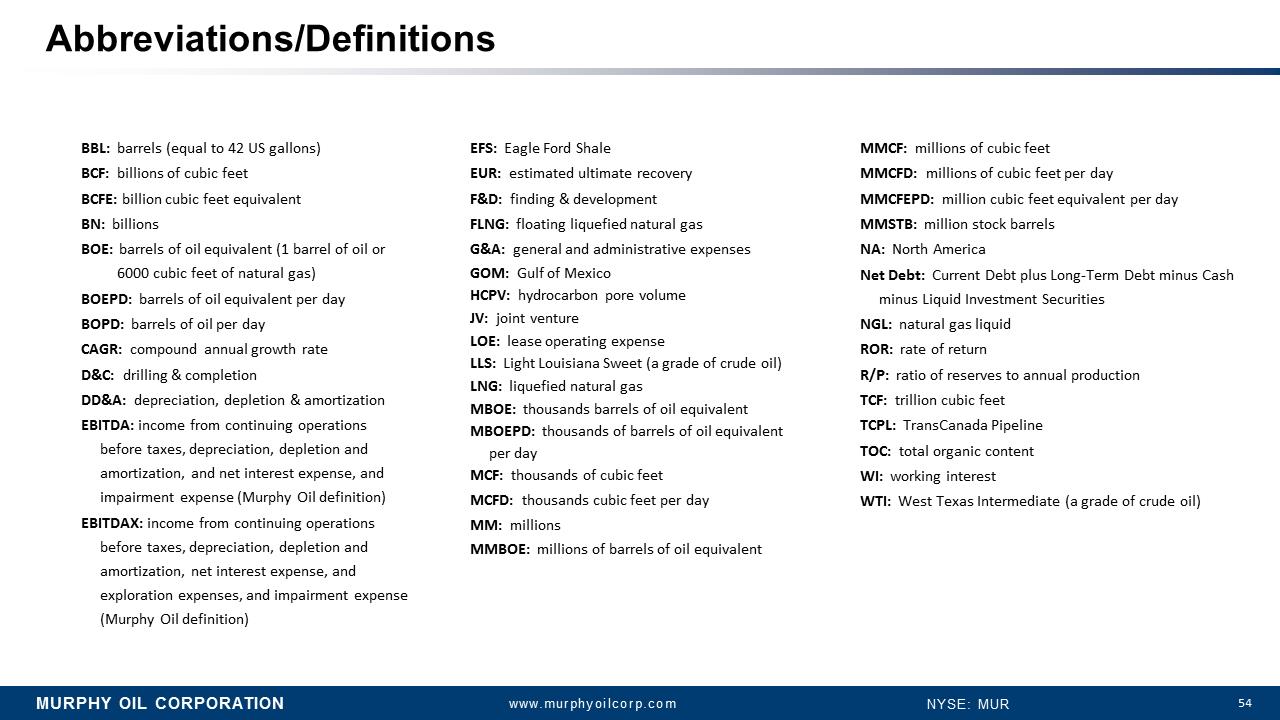
MURPHY OIL CORPORATION www.murphyoilcorp.com NYSE: MUR 54 Abbreviations/Definitions BBL: barrels (equal to 42 US gallons) BCF: billions of cubic feet BCFE: billion cubic feet equivalent BN: billions BOE: barrels of oil equivalent (1 barrel of oil or 6000 cubic feet of natural gas) BOEPD: barrels of oil equivalent per day BOPD: barrels of oil per day CAGR: compound annual growth rate D&C: drilling & completion DD&A:depreciation, depletion & amortization EBITDA: income from continuing operations before taxes, depreciation, depletion and amortization, and net interest expense, and impairment expense (Murphy Oil definition) EBITDAX: income from continuing operations before taxes, depreciation, depletion and amortization, net interest expense, and exploration expenses, and impairment expense (Murphy Oil definition) MMCF: millions of cubic feet MMCFD: millions of cubic feet per day MMCFEPD:million cubic feet equivalent per day MMSTB: million stock barrels NA: North America Net Debt: Current Debt plus Long-Term Debt minus Cash minus Liquid Investment Securities NGL: natural gas liquid ROR: rate of return R/P: ratio of reserves to annual production TCF: trillion cubic feet TCPL: TransCanada Pipeline TOC: total organic content WI: working interest WTI: West Texas Intermediate (a grade of crude oil) EFS: Eagle Ford Shale EUR: estimated ultimate recovery F&D: finding & development FLNG: floating liquefied natural gas G&A: general and administrative expenses GOM: Gulf of Mexico HCPV: hydrocarbon pore volume JV: joint venture LOE: lease operating expense LLS: Light Louisiana Sweet (a grade of crude oil) LNG: liquefied natural gas MBOE: thousands barrels of oil equivalent MBOEPD: thousands of barrels of oil equivalent per day MCF: thousands of cubic feet MCFD: thousands cubic feet per day MM: millions MMBOE: millions of barrels of oil equivalent
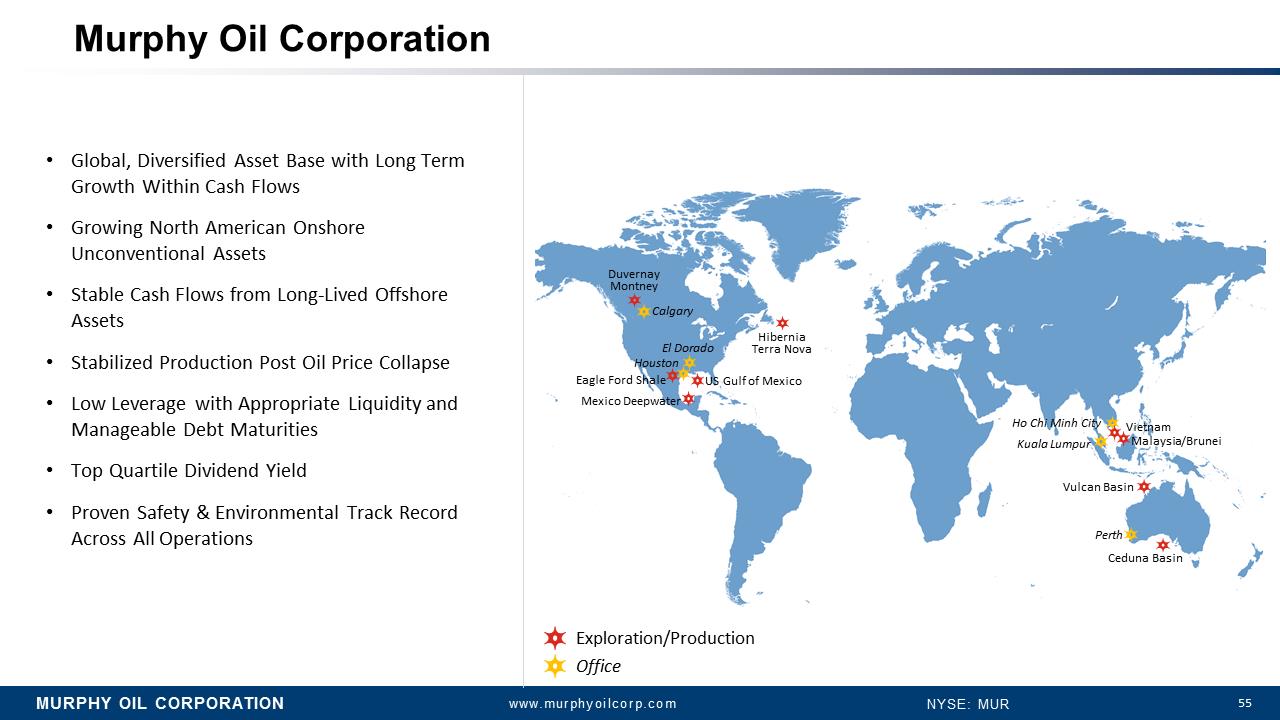
MURPHY OIL CORPORATION www.murphyoilcorp.com NYSE: MUR 55 Murphy Oil Corporation •Global, Diversified Asset Base with Long Term Growth Within Cash Flows •Growing North American Onshore Unconventional Assets •Stable Cash Flows from Long-Lived Offshore Assets •Stabilized Production Post Oil Price Collapse •Low Leverage with Appropriate Liquidity and Manageable Debt Maturities •Top Quartile Dividend Yield •Proven Safety & Environmental Track Record Across All Operations Duvernay Montney Hibernia Terra Nova Eagle Ford Shale US Gulf of Mexico Malaysia/Brunei Ho Chi Minh City Perth Calgary El Dorado Kuala Lumpur Houston Mexico Deepwater Vietnam Vulcan Basin Ceduna Basin Exploration/Production Office
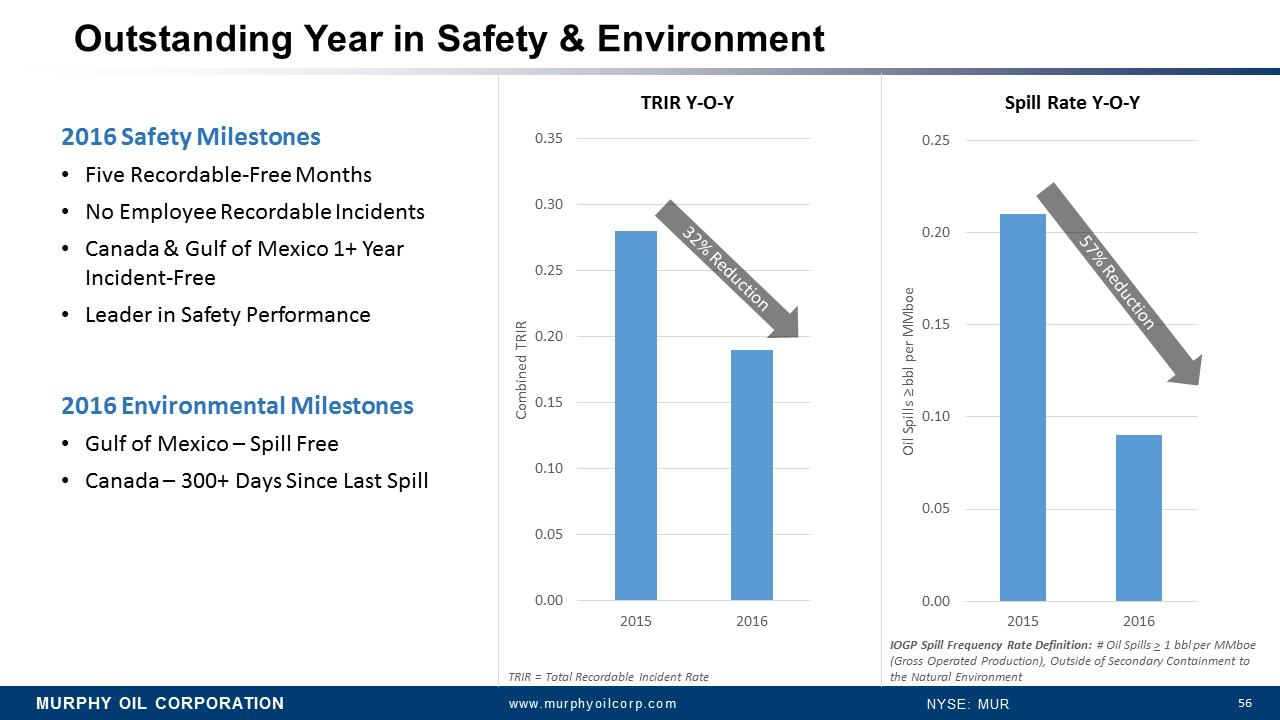
MURPHY OIL CORPORATION www.murphyoilcorp.com NYSE: MUR 56 Outstanding Year in Safety & Environment 0.00 0.05 0.10 0.15 0.20 0.25 0.30 0.35 2015 2016 Combined TRIR TRIR Y-O-Y 2016 Safety Milestones •Five Recordable-Free Months •No Employee Recordable Incidents •Canada & Gulf of Mexico 1+ Year Incident-Free •Leader in Safety Performance 2016 Environmental Milestones •Gulf of Mexico –Spill Free •Canada –300+ Days Since Last Spill Spill Rate Y-O-Y 0.00 0.05 0.10 0.15 0.20 0.25 2015 2016 Oil Spills = bbl per MMboe IOGP Spill Frequency Rate Definition: # Oil Spills >1 bbl per MMboe (Gross Operated Production), Outside of Secondary Containment to the Natural Environment TRIR = Total Recordable Incident Rate
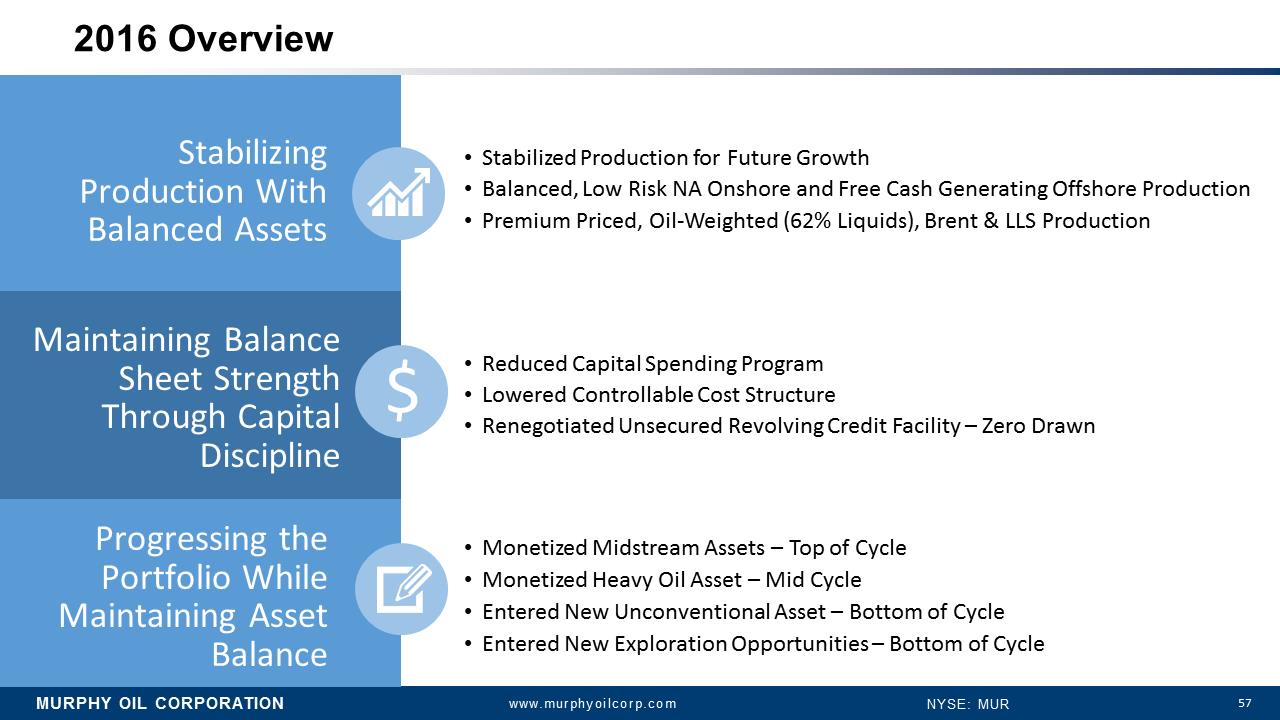
MURPHY OIL CORPORATION www.murphyoilcorp.com NYSE: MUR 57 2016 Overview •Stabilized Production for Future Growth •Balanced, Low Risk NA Onshore and Free Cash Generating Offshore Production •Premium Priced, Oil-Weighted (62% Liquids), Brent & LLS Production •Reduced Capital Spending Program •Lowered Controllable Cost Structure •Renegotiated Unsecured Revolving Credit Facility –Zero Drawn •Monetized Midstream Assets –Top of Cycle •Monetized Heavy Oil Asset –Mid Cycle •Entered New Unconventional Asset –Bottom of Cycle •Entered New Exploration Opportunities –Bottom of Cycle Progressing the Portfolio While Maintaining Asset Balance Maintaining Balance Sheet Strength Through Capital Discipline Stabilizing Production With Balanced Assets $
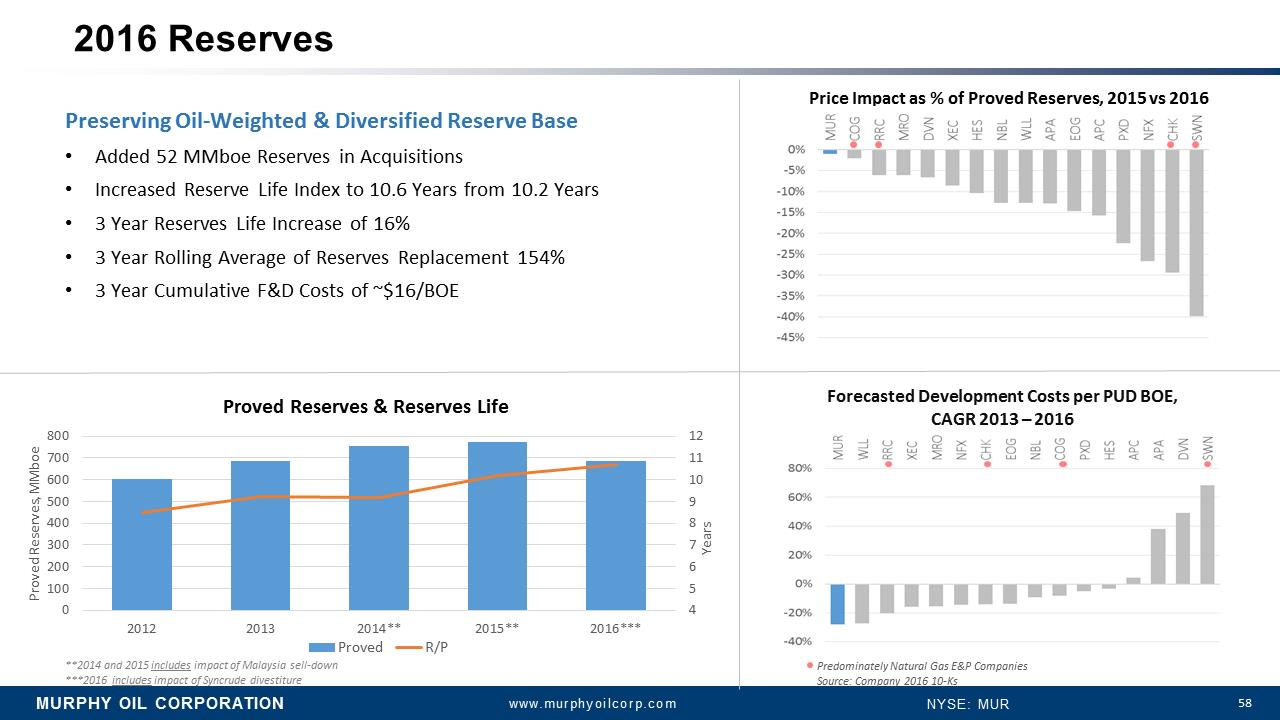
MURPHY OIL CORPORATION www.murphyoilcorp.com NYSE: MUR 58 Price Impact as % of Proved Reserves, 2015 vs 2016 Forecasted Development Costs per PUD BOE,CAGR 2013 –2016 4 5 6 7 8 9 10 11 12 0 100 200 300 400 500 600 700 800 2012 2013 2014** 2015** 2016*** Years Proved Reserves, MMboe Proved Reserves & Reserves Life Proved R/P **2014 and 2015 includesimpact of Malaysia sell-down ***2016 includesimpact of Syncrude divestiture Predominately Natural Gas E&P Companies Source: Company 2016 10-Ks Preserving Oil-Weighted & Diversified Reserve Base •Added 52 MMboe Reserves in Acquisitions •Increased Reserve Life Index to 10.6 Years from 10.2 Years •3 Year Reserves Life Increase of 16% •3 Year Rolling Average of Reserves Replacement 154% •3 Year Cumulative F&D Costs of ~$16/BOE 2016 Reserves
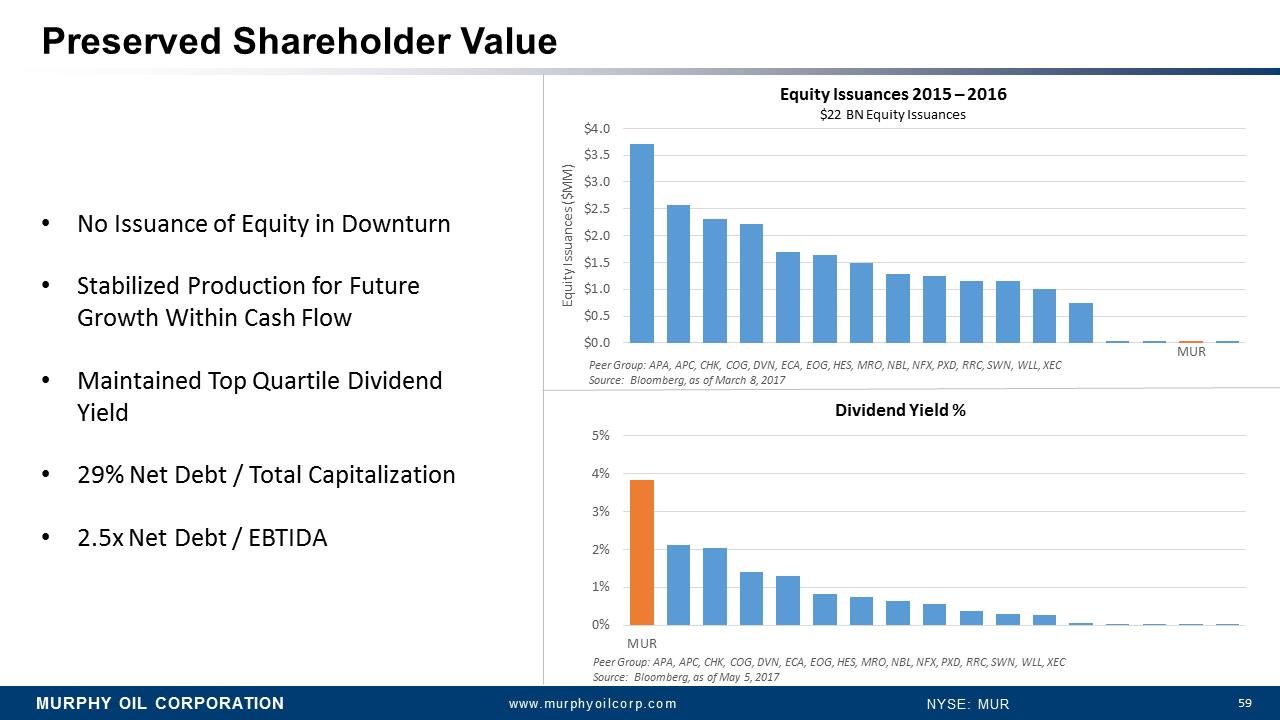
MURPHY OIL CORPORATION www.murphyoilcorp.com NYSE: MUR 59 $0.0 $0.5 $1.0 $1.5 $2.0 $2.5 $3.0 $3.5 $4.0 Equity Issuances ($MM) Equity Issuances 2015 –2016 $22 BN Equity Issuances PeerGroup: APA, APC, CHK, COG, DVN, ECA, EOG, HES, MRO, NBL, NFX, PXD, RRC, SWN, WLL, XEC Source: Bloomberg, as of March8, 2017 •No Issuance of Equity in Downturn •Stabilized Production for Future Growth Within Cash Flow •Maintained Top Quartile Dividend Yield •29% Net Debt / Total Capitalization •2.5x Net Debt / EBTIDA 0% 1% 2% 3% 4% 5% MUR Dividend Yield % Peer Group: APA, APC, CHK, COG, DVN, ECA, EOG, HES, MRO, NBL, NFX, PXD, RRC, SWN, WLL, XEC Source: Bloomberg, as of May 5, 2017 Preserved Shareholder Value MUR
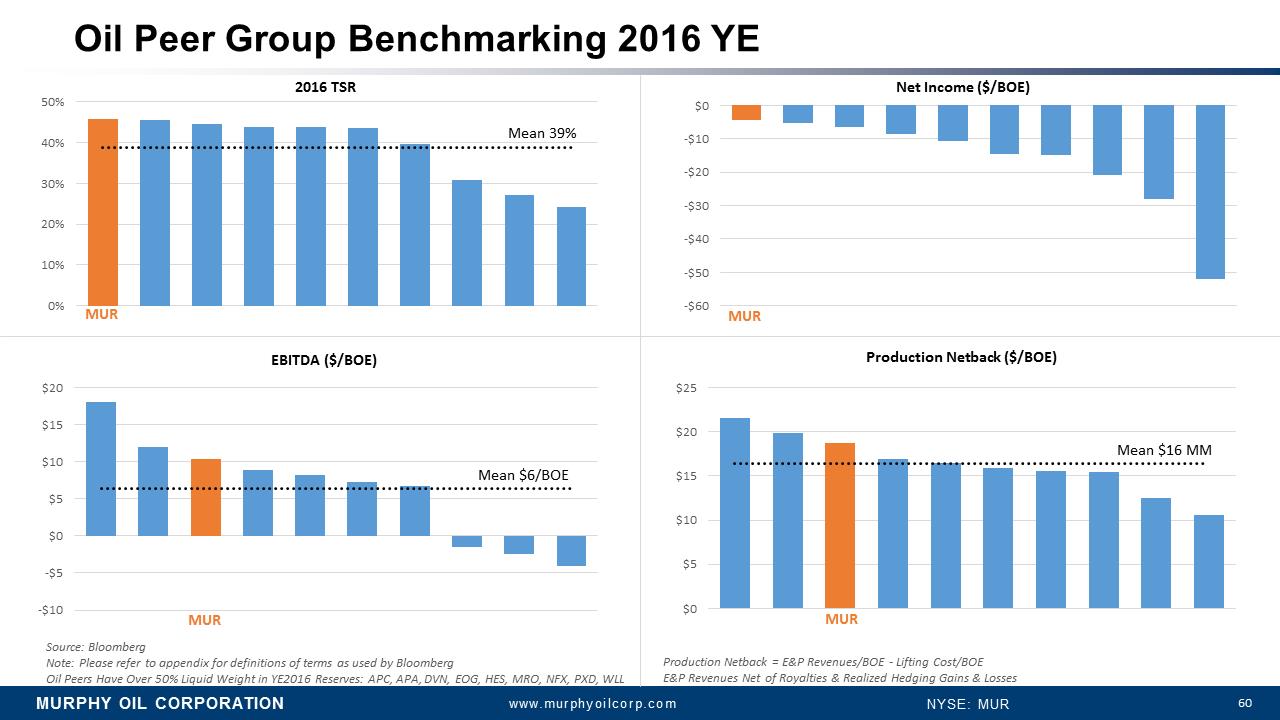
MURPHY OIL CORPORATION www.murphyoilcorp.com NYSE: MUR 60 $0 $5 $10 $15 $20 $25 -$60 -$50 -$40 -$30 -$20 -$10 $0 EBITDA ($/BOE) Net Income ($/BOE) Production Netback ($/BOE) Oil Peer Group Benchmarking 2016 YE 2016 TSR Source: Bloomberg Note: Please refer to appendix for definitions of terms as used by Bloomberg Oil Peers Have Over 50% Liquid Weight in YE2016 Reserves: APC, APA, DVN, EOG, HES, MRO, NFX, PXD, WLL Production Netback = E&P Revenues/BOE -Lifting Cost/BOE E&P Revenues Net of Royalties & Realized Hedging Gains & Losses MUR MUR MUR MUR 0% 10% 20% 30% 40% 50% Mean 39% -$10 -$5 $0 $5 $10 $15 $20 Mean $6/BOE Mean $16 MM
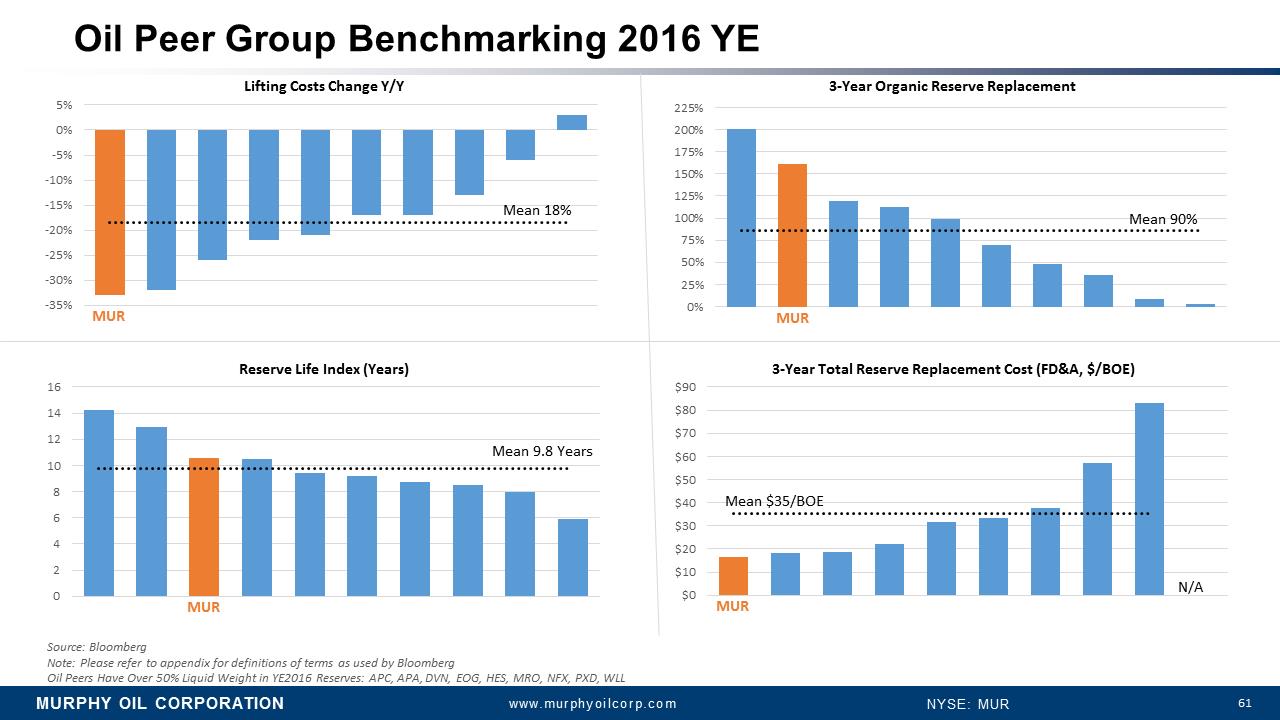
MURPHY OIL CORPORATION www.murphyoilcorp.com NYSE: MUR 61 3-Year Total Reserve Replacement Cost (FD&A, $/BOE) Reserve Life Index (Years) Lifting Costs Change Y/Y 3-Year Organic Reserve Replacement Oil Peer Group Benchmarking 2016 YE Source: Bloomberg Note: Please refer to appendix for definitions of terms as used by Bloomberg Oil Peers Have Over 50% Liquid Weight in YE2016 Reserves: APC, APA, DVN, EOG, HES, MRO, NFX, PXD, WLL -35% -30% -25% -20% -15% -10% -5% 0% 5% Mean 18% MUR 0% 25% 50% 75% 100% 125% 150% 175% 200% 225% Mean 90% 0 2 4 6 8 10 12 14 16 MUR Mean 9.8 Years $0 $10 $20 $30 $40 $50 $60 $70 $80 $90 N/A Mean $35/BOE MUR MUR
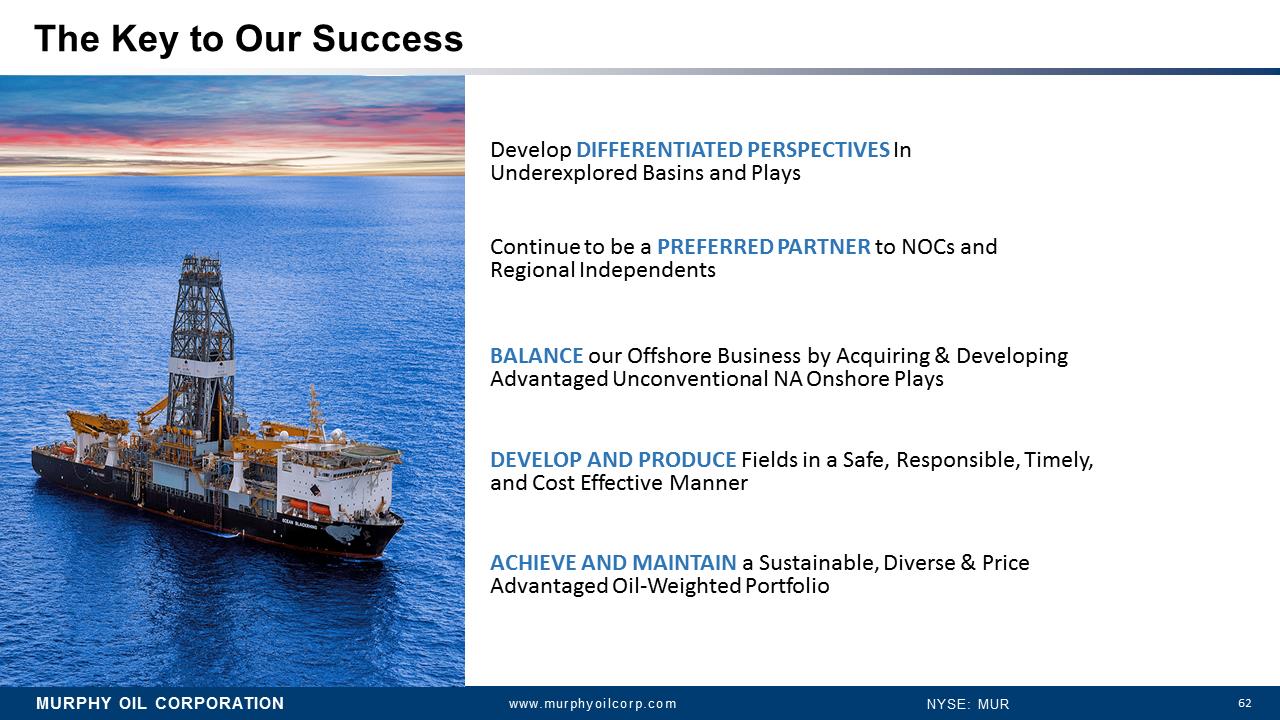
MURPHY OIL CORPORATION www.murphyoilcorp.com NYSE: MUR 62 The Key to Our Success Continue to be a PREFERRED PARTNER to NOCs and Regional Independents BALANCE our Offshore Business by Acquiring & Developing Advantaged Unconventional NA Onshore Plays DEVELOP AND PRODUCE Fields in a Safe, Responsible, Timely, and Cost Effective Manner ACHIEVE AND MAINTAIN a Sustainable, Diverse & Price Advantaged Oil-Weighted Portfolio Develop DIFFERENTIATED PERSPECTIVES In Underexplored Basins and Plays
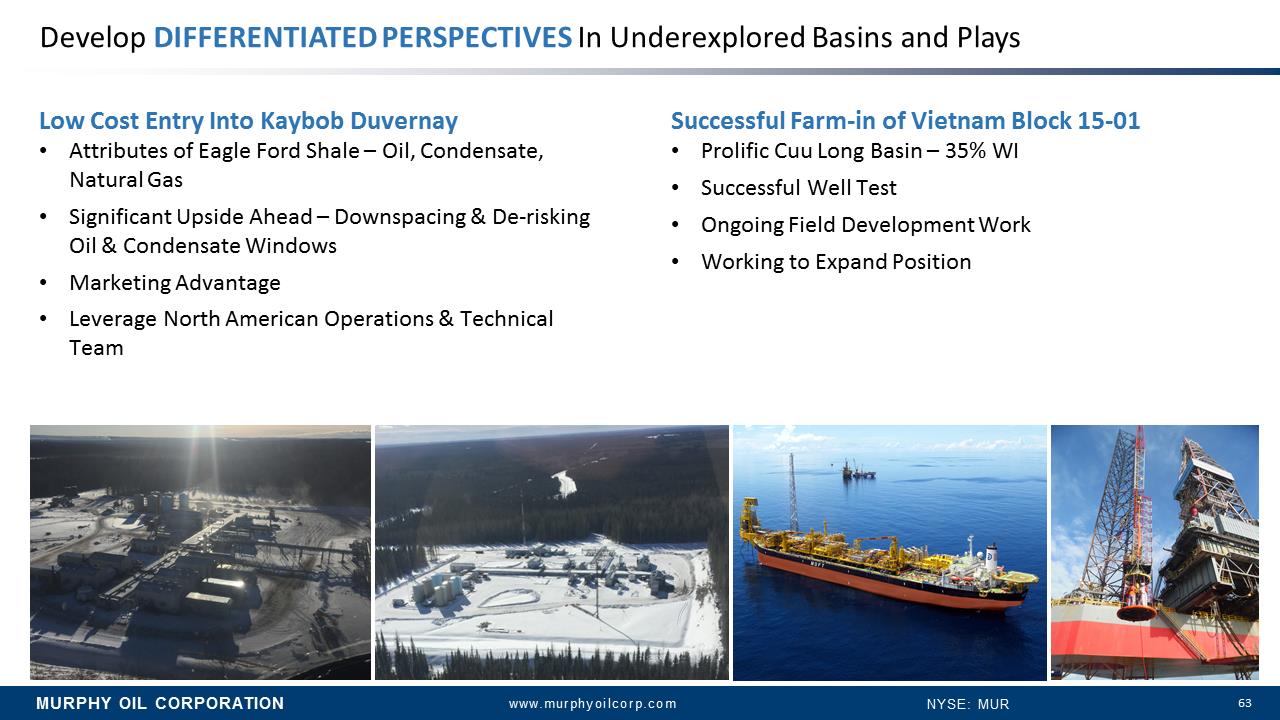
MURPHY OIL CORPORATION www.murphyoilcorp.com NYSE: MUR 63 Develop DIFFERENTIATED PERSPECTIVES In Underexplored Basins and Plays Low Cost Entry Into Kaybob Duvernay •Attributes of Eagle Ford Shale –Oil, Condensate, Natural Gas •Significant Upside Ahead –Downspacing& De-risking Oil & Condensate Windows •Marketing Advantage •Leverage North American Operations & Technical Team Successful Farm-in of Vietnam Block 15-01 •Prolific Cuu Long Basin –35% WI •Successful Well Test •Ongoing Field Development Work •Working to Expand Position
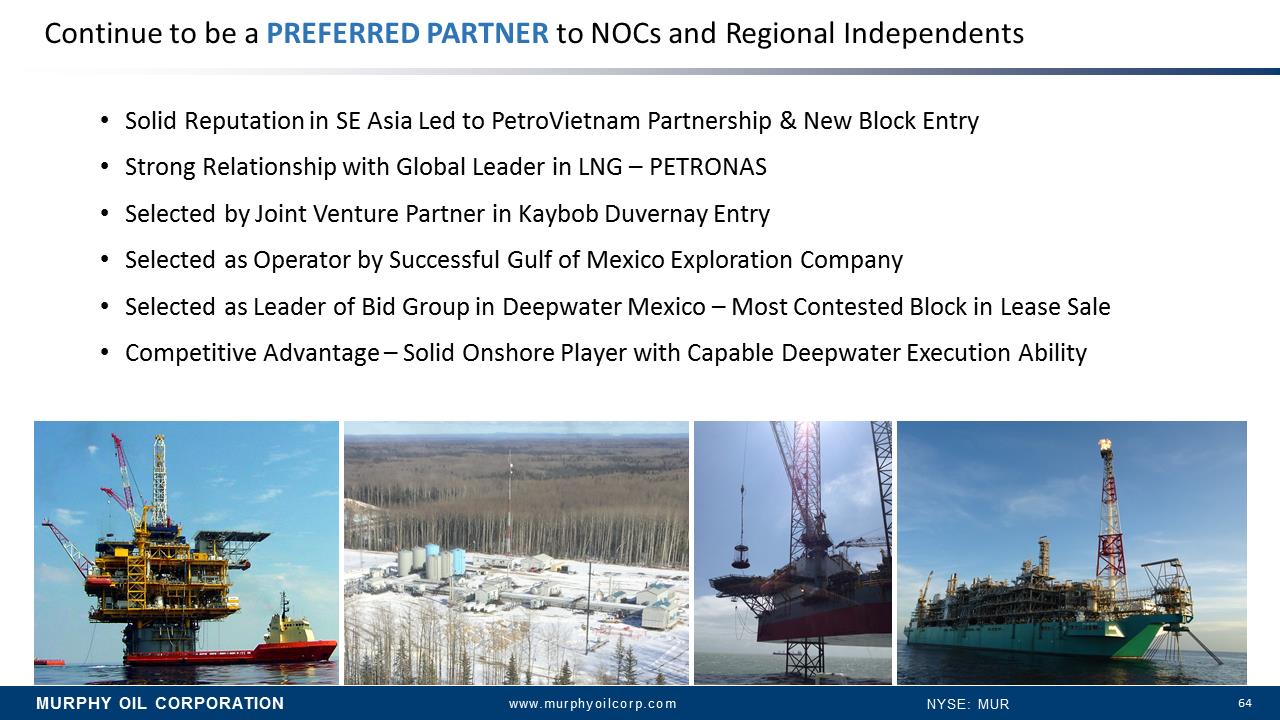
MURPHY OIL CORPORATION www.murphyoilcorp.com NYSE: MUR 64 •Solid Reputation in SE Asia Led to PetroVietnam Partnership & New Block Entry •Strong Relationship with Global Leader in LNG –PETRONAS •Selected by Joint Venture Partner in Kaybob Duvernay Entry •Selected as Operator by Successful Gulf of Mexico Exploration Company •Selected as Leader of Bid Group in Deepwater Mexico –Most Contested Block in Lease Sale •Competitive Advantage –Solid Onshore Player with Capable Deepwater Execution Ability Continue to be a PREFERRED PARTNERto NOCs and Regional Independents
MURPHY OIL CORPORATION www.murphyoilcorp.com NYSE: MUR 65 •Rebuilding Opportunity Set in Deepwater at Bottom of Cycle •Stabilizing Production •North American Onshore Assets –Unconventional Focus •Eagle Ford Shale –Low Cost Entry, Oil-Weighted Production •MontneyNatural Gas –Low Cost Operations with Long Term Expansion Opportunities •New Kaybob Duvernay –Low Cost Entry, Multi-Year Running Room with Resource Upside BALANCEour Offshore Business by Acquiring & Developing Advantaged Unconventional NA Onshore Plays
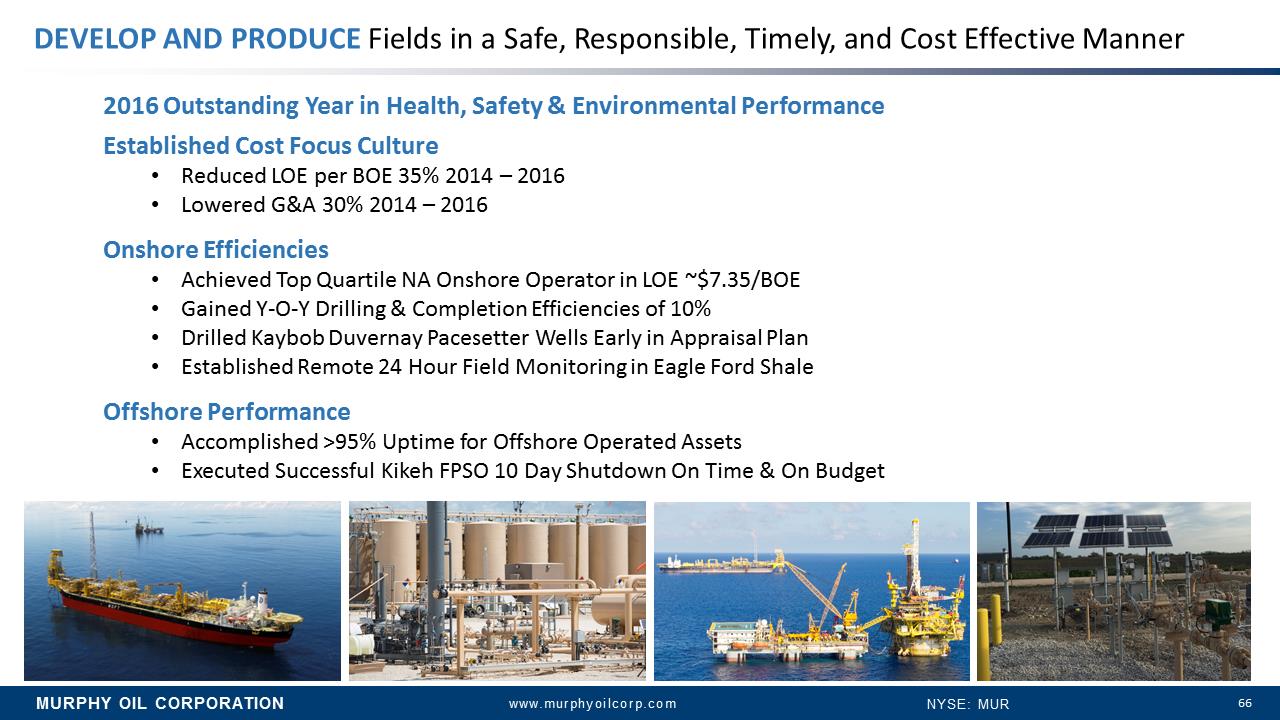
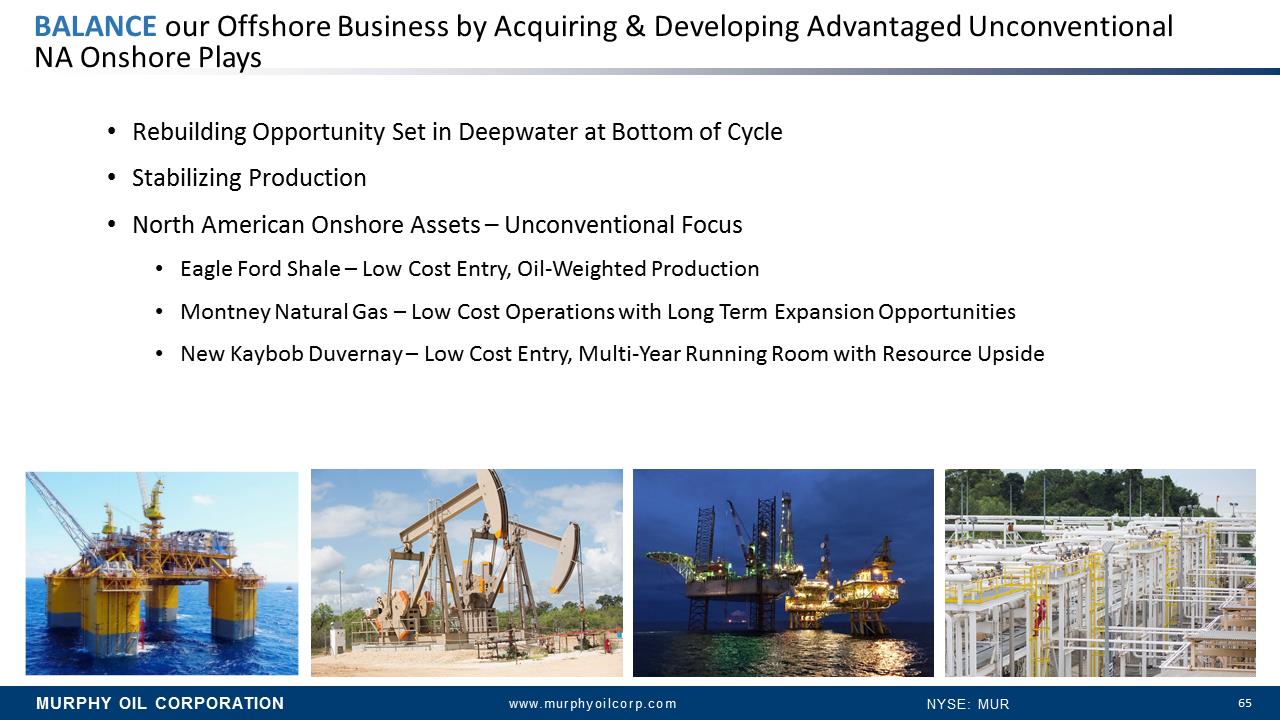
MURPHY OIL CORPORATION www.murphyoilcorp.com NYSE: MUR 66 2016 Outstanding Year in Health, Safety & Environmental Performance Established Cost Focus Culture •Reduced LOE per BOE 35% 2014 –2016 •LoweredG&A 30% 2014 –2016 Onshore Efficiencies •Achieved Top Quartile NA Onshore Operator in LOE ~$7.35/BOE •Gained Y-O-Y Drilling & Completion Efficiencies of 10% •Drilled Kaybob Duvernay Pacesetter Wells Early in Appraisal Plan •Established Remote 24 Hour Field Monitoring in Eagle Ford Shale Offshore Performance •Accomplished >95% Uptime for Offshore Operated Assets •Executed Successful KikehFPSO 10 Day Shutdown On Time & On Budget DEVELOP AND PRODUCE Fields in a Safe, Responsible, Timely, and Cost Effective Manner
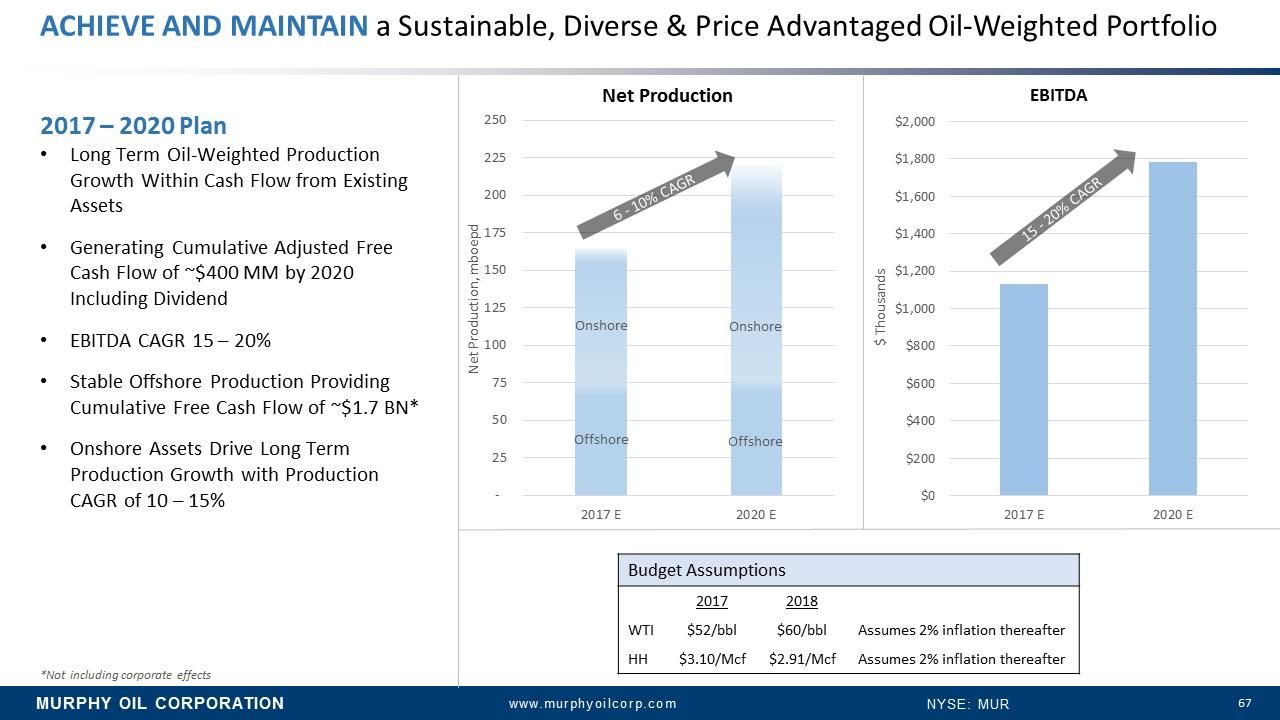
MURPHY OIL CORPORATION www.murphyoilcorp.com NYSE: MUR 67 - 25 50 75 100 125 150 175 200 225 250 2017 E 2020 E Net Production *Not including corporate effects Onshore Net Production, mboepd Budget Assumptions 2017 2018 WTI $52/bbl $60/bbl Assumes 2% inflation thereafter HH $3.10/Mcf $2.91/Mcf Assumes 2% inflation thereafter Offshore Offshore Onshore $0 $200 $400 $600 $800 $1,000 $1,200 $1,400 $1,600 $1,800 $2,000 2017 E 2020 E $ Thousands EBITDA 2017 –2020 Plan •Long Term Oil-Weighted Production Growth Within Cash Flow from Existing Assets •Generating Cumulative Adjusted Free Cash Flow of ~$400 MM by 2020 Including Dividend •EBITDA CAGR 15 –20% •Stable Offshore Production Providing Cumulative Free Cash Flow of ~$1.7 BN* •Onshore Assets Drive Long Term Production Growth with Production CAGR of 10 –15% ACHIEVE AND MAINTAIN a Sustainable, Diverse & Price Advantaged Oil-Weighted Portfolio
MURPHY OIL CORPORATION www.murphyoilcorp.com NYSE: MUR 68 Looking Toward Our Future Re-Focus •Ongoing Cost Focused Culture •Maintained Balance Sheet Strength •Poised for Value-Added Production Growth Re-Balance •Acquire New Unconventional North American Onshore Assets •Position Offshore Exploration in Downturn •Farm-in of Vietnam Re-Energize •Lever Onshore Continuous Improvement Mindset Across Company •Capitalize on Technological Advances in Both Onshore and Offshore •Poised for Production Growth in Price Recovery •Focus on Strategic Business Development