Exhibit 99.2

MURPHY OIL CORPORATION 1 www.murphyoilcorp.com NYSE: MUR MURPHY ANNOUNCES STRATEGIC SALE OF MALAYSIAN PORTFOLIO MARCH 21, 2019 ROGER W. JENKINS PRESIDENT & CHIEF EXECUTIVE OFFICER

MURPHY OIL CORPORATION 2 www.murphyoilcorp.com NYSE: MUR Cautionary Statement & Investor Relations Contacts Cautionary Note to U.S. Investors – The United States Securities and Exchange Commission (SEC) requires oil and natural gas comp anies, in their filings with the SEC, to disclose proved reserves that a company has demonstrated by actual production or conclusive formation tests to be economically and legally producible under e xis ting economic and operating conditions. We may use certain terms in this presentation, such as “resource”, “gross resource”, “recoverable resource”, “net risked P MEAN resource”, “recoverable oil”, “resource base”, “EUR” or “estimated ultimate recovery” and similar terms that the SEC’s rules prohibit us from including in filings with the SEC. The SEC permits the optional disclosure of pro bab le and possible reserves in our filings with the SEC. Investors are urged to consider closely the disclosures and risk factors in our most recent Annual Report on Form 10 - K filed with the SEC and any subse quent Quarterly Report on Form 10 - Q or Current Report on Form 8 - K that we file, available from the SEC’s website. Forward - Looking Statements – This presentation contains forward - looking statements as defined in the Private Securities Litigati on Reform Act of 1995. Forward - looking statements are generally identified through the inclusion of words such as “aim”, “anticipate”, “believe”, “drive”, “estimate”, “expect”, “expressed c onf idence”, “forecast”, “future”, “goal”, “guidance”, “intend”, “may”, “objective”, “outlook”, “plan”, “position”, “potential”, “project”, “seek”, “should”, “strategy”, “target”, “will” or variati ons of such words and other similar expressions. These statements, which express management’s current views concerning future events or results, are subject to inherent risks and uncertainties. Factors that co uld cause one or more of these future events or results not to occur as implied by any forward - looking statement include, but are not limited to: our inability to complete the Malaysia divestiture due to the failure to obtain regulatory approvals, failure of our counterparty to perform its obligations under the transaction agreement, the failure to satisfy all closing conditions otherwise; increase d v olatility or deterioration in the level of crude oil and natural gas prices; deterioration in the success rate of our exploration programs or in our ability to maintain production rates and replace rese rve s; reduced customer demand for our products due to environmental, regulatory, technological or other reasons; adverse foreign exchange movements; political and regulatory instability in the m ark ets where we do business; natural hazards impacting our operations; any other deterioration in our business, markets or prospects; any failure to obtain necessary regulatory approvals; any inabilit y t o service or refinance our outstanding debt or to access debt markets at acceptable price, and adverse developments in the U.S. or global capital markets, credit markets or economies in general. The co mpany cannot, without unreasonable effort, forecast certain items required to develop meaningful comparable GAAP financial measures. These items include commodity prices, foreign exchange rates , interest and tax rates, as well as other non - cash and unusual items and adjustments that occur with a company of our size and geographic diversity. This inhibits our ability to make reliabl e GAAP estimates for numerous of our income statement and cash flow measures, which ultimately could result in a range of projected values so broad as be meaningless to investors. For further disc ussion of factors that could cause one or more of these future events or results not to occur as implied by any forward - looking statement, see “Risk Factors” in our most recent Annual Report on Form 10 - K filed with the U.S. Securities and Exchange Commission (SEC) and any subsequent Quarterly Report on Form 10 - Q or Current Report on Form 8 - K that we file, available from the SEC’s website and fr om Murphy Oil Corporation’s website at http://ir.murphyoilcorp.com. Murphy Oil Corporation undertakes no duty to publicly update or revise any forward - looking statements. Non - GAAP Financial Measures – This presentation refers to certain non - GAAP measures such as “Free Cash Flow” and “Adjusted Cash Flow from Operations”. Definitions of these measures presented herein and reconciliations between U.S. GAAP and non - GAAP financial measures are included in the appendix. Kelly Whitley VP, Investor Relations & Communications 281 - 675 - 9107 Email: kelly_whitley@murphyoilcorp.com Investor Relations Contacts Bryan Arciero Sr. Investor Relations Advisor 832 - 319 - 5374 Email: bryan_arciero@murphyoilcorp.com Emily McElroy Sr. Investor Relations Analyst 870 - 864 - 6324 Email: emily_mcelroy@murphyoilcorp.com
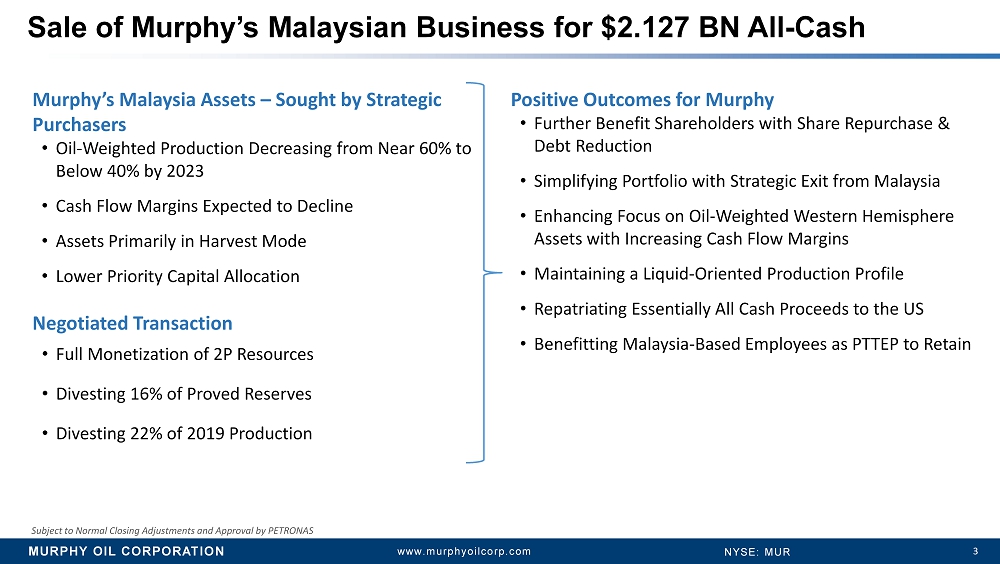
MURPHY OIL CORPORATION 3 www.murphyoilcorp.com NYSE: MUR Sale of Murphy’s Malaysian Business for $2.127 BN All - Cash Positive Outcomes for Murphy • Further Benefit Shareholders with Share Repurchase & Debt Reduction • Simplifying Portfolio with Strategic Exit from Malaysia • Enhancing Focus on Oil - Weighted Western Hemisphere Assets with Increasing Cash Flow Margins • Maintaining a Liquid - Oriented Production Profile • Repatriating Essentially All Cash Proceeds to the US • Benefitting Malaysia - Based Employees as PTTEP to Retain Subject to Normal Closing Adjustments and Approval by PETRONAS Murphy’s Malaysia Assets – Sought by Strategic Purchasers • Oil - Weighted Production Decreasing from Near 60% to Below 40% by 2023 • Cash Flow Margins Expected to Decline • Assets Primarily in Harvest Mode • Lower Priority Capital Allocation Negotiated Transaction • Full Monetization of 2P Resources • Divesting 16% of Proved Reserves • Divesting 22% of 2019 Production
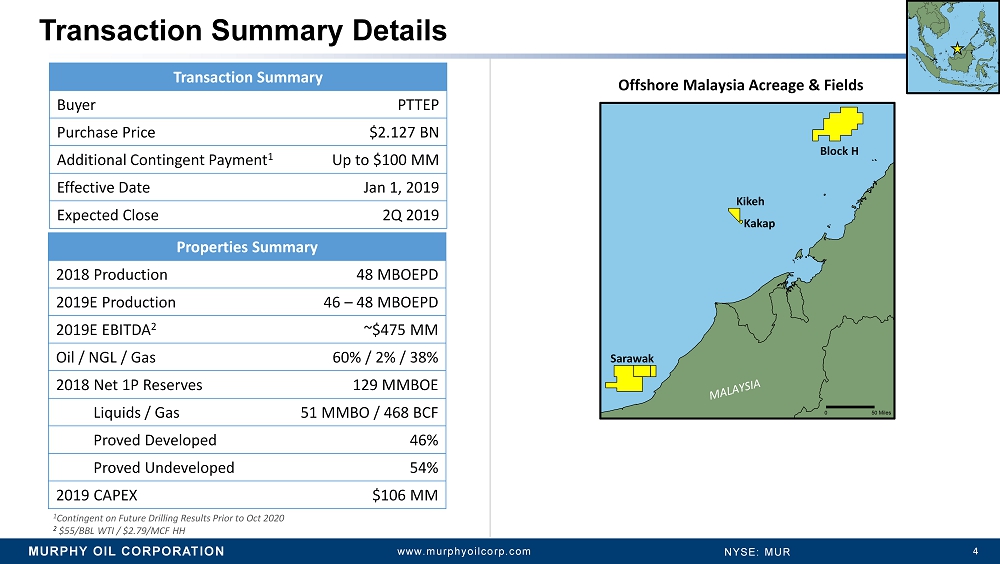
MURPHY OIL CORPORATION 4 www.murphyoilcorp.com NYSE: MUR Transaction Summary Details Transaction Summary Buyer PTTEP Purchase Price $2.127 BN Additional Contingent Payment 1 Up to $100 MM Effective Date Jan 1, 2019 Expected Close 2Q 2019 Properties Summary 2018 Production 48 MBOEPD 2019E Production 46 – 48 MBOEPD 2019E EBITDA 2 ~$475 MM Oil / NGL / Gas 60% / 2% / 38% 2018 Net 1P Reserves 129 MMBOE Liquids / Gas 51 MMBO / 468 BCF Proved Developed 46% Proved Undeveloped 54% 2019 CAPEX $106 MM 1 Contingent on Future Drilling Results Prior to Oct 2020 2 $55/BBL WTI / $2.79/MCF HH Offshore Malaysia Acreage & Fields Block H Kikeh Kakap Sarawak
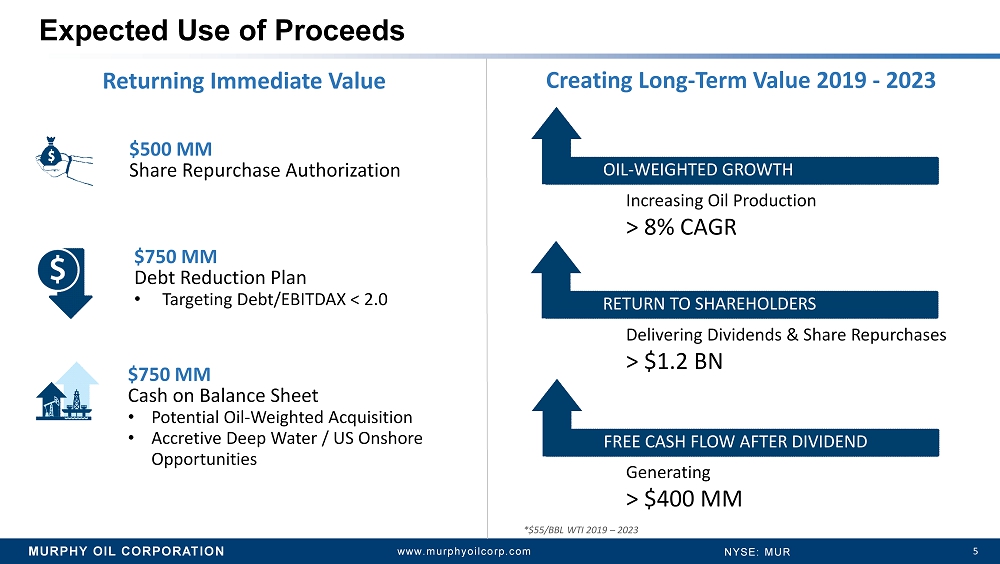
MURPHY OIL CORPORATION 5 www.murphyoilcorp.com NYSE: MUR Expected Use of Proceeds $500 MM Share Repurchase Authorization $750 MM Cash on Balance Sheet • Potential Oil - Weighted Acquisition • Accretive Deep Water / US Onshore Opportunities Returning Immediate Value Delivering Dividends & Share Repurchases > $1.2 BN Generating > $400 MM RETURN TO SHAREHOLDERS OIL - WEIGHTED GROWTH FREE CASH FLOW Creating Long - Term Value 2019 - 2023 Increasing Oil Production > 8% CAGR $750 MM Debt Reduction Plan • Targeting Debt/EBITDAX < 2.0 RETURN TO SHAREHOLDERS FREE CASH FLOW AFTER DIVIDEND *$55/BBL WTI 2019 – 2023
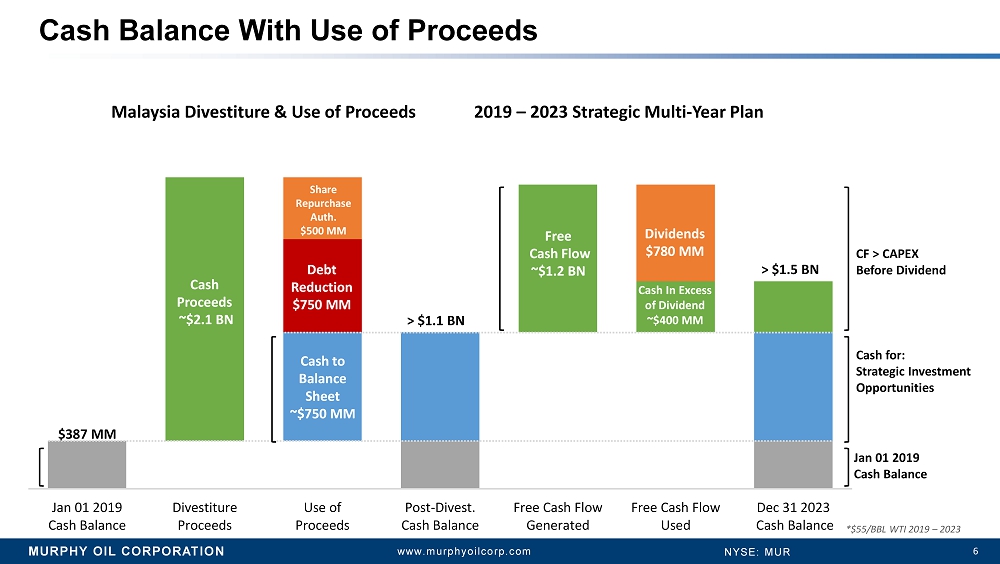
MURPHY OIL CORPORATION 6 www.murphyoilcorp.com NYSE: MUR Jan 01 2019 Cash Balance Divestiture Proceeds Use of Proceeds Post-Divest. Cash Balance Free Cash Flow Generated Free Cash Flow Used Dec 31 2023 Cash Balance Cash Balance With Use of Proceeds Jan 01 2019 Cash Balance CF > CAPEX Before Dividend $387 MM Debt Reduction $750 MM Share Repurchase Auth. $500 MM > $1.5 BN Dividends $780 MM Cash to Balance Sheet ~$750 MM Cash In Excess of Dividend ~$400 MM Cash Proceeds ~$2.1 BN Free Cash Flow ~$1.2 BN Malaysia Divestiture & Use of Proceeds 2019 – 2023 Strategic Multi - Year Plan *$55/BBL WTI 2019 – 2023 Cash for: Strategic Investment Opportunities > $1.1 BN
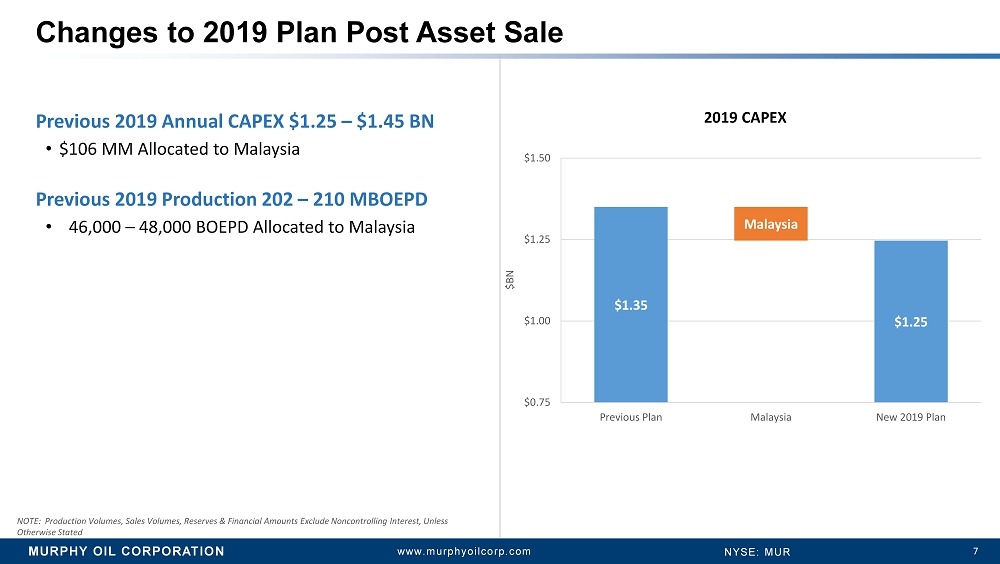
MURPHY OIL CORPORATION 7 www.murphyoilcorp.com NYSE: MUR Previous 2019 Annual CAPEX $1.25 – $1.45 BN • $106 MM Allocated to Malaysia Previous 2019 Production 202 – 210 MBOEPD • 46,000 – 48,000 BOEPD Allocated to Malaysia Changes to 2019 Plan Post Asset Sale NOTE: Production Volumes, Sales Volumes, Reserves & Financial Amounts Exclude Noncontrolling Interest, Unless Otherwise Stated 2019 CAPEX $1.35 $1.25 Malaysia $0.75 $1.00 $1.25 $1.50 Previous Plan Malaysia New 2019 Plan $BN
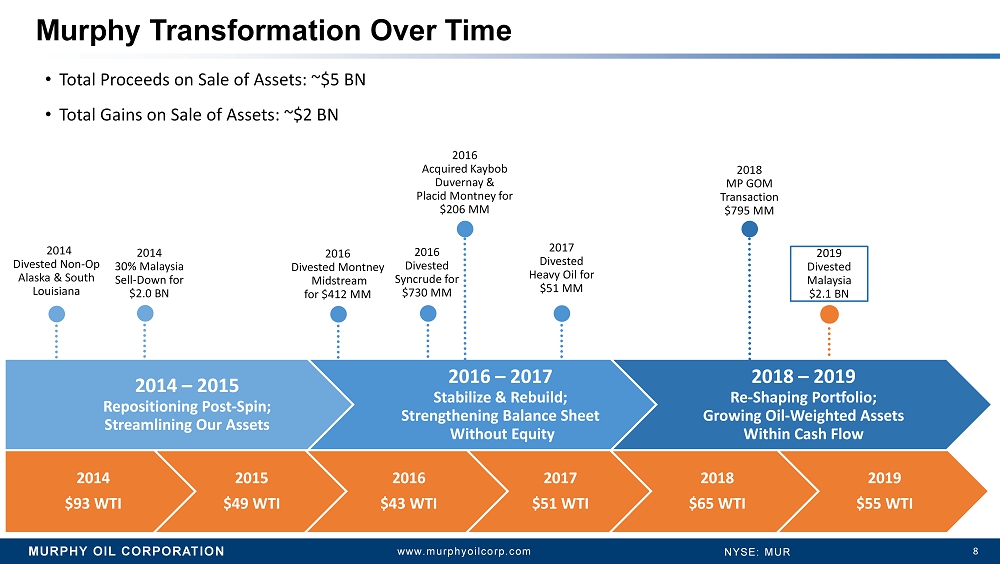
MURPHY OIL CORPORATION 8 www.murphyoilcorp.com NYSE: MUR 2014 $93 WTI 2015 $49 WTI 2016 $43 WTI 2017 $51 WTI 2018 $65 WTI 2019 $55 WTI • Total Proceeds on Sale of Assets: ~$5 BN • Total Gains on Sale of Assets: ~$2 BN Murphy Transformation Over Time 2014 – 2015 Repositioning Post - Spin; Streamlining Our Assets 2016 – 2017 Stabilize & Rebuild; Strengthening Balance Sheet Without Equity 2018 – 2019 Re - Shaping Portfolio; Growing Oil - Weighted Assets Within Cash Flow 2014 Divested Non - Op Alaska & South Louisiana 2014 30% Malaysia Sell - Down for $2.0 BN 2016 Acquired Kaybob Duvernay & Placid Montney for $206 MM 2016 Divested Syncrude for $ 730 MM 2016 Divested Montney Midstream for $ 412 MM 2017 Divested Heavy Oil for $51 MM 2018 MP GOM Transaction $795 MM 2019 Divested Malaysia $2.1 BN
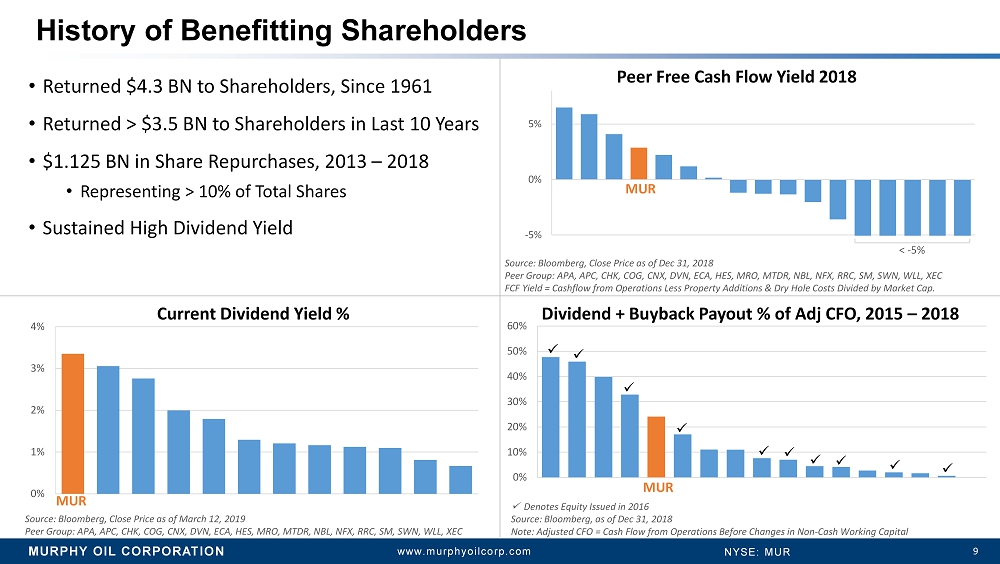
MURPHY OIL CORPORATION 9 www.murphyoilcorp.com NYSE: MUR -5% 0% 5% x Denotes Equity Issued in 2016 Source: Bloomberg, as of Dec 31, 2018 Note: Adjusted CFO = Cash Flow from Operations Before Changes in Non - Cash Working Capital History of Benefitting Shareholders 0% 1% 2% 3% 4% MUR Source: Bloomberg, Close Price as of March 12, 2019 Peer Group: APA, APC, CHK, COG, CNX, DVN, ECA, HES, MRO, MTDR, NBL, NFX, RRC, SM, SWN, WLL, XEC 0% 10% 20% 30% 40% 50% 60% x x x x Dividend + Buyback Payout % of Adj CFO, 2015 – 2018 Current Dividend Yield % MUR MUR Peer Free Cash Flow Yield 2018 • Returned $4.3 BN to Shareholders, Since 1961 • Returned > $3.5 BN to Shareholders in Last 10 Years • $1.125 BN in Share Repurchases, 2013 – 2018 • Representing > 10% of Total Shares • Sustained High Dividend Yield Source: Bloomberg, Close Price as of Dec 31, 2018 Peer Group: APA, APC, CHK, COG, CNX, DVN, ECA, HES, MRO, MTDR, NBL, NFX, RRC, SM, SWN, WLL, XEC FCF Yield = Cashflow from Operations Less Property Additions & Dry Hole Costs Divided by Market Cap. < - 5% x x x x x x
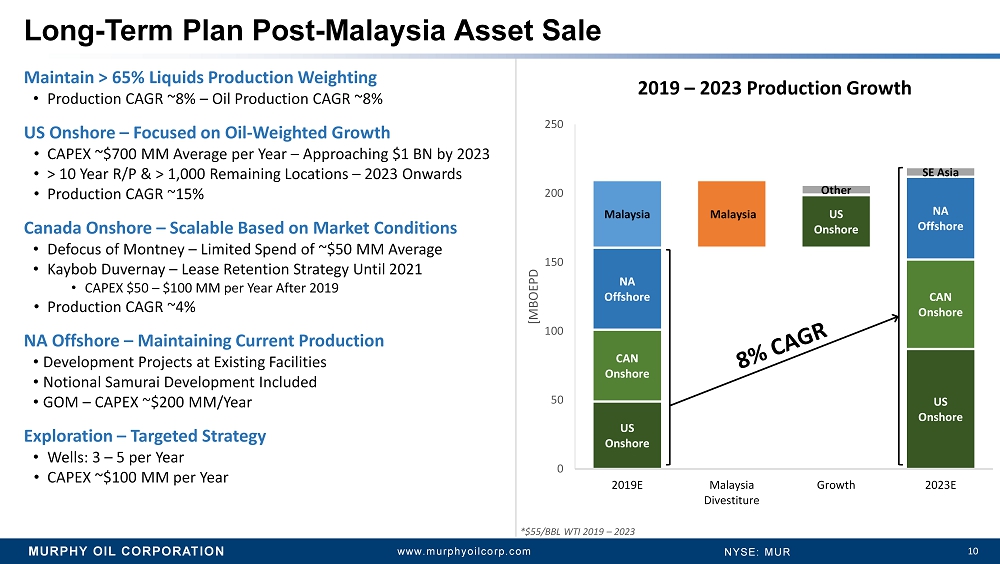
MURPHY OIL CORPORATION 10 www.murphyoilcorp.com NYSE: MUR US Onshore US Onshore US Onshore CAN Onshore CAN Onshore NA Offshore NA Offshore NA Offshore Malaysia Malaysia Other SE Asia 0 50 100 150 200 250 2019E Malaysia Divestiture Growth 2023E [MBOEPD Long - Term Plan Post - Malaysia Asset Sale 2019 – 2023 Production Growth *$55/BBL WTI 2019 – 2023 Maintain > 65% Liquids Production Weighting • Production CAGR ~8% – Oil Production CAGR ~8% US Onshore – Focused on Oil - Weighted Growth • CAPEX ~$700 MM Average per Year – Approaching $1 BN by 2023 • > 10 Year R/P & > 1,000 Remaining Locations – 2023 Onwards • Production CAGR ~15% Canada Onshore – Scalable Based on Market Conditions • Defocus of Montney – Limited Spend of ~$50 MM Average • Kaybob Duvernay – Lease Retention Strategy Until 2021 • CAPEX $50 – $100 MM per Year After 2019 • Production CAGR ~4% NA Offshore – Maintaining Current Production • Development Projects at Existing Facilities • Notional Samurai Development Included • GOM – CAPEX ~$200 MM/Year Exploration – Targeted Strategy • Wells: 3 – 5 per Year • CAPEX ~$100 MM per Year
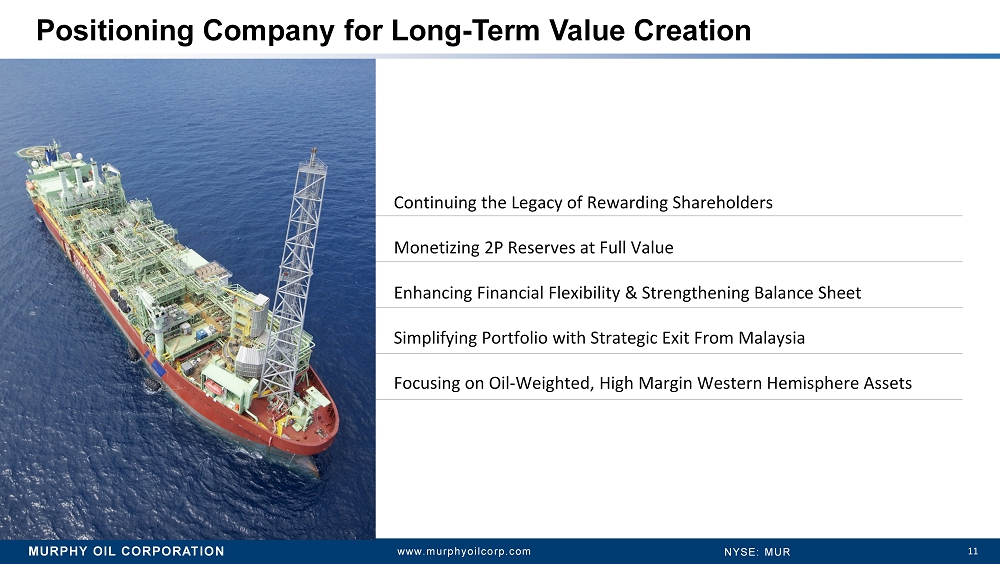
MURPHY OIL CORPORATION 11 www.murphyoilcorp.com NYSE: MUR Continuing the Legacy of Rewarding Shareholders Monetizing 2P Reserves at Full Value Enhancing Financial Flexibility & Strengthening Balance Sheet Simplifying Portfolio with Strategic Exit From Malaysia Focusing on Oil - Weighted, High Margin Western Hemisphere Assets Positioning Company for Long - Term Value Creation

MURPHY OIL CORPORATION 12 www.murphyoilcorp.com NYSE: MUR ONSHORE APPENDIX
MURPHY OIL CORPORATION 13 www.murphyoilcorp.com NYSE: MUR Non - GAAP Financial Measure Definitions & Reconciliations The following list of Non - GAAP financial measure definitions and related reconciliations is intended to satisfy the requirements of Regulation G of the Securities Exchange Act of 1934 , as amended . This information is historical in nature . Murphy undertakes no obligation to publicly update or revise any Non - GAAP financial measure definitions and related reconciliations .
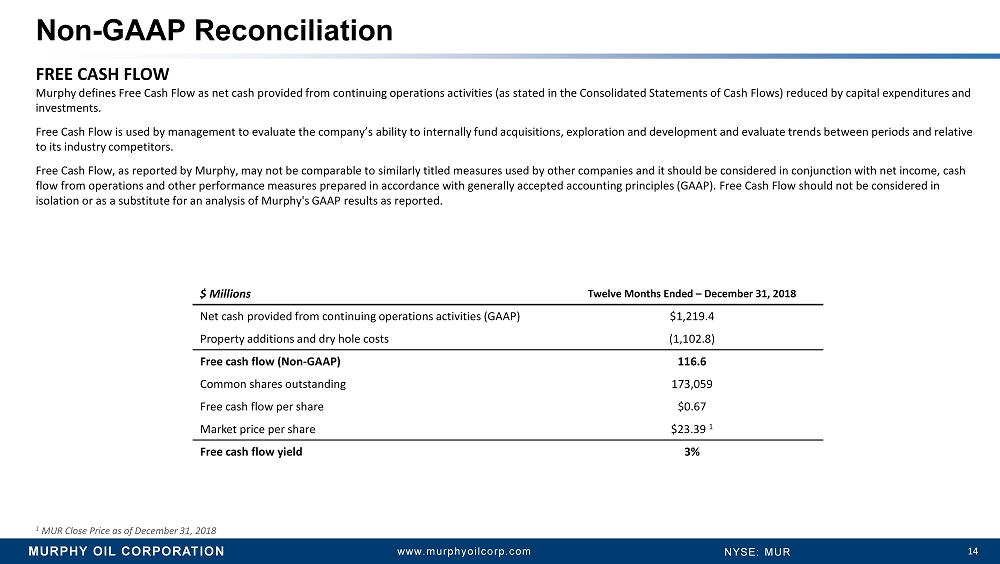
MURPHY OIL CORPORATION 14 www.murphyoilcorp.com NYSE: MUR Non - GAAP Reconciliation FREE CASH FLOW Murphy defines Free C ash F low as net cash provided from continuing operations activities (as stated in the Consolidated Statements of Cash Flows) reduc ed by capital expenditures and investments. Free C ash Flow is used by management to evaluate the company’s ability to internally fund acquisitions, exploration and development an d evaluate trends between periods and relative to its industry competitors. Free Cash Flow , as reported by Murphy, may not be comparable to similarly titled measures used by other companies and it should be consider ed in conjunction with net income, cash flow from operations and other performance measures prepared in accordance with generally accepted accounting principles (GAA P). Free Cash Flow should not be considered in isolation or as a substitute for an analysis of Murphy's GAAP results as reported. $ Millions Twelve Months Ended – December 31, 2018 Net cash provided from continuing operations activities (GAAP) $1,219.4 Property additions and dry hole costs (1,102.8) Free cash flow (Non - GAAP) 116.6 Common shares outstanding 173,059 Free cash flow per share $0.67 Market price per share $23.39 1 Free cash flow yield 3% 1 MUR Close Price as of December 31, 2018
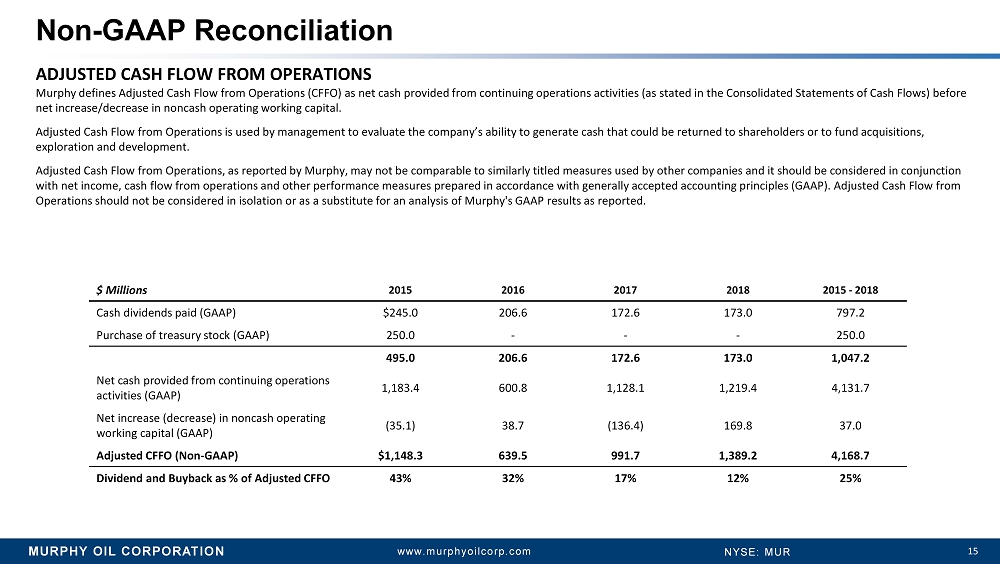
MURPHY OIL CORPORATION 15 www.murphyoilcorp.com NYSE: MUR Non - GAAP Reconciliation ADJUSTED CASH FLOW FROM OPERATIONS Murphy defines Adjusted Cash Flow from Operations (CFFO) as net cash provided from continuing operations activities (as state d i n the Consolidated Statements of Cash Flows) before net increase/decrease in noncash operating working capital. Adjusted Cash Flow from Operations is used by management to evaluate the company’s ability to generate cash that could be ret urn ed to shareholders or to fund acquisitions, exploration and development. Adjusted Cash Flow from Operations, as reported by Murphy, may not be comparable to similarly titled measures used by other companies and it should be considered in conjunction with net income, cash flow from operations and other performance measures prepared in accordance with generally accepted acco unt ing principles (GAAP). Adjusted Cash Flow from Operations should not be considered in isolation or as a substitute for an analysis of Murphy's GAAP results as reported. $ Millions 2015 2016 2017 2018 2015 - 2018 Cash dividends paid (GAAP) $245.0 206.6 172.6 173.0 797.2 Purchase of treasury stock (GAAP) 250.0 - - - 250.0 495.0 206.6 172.6 173.0 1,047.2 Net cash provided from continuing operations activities (GAAP) 1,183.4 600.8 1,128.1 1,219.4 4,131.7 Net increase (decrease) in noncash operating working capital (GAAP) (35.1) 38.7 (136.4) 169.8 37.0 Adjusted CFFO (Non - GAAP) $1,148.3 639.5 991.7 1,389.2 4,168.7 Dividend and Buyback as % of Adjusted CFFO 43% 32% 17% 12% 25%
MURPHY OIL CORPORATION 16 www.murphyoilcorp.com NYSE: MUR MURPHY ANNOUNCES STRATEGIC SALE OF MALAYSIAN PORTFOLIO MARCH 21, 2019 ROGER W. JENKINS PRESIDENT & CHIEF EXECUTIVE OFFICER 16