EXHIBIT 13
Financial and Operating Highlights
| | | | | | | | | | | | | | | |
(Thousands of dollars except per share data)
| | 2004
| | 2003
| | % Change
2004–2003
| | | 2002
| | % Change
2003–2002
| |
For the Year | | | | | | | | | | | | | | | |
Revenues | | $ | 8,359,839 | | $ | 5,164,657 | | 62 | % | | $ | 3,796,917 | | 36 | % |
Net income | | | 701,315 | | | 294,197 | | 138 | % | | | 111,508 | | 164 | % |
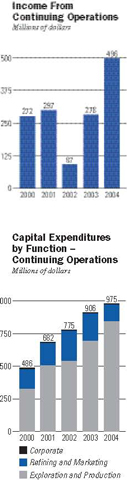
Income from continuing operations | | | 496,395 | | | 278,410 | | 78 | % | | | 87,279 | | 219 | % |
Cash dividends paid | | | 78,205 | | | 73,464 | | 6 | % | | | 70,898 | | 4 | % |
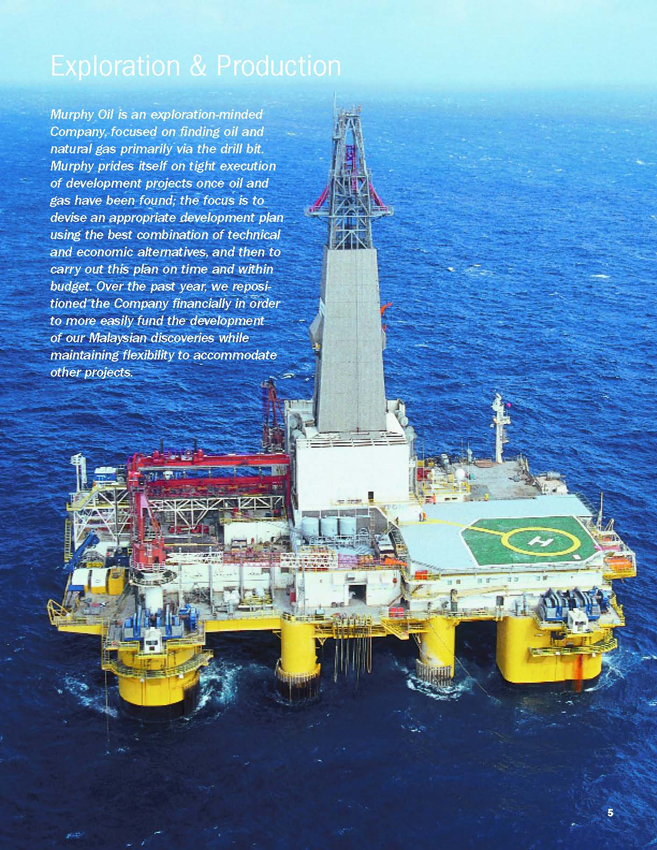
Capital expenditures1 | | | 975,393 | | | 906,114 | | 8 | % | | | 774,844 | | 17 | % |
Net cash provided by operating activities | | | 1,097,018 | | | 652,278 | | 68 | % | | | 532,844 | | 22 | % |
Average common shares outstanding – diluted | | | 93,443,511 | | | 92,742,766 | | .8 | % | | | 92,134,967 | | .7 | % |
| | |
|
| |
|
| |
|
| |
|
| |
|
|
At End of Year | | | | | | | | | | | | | | | |
Working capital | | $ | 424,372 | | $ | 228,529 | | 86 | % | | $ | 136,268 | | 68 | % |
Net property, plant and equipment | | | 3,685,594 | | | 3,530,800 | | 4 | % | | | 2,886,599 | | 22 | % |
Total assets | | | 5,458,243 | | | 4,712,647 | | 16 | % | | | 3,885,775 | | 21 | % |
Long-term debt | | | 613,355 | | | 1,090,307 | | -44 | % | | | 862,808 | | 26 | % |
Stockholders’ equity | | | 2,649,156 | | | 1,950,883 | | 36 | % | | | 1,593,553 | | 22 | % |
| | |
|
| |
|
| |
|
| |
|
| |
|
|
Per Share of Common Stock | | | | | | | | | | | | | | | |
Net income – diluted | | $ | 7.51 | | $ | 3.17 | | 137 | % | | $ | 1.21 | | 162 | % |
Cash dividends paid | | | .85 | | | .80 | | 6 | % | | | .775 | | 3 | % |
Stockholders’ equity | | | 28.78 | | | 21.24 | | 35 | % | | | 17.38 | | 22 | % |
| | |
|
| |
|
| |
|
| |
|
| |
|
|
Net Crude Oil and Gas Liquids Produced – barrels per day1 | | | 93,634 | | | 76,620 | | 22 | % | | | 67,549 | | 13 | % |
United States | | | 19,314 | | | 4,526 | | 327 | % | | | 4,128 | | 10 | % |
Canada | | | 43,689 | | | 44,935 | | -3 | % | | | 40,575 | | 11 | % |
Other International | | | 30,631 | | | 27,159 | | 13 | % | | | 22,846 | | 19 | % |
| | |
|
| |
|
| |
|
| |
|
| |
|
|
Net Natural Gas Sold – thousands of cubic feet per day1 | | | 109,452 | | | 111,791 | | -2 | % | | | 107,749 | | 4 | % |
United States | | | 88,621 | | | 82,281 | | 8 | % | | | 88,067 | | -7 | % |
Canada | | | 13,972 | | | 19,946 | | -30 | % | | | 12,709 | | 57 | % |
United Kingdom | | | 6,859 | | | 9,564 | | -28 | % | | | 6,973 | | 37 | % |
| | |
|
| |
|
| |
|
| |
|
| |
|
|
Crude Oil Refined – barrels per day | | | 164,275 | | | 119,281 | | 38 | % | | | 143,829 | | -17 | % |
North America | | | 133,242 | | | 90,869 | | 47 | % | | | 114,189 | | -20 | % |
United Kingdom | | | 31,033 | | | 28,412 | | 9 | % | | | 29,640 | | -4 | % |
| | |
|
| |
|
| |
|
| |
|
| |
|
|
Petroleum Products Sold – barrels per day | | | 338,908 | | | 264,928 | | 28 | % | | | 210,631 | | 26 | % |
North America | | | 301,801 | | | 229,876 | | 31 | % | | | 176,427 | | 30 | % |
United Kingdom | | | 37,107 | | | 35,052 | | 6 | % | | | 34,204 | | 2 | % |
| | |
|
| |
|
| |
|
| |
|
| |
|
|
Stockholder and Employee Data | | | | | | | | | | | | | | | |
Common shares outstanding (thousands)2 | | | 92,035 | | | 91,871 | | .2 | % | | | 91,689 | | .2 | % |
Number of stockholders of record2 | | | 2,864 | | | 2,839 | | .9 | % | | | 2,826 | | .5 | % |
Number of employees2 | | | 5,826 | | | 4,789 | | 22 | % | | | 4,010 | | 19 | % |
Average number of employees | | | 5,276 | | | 4,446 | | 19 | % | | | 3,875 | | 15 | % |
| | |
|
| |
|
| |
|
| |
|
| |
|
|
| 1 | Continuing operations only. |
1
Dear Fellow Shareholders,
Murphy Oil Corporation’s financial results in 2004, aided by strong crude oil and natural gas prices and increasing crude oil production, were the best in the Company’s history. Reported net income was $701.3 million ($7.51 per share) with net cash provided by operating activities of $1.1 billion. This income figure includes the gain from the sale, which closed in the second quarter, of most of the Company’s Western Canadian conventional producing properties. Significantly, even when this gain and prior operating results for these properties are excluded, your Company still reported record income from continuing operations of $496.4 million ($5.31 per share), with net cash provided of $1.0 billion. Clearly the Company benefited from extremely high crude oil and North American natural gas prices during the year, but importantly, we placed ourselves in a position to capture what the market provided. Due to timely acquisitions made prior to the surge in prices, and important discoveries now on stream in the deepwater of the Gulf of Mexico and in the shallow-water offshore Sarawak, Malaysia, the Company’s production in 2004 was a near-record 120,100 barrel equivalents per day despite selling over 30,500 barrel equivalents per day of mature, high-cost properties over the last two years. A new production record should be established in 2005 as additional fields come on stream. I am proud of the Company’s accomplishments in 2004. We made significant discoveries in the deepwater Gulf of Mexico at Thunderhawk (37.5%), and in Malaysia at Kakap and Senangin in deepwater Block K (80%) offshore Sabah and Kenarong in Block PM 311 (75%) offshore Peninsular Malaysia. In addition, the Medusa field (60%) located in the deepwater Gulf of Mexico reached its projected plateau rate of 40,000 barrel equivalents per day and the Front Runner field (37.5%), also in the deepwater Gulf, commenced producing. All of these discoveries and both of the Gulf fields are operated by the Company. Importantly, we received approval from the appropriate Malaysian authorities and our Board of Directors for the field development plan at Kikeh (80%), the large Company-operated discovery located in deepwater Sabah. This field is forecast to start producing in the second half of 2007.
2
It is vitally important to the long-term success of an oil and gas company to continually evaluate the various producing assets in its portfolio with an eye towards upgrading the mix and quality. Capital can be withdrawn from less promising areas and redeployed to faster growing regions destined to positively impact shareholder value. To this end, we sold the bulk of our Western Canadian assets early in 2004. These were high-cost fields in fast decline that could no longer contribute to our future growth. Conversely, we purchased a significant interest in a conventional heavy oil field in the Seal area in Northern Alberta, Canada in September 2004. The Company, already a large owner of the field, added 2,750 barrels per day of production that is on track to grow to 8,500 barrels per day by 2007. These barrels do not require additional heat or energy to produce. Therefore they are among the lowest cost heavy oil barrels in the basin to lift.
The year of 2004 was also eventful in our downstream business. The new hydrocracker became operational early in the year giving Meraux the capability to run 125,000 barrels per day of crude and make both ultra-low sulfur gasoline and diesel products. The ROSE (Residual Oil Supercritical Extractor) unit, rebuilt after a fire in 2003, started commissioning at the end of the year. The ROSE unit enables Meraux to run a less expensive medium-sulfur crude making the plant more competitive. On the retail side, the Company now has 771 Wal-Mart gasoline units in operation and continues to be the leader in hypermarket gasoline retailing. The Wal-Mart investment plays an important strategic role for the Company. We now sell approximately 150,000 barrels of retail gasoline per day compared to producing 110,000 barrels per day of crude oil. As crude oil prices fall, wholesale gasoline prices typically fall in tandem and while retail prices follow, they typically decline more slowly (conversely they increase more slowly when crude prices rise). As a result, we can usually “trap” profit in our retail business in a falling crude oil price environment, thereby softening the financial impact on our upstream business.

Lastly in 2004, at year-end we paid down $514 million of long-term debt ending the year with a debt to total capitalization ratio of 18.8%,
3
one of the lowest in the industry. As a result, we can now develop the $1.9 billion Kikeh field while continuing to aggressively drill the Company’s exploration acreage. Naturally, this latter activity is where the next large value creation event will likely occur in our Company.
As good as 2004 was, I believe that 2005 will be better. For starters, we announced a natural gas discovery at South Dachshund (50%) in the deepwater Eastern Gulf of Mexico as well as an oil discovery at Azurite Marine #1 (85%) in Murphy’s first wildcat well offshore Congo-Brazzaville in Africa. The latter discovery is particularly important because it opens a new and potentially significant basin for Murphy. For the balance of the year important wildcats are planned offshore Sabah, offshore Sarawak, and offshore Peninsular Malaysia, all in Malaysia; offshore Congo to follow up the initial success at Azurite Marine; and in the deepwater Gulf of Mexico to delineate the Thunderhawk discovery and drill more expanded Miocene prospects. Our Company has large, promising acreage positions in three of the most prolific oil basins on the planet, and most importantly, we already have significant discoveries in all three with the expectation of more to come.
The Company’s downstream investments in 2005 will continue to be dominated by capital allocated to build gasoline outlets in the parking lots of Wal-Mart Supercenters. We believe we are one of the lowest cost, highest volume and fastest growing retail networks in America. Furthermore, we intend to maintain and expand this leadership position.
The world’s economy, driven by fast-growing, market-oriented China and India, needs crude oil at an accelerating rate just at a time when this resource has become more expensive and difficult to find than has historically been the case. Your Company, due to exceptional performance by exceptional people, has demonstrated an ability to help satisfy this need by finding large oil fields. Our continued success is by no means guaranteed, but the people, capital and desire are in place to make this happen.
Rodes Hart retired in May of 2004 from the Murphy Board after 29 years. I will miss Rodes’ incisive business judgment, candor and support. He grasped issues quickly and was always very forthright in his assessments and, resultantly, represented shareholders’ interests extremely well.
Thank you for your ongoing support.
|
/s/ Claiborne P. Deming
|
| Claiborne P. Deming |
President and Chief Executive Officer |
|
February 25, 2005 |
El Dorado, Arkansas |
4
5
6
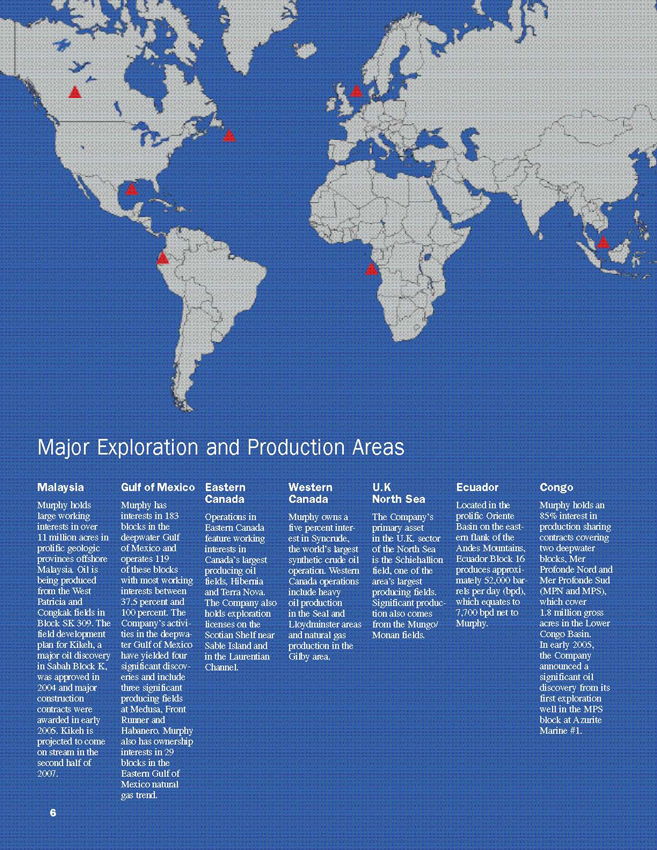
Murphy Oil’s focus is finding oil and natural gas, and this is primarily done through an exploration program that is centered around deepwater Gulf of Mexico and international prospects. In addition to our exploration opportunities in North America, we believe there are many opportunities for significant oil and gas discoveries in other parts of the globe, as evidenced by the level of our exploration activities in Malaysia and the Congo. During 2004, we repositioned the Company financially in order to more easily fund the development of our Malaysian discoveries. We sold a significant portion of our Western Canadian conventional oil and natural gas assets and used the proceeds to pay down debt. Our available credit capacity, combined with sustained cash flow from our largest producing assets of Hibernia and Terra Nova offshore Eastern Canada, Syncrude synthetic oil project in Western Canada, Schiehallion and Mungo/Monan in the U.K. sector of the North Sea, and Medusa and Front Runner in the deepwater Gulf of Mexico should allow us to fund our share of the Kikeh development in Block K, offshore Malaysia, while maintaining flexibility to accommodate other development projects.
During 2004, Murphy allocated 86% of its capital expenditures to upstream operations as we continued to fund our deepwater drilling programs in Malaysia, the Gulf of Mexico and offshore Congo; the completion of the West Patricia Phase II development offshore Sarawak, Malaysia, and the Front Runner development on Green Canyon Blocks 338/339; and the continued Phase III expansion of Syncrude, the world’s largest synthetic crude oil operation. As anticipated, production volumes ramped up at our deepwater developments at Medusa in Mississippi Canyon Blocks 538/582 and Habanero in Garden Banks Block 341. Front Runner, in Green Canyon Blocks 338/339, was placed on stream in early December 2004. For the full year, our worldwide production averaged over 120,000 barrels of oil equivalent per day (boepd). In the fourth quarter 2004 production was affected by Hurricane Ivan as damaged facilities and project delays reduced annualized 2004 production by about 4,000 boepd.
International — Focused on Malaysia and Congo
During 2004, activities in the Company’s offshore acreage in Malaysia resulted in additional discoveries in Blocks K (80%) and PM 311 (75%), the completion of Phase II development for the West Patricia production facility on Block SK 309 (85%), and most importantly, the sanctioning of the Kikeh Field Development Plan (FDP) by our Board of Directors and Malaysian authorities. On Block K in the Sabah Trough oil and gas province, new discoveries were made at Kakap, Senangin and Kikeh #7 deep. In the Peninsular Malaysia province, discovery wells were drilled at Kenarong and Pertang in Block PM 311. Offshore Sarawak, the Congkak field was successfully tied back through the West Patricia production complex and first oil at this field occurred late in the year. Our exploration results in deepwater Sabah and offshore Peninsular Malaysia and Sarawak confirm our belief that there continues to be significant hydrocarbon potential across these regions. Our plans for the coming year include aggressive appraisal programs for Blocks K and PM 311 along with continued exploration in these and other blocks in Malaysia. With the full sanctioning of the Kikeh FDP achieved in the third quarter of 2004, we are targeting first oil from this world-class discovery in the second half of 2007. When brought on stream, Kikeh is expected to provide the largest net production from a single field in the history of the Company.
In December 2004, Murphy received final approval on two production sharing contracts on its adjoining licensed acreage at Mer Profonde Nord and Mer Profonde Sud (MPN and MPS, both 85%) in the Lower Congo Basin, offshore Republic of the Congo. In late December, we spudded our first exploratory well on the Azurite Marine prospect in the southern corner of MPS and in early 2005 announced a significant oil discovery at this well. The Company plans to drill at least two more wells on nearby separate prospects in 2005. Success in the Congo would establish another focus area for Murphy’s international program.
7
Exploration and Production Statistical Summary
| | | | | | | | | | | |
| | | 2004
| | 2003
| | 2002
| | 2001
| | 2000
|
Net crude oil and condensate production – barrels per day | | | | | | | | | | | |
United States | | | 19,154 | | 4,374 | | 3,837 | | 4,339 | | 4,770 |
Canada – light | | | 168 | | 582 | | 1,256 | | 1,981 | | 2,055 |
heavy | | | 5,838 | | 4,705 | | 3,609 | | 4,521 | | 3,010 |
offshore | | | 25,407 | | 28,534 | | 24,037 | | 9,535 | | 9,199 |
synthetic | | | 11,794 | | 10,483 | | 11,362 | | 10,479 | | 8,443 |
United Kingdom | | | 10,800 | | 14,513 | | 18,180 | | 20,049 | | 20,679 |
Ecuador | | | 7,735 | | 5,172 | | 4,544 | | 5,319 | | 6,405 |
Malaysia | | | 11,885 | | 7,301 | | – | | – | | – |
Net natural gas liquids production – barrels per day | | | | | | | | | | | |
United States | | | 160 | | 152 | | 291 | | 413 | | 551 |
Canada | | | 482 | | 631 | | 311 | | 540 | | 182 |
United Kingdom | | | 211 | | 173 | | 122 | | 165 | | 216 |
| | |
|
| |
| |
| |
| |
|
Continuing operations | | | 93,634 | | 76,620 | | 67,549 | | 57,341 | | 55,510 |
Discontinued operations | | | 3,106 | | 6,832 | | 8,821 | | 10,014 | | 9,749 |
| | |
|
| |
| |
| |
| |
|
Total liquids produced | | | 96,740 | | 83,452 | | 76,370 | | 67,355 | | 65,259 |
| | |
|
| |
| |
| |
| |
|
Net crude oil and condensate sold – barrels per day | | | | | | | | | | | |
United States | | | 19,154 | | 4,374 | | 3,837 | | 4,339 | | 4,769 |
Canada – light | | | 168 | | 582 | | 1,256 | | 1,981 | | 2,055 |
heavy | | | 5,838 | | 4,705 | | 3,609 | | 4,521 | | 3,010 |
offshore | | | 26,306 | | 28,542 | | 23,935 | | 9,862 | | 9,456 |
synthetic | | | 11,794 | | 10,483 | | 11,362 | | 10,479 | | 8,443 |
United Kingdom | | | 10,800 | | 14,591 | | 18,209 | | 20,206 | | 20,921 |
Ecuador | | | 3,414 | | 4,997 | | 4,293 | | 5,381 | | 6,393 |
Malaysia | | | 11,020 | | 7,235 | | – | | – | | – |
Net natural gas liquids sold – barrels per day | | | | | | | | | | | |
United States | | | 160 | | 152 | | 291 | | 413 | | 551 |
Canada | | | 482 | | 631 | | 311 | | 540 | | 182 |
United Kingdom | | | 124 | | 131 | | 149 | | 148 | | 216 |
| | |
|
| |
| |
| |
| |
|
Continuing operations | | | 89,260 | | 76,423 | | 67,252 | | 57,870 | | 55,996 |
Discontinued operations | | | 3,106 | | 6,832 | | 8,821 | | 10,014 | | 9,749 |
| | |
|
| |
| |
| |
| |
|
Total liquids sold | | | 92,366 | | 83,255 | | 76,073 | | 67,884 | | 65,745 |
| | |
|
| |
| |
| |
| |
|
Net natural gas sold – thousands of cubic feet per day | | | | | | | | | | | |
United States | | | 88,621 | | 82,281 | | 88,067 | | 112,616 | | 141,373 |
Canada | | | 13,972 | | 19,946 | | 12,709 | | 25,701 | | 9,590 |
United Kingdom | | | 6,859 | | 9,564 | | 6,973 | | 13,125 | | 10,850 |
| | |
|
| |
| |
| |
| |
|
Continuing operations | | | 109,452 | | 111,791 | | 107,749 | | 151,442 | | 161,813 |
Discontinued operations | | | 30,760 | | 103,543 | | 189,182 | | 129,793 | | 67,599 |
| | |
|
| |
| |
| |
| |
|
Total natural gas sold | | | 140,212 | | 215,334 | | 296,931 | | 281,235 | | 229,412 |
| | |
|
| |
| |
| |
| |
|
Net hydrocarbons produced – equivalent barrels1,2 per day | | | 120,109 | | 119,341 | | 125,859 | | 114,228 | | 103,494 |
Estimated net hydrocarbon proved reserves – million equivalent barrels1,2,3 | | | 385.6 | | 425.5 | | 455.3 | | 501.2 | | 442.3 |
| | |
|
| |
| |
| |
| |
|
Weighted average sales prices4 | | | | | | | | | | | |
Crude oil and condensate – dollars per barrel | | | | | | | | | | | |
United States | | $ | 35.35 | | 24.22 | | 24.25 | | 24.92 | | 30.38 |
Canada5 – light | | | 37.70 | | 27.68 | | 22.81 | | 21.73 | | 29.98 |
heavy | | | 20.26 | | 12.36 | | 16.83 | | 11.21 | | 16.74 |
offshore | | | 36.60 | | 27.08 | | 25.36 | | 23.77 | | 27.16 |
synthetic | | | 40.35 | | 24.97 | | 25.64 | | 25.04 | | 29.62 |
United Kingdom | | | 36.82 | | 29.59 | | 24.39 | | 24.44 | | 27.78 |
Ecuador | | | 24.78 | | 22.99 | | 19.64 | | 17.00 | | 22.01 |
Malaysia | | | 41.35 | | 29.42 | | – | | – | | – |
Natural gas liquids – dollars per barrel | | | | | | | | | | | |
United States | | | 29.77 | | 23.42 | | 17.13 | | 20.40 | | 23.04 |
Canada5 | | | 30.83 | | 24.63 | | 16.98 | | 20.78 | | 22.98 |
United Kingdom | | | 26.91 | | 22.49 | | 18.28 | | 19.12 | | 23.64 |
Natural gas – dollars per thousand cubic feet | | | | | | | | | | | |
United States | | | 6.45 | | 5.29 | | 3.37 | | 4.64 | | 4.01 |
Canada5 | | | 5.64 | | 4.47 | | 2.59 | | 3.54 | | 4.68 |
United Kingdom5 | | | 4.52 | | 3.50 | | 2.76 | | 2.52 | | 1.81 |
| 1 | Natural gas converted at a 6:1 ratio. |
| 4 | Includes intracompany transfers at market prices. |
8
In 2004, our Block 16 property (20%) in Ecuador produced 7,700 barrels of oil per day (bpd) net to Murphy. This long-life asset has a sustainable production profile and is currently producing from numerous fields in the Oriente Basin. Between June and December 2004, the Company did not receive its equity share of oil sales associated with Block 16 production due to a dispute with the operator over Murphy’s new transportation and marketing arrangements. Murphy is owed over 1.5 million barrels of oil by the other working interest owners, and we are working diligently to complete an equitable settlement of this matter. We believe this sales shortfall will be made up during 2005 via either a cash settlement or allocation of additional oil barrels from 2005 production.
In the North Sea, our primary assets Schiehallion (5.88%) and Mungo/Monan (12.65%) continue to produce at an average net rate of more than 9,000 boepd with several phases of development still to come. The Company sold its fully-exploited “T” Block field in 2004 recognizing a $24.6 million after-tax gain; “T” Block was a late life asset where operating costs were becoming unacceptably high in relation to revenue generation.
Deepwater Gulf of Mexico — Moving into the Expanded Miocene Trend
In May 2004, Murphy’s U.S. operations made its first discovery in the expanded Miocene play in the deepwater Gulf of Mexico, where recent industry activity has resulted in the noteworthy Thunderhorse, Tahiti and Atlantis discoveries. Our Thunderhawk discovery (37.5%), adjacent to the Thunderhorse field in Mississippi Canyon, encountered 300 feet of hydrocarbons in two high-quality Miocene sand reservoirs. In our Eastern Gulf of Mexico program, we also recorded our first success with the South Dachshund (50%) Miocene gas discovery in January 2005. Our 29 block acreage position in the Eastern Gulf holds multiple prospects which, along with South Dachshund, can be tied-in to existing infrastructure. Our Front Runner NW discovery (37.5%), also drilled in 2004, will be a tie-back to our current Front Runner production facility.
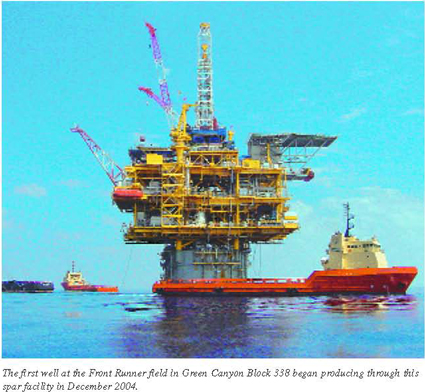
The Front Runner field (37.5%), located in Green Canyon Blocks 338/339, began producing in December 2004 from the first of eight wells, the remainder of which will be completed in 2005 and early 2006. The development is a Truss Spar-type Floating Production System with a peak handling capacity of 60,000 bpd of oil and 110 million cubic feet per day of natural gas. It will serve as the production hub for Company-operated discoveries at Front Runner, Front Runner South, Quatrain and Front Runner NW. Production will reach peak spar capacity in 2006.
9
Our Medusa field (60%), producing since the fourth quarter of 2003, now has all six wells on production. The field reached payout in December 2004, despite almost one month of downtime due to workover rig damage caused by Hurricane Ivan. Production from Medusa resumed in mid-October 2004 and is currently at the spar’s peak gross capacity of 40,000 barrels of oil per day. Medusa, Front Runner and another deepwater producing field at Habanero (33.75%), should enable Murphy to raise its U.S. deepwater production to 36,000 boepd in 2005. With our recent discoveries at Thunderhawk and South Dachshund, along with our producing assets in Medusa, Front Runner and Habanero, the Company is now firmly established as an explorer, developer and producer in the deepwater Gulf of Mexico oil and gas provinces.
Gulf of Mexico activity planned for 2005 includes continued appraisal and development of the Thunderhawk discovery and the completion and start-up of two smaller subsea developments at Seventeen Hands (37.5%) and North Medusa (17%). We will increase our exploration focus on the expanded Miocene play with a number of prospects targeted for future drilling, some relatively close to existing Murphy infrastructure. The Company will continue to high-grade our portfolio of prospects in the expanded Miocene and Eastern Gulf natural gas trend, and we plan to take advantage of the large number of industry lease relinquishments which will be rebid at scheduled lease sales in 2006 and 2007.
Canada — Expanding Heavy Oil and Oil Sands
As announced earlier in 2004, the Company divested approximately two-thirds of its conventional oil and natural gas interests in Western Canada, retaining the Gilby area natural gas property and the Seal and Lloydminster heavy oil properties. Murphy’s working interest in these retained areas generally range from 50% to 100%. With active drilling programs in all three areas, we anticipate a resumption of production growth, particularly in heavy oil. The $583 million received from the sale of the Western Canadian assets will be redirected to fund our higher growth and higher return exploration and development programs in Malaysia, deepwater Gulf of Mexico and the Congo. The sale included proved reserves (net of royalty) of approximately 43 million barrel equivalents from heavy oil, light oil and natural gas properties. In September 2004, we increased our position in the Seal area with an acreage acquisition for $121 million, and by year-end 2004 we had ramped up production at Seal to more then 7,000 bpd of heavy oil. We anticipate further production gains from Seal through additional drilling and facility installation in the coming year.
The Phase III expansion at Syncrude (5%), the world’s largest synthetic oil project, will bring gross synthetic oil production to 350,000 bpd by 2006. Offshore Eastern Canada, our legacy assets of Hibernia (6.5%) and Terra Nova (12%) continue to provide a strong financial contribution. Exploratory efforts on the Scotian Shelf resulted in a disappointing dry hole at Crimson, which was an attempt to extend the Annapolis discovery and achieve development economics for the block. Given the result at Crimson, and in the absence of a clear path forward for East Coast exploration, we elected to expense the Annapolis well at the same time. Plans for further exploration on the East Coast are being re-evaluated.
Production Growth
We believe that our strategy of diverting a large portion of our investment in the conventional Western Canadian Sedimentary Basin to aggressively pursue growth opportunities in other areas is both sound and well-timed. Not only is our Company positioned for significant production growth in the coming years — as evidenced by new production at Front Runner, expansion at Syncrude, and development of the Kikeh field in Malaysia — this growth is expected to have a meaningful percentage funded by internal cash flow from our strong, cash-generating producing oil and gas properties.
10
11
Refining and Marketing Statistical Summary
| | | | | | | | | | | |
| | | 2004
| | 2003
| | 2002
| | 2001
| | 2000
|
Refining | | | | | | | | | | | |
Crude capacity* of refineries – barrels per stream day | | | 192,400 | | 192,400 | | 167,400 | | 167,400 | | 167,400 |
| | |
|
| |
| |
| |
| |
|
Refinery inputs – barrels per day | | | | | | | | | | | |
Crude – Meraux, Louisiana | | | 101,644 | | 60,403 | | 83,721 | | 104,345 | | 103,154 |
Superior, Wisconsin | | | 31,598 | | 30,466 | | 30,468 | | 35,869 | | 34,159 |
Milford Haven, Wales | | | 31,033 | | 28,412 | | 29,640 | | 26,985 | | 28,507 |
Other feedstocks | | | 12,170 | | 10,113 | | 11,013 | | 9,901 | | 8,298 |
| | |
|
| |
| |
| |
| |
|
Total inputs | | | 176,445 | | 129,394 | | 154,842 | | 177,100 | | 174,118 |
| | |
|
| |
| |
| |
| |
|
Refinery yields – barrels per day | | | | | | | | | | | |
Gasoline | | | 68,663 | | 52,162 | | 63,409 | | 73,217 | | 75,106 |
Kerosine | | | 7,734 | | 6,568 | | 9,446 | | 12,874 | | 11,955 |
Diesel and home heating oils | | | 66,225 | | 41,277 | | 48,344 | | 52,660 | | 49,606 |
Residuals | | | 17,445 | | 14,595 | | 16,589 | | 20,530 | | 18,524 |
Asphalt, LPG and other | | | 14,693 | | 11,986 | | 12,651 | | 13,467 | | 14,624 |
Fuel and loss | | | 1,685 | | 2,806 | | 4,403 | | 4,352 | | 4,303 |
| | |
|
| |
| |
| |
| |
|
Total yields | | | 176,445 | | 129,394 | | 154,842 | | 177,100 | | 174,118 |
| | |
|
| |
| |
| |
| |
|
Average cost of crude inputs to refineries – dollars per barrel | | | | | | | | | | | |
North America | | $ | 40.00 | | 29.79 | | 24.76 | | 23.44 | | 28.82 |
United Kingdom | | | 39.60 | | 30.24 | | 25.83 | | 24.86 | | 29.29 |
| | |
|
| |
| |
| |
| |
|
Marketing | | | | | | | | | | | |
Products sold – barrels per day | | | | | | | | | | | |
North America – Gasoline | | | 207,786 | | 162,911 | | 112,281 | | 96,597 | | 76,314 |
Kerosine | | | 4,811 | | 4,388 | | 5,818 | | 9,621 | | 8,517 |
Diesel and home heating oils | | | 66,648 | | 43,373 | | 35,995 | | 41,064 | | 39,347 |
Residuals | | | 13,699 | | 10,972 | | 13,759 | | 17,308 | | 15,163 |
Asphalt, LPG and other | | | 8,857 | | 8,232 | | 8,574 | | 9,666 | | 10,271 |
| | |
|
| |
| |
| |
| |
|
| | | | 301,801 | | 229,876 | | 176,427 | | 174,256 | | 149,612 |
| | |
|
| |
| |
| |
| |
|
United Kingdom – Gasoline | | | 11,435 | | 12,101 | | 12,058 | | 11,058 | | 11,622 |
Kerosine | | | 2,756 | | 2,526 | | 2,685 | | 2,547 | | 2,478 |
Diesel and home heating oils | | | 14,649 | | 13,506 | | 14,574 | | 11,798 | | 9,760 |
Residuals | | | 4,062 | | 3,816 | | 3,127 | | 3,538 | | 3,852 |
LPG and other | | | 4,205 | | 3,103 | | 1,760 | | 2,121 | | 2,191 |
| | |
|
| |
| |
| |
| |
|
| | | | 37,107 | | 35,052 | | 34,204 | | 31,062 | | 29,903 |
| | |
|
| |
| |
| |
| |
|
Total products sold | | | 338,908 | | 264,928 | | 210,631 | | 205,318 | | 179,515 |
| | |
|
| |
| |
| |
| |
|
Branded retail outlets* | | | | | | | | | | | |
North America – Murphy USA | | | 752 | | 623 | | 506 | | 387 | | 276 |
Other | | | 375 | | 371 | | 408 | | 428 | | 436 |
Total | | | 1,127 | | 994 | | 914 | | 815 | | 712 |
United Kingdom | | | 358 | | 384 | | 416 | | 411 | | 386 |
| | |
|
| |
| |
| |
| |
|
12
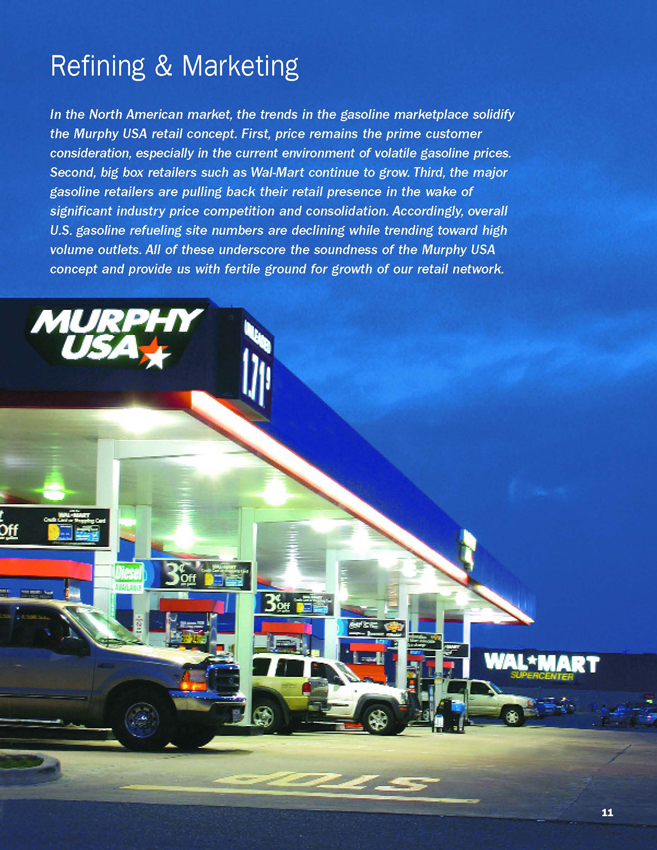
Our downstream operations turned the corner in 2004, moving from a loss in 2003 of $11 million to a profit of $82 million in 2004, based on strong operating margins from both North America and the U.K., and higher crude runs at the Company’s Meraux, Louisiana, refinery. In addition, the Company’s Murphy USA retail program with 752 gas stations located at Wal-Mart stores in 21 states throughout the Southeast, South, Midwest and South Central regions of the country, has gained momentum as both fuel and non-fuel sales volumes continue to grow.
Gaining Ground in Clean Fuels Refining
The Company’s Meraux, Louisiana, refinery successfully completed its Clean Fuels conversion and expansion project in 2004. The refinery has increased its capacity to 125,000 bpd with higher conversion capacity and improved yields, and has fully integrated its new hydrocracker to allow the production of low-sulfur or blend fuels. Although Meraux qualifies for a small refiner exemption through 2007, the refinery already meets the Environment Protection Agency’s (EPA) 2008 low-sulfur requirements of 30 parts per million, thus generating potentially valuable sulfur credits. The Company’s Superior, Wisconsin, refinery had weaker refining margins throughout 2004 when compared to prior years, but it continues to generate annual cash flow in excess of capital spending requirements by relying on lower-priced heavy crude from Canada and profitable asphalt production. The Superior refinery also completed a low-sulfur gasoline conversion well ahead of EPA mandates and has low-sulfur exemptions on diesel production until 2010. During 2004, the ROSE (Residual Oil Supercritical Extractor) unit was rebuilt at the Meraux refinery, following a fire in 2003. The ROSE unit was recommissioned in early 2005.
13
As anticipated, Murphy’s 2004 capital expenditures in the downstream sector decreased significantly from the prior year due to completion of the Clean Fuels and expansion projects at the Meraux refinery and the gasoline desulfurization unit construction at the Superior refinery. Although the Company’s two U.S. refineries supply an important portion of Murphy USA sites’ gasoline needs, the retail network sells more than twice as much fuel as the Company’s infrastructure can produce. Accordingly, Murphy is a big buyer of gasoline on the spot market through bulk purchases and exchanges. This need for gasoline purchases should continue to grow in 2005 and beyond due to the Company’s plan to build a significant number of additional Murphy USA stations during the coming years.
Accelerating Our Retail Presence
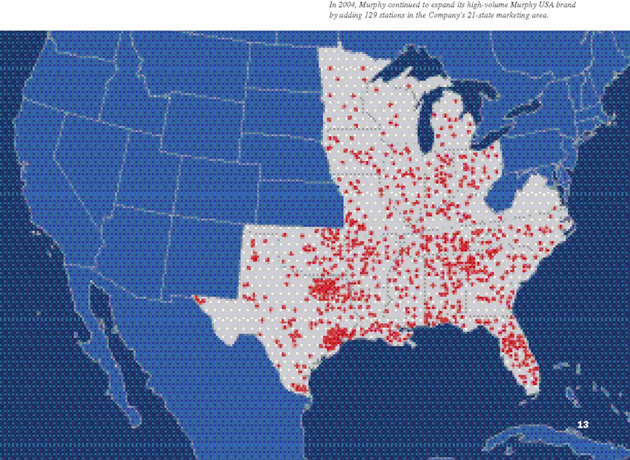
Over the past several years, the Company has aggressively grown its retail network of Murphy USA gas stations at Wal-Mart stores. The 119 new stations built in 2003 were eclipsed in 2004 when 129 new stations were added, and our budget includes adding up to 150 new stations per year over the next two years. This would bring Murphy USA gas stations to well over 1,000 Wal-Mart locations by year-end 2006.
In 2004, per store monthly sales volumes and non-fuel income contined to grow. Going forward, as we steadily add to the station count in our 21-state marketing region, we expect continued growth in fuel and non-fuel sales volumes while we work to drive down unit operating costs and manage the trade-off between high fuel volume and profitable margin. Six years into the program, Murphy USA has emerged as a strong competitor in the high volume gasoline retailer arena.
Maximizing Our U.K. Niche
In addition to our primary U.S. operating downstream business, the Company also has a relatively small, but well-run and profitable refining and marketing operation in the United Kingdom. This business generated record operating earnings in 2004 due to quite strong margins in both the refining and marketing areas during much of the year. The Company has an effective 30-percent interest in a Milford Haven, Wales refinery, with our share rated at 32,400 barrels of crude oil throughputs per day. Refined products are marketed through a network of approximately 100 company-operated and 250 dealer-operated gasoline stations in England and Wales. These stations are primarily operated under the Murco brand, and many of the company-operated sites offer small, but convenient neighborhood grocery markets that are attractive shopping locations for local residents.
14
Board of Directors
| | | | |
William C. Nolan, Jr. Partner, Nolan and Alderson, El Dorado, Arkansas. Director since 1977. Chairman of the Board and the Executive Committee, ex-officio member of all other committees | | Robert A. Hermes Chairman of the Board, Retired Purvin & Gertz, Inc., Houston, Texas.
Director since 1999. Committees: Nominating and Governance
(Chairman); Public Policy and
Environmental | | Neal E. Schmale Executive Vice President and Chief Financial Officer, Sempra Energy, San Diego, California.
Director since 2004. Committees: Audit; Executive
Compensation |
| | | | | |
Claiborne P. Deming President and Chief Executive Officer, Murphy Oil Corporation, El Dorado, Arkansas. Director since 1993. Committees: Executive | | R. Madison Murphy Managing Member, Murphy Family Management, LLC, El Dorado, Arkansas. Director since 1993; Chairman from 1994–2002 Committees: Executive; Audit (Chairman) | | David J. H. Smith Chief Executive Officer, Retired, Whatman plc, Maidstone, Kent, England. Director since 2001. Committees: Executive Compensation; Public Policy and Environmental |
| | |
Frank W. Blue | | Ivar B. Ramberg | | Caroline G. Theus |
Attorney, Santa Barbara, California. Director since 2003. Committees: Audit; Nominating and Governance | | Executive Officer, Ramberg Consulting AS (Ram-Co), Osteraas, Norway. Director since 2003. Committees: Nominating and Governance; Public Policy and Environmental | | President, Keller Enterprises, LLC, Alexandria, Louisiana. Director since 1985. Committees: Executive Committee Public Policy and Environmental; (Chairman) |
| | |
George S. Dembroski Vice Chairman, Retired, RBC Dominion Securities Limited, Toronto, Ontario, Canada. Director since 1995. Committees: Executive; Audit; Executive Compensation (Chairman) | | | | |
Executive Officers
| | | | |
Claiborne P. Deming President and Chief Executive Officer since
October 1994 and Director and Member of
the Executive Committee since 1993. Steven A. Cossé Executive Vice President since February
2005 and General Counsel since August
1991. Mr. Cossé was elected Senior Vice
President in 1994 and Vice President in
1993. | | W. Michael Hulse Executive Vice President – Worldwide
Downstream Operations since April 2003
and President of MOUSA since
November 2001. He served as President
of Murphy Eastern Oil Company from
April 1996 to November 2001. Bill H. Stobaugh Senior Vice President since February 2005.
Mr. Stobaugh joined the Company as
Vice President in 1995. | | Kevin G. Fitzgerald Treasurer since July 2001. Mr. Fitzgerald
was Director of Investor Relations from
1996 to June 2001. John W. Eckart Controller since March 2000. Walter K. Compton Secretary since December 1996. |
15
Principal Subsidiaries
| | | | | | |
Murphy Exploration & Production Company – USA Engages in crude oil and natural gas exploration and production in the Gulf of Mexico and in
Gulf Coast areas onshore. | | 131 South Robertson Street
New Orleans, Louisiana 70112
(504) 561-2811 Mailing Address: P.O. Box 61780 New Orleans, Louisiana
70161-1780 | | John C. Higgins President S.J. Carboni, Jr. Vice President, Deepwater
Development and Production James R. Murphy Vice President, Exploration Steven A. Cossé Vice President and General Counsel | | Kevin G. Fitzgerald
Treasurer Gasper F. Bivalacqua
Controller Walter K. Compton
Secretary |
| | | |
Murphy Oil Company Ltd. Engages in crude oil and natural gas exploration and production, extraction and sale of synthetic crude oil, and marketing of petroleum products in Canada. | | 1700-555-4th Avenue SW Calgary, Alberta T2P 3E7 (403) 294-8000 Mailing Address: P.O. Box 2721, Station M Calgary, Alberta T2P 3Y3 Canada | | Harvey Doerr President Steve C. Crosby Vice President, East Coast and Northern Canada Timothy A. Larson Vice President, Crude Oil and Natural Gas W. Patrick Olson Vice President, Production | | Marty L. Proctor Vice President, Exploitation Kevin G. Fitzgerald reasurer Heather J. Jones Controller Georg R. McKay Secretary |
| | | |
Murphy Exploration &Production Company –International Engages in crude oil and natural gas exploration and production outside North America. | | 550 WestLake Park Blvd. Suite 1000 Houston, Texas 77079 (281) 249-1040 | | David M. Wood President Bruce R. Laws Vice President, New Ventures George M. Shirley Vice President and General Manager – Malaysia Steven A. Cossé Vice President and General Counsel | | Kevin G. Fitzgerald Treasurer Dean E. Haefner Controller Walter K. Compton Secretary |
| | | |
Murphy Oil USA, Inc. Engages in refining and marketing of petroleum products in the United States. | | 200 Peach Street El Dorado, Arkansas 71730 (870) 862-6411 Mailing Address: P.O. Box 7000 El Dorado, Arkansas 71731-7000 | | W. Michael Hulse President Charles A. Ganus Senior Vice President, Marketing and President, Murphy USA Marketing Company Gary R. Bates Vice President, Supply and Transportation Ernest C. Cagle Vice President, Manufacturing | | John D. Edmunds Vice President, Engineering Henry J. Heithaus Vice President, Retail Marketing Gordon W. Williamson Treasurer John W. Eckart Controller Walter K. Compton Secretary |
| | | |
Murphy Eastern Oil Company Provides technical and professional services to certain of Murphy Oil Corporation’s subsidiaries engaged in crude oil and natural gas exploration and production in the Eastern Hemisphere and refining and marketing of petroleum products in the U.K. | | 4 Beaconsfield Road St. Albans, Hertfordshire AL1 3RH, England 44-1727-892-400 | | Stephen R. Wylie President Kevin W. Melnyk Vice President, Supply and Refining Ijaz Iqbal Vice President, Treasury, Tax and Planning | | Kevin G. Fitzgerald Treasurer Walter K. Compton Secretary |
16