Exhibit 13
FINANCIALAND OPERATING HIGHLIGHTS
| | | | | | | | | | | | | | | |
(Thousands of dollars except per share data) | | 2005 | | 2004 | | % Change 2005–2004 | | | 2003 | | % Change 2004–2003 | |
For the Year | | | | | | | | | | | | | | | |
Revenues | | $ | 11,877,151 | | $ | 8,359,839 | | 42 | % | | $ | 5,164,657 | | 62 | % |
Net income | | | 846,452 | | | 701,315 | | 21 | % | | | 294,197 | | 138 | % |
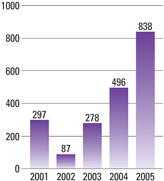
Income from continuing operations | | | 837,903 | | | 496,395 | | 69 | % | | | 278,410 | | 78 | % |
Cash dividends paid | | | 83,198 | | | 78,205 | | 6 | % | | | 73,464 | | 6 | % |
Capital expenditures1 | | | 1,329,831 | | | 975,393 | | 36 | % | | | 906,114 | | 8 | % |
Net cash provided by operating activities | | | 1,225,262 | | | 1,097,018 | | 12 | % | | | 652,278 | | 68 | % |
Average common shares outstanding – diluted (thousands)2 | | | 187,889 | | | 186,887 | | 0.5 | % | | | 185,486 | | 0.8 | % |
| | | | | |
At End of Year | | | | | | | | | | | | | | | |
Working capital | | $ | 551,938 | | $ | 424,372 | | 30 | % | | $ | 228,529 | | 86 | % |
Net property, plant and equipment | | | 4,374,229 | | | 3,685,594 | | 19 | % | | | 3,530,800 | | 4 | % |
Total assets | | | 6,368,511 | | | 5,458,243 | | 17 | % | | | 4,712,647 | | 16 | % |
Long-term debt | | | 609,574 | | | 613,355 | | -1 | % | | | 1,090,307 | | -44 | % |
Stockholders’ equity | | | 3,460,990 | | | 2,649,156 | | 31 | % | | | 1,950,883 | | 36 | % |
| | | | | |
Per Share of Common Stock | | | | | | | | | | | | | | | |
Net income – diluted | | $ | 4.51 | | $ | 3.75 | | 20 | % | | $ | 1.59 | | 136 | % |
Income from continuing operations – diluted | | | 4.46 | | | 2.65 | | 68 | % | | | 1.50 | | 77 | % |
Cash dividends paid | | | .45 | | | .425 | | 6 | % | | | .40 | | 6 | % |
Stockholders’ equity | | | 18.61 | | | 14.39 | | 29 | % | | | 10.62 | | 35 | % |
| | | | | |
Net Crude Oil and Gas Liquids Produced – barrels per day 1 | | | 101,349 | | | 93,634 | | 8 | % | | | 76,620 | | 22 | % |
United States | | | 25,897 | | | 19,314 | | 34 | % | | | 4,526 | | 327 | % |
Canada | | | 46,086 | | | 43,689 | | 5 | % | | | 44,935 | | -3 | % |
Other International | | | 29,366 | | | 30,631 | | -4 | % | | | 27,159 | | 13 | % |
| | | | | |
Net Natural Gas Sold – thousands of cubic feet per day 1 | | | 90,198 | | | 109,452 | | -18 | % | | | 111,791 | | -2 | % |
United States | | | 70,452 | | | 88,621 | | -21 | % | | | 82,281 | | 8 | % |
Canada | | | 10,323 | | | 13,972 | | -26 | % | | | 19,946 | | -30 | % |
United Kingdom | | | 9,423 | | | 6,859 | | 37 | % | | | 9,564 | | -28 | % |
| | | | | |
Crude Oil Refined – barrels per day | | | 135,122 | | | 164,275 | | -18 | % | | | 119,281 | | 38 | % |
North America | | | 108,139 | | | 133,242 | | -19 | % | | | 90,869 | | 47 | % |
United Kingdom | | | 26,983 | | | 31,033 | | -13 | % | | | 28,412 | | 9 | % |
| | | | | |
Petroleum Products Sold – barrels per day | | | 358,255 | | | 338,908 | | 6 | % | | | 264,928 | | 28 | % |
North America | | | 322,714 | | | 301,801 | | 7 | % | | | 229,876 | | 31 | % |
United Kingdom | | | 35,541 | | | 37,107 | | -4 | % | | | 35,052 | | 6 | % |
| | | | | |
Stockholder and Employee Data | | | | | | | | | | | | | | | |
Common shares outstanding (thousands)2,3 | | | 185,947 | | | 184,071 | | 1.0 | % | | | 183,741 | | 0.2 | % |
Number of stockholders of record3 | | | 2,847 | | | 2,864 | | -0.6 | % | | | 2,839 | | 0.9 | % |
Number of employees3 | | | 6,248 | | | 5,826 | | 7 | % | | | 4,789 | | 22 | % |
Average number of employees | | | 6,127 | | | 5,276 | | 16 | % | | | 4,446 | | 19 | % |
| 1 | From continuing operations. |
| 2 | 2004 and 2003 adjusted for two-for-one stock split effective June 3, 2005. |
1
LETTERTO SHAREHOLDERS
Dear Fellow Shareholders,
Some years are more memorable than others and 2005 was one of those years. Hurricane Katrina’s devastation of the Gulf Coast and its impact on our Company and employees are undoubtedly the most obvious reasons from a personal and Company point of view. From an industry perspective, however, I would suggest that 2005 will be memorable as the first year of widespread awareness of the increasing strain placed on the world’s conventional crude oil supplies. Simply put, it is becoming more difficult for our industry to make new discoveries of sufficiently large fields to accomplish the tandem task of replacing depletion and providing for demand growth. What does this mean? For starters, crude oil prices find support at higher levels as conventional reserves are priced at replacement cost levels substantially higher than in the recent past. In addition, it is now clear that unconventional reserves (e.g. Syncrude) will play an increasingly larger role in supplying hydrocarbons for the world’s economy. Furthermore, alternative fuels will slowly add market share, although this share will likely remain very small for the foreseeable future and typically will be supported by taxpayer subsidies.
Our company is very well suited to this changing energy world. Certainly, we are extremely strong financially. In 2005, Murphy earned record net income of $846.5 million ($4.51 per share) easily surpassing the previous record mark set in 2004. Even excluding nonrecurring items such as gains on asset sales and mindful that most of our Gulf of Mexico production was shut-in and the Meraux Refinery offline the last four months of the year, our earnings were above all previous years. Our cash flow from operations in 2005 was $1.22 billion. The balance sheet remains rock solid with debt to total capitalization at 15 percent. Clearly we are in the soundest financial condition
Income from Continuing Operations
Millions of dollars
2
in our history and have, so far, funded the build-out of the $1.5 billion Kikeh (80%) development from cash flow.
We are also well positioned from a resource standpoint. In 2006, your company adds natural gas production from the Seventeen Hands field (37.5%) in the deep water Gulf of Mexico and oil production from the third major expansion at Syncrude (5%) and from the Seal area (50-100%), both located in northern Alberta, Canada. A large surge of production growth occurs in 2007 as Kikeh starts up in the second half of the year. Also in the queue are the Kenarong and Pertang (75%) natural gas fields offshore Peninsular Malaysia that are waiting for a gas market to develop and the large Kakap-Gumusut oil field located near Kikeh that is shared with and operated by another company. As you can see, we will be growing for the foreseeable future and are well placed to capture what the energy markets are offering.
We realize that in a world of ever increasing demand for hydrocarbons, driven by the emergence of India and China firmly into the global market economy, the ownership of long-lived, large conventional oil and gas fields such as Hibernia, Terra Nova and, now, Kikeh and Kakap-Gumusut, supplemented by unconventional resources such as Syncrude, provide unique growth and profit opportunities. These assets form the basis of our Company, which is set to increase production through the beginning of the second decade of this century.
Murphy’s downstream business is anchored by one of the fastest-growing, highest-volume retail gasoline networks in the United States. By the end of 2005 we had 864 sites in operation located in the parking lots of Wal-Mart Supercenters and we anticipate crossing the 1,000 site mark shortly after the end of 2006. This sales channel acts as an important cushion against declining crude oil prices and contributed significantly to the Company’s downstream profits in 2005.
Capital Expenditures by Function
Millions of dollars

3
The Company’s United Kingdom downstream company – Murco Petroleum – reported record earnings in 2005. This very efficient operation provided important profit contributions in the third and fourth quarter after Meraux went offline. We acquired an additional 68 retail stations during the year to complement our existing chain allowing Murco to sell more of its product into the U.K. retail market. Importantly, these sites have been profitable from the moment acquired.
Hurricane Katrina hit the Meraux Refinery in St. Bernard Parish head on. The hurricane caused a storm surge to overtop the two levee systems protecting St. Bernard Parish sending a wall of water into the area. The entire Parish was flooded with the refinery processing units having between two and six feet of water and the tank farm up to 18 feet. The day after the hurricane struck, we began manning the plant, initially coming in by boat on the Mississippi River, a five hour one-way trip. In addition, the truck terminal at the plant was open and manned the day following the hurricane and supplied fuel free of charge to emergency response vehicles in St. Bernard Parish. For over 30 days, this was the primary and, in many cases, the only source of essential fuel used to save lives. As of this writing, the refinery is still under repair and renovation. It is a very large job with every unit being worked on and most pumps, motors, electronic controls and wiring being replaced. We will start coming back up during the first half of April.
One of our storage tanks was dislodged by the storm surge and was damaged. Three days later when the storm waters receded, oil leaked into the area surrounded by our containment levees but approximately 3,000 barrels escaped through a breach in the containment levees. As the storm waters were receding, oil moved on top of the waters into the adjacent areas. We have now cleaned the oil from public areas (streets and sidewalks) and we are well along in our clean-up program for impacted residences. In addition, we set up claims
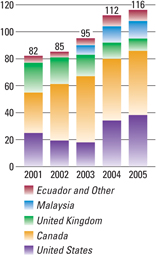
Net Hydrocarbons Produced from Continuing Operations
Thousands of oil equivalent barrels per day
4

Claiborne P. Deming
President and Chief Executive Officer
offices around the Gulf Coast and offered to pay settlements to affected residents and clean up the affected properties. It is important to note that these homes had already been flooded with water up to rooflines for days before the spill occurred. Furthermore, the ATSDR, an arm of the U.S. Department of Health, has issued a finding that if the oil is removed to applicable standards, there will be no long-term health impacts to returning residents in the affected area. Our clean-up efforts started two days after the spill was discovered. Our settlement program began two months after the storm, after we performed testing to ascertain the area impacted by the oil. This is an achievement of which I am extremely proud for I believe we have responded forthrightly, fairly and efficiently.
In closing, I would like to thank the employees of this organization for their response to Katrina. I have always known that the individuals in this enterprise understood their responsibilities and met them. It is not until you experience an event like Katrina, however, that shut off the Company’s Gulf of Mexico production, closed our refinery, displaced virtually all of our Meraux employees and our U.S. exploration and production office staff in New Orleans (who set up shop in Lafayette within two weeks) that you see first hand the commitment and honor of our people. I have never been more proud to be part of Murphy Oil Corporation.

Claiborne P. Deming
President and Chief Executive Officer
February 10, 2006
El Dorado, Arkansas
5
EXPLORATIONAND PRODUCTION STATISTICAL SUMMARY
| | | | | | | | | | | | | | |
| | | 2005 | | | 2004 | | 2003 | | 2002 | | 2001 | | 2000 |
Net crude oil and condensate production – barrels per day | | | | | | | | | | | | | | |
United States | | | 25,777 | | | 19,154 | | 4,374 | | 3,837 | | 4,339 | | 4,770 |
Canada – light | | | 160 | | | 168 | | 582 | | 1,256 | | 1,981 | | 2,055 |
heavy | | | 11,806 | | | 5,838 | | 4,705 | | 3,609 | | 4,521 | | 3,010 |
offshore | | | 23,124 | | | 25,407 | | 28,534 | | 24,037 | | 9,535 | | 9,199 |
synthetic | | | 10,593 | | | 11,794 | | 10,483 | | 11,362 | | 10,479 | | 8,443 |
United Kingdom | | | 7,955 | | | 10,800 | | 14,513 | | 18,180 | | 20,049 | | 20,679 |
Ecuador | | | 7,871 | | | 7,735 | | 5,172 | | 4,544 | | 5,319 | | 6,405 |
Malaysia | | | 13,503 | | | 11,885 | | 7,301 | | — | | — | | — |
Net natural gas liquids production – barrels per day | | | | | | | | | | | | | | |
United States | | | 120 | | | 160 | | 152 | | 291 | | 413 | | 551 |
Canada | | | 403 | | | 482 | | 631 | | 311 | | 540 | | 182 |
United Kingdom | | | 37 | | | 211 | | 173 | | 122 | | 165 | | 216 |
| | | | | | | | | | | | | | |
Continuing operations | | | 101,349 | | | 93,634 | | 76,620 | | 67,549 | | 57,341 | | 55,510 |
Discontinued operations | | | — | | | 3,106 | | 6,832 | | 8,821 | | 10,014 | | 9,749 |
| | | | | | | | | | | | | | |
Total liquids produced | | | 101,349 | | | 96,740 | | 83,452 | | 76,370 | | 67,355 | | 65,259 |
| | | | | | | | | | | | | | |
Net crude oil and condensate sold – barrels per day | | | | | | | | | | | | | | |
United States | | | 25,777 | | | 19,154 | | 4,374 | | 3,837 | | 4,339 | | 4,769 |
Canada – light | | | 160 | | | 168 | | 582 | | 1,256 | | 1,981 | | 2,055 |
heavy | | | 11,806 | | | 5,838 | | 4,705 | | 3,609 | | 4,521 | | 3,010 |
offshore | | | 22,443 | | | 26,306 | | 28,542 | | 23,935 | | 9,862 | | 9,456 |
synthetic | | | 10,593 | | | 11,794 | | 10,483 | | 11,362 | | 10,479 | | 8,443 |
United Kingdom | | | 8,247 | | | 10,800 | | 14,591 | | 18,209 | | 20,206 | | 20,921 |
Ecuador | | | 9,821 | | | 3,414 | | 4,997 | | 4,293 | | 5,381 | | 6,393 |
Malaysia | | | 13,818 | | | 11,020 | | 7,235 | | — | | — | | — |
Net natural gas liquids sold – barrels per day | | | | | | | | | | | | | | |
United States | | | 120 | | | 160 | | 152 | | 291 | | 413 | | 551 |
Canada | | | 403 | | | 482 | | 631 | | 311 | | 540 | | 182 |
United Kingdom | | | 56 | | | 124 | | 131 | | 149 | | 148 | | 216 |
| | | | | | | | | | | | | | |
Continuing operations | | | 103,244 | | | 89,260 | | 76,423 | | 67,252 | | 57,870 | | 55,996 |
Discontinued operations | | | — | | | 3,106 | | 6,832 | | 8,821 | | 10,014 | | 9,749 |
| | | | | | | | | | | | | | |
Total liquids sold | | | 103,244 | | | 92,366 | | 83,255 | | 76,073 | | 67,884 | | 65,745 |
| | | | | | | | | | | | | | |
Net natural gas sold – thousands of cubic feet per day | | | | | | | | | | | | | | |
United States | | | 70,452 | | | 88,621 | | 82,281 | | 88,067 | | 112,616 | | 141,373 |
Canada | | | 10,323 | | | 13,972 | | 19,946 | | 12,709 | | 25,701 | | 9,590 |
United Kingdom | | | 9,423 | | | 6,859 | | 9,564 | | 6,973 | | 13,125 | | 10,850 |
| | | | | | | | | | | | | | |
Continuing operations | | | 90,198 | | | 109,452 | | 111,791 | | 107,749 | | 151,442 | | 161,813 |
Discontinued operations | | | — | | | 30,760 | | 103,543 | | 189,182 | | 129,793 | | 67,599 |
| | | | | | | | | | | | | | |
Total natural gas sold | | | 90,198 | | | 140,212 | | 215,334 | | 296,931 | | 281,235 | | 229,412 |
| | | | | | | | | | | | | | |
Net hydrocarbons produced – equivalent barrels1,2 per day | | | 116,382 | | | 120,109 | | 119,341 | | 125,859 | | 114,228 | | 103,494 |
Estimated net hydrocarbon reserves – million equivalent barrels1,2,3 | | | 353.6 | | | 385.6 | | 425.5 | | 455.3 | | 501.2 | | 442.3 |
| | | | | | | | | | | | | | |
Weighted average sales prices4 | | | | | | | | | | | | | | |
Crude oil and condensate – dollars per barrel | | | | | | | | | | | | | | |
United States | | $ | 47.48 | | | 35.35 | | 24.22 | | 24.25 | | 24.92 | | 30.38 |
Canada5 – light | | | 52.47 | | | 37.70 | | 27.68 | | 22.81 | | 21.73 | | 29.98 |
heavy | | | 21.30 | | | 20.26 | | 12.36 | | 16.83 | | 11.21 | | 16.74 |
offshore | | | 51.37 | | | 36.60 | | 27.08 | | 25.36 | | 23.77 | | 27.16 |
synthetic | | | 58.12 | | | 40.35 | | 24.97 | | 25.64 | | 25.04 | | 29.62 |
United Kingdom | | | 52.83 | | | 36.82 | | 29.59 | | 24.39 | | 24.44 | | 27.78 |
Ecuador | | | 32.54 | 6 | | 24.78 | | 22.99 | | 19.64 | | 17.00 | | 22.01 |
Malaysia | | | 46.16 | 7 | | 41.35 | | 29.42 | | — | | — | | — |
Natural gas liquids – dollars per barrel | | | | | | | | | | | | | | |
United States | | | 35.09 | | | 29.77 | | 23.42 | | 17.13 | | 20.40 | | 23.04 |
Canada5 | | | 40.90 | | | 30.83 | | 24.63 | | 16.98 | | 20.78 | | 22.98 |
United Kingdom | | | 34.77 | | | 26.91 | | 22.49 | | 18.28 | | 19.12 | | 23.64 |
Natural gas – dollars per thousand cubic feet | | | | | | | | | | | | | | |
United States | | | 8.52 | | | 6.45 | | 5.29 | | 3.37 | | 4.64 | | 4.01 |
Canada5 | | | 7.88 | | | 5.64 | | 4.47 | | 2.59 | | 3.54 | | 4.68 |
United Kingdom5 | | | 5.80 | | | 4.52 | | 3.50 | | 2.76 | | 2.52 | | 1.81 |
| 1 | Natural gas converted at a 6:1 ratio. |
| 4 | Includes intracompany transfers at market prices. |
| 6 | Includes price attained in 2005 for recoupment of a portion of 2004 crude oil production owed to the Company in Block 16. Excluding this recoupment, the 2005 average price would have been $34.87 per barrel. |
| 7 | Price is net of a payment under the terms of the production sharing contract for Block SK 309. |
6
REFININGAND MARKETING STATISTICAL SUMMARY
| | | | | | | | | | | | | |
| | | 2005 | | 2004 | | 2003 | | 2002 | | 2001 | | 2000 |
| Refining | | | | | | | | | | | | | |
Crude capacity* of refineries – barrels per stream day | | | 192,400 | | 192,400 | | 192,400 | | 167,400 | | 167,400 | | 167,400 |
| | | | | | | | | | | | | |
Refinery inputs – barrels per day | | | | | | | | | | | | | |
Crude – Meraux, Louisiana | | | 73,371 | | 101,644 | | 60,403 | | 83,721 | | 104,345 | | 103,154 |
Superior, Wisconsin | | | 34,768 | | 31,598 | | 30,466 | | 30,468 | | 35,869 | | 34,159 |
Milford Haven, Wales | | | 26,983 | | 31,033 | | 28,412 | | 29,640 | | 26,985 | | 28,507 |
Other feedstocks | | | 9,131 | | 12,170 | | 10,113 | | 11,013 | | 9,901 | | 8,298 |
| | | | | | | | | | | | | |
Total inputs | | | 144,253 | | 176,445 | | 129,394 | | 154,842 | | 177,100 | | 174,118 |
| | | | | | | | | | | | | |
Refinery yields – barrels per day | | | | | | | | | | | | | |
Gasoline | | | 54,869 | | 68,663 | | 52,162 | | 63,409 | | 73,217 | | 75,106 |
Kerosine | | | 7,805 | | 7,734 | | 6,568 | | 9,446 | | 12,874 | | 11,955 |
Diesel and home heating oils | | | 48,535 | | 66,225 | | 41,277 | | 48,344 | | 52,660 | | 49,606 |
Residuals | | | 18,231 | | 17,445 | | 14,595 | | 16,589 | | 20,530 | | 18,524 |
Asphalt, LPG and other | | | 13,268 | | 14,693 | | 11,986 | | 12,651 | | 13,467 | | 14,624 |
Fuel and loss | | | 1,545 | | 1,685 | | 2,806 | | 4,403 | | 4,352 | | 4,303 |
| | | | | | | | | | | | | |
Total yields | | | 144,253 | | 176,445 | | 129,394 | | 154,842 | | 177,100 | | 174,118 |
| | | | | | | | | | | | | |
Average cost of crude inputs to refineries – dollars per barrel | | | | | | | | | | | | | |
North America | | $ | 54.10 | | 40.00 | | 29.79 | | 24.76 | | 23.44 | | 28.82 |
United Kingdom | | | 56.15 | | 39.60 | | 30.24 | | 25.83 | | 24.86 | | 29.29 |
| | | | | | | | | | | | | |
| Marketing | | | | | | | | | | | | | |
Products sold – barrels per day | | | | | | | | | | | | | |
North America – Gasoline | | | 233,191 | | 207,786 | | 162,911 | | 112,281 | | 96,597 | | 76,314 |
Kerosine | | | 5,671 | | 4,811 | | 4,388 | | 5,818 | | 9,621 | | 8,517 |
Diesel and home heating oils | | | 60,228 | | 66,648 | | 43,373 | | 35,995 | | 41,064 | | 39,347 |
Residuals | | | 15,330 | | 13,699 | | 10,972 | | 13,759 | | 17,308 | | 15,163 |
Asphalt, LPG and other | | | 8,294 | | 8,857 | | 8,232 | | 8,574 | | 9,666 | | 10,271 |
| | | | | | | | | | | | | |
| | | 322,714 | | 301,801 | | 229,876 | | 176,427 | | 174,256 | | 149,612 |
| | | | | | | | | | | | | |
United Kingdom – Gasoline | | | 12,739 | | 11,435 | | 12,101 | | 12,058 | | 11,058 | | 11,622 |
Kerosine | | | 2,410 | | 2,756 | | 2,526 | | 2,685 | | 2,547 | | 2,478 |
Diesel and home heating oils | | | 14,910 | | 14,649 | | 13,506 | | 14,574 | | 11,798 | | 9,760 |
Residuals | | | 3,242 | | 4,062 | | 3,816 | | 3,127 | | 3,538 | | 3,852 |
LPG and other | | | 2,240 | | 4,205 | | 3,103 | | 1,760 | | 2,121 | | 2,191 |
| | | | | | | | | | | | | |
| | | 35,541 | | 37,107 | | 35,052 | | 34,204 | | 31,062 | | 29,903 |
| | | | | | | | | | | | | |
Total products sold | | | 358,255 | | 338,908 | | 264,928 | | 210,631 | | 205,318 | | 179,515 |
| | | | | | | | | | | | | |
Branded retail outlets* | | | | | | | | | | | | | |
North America – Murphy USA | | | 864 | | 752 | | 623 | | 506 | | 387 | | 276 |
Other | | | 337 | | 375 | | 371 | | 408 | | 428 | | 436 |
Total | | | 1,201 | | 1,127 | | 994 | | 914 | | 815 | | 712 |
United Kingdom | | | 412 | | 358 | | 384 | | 416 | | 411 | | 386 |
| | | | | | | | | | | | | |

In 2005, Murphy continued to expand its high-volume Murphy USA brand by adding 112 stations in the Company’s 21-state marketing area.
7
BOARDOF DIRECTORS

William C. Nolan, Jr.
Partner, Nolan & Alderson, Attorneys,
El Dorado, Arkansas.
Director since 1977.
Chairman of the Board and the Executive Committee, ex-officio member of all other committees
Claiborne P. Deming
President and Chief Executive Officer,
Murphy Oil Corporation,
El Dorado, Arkansas.
Director since 1993.
Committees: Executive
Frank W. Blue
Attorney, Santa Barbara, California.
Director since 2003.
Committees: Audit; Nominating and Governance
George S. Dembroski
Vice Chairman, Retired, RBC Dominion
Securities Limited, Toronto, Ontario, Canada.
Director since 1995.
Committees: Executive; Audit; Executive Compensation (Chairman)
Robert A. Hermes
Chairman of the Board, Retired,
Purvin & Gertz, Inc., Houston, Texas.
Director since 1999.
Committees: Nominating and Governance (Chairman); Public Policy and Environmental
R. Madison Murphy
Managing Member, Murphy Family Management, LLC,
El Dorado, Arkansas.
Director since 1993;
Chairman from 1994 – 2002.
Committees: Executive; Audit (Chairman)
Ivar B. Ramberg
Executive Officer, Ramberg Consulting AS,
Osteraas, Norway.
Director since 2003.
Committees: Nominating and Governance; Public Policy and Environmental
Neal E. Schmale
President and Chief Operating Officer,
Sempra Energy, San Diego, California.
Director since 2004.
Committees: Audit; Executive Compensation
David J. H. Smith
Chief Executive Officer, Retired,
Whatman plc, Maidstone, Kent, England.
Director since 2001.
Committees: Executive Compensation;
Public Policy and Environmental
Caroline G. Theus
President, Keller Enterprises, LLC, and
President, Inglewood Land and Development Co., Alexandria, Louisiana.
Director since 1985.
Committees: Executive; Public Policy and Environmental (Chairman)

8
PRINCIPAL SUBSIDIARIES
| | | | | | |
| | | |
Murphy Exploration & Production Company – USA Engages in crude oil and natural gas exploration and production in the Gulf of Mexico and in Gulf Coast areas onshore. | | 131 South Robertson Street New Orleans Louisiana 70112 (504) 561-2811 Temporarily relocated to: 201 Energy Parkway, Suite 310 Lafayette, Louisiana 70508 (337) 267-9123 | | John C. Higgins President S.J. Carboni, Jr. Vice President, Deepwater Development and Production James R. Murphy Vice President, Exploration Steven A. Cossé Vice President and General Counsel | | Kevin G. Fitzgerald Treasurer Gasper F. Bivalacqua Controller Walter K. Compton Secretary |
| | | |
Murphy Oil Company Ltd. Engages in crude oil and natural gas exploration and production, extraction and sale of synthetic crude oil, and marketing of petroleum products in Canada. | | 1700-555-4th Avenue SW Calgary, Alberta T2P 3E7 (403) 294-8000 Mailing Address: P.O. Box 2721, Station M Calgary, Alberta T2P 3Y3 Canada | | Harvey Doerr President Steve C. Crosby Vice President, East Coast and Northern Canada W. Patrick Olson Vice President, Production | | Marty L. Proctor Vice President, Exploitation Kevin G. Fitzgerald Treasurer Heather J. Jones Controller Georg R. McKay Secretary |
| | | |
Murphy Exploration & Production Company – International Engages in crude oil and natural gas exploration and production outside North America. | | 550 WestLake Park Blvd. Suite 1000 Houston, Texas 77079 (281) 249-1040 | | David M. Wood President Bruce R. Laws Vice President, New Ventures George M. Shirley Vice President and General Manager – Malaysia Steven A. Cossé Vice President and General Counsel | | Kevin G. Fitzgerald Treasurer Dean E. Haefner Controller Walter K. Compton Secretary |
| | | |
Murphy Oil USA, Inc. Engages in refining and marketing of petroleum products in the United States. | | 200 Peach Street El Dorado, Arkansas 71730 (870) 862-6411 Mailing Address: P.O. Box 7000 El Dorado, Arkansas 71731-7000 | | W. Michael Hulse President Charles A. Ganus Senior Vice President, Marketing, and President, Murphy USA Marketing Company Gary R. Bates Vice President, Supply and Transportation Ernest C. Cagle Vice President, Manufacturing John D. Edmunds Vice President, Engineering | | Henry J. Heithaus Vice President, Retail Marketing Steven A. Cossé Vice President and General Counsel Gordon W. Williamson Treasurer John W. Eckart Controller Walter K. Compton Secretary |
| | | |
Murphy Eastern Oil Company Provides technical and professional services to certain of Murphy Oil Corporation’s subsidiaries engaged in crude oil and natural gas exploration and production in the Eastern Hemisphere and refining and marketing of petroleum products in the United Kingdom. | | 4 Beaconsfield Road St. Albans, Hertfordshire AL1 3RH, England 44-1727-892-400 | | Stephen R. Wylie President Ijaz Iqbal Vice President, Treasury, Tax and Planning | | Kevin G. Fitzgerald Treasurer Walter K. Compton Secretary |
CORPORATE INFORMATION
| | | | |
| CORPORATE OFFICE | | ANNUAL MEETING | | INQUIRIES |
| 200 Peach Street | | The annual meeting of the Company’s | | Inquiries regarding shareholder account |
| P.O. Box 7000 | | shareholders will be held at 10 a.m. on | | matters should be addressed to: |
| El Dorado, Arkansas 71731-7000 | | May 10, 2006, at the South Arkansas Arts | | Walter K. Compton |
| (870) 862-6411 | | Center, 110 East 5th Street, El Dorado, | | Secretary |
| | Arkansas. A formal notice of the meeting, | | Murphy Oil Corporation |
| STOCK EXCHANGE LISTINGS | | together with a proxy statement and proxy | | P.O. Box 7000 |
| Trading Symbol: MUR | | form, will be provided to all shareholders. | | El Dorado, Arkansas 71731-7000 |
| New York Stock Exchange | | | | |
| | E-MAIL ADDRESS | | Members of the financial community |
TRANSFER AGENTAND REGISTRAR Computershare Investor Services, L.L.C. 2 North LaSalle St. Chicago, Illinois 60602 Toll-free (888) 239-5303 Local Chicago (312) 360-5303 | | murphyoil@murphyoilcorp.com | | should direct their inquiries to: Mindy K. West Director of Investor Relations Murphy Oil Corporation P.O. Box 7000 El Dorado, Arkansas 71731-7000 (870) 864-6315 |
| | | |
| | WWW.MURPHYOILCORP.COM | |
| | Murphy Oil’s website provides frequently | |
| | updated information about the Company | |
| | and its operations, including: | |
| | • News releases | |
| ELECTRONIC PAYMENTOF DIVIDENDS | | • Annual report | | |
| Shareholders may have dividends | | • Quarterly reports | | CERTIFICATIONS |
| deposited directly into their bank accounts | | • Live webcasts of quarterly | | The Company has filed the required |
| by electronic funds transfer. Authorization | | conference calls | | certifications under Section 302 of the |
| forms may be obtained from: | | • Links to the Company’s SEC filings | | Sarbanes-Oxley Act of 2002 regarding the |
Computershare Investor Services, L.L.C. | | • Stock quotes | | quality of our public disclosures as |
2 North LaSalle St. | | • Profiles of the Company’s operations | | Exhibits 31.1 and 31.2 to our annual |
Chicago, Illinois 60602 | | • On-line stock investment accounts | | report on Form 10-K for the fiscal year |
Toll-free (888) 239-5303 | | • Murphy USA station locator | | ended December 31, 2005. In 2005 after |
Local Chicago (312) 360-5303 | | | | our annual meeting of stockholders, the |
| | | | Company filed with the New York Stock |
| | | | Exchange the CEO certification regarding |
| | | | its compliance with the NYSE corporate |
| | | | governance listing standards as required |
| | | | by NYSE Rule 303A.12(a). |
EXECUTIVE OFFICERS
| | | | |
| Claiborne P. Deming | | W. Michael Hulse | | Kevin G. Fitzgerald |
| President and Chief Executive Officer since | | Executive Vice President – Worldwide | | Treasurer since July 2001. Mr. Fitzgerald |
| October 1994 and Director and Member of | | Downstream Operations since April 2003 | | was Director of Investor Relations from |
| the Executive Committee since 1993. | | and President of Murphy Oil USA, Inc. | | 1996 to June 2001. |
| | since November 2001. Mr. Hulse served | | |
| Steven A. Cossé | | asPresident of Murphy Eastern Oil | | John W. Eckart |
| Executive Vice President since February | | Company from April 1996 to November | | Controller since March 2000. |
| 2005 and General Counsel since August | | 2001. | | |
| 1991. Mr. Cossé was elected Senior Vice | | | | Walter K. Compton |
| President in 1994 and Vice President in 1993. | | Bill H. Stobaugh | | Secretary since December 1996. |
| | Senior Vice President since February 2005. | | |
| | Mr. Stobaugh joined the Company as Vice | | |
| | President in 1995. | | |