EXHIBIT 13
FINANCIALAND OPERATING HIGHLIGHTS
| | | | | | | | | | | | | | | |
(Thousands of dollars except per share data) | | 2006 | | 2005 | | % Change
2006–2005 | | | 2004 | | % Change
2005–2004 | |
For the Year | | | | | | | | | | | | | | | |
Revenues | | $ | 14,307,387 | | $ | 11,877,151 | | 20 | % | | $ | 8,359,839 | | 42 | % |
Net income | | | 638,279 | | | 846,452 | | -25 | % | | | 701,315 | | 21 | % |
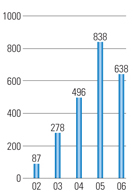
Income from continuing operations | | | 638,279 | | | 837,903 | | -24 | % | | | 496,395 | | 69 | % |
Cash dividends paid | | | 98,162 | | | 83,198 | | 18 | % | | | 78,205 | | 6 | % |
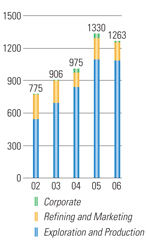
Capital expenditures1 | | | 1,262,539 | | | 1,329,831 | | -5 | % | | | 975,393 | | 36 | % |
Net cash provided by operating activities | | | 962,702 | | | 1,225,262 | | -21 | % | | | 1,097,018 | | 12 | % |
Average common shares outstanding – diluted (thousands) | | | 189,158 | | | 187,889 | | 1 | % | | | 186,887 | | 1 | % |
| | | | | | | | | | | | | | | |
At End of Year | | | | | | | | | | | | | | | |
Working capital | | $ | 795,986 | | $ | 551,938 | | 44 | % | | $ | 424,372 | | 30 | % |
Net property, plant and equipment | | | 5,106,282 | | | 4,374,229 | | 17 | % | | | 3,685,594 | | 19 | % |
Total assets | | | 7,445,727 | | | 6,368,511 | | 17 | % | | | 5,458,243 | | 17 | % |
Long-term debt | | | 840,275 | | | 609,574 | | 38 | % | | | 613,355 | | -1 | % |
Stockholders’ equity | | | 4,052,676 | | | 3,460,990 | | 17 | % | | | 2,649,156 | | 31 | % |
| | | | | | | | | | | | | | | |
Per Share of Common Stock | | | | | | | | | | | | | | | |
Net income – diluted | | $ | 3.37 | | $ | 4.51 | | -25 | % | | $ | 3.75 | | 20 | % |
Income from continuing operations – diluted | | | 3.37 | | | 4.46 | | -24 | % | | | 2.65 | | 68 | % |
Cash dividends paid | | | .525 | | | .45 | | 17 | % | | | .425 | | 6 | % |
Stockholders’ equity | | | 21.61 | | | 18.61 | | 16 | % | | | 14.39 | | 29 | % |
| | | | | | | | | | | | | | | |
Net Crude Oil and Gas Liquids Produced – barrels per day1 | | | 87,817 | | | 101,349 | | -13 | % | | | 93,634 | | 8 | % |
United States | | | 21,112 | | | 25,897 | | -18 | % | | | 19,314 | | 34 | % |
Canada | | | 39,653 | | | 46,086 | | -14 | % | | | 43,689 | | 5 | % |
Other International | | | 27,052 | | | 29,366 | | -8 | % | | | 30,631 | | -4 | % |
| | | | | | | | | | | | | | | |
Net Natural Gas Sold – thousands of cubic feet per day1 | | | 75,262 | | | 90,198 | | -17 | % | | | 109,452 | | -18 | % |
United States | | | 56,810 | | | 70,452 | | -19 | % | | | 88,621 | | -21 | % |
Canada | | | 9,752 | | | 10,323 | | -6 | % | | | 13,972 | | -26 | % |
United Kingdom | | | 8,700 | | | 9,423 | | -8 | % | | | 6,859 | | 37 | % |
| | | | | | | | | | | | | | | |
Crude Oil Refined – barrels per day | | | 119,231 | | | 135,122 | | -12 | % | | | 164,275 | | -18 | % |
North America | | | 89,195 | | | 108,139 | | -18 | % | | | 133,242 | | -19 | % |
United Kingdom | | | 30,036 | | | 26,983 | | 11 | % | | | 31,033 | | -13 | % |
| | | | | | | | | | | | | | | |
Petroleum Products Sold – barrels per day | | | 385,271 | | | 358,255 | | 8 | % | | | 338,908 | | 6 | % |
North America | | | 350,601 | | | 322,714 | | 9 | % | | | 301,801 | | 7 | % |
United Kingdom | | | 34,670 | | | 35,541 | | -2 | % | | | 37,107 | | -4 | % |
| | | | | | | | | | | | | | | |
Stockholder and Employee Data | | | | | | | | | | | | | | | |
Common shares outstanding (thousands)2 | | | 187,572 | | | 185,947 | | 1 | % | | | 184,071 | | 1 | % |
Number of stockholders of record2 | | | 2,758 | | | 2,847 | | -3 | % | | | 2,864 | | -1 | % |
Number of employees2 | | | 7,296 | | | 6,248 | | 17 | % | | | 5,826 | | 7 | % |
Average number of employees | | | 7,019 | | | 6,127 | | 15 | % | | | 5,276 | | 16 | % |
| | | | | | | | | | | | | | | |
1 | From continuing operations. |
Ex. 13-1
LETTERTO SHAREHOLDERS
Dear Fellow Shareholders,
As 2007 begins, our Company is in an enviable place with extraordinary production growth from our flagship Kikeh development (80%) in Malaysia scheduled to begin in the second half of this year. In addition, other meaningful developments are scheduled to start up in 2009 including the Sarawak, Malaysia gas project (85%), the Azurite Marine oil field in the Republic of Congo (85%) and the Thunder Hawk oil field in the Gulf of Mexico (37.5%). Put succinctly, we should double our production from current levels within the next few years. Also, as demonstrated by the record refining and marketing earnings in the third quarter of 2006, the breadth of the downstream segment today enables us to maintain a balanced, fully-integrated portfolio capable of capturing profit even in periods of declining crude oil prices. Certainly, the future of our Company is promising.
Hurricane Katrina Recovery
Reflecting on 2006, it is quite clear that Hurricane Katrina affected Murphy in a significant way and, I believe, as much as or more than any other energy company. At mid-year, the Meraux, Louisiana refinery restarted after extensive repairs following massive flooding from the storm. Also, the class action lawsuit concerning the oil spill resulting from Katrina was settled in September 2006 and received final court approval in January 2007. Settling mass tort claims this quickly is very unusual and reflects the hard work and substantial skills of all involved.
In the Gulf of Mexico, our affected production was restored in a timely manner with the exception of some of our non-operated production that is still awaiting additional remediation. Given the path and severity of the storm, it could have been much worse.
With the resolution of these issues, Hurricane Katrina and its aftermath have become more and more distant in our rearview mirror. It is important to report to you that we have been able to put this firmly behind us, which strengthens our focus on the future. I am particularly proud of the exceptional performance of our people during very trying circumstances. The bonds forged during this time of intense work, with shortened decision times involving large and complicated issues, will serve our Company well in the future.
Financial Results
Despite the lingering impacts of Katrina, 2006 was another strong year for the Company. For the year, Murphy earned $638.3 million ($3.37 per diluted share), with cash flow from operations of $962.7 million. The balance sheet at the end of the year is in sound condition with debt slightly exceeding 17 percent of capital employed.
During 2007, debt will increase as we fund ongoing development projects, but in keeping with the Company’s financial discipline, it will be measured and is expected to be paid down promptly with the strong cash flow generated by the projects mentioned above, beginning with Kikeh.
Exploration & Production
On the exploration front, we are currently revamping our program following spotty 2006 results. The year 2007 started nicely with a discovery at Rotan (80%) located offshore Sabah, Malaysia in Block H. This natural gas discovery is located in a new play type with younger sands than the other
Ex. 13-2

Claiborne P. Deming
President and Chief Executive Officer
deepwater Sabah discoveries. Several other similar nearby prospects exist and could be followed up later in the year. Furthermore, the two Sarawak blocks (SK 309 and SK 311) were renewed at the beginning of 2007. To date, we have made 14 discoveries offshore Sarawak and, importantly, substantial prospectivity remains on these prolific blocks. Offshore Republic of Congo, additional seismic has been obtained in the Mer Profonde Nord block (85%) and we are currently acquiring a seabed logging survey in the Mer Profonde Sud block (85%). Following completion of our analysis, an exploratory program will be developed. In our Gulf of Mexico portfolio, we will drill fewer wells this year as we recalibrate our program and prepare for the important 2007 and 2008 offshore lease sales. This basin remains a core area for future exploration as we currently hold a working interest in 235 offshore leases covering approximately 847,000 net acres. Also worthy of note, the Company’s reserve replacement and finding and development costs are much improved for 2006 as we continue what should be many years of booking reserves associated with our Malaysian discoveries.
Murphy’s unique strength is an inventory of high-quality, high-impact oil and natural gas developments. The Kikeh project is nearing completion and will provide approximately 80,000 barrels per day net to the Company when it ramps up to its plateau production level during 2008. Offshore Sarawak, Malaysia, the final agreement was signed in late February to develop multiple natural gas fields and to sell the natural gas to PETRONAS for their Bintulu LNG plant beginning in 2009. Likewise, in the Gulf of Mexico, our Thunder Hawk discovery located in Mississippi Canyon was sanctioned for development as a stand-alone semi-submersible floating production unit with a capacity of 45,000 barrels per day and is scheduled to commence production in 2009. Our Board also sanctioned the development of the Azurite discovery, offshore Republic of Congo. An innovative Floating, Drilling, Production, Storage and Offloading vessel (FDPSO) with production capacity of 40,000 barrels per day is anticipated with first oil also likely in 2009. Later this year, we anticipate sanctioning the Kakap discovery offshore Sabah, Malaysia as part of a unitized development that is operated by another company.
Ex.13-3
| | | | |
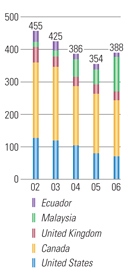
Estimated Net Proved Hydrocarbon Reserves Millions of oil
equivalent barrels | | Income from Continuing Operations Millions of dollars | | Capital Expenditures by Function Millions of dollars |
 | |  | |  |
Downstream
The year 2006 was a period of recovery for Murphy’s downstream business in the United States. The Company’s Meraux, Louisiana refinery suffered a direct hit from Hurricane Katrina in 2005 leaving it flooded and out of commission during the first half of 2006. However, Meraux came back on line in time to contribute to record earnings in the third quarter from the downstream segment, which benefited from healthy margins for both refining and marketing.
Our Superior, Wisconsin refinery ran reliably throughout the year and posted a year of record profit. Northern tier refineries were able to capture a substantial profit by running Canadian heavy crude and selling asphalt. Our operation was no exception and it was a banner year. Likewise, the downstream business in the United Kingdom proved once again to be a very efficient operation and posted another profitable year with the Milford Haven, Wales refinery and retail marketing assets, including the 68 fueling sites acquired in 2005, contributing nicely. The U.K. assets accounted for 30% of the income generated by our worldwide downstream operations in 2006.
In 2007, wewill focus on optimizing operations at our Meraux refinery and continuing to develop our growing retail marketing offering, Murphy USA. Our retail presence covers 21 states and this business had another very profitable year. I believe it is the preeminent retail gasoline operation of its kind and represents a superb business model. It continues to increase market share and profitability by way of competitive pricing. With 987 Murphy USA sites in operation at the end of 2006 and with the Meraux refinery restored, our downstream group is poised to contribute meaningfully and to provide balance to our overall operations.
Management Changes
We announced a significant management change in the fourth quarter of 2006. David Wood was named head of a combined Murphy Exploration & Production Company placing our worldwide upstream function under one management structure. David is responsible for the Company’s
Ex. 13-4
tremendous success in Malaysia and I feel very confident he will provide focused and dynamic leadership to this important function. At the same time, Harvey Doerr was named head of the Company’s worldwide refining and marketing organization. Harvey has run the Company’s Canadian operation for the last nine years in an exemplary fashion and is one of the most accomplished executives I have had the privilege to be around. I am looking forward to both David’s and Harvey’s leadership.
In Closing
I am enthusiastic about the opportunities that are before us. Certainly, the prospect of doubling our production is reason enough to be optimistic, but our future relies on much more than just these stellar assets. We would not be the company we are today without the forward-looking, innovative thinking of our worldwide employees. Their grit in the face of adversity as well as their ability to respond quickly to capture value are important to the future success of our enterprise.
Murphy’s strategy in the past has emphasized organic production growth and reserve additions through high-risk, but focused exploration. This strategy has served us well. However, given the increased cost of drilling and increasing difficulty of accessing plays, we will broaden our thinking to include different ways to capture opportunities that meaningfully add value. We are not completely changing what we do; however, we simply realize that as a Company we have to adapt to changed circumstances. We will continue our grass roots exploration but in a measured, focused way and will intensify our execution across all areas of our operations.
Our Company is also experiencing changes in its Board of Directors. In August, we announced the addition of James V. Kelley to our Board. Jim has extensive financial experience and knowledge but, more importantly, a level head and sound judgment. He will be a great addition. On a sad note, George S. Dembroski retires after twelve stellar years as a director. George has been a wonderful advisor and confidant. His market instincts are some of the best that I have ever seen and his integrity is unquestioned. To George, I say “outstanding!”
Also, we recently announced the funding of a scholarship program (called the El Dorado Promise) that allows every eligible graduate of the El Dorado Public School District to attend college. The $50 million gift, to be funded over ten years, is expected to provide college scholarships for graduating classes of El Dorado High School for the next 20 years. This gift is made possible by the hardworking, talented employees of Murphy Oil Corporation and to them it is dedicated. Their success allows this extraordinary gift of philanthropy to the home of our Company’s headquarters located in El Dorado for over 50 years. Likewise, I also believe in the promising future of Murphy and believe we are heading in the right direction with our eyes clearly on the road ahead.
|
 |
| Claiborne P. Deming |
| President and Chief Executive Officer |
|
| February 23, 2007 |
| El Dorado, Arkansas |
Ex. 13-5
EXPLORATIONAND PRODUCTION STATISTICAL SUMMARY
| | | | | | | | | | | | | | | |
| | | 2006 | | 2005 | | 2004 | | 2003 | | 2002 | | 2001 | | 2000 |
Net crude oil and condensate production – barrels per day | | | | | | | | | | | | | | | |
United States | | | 20,983 | | 25,777 | | 19,154 | | 4,374 | | 3,837 | | 4,3 39 | | 4,770 |
Canada – light | | | 110 | | 160 | | 168 | | 582 | | 1,256 | | 1,9 81 | | 2,055 |
heavy | | | 12,613 | | 11,806 | | 5,838 | | 4,705 | | 3,609 | | 4,521 | | 3,010 |
offshore | | | 14,896 | | 23,124 | | 25,407 | | 28,534 | | 24,037 | | 9,535 | | 9,199 |
synthetic | | | 11,701 | | 10,593 | | 11,794 | | 10,483 | | 11,362 | | 10,479 | | 8,443 |
United Kingdom | | | 7,095 | | 7,955 | | 10,800 | | 14,513 | | 18,180 | | 20,0 49 | | 20,679 |
Ecuador | | | 8,608 | | 7,871 | | 7,735 | | 5,172 | | 4,544 | | 5,3 19 | | 6,405 |
Malaysia | | | 11,298 | | 13,503 | | 11,885 | | 7,301 | | — | | — | | — |
Net natural gas liquids production – barrels per day | | | | | | | | | | | | | | | |
United States | | | 129 | | 120 | | 160 | | 152 | | 291 | | 413 | | 551 |
Canada | | | 333 | | 403 | | 482 | | 631 | | 311 | | 540 | | 182 |
United Kingdom | | | 51 | | 37 | | 211 | | 173 | | 122 | | 165 | | 216 |
| | | | | | | | | | | | | | | |
Continuing operations | | | 87,817 | | 101,349 | | 93,634 | | 76,620 | | 67,549 | | 57,341 | | 55,510 |
Discontinued operations | | | — | | — | | 3,106 | | 6,832 | | 8,821 | | 10,014 | | 9,749 |
| | | | | | | | | | | | | | | |
Total liquids produced | | | 87,817 | | 101,349 | | 96,740 | | 83,452 | | 76,370 | | 67,355 | | 65,259 |
| | | | | | | | | | | | | | | |
Net crude oil and condensate sold – barrels per day | | | | | | | | | | | | | | | |
United States | | | 20,983 | | 25,777 | | 19,154 | | 4,374 | | 3,837 | | 4,339 | | 4,769 |
Canada – light | | | 110 | | 160 | | 168 | | 582 | | 1,256 | | 1,981 | | 2,055 |
heavy | | | 12,613 | | 11,806 | | 5,838 | | 4,705 | | 3,609 | | 4,521 | | 3,010 |
offshore | | | 15,360 | | 22,443 | | 26,306 | | 28,542 | | 23,935 | | 9,862 | | 9,456 |
synthetic | | | 11,701 | | 10,593 | | 11,794 | | 10,483 | | 11,362 | | 10,479 | | 8,443 |
United Kingdom | | | 6,678 | | 8,247 | | 10,800 | | 14,591 | | 18,209 | | 20,206 | | 20,921 |
Ecuador | | | 10,349 | | 9,821 | | 3,414 | | 4,997 | | 4,293 | | 5,381 | | 6,393 |
Malaysia | | | 11,986 | | 13,818 | | 11,020 | | 7,235 | | — | | — | | — |
Net natural gas liquids sold – barrels per day | | | | | | | | | | | | | | | |
United States | | | 129 | | 120 | | 160 | | 152 | | 291 | | 413 | | 551 |
Canada | | | 333 | | 403 | | 482 | | 631 | | 311 | | 540 | | 182 |
United Kingdom | | | — | | 56 | | 124 | | 131 | | 149 | | 148 | | 216 |
| | | | | | | | | | | | | | | |
Continuing operations | | | 90,242 | | 103,244 | | 89,260 | | 76,423 | | 67,252 | | 57,870 | | 55,996 |
Discontinued operations | | | — | | — | | 3,106 | | 6,832 | | 8,821 | | 10,014 | | 9,749 |
| | | | | | | | | | | | | | | |
Total liquids sold | | | 90,242 | | 103,244 | | 92,366 | | 83,255 | | 76,073 | | 67,884 | | 65,745 |
| | | | | | | | | | | | | | | |
Net natural gas sold – thousands of cubic feet per day | | | | | | | | | | | | | | | |
United States | | | 56,810 | | 70,452 | | 88,621 | | 82,281 | | 88,067 | | 112,616 | | 141,373 |
Canada | | | 9,752 | | 10,323 | | 13,972 | | 19,946 | | 12,709 | | 25,701 | | 9,590 |
United Kingdom | | | 8,700 | | 9,423 | | 6,859 | | 9,564 | | 6,973 | | 13,125 | | 10,850 |
| | | | | | | | | | | | | | | |
Continuing operations | | | 75,262 | | 90,198 | | 109,452 | | 111,791 | | 107,749 | | 151,442 | | 161,813 |
Discontinued operations | | | — | | — | | 30,760 | | 103,543 | | 189,182 | | 129,793 | | 67,599 |
| | | | | | | | | | | | | | | |
Total natural gas sold | | | 75,262 | | 90,198 | | 140,212 | | 215,334 | | 296,931 | | 281,235 | | 229,412 |
| | | | | | | | | | | | | | | |
Net hydrocarbons produced – equivalent barrels1,2per day | | | 100,361 | | 116,382 | | 120,109 | | 119,341 | | 125,859 | | 114,228 | | 103,494 |
Estimated net hydrocarbon reserves – million equivalent barrels1,2,3 | | | 388.3 | | 353.6 | | 385.6 | | 425.5 | | 455.3 | | 501.2 | | 442.3 |
| | | | | | | | | | | | | | | |
Weighted average sales prices4 | | | | | | | | | | | | | | | |
Crude oil and condensate – dollars per barrel | | | | | | | | | | | | | | | |
United States | | $ | 57.30 | | 47.48 | | 35.35 | | 24.22 | | 24.25 | | 24.92 | | 30.38 |
Canada5– light | | | 58.26 | | 52.47 | | 37.70 | | 27.68 | | 22.81 | | 21.73 | | 29.98 |
heavy | | | 25.87 | | 21.30 | | 20.26 | | 12.36 | | 16.83 | | 11.21 | | 16.74 |
offshore | | | 62.55 | | 51.37 | | 36.60 | | 27.08 | | 25.36 | | 23.77 | | 27.16 |
synthetic | | | 63.23 | | 58.12 | | 40.35 | | 24.97 | | 25.64 | | 25.04 | | 29.62 |
United Kingdom | | | 64.30 | | 52.83 | | 36.82 | | 29.59 | | 24.39 | | 24.44 | | 27.78 |
Ecuador6 | | | 33.79 | | 32.54 | | 24.78 | | 22.99 | | 19.64 | | 17.00 | | 22.01 |
Malaysia7 | | | 51.78 | | 46.16 | | 41.35 | | 29.42 | | — | | — | | — |
Natural gas liquids – dollars per barrel | | | | | | | | | | | | | | | |
United States | | | 43.34 | | 35.09 | | 29.77 | | 23.42 | | 17.13 | | 20.40 | | 23.04 |
Canada5 | | | 48.00 | | 40.90 | | 30.83 | | 24.63 | | 16.98 | | 20.78 | | 22.98 |
United Kingdom | | | — | | 34.77 | | 26.91 | | 22.49 | | 18.28 | | 19.12 | | 23.64 |
Natural gas – dollars per thousand cubic feet | | | | | | | | | | | | | | | |
United States | | | 7.76 | | 8.52 | | 6.45 | | 5.29 | | 3.37 | | 4.64 | | 4.01 |
Canada5 | | | 6.49 | | 7.88 | | 5.64 | | 4.47 | | 2.59 | | 3.54 | | 4.68 |
United Kingdom5 | | | 7.34 | | 5.80 | | 4.52 | | 3.50 | | 2.76 | | 2.52 | | 1.81 |
1 | Natural gas converted at a 6:1 ratio. |
4 | Includes intracompany transfers at market prices. |
6 | Includes prices attained in 2006 and 2005 for recoupment of a portion of 2004 Block 16 crude oil production formerly owed to the Company. The price in 2006 is adversely affected by revenue sharing with the Ecuadorian government beginning in April 2006. |
7 | Prices in 2006 and 2005 are net of a payment under the terms of the production sharing contract for Block SK 309. |
Ex. 13-6
REFININGAND MARKETING STATISTICAL SUMMARY
| | | | | | | | | | | | | | | |
| | | 2006 | | 2005 | | 2004 | | 2003 | | 2002 | | 2001 | | 2000 |
Refining | | | | | | | | | | | | | | | |
Crude capacity* of refineries – barrels per stream day | | | 192,400 | | 192,400 | | 192,400 | | 192,400 | | 167,400 | | 167,400 | | 167,400 |
| | | | | | | | | | | | | | | |
Refinery inputs – barrels per day | | | | | | | | | | | | | | | |
Crude – Meraux, Louisiana | | | 55,129 | | 73,371 | | 101,644 | | 60,403 | | 83,721 | | 104,345 | | 103,154 |
Superior, Wisconsin | | | 34,066 | | 34,768 | | 31,598 | | 30,466 | | 30,468 | | 35,869 | | 34,159 |
Milford Haven, Wales | | | 30,036 | | 26,983 | | 31,033 | | 28,412 | | 29,640 | | 26,985 | | 28,507 |
Other feedstocks | | | 6,423 | | 9,131 | | 12,170 | | 10,113 | | 11,013 | | 9,901 | | 8,298 |
| | | | | | | | | | | | | | | |
Total inputs | | | 125,654 | | 144,253 | | 176,445 | | 129,394 | | 154,842 | | 177,100 | | 174,118 |
| | | | | | | | | | | | | | | |
Refinery yields – barrels per day | | | | | | | | | | | | | | | |
Gasoline | | | 48,314 | | 54,869 | | 68,663 | | 52,162 | | 63,409 | | 73,217 | | 75,106 |
Kerosine | | | 5,067 | | 7,805 | | 7,734 | | 6,568 | | 9,446 | | 12,874 | | 11,955 |
Diesel and home heating oils | | | 42,137 | | 48,535 | | 66,225 | | 41,277 | | 48,344 | | 52,660 | | 49,606 |
Residuals | | | 15,244 | | 18,231 | | 17,445 | | 14,595 | | 16,589 | | 20,530 | | 18,524 |
Asphalt, LPG and other | | | 12,855 | | 13,268 | | 14,693 | | 11,986 | | 12,651 | | 13,467 | | 14,624 |
Fuel and loss | | | 2,037 | | 1,545 | | 1,685 | | 2,806 | | 4,403 | | 4,352 | | 4,303 |
| | | | | | | | | | | | | | | |
Total yields | | | 125,654 | | 144,253 | | 176,445 | | 129,394 | | 154,842 | | 177,100 | | 174,118 |
| | | | | | | | | | | | | | | |
Average cost of crude inputs to refineries – dollars per barrel | | | | | | | | | | | | | | | |
North America | | $ | 59.54 | | 49.73 | | 40.00 | | 29.79 | | 24.76 | | 23.44 | | 28.82 |
United Kingdom | | | 66.66 | | 56.15 | | 39.60 | | 30.24 | | 25.83 | | 24.86 | | 29.29 |
| | | | | | | | | | | | | | | |
Marketing | | | | | | | | | | | | | | | |
Products sold – barrels per day | | | | | | | | | | | | | | | |
North America – Gasoline | | | 266,353 | | 233,191 | | 207,786 | | 162,911 | | 112,281 | | 96,597 | | 76,314 |
Kerosine | | | 2,269 | | 5,671 | | 4,811 | | 4,388 | | 5,818 | | 9,621 | | 8,517 |
Diesel and home heating oils | | | 62,196 | | 60,228 | | 66,648 | | 43,373 | | 35,995 | | 41,064 | | 39,347 |
Residuals | | | 11,696 | | 15,330 | | 13,699 | | 10,972 | | 13,759 | | 17,308 | | 15,163 |
Asphalt, LPG and other | | | 8,087 | | 8,294 | | 8,857 | | 8,232 | | 8,574 | | 9,666 | | 10,271 |
| | | | | | | | | | | | | | | |
| | | 350,601 | | 322,714 | | 301,801 | | 229,876 | | 176,427 | | 174,256 | | 149,612 |
| | | | | | | | | | | | | | | |
United Kingdom – Gasoline | | | 12,425 | | 12,739 | | 11,435 | | 12,101 | | 12,058 | | 11,058 | | 11,622 |
Kerosine | | | 3,619 | | 2,410 | | 2,756 | | 2,526 | | 2,685 | | 2,547 | | 2,478 |
Diesel and home heating oils | | | 11,803 | | 14,910 | | 14,649 | | 13,506 | | 14,574 | | 11,798 | | 9,760 |
Residuals | | | 3,825 | | 3,242 | | 4,062 | | 3,816 | | 3,127 | | 3,538 | | 3,852 |
LPG and other | | | 2,998 | | 2,240 | | 4,205 | | 3,103 | | 1,760 | | 2,121 | | 2,191 |
| | | | | | | | | | | | | | | |
| | | 34,670 | | 35,541 | | 37,107 | | 35,052 | | 34,204 | | 31,062 | | 29,903 |
| | | | | | | | | | | | | | | |
Total products sold | | | 385,271 | | 358,255 | | 338,908 | | 264,928 | | 210,631 | | 205,318 | | 179,515 |
| | | | | | | | | | | | | | | |
Branded retail outlets* | | | | | | | | | | | | | | | |
North America – Murphy USA | | | 987 | | 864 | | 752 | | 623 | | 506 | | 387 | | 276 |
Other | | | 177 | | 337 | | 375 | | 371 | | 408 | | 428 | | 436 |
Total | | | 1,164 | | 1,201 | | 1,127 | | 994 | | 914 | | 815 | | 712 |
United Kingdom | | | 402 | | 412 | | 358 | | 384 | | 416 | | 411 | | 386 |
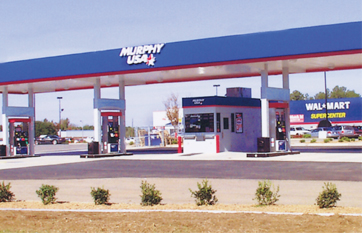
In 2006, Murphy continued to expand its high-volume Murphy USA brand by adding 123 stations in the Company’s 21-state marketing area.
Ex. 13-7
BOARDOF DIRECTORS
| | |
 | | WILLIAM C. NOLAN, JR. Partner, Nolan & Alderson, Attorneys, El Dorado, Arkansas. Director since 1977. Chairman of the Board and the Executive Committee, ex-officio member of all other committees |
| |
| |
| |
| |
| |
 | | CLAIBORNE P. DEMING President and Chief Executive Officer, Murphy Oil Corporation, El Dorado, Arkansas. Director since 1993. Committees: Executive |
| |
| |
| |
| |
| |
| |
 | | FRANK W. BLUE Attorney, Santa Barbara, California. Director since 2003. Committees: Audit; Nominating and Governance |
| |
| |
| |
| |
 | | GEORGE S. DEMBROSKI Vice Chairman, Retired, RBC Dominion Securities Limited, Toronto, Ontario, Canada. Director since 1995. Committees: Executive; Audit; Executive Compensation (Chairman) |
| |
| |
| |
| |
| |
| |
 | | ROBERT A. HERMES Chairman of the Board, Retired, Purvin & Gertz, Inc., Houston, Texas. Director since 1999. Committees: Nominating and Governance (Chairman); Public Policy and Environmental |
| |
| |
| |
| |
| |
| |
 | | JAMES V. KELLEY President and Chief Operating Officer, BancorpSouth, Inc., Tupelo, Mississippi. Director since 2006. Committees: Audit |
| |
| |
| |
| |
| |
 | | R. MADISON MURPHY Managing Member, Murphy Family Management, LLC, El Dorado, Arkansas. Director since 1993; Chairman from 1994–2002. Committees: Executive; Audit (Chairman) |
| |
| |
| |
| |
| |
| |
 | | IVAR B. RAMBERG Executive Officer, Ramberg Consulting AS, Osteraas, Norway. Director since 2003. Committees: Nominating and Governance; Public Policy and Environmental |
| |
| |
| |
| |
| |
| |
 | | NEAL E. SCHMALE President and Chief Operating Officer, Sempra Energy, San Diego, California. Director since 2004. Committees: Audit; Executive Compensation |
| |
| |
| |
| |
| |
 | | DAVID J. H. SMITH Chief Executive Officer, Retired, Whatman plc, Maidstone, Kent, England. Director since 2001. Committees: Executive Compensation; Public Policy and Environmental |
| |
| |
| |
| |
| |
| |
 | | CAROLINE G. THEUS President, Keller Enterprises, LLC, and President, Inglewood Land and Development Co., Alexandria, Louisiana. Director since 1985. Committees: Executive; Public Policy and Environmental (Chairman) |
| |
| |
| |
| |
| |
| |
Ex. 13-8
PRINCIPAL OPERATING SUBSIDIARIES
| | | | | | |
Murphy Exploration & Production Company Engages in crude oil and natural gas exploration and production. | | 550 WestLake Park Blvd. Suite 1000 Houston, Texas 77079 (281) 249-1040 | | David M. Wood President Steven A. Cossé Vice President and General Counsel | | Mindy K. West Vice President and Treasurer John W. Eckart Vice President and Controller Walter K. Compton Secretary |
Murphy Oil Company Ltd. Engages in crude oil and natural gas exploration and production, extraction and sale of synthetic crude oil, and marketing of petroleum products in Canada. | | 1700-555-4th Avenue SW Calgary, Alberta T2P 3E7 (403) 294-8000 Mailing Address: P.O. Box 2721, Station M Calgary, Alberta T2P 3Y3 Canada | | Steve C. Crosby President W. Patrick Olson Vice President, Production | | Mindy K. West Vice President and Treasurer Heather J. Jones Controller Georg R. McKay Secretary |
Murphy Oil USA, Inc. Engages in refining and marketing of petroleum products in the United States. | | 200 Peach Street El Dorado, Arkansas 71730 (870) 862-6411 Mailing Address: P.O. Box 7000 El Dorado, Arkansas 71731-7000 | | Harvey Doerr President Charles A. Ganus Senior Vice President, Marketing and President, Murphy USA Marketing Company Gary R. Bates Vice President, Supply and Transportation Ernest C. Cagle Vice President, Manufacturing John D. Edmunds Vice President, Engineering | | Henry J. Heithaus Vice President, Retail Marketing Steven A. Cossé Vice President and General Counsel Mindy K. West Vice President and Treasurer John W. Eckart Vice President and Controller Walter K. Compton Secretary |
Ex. 13-9
CORPORATE INFORMATION
CORPORATE OFFICE
200 Peach Street
P.O. Box 7000
El Dorado, Arkansas 71731-7000
(870) 862-6411
STOCK EXCHANGE LISTINGS
Trading Symbol: MUR
New York Stock Exchange
TRANSFER AGENTAND REGISTRAR
Computershare Investor Services, L.L.C.
2 North LaSalle St.
Chicago, Illinois 60602
Toll-free (888) 239-5303
Local Chicago (312) 360-5303
ELECTRONIC PAYMENTOF DIVIDENDS
Shareholders may have dividends deposited directly into their bank accounts by electronic funds transfer. Authorization forms may be obtained from:
Computershare Investor Services, L.L.C.
2 North LaSalle St.
Chicago, Illinois 60602
Toll-free (888) 239-5303
Local Chicago (312) 360-5303
ANNUAL MEETING
The annual meeting of the Company’s shareholders will be held at 10:00 a.m. on May 9, 2007, at the South Arkansas Arts Center, 110 East 5th Street, El Dorado, Arkansas. A formal notice of the meeting, together with a proxy statement and proxy form, will be provided to all shareholders.
E-MAIL ADDRESS
murphyoil@murphyoilcorp.com
WWW.MURPHYOILCORP.COM
Murphy Oil’s website provides frequently updated information about the Company and its operations, including:
| • | | Live webcasts of quarterly conference calls |
| • | | Links to the Company’s SEC filings |
| • | | Profiles of the Company’s operations |
| • | | On-line stock investment accounts |
| • | | Murphy USA station locator |
INQUIRIES
Inquiries regarding shareholder account matters should be addressed to:
Walter K. Compton
Secretary
Murphy Oil Corporation
P.O. Box 7000
El Dorado, Arkansas 71731-7000
Members of the financial community should direct their inquiries to:
Dory J. Stiles
Manager of Investor Relations
Murphy Oil Corporation
P.O. Box 7000
El Dorado, Arkansas 71731-7000
(870) 864-6496
CERTIFICATIONS
The Company has filed the required certifications under Section 302 of the Sarbanes-Oxley Act of 2002 regarding the quality of our public disclosures as Exhibits 31.1 and 31.2 to our annual report on Form 10-K for the fiscal year ended December 31, 2006. In 2006 after our annual meeting of stockholders, the Company filed with the New York Stock Exchange the CEO certification regarding its compliance with the NYSE corporate governance listing standards as required by NYSE Rule 303A.12(a).
EXECUTIVE OFFICERS
CLAIBORNE P. DEMING
President and Chief Executive Officer since October 1994 and Director and Member of the Executive Committee since 1993.
STEVEN A. COSSÉ
Executive Vice President since February 2005 and General Counsel since August 1991. Mr. Cossé was elected Senior Vice President in 1994 and Vice President in 1993.
HARVEY DOERR
Executive Vice President and President of Murphy Oil USA, Inc. since January 2007. Mr. Doerr served as President of Murphy Oil Company Ltd. from September 1997 through December 2006.
DAVID M. WOOD
Executive Vice President and President of Murphy Exploration & Production Company since January 2007. Mr. Wood served as President of Murphy Exploration & Production Company-International from March 2003 through December 2006 and was Senior Vice President of Frontier Exploration & Production from April 1999 through February 2003.
KEVIN G. FITZGERALD
Senior Vice President and Chief Financial Officer since January 2007. Mr. Fitzgerald was Treasurer from July 2001 through December 2006 and Director of Investor Relations from 1996 through June 2001.
BILL H. STOBAUGH
Senior Vice President since February 2005. Mr. Stobaugh joined the Company as Vice President in 1995.
MINDY K. WEST
Vice President and Treasurer since January 2007. Ms. West was Director of Investor Relations from July 2001 through December 2006.
JOHN W. ECKART
Vice President and Controller since January 2007. Mr. Eckart has been Controller since March 2000.
WALTER K. COMPTON
Secretary since December 1996.
Ex. 13-10