Exhibit 13
Letter to Shareholders

Claiborne P. Deming
President and Chief Executive Officer
Dear Fellow Shareholders,
I believe very strongly that 2007 will be viewed, especially in the fullness of time, as a pivotal and extraordinarily important year for our Company. The year will not only be identified with a significant individual event (the start-up of production from our Kikeh field (80%) in Malaysia) but also as the year the Company repositioned itself and charted the course for its future. We are in the midst of an intriguing but, more importantly, intense value-creation time, represented, in part, by the following: the start-up of Kikeh; frontier acreage acquisitions offshore Suriname and Australia; a potentially significant natural gas “new play” acquisition in British Columbia; the most successful Gulf of Mexico lease sale for Murphy in recent memory; the Murphy USA property acquisition; and the Milford Haven, Wales refinery purchase. In addition, we sold down the Company’s interest in the Azurite field in West Africa (picking up a “carry” on two exploration wells) and sold out of our position in Berkana Energy Corp., a Canadian junior company.
In brief, the realigned leadership group put in place at the end of 2006 consisting of David Wood, leader of a single worldwide Upstream operating group, and Harvey Doerr, head of worldwide Downstream operations, performed well in their expanded roles. I feel very confident with their leadership reflected by the opportunities already secured under their oversight.
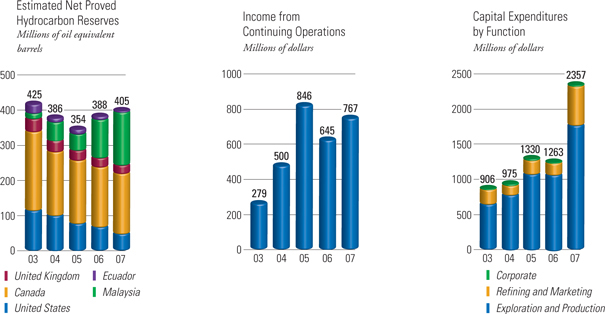
Financial ResultsA healthy commodity price environment coupled with good execution by both the Upstream and Downstream operating units allowed the Company to turn in its second best year of net income with earnings of $766.5 million ($4.01 per diluted share). Cash flow from operations was $1,740.4 million and we ended the year with a healthy debt to capital employed ratio of 23%.
Exploration and ProductionDeservedly, Kikeh gets top billing. The start-up of production from this field on August 17, 2007 brought to fruition arguably the most meaningful discovery in the Company’s history. We believe the Kikeh development set a record for a deepwater development by going from discovery to first oil in just five years. Just as importantly, costs were controlled very efficiently during a period of escalating prices. We all owe a debt of gratitude to the first class team led by Roger Jenkins that made this happen.
Secondly, from the sanctioned development projects now in place, production is set to approximately double in the near term from the 2007 average production level of just under 102,000 barrels of oil equivalent per day. This industry leading organic growth is anchored by the Kikeh field, but also importantly from other developments scheduled to commence production beginning in 2008 and 2009, including: Tupper (100%); Sarawak natural gas (85%); Thunder Hawk (37.5%); and Azurite (50%). Also, our Kakap (14%) discovery offshore Sabah, Malaysia was sanctioned in December and will be part of a unitized development operated by another company with first production slated for late 2012.
As planned, 2007 was somewhat quiet on the exploration front. We made two natural gas discoveries in Block H offshore Malaysia, Rotan and Biris (both 80%). These fields provide a solid foundation as we pursue bringing another production center on in this region. Look for us to become much more active on the worldwide exploration front in 2008. Wildcats are planned for deepwater Block K and shallow water Blocks 309 and 311 in Malaysia, both the Mer Profonde Sud and Mer Profonde Nord blocks offshore Republic of Congo, the Gulf of Mexico, and offshore Australia. These prospects tend to be quite large and target both oil and gas. In the Congo, partners will be brought in and will pay disproportionately in order to mitigate risk.
2
Of considerable importance for the future and as noted at the outset, we were able to quietly position ourselves over the last year into new areas that will enhance an already robust exploration portfolio. Acreage was acquired in two new countries – Suriname and Australia. Block 37 in Suriname (80%) covers about two million acres and was picked up in June. We will be acquiring 3D seismic this year and should drill our first prospect in 2009. In November, we announced the acquisition, subject to government approval, of a 40% working interest and operatorship in permit AC/P36 located in the Browse Basin offshore northwestern Australia. The area covers approximately one million acres and has several quite large structures which are currently being evaluated ahead of drilling in the fourth quarter of 2008.
We were also able to pick up substantial acreage in a more familiar basin – the Gulf of Mexico. Twenty-six deepwater blocks in DeSoto Canyon and Lloyd Ridge were obtained in October’s OCS Sale 205. These blocks, 22 of which have never been leased before, will become a focal point in future Gulf of Mexico exploration plans beginning this year and complement our existing Green Canyon acreage position upon which we recently received encouraging preliminary results from a wide-azimuth 3D survey shoot.
Another significant addition during 2007 was the Tupper leases. Located in northeastern British Columbia, this tight gas sands play is part of the Triassic-aged Montney formation. Given our affinity toward high impact exploration, this resource play provides us with needed balance while making us more geographically diverse. The drilling program kicked off in November 2007 and results thus far have been promising. We will concentrate our effort this year on drilling and putting the infrastructure in place to bring first gas to market in the fourth quarter of 2008.
Refining and MarketingTurning to Downstream, 2007 resulted in record setting income for the group of nearly $206 million, approximately 27% of total company-wide net income. Considering the state of our downstream business post-Hurricane Katrina, this magnitude of earnings is certainly welcome. Naturally, more is expected.
Two distinguishing events occurred in 2007. Firstly, we acquired the real estate underlying most of our existing Murphy USA retail stations, and secondly, we purchased the remaining 70% interest in the Milford Haven, Wales refinery.
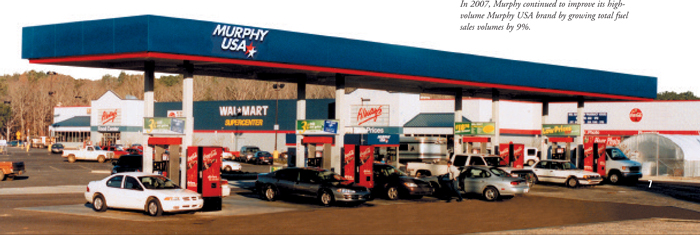
Owning the retail properties as opposed to leasing enhances the sustainability of this “best in class” retail offering. In the process of securing this deal, we were able to close 47 nonstrategic U.S. locations that were not performing as well as the remainder of the sites. In an effort to leverage our brand recognition, we are also in the early stages of implementing a new, larger convenience store model independent of our Wal-Mart Supercenter stronghold. It will be a “new launch” that should quickly gain scale and complement the highly successful Murphy USA format. We exited 2007 with 973 stations in operation and should top the 1,000 station threshold later this year.
Effective December 1, 2007, for a very attractive price, we became sole owner and operator of the Milford Haven refinery in which we previously held a 30% stake. Integration of this facility into our portfolio adds important diversity to our Downstream business and should be immediately accretive to earnings and cash flow. Having been a partner in the facility for over 26 years, we have experience in the local market and should be able to capture synergies afforded by having a focused, unitary ownership structure. While this acquisition makes us “long” on gasoline in the U.K., our retail network will look to expand and we will explore potential arbitrage opportunities to the United States.
On the United States refining front, much emphasis continues to be placed upon operating reliably. I am happy to say that Meraux’s operational performance during the final quarter of 2007 was excellent. Our Superior, Wisconsin refinery once again proved to be a steady performer eclipsing the profit record set in 2006.
Often not mentioned but critically important, our midstream business was strengthened as well in 2007 with the opening of a new terminal facility near Jonesboro, Arkansas. This terminal services a three-state region in the heartland of America. In 2008, we plan to equip all 12 of our company-owned U.S. terminals with ethanol blending capabilities.
3
Closing ThoughtsHistory tells us that high commodity prices are destined to retreat and low commodity prices are destined to climb. As an organization, it is imperative that we position ourselves wisely in the event of a downturn in the overall economy or commodity prices, while still taking the steps necessary to ensure future success in either pricing environment.
Quite candidly, I believe Murphy Oil is stronger today than ever and properly aligned to create value for our shareholders. Murphy is fortunate to have an extraordinary array of talented individuals at all levels of our organization that not only have the foresight necessary to chart the course but the willingness to roll up their sleeves and get there.
As our shareholders, we work for you and your continued support is greatly appreciated. In 2007 we took steps to chart the course of Murphy Oil; now it is time to make it happen. That is exactly what we are doing.
|
| Claiborne P. Deming |
| President and Chief Executive Officer |

February 15, 2008
El Dorado, Arkansas
4
Financial and Operating Highlights
| % Change | % Change | ||||||||||||||
(Thousands of dollars except per share data) | 2007 | 2006 | 2007–2006 | 2005 | 2006–2005 | ||||||||||
For the Year | |||||||||||||||
Revenues | $ | 18,439,098 | $ | 14,307,387 | 29 | % | $ | 11,877,151 | 20 | % | |||||
Net income | 766,529 | 644,669 | 19 | % | 854,742 | -25 | % | ||||||||
Income from continuing operations | 766,529 | 644,669 | 19 | % | 846,193 | -24 | % | ||||||||
Cash dividends paid | 127,353 | 98,162 | 30 | % | 83,198 | 18 | % | ||||||||
Capital expenditures1 | 2,357,347 | 1,262,539 | 87 | % | 1,329,831 | -5 | % | ||||||||
Net cash provided by operating activities | 1,740,420 | 975,478 | 78 | % | 1,248,931 | -22 | % | ||||||||
Average common shares outstanding – diluted (thousands) | 191,141 | 189,158 | 1 | % | 187,889 | 1 | % | ||||||||
At End of Year | |||||||||||||||
Working capital | $ | 777,530 | $ | 795,986 | -2 | % | $ | 551,938 | 44 | % | |||||
Net property, plant and equipment | 7,109,822 | 5,106,282 | 39 | % | 4,374,229 | 17 | % | ||||||||
Total assets | 10,535,849 | 7,483,161 | 41 | % | 6,410,396 | 17 | % | ||||||||
Long-term debt | 1,516,156 | 840,275 | 80 | % | 609,574 | 38 | % | ||||||||
Stockholders’ equity | 5,066,174 | 4,121,273 | 23 | % | 3,522,070 | 17 | % | ||||||||
Per Share of Common Stock | |||||||||||||||
Net income – diluted | $ | 4.01 | $ | 3.41 | 18 | % | $ | 4.55 | -25 | % | |||||
Income from continuing operations – diluted | 4.01 | 3.41 | 18 | % | 4.50 | -24 | % | ||||||||
Cash dividends paid | .675 | .525 | 29 | % | .45 | 17 | % | ||||||||
Stockholders’ equity | 26.70 | 21.97 | 22 | % | 18.94 | 16 | % | ||||||||
Net Crude Oil and Gas Liquids Produced – barrels per day1 | 91,522 | 87,817 | 4 | % | 101,349 | -13 | % | ||||||||
United States | 12,989 | 21,112 | -38 | % | 25,897 | -18 | % | ||||||||
Canada | 43,939 | 39,653 | 11 | % | 46,086 | -14 | % | ||||||||
Other International | 34,594 | 27,052 | 28 | % | 29,366 | -8 | % | ||||||||
Net Natural Gas Sold – thousands of cubic feet per day1 | 61,082 | 75,262 | -19 | % | 90,198 | -17 | % | ||||||||
United States | 45,139 | 56,810 | -21 | % | 70,452 | -19 | % | ||||||||
Canada | 9,922 | 9,752 | 2 | % | 10,323 | -6 | % | ||||||||
United Kingdom | 6,021 | 8,700 | -31 | % | 9,423 | -8 | % | ||||||||
Crude Oil Refined – barrels per day | 175,183 | 119,231 | 47 | % | 135,122 | -12 | % | ||||||||
North America | 139,183 | 89,195 | 56 | % | 108,139 | -18 | % | ||||||||
United Kingdom | 36,000 | 30,036 | 20 | % | 26,983 | -11 | % | ||||||||
Petroleum Products Sold – barrels per day | 457,770 | 385,271 | 19 | % | 358,255 | 8 | % | ||||||||
North America | 416,668 | 350,601 | 19 | % | 322,714 | 9 | % | ||||||||
United Kingdom | 41,102 | 34,670 | 19 | % | 35,541 | -2 | % | ||||||||
Stockholder and Employee Data | |||||||||||||||
Common shares outstanding (thousands)2 | 189,714 | 187,572 | 1 | % | 185,947 | 1 | % | ||||||||
Number of stockholders of record2 | 2,655 | 2,758 | -4 | % | 2,847 | -3 | % | ||||||||
Number of employees2 | 7,539 | 7,296 | 3 | % | 6,248 | 17 | % | ||||||||
Average number of employees | 7,340 | 7,019 | 5 | % | 6,127 | 15 | % | ||||||||
| 1 | From continuing operations. |
| 2 | At December 31. |
5
Exploration and Production Statistical Summary
| 2007 | 2006 | 2005 | 2004 | 2003 | 2002 | 2001 | |||||||||
Net crude oil, condensate and natural gas liquids production – barrels per day | |||||||||||||||
United States | 12,989 | 21,112 | 25,897 | 19,314 | 4,526 | 4,128 | 4,752 | ||||||||
Canada – light | 596 | 443 | 563 | 650 | 1,213 | 1,567 | 2,521 | ||||||||
heavy | 11,524 | 12,613 | 11,806 | 5,838 | 4,705 | 3,609 | 4,521 | ||||||||
offshore | 18,871 | 14,896 | 23,124 | 25,407 | 28,534 | 24,037 | 9,535 | ||||||||
synthetic | 12,948 | 11,701 | 10,593 | 11,794 | 10,483 | 11,362 | 10,479 | ||||||||
United Kingdom | 5,281 | 7,146 | 7,992 | 11,011 | 14,686 | 18,302 | 20,214 | ||||||||
Malaysia | 20,367 | 11,298 | 13,503 | 11,885 | 7,301 | — | — | ||||||||
Ecuador | 8,946 | 8,608 | 7,871 | 7,735 | 5,172 | 4,544 | 5,319 | ||||||||
Continuing operations | 91,522 | 87,817 | 101,349 | 93,634 | 76,620 | 67,549 | 57,341 | ||||||||
Discontinued operations | — | — | — | 3,106 | 6,832 | 8,821 | 10,014 | ||||||||
Total liquids produced | 91,522 | 87,817 | 101,349 | 96,740 | 83,452 | 76,370 | 67,355 | ||||||||
Net crude oil, condensate and natural gas liquids sold – barrels per day | |||||||||||||||
United States | 12,989 | 21,112 | 25,897 | 19,314 | 4,526 | 4,128 | 4,752 | ||||||||
Canada – light | 596 | 443 | 563 | 650 | 1,213 | 1,567 | 2,521 | ||||||||
heavy | 11,524 | 12,613 | 11,806 | 5,838 | 4,705 | 3,609 | 4,521 | ||||||||
offshore | 18,839 | 15,360 | 22,443 | 26,306 | 28,542 | 23,935 | 9,862 | ||||||||
synthetic | 12,948 | 11,701 | 10,593 | 11,794 | 10,483 | 11,362 | 10,479 | ||||||||
United Kingdom | 5,218 | 6,678 | 8,303 | 10,924 | 14,722 | 18,358 | 20,354 | ||||||||
Malaysia | 16,018 | 11,986 | 13,818 | 11,020 | 7,235 | — | — | ||||||||
Ecuador | 9,470 | 10,349 | 9,821 | 3,414 | 4,997 | 4,293 | 5,381 | ||||||||
Continuing operations | 87,602 | 90,242 | 103,244 | 89,260 | 76,423 | 67,252 | 57,870 | ||||||||
Discontinued operations | — | — | — | 3,106 | 6,832 | 8,821 | 10,014 | ||||||||
Total liquids sold | 87,602 | 90,242 | 103,244 | 92,366 | 83,255 | 76,073 | 67,884 | ||||||||
Net natural gas sold – thousands of cubic feet per day | |||||||||||||||
United States | 45,139 | 56,810 | 70,452 | 88,621 | 82,281 | 88,067 | 112,616 | ||||||||
Canada | 9,922 | 9,752 | 10,323 | 13,972 | 19,946 | 12,709 | 25,701 | ||||||||
United Kingdom | 6,021 | 8,700 | 9,423 | 6,859 | 9,564 | 6,973 | 13,125 | ||||||||
Continuing operations | 61,082 | 75,262 | 90,198 | 109,452 | 111,791 | 107,749 | 151,442 | ||||||||
Discontinued operations | — | — | — | 30,760 | 103,543 | 189,182 | 129,793 | ||||||||
Total natural gas sold | 61,082 | 75,262 | 90,198 | 140,212 | 215,334 | 296,931 | 281,235 | ||||||||
Net hydrocarbons produced – equivalent barrels1,2per day | 101,702 | 100,361 | 116,382 | 120,109 | 119,341 | 125,859 | 114,228 | ||||||||
Estimated net hydrocarbon reserves – million equivalent barrels1,2,3 | 405.1 | 388.3 | 353.6 | 385.6 | 425.5 | 455.3 | 501.2 | ||||||||
Weighted average sales prices4 | |||||||||||||||
Crude oil, condensate and NGL – dollars per barrel | |||||||||||||||
United States | $ | 65.57 | 57.30 | 47.48 | 35.35 | 24.22 | 24.25 | 24.92 | |||||||
Canada5 – light | 50.98 | 50.45 | 44.27 | 32.96 | 26.02 | 20.38 | 21.75 | ||||||||
heavy | 32.84 | 25.87 | 21.30 | 20.26 | 12.36 | 16.83 | 11.21 | ||||||||
offshore | 69.83 | 62.55 | 51.37 | 36.60 | 27.08 | 25.36 | 23.77 | ||||||||
synthetic | 74.35 | 63.23 | 58.12 | 40.35 | 24.97 | 25.64 | 25.04 | ||||||||
United Kingdom | 68.38 | 64.30 | 52.83 | 36.82 | 29.59 | 24.39 | 24.44 | ||||||||
Malaysia6 | 74.58 | 51.78 | 46.16 | 41.35 | 29.42 | — | — | ||||||||
Ecuador7 | 36.47 | 33.79 | 32.54 | 24.78 | 22.99 | 19.64 | 17.00 | ||||||||
Natural gas – dollars per thousand cubic feet | |||||||||||||||
United States | 7.38 | 7.76 | 8.52 | 6.45 | 5.29 | 3.37 | 4.64 | ||||||||
Canada5 | 6.34 | 6.49 | 7.88 | 5.64 | 4.47 | 2.59 | 3.54 | ||||||||
United Kingdom5 | 7.54 | 7.34 | 5.80 | 4.52 | 3.50 | 2.76 | 2.52 | ||||||||
1 | Natural gas converted at a 6:1 ratio. |
2 | Includes synthetic oil. |
3 | At December 31. |
4 | Includes intracompany transfers at market prices. |
5 | U.S. dollar equivalent. |
6 | Prices in 2007–2005 are net of payments under the terms of the production sharing contracts for Blocks SK 309 and K. |
7 | Includes prices attained in 2006 and 2005 for recoupment of a portion of 2004 Block 16 crude oil production formerly owed to the Company. The prices in 2007 and 2006 are adversely affected by revenue sharing with the Ecuadorian government beginning in April 2006 and further increased in October 2007. |
6
Refining and Marketing Statistical Summary
| 2007 | 2006 | 2005 | 2004 | 2003 | 2002 | 2001 | |||||||||
Refining | |||||||||||||||
Crude capacity*of refineries – barrels per stream day | 268,000 | 192,400 | 192,400 | 192,400 | 192,400 | 167,400 | 167,400 | ||||||||
Refinery inputs – barrels per day | |||||||||||||||
Crude – Meraux, Louisiana | 106,446 | 55,129 | 73,371 | 101,644 | 60,403 | 83,721 | 104,345 | ||||||||
Superior, Wisconsin | 32,737 | 34,066 | 34,768 | 31,598 | 30,466 | 30,468 | 35,869 | ||||||||
Milford Haven, Wales | 36,000 | 30,036 | 26,983 | 31,033 | 28,412 | 29,640 | 26,985 | ||||||||
Other feedstocks | 10,805 | 6,423 | 9,131 | 12,170 | 10,113 | 11,013 | 9,901 | ||||||||
Total inputs | 185,988 | 125,654 | 144,253 | 176,445 | 129,394 | 154,842 | 177,100 | ||||||||
Refinery yields – barrels per day | |||||||||||||||
Gasoline | 74,395 | 48,314 | 54,869 | 68,663 | 52,162 | 63,409 | 73,217 | ||||||||
Kerosine | 5,371 | 5,067 | 7,805 | 7,734 | 6,568 | 9,446 | 12,874 | ||||||||
Diesel and home heating oils | 67,111 | 42,137 | 48,535 | 66,225 | 41,277 | 48,344 | 52,660 | ||||||||
Residuals | 18,910 | 15,244 | 18,231 | 17,445 | 14,595 | 16,589 | 20,530 | ||||||||
Asphalt, LPG and other | 17,546 | 12,855 | 13,268 | 14,693 | 11,986 | 12,651 | 13,467 | ||||||||
Fuel and loss | 2,655 | 2,037 | 1,545 | 1,685 | 2,806 | 4,403 | 4,352 | ||||||||
Total yields | 185,988 | 125,654 | 144,253 | 176,445 | 129,394 | 154,842 | 177,100 | ||||||||
Average cost of crude inputs to refineries – dollars per barrel | |||||||||||||||
North America | $ | 69.40 | 59.54 | 49.73 | 40.00 | 29.79 | 24.76 | 23.44 | |||||||
United Kingdom | 81.53 | 66.66 | 56.15 | 39.60 | 30.24 | 25.83 | 24.86 | ||||||||
Marketing | |||||||||||||||
Products sold – barrels per day | |||||||||||||||
North America – Gasoline | 298,833 | 266,353 | 233,191 | 207,786 | 162,911 | 112,281 | 96,597 | ||||||||
Kerosine | 1,685 | 2,269 | 5,671 | 4,811 | 4,388 | 5,818 | 9,621 | ||||||||
Diesel and home heating oils | 91,344 | 62,196 | 60,228 | 66,648 | 43,373 | 35,995 | 41,064 | ||||||||
Residuals | 15,422 | 11,696 | 15,330 | 13,699 | 10,972 | 13,759 | 17,308 | ||||||||
Asphalt, LPG and other | 9,384 | 8,087 | 8,294 | 8,857 | 8,232 | 8,574 | 9,666 | ||||||||
| 416,668 | 350,601 | 322,714 | 301,801 | 229,876 | 176,427 | 174,256 | |||||||||
United Kingdom – Gasoline | 14,356 | 12,425 | 12,739 | 11,435 | 12,101 | 12,058 | 11,058 | ||||||||
Kerosine | 4,020 | 3,619 | 2,410 | 2,756 | 2,526 | 2,685 | 2,547 | ||||||||
Diesel and home heating oils | 14,785 | 11,803 | 14,910 | 14,649 | 13,506 | 14,574 | 11,798 | ||||||||
Residuals | 3,728 | 3,825 | 3,242 | 4,062 | 3,816 | 3,127 | 3,538 | ||||||||
LPG and other | 4,213 | 2,998 | 2,240 | 4,205 | 3,103 | 1,760 | 2,121 | ||||||||
| 41,102 | 34,670 | 35,541 | 37,107 | 35,052 | 34,204 | 31,062 | |||||||||
Total products sold | 457,770 | 385,271 | 358,255 | 338,908 | 264,928 | 210,631 | 205,318 | ||||||||
Branded retail outlets* | |||||||||||||||
North America – Murphy USA | 973 | 987 | 864 | 752 | 623 | 506 | 387 | ||||||||
Other | 153 | 177 | 337 | 375 | 371 | 408 | 428 | ||||||||
Total | 1,126 | 1,164 | 1,201 | 1,127 | 994 | 914 | 815 | ||||||||
United Kingdom | 389 | 402 | 412 | 358 | 384 | 416 | 411 | ||||||||
| * | At December 31. |
7
Board of Directors
| William C. Nolan, Jr. Partner, Nolan & Alderson, Attorneys, El Dorado, Arkansas. Director since 1977. Chairman of the Board and the Executive Committee, ex-officio member of all other committees |
| R. Madison Murphy Managing Member, Murphy Family Management, LLC, El Dorado, Arkansas. Director since 1993; Chairman from 1994–2002. Committees: Executive; Audit (Chairman) | |||
| Claiborne P. Deming President and Chief Executive Officer, Murphy Oil Corporation, El Dorado, Arkansas. Director since 1993. Committees: Executive |  | Ivar B. Ramberg Executive Officer, Ramberg Consulting AS, Osteraas, Norway. Director since 2003. Committees: Nominating and Governance; Public Policy and Environmental | |||
| Frank W. Blue Attorney, Santa Barbara, California. Director since 2003. Committees: Audit; Nominating and Governance |  | Neal E. Schmale President and Chief Operating Officer, Sempra Energy, San Diego, California. Director since 2004. Committees: Audit (Financial Expert); Executive Compensation | |||
| Robert A. Hermes Chairman of the Board, Retired, Purvin & Gertz, Inc., Houston, Texas. Director since 1999. Committees: Executive; Nominating and Governance (Chairman); Public Policy and Environmental |  | David J. H. Smith Chief Executive Officer, Retired, Whatman plc, Maidstone, Kent, England. Director since 2001. Committees: Executive Compensation (Chairman); Public Policy and Environmental | |||
| James V. Kelley President and Chief Operating Officer, BancorpSouth, Inc., Tupelo, Mississippi. Director since 2006. Committees: Audit; Executive Compensation |  | Caroline G. Theus President, Keller Enterprises, LLC, and President, Inglewood Land and Development Co., Alexandria, Louisiana. Director since 1985. Committees: Executive; Public Policy and Environmental (Chairman) | |||


8
PRINCIPAL SUBSIDIARIES
Murphy Exploration & Production Company Engages in worldwide crude oil and natural gas exploration and production. | 16290 Katy Freeway Suite 600 Houston, TX 77094 (281) 675-9000 | David M. Wood President
Roger W. Jenkins Senior Vice President, North America
Steven A. Cossé Vice President and General Counsel | Mindy K. West Vice President and Treasurer
John W. Eckart Vice President and Controller
Walter K. Compton Secretary | |||
Murphy Oil Company Ltd. Engages in crude oil and natural gas exploration and production, and extraction and sale of synthetic crude oil. | 1700-555-4th Avenue SW Calgary, Alberta T2P 3E7 (403) 294-8000
Mailing Address: P.O. Box 2721, Station M Calgary, Alberta T2P 3Y3 Canada | Steve C. Crosby President
W. Patrick Olson Vice President, Production | Mindy K. West Vice President and Treasurer
Heather J. Jones Controller
Georg R. McKay Secretary | |||
Murphy Oil USA, Inc. Engages in refining and marketing of petroleum products in the United States. | 200 Peach Street El Dorado, Arkansas 71730 (870) 862-6411
Mailing Address: P.O. Box 7000 El Dorado, Arkansas 71731-7000 | Harvey Doerr President
Charles A. Ganus Senior Vice President, Marketing and President, Murphy USA Marketing Company
Gary R. Bates Vice President, Supply and Transportation
Ernest C. Cagle Vice President, Manufacturing
John D. Edmunds Vice President, Engineering | Henry J. Heithaus Vice President, Retail Marketing
Steven A. Cossé Vice President and General Counsel
Mindy K. West Vice President and Treasurer
John W. Eckart Vice President and Controller
Walter K. Compton Secretary | |||
Murco Petroleum Limited Engages in refining and marketing of petroleum products in the United Kingdom. | 4 Beaconsfield Road St. Albans, Hertfordshire AL1 3RH, England 44-1727-892-400 | Stephen R. Wylie Managing Director
Jeremy Clarke Marketing Director
Thomas McKinlay Supply Director | Simon V. Rhodes Financial Director
Patricia E. Haylock Secretary | |||
Corporate Information
Corporate Office
200 Peach Street P.O. Box 7000 El Dorado, Arkansas 71731-7000 (870) 862-6411
Stock Exchange Listings
Trading Symbol: MUR New York Stock Exchange
Transfer Agent and Registrar
Computershare Investor Services, L.L.C. 2 North LaSalle St. Chicago, Illinois 60602 Toll-free (888) 239-5303 Local Chicago (312) 360-5303
Electronic Payment of Dividends
Shareholders may have dividends deposited directly into their bank accounts by electronic funds transfer. Authorization forms may be obtained from:
Computershare Investor Services, L.L.C. 2 North LaSalle St. Chicago, Illinois 60602 Toll-free (888) 239-5303 Local Chicago (312) 360-5303 | Annual Meeting
The annual meeting of the Company’s shareholders will be held at 10:00 a.m. on May 14, 2008, at the South Arkansas Arts Center, 110 East 5th Street, El Dorado, Arkansas. A formal notice of the meeting, together with a proxy statement and proxy form, will be provided to all shareholders.
E-mail Address
murphyoil@murphyoilcorp.com
www.murphyoilcorp.com
Murphy Oil’s website provides frequently updated information about the Company and its operations, including:
• News releases
• Annual report
• Quarterly reports
• Live webcasts of quarterly conference calls
• Links to the Company’s SEC filings
• Stock quotes
• Profiles of the Company’s operations
• On-line stock investment accounts
• Murphy USA station locator | Inquiries
Inquiries regarding shareholder account matters should be addressed to:
Walter K. Compton Secretary Murphy Oil Corporation P.O. Box 7000 El Dorado, Arkansas 71731-7000
Members of the financial community should direct their inquiries to:
Dory J. Stiles Manager of Investor Relations Murphy Oil Corporation P.O. Box 7000 El Dorado, Arkansas 71731-7000 (870) 864-6496
Certifications
The Company has filed the required certifications under Section 302 of the Sarbanes-Oxley Act of 2002 regarding the quality of our public disclosures as Exhibits 31.1 and 31.2 to our annual report on Form 10-K for the fiscal year ended December 31, 2007. In 2007 after our annual meeting of stockholders, the Company filed with the New York Stock Exchange the CEO certification regarding its compliance with the NYSE corporate governance listing standards as required by NYSE Rule 303A.12(a). |
Executive Officers
Claiborne P. Deming
President and Chief Executive Officer since October 1994 and Director and Member of the Executive Committee since 1993.
Steven A. Cossé
Executive Vice President since February 2005 and General Counsel since August 1991. Mr. Cossé was elected Senior Vice President in 1994 and Vice President in 1993.
Harvey Doerr
Executive Vice President and President of Murphy Oil USA, Inc. since January 2007. Mr. Doerr served as President of Murphy Oil Company Ltd. from September 1997 through December 2006. | David M. Wood
Executive Vice President and President of Murphy Exploration & Production Company since January 2007. Mr. Wood served as President of Murphy Exploration & Production Company-International from March 2003 through December 2006 and was Senior Vice President of Frontier Exploration & Production from April 1999 through February 2003.
Kevin G. Fitzgerald
Senior Vice President and Chief Financial Officer since January 2007. Mr. Fitzgerald was Treasurer from July 2001 through December 2006 and Director of Investor Relations from 1996 through June 2001. | Bill H. Stobaugh
Senior Vice President since February 2005. Mr. Stobaugh joined the Company as Vice President in 1995.
Mindy K. West
Vice President and Treasurer since January 2007. Ms. West was Director of Investor Relations from July 2001 through December 2006.
John W. Eckart
Vice President and Controller since January 2007. Mr. Eckart has been Controller since March 2000.
Walter K. Compton
Secretary since December 1996. |