Exhibit 13
Financial and Operating Highlights
| | | 000,000,00 | | | | 000,000,00 | | | | 000,000,00 | | | | 000,000,00 | | | | 000,000,00 | |
| | | | | | | | | % Change | | | | | | % Change | |
(Thousands of dollars except per share data) | | 2011 | | | 2010 | | | 2011–2010 | | | 2009 | | | 2010–2009 | |
For the Year | | | | | | | | | | | | | | | | | | | | |
Revenues | | $ | 27,745,549 | | | $ | 20,169,718 | | | | 38 | % | | $ | 16,895,206 | | | | 19 | % |
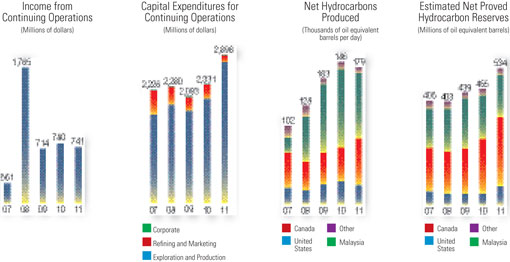
Income from continuing operations | | | 740,932 | | | | 779,559 | | | | -5 | % | | | 713,854 | | | | 9 | % |
Net income | | | 872,702 | | | | 798,081 | | | | 9 | % | | | 837,621 | | | | -5 | % |
Cash dividends paid | | | 212,752 | | | | 201,405 | | | | 6 | % | | | 190,788 | | | | 6 | % |
Capital expenditures | | | 2,943,812 | | | | 2,448,140 | | | | 20 | % | | | 2,207,269 | | | | 11 | % |
Net cash provided by operating activities | | | 2,145,385 | | | | 3,128,558 | | | | -31 | % | | | 1,864,633 | | | | 68 | % |
Average common shares outstanding – diluted (thousands) | | | 194,512 | | | | 193,158 | | | | 1 | % | | | 192,468 | | | | 0 | % |
| | | | | |
At End of Year | | | | | | | | | | | | | | | | | | | | |
Working capital | | $ | 622,743 | | | $ | 619,783 | | | | 0 | % | | $ | 1,194,087 | | | | -48 | % |
Net property, plant and equipment | | | 10,475,149 | | | | 10,367,847 | | | | 1 | % | | | 9,065,088 | | | | 14 | % |
Total assets | | | 14,138,138 | | | | 14,233,243 | | | | -1 | % | | | 12,756,359 | | | | 12 | % |
Long-term debt | | | 249,553 | | | | 939,350 | | | | -73 | % | | | 1,353,183 | | | | -31 | % |
Stockholders’ equity | | | 8,778,397 | �� | | | 8,199,550 | | | | 7 | % | | | 7,346,026 | | | | 12 | % |
| | | | | |
Per Share of Common Stock | | | | | | | | | | | | | | | | | | | | |
Income from continuing operations – diluted | | $ | 3.81 | | | $ | 4.03 | | | | -5 | % | | $ | 3.71 | | | | 9 | % |
Net income – diluted | | | 4.49 | | | | 4.13 | | | | 9 | % | | | 4.35 | | | | -5 | % |
Cash dividends paid | | | 1.10 | | | | 1.05 | | | | 5 | % | | | 1.00 | | | | 5 | % |
Stockholders’ equity | | | 45.31 | | | | 42.52 | | | | 7 | % | | | 38.44 | | | | 11 | % |
| | | | | |
Net Crude Oil and Gas Liquids Produced – barrels per day | | | 103,160 | | | | 126,927 | | | | -19 | % | | | 131,839 | | | | -4 | % |
United States | | | 17,148 | | | | 20,114 | | | | -15 | % | | | 17,053 | | | | 18 | % |
Canada | | | 30,049 | | | | 30,801 | | | | -2 | % | | | 32,043 | | | | -4 | % |
Malaysia | | | 48,551 | | | | 66,897 | | | | -27 | % | | | 76,322 | | | | -12 | % |
Other International | | | 7,412 | | | | 9,115 | | | | -19 | % | | | 6,421 | | | | 42 | % |
| | | | | |
Net Natural Gas Sold – thousands of cubic feet per day | | | 457,365 | | | | 356,801 | | | | 28 | % | | | 187,266 | | | | 91 | % |
United States | | | 47,212 | | | | 53,037 | | | | -11 | % | | | 54,255 | | | | -2 | % |
Canada | | | 188,787 | | | | 85,563 | | | | 121 | % | | | 54,857 | | | | 56 | % |
Malaysia | | | 217,440 | | | | 212,692 | | | | 2 | % | | | 74,653 | | | | 185 | % |
United Kingdom | | | 3,926 | | | | 5,509 | | | | -29 | % | | | 3,501 | | | | 57 | % |
| | | | | |
Petroleum Products Sold – barrels per day | | | 556,434 | | | | 536,757 | | | | 4 | % | | | 536,474 | | | | 0 | % |
United States | | | 420,737 | | | | 450,100 | | | | -7 | % | | | 432,700 | | | | 4 | % |
United Kingdom | | | 135,697 | | | | 86,657 | | | | 57 | % | | | 103,774 | | | | -16 | % |
| | | | | |
Stockholder and Employee Data at December 31 | | | | | | | | | | | | | | | | | | | | |
Common shares outstanding (thousands) | | | 193,723 | | | | 192,836 | | | | 0 | % | | | 191,115 | | | | 1 | % |
Number of stockholders of record | | | 2,212 | | | | 2,363 | | | | -6 | % | | | 2,490 | | | | -5 | % |
Number of employees | | | 8,610 | | | | 8,994 | | | | -4 | % | | | 8,369 | | | | 7 | % |
Average number of employees for year | | | 8,906 | | | | 8,673 | | | | 3 | % | | | 8,157 | | | | 6 | % |
Murphy Oil at a Glance
Murphy Oil Corporation (“Murphy” or “the Company”) is an international oil and gas company that conducts business through various operating subsidiaries. The Company produces oil and/or natural gas in the United States, Canada, Malaysia, the United Kingdom and Republic of the Congo and conducts exploration activities worldwide. Murphy also has an interest in a Canadian synthetic oil operation. The Company operates a growing retail marketing gasoline station chain on the parking lots of Walmart Supercenters and at stand-alone locations in the United States, and also markets petroleum products under various brand names and to unbranded wholesale customers in the United States. Additionally, the Company owns two ethanol production facilities in the United States. The Company owns a petroleum refinery and markets petroleum products in the United Kingdom. The Company has announced its intention to sell its U.K. refining and marketing assets. Murphy is headquartered in El Dorado, Arkansas, and has over 8,500 employees worldwide. The Company’s common stock is traded on the New York Stock Exchange under the ticker symbol “MUR”.
Major Subsidiaries of Murphy Oil Corporation
Murphy Exploration & Production Company, through various operating subsidiaries and affiliates, is engaged in crude oil and natural gas production activities in the United States, Malaysia, the U.K. sector of the North Sea and Republic of the Congo, and explores for oil and natural gas worldwide. The subsidiary has its headquarters in Houston, Texas, and conducts business from offices in Kuala Lumpur, Malaysia; St. Albans, England; Pointe-Noire, Republic of the Congo; Singapore; Jakarta, Indonesia; Perth, Western Australia; and Erbil, in the Kurdistan region of Iraq.
Murphy Oil Company Ltd. is engaged in crude oil and natural gas exploration and production in Western Canada and offshore Eastern Canada as well as the extraction and sale of synthetic crude oil from oil sands. The subsidiary’s office is located in Calgary, Alberta, and is operated as a component of the Company’s worldwide exploration and production operation directed from Houston.
Murphy Oil USA, Inc. is engaged in retail and wholesale marketing of petroleum products in the United States. It is headquartered in El Dorado, Arkansas. High-volume and low-cost Murphy USA® branded gasoline stations located on-site at Walmart Supercenters and at stand-alone Murphy Express locations provide fuel and merchandise to retail customers in 23 states, primarily in the Southern and Midwestern U.S. Murphy Oil USA also operates a network of six Company-owned terminals that, along with a number of third-party terminals, supply fuel to a retail network and wholesale customers in 23 states. Ethanol production facilities in Hankinson, North Dakota, and Hereford, Texas, produce about one-third of ethanol blended into gasoline sold by the Company.
Murco Petroleum Limited is engaged in refining and marketing of petroleum products in the United Kingdom. Headquartered at St. Albans, England, Murco owns a refinery in Milford Haven, Wales, and operates a network of fueling stations in the United Kingdom. The Company has announced its intention to sell these U.K. operations.
| | | | |
Offices | | | | |
| | |
El Dorado, Arkansas | | St. Albans, Hertfordshire, England | | Jakarta, Indonesia |
| | |
Houston, Texas | | Pointe-Noire, Republic of the Congo | | Perth, Western Australia, Australia |
| | |
Calgary, Alberta, Canada | | Singapore | | Erbil, Kurdistan, Iraq |
| | |
Kuala Lumpur, Malaysia | | | | |
1
Dear Fellow Shareholders
| | |
| Two thousand eleven saw continuation of an overall sluggish global economy with Euro zone sovereign debt issues, a Standard & Poor’s downgrade of U.S. government debt and a tragic natural disaster in Japan all adding further drag to any sign of economic recovery. However, oil markets saw some strength on the back of Asian demand and shut-in of Libyan production. The global benchmark crude, Dated Brent, ranged between $95 and $115 per barrel for much of the year and showed strength above U.S. West Texas Intermediate crude that was partially landlocked and in oversupply. This differential, that at times was close to $30 per barrel, closed near year-end 2011 to a more normal $10 as pipeline constraints were being worked. We sold our two U.S. refineries just as this price advantage waned. | |  |
While our international natural gas production benefited from strong liquified natural gas market pricing, gas prices in North America continued to fall throughout 2011 and recently dropped below $3 per million British Thermal Units as warm winter temperatures further challenged the current oversupply picture. Absent increased demand or new export opportunities, I expect North American natural gas prices to be under continued pressure for the midterm. We are fortunate to have the opportunity and flexibility to react quickly and redirect spending away from dry gas investments in North America. | |
Our diverse, oil-weighted global portfolio, complemented by our North American resource position, provides the basis for strength and growth across our upstream business. We are almost two years removed from the unfortunate and tragic events of the Macondo incident in the Gulf of Mexico (GOM) and, while the pace of play has improved, new permits require higher levels of manpower and much more time to complete. That coupled with fewer rigs makes for a much slower, and for us a smaller, business. Over that same time frame, our onshore business has picked up the slack and is on a rapidly growing trajectory.
Last year we established the framework and began executing on our strategy to reposition the company. As mentioned, we closed on the sale of the two U.S. refineries at the end of the third quarter and are now focused on the disposition of the U.K. refinery at Milford Haven, Wales. We are also evaluating the potential to separate our retail business and to unlock its value, which we believe is unrealized within the current corporate structure.
Net income for 2011 totaled $873 million ($4.49 per share), up slightly from 2010 as contributions from Refining and Marketing, including discontinued operations, offset lower Upstream results. The lower net income in our exploration and production segment was primarily due to an impairment charge taken at our Azurite field, offshore Republic of the Congo. Our balance sheet remains strong as we ended the year with a long-term debt-to-capital-employed ratio of 2.8%, providing ample capacity to act on value-added opportunities.
2
Exploration and Production
Annual production for 2011 averaged 179,400 barrels of oil equivalent per day with a weighting of 58% to oil and 16% to oil-indexed natural gas. We were more negatively impacted by lower production from the Kikeh field in Malaysia due to a sand/fines migration issue in some wells, lower Azurite production in Republic of the Congo and less than budgeted wells drilled in the GOM due to lack of permits than we were by positive results in the Eagle Ford Shale (EFS) area in south Texas and Tupper West in British Columbia.
In 2012, we should see good year-on-year production growth with accelerated development at EFS and the Seal heavy oil project in northern Alberta, complemented by stabilized production from Kikeh following the successfully completed remediation program at the end of last year.
Activity in our North American resource program ramped up further in 2011. This oil-weighted resource program now extends over 800,000 net acres with entry into a fifth play. We reorganized our North American resource business as a single unit to bring expertise and complementary disciplines from our successful Montney development program in Canada to the fast growing business in the EFS. Heavy oil production growth at the Seal project is moving forward at an accelerated pace. We are focused at Seal on additional development drilling, down spacing opportunities, multi-leg laterals and advancing our Enhanced Oil Recovery projects related to polymer flooding and thermal stimulation as we look to unlock the large resource in place there. In the southern Alberta Bakken play, we are in the very early stages of evaluating the productive capability of our acreage having drilled six appraisal wells in the play, with the most recent showing encouragement.
In addition to our North American onshore activity, in 2011 we sanctioned seven development projects that will be important growth components starting in 2013. These oil developments include Patricia, Serendah, South Acis, Permas and Endau in the Sarawak blocks and Siakap North in Block K, all in Malaysia, and the Schiehallion field re-development project in the U.K. North Sea.
3
Activity levels and results from our global exploration program were disappointing in 2011. We only drilled four wildcat wells testing targets in Suriname, Indonesia and Brunei. The process of lining up rigs and finalizing well schedules pushed some activity into this year, so I expect the 2012 program will return to a more normal pace of testing 12 to 15 prospects. The year is off to a good start with a gas discovery in Block H, offshore Sabah Malaysia, in close proximity to the Rotan gas discovery, which is being evaluated for Floating LNG development. Impactful prospects will be drilled in the Kurdistan region of Iraq, Republic of the Congo and Australia during the year.
Refining and Marketing
Consistent with our strategy to exit the refining business, we are now progressing on the divestiture of the Milford Haven refinery in Wales.
The Downstream business had a very solid year turning in net income of $190 million, excluding discontinued operations, with the U.S. Retail business contributing the second highest net income in its history. Build out of our chain continued with the addition of 29 stations, bringing the total number of retail outlets to 1,128 at year-end. Our U.S. retail chain broadened its partnership with Wal-Mart and participated in the “10 cents per gallon Rollback” program on gasoline prices from June through December. Longer term we are excited about the opportunity to expand both within and outside our current footprint with Wal-Mart.
In Renewable Energy, we completed the construction and upgrades to the Hereford, Texas ethanol plant, which started up at the end of March, on schedule and within budget. Start-up and commissioning went well and the plant has ramped up to its nameplate capacity of 105 million gallons per year. Operations at our Hankinson, North Dakota ethanol plant continue to be steady in the 120 million gallon per year range. These two plants have now been fully integrated into our U.S. marketing business.
In Closing
The repositioning of our Company remains on track with the sale of the two U.S. refineries and attention shifting to divestiture of the U.K. refinery. Recognizing the value of our retail business is also in focus. The Upstream growth plan is in place with the sanction of key projects in Malaysia and accelerated development of our oil-weighted North American resource portfolio. We will maintain an active and impactful exploration program this year and continue to renew and replenish our prospect inventory. Our plans are set and the team is in place to deliver on these growth initiatives.
Your support over the past year has been greatly appreciated and together we can look forward to a Company better positioned for a bright future.

David M. Wood
President and Chief Executive Officer
February 10, 2012
El Dorado, Arkansas
4
Exploration and Production Statistical Summary
| | | | | | | | | | | | | | | | | | | | | | | | | | | | |
| | | 2011 | | | 2010 | | | 2009 | | | 2008 | | | 2007 | | | 2006 | | | 2005 | |
Net crude oil, condensate and natural gas liquids production – barrels per day | | | | | | | | | | | | | | | | | | | | | | | | | | | | |
United States | | | 17,148 | | | | 20,114 | | | | 17,053 | | | | 10,668 | | | | 12,989 | | | | 21,112 | | | | 25,897 | |
Canada – light | | | 83 | | | | 43 | | | | 18 | | | | 46 | | | | 596 | | | | 443 | | | | 563 | |
heavy | | | 7,264 | | | | 5,988 | | | | 6,813 | | | | 8,484 | | | | 11,524 | | | | 12,613 | | | | 11,806 | |
offshore | | | 9,204 | | | | 11,497 | | | | 12,357 | | | | 16,826 | | | | 18,871 | | | | 14,896 | | | | 23,124 | |
synthetic | | | 13,498 | | | | 13,273 | | | | 12,855 | | | | 12,546 | | | | 12,948 | | | | 11,701 | | | | 10,593 | |
Malaysia | | | 48,551 | | | | 66,897 | | | | 76,322 | | | | 57,403 | | | | 20,367 | | | | 11,298 | | | | 13,503 | |
United Kingdom | | | 2,423 | | | | 3,295 | | | | 3,361 | | | | 4,869 | | | | 5,281 | | | | 7,146 | | | | 7,992 | |
Republic of the Congo | | | 4,989 | | | | 5,820 | | | | 1,743 | | | | — | | | | — | | | | — | | | | — | |
| | | | | | | | | | | | | | | | | | | | | | | | | | | | |
Continuing operations | | | 103,160 | | | | 126,927 | | | | 130,522 | | | | 110,842 | | | | 82,576 | | | | 79,209 | | | | 93,478 | |
Discontinued operations | | | — | | | | — | | | | 1,317 | | | | 7,412 | | | | 8,946 | | | | 8,608 | | | | 7,871 | |
| | | | | | | | | | | | | | | | | | | | | | | | | | | | |
Total liquids produced | | | 103,160 | | | | 126,927 | | | | 131,839 | | | | 118,254 | | | | 91,522 | | | | 87,817 | | | | 101,349 | |
| | | | | | | | | | | | | | | | | | | | | | | | | | | | |
Net crude oil, condensate and natural gas liquids sold – barrels per day | | | | | | | | | | | | | | | | | | | | | | | | | | | | |
United States | | | 17,148 | | | | 20,114 | | | | 17,053 | | | | 10,668 | | | | 12,989 | | | | 21,112 | | | | 25,897 | |
Canada – light | | | 83 | | | | 43 | | | | 18 | | | | 46 | | | | 596 | | | | 443 | | | | 563 | |
heavy | | | 7,264 | | | | 5,988 | | | | 6,813 | | | | 8,484 | | | | 11,524 | | | | 12,613 | | | | 11,806 | |
offshore | | | 9,079 | | | | 11,343 | | | | 12,455 | | | | 16,690 | | | | 18,839 | | | | 15,360 | | | | 22,443 | |
synthetic | | | 13,498 | | | | 13,273 | | | | 12,855 | | | | 12,546 | | | | 12,948 | | | | 11,701 | | | | 10,593 | |
Malaysia | | | 48,092 | | | | 68,975 | | | | 72,575 | | | | 61,907 | | | | 16,018 | | | | 11,986 | | | | 13,818 | |
United Kingdom | | | 2,299 | | | | 4,177 | | | | 2,445 | | | | 5,739 | | | | 5,218 | | | | 6,678 | | | | 8,303 | |
Republic of the Congo | | | 3,959 | | | | 5,428 | | | | 973 | | | | — | | | | — | | | | — | | | | — | |
| | | | | | | | | | | | | | | | | | | | | | | | | | | | |
Continuing operations | | | 101,422 | | | | 129,341 | | | | 125,187 | | | | 116,080 | | | | 78,132 | | | | 79,893 | | | | 93,423 | |
Discontinued operations | | | — | | | | — | | | | 1,162 | | | | 7,774 | | | | 9,470 | | | | 10,349 | | | | 9,821 | |
| | | | | | | | | | | | | | | | | | | | | | | | | | | | |
Total liquids sold | | | 101,422 | | | | 129,341 | | | | 126,349 | | | | 123,854 | | | | 87,602 | | | | 90,242 | | | | 103,244 | |
| | | | | | | | | | | | | | | | | | | | | | | | | | | | |
Net natural gas sold – thousands of cubic feet per day | | | | | | | | | | | | | | | | | | | | | | | | | | | | |
United States | | | 47,212 | | | | 53,037 | | | | 54,255 | | | | 45,785 | | | | 45,139 | | | | 56,810 | | | | 70,452 | |
Canada | | | 188,787 | | | | 85,563 | | | | 54,857 | | | | 1,910 | | | | 9,922 | | | | 9,752 | | | | 10,323 | |
Malaysia – Sarawak | | | 176,943 | | | | 154,535 | | | | 28,070 | | | | — | | | | — | | | | — | | | | — | |
– Kikeh | | | 40,497 | | | | 58,157 | | | | 46,583 | | | | 1,399 | | | | — | | | | — | | | | — | |
United Kingdom | | | 3,926 | | | | 5,509 | | | | 3,501 | | | | 6,424 | | | | 6,021 | | | | 8,700 | | | | 9,423 | |
| | | | | | | | | | | | | | | | | | | | | | | | | | | | |
Total natural gas sold | | | 457,365 | | | | 356,801 | | | | 187,266 | | | | 55,518 | | | | 61,082 | | | | 75,262 | | | | 90,198 | |
| | | | | | | | | | | | | | | | | | | | | | | | | | | | |
Net hydrocarbons produced – equivalent barrels1per day | | | 179,388 | | | | 186,394 | | | | 163,050 | | | | 127,507 | | | | 101,702 | | | | 100,361 | | | | 116,382 | |
Estimated net hydrocarbon reserves – million equivalent barrels1,2 | | | 534.1 | | | | 455.2 | | | | 439.2 | | | | 402.8 | | | | 405.1 | | | | 388.3 | | | | 353.6 | |
| | | | | | | | | | | | | | | | | | | | | | | | | | | | |
Weighted average sales prices3 | | | | | | | | | | | | | | | | | | | | | | | | | | | | |
Crude oil, condensate and natural gas liquids –dollars per barrel | | | | | | | | | | | | | | | | | | | | | | | | | | | | |
United States | | $ | 103.92 | | | | 76.31 | | | | 60.08 | | | | 95.74 | | | | 65.57 | | | | 57.30 | | | | 47.48 | |
Canada4– light | | | 94.28 | | | | 75.48 | | | | 64.24 | | | | 70.37 | | | | 50.98 | | | | 50.45 | | | | 44.27 | |
heavy | | | 57.00 | | | | 49.89 | | | | 40.45 | | | | 59.05 | | | | 32.84 | | | | 25.87 | | | | 21.30 | |
offshore | | | 110.02 | | | | 76.87 | | | | 58.19 | | | | 96.69 | | | | 69.83 | | | | 62.55 | | | | 51.37 | |
synthetic | | | 102.94 | | | | 77.90 | | | | 61.49 | | | | 100.10 | | | | 74.35 | | | | 63.23 | | | | 58.12 | |
Malaysia5 | | | 90.14 | | | | 60.97 | | | | 55.51 | | | | 87.83 | | | | 74.58 | | | | 51.78 | | | | 46.16 | |
United Kingdom | | | 110.13 | | | | 77.95 | | | | 61.31 | | | | 90.16 | | | | 68.38 | | | | 64.30 | | | | 52.83 | |
Republic of the Congo5 | | | 103.02 | | | | 74.87 | | | | 69.04 | | | | — | | | | — | | | | — | | | | — | |
Natural gas – dollars per thousand cubic feet | | | | | | | | | | | | | | | | | | | | | | | | | | | | |
United States | | | 4.13 | | | | 4.52 | | | | 4.05 | | | | 9.67 | | | | 7.38 | | | | 7.76 | | | | 8.52 | |
Canada4 | | | 4.07 | | | | 4.23 | | | | 3.09 | | | | 6.40 | | | | 6.34 | | | | 6.49 | | | | 7.88 | |
Malaysia – Sarawak | | | 7.10 | | | | 5.31 | | | | 4.05 | | | | — | | | | — | | | | — | | | | — | |
– Kikeh | | | 0.24 | | | | 0.23 | | | | 0.23 | | | | 0.23 | | | | — | | | | — | | | | — | |
United Kingdom4 | | | 9.99 | | | | 7.01 | | | | 5.04 | | | | 10.98 | | | | 7.54 | | | | 7.34 | | | | 5.80 | |
| 1 | Natural gas converted at a 6:1 ratio. |
| 3 | Includes intracompany transfers at market prices. |
| 4 | U.S. dollar equivalent. |
| 5 | Prices are net of payments under the terms of the respective production sharing contracts. |
5
Refining and Marketing Statistical Summary
| | | | | | | | | | | | | | | | | | | | | | | | | | | | |
| | | 2011 | | | 2010 | | | 2009 | | | 2008 | | | 2007 | | | 2006 | | | 2005 | |
Branded retail outlets at December 31 | | | | | | | | | | | | | | | | | | | | | | | | | | | | |
United States – Murphy USA® | | | 1,003 | | | | 1,001 | | | | 996 | | | | 992 | | | | 971 | | | | 987 | | | | 864 | |
Murphy Express® | | | 125 | | | | 98 | | | | 52 | | | | 33 | | | | 2 | | | | — | | | | — | |
Other | | | — | | | | 116 | | | | 121 | | | | 129 | | | | 153 | | | | 177 | | | | 337 | |
Total United States | | | 1,128 | | | | 1,215 | | | | 1,169 | | | | 1,154 | | | | 1,126 | | | | 1,164 | | | | 1,201 | |
United Kingdom | | | 459 | | | | 451 | | | | 453 | | | | 454 | | | | 389 | | | | 402 | | | | 412 | |
| | | | | | | | | | | | | | | | | | | | | | | | | | | | |
United States retail marketing: | | | | | | | | | | | | | | | | | | | | | | | | | | | | |
Fuel margin per gallon1 | | $ | 0.156 | | | | 0.114 | | | | 0.083 | | | | 0.165 | | | | 0.103 | | | | 0.104 | | | | 0.115 | |
Gallons sold per store month | | | 277,715 | | | | 306,646 | | | | 312,493 | | | | 324,223 | | | | 294,784 | | | | 285,665 | | | | 268,277 | |
Merchandise sales revenue per store month | | $ | 158,144 | | | | 153,530 | | | | 137,623 | | | | 110,943 | | | | 97,523 | | | | 80,598 | | | | 66,516 | |
Merchandise margin as a percentage of merchandise sales | | | 12.8 | % | | | 13.1 | % | | | 12.5 | % | | | 13.5 | % | | | 13.2 | % | | | 13.3 | % | | | 12.8 | % |
Unit margins per barrel: | | | | | | | | | | | | | | | | | | | | | | | | | | | | |
United States refining2– Discontinued operations | | $ | 3.45 | | | | 0.23 | | | | 0.75 | | | | (1.48 | ) | | | 5.11 | | | | (0.24 | ) | | | 1.02 | |
United Kingdom refining and marketing | | | (0.67 | ) | | | (1.47 | ) | | | (0.28 | ) | | | 3.41 | | | | (1.48 | ) | | | 4.43 | | | | 4.81 | |
| | | | | | | | | | | | | | | | | | | | | | | | | | | | |
Petroleum products sold – barrels per day | | | | | | | | | | | | | | | | | | | | | | | | | | | | |
United States – Gasoline | | | 312,945 | | | | 333,182 | | | | 319,549 | | | | 313,827 | | | | 298,833 | | | | 266,353 | | | | 233,191 | |
Kerosine | | | 11,864 | | | | 11,449 | | | | 11,928 | | | | 4,606 | | | | 1,685 | | | | 2,269 | | | | 5,671 | |
Diesel and home heating oils | | | 74,410 | | | | 77,799 | | | | 76,599 | | | | 86,933 | | | | 91,344 | | | | 62,196 | | | | 60,228 | |
Residuals | | | 12,618 | | | | 18,015 | | | | 15,501 | | | | 14,837 | | | | 15,422 | | | | 11,696 | | | | 15,330 | |
Asphalt, LPG and other | | | 8,900 | | | | 9,655 | | | | 9,123 | | | | 7,287 | | | | 9,384 | | | | 8,087 | | | | 8,294 | |
| | | | | | | | | | | | | | | | | | | | | | | | | | | | |
Total United States | | | 420,737 | | | | 450,100 | | | | 432,700 | | | | 427,490 | | | | 416,668 | | | | 350,601 | | | | 322,714 | |
| | | | | | | | | | | | | | | | | | | | | | | | | | | | |
United Kingdom – Gasoline | | | 35,757 | | | | 23,085 | | | | 30,007 | | | | 34,125 | | | | 14,356 | | | | 12,425 | | | | 12,739 | |
Kerosine | | | 16,298 | | | | 11,387 | | | | 12,954 | | | | 14,835 | | | | 4,020 | | | | 3,619 | | | | 2,410 | |
Diesel and home heating oils | | | 48,893 | | | | 29,710 | | | | 35,721 | | | | 34,560 | | | | 14,785 | | | | 11,803 | | | | 14,910 | |
Residuals | | | 14,427 | | | | 7,885 | | | | 10,560 | | | | 12,744 | | | | 3,728 | | | | 3,825 | | | | 3,242 | |
LPG and other | | | 20,322 | | | | 14,590 | | | | 14,532 | | | | 15,246 | | | | 4,213 | | | | 2,998 | | | | 2,240 | |
| | | | | | | | | | | | | | | | | | | | | | | | | | | | |
Total United Kingdom | | | 135,697 | | | | 86,657 | | | | 103,774 | | | | 111,510 | | | | 41,102 | | | | 34,670 | | | | 35,541 | |
| | | | | | | | | | | | | | | | | | | | | | | | | | | | |
Total petroleum products sold | | | 556,434 | | | | 536,757 | | | | 536,474 | | | | 539,000 | | | | 457,770 | | | | 385,271 | | | | 358,255 | |
| | | | | | | | | | | | | | | | | | | | | | | | | | | | |
Crude capacity of refineries at December 31 – barrels per stream day | | | 135,000 | | | | 295,000 | | | | 268,000 | | | | 268,000 | | | | 268,000 | | | | 192,400 | | | | 192,400 | |
Refinery inputs – barrels per day | | | | | | | | | | | | | | | | | | | | | | | | | | | | |
Crude – Meraux, Louisiana – Discontinued operations | | | 100,163 | | | | 106,482 | | | | 101,864 | | | | 95,126 | | | | 106,446 | | | | 55,129 | | | | 73,371 | |
Superior, Wisconsin – Discontinued operations | | | 26,483 | | | | 34,541 | | | | 32,158 | | | | 26,580 | | | | 32,737 | | | | 34,066 | | | | 34,768 | |
Milford Haven, Wales | | | 131,959 | | | | 78,841 | | | | 96,625 | | | | 97,521 | | | | 36,000 | | | | 30,036 | | | | 26,983 | |
Other feedstocks | | | 6,456 | | | | 11,518 | | | | 14,317 | | | | 23,300 | | | | 10,805 | | | | 6,423 | | | | 9,131 | |
| | | | | | | | | | | | | | | | | | | | | | | | | | | | |
Total refinery inputs | | | 265,061 | | | | 231,382 | | | | 244,964 | | | | 242,527 | | | | 185,988 | | | | 125,654 | | | | 144,253 | |
| | | | | | | | | | | | | | | | | | | | | | | | | | | | |
Refinery yields – barrels per day | | | | | | | | | | | | | | | | | | | | | | | | | | | | |
United States – Gasoline | | | 51,950 | | | | 61,128 | | | | 62,534 | | | | 54,020 | | | | 61,998 | | | | 37,690 | | | | 45,287 | |
Kerosine | | | 11,172 | | | | 11,068 | | | | 10,670 | | | | 8,759 | | | | 871 | | | | 812 | | | | 5,001 | |
Diesel and home heating oils | | | 37,723 | | | | 41,305 | | | | 40,761 | | | | 41,658 | | | | 52,893 | | | | 30,829 | | | | 34,561 | |
Residuals | | | 12,736 | | | | 18,082 | | | | 15,786 | | | | 14,585 | | | | 15,269 | | | | 11,414 | | | | 15,019 | |
Asphalt, LPG and other | | | 14,842 | | | | 14,802 | | | | 10,845 | | | | 9,065 | | | | 13,202 | | | | 9,893 | | | | 10,406 | |
Fuel and loss | | | 1,247 | | | | 834 | | | | 1,409 | | | | 1,852 | | | | 1,999 | | | | 1,260 | | | | 722 | |
| | | | | | | | | | | | | | | | | | | | | | | | | | | | |
Total United States – Discontinued operations | | | 129,670 | | | | 147,219 | | | | 142,005 | | | | 129,939 | | | | 146,232 | | | | 91,898 | | | | 110,996 | |
| | | | | | | | | | | | | | | | | | | | | | | | | | | | |
United Kingdom – Gasoline | | | 34,171 | | | | 20,889 | | | | 26,902 | | | | 32,290 | | | | 12,397 | | | | 10,624 | | | | 9,582 | |
Kerosine | | | 17,038 | | | | 11,374 | | | | 13,789 | | | | 15,065 | | | | 4,500 | | | | 4,255 | | | | 2,804 | |
Diesel and home heating oils | | | 47,418 | | | | 25,995 | | | | 34,619 | | | | 33,868 | | | | 14,218 | | | | 11,308 | | | | 13,974 | |
Residuals | | | 14,185 | | | | 8,296 | | | | 10,388 | | | | 12,585 | | | | 3,641 | | | | 3,830 | | | | 3,212 | |
Asphalt, LPG and other | | | 19,448 | | | | 14,799 | | | | 13,735 | | | | 15,750 | | | | 4,344 | | | | 2,962 | | | | 2,862 | |
Fuel and loss | | | 3,131 | | | | 2,810 | | | | 3,526 | | | | 3,030 | | | | 656 | | | | 777 | | | | 823 | |
| | | | | | | | | | | | | | | | | | | | | | | | | | | | |
Total United Kingdom | | | 135,391 | | | | 84,163 | | | | 102,959 | | | | 112,588 | | | | 39,756 | | | | 33,756 | | | | 33,257 | |
| | | | | | | | | | | | | | | | | | | | | | | | | | | | |
Total refinery yields | | | 265,061 | | | | 231,382 | | | | 244,964 | | | | 242,527 | | | | 185,988 | | | | 125,654 | | | | 144,253 | |
| | | | | | | | | | | | | | | | | | | | | | | | | | | | |
| 1 | Represents net sales prices for fuel less purchased cost of fuel. |
| 2 | Represents refinery sales realizations less cost of crude and other feedstocks and refinery operating and depreciation expenses. |
6
Board of Directors
| | | | | | |
 | | William C. Nolan, Jr. Partner, Nolan & Alderson, Attorneys, El Dorado, Arkansas. Director since 1977. Chairman of the Board until May 2012, ex-officio member of all other committees | |  | | James V. Kelley President and Chief Operating Officer, BancorpSouth, Inc., Tupelo, Mississippi. Director since 2006. Committees: Audit; Executive Compensation |
| | | |
 | | Claiborne P. Deming President and Chief Executive Officer, Retired, Murphy Oil Corporation, El Dorado, Arkansas. Director since 1993. Chairman of the Board beginning in May 2012. Committees: Executive (Chairman); Environmental, Health & Safety | |  | | Walentin (Val) Mirosh President, Mircan Resources, Inc., Calgary, Alberta, Canada. Director since 2011. Committees: Executive Compensation |
| | | |
 | | David M. Wood President and Chief Executive Officer, Murphy Oil Corporation, El Dorado, Arkansas. Director since January 2009. Committees: Executive | |  | | R. Madison Murphy Managing Member, Murphy Family Management, LLC, El Dorado, Arkansas. Director since 1993. Chairman from 1994–2002. Committees: Executive; Audit (Chairman) |
| | | |
 | | Frank W. Blue International Legal Advisor/Arbitrator, Santa Barbara, California. Director since 2003. Committees: Audit; Nominating & Governance | |  | | Neal E. Schmale President and Chief Operating Officer, Retired, Sempra Energy, San Diego, California. Director since 2004. Committees: Audit; Executive Compensation |
| | | |
 | | Steven A. Cossé Executive Vice President and General Counsel, Retired, Murphy Oil Corporation, El Dorado, Arkansas. Director since 2011. Committees: Environmental, Health & Safety | |  | | David J. H. Smith Chief Executive Officer, Retired, Whatman plc, Maidstone, Kent, England. Director since 2001. Committees: Executive Compensation (Chairman); Nominating & Governance |
| | | |
 | | Robert A. Hermes Chairman of the Board, Retired, Purvin & Gertz, Inc., Houston, Texas. Director since 1999. Committees: Executive; Nominating & Governance (Chairman); Environmental, Health & Safety | |  | | Caroline G. Theus President, Inglewood Land & Development Co., Alexandria, Louisiana. Director since 1985. Committees: Executive; Environmental, Health & Safety (Chairman) |
7
Principal Subsidiaries
| | | | |
Murphy Exploration & Production Company Engages in worldwide crude oil and natural gas exploration and production. 16290 Katy Freeway Suite 600 Houston, Texas 77094 (281) 675-9000 | | Roger W. Jenkins President Eugene T. Coleman Executive Vice President, Worldwide Derek M. Stewart Senior Vice President, Americas, West Africa and Middle East Sam Algar Vice President, Asia Pacific Exploration Keith S. Caldwell Vice President, Finance and Administration Daniel R. Hanchera Vice President, Business Development | | Dave B. Perkins Vice President, Health, Safety, Environment & Security Walter K. Compton Vice President and General Counsel Kevin G. Fitzgerald Vice President Mindy K. West Vice President and Treasurer John W. Eckart Vice President John A. Moore Secretary |
| | |
Murphy Oil Company Ltd. Engages in crude oil and natural gas exploration and production, and extraction and sale of synthetic crude oil in Canada. 4000, 520-3 Avenue SW Calgary, Alberta T2P 0R3 (403) 294-8000 Mailing Address: P.O. Box 2721, Station M Calgary, Alberta T2P 3Y3 Canada | | Michael McFadyen President Cal Buchanan Vice President, Business Development Ronald L. Mcllwrick Vice President, Operations | | Dennis Ward Vice President, Finance Mindy K. West Vice President and Treasurer Paul Christensen Controller |
| | |
Murphy Oil USA, Inc. Engages in marketing of petroleum products and manufacturing of ethanol fuel in the United States. 200 Peach Street El Dorado, Arkansas 71730 (870) 862-6411 Mailing Address: P.O. Box 7000 El Dorado, Arkansas 71731-7000 | | Thomas McKinlay President Marn Cheng Vice President Stephen F. Hunkus Vice President, World Wide Refining and Renewable Energy Walter K. Compton Vice President and General Counsel | | Mindy K. West Vice President and Treasurer John W. Eckart Vice President and Controller John A. Moore Secretary |
| | |
Murco Petroleum Limited Engages in refining and marketing of petroleum products in the United Kingdom. 4 Beaconsfield Road St. Albans, Hertfordshire AL1 3RH, England 44-1727-892-400 | | Bryan G. Kelly Managing Director Jamie Goodfellow Marketing Director Bernard Pouille Supply and Refining Director | | Simon V. Rhodes Financial Director Patricia E. Haylock Secretary |
Corporate Information
| | | | |
Corporate Office | | Electronic Payment of Dividends | | Annual Meeting |
200 Peach Street P.O. Box 7000 El Dorado, Arkansas 71731-7000 (870) 862-6411 Stock Exchange Listings Trading Symbol: MUR New York Stock Exchange Transfer Agent and Registrar Computershare Trust Company, N.A. Toll-free (888) 239-5303 Local Chicago (312) 360-5303 (Address for overnight delivery) 250 Royall Street Mail Stop 1A Canton, MA 02021 (Address for first class mail, registered mail and certified mail) P. O. Box 43036 Providence, RI 02940 | | Shareholders may have dividends deposited directly into their bank accounts by electronic funds transfer. Authorization forms may be obtained by contacting Computershare as described under Transfer Agent and Registrar above. E-mail Address murphyoil@murphyoilcorp.com Web Site www.murphyoilcorp.com Murphy Oil’s website provides frequently updated information about the Company and its operations, including: • News releases • Annual report • Quarterly reports • Live webcasts of quarterly conference calls • Links to the Company’s SEC filings • Stock quotes • Profiles of the Company’s operations • Murphy USA station locator | | The annual meeting of the Company’s shareholders will be held at 10:00 a.m. on May 9, 2012, at the South Arkansas Arts Center, 110 East 5th Street, El Dorado, Arkansas. A formal notice of the meeting, together with a proxy statement and proxy form, will be provided to all shareholders. Inquiries Inquiries regarding shareholder account matters should be addressed to: John A. Moore Manager, Law and Secretary Murphy Oil Corporation P.O. Box 7000 El Dorado, Arkansas 71731-7000 jmoore@murphyoilcorp.com Members of the financial community should direct their inquiries to: Barry Jeffery Director, Investor Relations Murphy Oil Corporation P.O. Box 7000 El Dorado, Arkansas 71731-7000 (870) 864-6501 bjeffery@murphyoilcorp.com |
| | |
Executive Officers | | | | |
| | |
David M. Wood President and Chief Executive Officer and Director and Member of the Executive Committee since January 2009. Mr. Wood served as Executive Vice President and President of Murphy Exploration & Production Company from January 2007 until December 2008, and President of Murphy Exploration & Production Company- International from March 2003 through December 2006. Kevin G. Fitzgerald Executive Vice President and Chief Financial Officer since December 2011. Mr. Fitzgerald was Senior Vice President and Chief Financial Officer from January 2007 to November 2011, and was Treasurer from July 2001 through December 2006. Roger W. Jenkins Executive Vice President since August 2009. Mr. Jenkins has served as President of Murphy Exploration & Production Company since January 2009, and prior to that was Senior Vice President, North America for this subsidiary from September 2007 to December 2008. | | Thomas McKinlay Executive Vice President, World Wide Downstream operations since January 2011. Mr. McKinlay was Vice President, U.S. Manufacturing from August 2009 to January 2011. Additionally, Mr. McKinlay has served as Senior Vice President of Murphy Oil USA, Inc. since April 2009. From August 2008 to March 2009, he was General Manager, Supply and Transportation for this U.S. subsidiary. Bill H. Stobaugh Executive Vice President, Corporate Planning & Business Development since February 2012. Mr. Stobaugh was Senior Vice President from February 2005 to January 2012. Walter K. Compton Senior Vice President and General Counsel since March 2011. Mr. Compton was Vice President, Law from February 2009 to February 2011, and Manager, Law from November 1996 to January 2009. John W. Eckart Senior Vice President and Controller since December 2011. Mr. Eckart was Vice President and Controller from January 2007 to November 2011, and has been Controller since March 2000. | | Mindy K. West Vice President and Treasurer since January 2007. Ms. West was Director of Investor Relations from July 2001 through December 2006. Kelli M. Hammock Vice President, Administration since December 2009. Ms. Hammock was General Manager, Administration from June 2006 to November 2009. Thomas J. Mireles Vice President, Corporate Planning & Development since February 2012. Mr. Mireles was General Manager, Planning & Analysis from June 2010 to January 2012. He also served as Senior Manager, Business Development from February 2009 to May 2010 and was Manager, Business Development from January 2007 to January 2009. John A. Moore Secretary since March 2011. Mr. Moore was Senior Attorney from August 2005 to February 2011. |