Financial and Operating Highlights
| | | | | | | | | | | | | | | | | | | | |
(Thousands of dollars except per share data) | | 2012 | | | 2011 | | | % Change
2012–2011 | | | 2010 | | | % Change
2011–2010 | |
For the Year | | | | | | | | | | | | | | | | | | | | |
Revenues | | $ | 28,626,046 | | | $ | 27,638,121 | | | | 4 | % | | $ | 20,036,150 | | | | 38 | % |
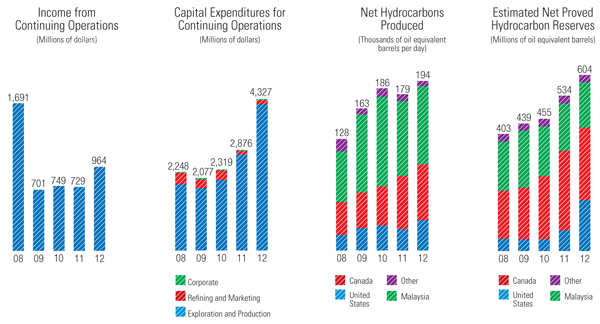
Income from continuing operations | | | 964,046 | | | | 729,471 | | | | 32 | % | | | 749,080 | | | | -3 | % |
Net income | | | 970,876 | | | | 872,702 | | | | 11 | % | | | 798,081 | | | | 9 | % |
Cash dividends paid – normal | | | 228,288 | | | | 212,752 | | | | 7 | % | | | 201,405 | | | | 6 | % |
– special | | | 486,141 | | | | — | | | | N/A | | | | — | | | | N/A | |
Capital expenditures | | | 4,383,986 | | | | 2,943,812 | | | | 49 | % | | | 2,448,140 | | | | 20 | % |
Net cash provided by operating activities | | | 3,056,281 | | | | 2,145,385 | | | | 42 | % | | | 3,128,558 | | | | -31 | % |
Average common shares outstanding –diluted (thousands) | | | 194,669 | | | | 194,512 | | | | 0 | % | | | 193,158 | | | | 1 | % |
| | | | | |
At End of Year | | | | | | | | | | | | | | | | | | | | |
Working capital | | $ | 699,502 | | | $ | 622,743 | | | | 12 | % | | $ | 619,783 | | | | 0 | % |
Net property, plant and equipment | | | 13,011,606 | | | | 10,475,149 | | | | 24 | % | | | 10,367,847 | | | | 1 | % |
Total assets | | | 17,522,643 | | | | 14,138,138 | | | | 24 | % | | | 14,233,243 | | | | -1 | % |
Long-term debt | | | 2,245,201 | | | | 249,553 | | | | 800 | % | | | 939,350 | | | | -73 | % |
Stockholders’ equity | | | 8,942,035 | | | | 8,778,397 | | | | 2 | % | | | 8,199,550 | | | | 7 | % |
| | | | | |
Per Share of Common Stock | | | | | | | | | | | | | | | | | | | | |
Income from continuing operations – diluted | | $ | 4.95 | | | $ | 3.75 | | | | 32 | % | | $ | 3.88 | | | | -3 | % |
Net income – diluted | | | 4.99 | | | | 4.49 | | | | 11 | % | | | 4.13 | | | | 9 | % |
Cash dividends paid – normal | | | 1.175 | | | | 1.10 | | | | 7 | % | | | 1.05 | | | | 5 | % |
– special | | | 2.50 | | | | — | | | | N/A | | | | — | | | | N/A | |
Stockholders’ equity | | | 46.91 | | | | 45.31 | | | | 4 | % | | | 42.52 | | | | 7 | % |
| | | | | |
Net Crude Oil and Gas Liquids Produced –barrels per day | | | 112,591 | | | | 103,160 | | | | 9 | % | | | 126,927 | | | | -19 | % |
United States | | | 26,090 | | | | 17,148 | | | | 52 | % | | | 20,114 | | | | -15 | % |
Canada | | | 28,302 | | | | 30,049 | | | | -6 | % | | | 30,801 | | | | -2 | % |
Malaysia | | | 52,663 | | | | 48,551 | | | | 8 | % | | | 66,897 | | | | -27 | % |
Other International | | | 5,536 | | | | 7,412 | | | | -25 | % | | | 9,115 | | | | -19 | % |
| | | | | |
Net Natural Gas Sold – thousands of cubic feet per day | | | 490,124 | | | | 457,365 | | | | 7 | % | | | 356,801 | | | | 28 | % |
United States | | | 52,962 | | | | 47,212 | | | | 12 | % | | | 53,037 | | | | -11 | % |
Canada | | | 217,046 | | | | 188,787 | | | | 15 | % | | | 85,563 | | | | 121 | % |
Malaysia | | | 216,745 | | | | 217,440 | | | | 0 | % | | | 212,692 | | | | 2 | % |
United Kingdom | | | 3,371 | | | | 3,926 | | | | -14 | % | | | 5,509 | | | | -29 | % |
| | | | | |
Petroleum Products Sold – barrels per day | | | 474,949 | | | | 556,434 | | | | -15 | % | | | 536,757 | | | | 4 | % |
United States | | | 337,900 | | | | 420,737 | | | | -20 | % | | | 450,100 | | | | -7 | % |
United Kingdom | | | 137,049 | | | | 135,697 | | | | 1 | % | | | 86,657 | | | | 57 | % |
| | | | | |
Stockholder and Employee Data at December 31 | | | | | | | | | | | | | | | | | | | | |
Common shares outstanding (thousands) | | | 190,641 | | | | 193,723 | | | | -2 | % | | | 192,836 | | | | 0 | % |
Number of stockholders of record | | | 2,361 | | | | 2,212 | | | | 7 | % | | | 2,363 | | | | -6 | % |
Number of employees | | | 9,185 | | | | 8,610 | | | | 7 | % | | | 8,994 | | | | -4 | % |
Average number of employees for year | | | 8,879 | | | | 8,906 | | | | 0 | % | | | 8,673 | | | | 3 | % |
Murphy Oil at a Glance
| | |
| Murphy Oil Corporation (“Murphy” or “the Company”) is an international oil and gas company that conducts business through various operating subsidiaries. The Company produces oil and/or natural gas in the United States, Canada, Malaysia, the United Kingdom and Republic of the Congo and conducts exploration activities worldwide. Murphy also has an interest in a Canadian synthetic oil operation. The Company operates a growing retail gasoline marketing network on the parking lots of Walmart Supercenters and at stand-alone locations in the United States, and also markets petroleum products under various brand names and to unbranded wholesale customers in | | the United States. Additionally, the Company owns two ethanol production facilities in the United States. The Company owns a petroleum refinery and markets petroleum products in the United Kingdom. See further comments below regarding the Company’s intention to sell its U.K. assets and separate its U.S. downstream operations. Murphy is headquartered in El Dorado, Arkansas, and has over 9,100 employees worldwide. The Company’s common stock is traded on the New York Stock Exchange under the ticker symbol “MUR”. |
MAJOR SUBSIDIARIESOF MURPHY OIL CORPORATION
| | |
Murphy Exploration & Production Company,through various operating subsidiaries and affiliates, is engaged in crude oil and natural gas production activities in the United States, Malaysia, the U.K. sector of the North Sea and Republic of the Congo, and explores for oil and natural gas worldwide. The subsidiary has its headquarters in Houston, Texas, and conducts business from offices in numerous locations around the world. During 2012, the Company executed purchase and sale agreements to sell all of its U.K. exploration and production assets; these asset sales are expected to be completed in early 2013. Murphy Oil Company Ltd.is engaged in crude oil and natural gas exploration and production in Western Canada and offshore Eastern Canada as well as the extraction and sale of synthetic crude oil from oil sands. The subsidiary’s office is located in Calgary, Alberta, and is operated as a component of the Company’s worldwide exploration and production operation directed from Houston. | | Murphy Oil USA, Inc.is engaged in retail and wholesale marketing of petroleum products in the United States. It is headquartered in El Dorado, Arkansas. High-volume and low-cost Murphy USA® branded gasoline stations located on-site at Walmart Supercenters and at stand-alone Murphy Express locations provide fuel and merchandise to retail customers in 23 states, primarily in the Southern and Midwestern U.S. Murphy Oil USA also operates a network of seven Company-owned terminals that, along with a number of third-party terminals, supply fuel to the retail network and wholesale and bulk customers in 30 states. Ethanol production facilities in Hankinson, North Dakota, and Hereford, Texas, produce about one-third of ethanol blended into gasoline sold by the Company. The Company has announced its intention to separate this U.S. Downstream business by effecting a spin-off to its shareholders during 2013. After the separation, this business would be an independent publicly held company. |
| |
| | Murco Petroleum Limitedis engaged in refining and marketing of petroleum products in the United Kingdom. Headquartered at St. Albans, England, Murco owns a refinery in Milford Haven, Wales, and operates a network of fueling stations in the United Kingdom. The Company has announced its intention to sell these U.K. operations. |
| | | | |
OFFICES | | | | |
El Dorado, Arkansas | | St. Albans, Hertfordshire, England | | Jakarta, Indonesia |
Houston, Texas | | Pointe-Noire, Republic of the Congo | | Erbil, Kurdistan, Iraq |
Calgary, Alberta, Canada | | Perth, Western Australia, Australia | | Ho Chi Minh City, Vietnam |
Kuala Lumpur, Malaysia | | | | |
1
Dear Fellow Shareholders
| | |
As a result of a great deal of smart, hard work and dedication by our employees in 2012, our Company achieved important year-on-year growth in production and proved reserves, in retail station count and sales volume, and in earnings and dividends. Going forward in 2013, we expect to see continued growth – and as the planned spin-off of our U.S. Retail business becomes a reality later this year, we will see it more clearly as two separate, publicly traded companies each pursue their individual growth strategies. In our exploration and production business, production for 2012 averaged over 194,000 barrels of oil equivalent per day (boepd) with a weighting of 58% to oil and 15% to oil-indexed natural gas. This represents production growth of 8% over 2011 and a leading compound annual growth rate of nearly 14% over the last five years. Increases in production came from steady predictable growth in the Eagle Ford Shale (EFS) in south Texas, stabilized production from our Kikeh field and Sarawak gas development, both offshore Malaysia, and increased working interests in the Gulf of Mexico. Early in the year we made the decision to reduce spending and ultimately production by approximately 5,000 boepd of North American dry gas from our Montney developments in northeast British Columbia. While this resulted in lower production, it was the prudent decision in view of low natural gas prices. | |  |
In 2013 we will see another year of production growth with steady development at EFS and the offshore oil projects in Block K and Sarawak in Malaysia coming onstream late in the year.
Activity in our North America onshore business focused on oil development in the EFS and moving forward with plans for Enhanced Oil Recovery (EOR) at Seal in Canada. In the EFS, we ramped up to ten rigs early in the year and held steady at that level, drilling 151 wells for the year bringing our total well count to 213 at year-end 2012. Production from the EFS averaged over 15,000 boepd for the year, up from 3,750 boepd in 2011. We plan to maintain this steady rate of development for the foreseeable future as we target production growth to over 50,000 boepd. Our plans to grow heavy oil production at Seal are centered on EOR development related to polymer flooding and thermal stimulation. We added to our land position and resource base at Seal through an acquisition that fits well with our growth plans.
In our global offshore business, we are on track to bring new Malaysian oil developments onstream late in 2013 at Patricia, Serendah, South Acis and Permas in the Sarawak blocks and Siakap North in Sabah. In addition, the early production system for the Kakap-Gumusut project brought two wells onstream through the Kikeh facility in the fourth quarter of 2012, a year ahead of the main field. In a continuing effort to review and rationalize our portfolio, we signed Purchase and Sale agreements to sell our U.K. upstream fields at Schiehallion, Mungo-Monan and Amethyst.
Our global exploration focus is in four geographic regions on specific play types with a goal to deliver a consistent 10 well program. The 2012 program yielded solid results with seven discoveries from a total of ten wells drilled. We continued our string of success in Block H Malaysia with four discoveries bringing us to seven straight in the field where a third party floating liquefied natural gas (LNG) project is scheduled to be sanctioned in 2013. We participated at a 5% working interest in two smaller discoveries in Block CA-1 offshore Brunei and our final discovery came at our Dalmatian South prospect in the Gulf of Mexico. While not in the “grand slam” category, our steady pace of “singles” and “doubles” has contributed to over 150% production replacement over the
2
last five years as well as a near doubling of production and the addition of 200 million barrels of oil equivalent of proved reserves. We look forward to this year’s 10-plus well program where we have sizeable wells to drill in Australia, Cameroon and the Gulf of Mexico in 2013.
We are fortunate to have Brent as the global benchmark for the majority of our oil-weighted production as it shows continued strength, while West Texas Intermediate (WTI) remained dislocated to global benchmarks as growing domestic production resulted in an oversupply in the U.S. midcontinent. We expect the dislocation of WTI crude pricing against global benchmarks to continue for the midterm. However, with anticipated global economic recovery, we expect the supply/demand balance to remain tight and we are well positioned with our growing oil-weighted portfolio attracting Brent related pricing.
Natural gas prices in North America fell below $2.00 per million British thermal units (mmbtu) during part of 2012 as this market was oversupplied with shale gas. The Henry Hub benchmark recovered to around $3.50 per mmbtu by the end of the year. We are encouraged with recent announced LNG export projects in Canada where we have the majority of our North America dry gas position. In the near term, we will remain disciplined in our investments in North American dry gas until LNG exports for this region mature. Globally, continued strong demand for LNG provides support for solid oil-indexed pricing for our Sarawak, Malaysia gas production and should provide future growth opportunities in the region.
Our downstream business had another solid year turning in income of $197 million, excluding the Hereford ethanol plant impairment, and cash flow of $342 million, with the U.S. Retail business contributing the third highest net income in its history. Expansion of the retail network continued with the addition of 37 new stations in 2012, bringing the total number of retail outlets to 1,165 at year-end. We solidified our relationship with Walmart with an agreement to grow the retail network in core markets accessing over 200 new locations and providing the foundation for growth. In addition, we participated with Walmart on another promotional discount program on gasoline prices from September through December.
Having divested our two U.S. refineries in late 2011, we continue with the sales process for our U.K. downstream assets. During this protracted sales process, the business has continued to focus on safe reliable operations and has been able to capture margin and contribute net income through the year.
In 2012, our Company moved forward on key initiatives to unlock value for our shareholders with the plan to “spin-off” the U.S. Retail business into a separate entity, declaring a special dividend to shareholders and implementing a share repurchase program.
3
As a result of the planned “spin-off”, scheduled for the second half of 2013, Murphy USA will continue its growth as a low-price, high-volume fuel retailer to the price conscious consumer. This fuel first business will consist of retail marketing of petroleum products and convenience merchandise through a large chain of company owned and operated retail gasoline stations, located primarily on the parking lots of the largest retailer in the world. Murphy USA is poised to become a separate entity with a growth plan in place and an advantaged retail format underpinned by low cost supply to meet the needs of our value-conscious customers.
Murphy Oil Corporation will become an independent exploration and production company with principal activities in the United States, Canada and Malaysia. It will continue its global exploration program and accompanying development projects complemented by predictable growth in our North America oil-weighted onshore business led by the EFS. The EFS is on track to become Murphy’s most significant field in terms of net production with reserve potential now in excess of 300 million barrels. In the EFS we have recently cut drilling times by over 30% and continue to reduce completion costs as production maintains its steady ramp up towards 50,000-plus boepd by 2015. In addition, we are on-track with our oil development projects offshore Malaysia that will deliver substantial production growth in 2014-15.
In financial results, net income for 2012 totaled $970.9 million ($4.99 per share), up $98.2 million from 2011 primarily due to lower impairment charges and the benefit of tax deductions related to foreign exploration activity, somewhat offset by lower downstream results for the year. In August, the Board signaled support for our future growth by approving an increase to our regular dividend by 14% to an annual rate of $1.25 per share. We utilized our strong balance sheet to undertake the shareholder initiatives in the fourth quarter leaving the Company adequately capitalized to carry out our exploration and development program, ending the year with a debt-to-capital-employed ratio of 20.1%.
In closing as we look back on the performance and accomplishments of our Company over the past year, we must pause to reflect on the passing of our former Chairman, William C. Nolan, Jr., who died on March 12, 2012. Bill was an insightful leader who provided sage guidance during his 35-year tenure on the Board. He is sadly missed.
In August 2012, the Board added a capable new director in Jeffrey W. Nolan, President and CEO of Loutre Land and Timber Company. We welcome Jeff to the Board and look forward to his contributions.
David M. Wood retired as President and CEO in June 2012 after 17 years with the Company. We thank David for many contributions over his career and wish him well.
I appreciate your continued support as our Company moves forward with the spin-off of the U.S. Retail business and the creation of two strong but distinct businesses, each with a growth plan for the future. We have the team in place and together we look forward to delivering on our plans.
|
|
 |
| Steven A Cosse’ |
| President and Chief Executive Officer |
|
February 13, 2013 El Dorado, Arkansas |
4
Exploration and Production Statistical Summary
| | | | | | | | | | | | | | | | | | | | | | | | | | | | |
| | | 2012 | | | 2011 | | | 2010 | | | 2009 | | | 2008 | | | 2007 | | | 2006 | |
Net crude oil, condensate and natural gas liquids production – barrels per day | | | | | | | | | | | | | | | | | | | | | | | | | | | | |
United States | | | 26,090 | | | | 17,148 | | | | 20,114 | | | | 17,053 | | | | 10,668 | | | | 12,989 | | | | 21,112 | |
Canada – light | | | 245 | | | | 83 | | | | 43 | | | | 18 | | | | 46 | | | | 596 | | | | 443 | |
heavy | | | 7,241 | | | | 7,264 | | | | 5,988 | | | | 6,813 | | | | 8,484 | | | | 11,524 | | | | 12,613 | |
offshore | | | 6,986 | | | | 9,204 | | | | 11,497 | | | | 12,357 | | | | 16,826 | | | | 18,871 | | | | 14,896 | |
synthetic | | | 13,830 | | | | 13,498 | | | | 13,273 | | | | 12,855 | | | | 12,546 | | | | 12,948 | | | | 11,701 | |
Malaysia | | | 52,663 | | | | 48,551 | | | | 66,897 | | | | 76,322 | | | | 57,403 | | | | 20,367 | | | | 11,298 | |
Republic of the Congo | | | 2,078 | | | | 4,989 | | | | 5,820 | | | | 1,743 | | | | — | | | | — | | | | — | |
| | | | | | | | | | | | | | | | | | | | | | | | | | | | |
Continuing operations | | | 109,133 | | | | 100,737 | | | | 123,632 | | | | 127,161 | | | | 105,973 | | | | 77,295 | | | | 72,063 | |
Discontinued operations | | | 3,458 | | | | 2,423 | | | | 3,295 | | | | 4,678 | | | | 12,281 | | | | 14,227 | | | | 15,754 | |
| | | | | | | | | | | | | | | | | | | | | | | | | | | | |
Total liquids produced | | | 112,591 | | | | 103,160 | | | | 126,927 | | | | 131,839 | | | | 118,254 | | | | 91,522 | | | | 87,817 | |
| | | | | | | | | | | | | | | | | | | | | | | | | | | | |
Net crude oil, condensate and natural gas liquids sold – barrels per day | | | | | | | | | | | | | | | | | | | | | | | | | | | | |
United States | | | 26,090 | | | | 17,148 | | | | 20,114 | | | | 17,053 | | | | 10,668 | | | | 12,989 | | | | 21,112 | |
Canada – light | | | 245 | | | | 83 | | | | 43 | | | | 18 | | | | 46 | | | | 596 | | | | 443 | |
heavy | | | 7,241 | | | | 7,264 | | | | 5,988 | | | | 6,813 | | | | 8,484 | | | | 11,524 | | | | 12,613 | |
offshore | | | 7,092 | | | | 9,079 | | | | 11,343 | | | | 12,455 | | | | 16,690 | | | | 18,839 | | | | 15,360 | |
synthetic | | | 13,830 | | | | 13,498 | | | | 13,273 | | | | 12,855 | | | | 12,546 | | | | 12,948 | | | | 11,701 | |
Malaysia | | | 54,286 | | | | 48,092 | | | | 68,975 | | | | 72,575 | | | | 61,907 | | | | 16,018 | | | | 11,986 | |
Republic of the Congo | | | 1,468 | | | | 3,959 | | | | 5,428 | | | | 973 | | | | — | | | | — | | | | — | |
| | | | | | | | | | | | | | | | | | | | | | | | | | | | |
Continuing operations | | | 110,252 | | | | 99,123 | | | | 125,164 | | | | 122,742 | | | | 110,341 | | | | 72,914 | | | | 73,215 | |
Discontinued operations | | | 3,372 | | | | 2,299 | | | | 4,177 | | | | 3,607 | | | | 13,513 | | | | 14,688 | | | | 17,027 | |
| | | | | | | | | | | | | | | | | | | | | | | | | | | | |
Total liquids sold | | | 113,624 | | | | 101,422 | | | | 129,341 | | | | 126,349 | | | | 123,854 | | | | 87,602 | | | | 90,242 | |
| | | | | | | | | | | | | | | | | | | | | | | | | | | | |
Net natural gas sold – thousands of cubic feet per day | | | | | | | | | | | | | | | | | | | | | | | | | | | | |
United States | | | 52,962 | | | | 47,212 | | | | 53,037 | | | | 54,255 | | | | 45,785 | | | | 45,139 | | | | 56,810 | |
Canada | | | 217,046 | | | | 188,787 | | | | 85,563 | | | | 54,857 | | | | 1,910 | | | | 9,922 | | | | 9,752 | |
Malaysia – Sarawak | | | 174,283 | | | | 176,943 | | | | 154,535 | | | | 28,070 | | | | — | | | | — | | | | — | |
Kikeh | | | 42,462 | | | | 40,497 | | | | 58,157 | | | | 46,583 | | | | 1,399 | | | | — | | | | — | |
| | | | | | | | | | | | | | | | | | | | | | | | | | | | |
Continuing operations | | | 486,753 | | | | 453,439 | | | | 351,292 | | | | 183,765 | | | | 49,094 | | | | 55,061 | | | | 66,562 | |
Discontinued operations | | | 3,371 | | | | 3,926 | | | | 5,509 | | | | 3,501 | | | | 6,424 | | | | 6,021 | | | | 8,700 | |
| | | | | | | | | | | | | | | | | | | | | | | | | | | | |
Total natural gas sold | | | 490,124 | | | | 457,365 | | | | 356,801 | | | | 187,266 | | | | 55,518 | | | | 61,082 | | | | 75,262 | |
| | | | | | | | | | | | | | | | | | | | | | | | | | | | |
Net hydrocarbons produced – equivalent barrels1per day | | | 194,278 | | | | 179,388 | | | | 186,394 | | | | 163,050 | | | | 127,507 | | | | 101,702 | | | | 100,361 | |
Estimated net hydrocarbon reserves – million equivalent barrels1,2 | | | 604.3 | | | | 534.1 | | | | 455.2 | | | | 439.2 | | | | 402.8 | | | | 405.1 | | | | 388.3 | |
| | | | | | | | | | | | | | | | | | | | | | | | | | | | |
| | | | | | | |
Weighted average sales prices3 | | | | | | | | | | | | | | | | | | | | | | | | | | | | |
Crude oil, condensate and natural gas liquids –dollars per barrel | | | | | | | | | | | | | | | | | | | | | | | | | | | | |
United States | | $ | 102.60 | | | | 103.92 | | | | 76.31 | | | | 60.08 | | | | 95.74 | | | | 65.57 | | | | 57.30 | |
Canada4– light | | | 81.22 | | | | 94.28 | | | | 75.48 | | | | 64.24 | | | | 70.37 | | | | 50.98 | | | | 50.45 | |
heavy | | | 46.45 | | | | 57.00 | | | | 49.89 | | | | 40.45 | | | | 59.05 | | | | 32.84 | | | | 25.87 | |
offshore | | | 112.08 | | | | 110.02 | | | | 76.87 | | | | 58.19 | | | | 96.69 | | | | 69.83 | | | | 62.55 | |
synthetic | | | 91.85 | | | | 102.94 | | | | 77.90 | | | | 61.49 | | | | 100.10 | | | | 74.35 | | | | 63.23 | |
Malaysia5 | | | 97.29 | | | | 90.14 | | | | 60.97 | | | | 55.51 | | | | 87.83 | | | | 74.58 | | | | 51.78 | |
Republic of the Congo5 | | | 107.26 | | | | 103.02 | | | | 74.87 | | | | 69.04 | | | | — | | | | — | | | | — | |
Natural gas – dollars per thousand cubic feet | | | | | | | | | | | | | | | | | | | | | | | | | | | | |
United States | | | 2.76 | | | | 4.13 | | | | 4.52 | | | | 4.05 | | | | 9.67 | | | | 7.38 | | | | 7.76 | |
Canada4 | | | 2.62 | | | | 4.07 | | | | 4.23 | | | | 3.09 | | | | 6.40 | | | | 6.34 | | | | 6.49 | |
Malaysia – Sarawak5 | | | 7.50 | | | | 7.10 | | | | 5.31 | | | | 4.05 | | | | — | | | | — | | | | — | |
Kikeh | | | 0.24 | | | | 0.24 | | | | 0.23 | | | | 0.23 | | | | 0.23 | | | | — | | | | — | |
| 1 | Natural gas converted at a 6:1 ratio. |
| 3 | Includes intracompany transfers at market prices. |
| 4 | U.S. dollar equivalent. |
| 5 | Prices are net of payments under the terms of the respective production sharing contracts. |
5
Refining and Marketing Statistical Summary
| | | | | | | | | | | | | | | | | | | | | | | | | | | | |
| | | 2012 | | | 2011 | | | 2010 | | | 2009 | | | 2008 | | | 2007 | | | 2006 | |
Branded retail refueling stations1 | | | | | | | | | | | | | | | | | | | | | | | | | | | | |
United States – Murphy USA® | | | 1,015 | | | | 1,003 | | | | 1,001 | | | | 996 | | | | 992 | | | | 971 | | | | 987 | |
Murphy Express | | | 150 | | | | 125 | | | | 98 | | | | 52 | | | | 33 | | | | 2 | | | | — | |
Other | | | — | | | | — | | | | 116 | | | | 121 | | | | 129 | | | | 153 | | | | 177 | |
Total United States | | | 1,165 | | | | 1,128 | | | | 1,215 | | | | 1,169 | | | | 1,154 | | | | 1,126 | | | | 1,164 | |
United Kingdom | | | 452 | | | | 459 | | | | 451 | | | | 453 | | | | 454 | | | | 389 | | | | 402 | |
| | | | | | | | | | | | | | | | | | | | | | | | | | | | |
United States retail marketing: | | | | | | | | | | | | | | | | | | | | | | | | | | | | |
Fuel margin per gallon2 | | $ | 0.129 | | | | 0.156 | | | | 0.114 | | | | 0.083 | | | | 0.165 | | | | 0.103 | | | | 0.104 | |
Gallons sold per store month | | | 277,001 | | | | 277,715 | | | | 306,646 | | | | 312,493 | | | | 324,223 | | | | 294,784 | | | | 285,665 | |
Merchandise sales revenue per store month | | $ | 156,429 | | | | 158,144 | | | | 153,530 | | | | 137,623 | | | | 110,943 | | | | 97,523 | | | | 80,598 | |
Merchandise margin as a percentage of merchandise sales | | | 13.5 | % | | | 12.8 | % | | | 13.1 | % | | | 12.5 | % | | | 13.5 | % | | | 13.2 | % | | | 13.3 | % |
| | | | | | | | | | | | | | | | | | | | | | | | | | | | |
United Kingdom refining and marketing – Unit margins per barrel | | $ | 1.94 | | | | (0.67 | ) | | | (1.47 | ) | | | (0.28 | ) | | | 3.41 | | | | (1.48 | ) | | | 4.43 | |
| | | | | | | | | | | | | | | | | | | | | | | | | | | | |
Petroleum products sold – barrels per day | | | | | | | | | | | | | | | | | | | | | | | | | | | | |
United States – Gasoline | | | 289,650 | | | | 312,945 | | | | 333,182 | | | | 319,549 | | | | 313,827 | | | | 298,833 | | | | 266,353 | |
Kerosine | | | 146 | | | | 11,864 | | | | 11,449 | | | | 11,928 | | | | 4,606 | | | | 1,685 | | | | 2,269 | |
Diesel and home heating oils | | | 48,104 | | | | 74,410 | | | | 77,799 | | | | 76,599 | | | | 86,933 | | | | 91,344 | | | | 62,196 | |
Residuals | | | — | | | | 12,618 | | | | 18,015 | | | | 15,501 | | | | 14,837 | | | | 15,422 | | | | 11,696 | |
Asphalt, LPG and other | | | — | | | | 8,900 | | | | 9,655 | | | | 9,123 | | | | 7,287 | | | | 9,384 | | | | 8,087 | |
| | | | | | | | | | | | | | | | | | | | | | | | | | | | |
Total United States | | | 337,900 | | | | 420,737 | | | | 450,100 | | | | 432,700 | | | | 427,490 | | | | 416,668 | | | | 350,601 | |
| | | | | | | | | | | | | | | | | | | | | | | | | | | | |
United Kingdom – Gasoline | | | 47,087 | | | | 35,757 | | | | 23,085 | | | | 30,007 | | | | 34,125 | | | | 14,356 | | | | 12,425 | |
Kerosine | | | 17,273 | | | | 16,298 | | | | 11,387 | | | | 12,954 | | | | 14,835 | | | | 4,020 | | | | 3,619 | |
Diesel and home heating oils | | | 48,595 | | | | 48,893 | | | | 29,710 | | | | 35,721 | | | | 34,560 | | | | 14,785 | | | | 11,803 | |
Residuals | | | 13,744 | | | | 14,427 | | | | 7,885 | | | | 10,560 | | | | 12,744 | | | | 3,728 | | | | 3,825 | |
LPG and other | | | 10,350 | | | | 20,322 | | | | 14,590 | | | | 14,532 | | | | 15,246 | | | | 4,213 | | | | 2,998 | |
| | | | | | | | | | | | | | | | | | | | | | | | | | | | |
Total United Kingdom | | | 137,049 | | | | 135,697 | | | | 86,657 | | | | 103,774 | | | | 111,510 | | | | 41,102 | | | | 34,670 | |
| | | | | | | | | | | | | | | | | | | | | | | | | | | | |
Total petroleum products sold | | | 474,949 | | | | 556,434 | | | | 536,757 | | | | 536,474 | | | | 539,000 | | | | 457,770 | | | | 385,271 | |
| | | | | | | | | | | | | | | | | | | | | | | | | | | | |
Crude capacity of Milford Haven, Wales refinery1– barrels per stream day | | | 135,000 | | | | 135,000 | | | | 135,000 | | | | 108,000 | | | | 108,000 | | | | 108,000 | | | | 32,400 | |
| | | | | | | | | | | | | | | | | | | | | | | | | | | | |
Milford Haven, Wales refinery inputs – barrels per day | | | | | | | | | | | | | | | | | | | | | | | | | | | | |
Crude | | | 129,334 | | | | 131,959 | | | | 78,841 | | | | 96,625 | | | | 97,521 | | | | 36,000 | | | | 30,036 | |
Other feedstocks | | | 3,279 | | | | 3,432 | | | | 5,322 | | | | 6,334 | | | | 15,067 | | | | 3,756 | | | | 3,720 | |
| | | | | | | | | | | | | | | | | | | | | | | | | | | | |
Total U.K. refinery inputs | | | 132,613 | | | | 135,391 | | | | 84,163 | | | | 102,959 | | | | 112,588 | | | | 39,756 | | | | 33,756 | |
| | | | | | | | | | | | | | | | | | | | | | | | | | | | |
Milford Haven, Wales refinery yields – barrels per day | | | | | | | | | | | | | | | | | | | | | | | | | | | | |
Gasoline | | | 46,100 | | | | 34,171 | | | | 20,889 | | | | 26,902 | | | | 32,290 | | | | 12,397 | | | | 10,624 | |
Kerosine | | | 16,941 | | | | 17,038 | | | | 11,374 | | | | 13,789 | | | | 15,065 | | | | 4,500 | | | | 4,255 | |
Diesel and home heating oils | | | 46,004 | | | | 47,418 | | | | 25,995 | | | | 34,619 | | | | 33,868 | | | | 14,218 | | | | 11,308 | |
Residuals | | | 13,922 | | | | 14,185 | | | | 8,296 | | | | 10,388 | | | | 12,585 | | | | 3,641 | | | | 3,830 | |
Asphalt, LPG and other | | | 5,976 | | | | 19,448 | | | | 14,799 | | | | 13,735 | | | | 15,750 | | | | 4,344 | | | | 2,962 | |
Fuel and loss | | | 3,670 | | | | 3,131 | | | | 2,810 | | | | 3,526 | | | | 3,030 | | | | 656 | | | | 777 | |
| | | | | | | | | | | | | | | | | | | | | | | | | | | | |
Total U.K. refining yields | | | 132,613 | | | | 135,391 | | | | 84,163 | | | | 102,959 | | | | 112,588 | | | | 39,756 | | | | 33,756 | |
| | | | | | | | | | | | | | | | | | | | | | | | | | | | |
| 2 | Represents net sales prices for fuel less purchased cost of fuel. |
6
Board of Directors

Top row left to right
| | |
| Claiborne P. Deming— | | President and Chief Executive Officer, Retired, Murphy Oil Corporation, El Dorado, Arkansas. Director since 1993. Chairman of the Board since March 2012. Committees: Executive (Chairman); Environmental, Health & Safety |
| | |
| |
| Steven A. Cossé— | | President and Chief Executive Officer, Murphy Oil Corporation, El Dorado, Arkansas since June 2012. Director since 2011. Committees: Executive; Environmental, Health & Safety |
| | |
| |
| Frank W. Blue— | | International Legal Advisor/Arbitrator, Santa Barbara, California. Director since 2003. Committees: Audit; Nominating & Governance |
| | |
| |
| Robert A. Hermes— | | Chairman of the Board, Retired, Purvin & Gertz, Inc., Houston, Texas. Director since 1999. Committees: Executive; Nominating & Governance (Chairman); Environmental, Health & Safety |
| | |
| |
| James V. Kelley— | | President and Chief Operating Officer, BancorpSouth, Inc., Tupelo, Mississippi. Director since 2006. Committees: Audit; Executive Compensation; Nominating & Governance |
| | |
| |
| Walentin Mirosh— | | President, Mircan Resources Ltd., Calgary, Alberta, Canada. Director since 2011. Committees: Executive Compensation; Environmental, Health & Safety |
Bottom row left to right
| | |
| R. Madison Murphy— | | Managing Member, Murphy Family Management, LLC, El Dorado, Arkansas. Director since 1993. Chairman from 1994–2002. Committees: Executive; Audit (Chairman) |
| | |
| |
| Jeffrey W. Nolan— | | President and Chief Executive Officer, Loutre Land and Timber Company, El Dorado, Arkansas. Director since 2012. Committees: Executive Compensation |
| | |
| |
| Neal E. Schmale— | | President and Chief Operating Officer, Retired, Sempra Energy, San Diego, California. Director since 2004. Committees: Audit; Executive Compensation |
| | |
| |
| David J. H. Smith— | | Chief Executive Officer, Retired, Whatman plc, Maidstone, Kent, England. Director since 2001. Committees: Executive Compensation (Chairman); Nominating & Governance |
| | |
| |
| Caroline G. Theus— | | President, Inglewood Land & Development Co., Alexandria, Louisiana. Director since 1985. Committees: Executive; Environmental, Health & Safety (Chairman) |
7
Principal Subsidiaries
| | | | |
Murphy Exploration & Production Company Engages in worldwide crude oil and natural gas exploration and production. 16290 Katy Freeway Suite 600 Houston, Texas 77094 (281) 675-9000 | | Roger W. Jenkins President Eugene T. Coleman Executive Vice President, Offshore and International Operations Michael McFadyen Executive Vice President, North American Onshore Operations Derek M. Stewart Senior Vice President, Americas, West Africa and Middle East Sam Algar Vice President, Asia Pacific Exploration Keith S. Caldwell Vice President, Finance | | Daniel R. Hanchera Vice President, Business Development Dave B. Perkins Vice President, Health, Safety, Environment & Security Walter K. Compton Vice President and General Counsel Kevin G. Fitzgerald Vice President Mindy K. West Vice President and Treasurer John W. Eckart Vice President John A. Moore Secretary |
| | |
Murphy Oil Company Ltd. Engages in crude oil and natural gas exploration and production, and extraction and sale of synthetic crude oil in Canada. 4000, 520-3 Avenue SW Calgary, Alberta T2P 0R3 (403) 294-8000 Mailing Address: P.O. Box 2721, Station M Calgary, Alberta T2P 3Y3 Canada | | Michael McFadyen President Cal Buchanan Vice President, Business Development Ronald L. Mcllwrick Vice President, Operations Dennis Ward Vice President, Finance | | Kevin Fitzgerald Vice President Mindy K. West Treasurer Paul Christensen Controller Linda J. Smorang Secretary |
| | |
Murphy Oil USA, Inc. Engages in marketing of petroleum products and manufacturing of ethanol fuel in the United States. 200 Peach Street El Dorado, Arkansas 71730 (870) 862-6411 Mailing Address: P.O. Box 7000 El Dorado, Arkansas 71731-7000 | | R. Andrew Clyde President Marn K. Cheng Vice President Jeffery A. Goodwin Vice President Stephen F. Hunkus Vice President | | John C. Rudolfs Vice President Mindy K. West Chief Financial Officer John A. Moore General Counsel and Secretary |
| | |
Murco Petroleum Limited Engages in refining and marketing of petroleum products in the United Kingdom. 4 Beaconsfield Road St. Albans, Hertfordshire AL1 3RH, England 44-1727-892-400 | | Bryan G. Kelly Managing Director John E. Ford Planning & Special Projects Director Jamie Goodfellow Marketing Director | | Susan Hogg Supply and Refining Director Simon V. Rhodes Financial Director Patricia E. Haylock Secretary |
8
Corporate Information
| | | | |
| Corporate Office | | Electronic Payment of Dividends | | Annual Meeting |
200 Peach Street P.O. Box 7000 El Dorado, Arkansas 71731-7000 (870) 862-6411 Stock Exchange Listings Trading Symbol: MUR New York Stock Exchange Transfer Agent and Registrar Computershare Trust Company, N.A. Toll-free (888) 239-5303 Local Chicago (312) 360-5303 (Address for overnight delivery) 250 Royall Street Mail Stop 1A Canton, MA 02021 (Address for first class mail, registered mail and certified mail) P.O. Box 43036 Providence, RI 02940 | | Shareholders may have dividends deposited directly into their bank accounts by electronic funds transfer. Authorization forms may be obtained by contacting Computershare as described under Transfer Agent and Registrar above. E-mail Address murphyoil@murphyoilcorp.com Web Site www.murphyoilcorp.com Murphy Oil’s website provides frequently updated information about the Company and its operations, including: • News releases • Annual report • Quarterly reports • Live webcasts of quarterly conference calls • Links to the Company’s SEC filings • Stock quotes • Profiles of the Company’s operations • Murphy USA station locator | | The annual meeting of the Company’s stockholders will be held at 10:00 a.m. on May 8, 2013, at the South Arkansas Arts Center, 110 East 5th Street, El Dorado, Arkansas. A formal notice of the meeting, together with a proxy statement and proxy form, will be provided to all shareholders. Inquiries Inquiries regarding shareholder account matters should be addressed to: John A. Moore Manager, Law and Corporate Secretary Murphy Oil Corporation P.O. Box 7000 El Dorado, Arkansas 71731-7000 jmoore@murphyoilcorp.com Members of the financial community should direct their inquiries to: Barry Jeffery Director, Investor Relations Murphy Oil Corporation P.O. Box 7000 El Dorado, Arkansas 71731-7000 (870) 864-6501 bjeffery@murphyoilcorp.com |
| Executive Officers | | | | |
| | |
Steven A. Cossé President and Chief Executive Officer and Member of the Executive Committee since June 2012. Mr. Cossé has been a Director of the Company since August 2011. Mr. Cossé also was Executive Vice President of the company from February 2005 to March 2011 and was General Counsel of the company from August 1991 to March 2011. Roger W. Jenkins Chief Operating Officer since June 2012. Mr. Jenkins became Executive Vice President in August 2009, and has served as President of Murphy Exploration & Production Company since January 2009. Prior to that he was Senior Vice President, North America for this subsidiary from September 2007 to December 2008. Kevin G. Fitzgerald Executive Vice President and Chief Financial Officer since December 2011. Mr. Fitzgerald was Senior Vice President and Chief Financial Officer from January 2007 to November 2011, and was Treasurer from July 2001 through December 2006. | | Thomas McKinlay Executive Vice President, U.K. Downstream since January 2013. Mr. McKinlay was Executive Vice President, Worldwide Downstream from January 2011 to January 2013 and was Vice President, U.S. Manufacturing from August 2009 to January 2011. Additionally, Mr. McKinlay was President of Murphy Oil USA, Inc. from January 2011 to January 2013. He was Senior Vice President of this U.S. subsidiary from April 2009 to January 2011, and from August 2008 to March 2009, was General Manager, Supply and Transportation. Bill H. Stobaugh Executive Vice President, Corporate Planning & Business Development since February 2012. Mr. Stobaugh was Senior Vice President from February 2005 to January 2012. Walter K. Compton Senior Vice President and General Counsel since March 2011. Mr. Compton was Vice President, Law from February 2009 to February 2011, and Manager, Law from November 1996 to January 2009. | | John W. Eckart Senior Vice President and Controller since December 2011. Mr. Eckart was Vice President and Controller from January 2007 to November 2011, and has been Controller since March 2000. Mindy K. West Vice President and Treasurer since January 2007. Ms. West was Director of Investor Relations from July 2001 through December 2006. Kelli M. Hammock Vice President, Administration since December 2009. Ms. Hammock was General Manager, Administration from June 2006 to November 2009. Thomas J. Mireles Vice President, Corporate Planning & Development since February 2012. Mr. Mireles was General Manager, Planning & Analysis from June 2010 to January 2012. He also served as Senior Manager, Business Development from February 2009 to May 2010 and was Manager, Business Development from January 2007 to January 2009. John A. Moore Secretary since March 2011. Mr. Moore was Senior Attorney from August 2005 to February 2011. |