Exhibit 13
Financial and Operating Highlights
| % Change | % Change | |||||||||||||||||||
| (Thousands of dollars except per share data) | 2013 | 2012 | 2013–2012 | 2011 | 2012–2011 | |||||||||||||||
For the Year | ||||||||||||||||||||
Revenues | $ | 5,390,089 | $ | 4,619,602 | 17 | % | $ | 4,278,682 | 8 | % | ||||||||||
Income from continuing operations | 888,137 | 806,494 | 10 | % | 539,198 | 50 | % | |||||||||||||
Net income | 1,123,473 | 970,876 | 16 | % | 872,702 | 11 | % | |||||||||||||
Cash dividends paid – normal | 235,108 | 228,288 | 3 | % | 212,752 | 7 | % | |||||||||||||
– special | — | 486,141 | N/A | — | N/A | |||||||||||||||
Capital expenditures | 4,120,592 | 4,383,986 | -6 | % | 2,943,812 | 49 | % | |||||||||||||
Net cash provided by operating activities | 3,638,487 | 3,056,281 | 19 | % | 2,145,385 | 42 | % | |||||||||||||
Average common shares outstanding – diluted (thousands) | 189,271 | 194,669 | -3 | % | 194,512 | 0 | % | |||||||||||||
At End of Year | ||||||||||||||||||||
Working capital | $ | 284,612 | $ | 699,502 | -59 | % | $ | 622,743 | 12 | % | ||||||||||
Net property, plant and equipment | 13,481,055 | 13,011,606 | 4 | % | 10,475,149 | 24 | % | |||||||||||||
Total assets | 17,509,484 | 17,522,643 | 0 | % | 14,138,138 | 24 | % | |||||||||||||
Long-term debt | 2,936,563 | 2,245,201 | 31 | % | 249,553 | 800 | % | |||||||||||||
Stockholders’ equity | 8,595,730 | 8,942,035 | -4 | % | 8,778,397 | 2 | % | |||||||||||||
Per Share of Common Stock | ||||||||||||||||||||
Income from continuing operations – diluted | $ | 4.69 | $ | 4.14 | 13 | % | $ | 2.77 | 49 | % | ||||||||||
Net income – diluted | 5.94 | 4.99 | 19 | % | 4.49 | 11 | % | |||||||||||||
Cash dividends paid – normal | 1.25 | 1.175 | 6 | % | 1.10 | 7 | % | |||||||||||||
– special | — | 2.50 | N/A | — | N/A | |||||||||||||||
Stockholders’ equity | 46.87 | 46.91 | 0 | % | 45.31 | 4 | % | |||||||||||||
Net Crude Oil and Gas Liquids Produced – barrels per day | 135,078 | 112,591 | 20 | % | 103,160 | 9 | % | |||||||||||||
United States | 48,387 | 26,090 | 85 | % | 17,148 | 52 | % | |||||||||||||
Canada | 31,231 | 28,302 | 10 | % | 30,049 | -6 | % | |||||||||||||
Malaysia | 53,766 | 52,663 | 2 | % | 48,551 | 8 | % | |||||||||||||
Other International | 1,694 | 5,536 | -69 | % | 7,412 | -25 | % | |||||||||||||
Net Natural Gas Sold – thousands of cubic feet per day | 423,846 | 490,124 | -14 | % | 457,365 | 7 | % | |||||||||||||
United States | 53,212 | 52,962 | 0 | % | 47,212 | 12 | % | |||||||||||||
Canada | 175,449 | 217,046 | -19 | % | 188,787 | 15 | % | |||||||||||||
Malaysia | 194,370 | 216,745 | -10 | % | 217,440 | 0 | % | |||||||||||||
United Kingdom | 815 | 3,371 | -76 | % | 3,926 | -14 | % | |||||||||||||
Stockholder and Employee Data at December 31 | ||||||||||||||||||||
Common shares outstanding (thousands) | 183,407 | 190,641 | -4 | % | 193,723 | -2 | % | |||||||||||||
Number of stockholders of record | 2,598 | 2,361 | 10 | % | 2,212 | 7 | % | |||||||||||||
Number of employees | 1,875 | 9,185 | -80 | % | 8,610 | 7 | % | |||||||||||||
Murphy Oil at a Glance
Murphy Oil Corporation (“Murphy” or “the Company”) is an international oil and gas company that conducts business through various operating subsidiaries.
The Company produces oil and/or natural gas in the United States, Canada and Malaysia and conducts exploration activities worldwide. Murphy also has an interest in a Canadian synthetic oil operation. The Company currently owns a petroleum refinery and markets petroleum products in the United Kingdom. The Company has announced its intention to sell its U.K. downstream operations. Murphy is headquartered
in El Dorado, Arkansas, and has 1,875 employees worldwide. The Company’s common stock is traded on the New York Stock Exchange (NYSE) under the ticker symbol “MUR”.
On August 30, 2013, the Company completed the separation of its U.S. downstream business. The separate, publicly owned company is known as Murphy USA Inc. and is traded on the NYSE under the ticker symbol “MUSA.”
Major Subsidiaries of Murphy Oil Corporation
Murphy Exploration & Production Company, through various operating subsidiaries and affiliates, is engaged in crude oil and natural gas production activities in the United States and Malaysia, and explores for oil and natural gas worldwide. The subsidiary has its headquarters in Houston, Texas, and conducts business from offices in numerous locations around the world.
Murphy Oil Company Ltd. is engaged in crude oil and natural gas exploration and production in Western Canada and offshore Eastern Canada as well as the production
of synthetic crude oil from oil sands. The subsidiary’s office is located in Calgary, Alberta, and is operated as a component of the Company’s worldwide exploration and production operation directed from Houston.
Murco Petroleum Limited is engaged in refining and marketing of petroleum products in the United Kingdom. Headquartered at St. Albans, England, Murco owns a refinery in Milford Haven, Wales, and operates a network of fueling stations in the United Kingdom. The Company has announced its intention to sell these U.K. operations.
| Offices | ||||
| El Dorado, Arkansas | St. Albans, Hertfordshire, England | Ho Chi Minh City, Vietnam | ||
| Houston, Texas | Pointe-Noire, Republic of the Congo | Douala, Cameroon | ||
| Calgary, Alberta, Canada | Perth, Western Australia, Australia | Malabo, Equatorial Guinea | ||
| Kuala Lumpur, Malaysia | Jakarta, Indonesia | Paramaribo, Suriname | ||
1
Dear Fellow Shareholders
As I reflect back on 2013, it was clearly an important year for our Company as well as a rewarding one for our shareholders. There were many highlights throughout the year headlined by the spin-off of Murphy USA Inc. We had excellent performance in Health, Safety & Environmental (HSE), exceeded production guidance, increased our proved reserves at a record pace, executed development projects and continued to grow production in our Eagle Ford Shale (EFS) asset. Our strategy of executing a global offshore portfolio that is complemented by a strong North American (NA) onshore business with a new legacy asset in the EFS will position Murphy’s shareholders well for the future.
We achieved our best ever annual safety performance year led by continued improvement in the NA onshore business and safely executed offshore development work in Malaysia along with continued outstanding performance at our Milford Haven Refinery in Wales.
Production for 2013 averaged over 205,000 barrels of oil equivalent per day (boepd), a record for our company. Production was 6% higher than 2012 and is the first year in our history where we have averaged in excess of 200,000 boepd. The price for nearly 80% of our production is based on oil prices. Murphy has a five-year compound annual production growth rate of 10%, which puts us in elite company amongst our oil company peers. The production increases were led by the growth in the EFS where we averaged over 39,000 boepd for the year, an increase of 150 percent from 2012. EFS is now the second ranked field on an overall production basis in the Company. We expect another year of strong production growth in 2014 with continued increases coming from the EFS, a full year of production from our new Malaysia developments, and the start up of the Dalmatian field in the Gulf of Mexico (GOM). |
Roger W. Jenkins President and Chief Executive Officer | |
Reserves replacement for 2013 was our highest ever with an organic replacement rate of over 240%. Our year-end 2013 proved reserves of approximately 688 million barrels of oil equivalent raise our reserves production life to just over nine years.
We revamped our exploration program in 2013 by reorganizing the management team under the leadership of Kevin McLachlan who joined Murphy in April. Kevin has brought a new focus and strategy to our program that will yield results for our shareholders. In 2013 we had three discoveries out of nine wells drilled with these successes encountering natural gas offshore Brunei in Block CA-2 where we hold a 30% working interest. These discoveries, along with our recently announced sanction of the Block H Malaysia Floating Liquified Natural Gas project, further coupled with our current Sarawak gas project, will lead to long-term gas production with oil-linked pricing for upwards of 20 years into the future.
Our 2014 exploration drilling program will include another active year, highlighted by a Norphlet formation test at our Titan prospect in the GOM and the Bamboo well offshore Cameroon. We continued to replenish our prospect inventory with new country entries in the Atlantic Margin and new frontier blocks in Vietnam and Australia, where we partnered to acquire a large block in the under-explored Ceduna Basin. Murphy has a vast acreage position for a company of our size and our strategy to primarily grow organically through exploration, now supported by a strong NA onshore position, will have long term benefits for our shareholders. Our continued reserves additions and production growth prove this strategy is working. | ||

2
In our global offshore business, we brought five new shallow water fields offshore Malaysia online, namely oil fields at Patricia, Serendah, South Acis and Permas and a gas field at Merapuh. These fields were brought on stream on time and on budget, and initial production has performed above expectations. We have three deepwater developments coming on production in 2014. Two of these are in Malaysia, including Siakap North-Petai and the main Kakap-Gumusut non-operated field. The third is in the GOM at the Dalmatian project which starts up in the first quarter of this year. In the first half of 2013, we closed on the sale of our U.K. upstream assets, as part of the continuous review of our global portfolio.
In our NA onshore business, the EFS continues to deliver excellent results and is on track to become the most significant field in Company history, with resource potential now in excess of 600 million barrels equivalent. We now have over 300 wells on production, a remarkable feat considering we had zero in 2009 and testament to an outstanding job by our team in developing this asset. We are expanding our down spacing work along with further technical enhancements to this “well manufacturing” process. With current down spacing plans, we will have over 1,400 locations remaining to drill, which sets up a ten year drilling program in the area. At Seal in Canada, we are moving forward with our Enhanced Oil Recovery (EOR) pilot projects. We see the Seal area as a long-term growth opportunity for the Company and we expect to see production increases towards the end of 2017 when we anticipate an improved long-term market for this heavy crude. Syncrude remains a key part of our complementary onshore business as it continues to produce with anticipated long-term reserves growth.
Our strategy of blending a high margin global offshore business with the balance and predictable nature of our NA onshore operation remains sound. The two businesses complement each other well. Our growth in the NA onshore has provided significant improvement in production per well metrics. Our ability to deliver and operate offshore developments is our calling card to obtain quality acreage and attract exploration partners. The global offshore business further allows our shareholders exposure to exploration success that I believe will be meaningful for a company of our size.
In downstream, we completed the spin-off of the U.S. retail gasoline business, Murphy USA Inc., in the third quarter. The separation was smooth and seamless and we wish Murphy USA Inc. all the best as they venture forth on their own. The sales process for our U.K. downstream assets continues and we are working to get this sale completed as soon as possible. I commend the effort of our U.K. based employees as they focus on safe, reliable operations in a difficult market environment.
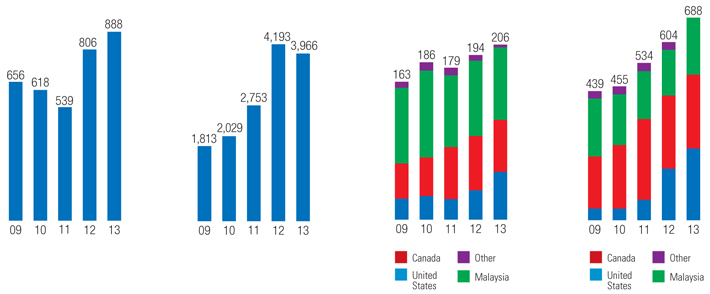
| Income from | Capital Expenditures for | Net Hydrocarbons | Estimated Net Proved | |||||
| Continuing Operations | Continuing Operations | Produced | Hydrocarbon Reserves | |||||
| (Millions of dollars) | (Millions of dollars) | (Thousands of oil equivalent | (Millions of oil equivalent barrels) | |||||
| barrels per day) |
3
In other shareholder initiatives, the Company moved forward on the approved $1 billion share repurchase program during the year. We recently completed the third tranche of $250 million share repurchase in January 2014 and have initiated another tranche of $250 million in February 2014. I see this share repurchase initiative as critical for our shareholders as we tie these purchases to the value of our proven oil-weighted reserve base as compared to global finding and developing cost benchmarks. I see the use of share repurchases as a capital allocation comparison tool going forward.
In financial results, net income for 2013 totaled $1,123 million ($5.94 per diluted share), which is the second highest on record, and up more than $152 million from 2012. Our balance sheet remains strong, ending the year with a debt-to-capital-employed ratio of 25.5%. Overall our year-end net debt to total capitalization is in very good shape amongst our E&P peers at 17.4% with total debt of $2.94 billion and global cash and invested cash of $1.12 billion. In an effort to protect cash flow and maintain our capital programs we implemented a hedging strategy in 2013 and are carrying it forward into 2014. So far in 2014, we have hedged approximately 40% of our U.S. onshore oil production at a WTI basis of over $97 per barrel for the first half of the year and 75% of our Canadian gas production for the full year at just over C$4.00 per thousand cubic feet at AECO prices.
I would like to recognize the contribution of Steven A. Cossé who retired as President and Chief Executive Officer on August 30, 2013. We owe a debt of gratitude to Steve for leading us through the repositioning of our Company. Steve will remain on the Board of Directors and we look forward to his continued sage guidance.
In August 2013, the Board added an experienced new director in T. Jay Collins, Retired President and CEO of Oceaneering International, Inc. We welcome Jay to the Board and look forward to his contributions.
Two of our Directors, Robert A. Hermes and David J.H. Smith, are retiring from the Board in May. Among multiple other roles, Bob was a member of the Executive Committee and chaired our Nominating & Governance Committee, and he greatly assisted in the process that culminated in the spin-off of Murphy USA Inc. David did yeoman’s work as chairman of our Executive Compensation Committee for many years as well as serving on the HSE Committee. Bob and David will be missed and we thank them for their many years of faithful service to our Company.
Murphy Oil is an exploration driven company with super-major offshore development ability now coupled with a newly developed NA onshore capability. These attributes make us an attractive global partner. We have a strong balance sheet that positions us well for the long term and have delivered double digit growth in production and reserves, plus continued dividend increases, over the last five years. I am honored to be handed the reins to lead Murphy into a new phase as an independent exploration and production company. I appreciate your continued support as our Company moves forward. We have the people, assets and processes in place to deliver returns to our shareholders.

Roger W. Jenkins
President and Chief Executive Officer
February 7, 2014
El Dorado, Arkansas
4
Exploration and Production Statistical Summary
| 2013 | 2012 | 2011 | 2010 | 2009 | 2008 | 2007 | ||||||||||||||||||||||
Net crude oil, condensate and natural gas liquids production – barrels per day | ||||||||||||||||||||||||||||
United States | 48,387 | 26,090 | 17,148 | 20,114 | 17,053 | 10,668 | 12,989 | |||||||||||||||||||||
Canada – light | 118 | 245 | 83 | 43 | 18 | 46 | 596 | |||||||||||||||||||||
heavy | 9,128 | 7,241 | 7,264 | 5,988 | 6,813 | 8,484 | 11,524 | |||||||||||||||||||||
offshore | 9,099 | 6,986 | 9,204 | 11,497 | 12,357 | 16,826 | 18,871 | |||||||||||||||||||||
synthetic | 12,886 | 13,830 | 13,498 | 13,273 | 12,855 | 12,546 | 12,948 | |||||||||||||||||||||
Malaysia | 53,766 | 52,663 | 48,551 | 66,897 | 76,322 | 57,403 | 20,367 | |||||||||||||||||||||
Republic of the Congo | 1,046 | 2,078 | 4,989 | 5,820 | 1,743 | — | — | |||||||||||||||||||||
Continuing operations | 134,430 | 109,133 | 100,737 | 123,632 | 127,161 | 105,973 | 77,295 | |||||||||||||||||||||
Discontinued operations | 648 | 3,458 | 2,423 | 3,295 | 4,678 | 12,281 | 14,227 | |||||||||||||||||||||
Total liquids produced | 135,078 | 112,591 | 103,160 | 126,927 | 131,839 | 118,254 | 91,522 | |||||||||||||||||||||
Net crude oil, condensate and natural gas liquids sold – barrels per day | ||||||||||||||||||||||||||||
United States | 48,387 | 26,090 | 17,148 | 20,114 | 17,053 | 10,668 | 12,989 | |||||||||||||||||||||
Canada – light | 118 | 245 | 83 | 43 | 18 | 46 | 596 | |||||||||||||||||||||
heavy | 9,128 | 7,241 | 7,264 | 5,988 | 6,813 | 8,484 | 11,524 | |||||||||||||||||||||
offshore | 8,586 | 7,092 | 9,079 | 11,343 | 12,455 | 16,690 | 18,839 | |||||||||||||||||||||
synthetic | 12,886 | 13,830 | 13,498 | 13,273 | 12,855 | 12,546 | 12,948 | |||||||||||||||||||||
Malaysia | 54,276 | 54,286 | 48,092 | 68,975 | 72,575 | 61,907 | 16,018 | |||||||||||||||||||||
Republic of the Congo | 2,093 | 1,468 | 3,959 | 5,428 | 973 | — | — | |||||||||||||||||||||
Continuing operations | 135,474 | 110,252 | 99,123 | 125,164 | 122,742 | 110,341 | 72,914 | |||||||||||||||||||||
Discontinued operations | 621 | 3,372 | 2,299 | 4,177 | 3,607 | 13,513 | 14,688 | |||||||||||||||||||||
Total liquids sold | 136,095 | 113,624 | 101,422 | 129,341 | 126,349 | 123,854 | 87,602 | |||||||||||||||||||||
Net natural gas sold – thousands of cubic feet per day | ||||||||||||||||||||||||||||
United States | 53,212 | 52,962 | 47,212 | 53,037 | 54,255 | 45,785 | 45,139 | |||||||||||||||||||||
Canada | 175,449 | 217,046 | 188,787 | 85,563 | 54,857 | 1,910 | 9,922 | |||||||||||||||||||||
Malaysia – Sarawak | 164,671 | 174,283 | 176,943 | 154,535 | 28,070 | — | — | |||||||||||||||||||||
Kikeh | 29,699 | 42,462 | 40,497 | 58,157 | 46,583 | 1,399 | — | |||||||||||||||||||||
Continuing operations | 423,031 | 486,753 | 453,439 | 351,292 | 183,765 | 49,094 | 55,061 | |||||||||||||||||||||
Discontinued operations | 815 | 3,371 | 3,926 | 5,509 | 3,501 | 6,424 | 6,021 | |||||||||||||||||||||
Total natural gas sold | 423,846 | 490,124 | 457,365 | 356,801 | 187,266 | 55,518 | 61,082 | |||||||||||||||||||||
Net hydrocarbons produced – equivalent barrels1per day | 205,719 | 194,278 | 179,388 | 186,394 | 163,050 | 127,507 | 101,702 | |||||||||||||||||||||
Estimated net hydrocarbon reserves – million equivalent barrels1,2 | 687.9 | 604.3 | 534.1 | 455.2 | 439.2 | 402.8 | 405.1 | |||||||||||||||||||||
Weighted average sales prices3 | ||||||||||||||||||||||||||||
Crude oil, condensate and natural gas liquids – dollars per barrel | ||||||||||||||||||||||||||||
United States | $ | 97.69 | 102.60 | 103.92 | 76.31 | 60.08 | 95.74 | 65.57 | ||||||||||||||||||||
Canada4– light | 85.61 | 81.22 | 94.28 | 75.48 | 64.24 | 70.37 | 50.98 | |||||||||||||||||||||
heavy | 46.80 | 46.45 | 57.00 | 49.89 | 40.45 | 59.05 | 32.84 | |||||||||||||||||||||
offshore | 108.64 | 112.08 | 110.02 | 76.87 | 58.19 | 96.69 | 69.83 | |||||||||||||||||||||
synthetic | 96.09 | 91.85 | 102.94 | 77.90 | 61.49 | 100.10 | 74.35 | |||||||||||||||||||||
Malaysia5 | 94.27 | 97.29 | 90.14 | 60.97 | 55.51 | 87.83 | 74.58 | |||||||||||||||||||||
Republic of the Congo5 | 109.43 | 107.26 | 103.02 | 74.87 | 69.04 | — | — | |||||||||||||||||||||
Natural gas – dollars per thousand cubic feet | ||||||||||||||||||||||||||||
United States | 3.83 | 2.76 | 4.13 | 4.52 | 4.05 | 9.67 | 7.38 | |||||||||||||||||||||
Canada4 | 3.09 | 2.62 | 4.07 | 4.23 | 3.09 | 6.40 | 6.34 | |||||||||||||||||||||
Malaysia – Sarawak5 | 6.66 | 7.50 | 7.10 | 5.31 | 4.05 | — | — | |||||||||||||||||||||
Kikeh | 0.24 | 0.24 | 0.24 | 0.23 | 0.23 | 0.23 | — | |||||||||||||||||||||
| 1 | Natural gas converted at a 6:1 ratio. |
| 2 | At December 31. |
| 3 | Includes intracompany transfers at market prices. |
| 4 | U.S. dollar equivalent. |
| 5 | Prices are net of payments under the terms of the respective production sharing contracts. |
5
U.K. Refining and Marketing Statistical Summary–Discontinued Operations
| 2013 | 2012 | 2011 | 2010 | 2009 | 2008 | 2007 | ||||||||||||||||||||||
United Kingdom refining and marketing – Unit margins per barrel | $ | (0.75 | ) | 1.94 | (0.67 | ) | (1.47 | ) | (0.28 | ) | 3.41 | (1.48 | ) | |||||||||||||||
Petroleum products sold in the United Kingdom – barrels per day | ||||||||||||||||||||||||||||
Gasoline | 49,389 | 47,087 | 35,757 | 23,085 | 30,007 | 34,125 | 14,356 | |||||||||||||||||||||
Kerosine | 16,498 | 17,273 | 16,298 | 11,387 | 12,954 | 14,835 | 4,020 | |||||||||||||||||||||
Diesel and home heating oils | 49,378 | 48,595 | 48,893 | 29,710 | 35,721 | 34,560 | 14,785 | |||||||||||||||||||||
Residuals | 12,863 | 13,744 | 14,427 | 7,885 | 10,560 | 12,744 | 3,728 | |||||||||||||||||||||
LPG and other | 4,346 | 10,350 | 20,322 | 14,590 | 14,532 | 15,246 | 4,213 | |||||||||||||||||||||
Total | 132,474 | 137,049 | 135,697 | 86,657 | 103,774 | 111,510 | 41,102 | |||||||||||||||||||||
Crude capacity of Milford Haven, Wales refinery* – barrels per stream day | 135,000 | 135,000 | 135,000 | 135,000 | 108,000 | 108,000 | 108,000 | |||||||||||||||||||||
Milford Haven, Wales refinery inputs – barrels per day | ||||||||||||||||||||||||||||
Crude | 122,930 | 129,334 | 131,959 | 78,841 | 96,625 | 97,521 | 36,000 | |||||||||||||||||||||
Other feedstocks | 3,330 | 3,279 | 3,432 | 5,322 | 6,334 | 15,067 | 3,756 | |||||||||||||||||||||
Total U.K. refinery inputs | 126,260 | 132,613 | 135,391 | 84,163 | 102,959 | 112,588 | 39,756 | |||||||||||||||||||||
Milford Haven, Wales refinery yields – barrels per day | ||||||||||||||||||||||||||||
Gasoline | 47,025 | 46,100 | 34,171 | 20,889 | 26,902 | 32,290 | 12,397 | |||||||||||||||||||||
Kerosine | 17,056 | 16,941 | 17,038 | 11,374 | 13,789 | 15,065 | 4,500 | |||||||||||||||||||||
Diesel and home heating oils | 46,327 | 46,004 | 47,418 | 25,995 | 34,619 | 33,868 | 14,218 | |||||||||||||||||||||
Residuals | 12,508 | 13,922 | 14,185 | 8,296 | 10,388 | 12,585 | 3,641 | |||||||||||||||||||||
LPG and other | 244 | 5,976 | 19,448 | 14,799 | 13,735 | 15,750 | 4,344 | |||||||||||||||||||||
Fuel and loss | 3,100 | 3,670 | 3,131 | 2,810 | 3,526 | 3,030 | 656 | |||||||||||||||||||||
Total U.K. refining yields | 126,260 | 132,613 | 135,391 | 84,163 | 102,959 | 112,588 | 39,756 | |||||||||||||||||||||
| * | At December 31. |
6
Board of Directors
 | Claiborne P. Deming President and Chief Executive Officer, Retired, Murphy Oil Corporation, El Dorado, Arkansas. Director since 1993. Chairman of the Board since March 2012. Committees: Executive (Chair); Health, Safety & Environmental |  | Walentin Mirosh President, Mircan Resources Ltd., Calgary, Alberta, Canada. Director since 2011. Committees: Executive Compensation; Health, Safety & Environmental | |||
 | Roger W. Jenkins President and Chief Executive Officer, Murphy Oil Corporation, El Dorado, Arkansas. Director since 2013. Committees: Executive |  | R. Madison Murphy Managing Member, Murphy Family Management, LLC, El Dorado, Arkansas. Director since 1993. Chairman from 1994–2002. Committees: Executive; Audit (Chair) | |||
 | Frank W. Blue International Legal Advisor/Arbitrator, Santa Barbara, California. Director since 2003. Committees: Audit; Nominating & Governance (Chair) |  | Jeffrey W. Nolan President and Chief Executive Officer, Loutre Land and Timber Company, El Dorado, Arkansas. Director since 2012. Committees: Executive Compensation; Nominating & Governance | |||
 | T. Jay Collins President and Chief Executive Officer, Retired, Oceaneering International, Inc., Houston, Texas. Director since 2013. Committees: Executive Compensation |  | Neal E. Schmale President and Chief Operating Officer, Retired, Sempra Energy, San Diego, California. Director since 2004. Committees: Audit; Executive Compensation (Chair) | |||
 | Steven A. Cossé President and Chief Executive Officer, Retired, Murphy Oil Corporation, El Dorado, Arkansas. Director since 2011. Committees: Executive; Health, Safety & Environmental |  | David J. H. Smith Chief Executive Officer, Retired, Whatman plc, Maidstone, Kent, England. Director since 2001. Committees: Executive Compensation; Nominating & Governance | |||
 | Robert A. Hermes Chairman of the Board, Retired, Purvin & Gertz, Inc., Houston, Texas. Director since 1999. Committees: Nominating & Governance; Health, Safety & Environmental |  | Caroline G. Theus President, Inglewood Land & Development Co., Alexandria, Louisiana. Director since 1985. Committees: Executive; Health, Safety & Environmental (Chair) | |||
 | James V. Kelley President and Chief Operating Officer, BancorpSouth, Inc., Tupelo, Mississippi. Director since 2006. Committees: Audit; Executive; Nominating & Governance | |||||
7
Murphy Oil Corporation Officers
| Roger W. Jenkins | John W. Eckart | Allan J. Misner | ||
| President and Chief Executive Officer | Senior Vice President and Controller | Vice President, Internal Audit | ||
| Kevin G. Fitzgerald | Kelli M. Hammock | K. Todd Montgomery | ||
| Executive Vice President and Chief Financial Officer | Senior Vice President, Administration | Vice President, Corporate Planning & Services | ||
| Walter K. Compton | Tim F. Butler | E. Ted Botner | ||
| Executive Vice President and General Counsel | Vice President, Tax | Secretary | ||
| Thomas McKinlay | John W. Dumas | John B. Gardner | ||
| Executive Vice President, U.K. Downstream | Vice President, Corporate Insurance | Treasurer | ||
| Bill H. Stobaugh | Barry F.R. Jeffery | |||
| Executive Vice President | Vice President, Investor Relations | |||
| Principal Subsidiaries | ||||
| Murphy Exploration & | Roger W. Jenkins | Keith S. Caldwell | ||
| Production Company | President | Vice President, Finance | ||
Engages in worldwide crude oil and natural gas exploration and production. |
Eugene T. Coleman Executive Vice President, Offshore and International Operations |
Bradley Gouge Vice President, Canada | ||
9805 Katy Freeway Suite G200 Houston, Texas 77024 (281) 675-9000 |
Michael K. McFadyen Executive Vice President, North American Onshore Operations |
Maria A. Martinez Vice President, Human Resources and Administration | ||
| Kevin J. McLachlan | Walter K. Compton | |||
| Executive Vice President, | Vice President and General Counsel | |||
| Global Exploration |
Kevin G. Fitzgerald Vice President
John W. Eckart | |||
Daniel R. Hanchera Senior Vice President, Business Development | ||||
| Vice President | ||||
| Eric M. Hambly | E. Ted Botner | |||
| Senior Vice President, S.E. Asia/Australia | Secretary | |||
| Thomas J. Mireles | John B. Gardner | |||
| Senior Vice President, North America, | Treasurer | |||
| South America and West Africa | ||||
| Murphy Oil Company Ltd. | Michael K. McFadyen | Dennis D. Ward | ||
| Engages in crude oil and natural gas exploration and production, and extraction and sale of synthetic crude oil in Canada. | President | Vice President, Finance | ||
Cal C. Buchanan |
Kevin G. Fitzgerald | |||
| Vice President, Joint Ventures & | Vice President | |||
| Business Development | ||||
| 4000, 520-3 Avenue SW | Brad A. Gouge | Paul Christensen | ||
| Calgary, Alberta T2P 0R3 | Vice President | Controller | ||
| (403) 294-8000 | ||||
| Ronald L. McIlwrick | Kevin Black | |||
| Vice President, Operations | Secretary | |||
| Mailing Address: | John B. Gardner | |||
| P.O. Box 2721, Station M | Treasurer | |||
| Calgary, Alberta T2P 3Y3 | ||||
| Canada | ||||
| Murco Petroleum Limited | Thomas McKinlay | Susan Hogg | ||
Engages in refining and marketing of petroleum products in the United Kingdom. | Managing Director
John E. Ford Planning & Special Projects Director | Supply and Refining Director
Simon V. Rhodes Financial Director | ||
| 4 Beaconsfield Road | ||||
| St. Albans, Hertfordshire | Jamie Goodfellow | Patricia E. Haylock | ||
| AL1 3RH, England | Marketing Director | Secretary | ||
| 44-1727-892-400 | ||||
8
Corporate Information
Corporate Office
200 Peach Street
P.O. Box 7000
El Dorado, Arkansas 71731-7000
(870) 862-6411
Stock Exchange Listings
Trading Symbol: MUR
New York Stock Exchange
Transfer Agent and Registrar
Computershare Trust Company, N.A.
Toll-free (888) 239-5303
(732) 645-4155
(Address for overnight delivery)
211 Quality Circle
Suite 210
College Station, TX 77845
(Address for first class mail,
registered mail and certified mail)
P.O. Box 30170
College Station, TX 77842-3170
Electronic Payment of Dividends
Shareholders may have dividends deposited directly into their bank accounts by electronic funds transfer. Authorization forms may be obtained by contacting Computershare as described under Transfer Agent and Registrar above.
E-mail Address
murphyoil@murphyoilcorp.com
Web Site
www.murphyoilcorp.com
Murphy Oil’s website provides frequently updated information about the Company and its operations, including:
| • | News releases |
| • | Annual report |
| • | Quarterly reports |
| • | Live webcasts of quarterly conference calls |
| • | Links to the Company’s SEC filings |
| • | Stock quotes |
| • | Profiles of the Company’s operations |
Annual Meeting
The annual meeting of the Company’s stockholders will be held at 10:00 a.m. on May 14, 2014, at the South Arkansas Arts Center, 110 East 5th Street, El Dorado, Arkansas. A formal notice of the meeting, together with a proxy statement and proxy form, will be provided to all shareholders.
Inquiries
Inquiries regarding shareholder account matters should be
addressed to:
E. Ted Botner
Manager, Law and Corporate Secretary
Murphy Oil Corporation
P.O. Box 7000
El Dorado, Arkansas 71731-7000
tbotner@murphyoilcorp.com
Members of the financial community should direct their inquiries to:
Barry Jeffery
Vice President, Investor Relations
Murphy Oil Corporation
P.O. Box 7000
El Dorado, Arkansas 71731-7000
(870) 864-6501
bjeffery@murphyoilcorp.com