
Q2 2023 Investor Presentation August 8, 2023
2 Safe Harbor This presentation may contain certain forward-looking statements about Arrow Financial Corporation (“Arrow” or the “Company”). Forward-looking statements, as defined in Section 21E of the Securities Exchange Act of 1934, as amended, include statements regarding anticipated future events and can be identified by the fact that they do not relate strictly to historical or current facts. They often include words such as “believe,” “expect,” “would,” “should,” “could,” or “may.” Forward-looking statements, by their nature, are subject to risks and uncertainties. Certain factors that could cause actual results to differ materially from expected results include increased competitive pressures, changes in the interest rate environment, general economic conditions or conditions within the banking industry or securities markets, and legislative and regulatory changes that could adversely affect the business in which the Company and its subsidiaries are engaged. We are not obligated to revise or update these statements to reflect unanticipated events. This document should be read in conjunction with Company’s Annual Report on Form 10-K for the year ended December 31, 2022 (the “2022 10-K”), the Quarterly Report on Form 10-Q for the quarter ended June 30, 2023, other filings with the SEC, and the second quarter 2023 earnings release issued August 8, 2023.
3 Table of Contents • Arrow History and Overview • Q2 2023 Results and Performance Metrics • Funding Sources, Investments and Liquidity • Non-Interest Income • Loans • Credit Quality • Capital

History and Overview 4
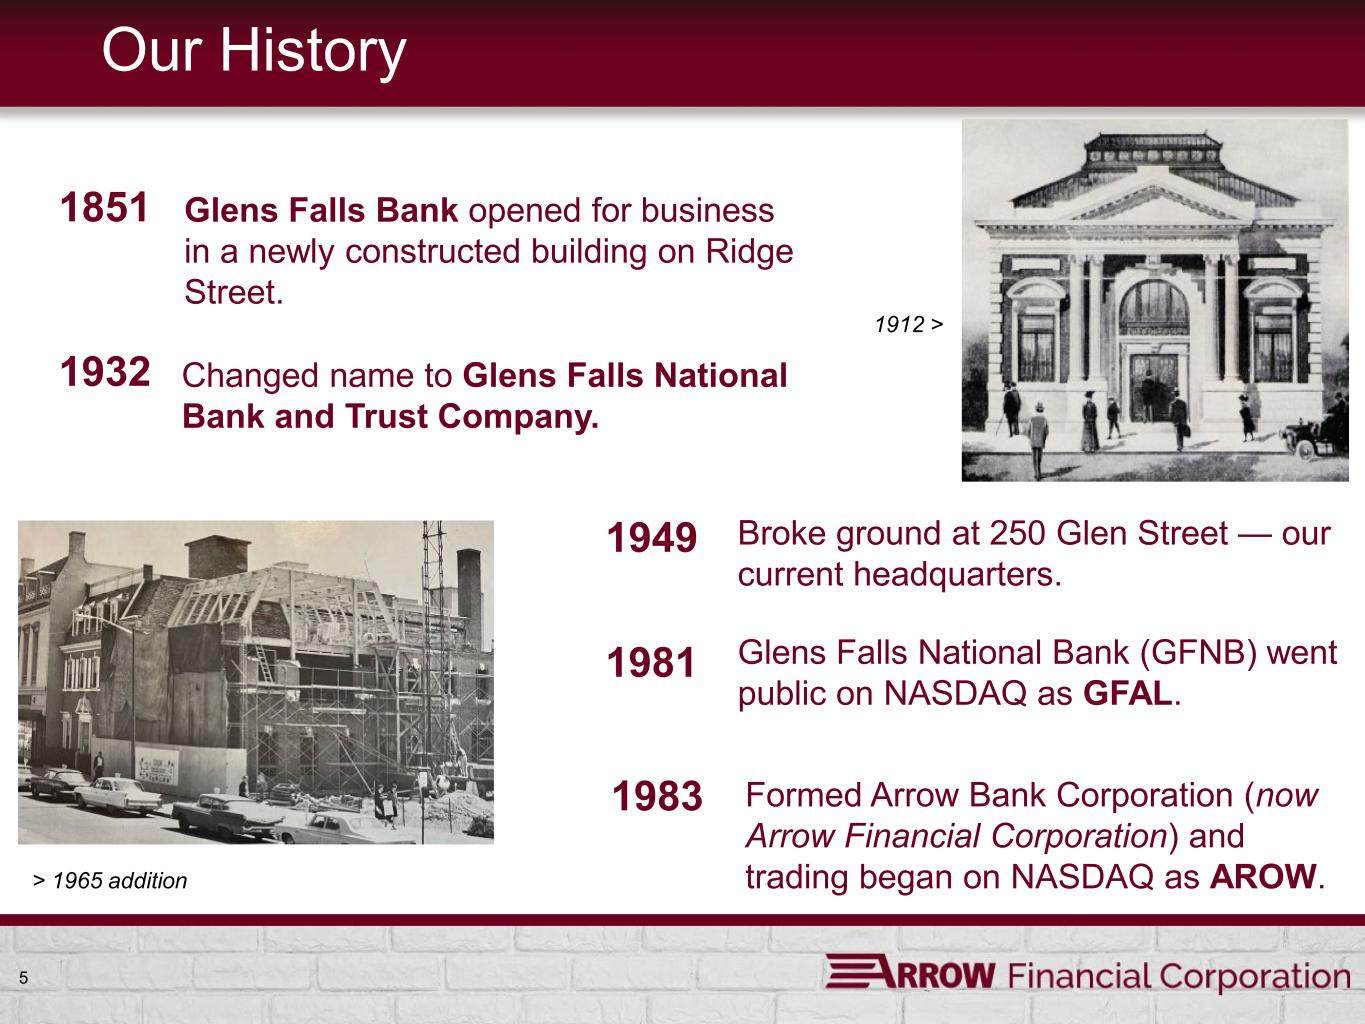
5 Our History 1851 Glens Falls Bank opened for business in a newly constructed building on Ridge Street. 1932 1912 > 1949 Changed name to Glens Falls National Bank and Trust Company. Broke ground at 250 Glen Street — our current headquarters. > 1965 addition 1981 Glens Falls National Bank (GFNB) went public on NASDAQ as GFAL. 1983 Formed Arrow Bank Corporation (now Arrow Financial Corporation) and trading began on NASDAQ as AROW.
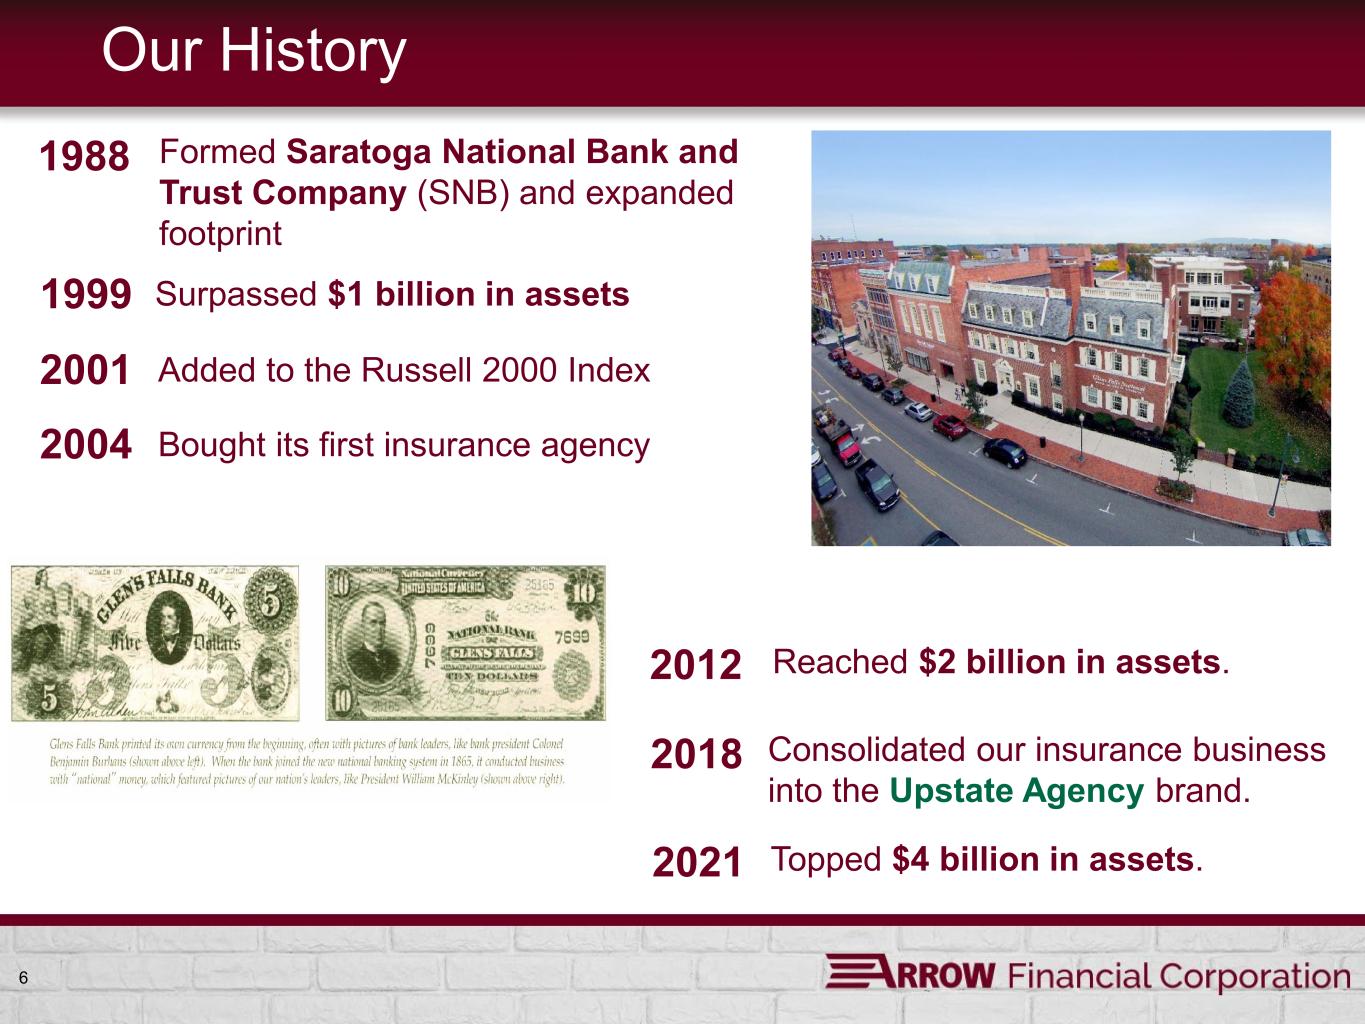
6 Our History 1988 Formed Saratoga National Bank and Trust Company (SNB) and expanded footprint 1999 Surpassed $1 billion in assets 2004 2021 Bought its first insurance agency Topped $4 billion in assets. 2018 Consolidated our insurance business into the Upstate Agency brand. 2012 Reached $2 billion in assets. 2001 Added to the Russell 2000 Index
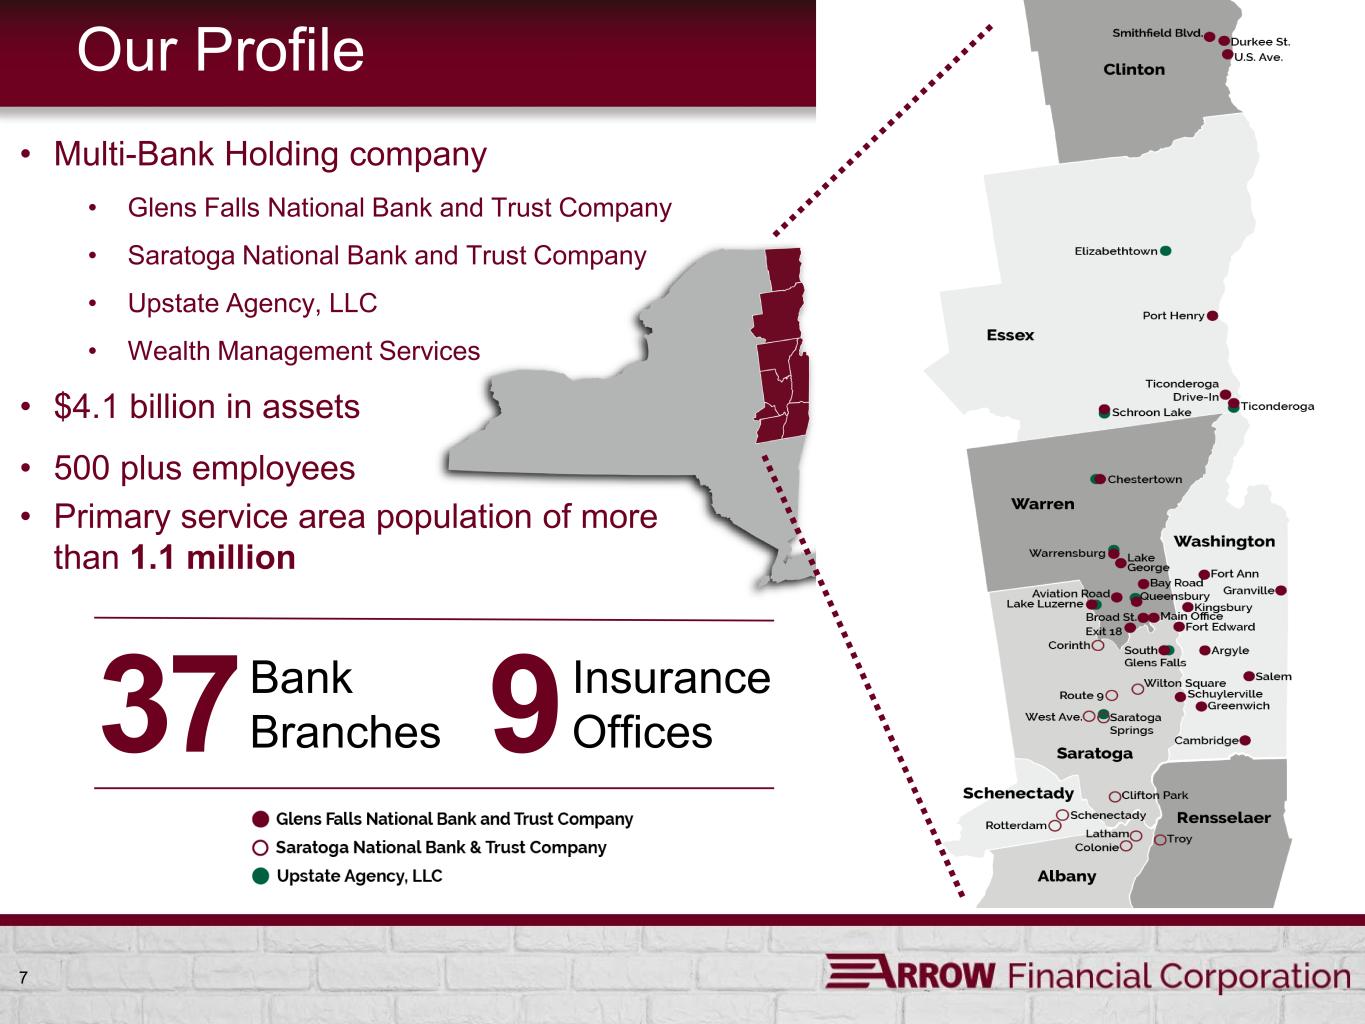
7 Our Profile Insurance Offices Bank Branches 937 • Multi-Bank Holding company • Glens Falls National Bank and Trust Company • Saratoga National Bank and Trust Company • Upstate Agency, LLC • Wealth Management Services • $4.1 billion in assets • 500 plus employees • Primary service area population of more than 1.1 million

8 Experienced Leadership Team David S. DeMarco, President and CEO 35+ Years Experience Mr. DeMarco joined the Company in 1987 as a commercial lender and since that time has served in positions of increasing responsibility within the organization. In 2012, he was named President and CEO of Saratoga National Bank. In May 2023, he was named President and CEO of Arrow Financial Corporation and Glens Falls National Bank. He holds a bachelor’s degree in finance from the University of Texas at Austin. Mr. DeMarco is a graduate of the Adirondack Regional Chamber of Commerce’s Leadership Program and the Stonier Graduate School of Banking. He serves as a Director of Saratoga National Bank and sits on the boards of various non- profits dedicated to healthcare and economic development. David D. Kaiser, Senior Executive Vice President and CCO 35+ Years Experience Mr. Kaiser joined the Company in 2001 as Vice President and Commercial Loan Officer. He served as Corporate Banking Manager and was later promoted to Senior Vice President, before being named Chief Credit Officer in 2011, followed by promotions to Executive Vice President and Senior Executive Vice President. Prior to joining the Company, he spent 15 years in the Capital Region as a Commercial Loan Officer. Mr. Kaiser has a bachelor’s degree in business administration from Siena College. Mr. Kaiser actively serves on boards of numerous community organizations. Andrew J. Wise, Senior Executive Vice President and COO 30+ Years Experience Mr. Wise joined the Company in 2016 as Senior Vice President of Administration for Glens Falls National Bank. He has since been promoted to Executive Vice President and Chief Operating Officer and Senior Executive Vice President. He has more than 30 years of experience building and leading both community banks and bank-owned insurance agencies. Mr. Wise previously served as Vice President and CISO for The Adirondack Trust Company and acted as Executive Vice President, COO for Wise Insurance Brokers, Inc. He has extensive experience in designing, implementing and managing workflows and delivering operational efficiency. He holds a bachelor’s degree from Boston University’s School of Management.

9 Experienced Leadership Team Penko K. Ivanov, Senior Executive Vice President, CFO, Treasurer and CAO 30+ Years Experience Mr. Ivanov joined the Company in 2023 with more than 30 years of experience in Financial Planning & Analysis, Controllership, SOX, Financial Reporting and Treasury. Mr. Ivanov previously served as CFO for Bankwell Financial Group, helping it almost double in size over six-plus years to $3.3 billion. He has held CFO positions at Darien Rowayton Bank and for Doral Bank’s U.S. Operations. He began his career with Ernst & Young and held accounting/finance positions at PepsiCo, GE Capital and Bridgewater Associates. Mr. Ivanov holds an MBA and bachelor’s degree in accounting and finance from the University of South Florida. He is also Six Sigma Black Belt certified. Marc Yrsha, Executive Vice President, Director of Relationship Banking 20+ Years Experience Mr. Yrsha joined the Company in 2015. He currently is the Chief Banking Officer, and oversees the strategic direction of the Retail Banking unit, which includes retail deposits and lending, business development, consumer payments, business services, municipal banking, as well as small business and retail lending. Prior to joining our Company, Mr. Yrsha spent time in retail leadership, retail and commercial lending at large regional and community banks within the Arrow footprint. Mr. Yrsha is active in the community serving in leadership roles on a variety of boards. He is a graduate of Castleton University in Vermont and the Adirondack Regional Chamber of Commerce’s Leadership Adirondack Program. Michael Jacobs, Executive Vice President, Chief Information Officer 30+ Years Experience Mr. Jacobs joined Glens Falls National Bank in 2003 as Information Systems Manager. He was later promoted to Senior Vice President and then Executive Vice President. As Chief Information Officer, Mr. Jacobs guides the company’s strategic technology plans. He has more than 30 years of experience in the community banking industry, having previously served as Operations Manager at Cohoes Savings Bank and Item Processing Manager at Hudson River Bank and Trust. Mr. Jacobs holds a bachelor’s degree in finance from Siena College and an associate degree in business administration from Hudson Valley Community College.
Q2 2023 Performance 10
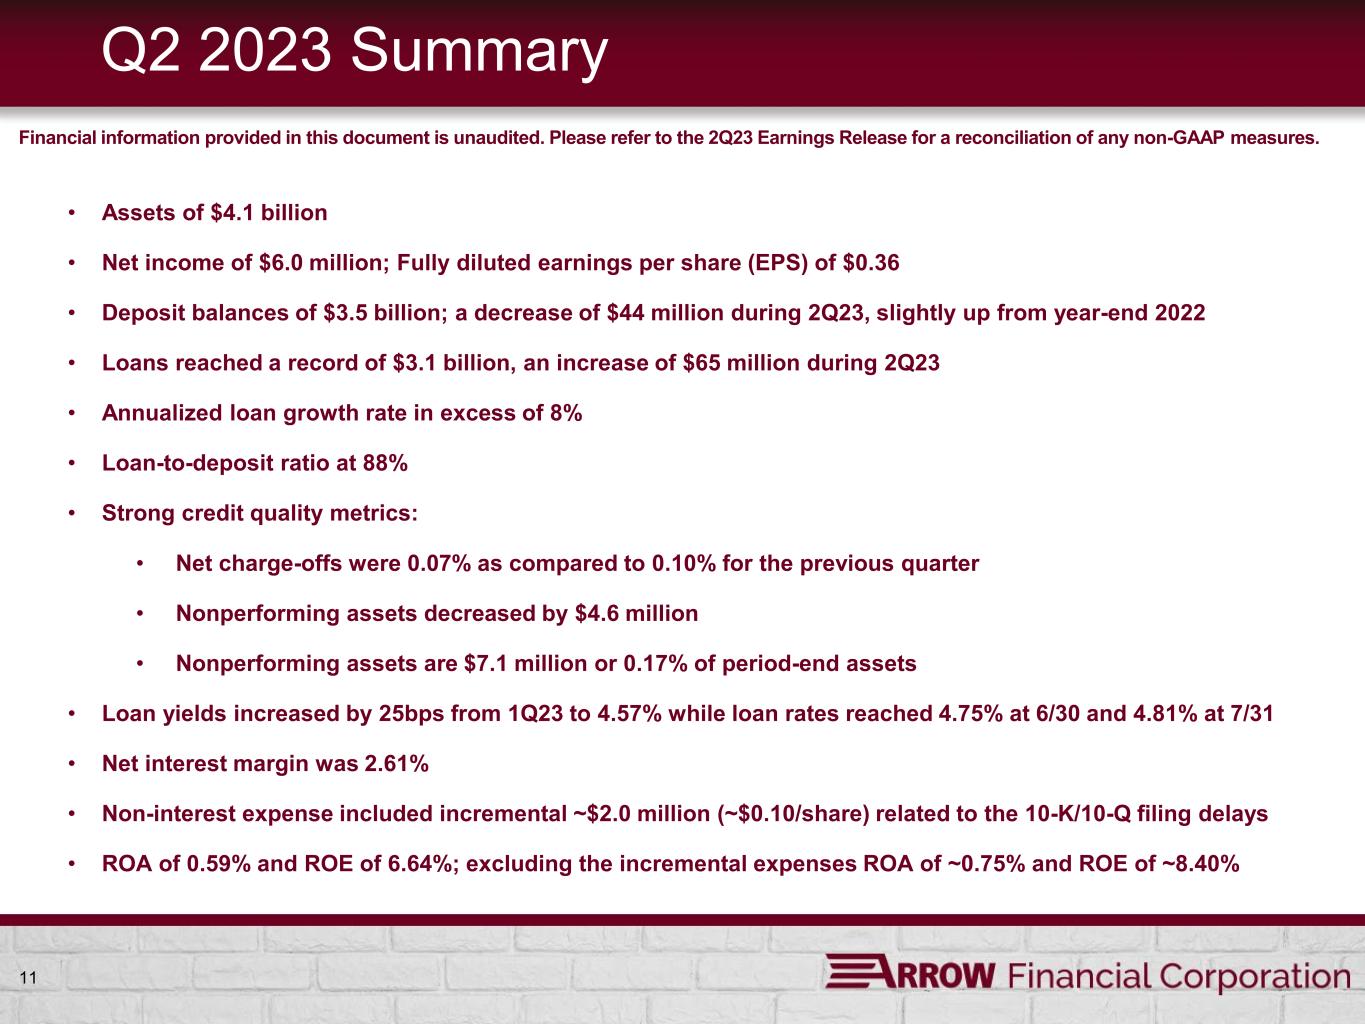
11 Q2 2023 Summary • Assets of $4.1 billion • Net income of $6.0 million; Fully diluted earnings per share (EPS) of $0.36 • Deposit balances of $3.5 billion; a decrease of $44 million during 2Q23, slightly up from year-end 2022 • Loans reached a record of $3.1 billion, an increase of $65 million during 2Q23 • Annualized loan growth rate in excess of 8% • Loan-to-deposit ratio at 88% • Strong credit quality metrics: • Net charge-offs were 0.07% as compared to 0.10% for the previous quarter • Nonperforming assets decreased by $4.6 million • Nonperforming assets are $7.1 million or 0.17% of period-end assets • Loan yields increased by 25bps from 1Q23 to 4.57% while loan rates reached 4.75% at 6/30 and 4.81% at 7/31 • Net interest margin was 2.61% • Non-interest expense included incremental ~$2.0 million (~$0.10/share) related to the 10-K/10-Q filing delays • ROA of 0.59% and ROE of 6.64%; excluding the incremental expenses ROA of ~0.75% and ROE of ~8.40% Financial information provided in this document is unaudited. Please refer to the 2Q23 Earnings Release for a reconciliation of any non-GAAP measures.
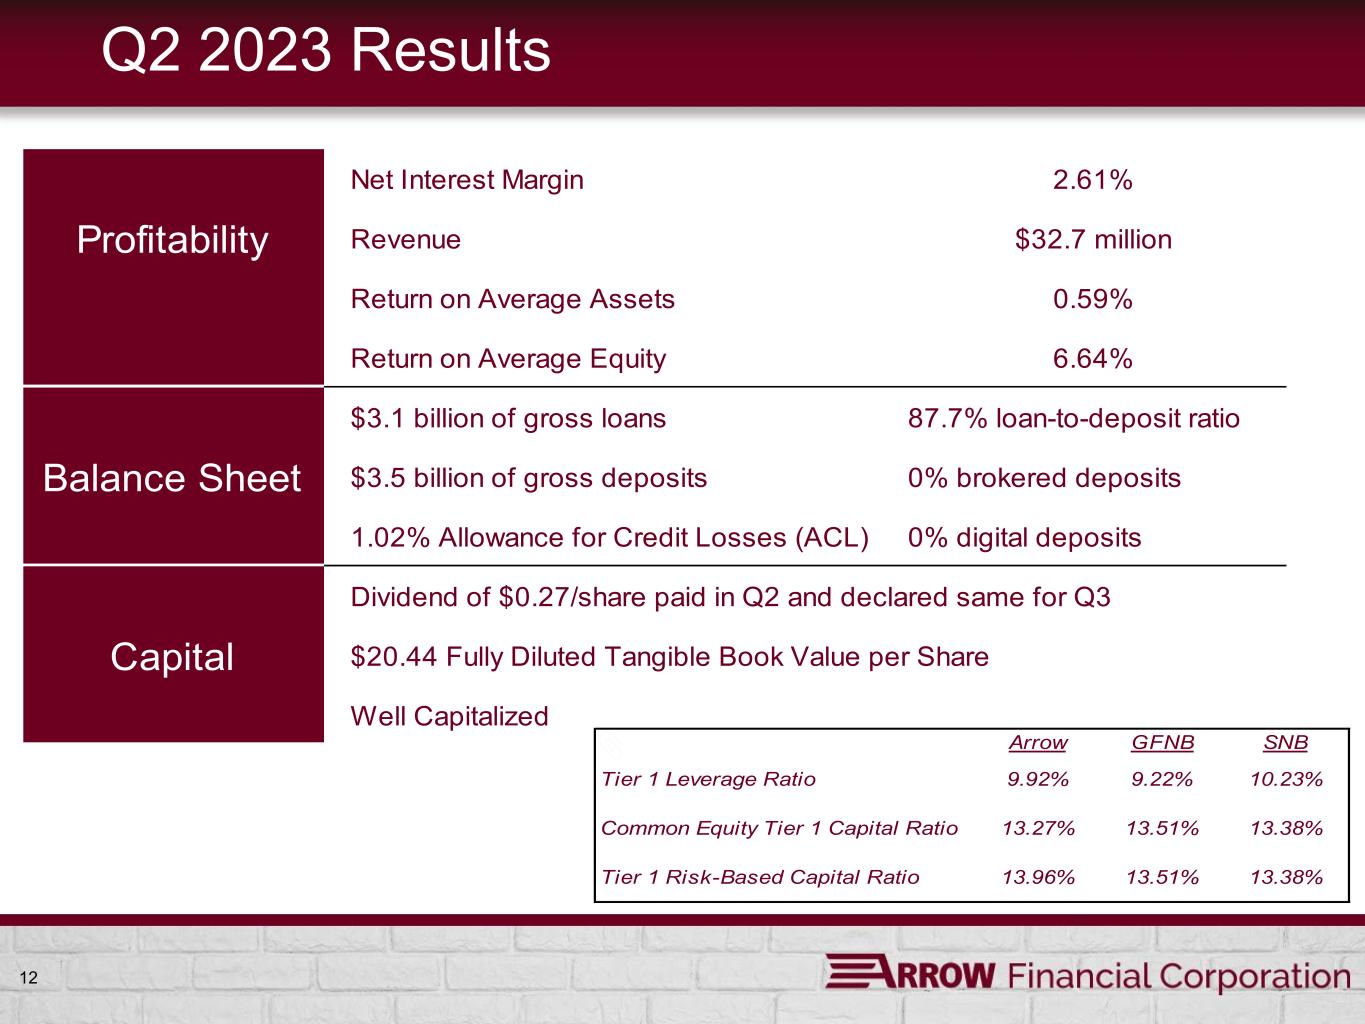
12 Net Interest Margin 2.61% Profitability Revenue $32.7 million Return on Average Assets 0.59% Return on Average Equity 6.64% $3.1 billion of gross loans 87.7% loan-to-deposit ratio Balance Sheet $3.5 billion of gross deposits 0% brokered deposits 1.02% Allowance for Credit Losses (ACL) 0% digital deposits Dividend of $0.27/share paid in Q2 and declared same for Q3 Capital $20.44 Fully Diluted Tangible Book Value per Share Well Capitalized Q2 2023 Results Arrow GFNB SNB Tier 1 Leverage Ratio 9.92% 9.22% 10.23% Common Equity Tier 1 Capital Ratio 13.27% 13.51% 13.38% Tier 1 Risk-Based Capital Ratio 13.96% 13.51% 13.38%
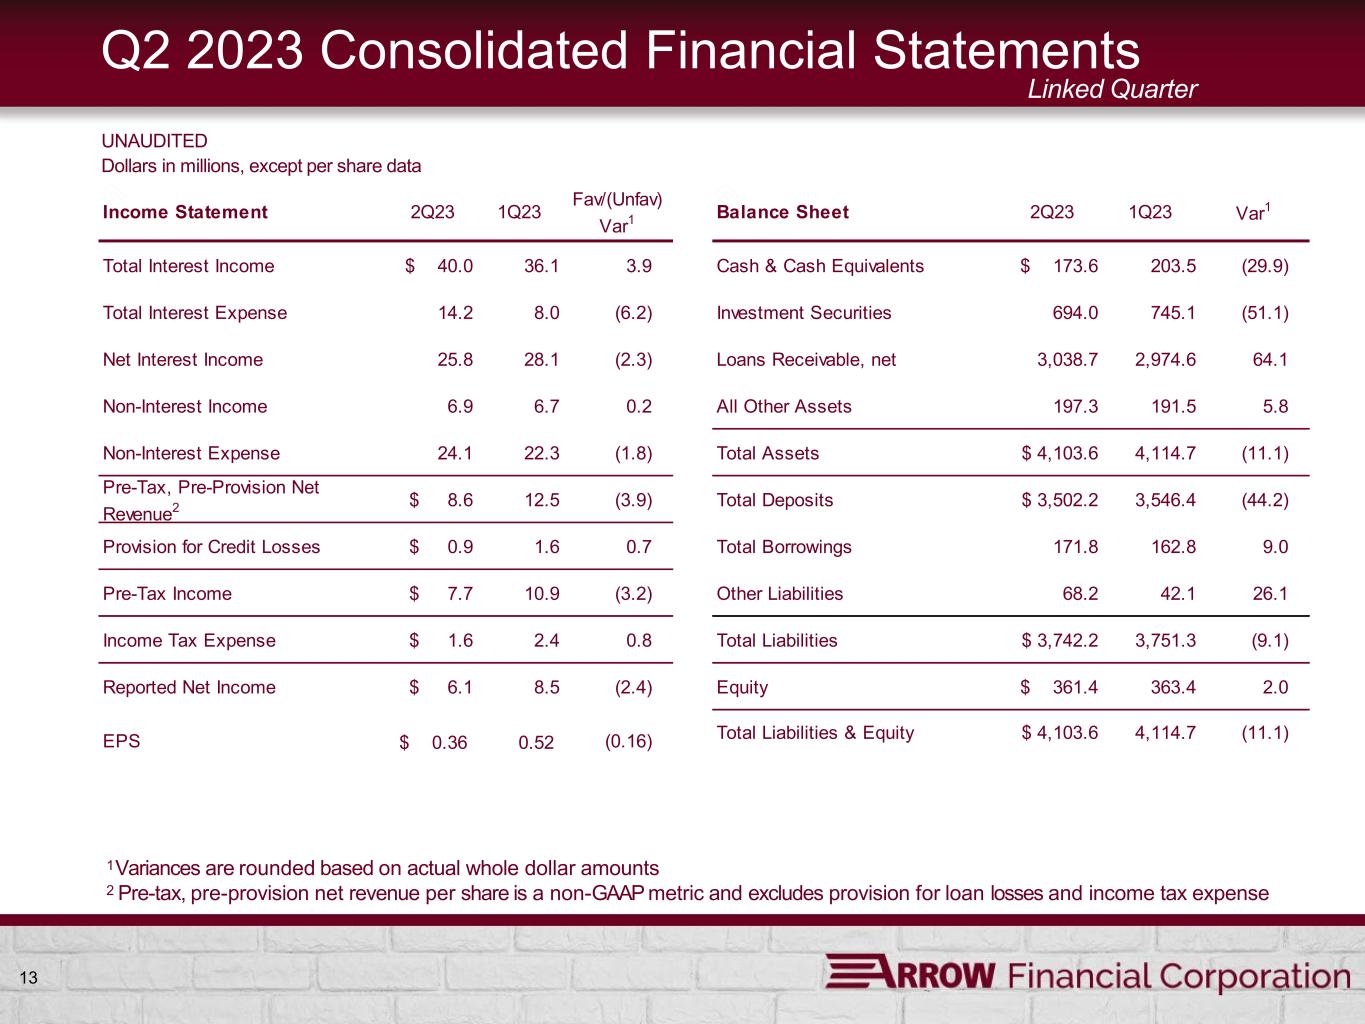
13 Q2 2023 Consolidated Financial Statements 1Variances are rounded based on actual whole dollar amounts 2 Pre-tax, pre-provision net revenue per share is a non-GAAP metric and excludes provision for loan losses and income tax expense UNAUDITED Dollars in millions, except per share data Linked Quarter Income Statement 2Q23 1Q23 Fav/(Unfav) Var1 Total Interest Income $ 40.0 36.1 3.9 Total Interest Expense 14.2 8.0 (6.2) Net Interest Income 25.8 28.1 (2.3) Non-Interest Income 6.9 6.7 0.2 Non-Interest Expense 24.1 22.3 (1.8) Pre-Tax, Pre-Provision Net Revenue2 $ 8.6 12.5 (3.9) Provision for Credit Losses $ 0.9 1.6 0.7 Pre-Tax Income $ 7.7 10.9 (3.2) Income Tax Expense $ 1.6 2.4 0.8 Reported Net Income $ 6.1 8.5 (2.4) EPS 0.36$ 0.52 (0.16) Balance Sheet 2Q23 1Q23 Var1 Cash & Cash Equivalents $ 173.6 203.5 (29.9) Investment Securities 694.0 745.1 (51.1) Loans Receivable, net 3,038.7 2,974.6 64.1 All Other Assets 197.3 191.5 5.8 Total Assets $ 4,103.6 4,114.7 (11.1) Total Deposits $ 3,502.2 3,546.4 (44.2) Total Borrowings 171.8 162.8 9.0 Other Liabilities 68.2 42.1 26.1 Total Liabilities $ 3,742.2 3,751.3 (9.1) Equity $ 361.4 363.4 2.0 Total Liabilities & Equity $ 4,103.6 4,114.7 (11.1)
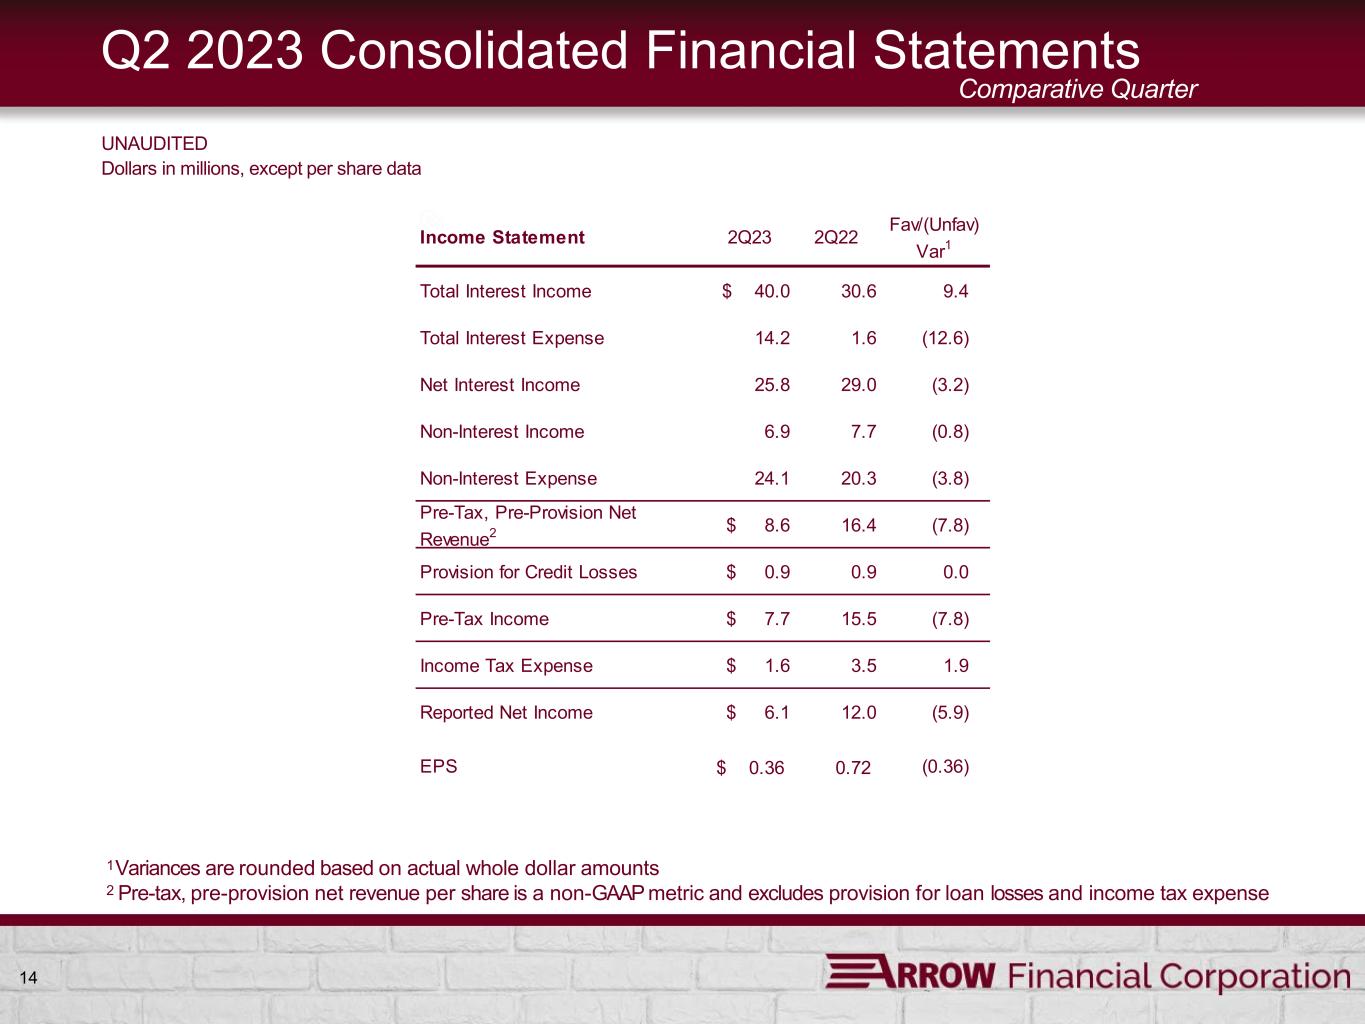
14 Q2 2023 Consolidated Financial Statements 1Variances are rounded based on actual whole dollar amounts 2 Pre-tax, pre-provision net revenue per share is a non-GAAP metric and excludes provision for loan losses and income tax expense UNAUDITED Dollars in millions, except per share data Comparative Quarter Income Statement 2Q23 2Q22 Fav/(Unfav) Var1 Total Interest Income $ 40.0 30.6 9.4 Total Interest Expense 14.2 1.6 (12.6) Net Interest Income 25.8 29.0 (3.2) Non-Interest Income 6.9 7.7 (0.8) Non-Interest Expense 24.1 20.3 (3.8) Pre-Tax, Pre-Provision Net Revenue2 $ 8.6 16.4 (7.8) Provision for Credit Losses $ 0.9 0.9 0.0 Pre-Tax Income $ 7.7 15.5 (7.8) Income Tax Expense $ 1.6 3.5 1.9 Reported Net Income $ 6.1 12.0 (5.9) EPS 0.36$ 0.72 (0.36)
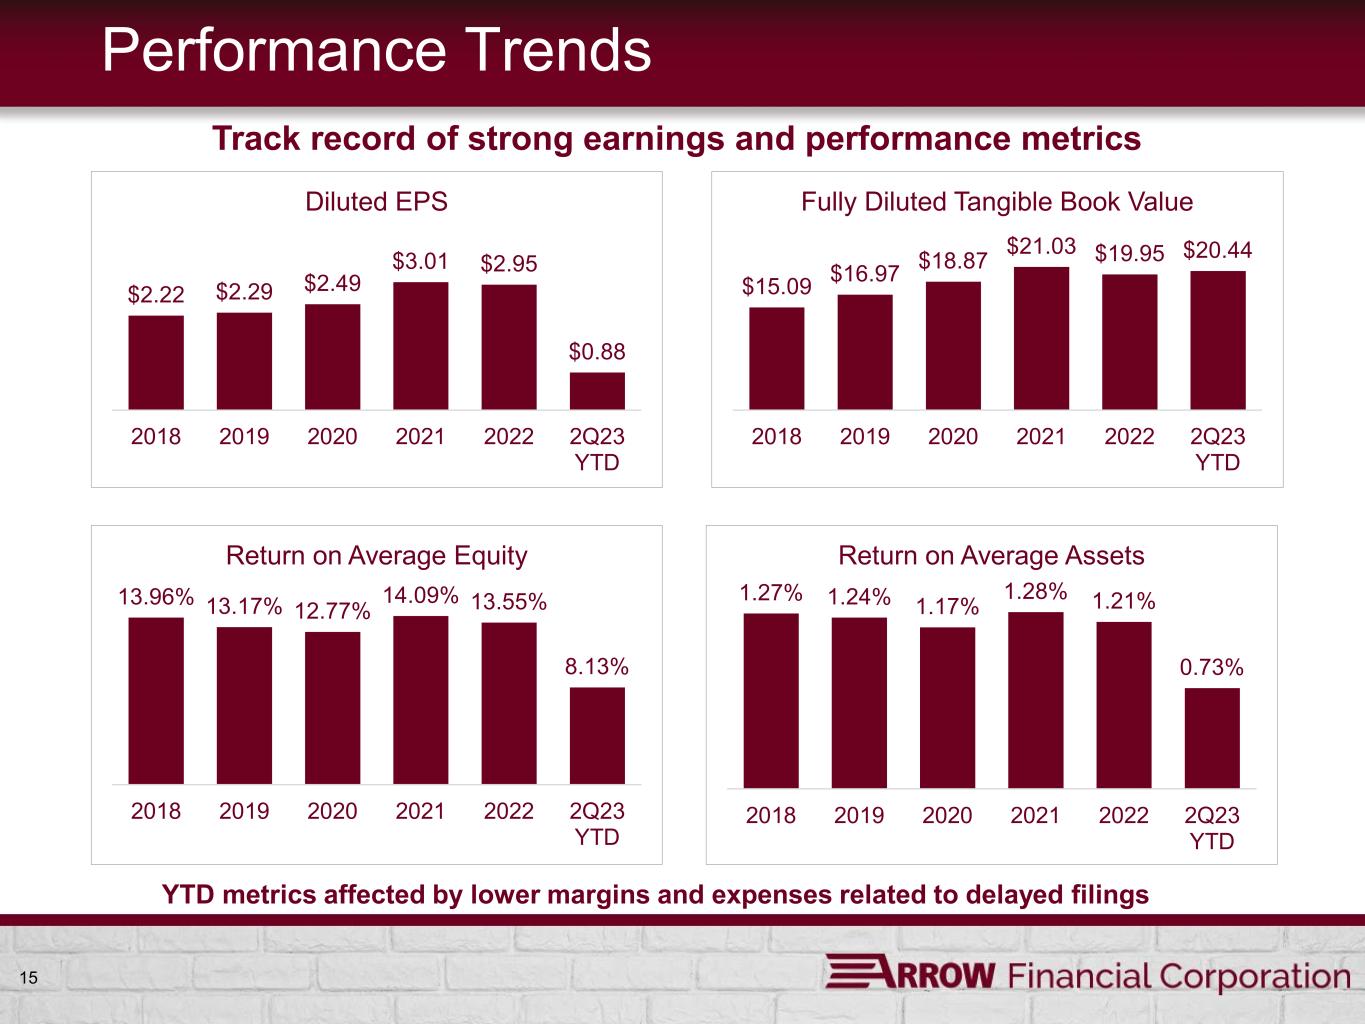
15 Performance Trends $2.22 $2.29 $2.49 $3.01 $2.95 $0.88 2018 2019 2020 2021 2022 2Q23 YTD Diluted EPS $15.09 $16.97 $18.87 $21.03 $19.95 $20.44 2018 2019 2020 2021 2022 2Q23 YTD Fully Diluted Tangible Book Value 13.96% 13.17% 12.77% 14.09% 13.55% 8.13% 2018 2019 2020 2021 2022 2Q23 YTD Return on Average Equity 1.27% 1.24% 1.17% 1.28% 1.21% 0.73% 2018 2019 2020 2021 2022 2Q23 YTD Return on Average Assets YTD metrics affected by lower margins and expenses related to delayed filings Track record of strong earnings and performance metrics
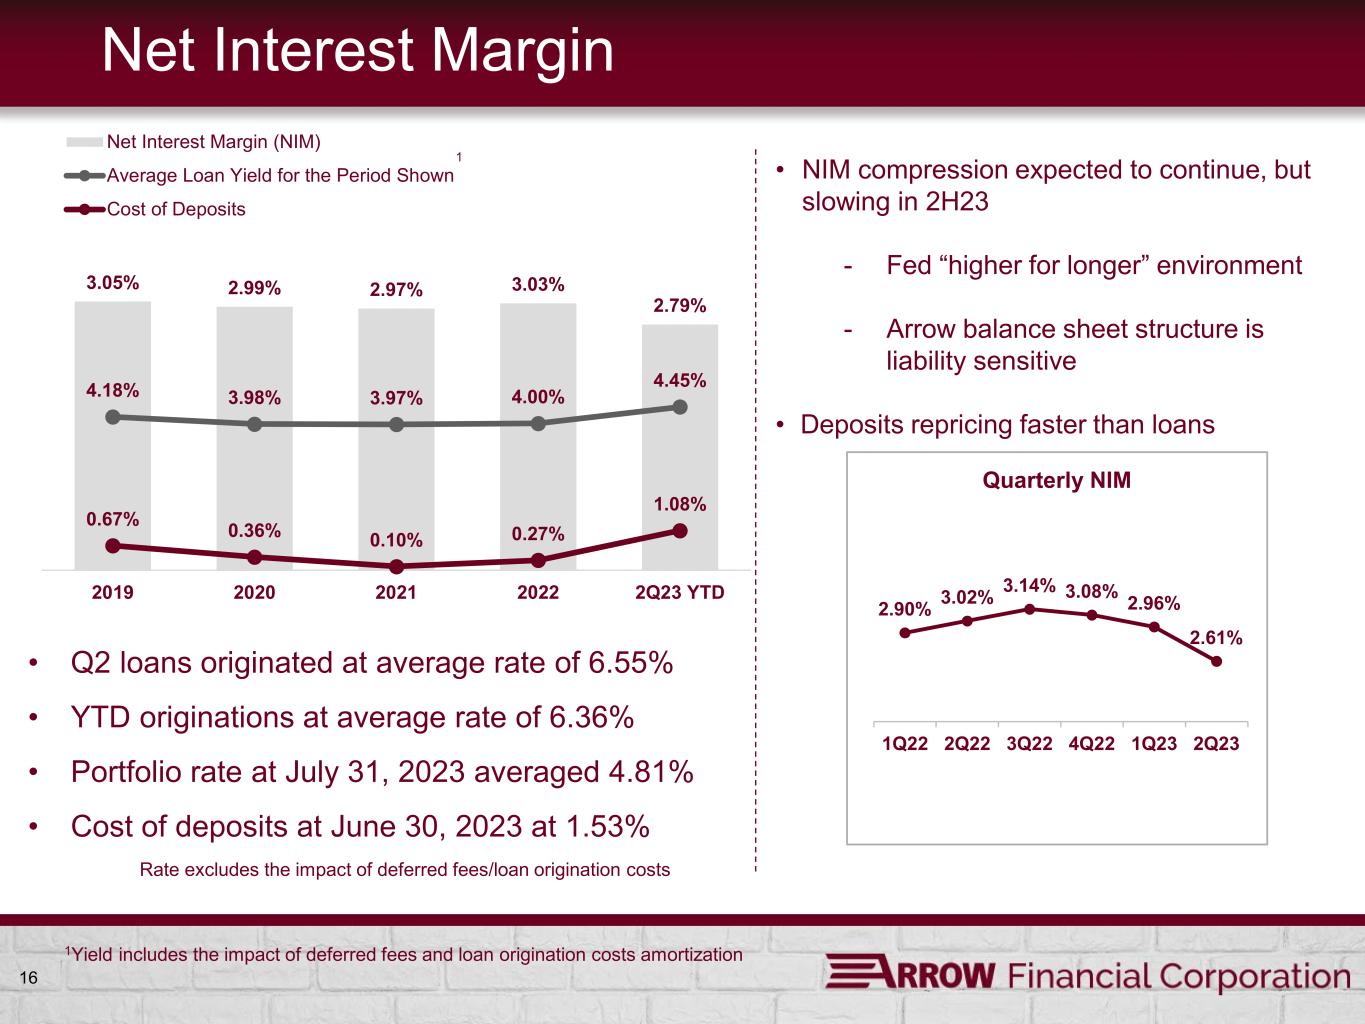
16 Net Interest Margin 3.05% 2.99% 2.97% 3.03% 2.79% 4.18% 3.98% 3.97% 4.00% 4.45% 0.67% 0.36% 0.10% 0.27% 1.08% 2019 2020 2021 2022 2Q23 YTD Net Interest Margin (NIM) Average Loan Yield for the Period Shown Cost of Deposits • NIM compression expected to continue, but slowing in 2H23 - Fed “higher for longer” environment - Arrow balance sheet structure is liability sensitive • Deposits repricing faster than loans 2.90% 3.02% 3.14% 3.08% 2.96% 2.61% 1Q22 2Q22 3Q22 4Q22 1Q23 2Q23 Quarterly NIM • Q2 loans originated at average rate of 6.55% • YTD originations at average rate of 6.36% • Portfolio rate at July 31, 2023 averaged 4.81% • Cost of deposits at June 30, 2023 at 1.53% Rate excludes the impact of deferred fees/loan origination costs 1 1Yield includes the impact of deferred fees and loan origination costs amortization

17 Operating Expenses - Efficiency Trends 56.6% 57.1% 52.8% 54.2% 54.3% 67.9% 2.27% 2.22% 2.02% 2.00% 2.01% 2.30% 2018 2019 2020 2021 2022 2Q23 YTD Efficiency Ratio Net Non-interest Expense / Average Assets Efficiency Ratio trend driven primarily by margin compression and by elevated expenses due to regulatory filing delays $65.1 $67.5 $70.7 $78.0 $81.5 $46.4 2018 2019 2020 2021 2022 2Q23 YTD Non-Interest Expenses (in millions) • 64.4 % excl. elevated expenses • Remaining increase driven by margin compression
Funding, Investments and Liquidity 18
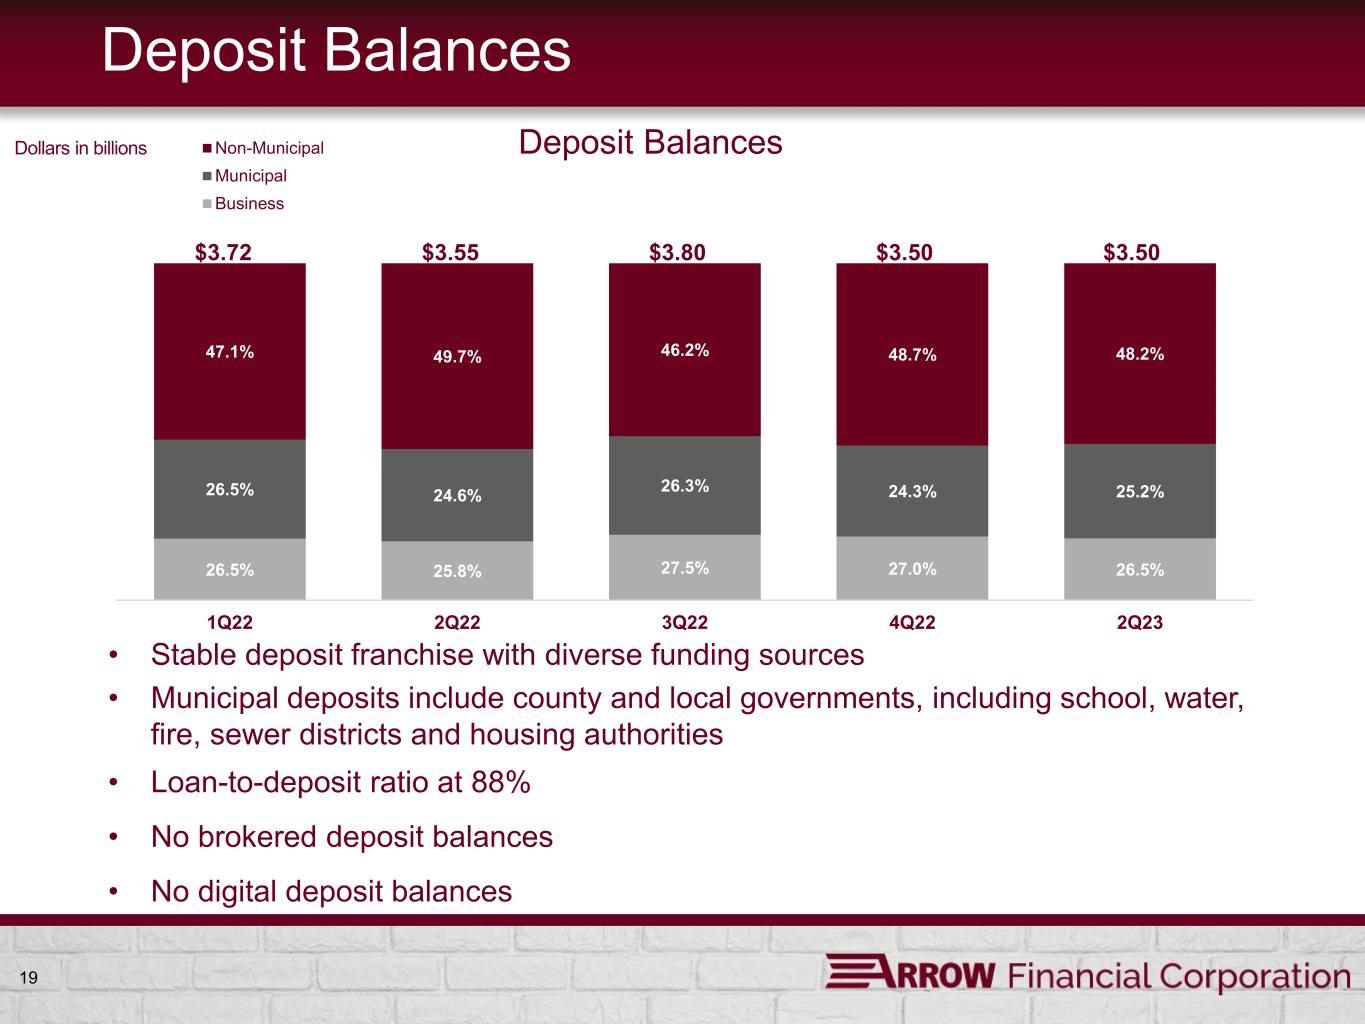
19 Deposit Balances 26.5% 25.8% 27.5% 27.0% 26.5% 26.5% 24.6% 26.3% 24.3% 25.2% 47.1% 49.7% 46.2% 48.7% 48.2% 1Q22 2Q22 3Q22 4Q22 2Q23 Axis Title Deposit BalancesNon-Municipal Municipal Business Dollars in billions $3.72 $3.55 $3.80 $3.50 $3.50 • Stable deposit franchise with diverse funding sources • Municipal deposits include county and local governments, including school, water, fire, sewer districts and housing authorities • Loan-to-deposit ratio at 88% • No brokered deposit balances • No digital deposit balances
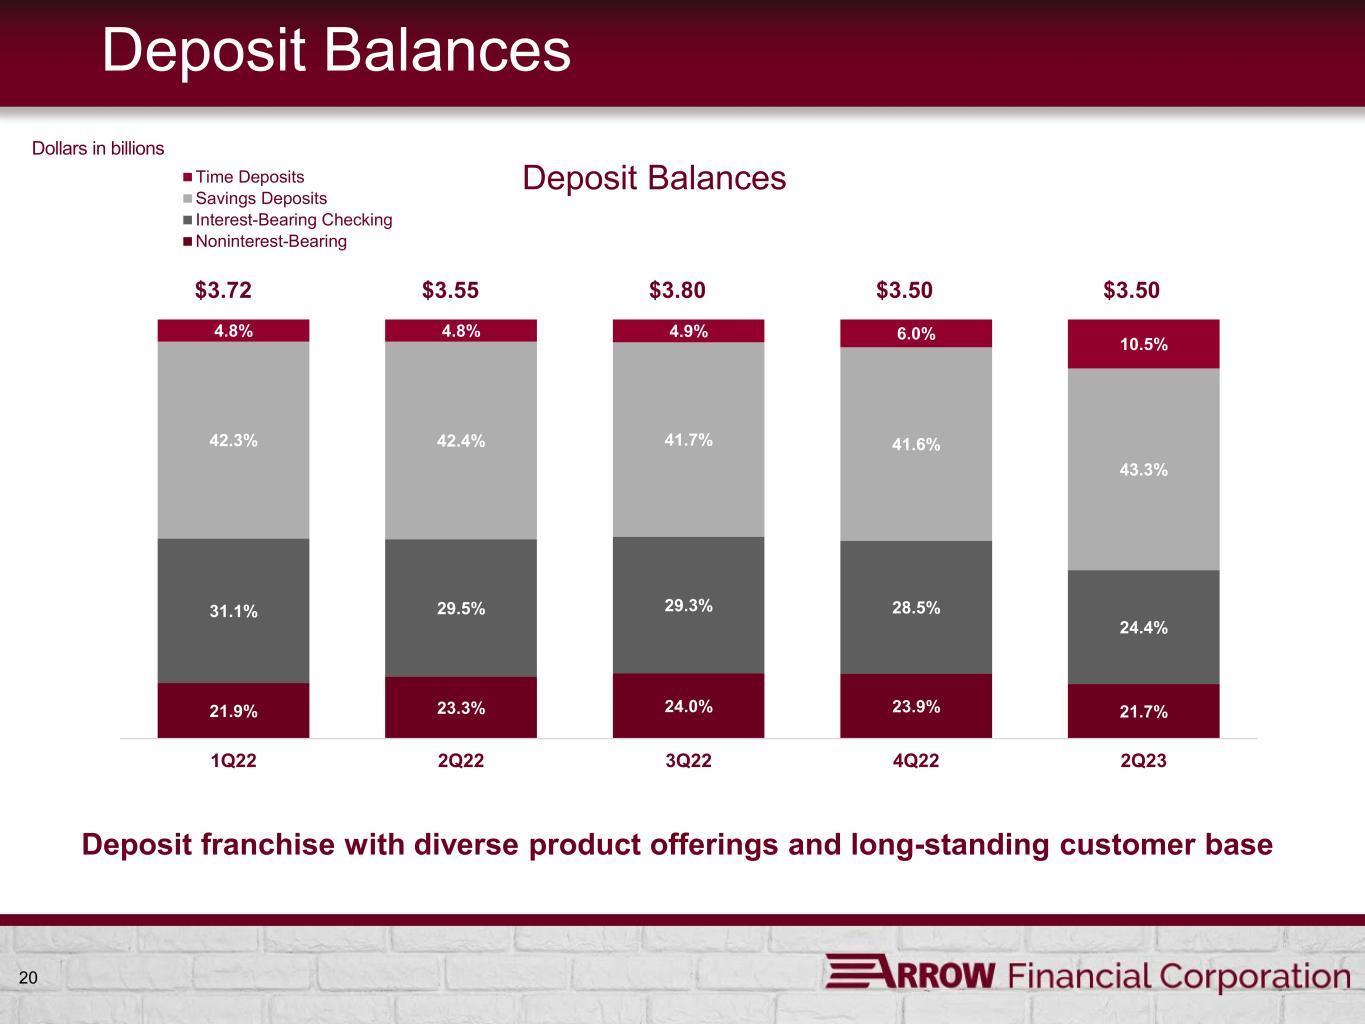
20 Deposit Balances 21.9% 23.3% 24.0% 23.9% 21.7% 31.1% 29.5% 29.3% 28.5% 24.4% 42.3% 42.4% 41.7% 41.6% 43.3% 4.8% 4.8% 4.9% 6.0% 10.5% 1Q22 2Q22 3Q22 4Q22 2Q23 Axis Title Deposit BalancesTime Deposits Savings Deposits Interest-Bearing Checking Noninterest-Bearing Dollars in billions $3.72 $3.55 $3.80 $3.50 $3.50 Deposit franchise with diverse product offerings and long-standing customer base
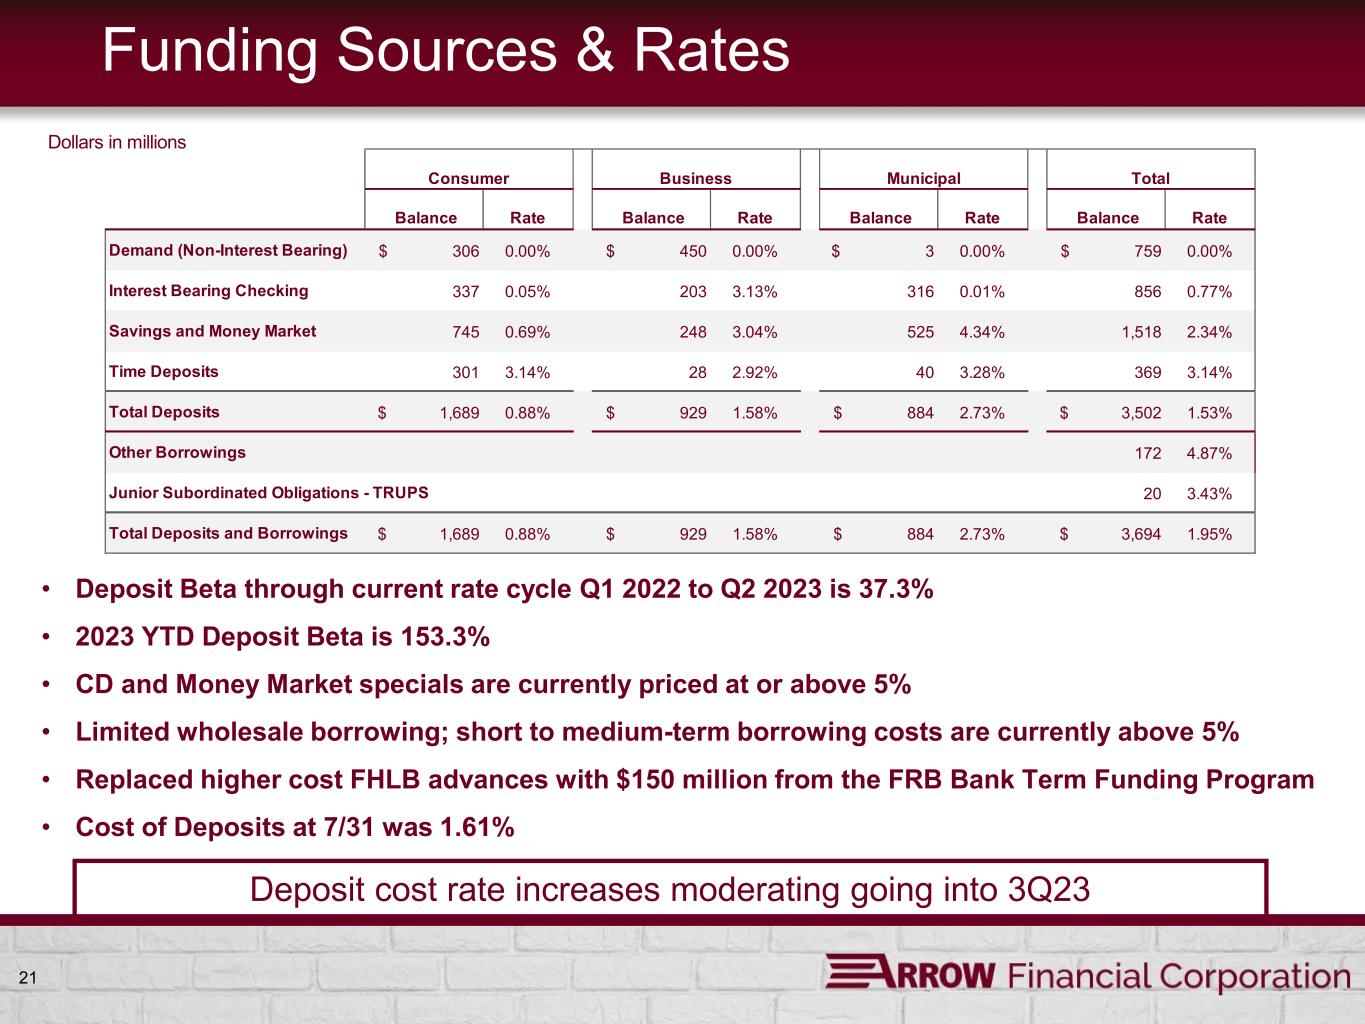
21 Funding Sources & Rates • Deposit Beta through current rate cycle Q1 2022 to Q2 2023 is 37.3% • 2023 YTD Deposit Beta is 153.3% • CD and Money Market specials are currently priced at or above 5% • Limited wholesale borrowing; short to medium-term borrowing costs are currently above 5% • Replaced higher cost FHLB advances with $150 million from the FRB Bank Term Funding Program • Cost of Deposits at 7/31 was 1.61% Dollars in millions Deposit cost rate increases moderating going into 3Q23 Balance Rate Balance Rate Balance Rate Balance Rate Demand (Non-Interest Bearing) $ 306 0.00% $ 450 0.00% $ 3 0.00% $ 759 0.00% Interest Bearing Checking 337 0.05% 203 3.13% 316 0.01% 856 0.77% Savings and Money Market 745 0.69% 248 3.04% 525 4.34% 1,518 2.34% Time Deposits 301 3.14% 28 2.92% 40 3.28% 369 3.14% Total Deposits $ 1,689 0.88% $ 929 1.58% $ 884 2.73% $ 3,502 1.53% Other Borrowings 172 4.87% Junior Subordinated Obligations - TRUPS 20 3.43% Total Deposits and Borrowings $ 1,689 0.88% $ 929 1.58% $ 884 2.73% $ 3,694 1.95% Consumer Business Municipal Total
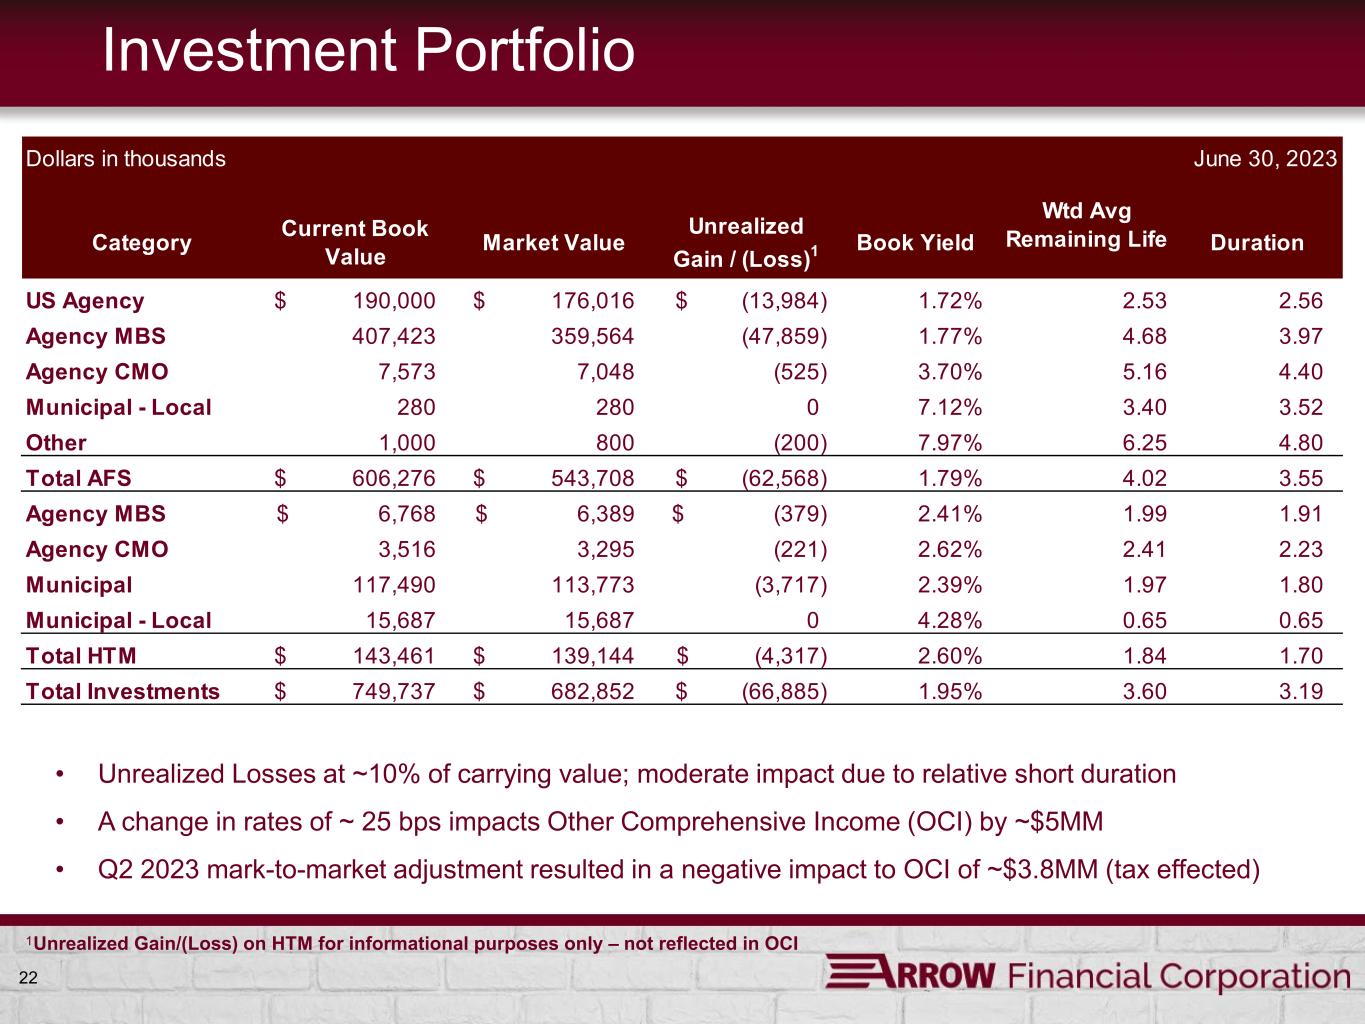
22 Duration Wtd Avg Remaining LifeCurrent Book Value Market ValueCategoy Unrealized Gain / (Loss) Book Yield • Unrealized Losses at ~10% of carrying value; moderate impact due to relative short duration • A change in rates of ~ 25 bps impacts Other Comprehensive Income (OCI) by ~$5MM • Q2 2023 mark-to-market adjustment resulted in a negative impact to OCI of ~$3.8MM (tax effected) Investment Portfolio 1 1Unrealized Gain/(Loss) on HTM for informational purposes only – not reflected in OCI Dollars in thousands June 30, 2023 Category 3.19 7,573 7,048 (525) 3.70% 407,423 359,564 (47,859) 1.77% Unrealized Gain / (Loss)1 (13,984)$ Book Yield 1.72% Current Book Value 190,000$ Total Investments US Agency Agency MBS Agency CMO Municipal - Local Other Total AFS Agency MBS Agency CMO Municipal Municipal - Local Total HTM 113,773 Market Value 176,016$ 117,490 15,687 143,461$ 749,737$ 280 800 543,708$ 6,389$ 280 1,000 606,276$ 6,768$ 3,516 3,295 15,687 139,144$ 7.12% 7.97% 1.79% 2.41% 2.62% 682,852$ 0 (200) (62,568)$ (379)$ (221) 2.39% 4.28% 2.60% 1.95% (3,717) 0 (4,317)$ (66,885)$ Duration 2.56 3.97 4.40 3.60 Wtd Avg Remaining Life 2.53 4.68 5.16 1.80 0.65 1.70 3.40 6.25 4.02 1.99 2.41 1.97 0.65 1.84 3.52 4.80 3.55 1.91 2.23

23 Liquidity FDIC Insured Deposits 71% Uninsured Deposits 29% Total Deposits = $3.5 billion • ~ $2.4 billion in deposits are insured • ~ 9% on-balance sheet liquidity (Cash and unencumbered AFS securities) • Available Borrowing Capacity Brokered Deposits $0.8 billion Borrowing Capacity1 $1.3 billion $2.1 billion • Liquidity and borrowing capacity provide in excess of 2X coverage of uninsured deposits • National Listing Services also available as additional sources of liquidity • Securities, Mortgage, and Auto Loan Portfolios provide steady source of cash flow 1FHLB, FRB and other bank lines Ample coverage of uninsured deposits Uninsured deposit accounts consist of municipal, business, and high net worth individuals – many have a broader and deeper banking relationship with Arrow

Non-Interest Income 24
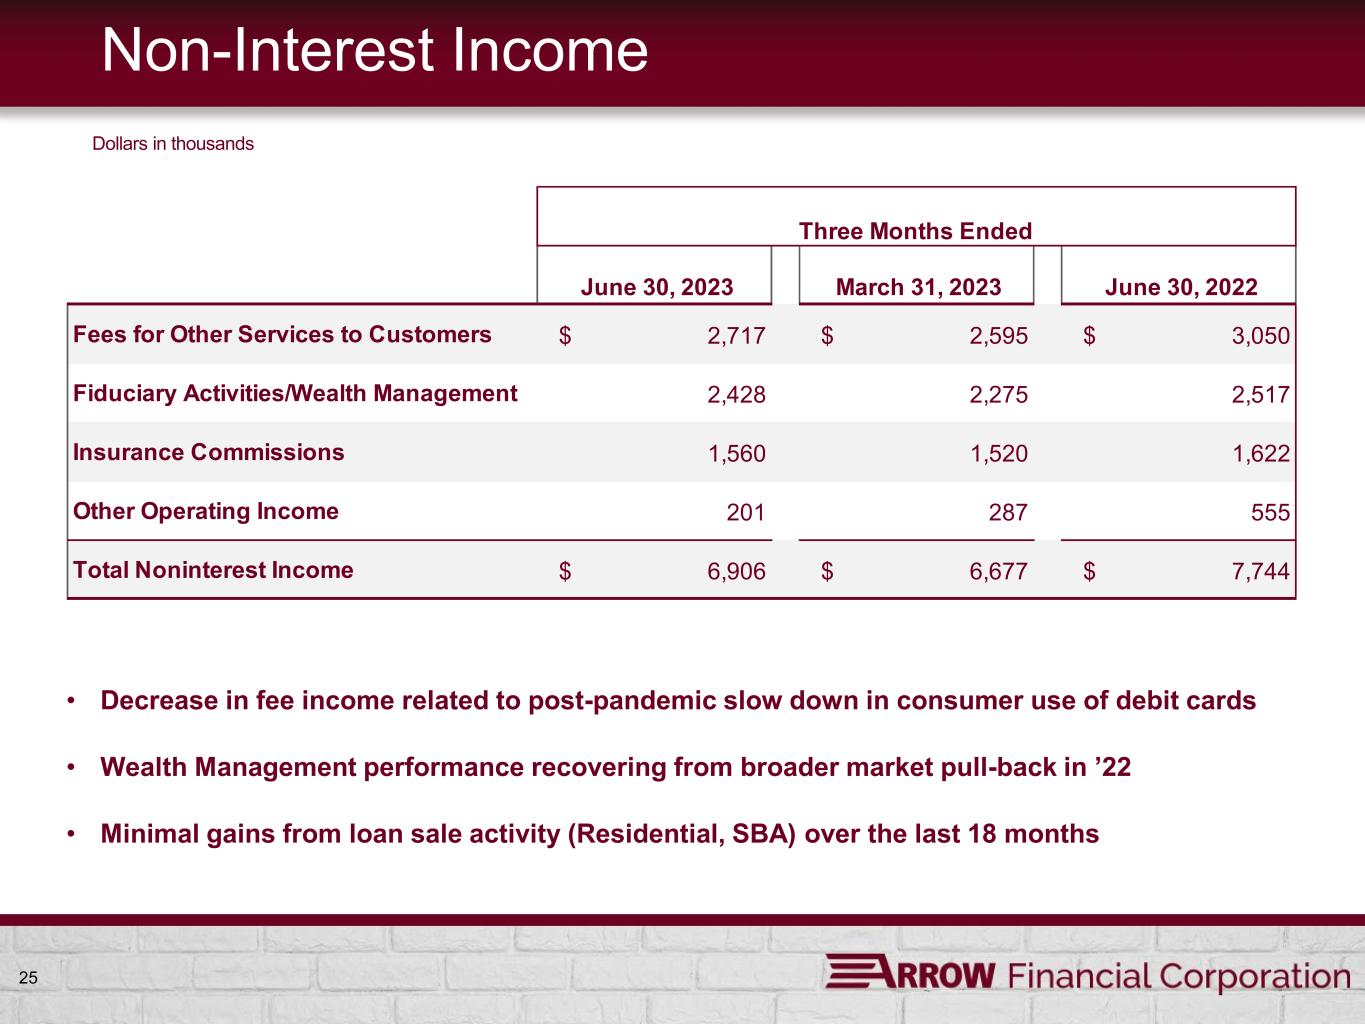
25 Non-Interest Income • Decrease in fee income related to post-pandemic slow down in consumer use of debit cards • Wealth Management performance recovering from broader market pull-back in ’22 • Minimal gains from loan sale activity (Residential, SBA) over the last 18 months Dollars in thousands June 30, 2023 March 31, 2023 June 30, 2022 Fees for Other Services to Customers $ 2,717 $ 2,595 $ 3,050 Fiduciary Activities/Wealth Management 2,428 2,275 2,517 Insurance Commissions 1,560 1,520 1,622 Other Operating Income 201 287 555 Total Noninterest Income $ 6,906 $ 6,677 $ 7,744 Three Months Ended

26 Wealth Management • $1.7 billion Assets under Management (AUM) at June 30, 2023 • YTD AUM increased ~$105.3 million (6.6%) • YTD New (net) accounts contributed ~$39 million • Serving New York (Upper Hudson Valley, Capital Region, North Country) • Based in Glens Falls, NY • 33 employees • Services • Asset Management Accounts • Trust and Estate Management • Employer Retirement Plans • Individual Retirement Plans • Brokerage Services (offered through LPL Financial) • Revenues • 2022 Revenue was $10.3 million on average AUM of ~$1.73B while S&P declined ~20% • Q2 2023 Revenue was $2.6 million on average AUM of ~$1.69B with S&P up ~8.3%

27 Insurance • Upstate Agency - Headquartered in South Glens Falls, NY - Total of 9 locations in New York (Capital Region, North Country) - 37 employees - Majority of policy holders reside within our geographic footprint • Insurance Products - Personal, Commercial, and Employee Benefit Plans • Revenues • 2022 Revenue of $6.5 million • 2Q23 Revenue of $1.6 million, in line with 2Q22 • 2023 YTD Revenue of $3.1 million
Loans 28
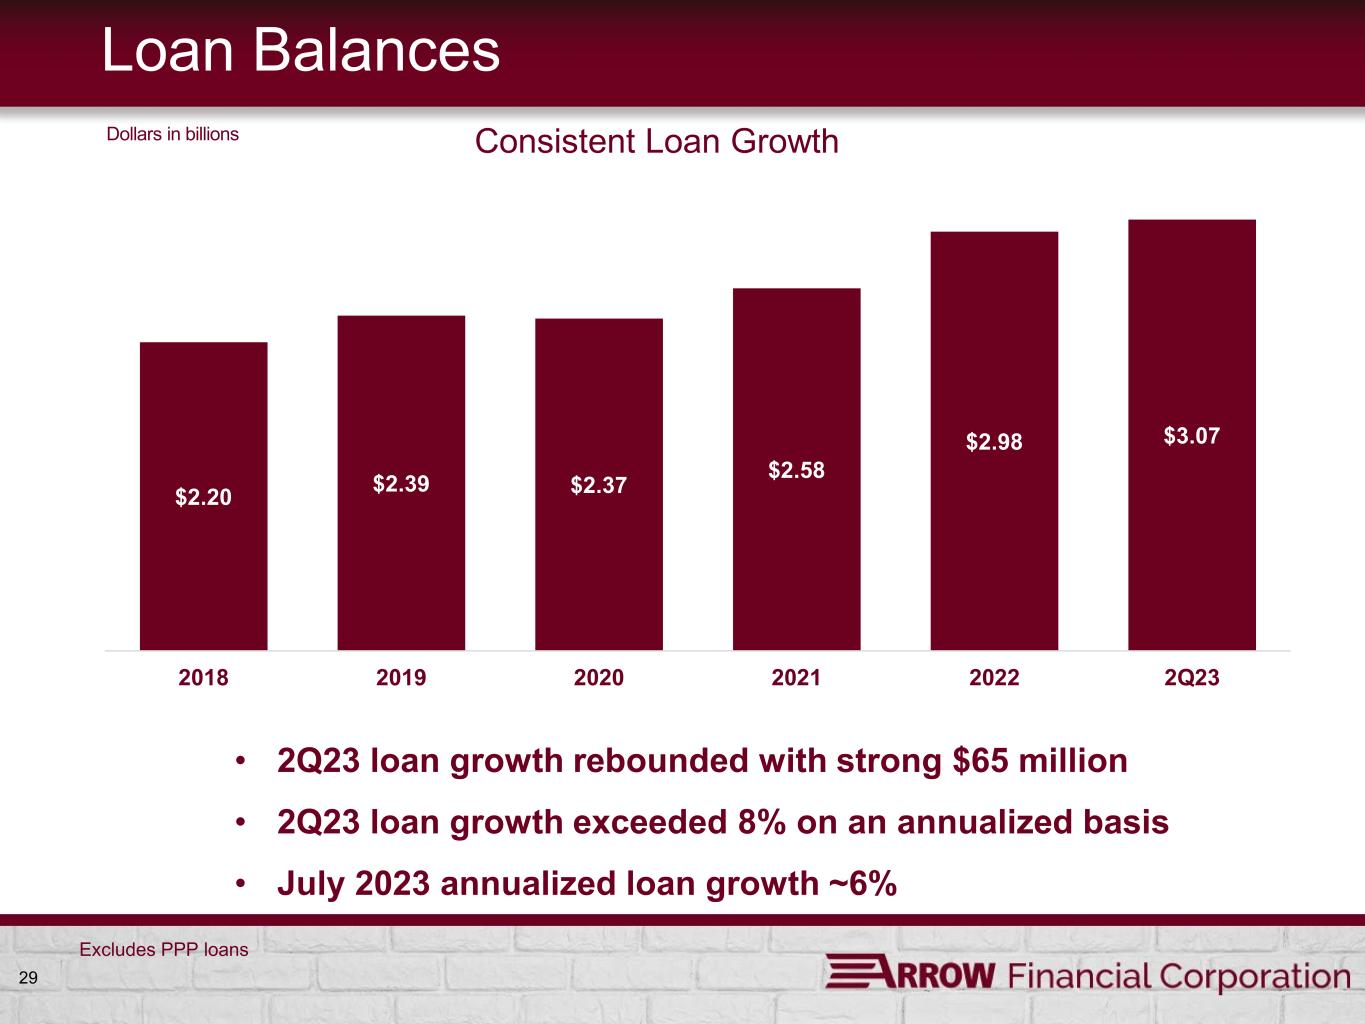
29 Loan Balances $2.20 $2.39 $2.37 $2.58 $2.98 $3.07 2018 2019 2020 2021 2022 2Q23 Consistent Loan Growth Excludes PPP loans Dollars in billions • 2Q23 loan growth rebounded with strong $65 million • 2Q23 loan growth exceeded 8% on an annualized basis • July 2023 annualized loan growth ~6%
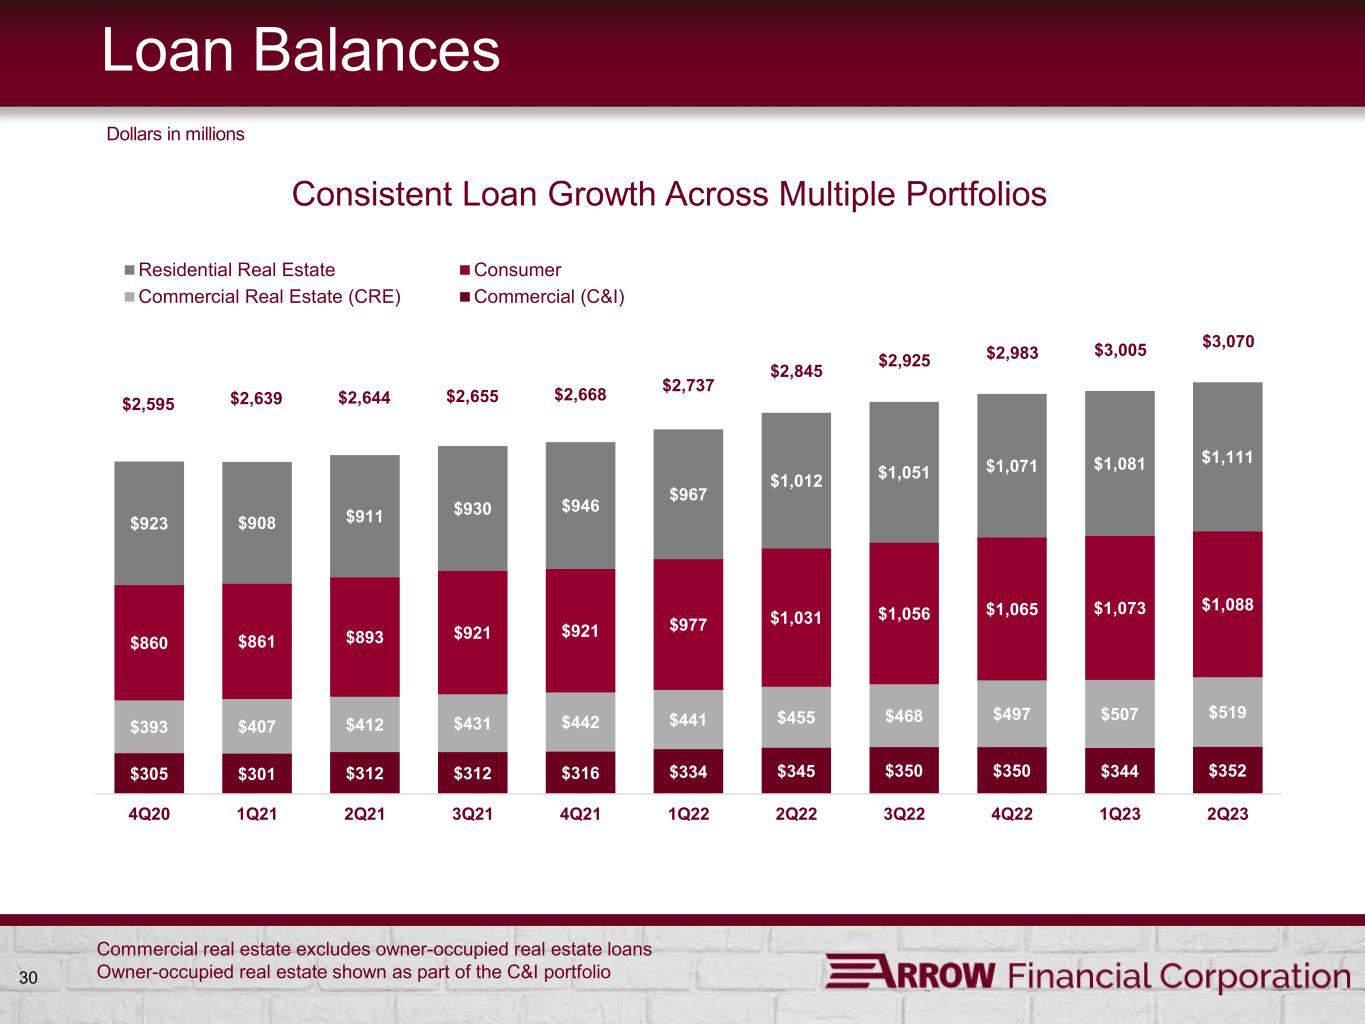
30 $2,595 $2,639 $2,644 $2,655 $2,668 $2,737 $2,845 $2,925 $2,983 $3,005 $3,070 Loan Balances Dollars in millions $305 $301 $312 $312 $316 $334 $345 $350 $350 $344 $352 $393 $407 $412 $431 $442 $441 $455 $468 $497 $507 $519 $860 $861 $893 $921 $921 $977 $1,031 $1,056 $1,065 $1,073 $1,088 $923 $908 $911 $930 $946 $967 $1,012 $1,051 $1,071 $1,081 $1,111 4Q20 1Q21 2Q21 3Q21 4Q21 1Q22 2Q22 3Q22 4Q22 1Q23 2Q23 Residential Real Estate Consumer Commercial Real Estate (CRE) Commercial (C&I) Consistent Loan Growth Across Multiple Portfolios Commercial real estate excludes owner-occupied real estate loans Owner-occupied real estate shown as part of the C&I portfolio
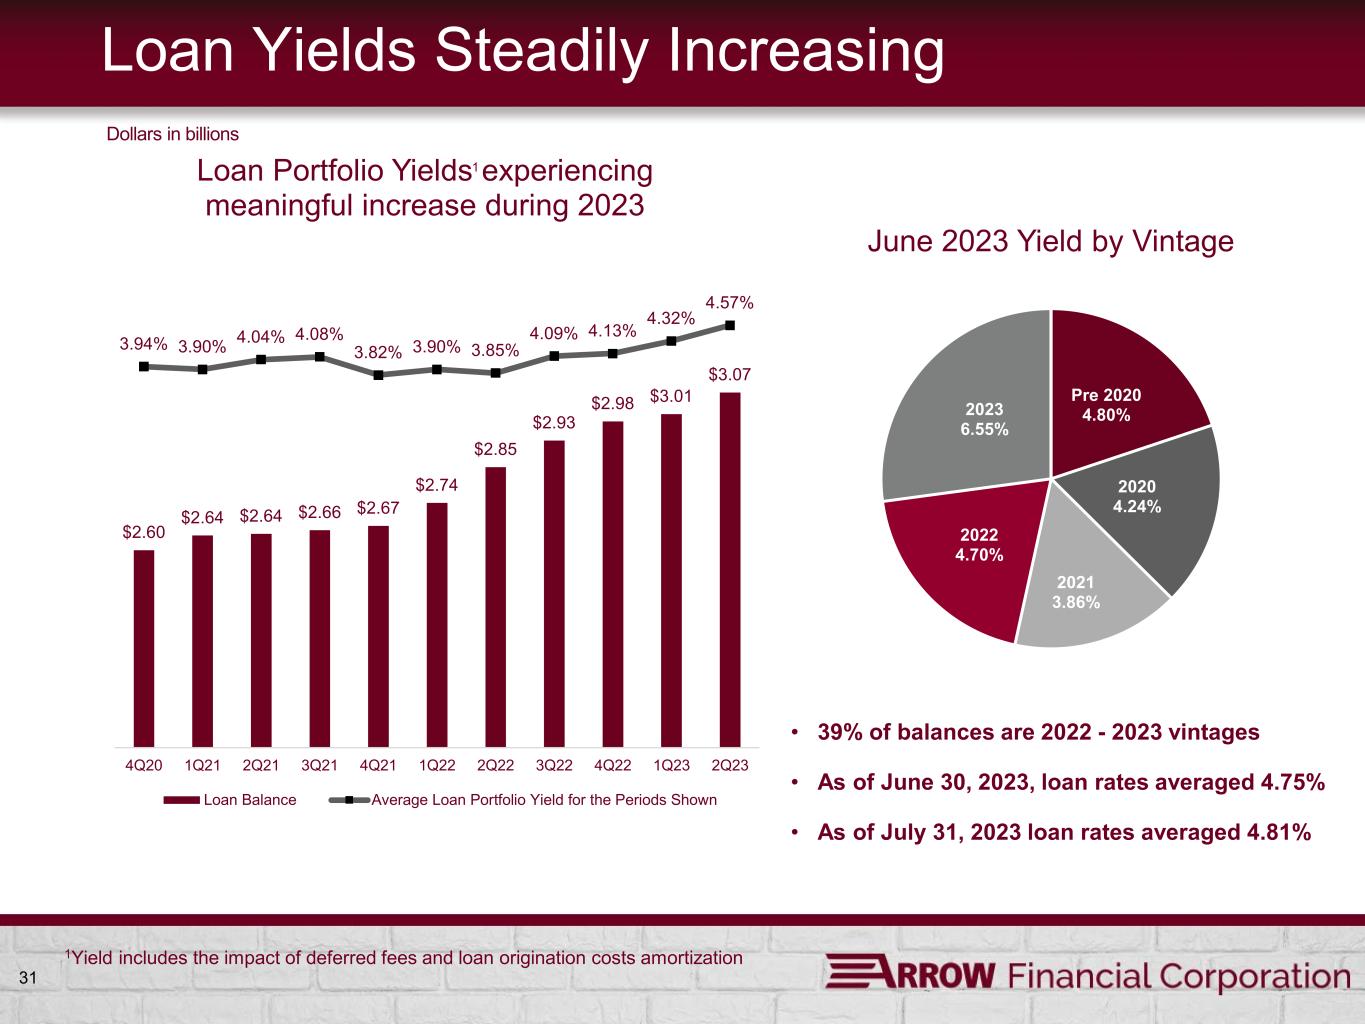
31 Loan Yields Steadily Increasing $2.60 $2.64 $2.64 $2.66 $2.67 $2.74 $2.85 $2.93 $2.98 $3.01 $3.07 3.94% 3.90% 4.04% 4.08% 3.82% 3.90% 3.85% 4.09% 4.13% 4.32% 4.57% 4Q20 1Q21 2Q21 3Q21 4Q21 1Q22 2Q22 3Q22 4Q22 1Q23 2Q23 Loan Portfolio Yields experiencing meaningful increase during 2023 Loan Balance Average Loan Portfolio Yield for the Periods Shown Dollars in billions Pre 2020 4.80% 2020 4.24% 2021 3.86% 2022 4.70% 2023 6.55% June 2023 Yield by Vintage • 39% of balances are 2022 - 2023 vintages • As of June 30, 2023, loan rates averaged 4.75% • As of July 31, 2023 loan rates averaged 4.81% 1Yield includes the impact of deferred fees and loan origination costs amortization 1
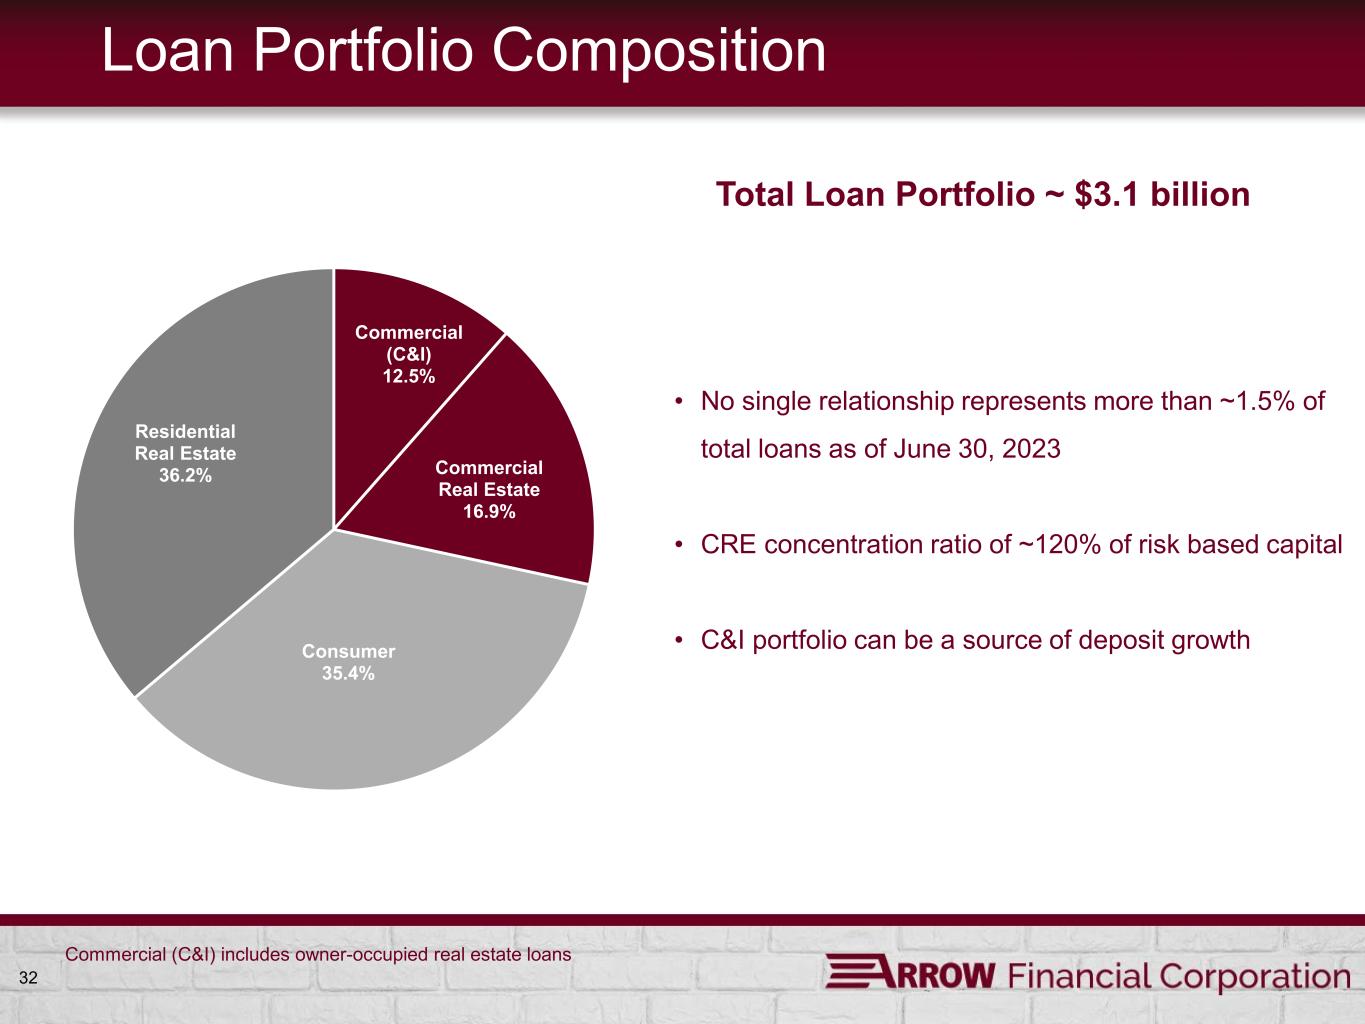
32 Loan Portfolio Composition Commercial (C&I) 12.5% Commercial Real Estate 16.9% Consumer 35.4% Residential Real Estate 36.2% • No single relationship represents more than ~1.5% of total loans as of June 30, 2023 • CRE concentration ratio of ~120% of risk based capital • C&I portfolio can be a source of deposit growth Total Loan Portfolio ~ $3.1 billion Commercial (C&I) includes owner-occupied real estate loans
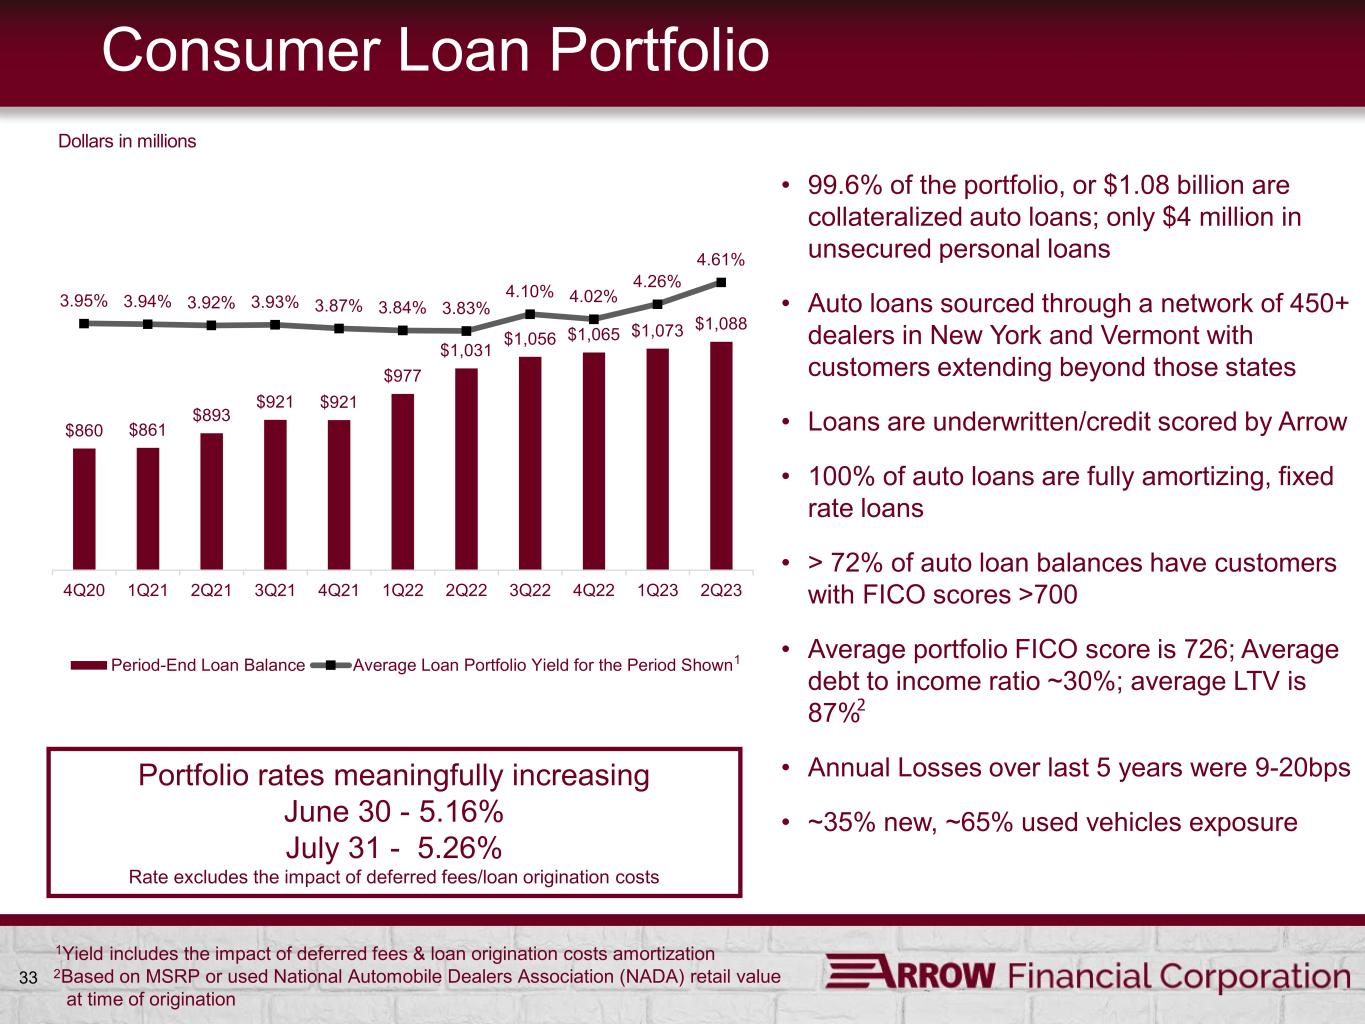
33 Consumer Loan Portfolio $860 $861 $893 $921 $921 $977 $1,031 $1,056 $1,065 $1,073 $1,088 3.95% 3.94% 3.92% 3.93% 3.87% 3.84% 3.83% 4.10% 4.02% 4.26% 4.61% 4Q20 1Q21 2Q21 3Q21 4Q21 1Q22 2Q22 3Q22 4Q22 1Q23 2Q23 Period-End Loan Balance Average Loan Portfolio Yield for the Period Shown Dollars in millions • 99.6% of the portfolio, or $1.08 billion are collateralized auto loans; only $4 million in unsecured personal loans • Auto loans sourced through a network of 450+ dealers in New York and Vermont with customers extending beyond those states • Loans are underwritten/credit scored by Arrow • 100% of auto loans are fully amortizing, fixed rate loans • > 72% of auto loan balances have customers with FICO scores >700 • Average portfolio FICO score is 726; Average debt to income ratio ~30%; average LTV is 87% • Annual Losses over last 5 years were 9-20bps • ~35% new, ~65% used vehicles exposure 2 1Yield includes the impact of deferred fees & loan origination costs amortization 2 Based on MSRP or used National Automobile Dealers Association (NADA) retail value at time of origination 1 Portfolio rates meaningfully increasing June 30 - 5.16% July 31 - 5.26% Rate excludes the impact of deferred fees/loan origination costs

34 Commercial Real Estate Portfolio $393 $407 $412 $431 $442 $441 $455 $468 $497 $507 $519 3.66% 4.90% 5.08% 4Q20 1Q21 2Q21 3Q21 4Q21 1Q22 2Q22 3Q22 4Q22 1Q23 2Q23 Period-End Loan Balance Average Loan Portfolio Yield for the Period Shown Dollars in millions • CRE loans extended to businesses / borrowers primarily located in our regional market area • No CRE exposure to large Metropolitan areas – e.g. no NYC exposure • As of June 30, 2023: – ~$334 million or ~ 67% of loans have rates tied to market indices, such as Prime, SOFR or FHLBNY – ~$116 million of loans will reprice within next 12 months – ~$24 million of fixed rate loans mature within 12 months – Total non-owner occupied Office exposure accounted for ~11% of CRE and ~1.9% of total loans – Total non-owner occupied Retail exposure accounted for ~15% of CRE and ~2.5% of total loans outstanding. – Total Hotels and Motels exposure accounted for ~24% of CRE and ~4.0% of total loans outstanding. – Total Other Accommodation and Food Services2 exposure accounted for ~8% of CRE and ~1.3% of total loans outstanding. – The majority of the remaining CRE exposure is comprised of multi-family and other residential investment properties 1Yield includes the impact of deferred fees and loan origination costs amortization 2Other Accommodation and Food Services includes RV parks, recreational camps, restaurants and other eating places. Commercial real estate excludes owner-occupied real estate loans 1 Portfolio rates trending upward June 30 - 5.10% July 31 - 5.12% Rate excludes the impact of deferred fees/loan origination costs

35 Commercial (C&I) Portfolio $305 $301 $312 $312 $316 $334 $346 $350 $350 $344 $352 4.17% 4.35% 4.57% 0.00% 1.00% 2.00% 3.00% 4.00% 5.00% 4Q20 1Q21 2Q21 3Q21 4Q21 1Q22 2Q22 3Q22 4Q22 1Q23 2Q23 Period-End Loan Balance Average Loan Portfolio Yield for the Period Shown Dollars in millions • C&I loans extended to businesses / borrowers primarily located in Arrow’s regional market area • Growing C&I Portfolio a potential source for deposit acquisition – ~$191 million or ~ 54% of loans have rates tied to market indices, such as Prime, SOFR or FHLBNY – ~$53 million of loans will reprice within next 12 months – Only ~$4 million of fixed rate loans mature within 12 months 1Yield includes the impact of deferred fees and loan origination costs amortization Commercial (C&I) includes owner-occupied real estate loans 1 Portfolio rates on strong upward trend June 30 - 4.75% July 31 - 4.83% Rate excludes the impact of deferred fees/loan origination costs

36 Residential Real Estate Loans $923 $908 $911 $930 $946 $967 $1,012 $1,051 $1,071 $1,081 $1,111 3.83% 3.79% 3.77% 3.76% 3.73% 3.71% 3.70% 3.78% 3.80% 4.10% 4.17% 4Q20 1Q21 2Q21 3Q21 4Q21 1Q22 2Q22 3Q22 4Q22 1Q23 2Q23 Period-End Loan Balance Average Loan Portfolio Yield for the Period Shown Dollars in millions • One-to-four family residential real estate secured by first or second mortgages on residences and home equity lines located in Arrow’s market area • LTV generally does not exceed 80% at time of origination (lower of purchase price or appraised value) • Loans exceeding 80% LTV at origination require private mortgage insurance or govt. guarantee • ~ $100MM, or 9%, of residential loan portfolio is for construction purposes • ~9% of the portfolio are home equity loans and lines • At June 30, 2023: • ~20% of portfolio subject to adjustable rates • ~80% of portfolio is fixed • ~$90MM or ~39% of the adjustable rate portfolio is within the active reset period 1Yield includes the impact of deferred fees and loan origination costs amortization 1 As of July 31, 2023, the average Residential Mortgage portfolio rate was ~3.89% and the Home Equity Line portfolio rate was ~7.34%, resulting in overall portfolio rate of ~4.20% Rates exclude the impact of deferred fees/loan origination costs
Credit Quality and Capital 37
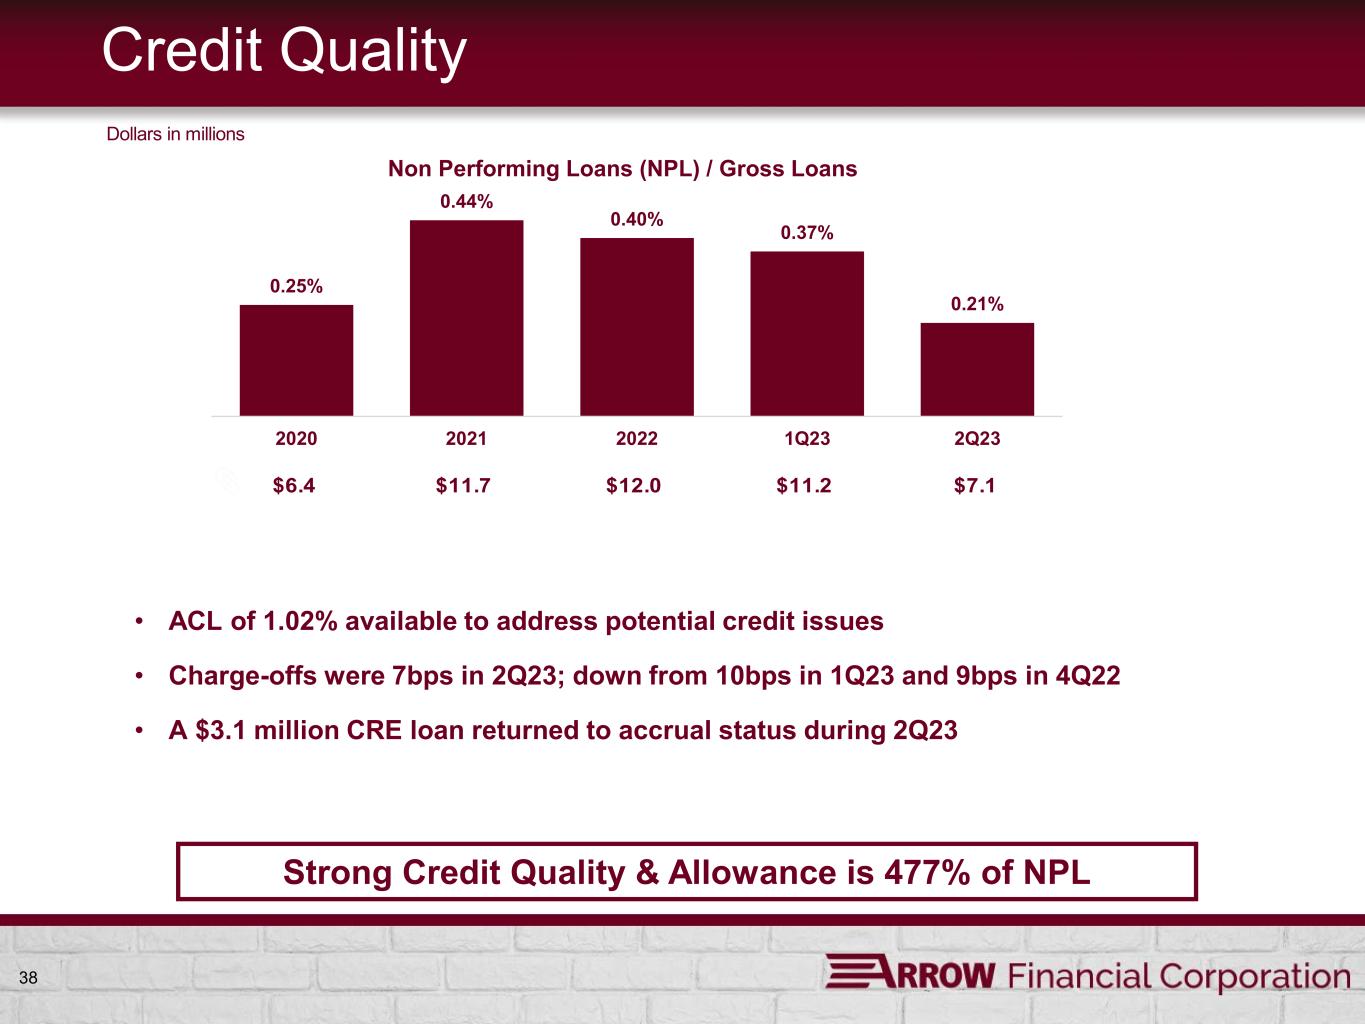
38 Credit Quality 0.25% 0.44% 0.40% 0.37% 0.21% 2020 2021 2022 1Q23 2Q23 Non Performing Loans (NPL) / Gross Loans Dollars in millions $6.4 $11.7 $12.0 $11.2 $7.1 • ACL of 1.02% available to address potential credit issues • Charge-offs were 7bps in 2Q23; down from 10bps in 1Q23 and 9bps in 4Q22 • A $3.1 million CRE loan returned to accrual status during 2Q23 Strong Credit Quality & Allowance is 477% of NPL
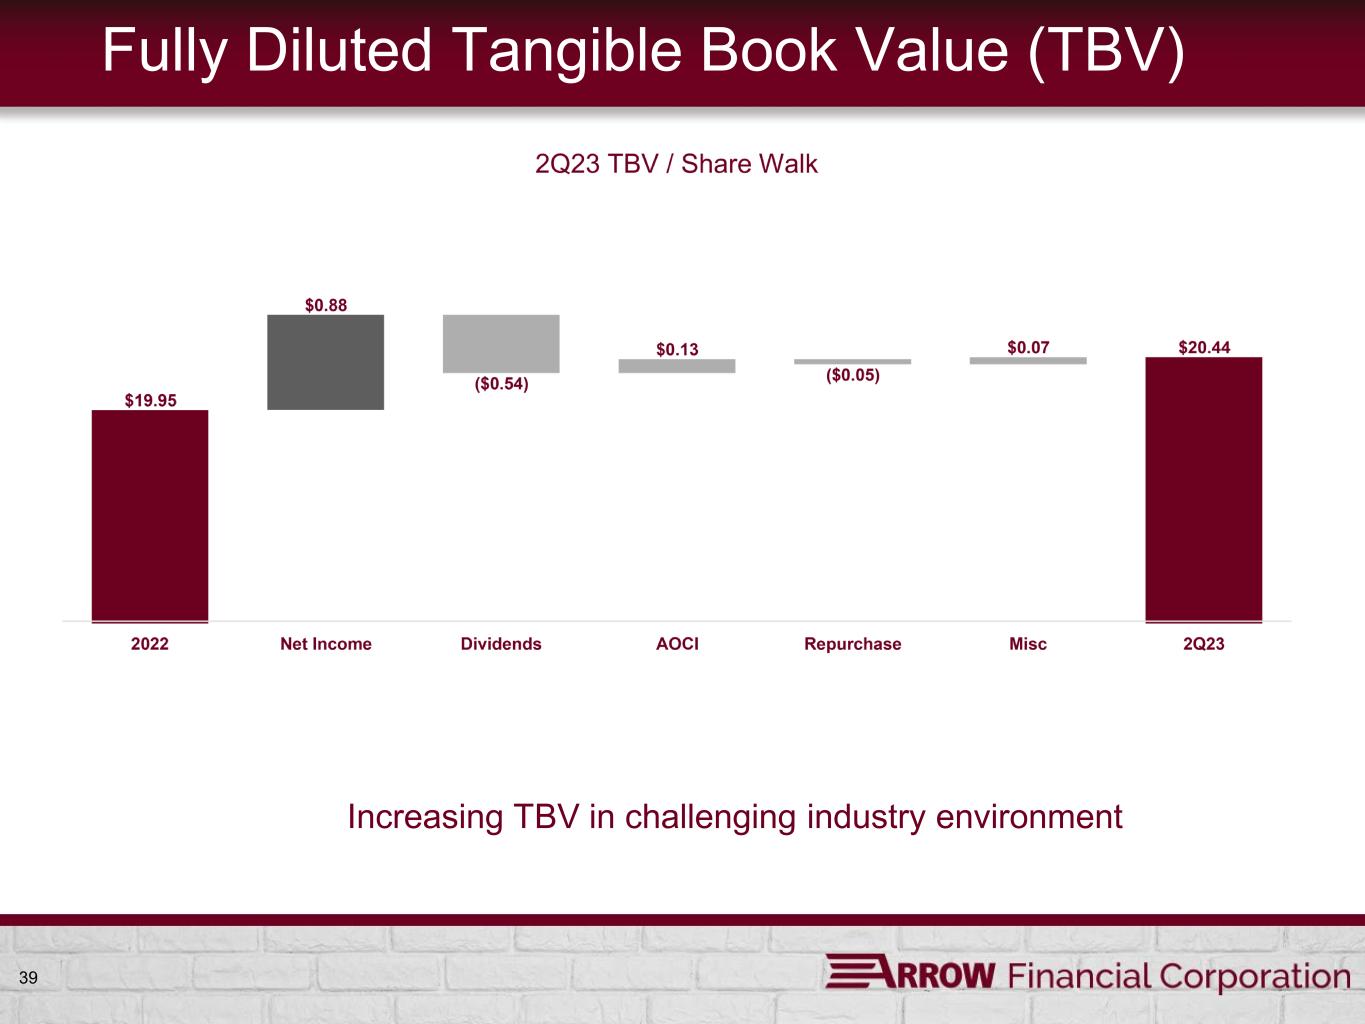
39 Fully Diluted Tangible Book Value (TBV) Increasing TBV in challenging industry environment
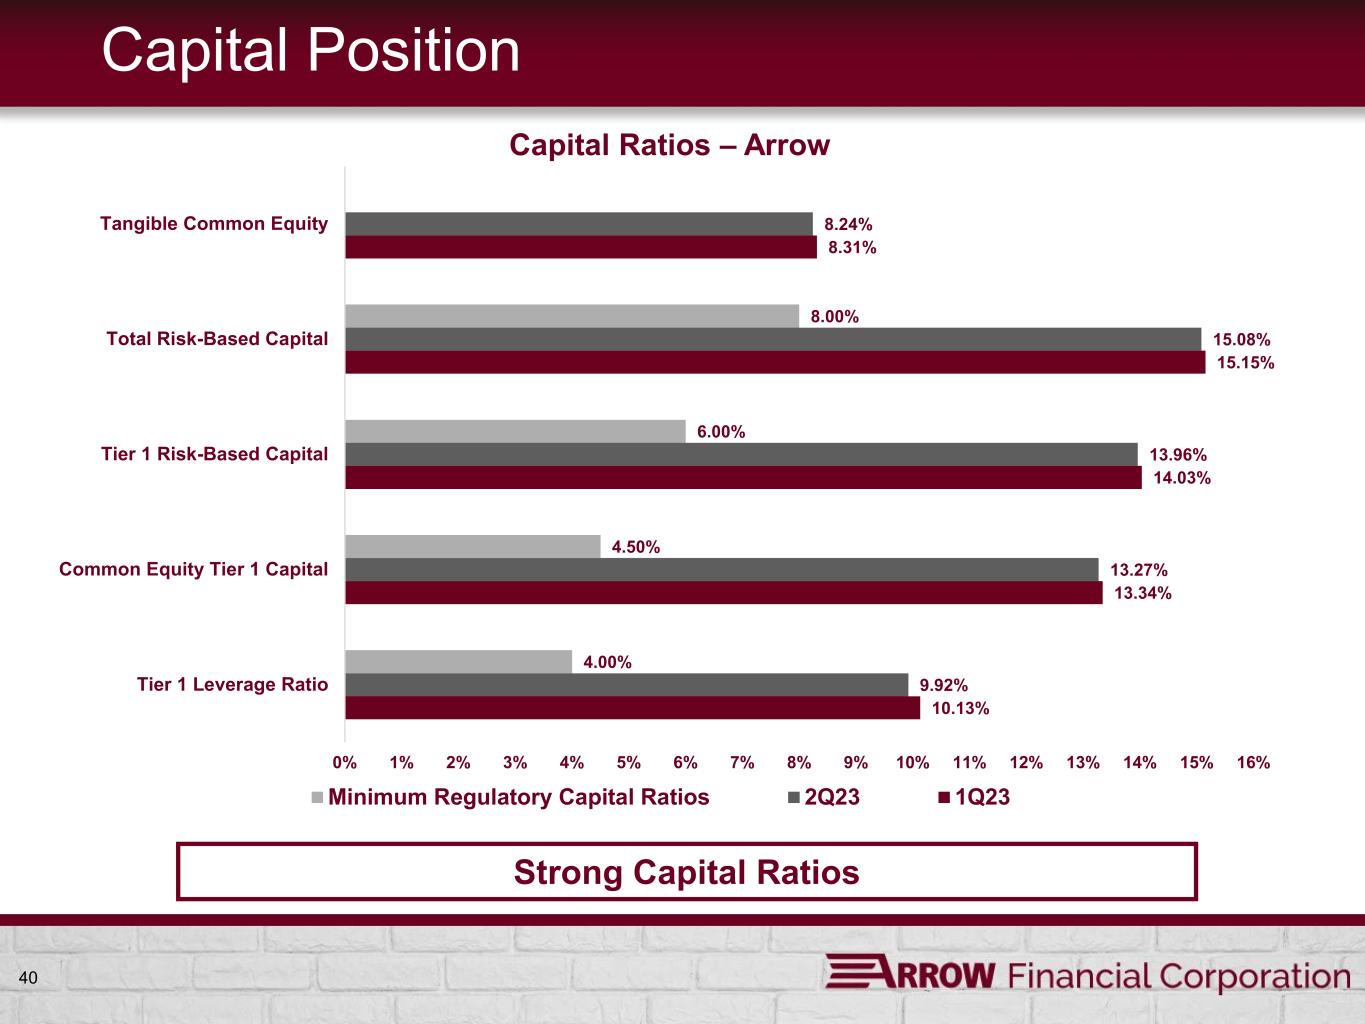
40 Capital Position 10.13% 13.34% 14.03% 15.15% 8.31% 9.92% 13.27% 13.96% 15.08% 8.24% 4.00% 4.50% 6.00% 8.00% 0% 1% 2% 3% 4% 5% 6% 7% 8% 9% 10% 11% 12% 13% 14% 15% 16% Tier 1 Leverage Ratio Common Equity Tier 1 Capital Tier 1 Risk-Based Capital Total Risk-Based Capital Tangible Common Equity Capital Ratios – Arrow Minimum Regulatory Capital Ratios 2Q23 1Q23 Strong Capital Ratios
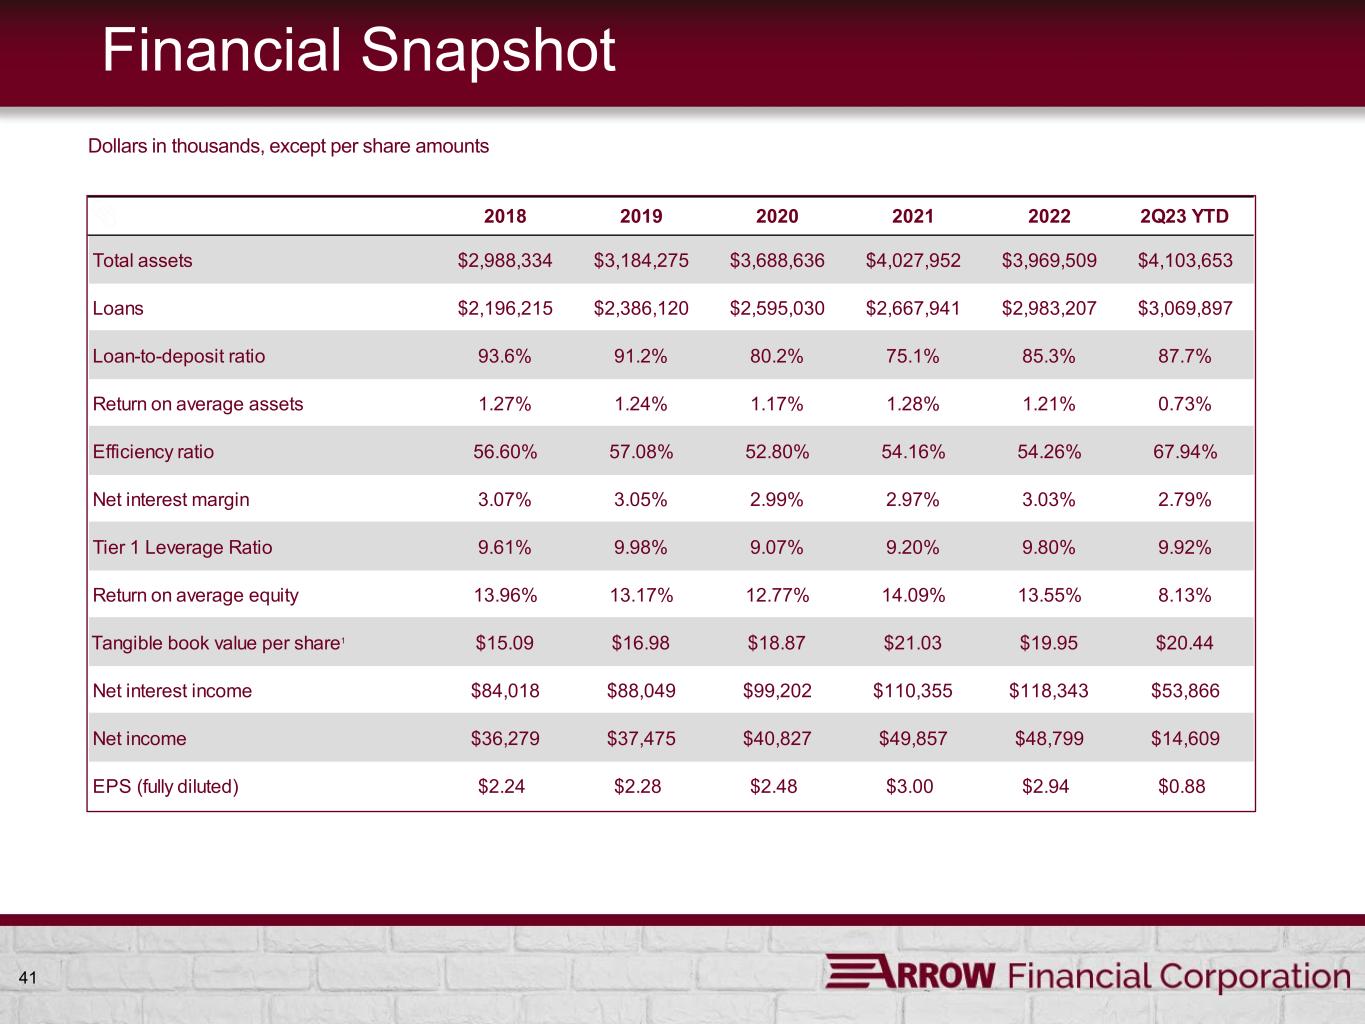
41 Financial Snapshot 2018 2019 2020 2021 2022 2Q23 YTD Total assets $2,988,334 $3,184,275 $3,688,636 $4,027,952 $3,969,509 $4,103,653 Loans $2,196,215 $2,386,120 $2,595,030 $2,667,941 $2,983,207 $3,069,897 Loan-to-deposit ratio 93.6% 91.2% 80.2% 75.1% 85.3% 87.7% Return on average assets 1.27% 1.24% 1.17% 1.28% 1.21% 0.73% Efficiency ratio 56.60% 57.08% 52.80% 54.16% 54.26% 67.94% Net interest margin 3.07% 3.05% 2.99% 2.97% 3.03% 2.79% Tier 1 Leverage Ratio 9.61% 9.98% 9.07% 9.20% 9.80% 9.92% Return on average equity 13.96% 13.17% 12.77% 14.09% 13.55% 8.13% Tangible book value per share1 $15.09 $16.98 $18.87 $21.03 $19.95 $20.44 Net interest income $84,018 $88,049 $99,202 $110,355 $118,343 $53,866 Net income $36,279 $37,475 $40,827 $49,857 $48,799 $14,609 EPS (fully diluted) $2.24 $2.28 $2.48 $3.00 $2.94 $0.88 Dollars in thousands, except per share amounts
Thank You


