Investor Presentation As of September 30, 2020
Forward-Looking Statements This presentation of First US Bancshares, Inc. (“FUSB” or the “Company”) contains forward-looking statements, as defined by federal securities laws. Statements contained in this presentation that are not historical facts are forward-looking statements. These statements may address issues that involve significant risks, uncertainties, estimates and assumptions made by FUSB’s senior management. FUSB undertakes no obligation to update these statements following the date of this presentation, except as required by law. In addition, FUSB, through its senior management, may make from time to time forward-looking public statements concerning the matters described herein. Such forward-looking statements are necessarily estimates reflecting the best judgment of FUSB’s senior management based upon current information and involve a number of risks and uncertainties. Certain factors that could affect the accuracy of such forward-looking statements are identified in the public filings made by FUSB with the Securities and Exchange Commission (the “SEC”), including FUSB’s most recent Annual Report on Form 10-K and Quarterly Report on Form 10-Q, and forward-looking statements contained in this presentation or in other public statements of FUSB or its senior management should be considered in light of those factors. Specifically, with respect to statements relating to the sufficiency of the allowance for loan and lease losses, loan demand, cash flows, interest costs, growth and earnings potential, expansion and FUSB’s positioning to handle the challenges presented by COVID-19, these factors include, but are not limited to, the rate of growth (or lack thereof) in the economy generally and in FUSB’s service areas; market conditions and investment returns; changes in interest rates; the impact of the COVID-19 pandemic on FUSB’s business, FUSB’s customers, the communities that FUSB serves and the United States economy, including the impact of actions taken by governmental authorities to try to contain the virus or address the impact of the virus on the United States economy (including, without limitation, the Coronavirus Aid, Relief and Economic Security (CARES) Act and subsequent federal legislation) and the resulting effect on FUSB’s operations, liquidity and capital position and on the financial condition of FUSB’s borrowers and other customers; the pending discontinuation of LIBOR as an interest rate benchmark; the availability of quality loans in FUSB’s service areas; the relative strength and weakness in the consumer and commercial credit sectors and in the real estate markets; collateral values; cybersecurity threats; and risks related to the Paycheck Protection Program. There can be no assurance that such factors or other factors will not affect the accuracy of such forward-looking statements.
Presentation Disclosure This presentation has been prepared by FUSB solely for informational purposes based on its own information, as well as information from public sources. This presentation has been prepared to assist interested parties in making their own evaluation of FUSB and does not purport to contain all of the information that may be relevant. In all cases, interested parties should conduct their own investigation and analysis of FUSB and the information included in this presentation or other information provided by or on behalf of FUSB. This presentation does not constitute an offer to sell or a solicitation of an offer to buy any securities of FUSB by any person in any jurisdiction in which it is unlawful for such person to make such an offer or solicitation. Neither the SEC nor any state securities commission has approved or disapproved of the securities of FUSB or passed upon the accuracy or adequacy of this presentation. Any representation to the contrary is a criminal offense. Except as otherwise indicated, this presentation speaks as of the date indicated on the cover page. The delivery of this presentation shall not, under any circumstances, create any implication that there has been no change in the affairs of FUSB after such date. This presentation includes unaudited financial measures that have been prepared other than in accordance with generally accepted accounting principles in the United States (“non-GAAP financial measures”), including tangible book value per common share, return on average tangible common equity and tangible common equity to tangible assets. FUSB presents non-GAAP financial measures when it believes that the additional information is useful and meaningful to management and investors. Non-GAAP financial measures do not have any standardized meaning and, therefore, may not be comparable to similar measures presented by other companies. The presentation of non-GAAP financial measures is not intended to be a substitute for, and should not be considered in isolation from, the financial measures reported in accordance with GAAP. See Appendix B to this presentation for a reconciliation of certain non-GAAP financial measures to the comparable GAAP measures. Quarterly data and 9/30/2020 data presented herein have not been audited by FUSB’s independent registered public accounting firm.
Contents Corporate Profile ………………………………………..……………………………………...….…......5 Q3 2020 Highlights……………..…….………...……………………………………………………….....9 Financial Results through September 30, 2020….………………………………………………….15 2020 Year-to-Date Highlights……..………….………………........................……………………....19 Ongoing Strategic Focus……………………………………………………………………………….22 Appendix A: Historical Information……………………………………...……………………...……26 Appendix B: Non-GAAP Reconciliation….……….....………………………………………..…….32
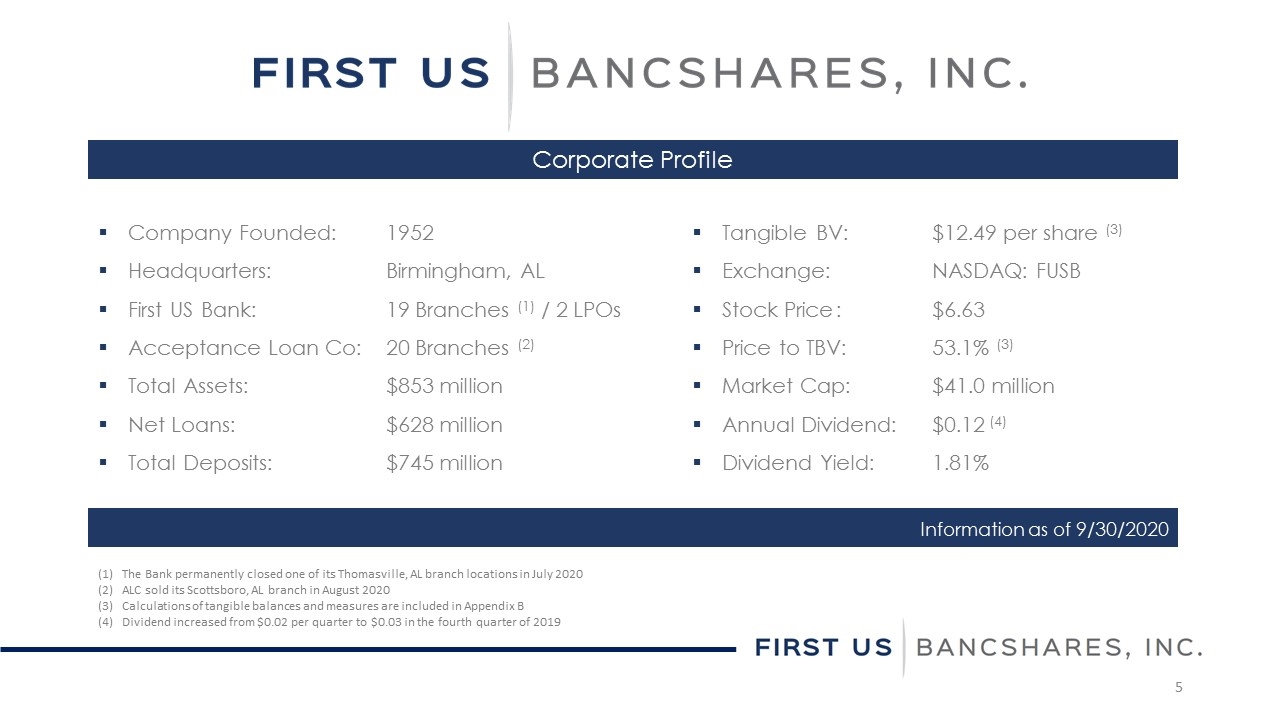
Company Founded:1952 Headquarters:Birmingham, AL First US Bank:19 Branches (1) / 2 LPOs Acceptance Loan Co:20 Branches (2) Total Assets:$853 million Net Loans:$628 million Total Deposits:$745 million Tangible BV:$12.49 per share (3) Exchange:NASDAQ: FUSB Stock Price:$6.63 Price to TBV:53.1% (3) Market Cap:$41.0 million Annual Dividend:$0.12 (4) Dividend Yield:1.81% Corporate Profile Information as of 9/30/2020 The Bank permanently closed one of its Thomasville, AL branch locations in July 2020 ALC sold its Scottsboro, AL branch in August 2020 Calculations of tangible balances and measures are included in Appendix B Dividend increased from $0.02 per quarter to $0.03 in the fourth quarter of 2019
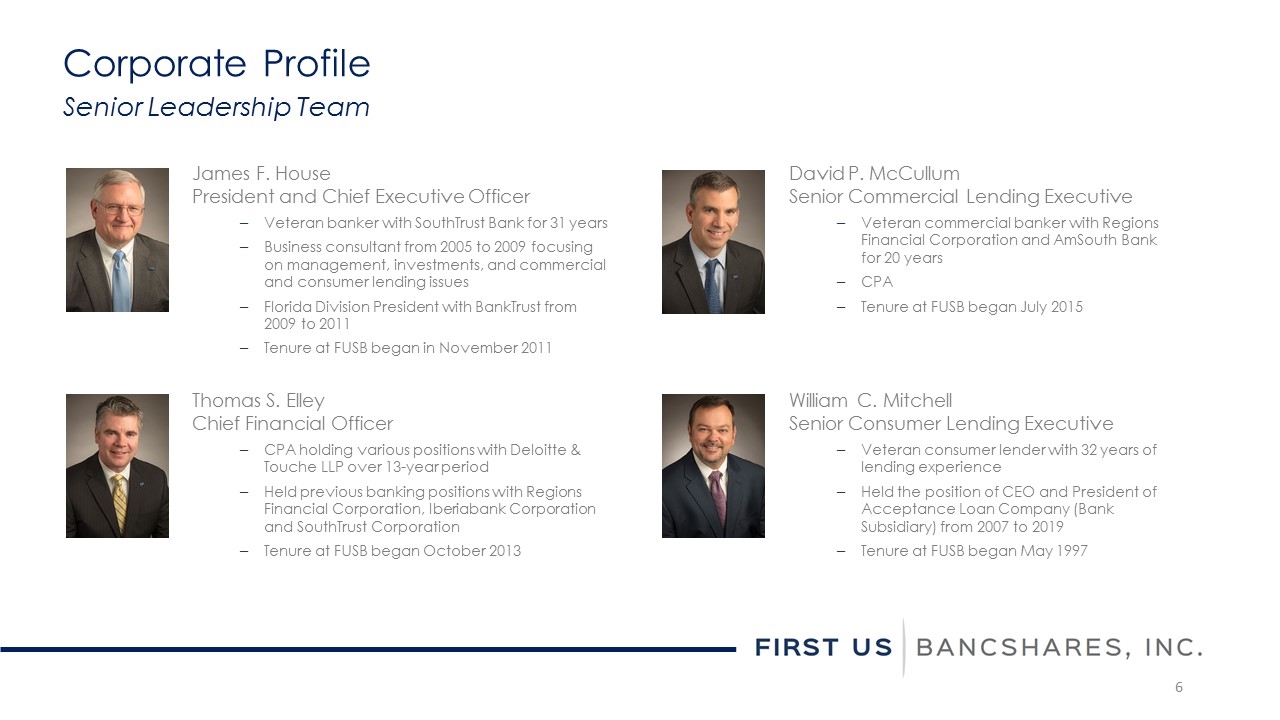
Corporate Profile Senior Leadership Team James F. House President and Chief Executive Officer Veteran banker with SouthTrust Bank for 31 years Business consultant from 2005 to 2009 focusing on management, investments, and commercial and consumer lending issues Florida Division President with BankTrust from 2009 to 2011 Tenure at FUSB began in November 2011 Thomas S. Elley Chief Financial Officer CPA holding various positions with Deloitte & Touche LLP over 13-year period Held previous banking positions with Regions Financial Corporation, Iberiabank Corporation and SouthTrust Corporation Tenure at FUSB began October 2013 David P. McCullum Senior Commercial Lending Executive Veteran commercial banker with Regions Financial Corporation and AmSouth Bank for 20 years CPA Tenure at FUSB began July 2015 William C. Mitchell Senior Consumer Lending Executive Veteran consumer lender with 32 years of lending experience Held the position of CEO and President of Acceptance Loan Company (Bank Subsidiary) from 2007 to 2019 Tenure at FUSB began May 1997
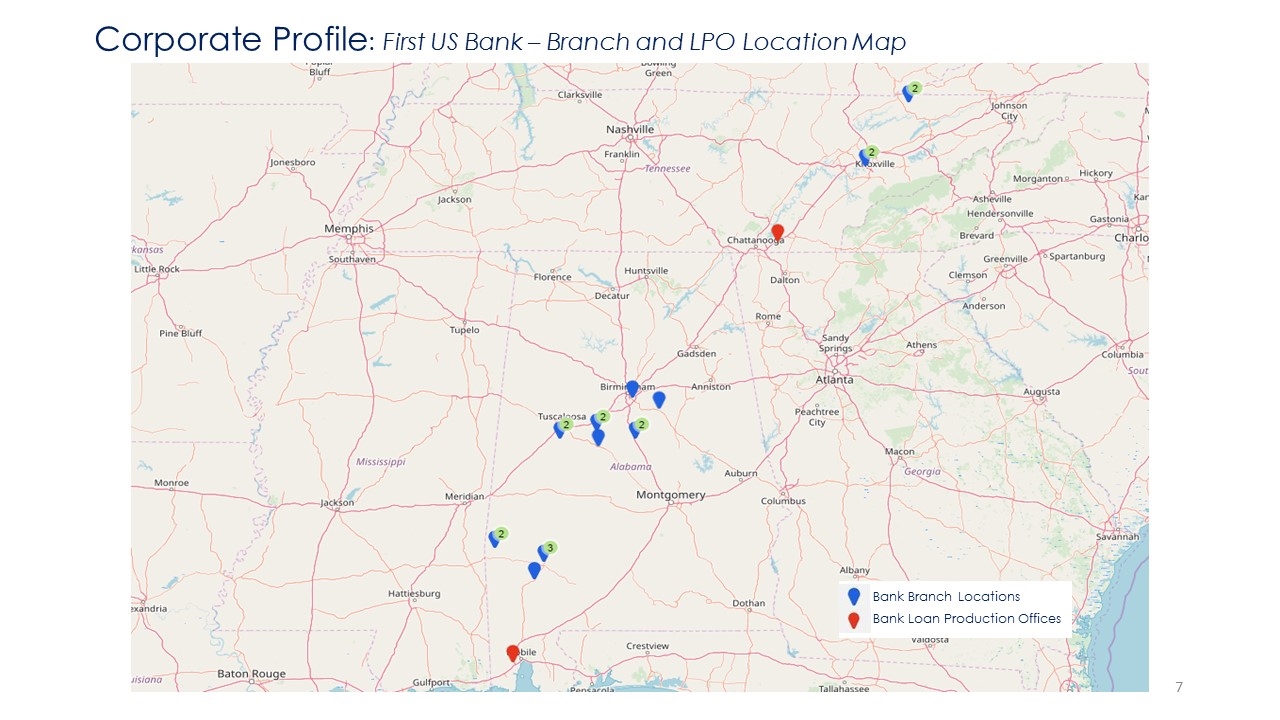
Corporate Profile: First US Bank – Branch and LPO Location Map Bank Branch Locations Bank Loan Production Offices
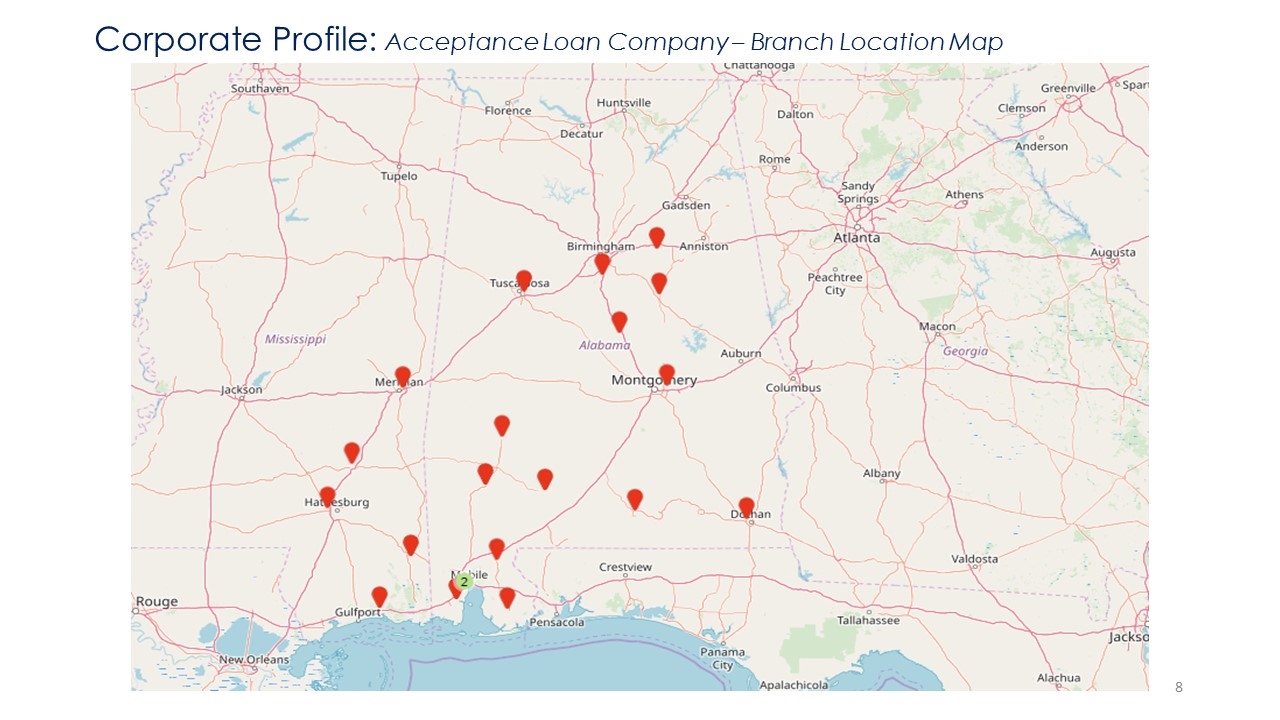
Corporate Profile: Acceptance Loan Company – Branch Location Map
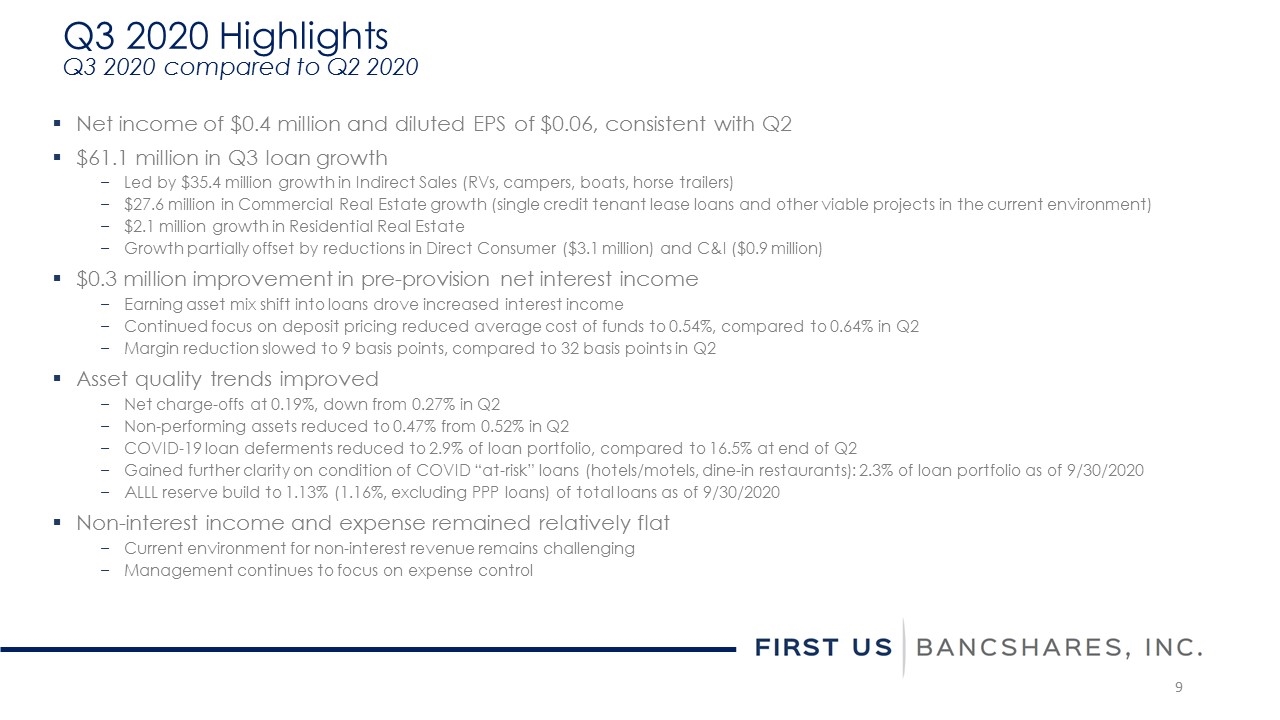
Net income of $0.4 million and diluted EPS of $0.06, consistent with Q2 $61.1 million in Q3 loan growth Led by $35.4 million growth in Indirect Sales (RVs, campers, boats, horse trailers) $27.6 million in Commercial Real Estate growth (single credit tenant lease loans and other viable projects in the current environment) $2.1 million growth in Residential Real Estate Growth partially offset by reductions in Direct Consumer ($3.1 million) and C&I ($0.9 million) $0.3 million improvement in pre-provision net interest income Earning asset mix shift into loans drove increased interest income Continued focus on deposit pricing reduced average cost of funds to 0.54%, compared to 0.64% in Q2 Margin reduction slowed to 9 basis points, compared to 32 basis points in Q2 Asset quality trends improved Net charge-offs at 0.19%, down from 0.27% in Q2 Non-performing assets reduced to 0.47% from 0.52% in Q2 COVID-19 loan deferments reduced to 2.9% of loan portfolio, compared to 16.5% at end of Q2 Gained further clarity on condition of COVID “at-risk” loans (hotels/motels, dine-in restaurants): 2.3% of loan portfolio as of 9/30/2020 ALLL reserve build to 1.13% (1.16%, excluding PPP loans) of total loans as of 9/30/2020 Non-interest income and expense remained relatively flat Current environment for non-interest revenue remains challenging Management continues to focus on expense control Q3 2020 Highlights Q3 2020 compared to Q2 2020
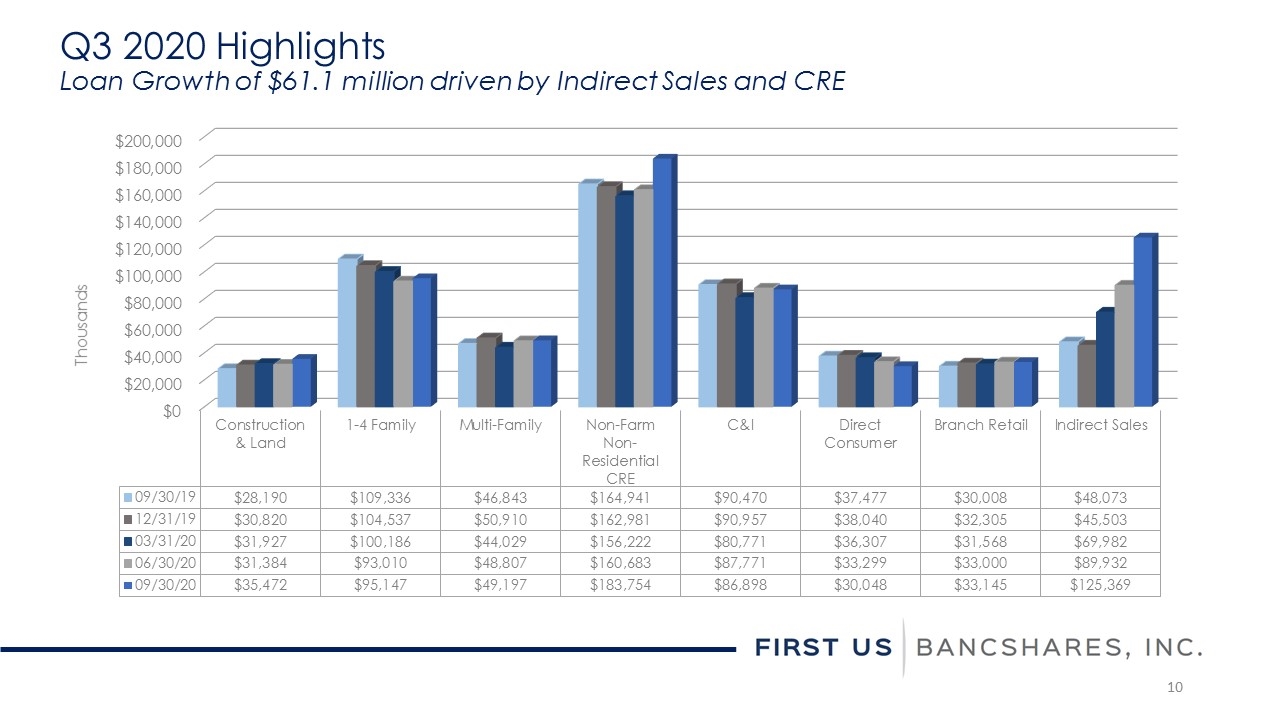
Q3 2020 Highlights Loan Growth of $61.1 million driven by Indirect Sales and CRE
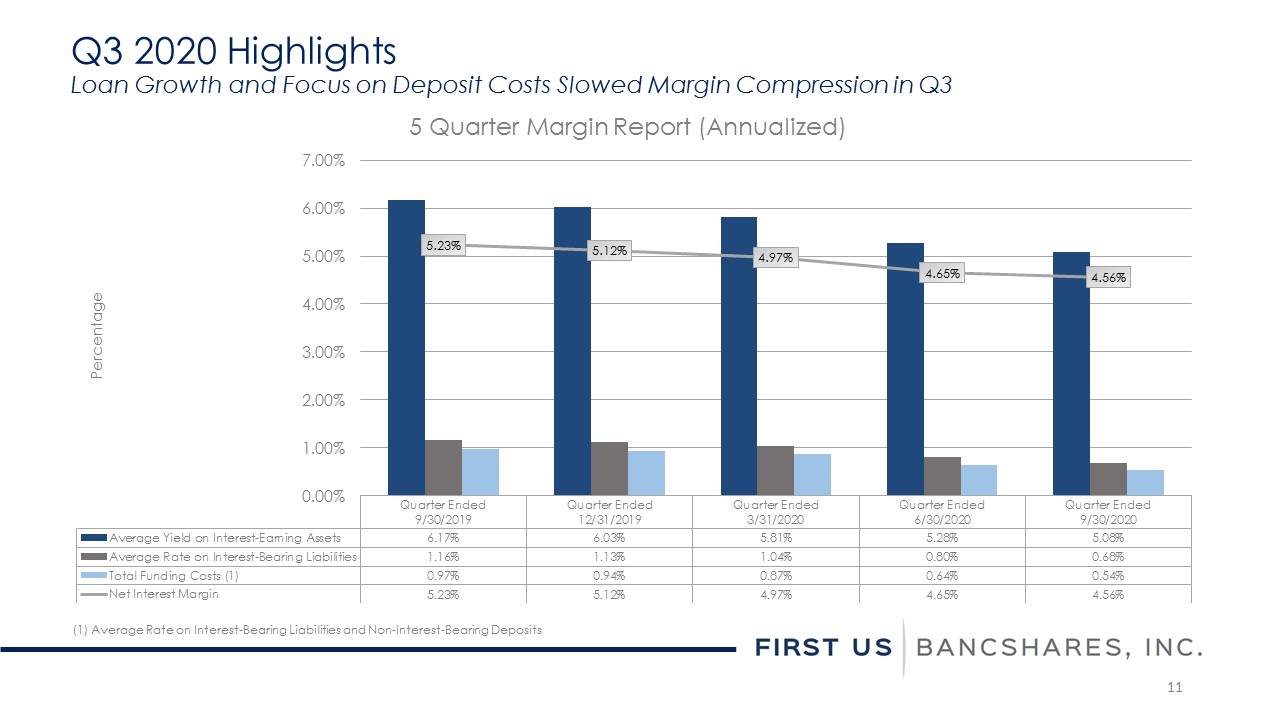
Q3 2020 Highlights Loan Growth and Focus on Deposit Costs Slowed Margin Compression in Q3 5 Quarter Margin Report (Annualized) (1) Average Rate on Interest-Bearing Liabilities and Non-Interest-Bearing Deposits
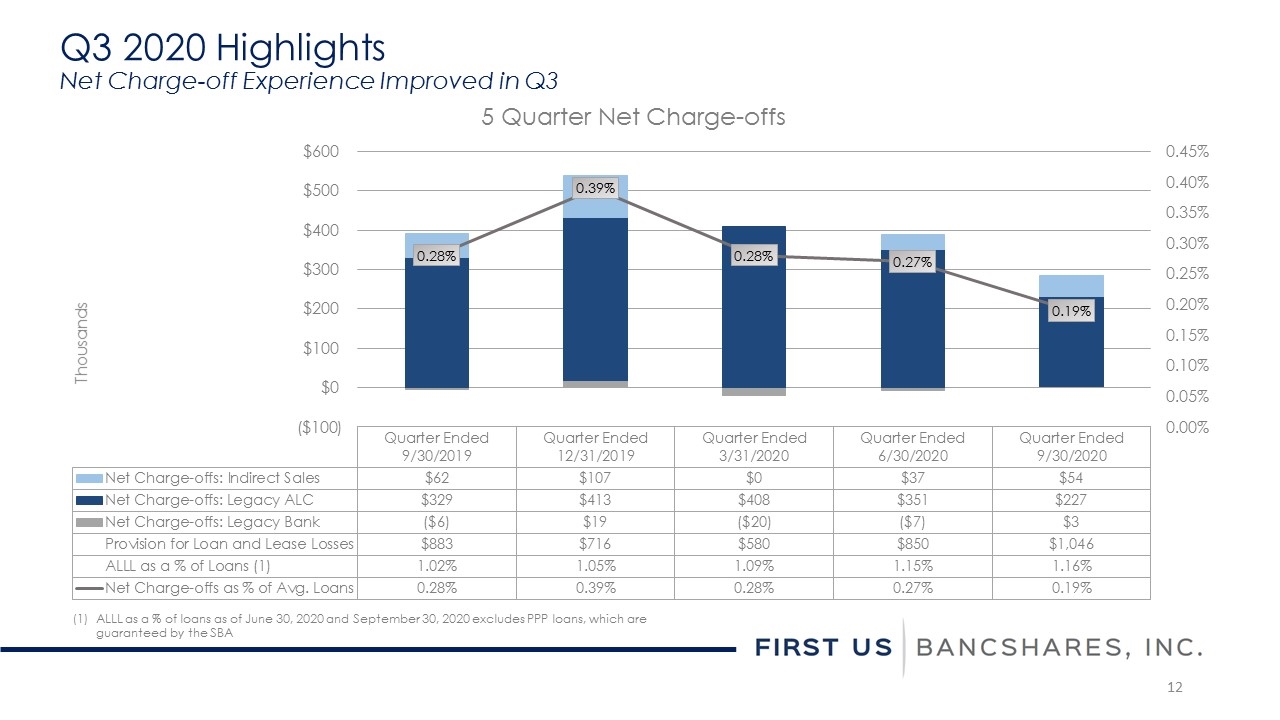
Q3 2020 Highlights Net Charge-off Experience Improved in Q3 ALLL as a % of loans as of June 30, 2020 and September 30, 2020 excludes PPP loans, which are guaranteed by the SBA 5 Quarter Net Charge-offs
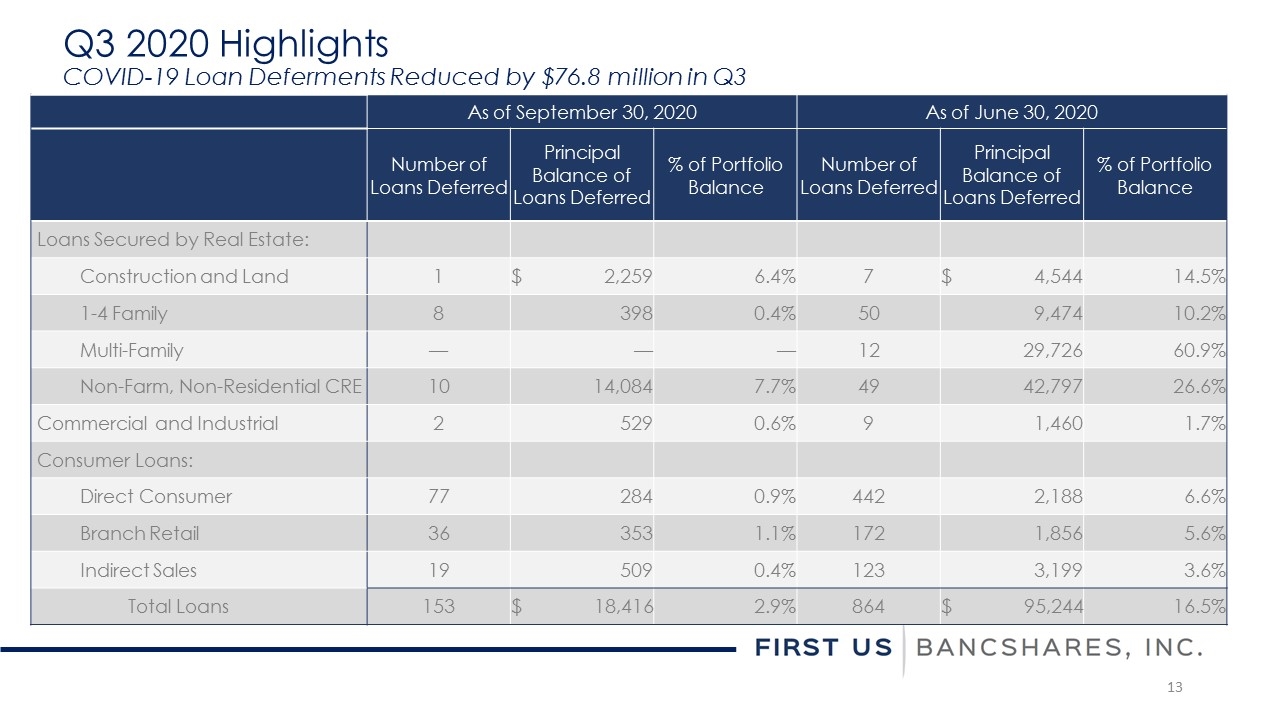
Q3 2020 Highlights COVID-19 Loan Deferments Reduced by $76.8 million in Q3 As of September 30, 2020 As of June 30, 2020 Number of Loans Deferred Principal Balance of Loans Deferred % of Portfolio Balance Number of Loans Deferred Principal Balance of Loans Deferred % of Portfolio Balance Loans Secured by Real Estate: Construction and Land 1 $ 2,259 6.4% 7 $ 4,544 14.5% 1-4 Family 8 398 0.4% 50 9,474 10.2% Multi-Family — — — 12 29,726 60.9% Non-Farm, Non-Residential CRE 10 14,084 7.7% 49 42,797 26.6% Commercial and Industrial 2 529 0.6% 9 1,460 1.7% Consumer Loans: Direct Consumer 77 284 0.9% 442 2,188 6.6% Branch Retail 36 353 1.1% 172 1,856 5.6% Indirect Sales 19 509 0.4% 123 3,199 3.6% Total Loans 153 $ 18,416 2.9% 864 $ 95,244 16.5%
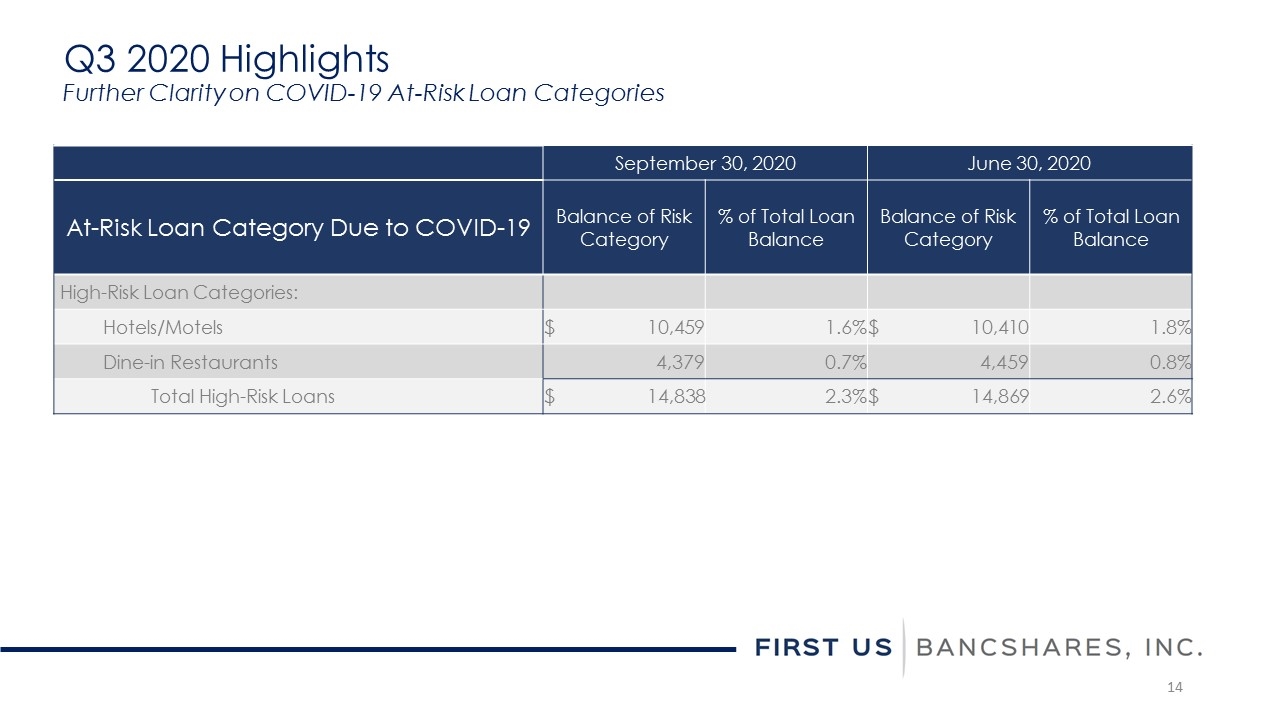
Q3 2020 Highlights Further Clarity on COVID-19 At-Risk Loan Categories September 30, 2020 June 30, 2020 At-Risk Loan Category Due to COVID-19 Balance of Risk Category % of Total Loan Balance Balance of Risk Category % of Total Loan Balance High-Risk Loan Categories: Hotels/Motels $ 10,459 1.6% $ 10,410 1.8% Dine-in Restaurants 4,379 0.7% 4,459 0.8% Total High-Risk Loans $ 14,838 2.3% $ 14,869 2.6%
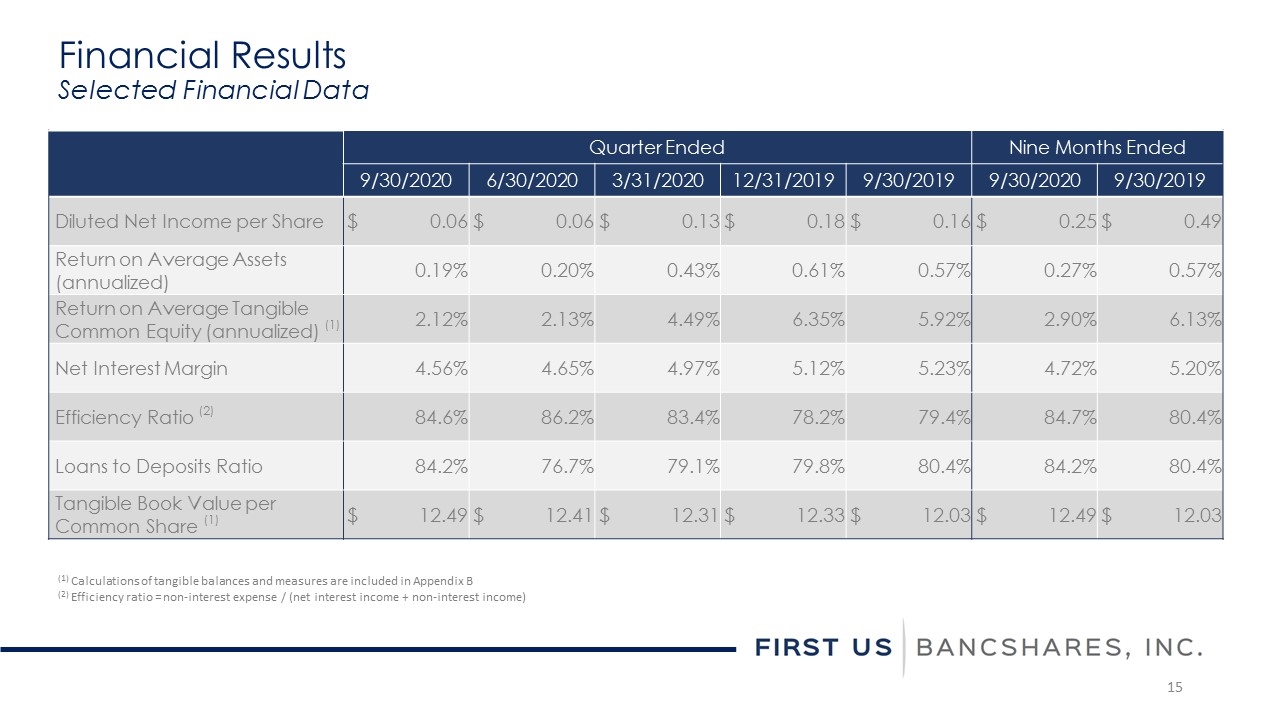
Quarter Ended Nine Months Ended 9/30/2020 6/30/2020 3/31/2020 12/31/2019 9/30/2019 9/30/2020 9/30/2019 Diluted Net Income per Share $ 0.06 $ 0.06 $ 0.13 $ 0.18 $ 0.16 $ 0.25 $ 0.49 Return on Average Assets (annualized) 0.19% 0.20% 0.43% 0.61% 0.57% 0.27% 0.57% Return on Average Tangible Common Equity (annualized) (1) 2.12% 2.13% 4.49% 6.35% 5.92% 2.90% 6.13% Net Interest Margin 4.56% 4.65% 4.97% 5.12% 5.23% 4.72% 5.20% Efficiency Ratio (2) 84.6% 86.2% 83.4% 78.2% 79.4% 84.7% 80.4% Loans to Deposits Ratio 84.2% 76.7% 79.1% 79.8% 80.4% 84.2% 80.4% Tangible Book Value per Common Share (1) $ 12.49 $ 12.41 $ 12.31 $ 12.33 $ 12.03 $ 12.49 $ 12.03 Financial Results Selected Financial Data (1) Calculations of tangible balances and measures are included in Appendix B (2) Efficiency ratio = non-interest expense / (net interest income + non-interest income)

Financial Results Income Statements (dollars in thousands, except per share data) Quarter Ended Nine Months Ended 9/30/2020 6/30/2020 3/31/2020 12/31/2019 9/30/2019 9/30/2020 9/30/2019 Total Interest Income $ 9,996 $ 9,780 $ 10,397 $ 10,825 $ 11,027 $ 30,173 $ 32,763 Total Interest Expense 1,031 1,157 1,511 1,636 1,680 3,699 5,010 Net Interest Income $ 8,965 $ 8,623 $ 8,886 $ 9,189 $ 9,347 $ 26,474 $ 27,753 Provision for Loan and Lease Losses 1,046 850 580 716 883 2,476 1,998 Net Interest Income After Provision for Loan and Lease Losses $ 7,919 $ 7,773 $ 8,306 $ 8,473 $ 8,464 $ 23,998 $ 25,755 Total Non-Interest Income 1,375 1,330 1,297 1,396 1,414 4,002 3,970 Total Non-Interest Expense 8,747 8,581 8,494 8,279 8,546 25,822 25,503 Income Before Income Taxes $ 547 $ 522 $ 1,109 $ 1,590 $ 1,332 $ 2,178 $ 4,222 Provision for Income Taxes 136 118 262 381 214 516 865 Net Income $ 411 $ 404 $ 847 $ 1,209 $ 1,118 $ 1,662 $ 3,357 Basic Net Income per Share $ 0.07 $ 0.07 $ 0.13 $ 0.19 $ 0.17 $ 0.27 $ 0.52 Diluted Net Income per Share $ 0.06 $ 0.06 $ 0.13 $ 0.18 $ 0.16 $ 0.25 $ 0.49 Dividends per Share $ 0.03 $ 0.03 $ 0.03 $ 0.03 $ 0.02 $ 0.09 $ 0.06
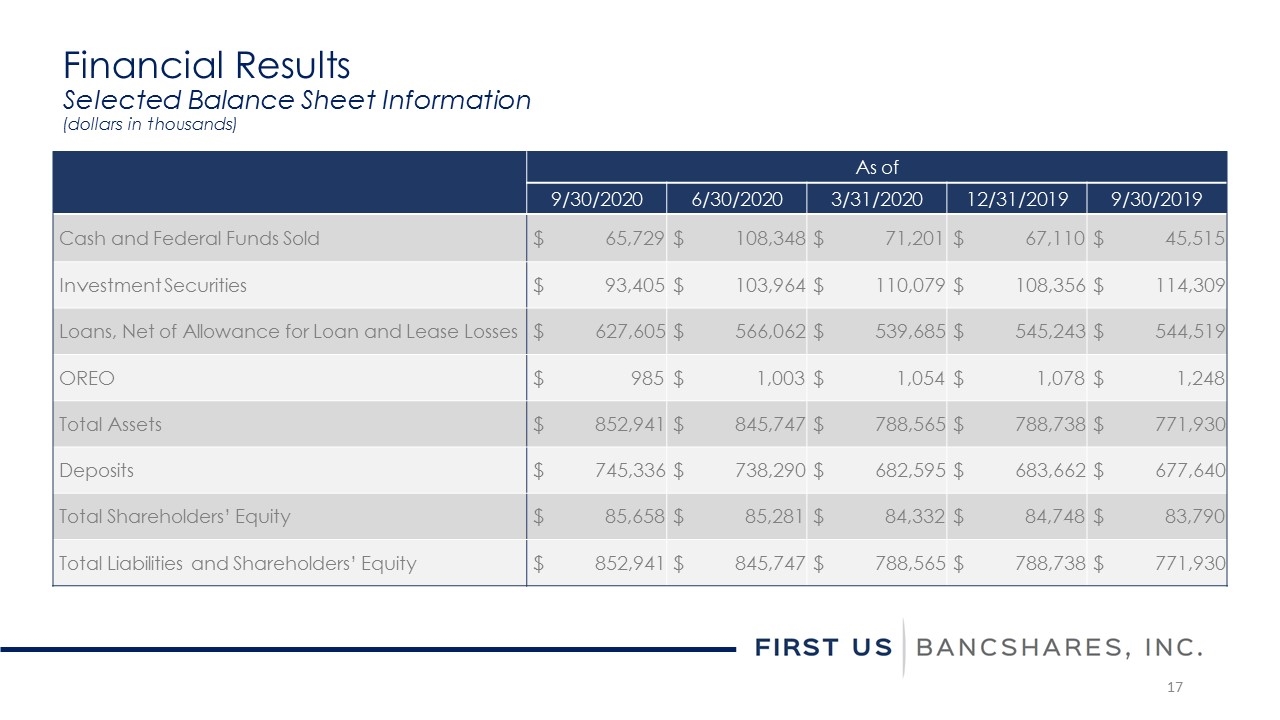
Financial Results Selected Balance Sheet Information (dollars in thousands) As of 9/30/2020 6/30/2020 3/31/2020 12/31/2019 9/30/2019 Cash and Federal Funds Sold $ 65,729 $ 108,348 $ 71,201 $ 67,110 $ 45,515 Investment Securities $ 93,405 $ 103,964 $ 110,079 $ 108,356 $ 114,309 Loans, Net of Allowance for Loan and Lease Losses $ 627,605 $ 566,062 $ 539,685 $ 545,243 $ 544,519 OREO $ 985 $ 1,003 $ 1,054 $ 1,078 $ 1,248 Total Assets $ 852,941 $ 845,747 $ 788,565 $ 788,738 $ 771,930 Deposits $ 745,336 $ 738,290 $ 682,595 $ 683,662 $ 677,640 Total Shareholders’ Equity $ 85,658 $ 85,281 $ 84,332 $ 84,748 $ 83,790 Total Liabilities and Shareholders’ Equity $ 852,941 $ 845,747 $ 788,565 $ 788,738 $ 771,930
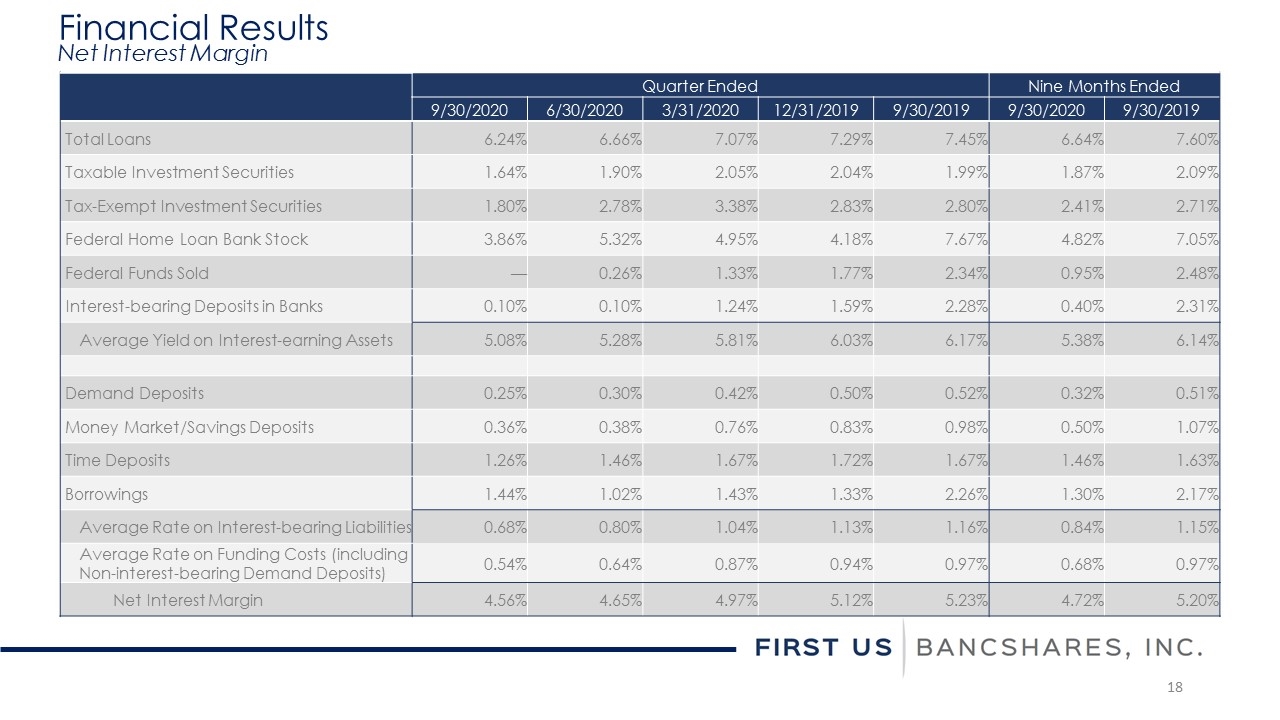
Quarter Ended Nine Months Ended 9/30/2020 6/30/2020 3/31/2020 12/31/2019 9/30/2019 9/30/2020 9/30/2019 Total Loans 6.24% 6.66% 7.07% 7.29% 7.45% 6.64% 7.60% Taxable Investment Securities 1.64% 1.90% 2.05% 2.04% 1.99% 1.87% 2.09% Tax-Exempt Investment Securities 1.80% 2.78% 3.38% 2.83% 2.80% 2.41% 2.71% Federal Home Loan Bank Stock 3.86% 5.32% 4.95% 4.18% 7.67% 4.82% 7.05% Federal Funds Sold — 0.26% 1.33% 1.77% 2.34% 0.95% 2.48% Interest-bearing Deposits in Banks 0.10% 0.10% 1.24% 1.59% 2.28% 0.40% 2.31% Average Yield on Interest-earning Assets 5.08% 5.28% 5.81% 6.03% 6.17% 5.38% 6.14% Demand Deposits 0.25% 0.30% 0.42% 0.50% 0.52% 0.32% 0.51% Money Market/Savings Deposits 0.36% 0.38% 0.76% 0.83% 0.98% 0.50% 1.07% Time Deposits 1.26% 1.46% 1.67% 1.72% 1.67% 1.46% 1.63% Borrowings 1.44% 1.02% 1.43% 1.33% 2.26% 1.30% 2.17% Average Rate on Interest-bearing Liabilities 0.68% 0.80% 1.04% 1.13% 1.16% 0.84% 1.15% Average Rate on Funding Costs (including Non-interest-bearing Demand Deposits) 0.54% 0.64% 0.87% 0.94% 0.97% 0.68% 0.97% Net Interest Margin 4.56% 4.65% 4.97% 5.12% 5.23% 4.72% 5.20% Financial Results Net Interest Margin
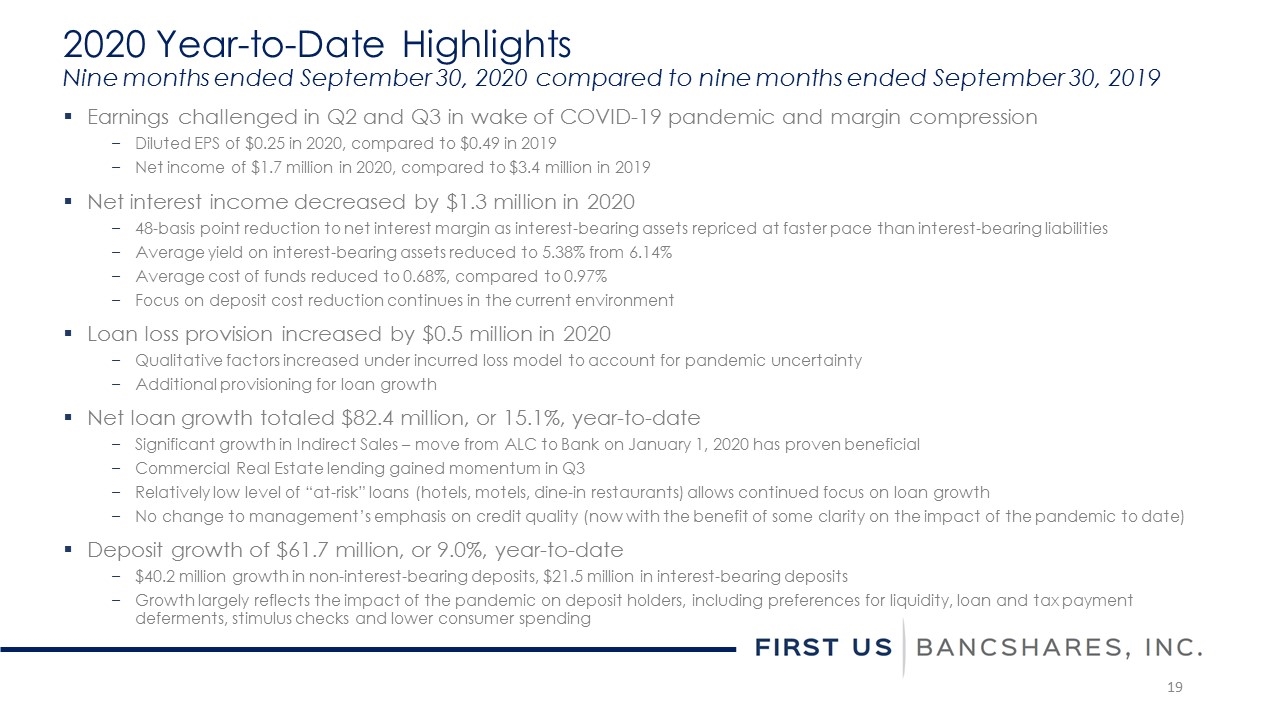
Earnings challenged in Q2 and Q3 in wake of COVID-19 pandemic and margin compression Diluted EPS of $0.25 in 2020, compared to $0.49 in 2019 Net income of $1.7 million in 2020, compared to $3.4 million in 2019 Net interest income decreased by $1.3 million in 2020 48-basis point reduction to net interest margin as interest-bearing assets repriced at faster pace than interest-bearing liabilities Average yield on interest-bearing assets reduced to 5.38% from 6.14% Average cost of funds reduced to 0.68%, compared to 0.97% Focus on deposit cost reduction continues in the current environment Loan loss provision increased by $0.5 million in 2020 Qualitative factors increased under incurred loss model to account for pandemic uncertainty Additional provisioning for loan growth Net loan growth totaled $82.4 million, or 15.1%, year-to-date Significant growth in Indirect Sales – move from ALC to Bank on January 1, 2020 has proven beneficial Commercial Real Estate lending gained momentum in Q3 Relatively low level of “at-risk” loans (hotels, motels, dine-in restaurants) allows continued focus on loan growth No change to management’s emphasis on credit quality (now with the benefit of some clarity on the impact of the pandemic to date) Deposit growth of $61.7 million, or 9.0%, year-to-date $40.2 million growth in non-interest-bearing deposits, $21.5 million in interest-bearing deposits Growth largely reflects the impact of the pandemic on deposit holders, including preferences for liquidity, loan and tax payment deferments, stimulus checks and lower consumer spending 2020 Year-to-Date Highlights Nine months ended September 30, 2020 compared to nine months ended September 30, 2019
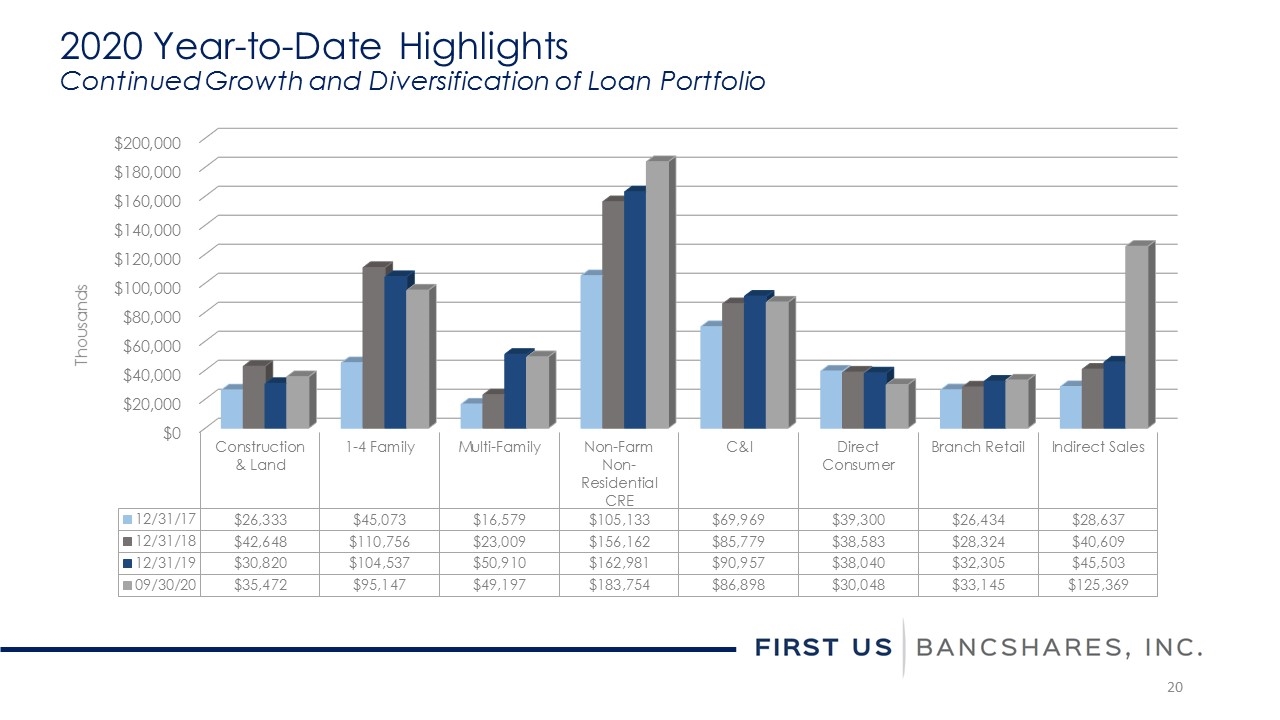
2020 Year-to-Date Highlights Continued Growth and Diversification of Loan Portfolio
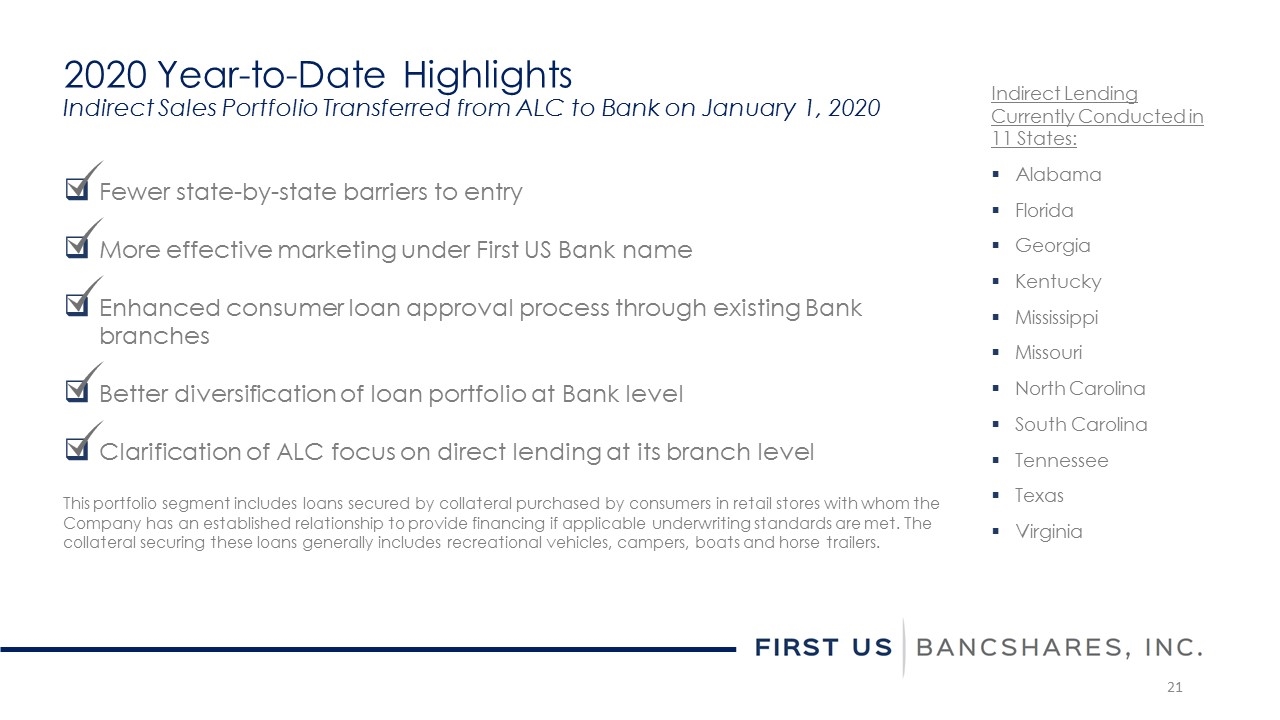
2020 Year-to-Date Highlights Indirect Sales Portfolio Transferred from ALC to Bank on January 1, 2020 Fewer state-by-state barriers to entry More effective marketing under First US Bank name Enhanced consumer loan approval process through existing Bank branches Better diversification of loan portfolio at Bank level Clarification of ALC focus on direct lending at its branch level This portfolio segment includes loans secured by collateral purchased by consumers in retail stores with whom the Company has an established relationship to provide financing if applicable underwriting standards are met. The collateral securing these loans generally includes recreational vehicles, campers, boats and horse trailers. Indirect Lending Currently Conducted in 11 States: Alabama Florida Georgia Kentucky Mississippi Missouri North Carolina South Carolina Tennessee Texas Virginia
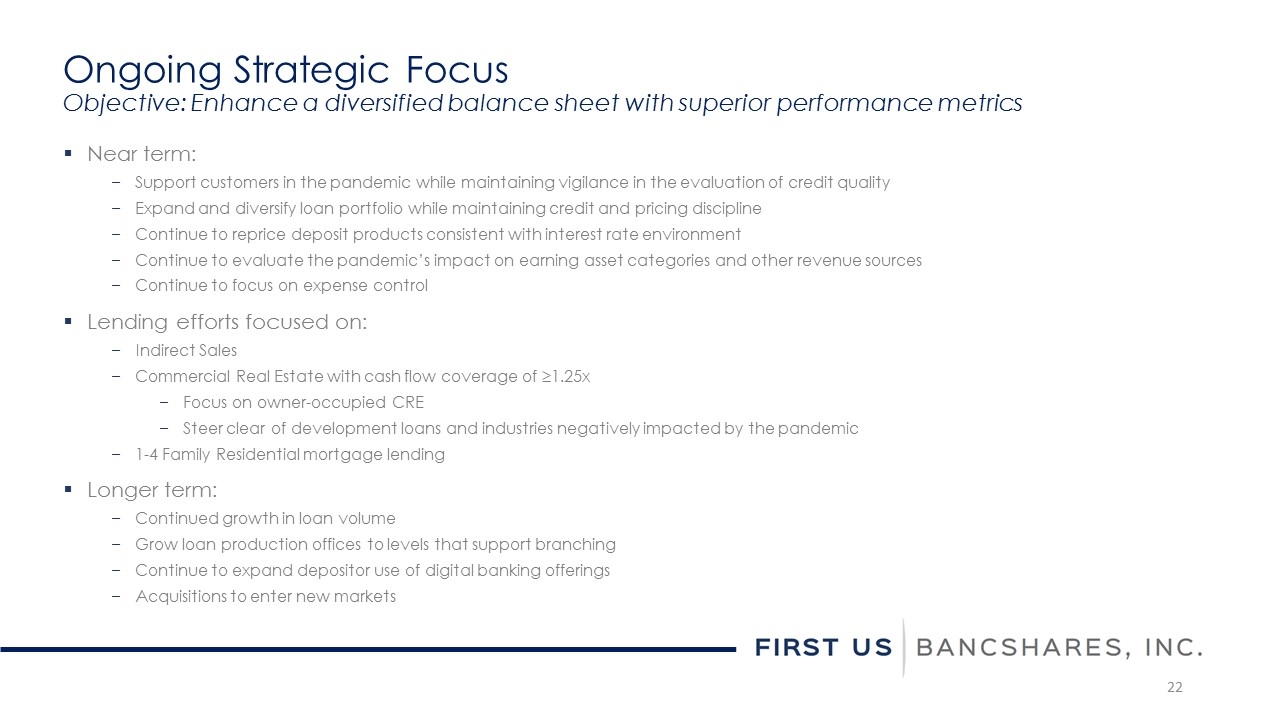
Near term: Support customers in the pandemic while maintaining vigilance in the evaluation of credit quality Expand and diversify loan portfolio while maintaining credit and pricing discipline Continue to reprice deposit products consistent with interest rate environment Continue to evaluate the pandemic’s impact on earning asset categories and other revenue sources Continue to focus on expense control Lending efforts focused on: Indirect Sales Commercial Real Estate with cash flow coverage of ≥1.25x Focus on owner-occupied CRE Steer clear of development loans and industries negatively impacted by the pandemic 1-4 Family Residential mortgage lending Longer term: Continued growth in loan volume Grow loan production offices to levels that support branching Continue to expand depositor use of digital banking offerings Acquisitions to enter new markets Ongoing Strategic Focus Objective: Enhance a diversified balance sheet with superior performance metrics
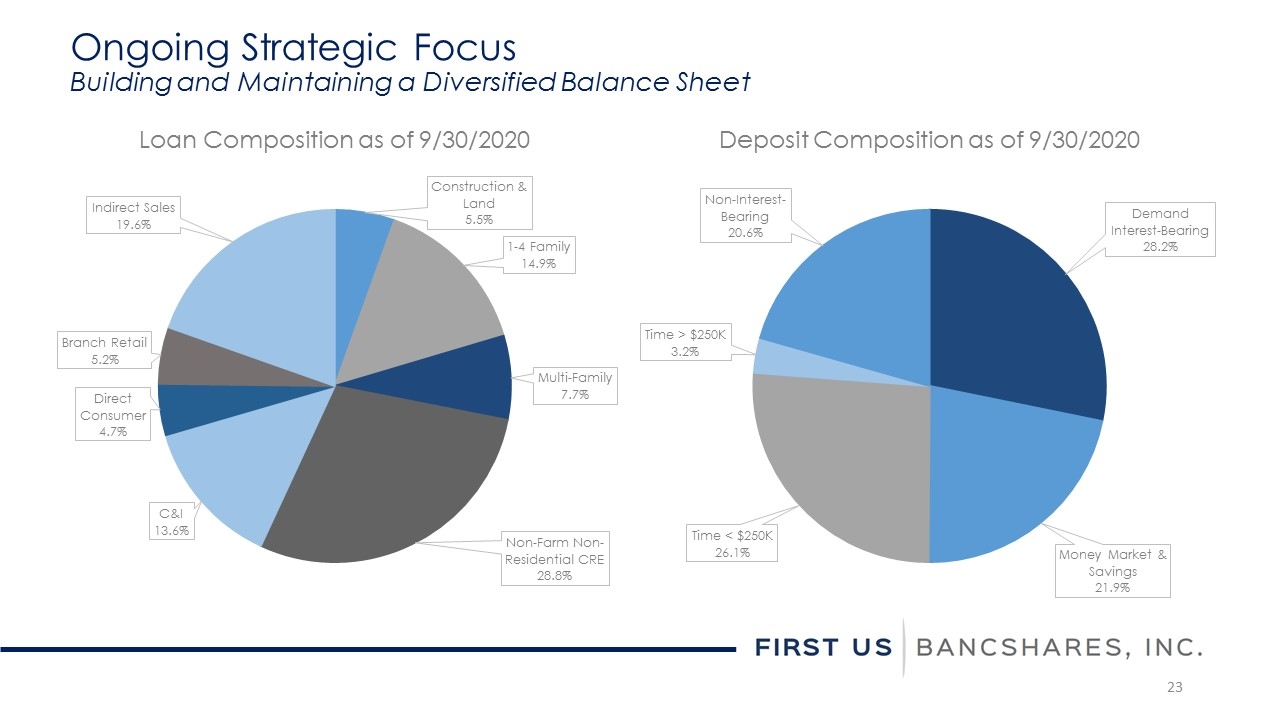
Ongoing Strategic Focus Building and Maintaining a Diversified Balance Sheet Loan Composition as of 9/30/2020 Deposit Composition as of 9/30/2020
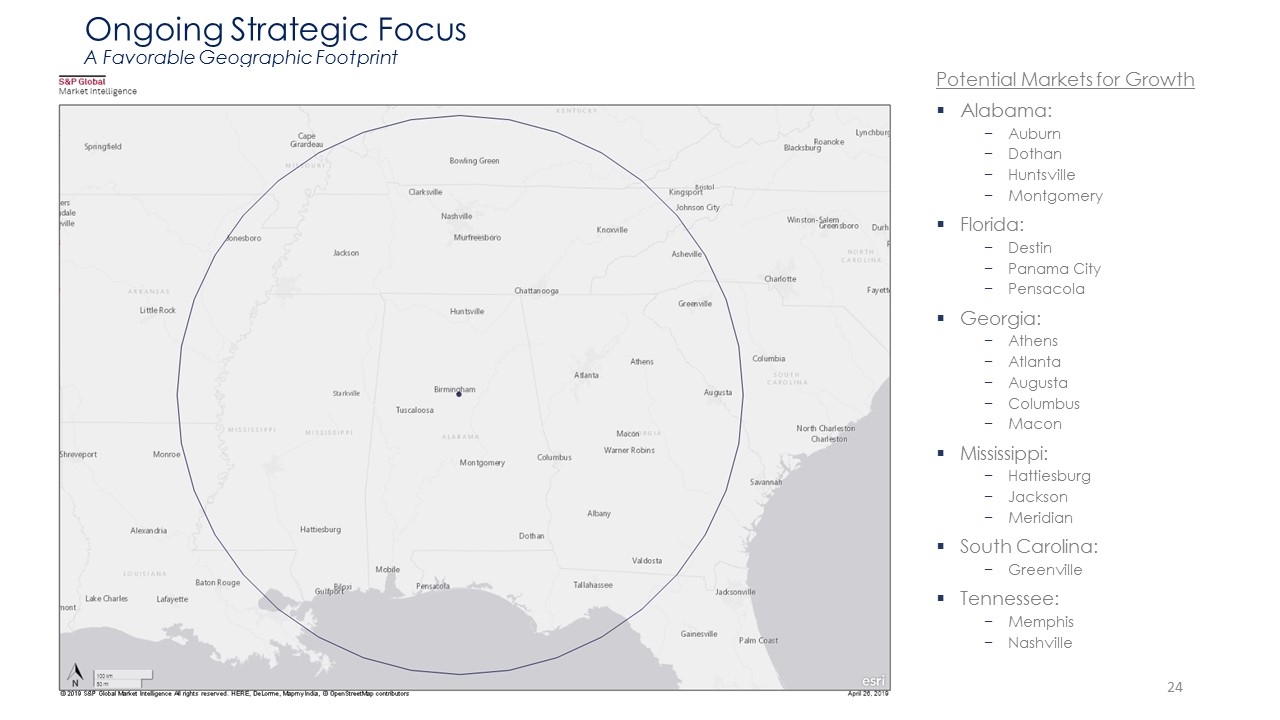
Ongoing Strategic Focus A Favorable Geographic Footprint Potential Markets for Growth Alabama: Auburn Dothan Huntsville Montgomery Florida: Destin Panama City Pensacola Georgia: Athens Atlanta Augusta Columbus Macon Mississippi: Hattiesburg Jackson Meridian South Carolina: Greenville Tennessee: Memphis Nashville
Appendices
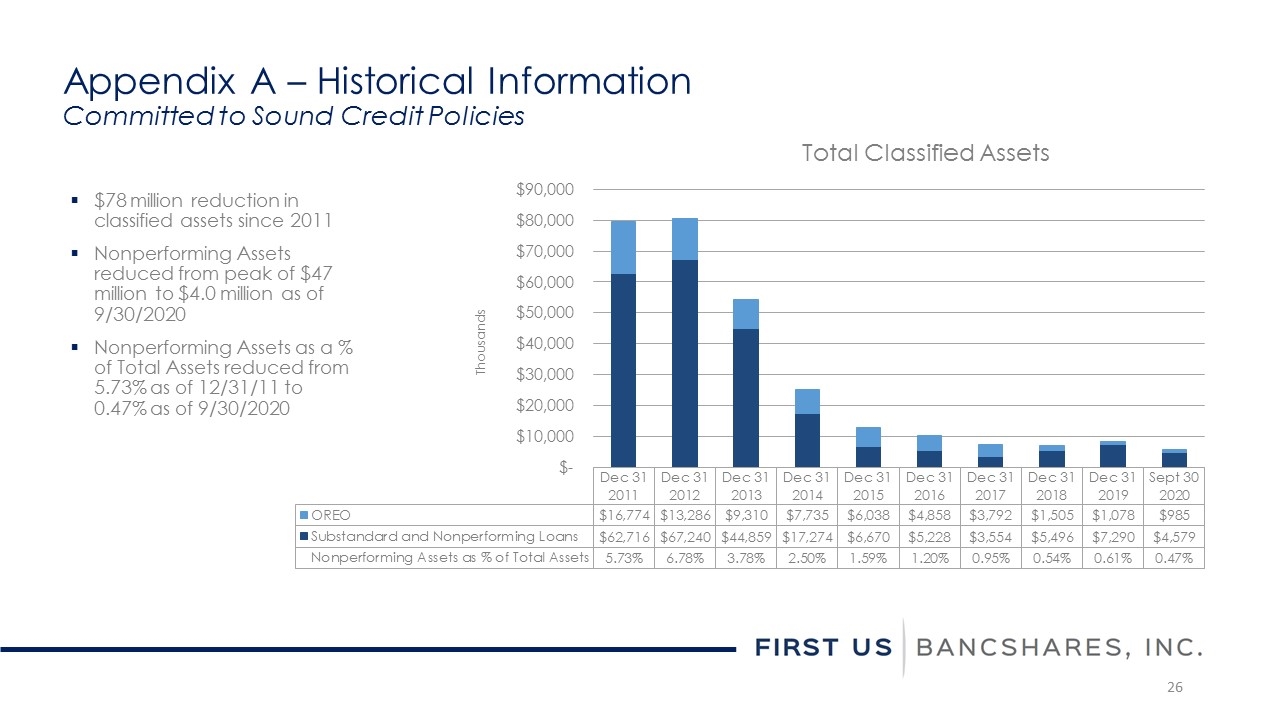
Appendix A – Historical Information Committed to Sound Credit Policies Total Classified Assets $78 million reduction in classified assets since 2011 Nonperforming Assets reduced from peak of $47 million to $4.0 million as of 9/30/2020 Nonperforming Assets as a % of Total Assets reduced from 5.73% as of 12/31/11 to 0.47% as of 9/30/2020
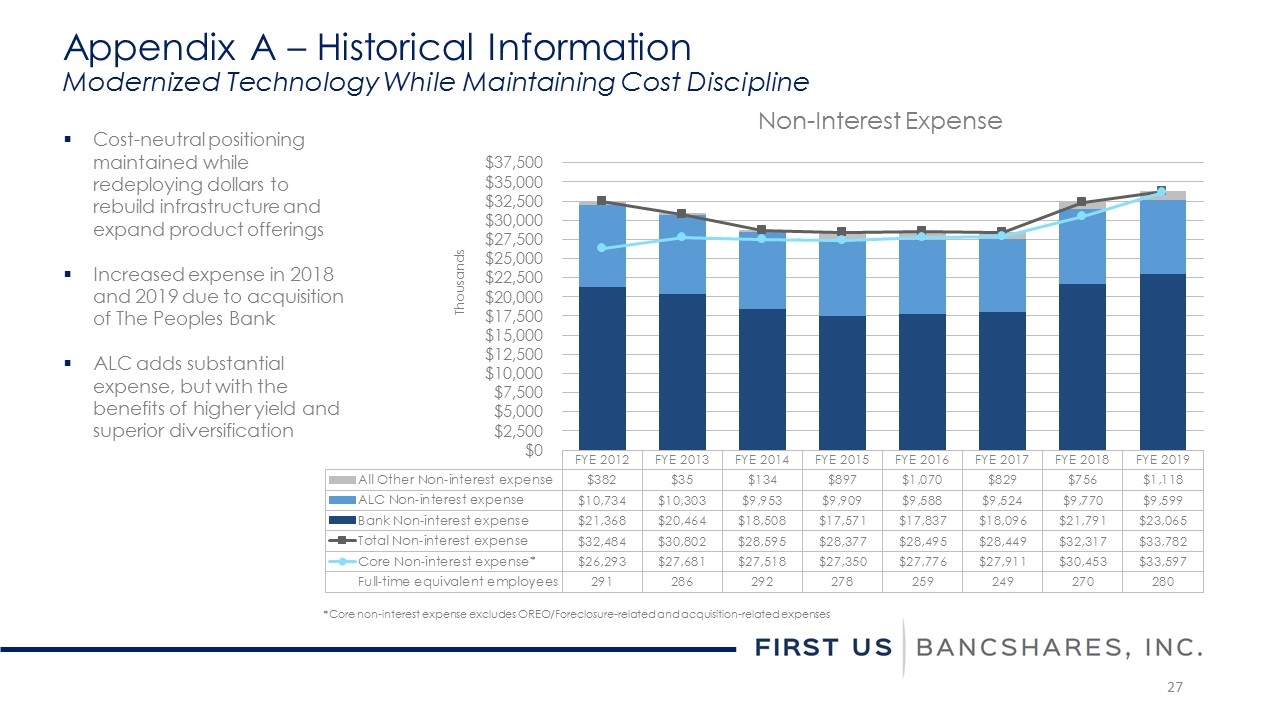
Appendix A – Historical Information Modernized Technology While Maintaining Cost Discipline Cost-neutral positioning maintained while redeploying dollars to rebuild infrastructure and expand product offerings Increased expense in 2018 and 2019 due to acquisition of The Peoples Bank ALC adds substantial expense, but with the benefits of higher yield and superior diversification Non-Interest Expense *Core non-interest expense excludes OREO/Foreclosure-related and acquisition-related expenses

Appendix A – Historical Information Income Statements Annual Comparison (dollars in thousands, except per share data) Year Ended 12/31/2019 12/31/2018 12/31/2017 12/31/2016 12/31/2015 Total Interest Income $ 43,588 $ 37,138 $ 31,100 $ 30,155 $ 29,897 Total Interest Expense 6,646 4,350 2,706 2,271 2,289 Net Interest Income $ 36,942 $ 32,788 $ 28,394 $ 27,884 $ 27,608 Provision for Loan and Lease Losses 2,714 2,622 1,987 3,197 216 Net Interest Income After Provision for Loan and Lease Losses $ 34,228 $ 30,166 $ 26,407 $ 24,687 $ 27,392 Total Non-Interest Income 5,366 5,610 4,666 5,201 4,531 Total Non-Interest Expense 33,782 32,385 28,449 28,495 28,377 Income Before Income Taxes $ 5,812 $ 3,391 $ 2,624 $ 1,393 $ 3,546 Provision for Income Taxes 1,246 901 3,035 169 951 Net Income (Loss) $ 4,566 $ 2,490 $ (411) $ 1,224 $ 2,595 Basic Net Income (Loss) per Share $ 0.71 $ 0.40 $ (0.07) $ 0.20 $ 0.42 Diluted Net Income (Loss) per Share $ 0.67 $ 0.37 $ (0.07) $ 0.19 $ 0.41 Dividends per Share $ 0.09 $ 0.08 $ 0.08 $ 0.08 $ 0.08
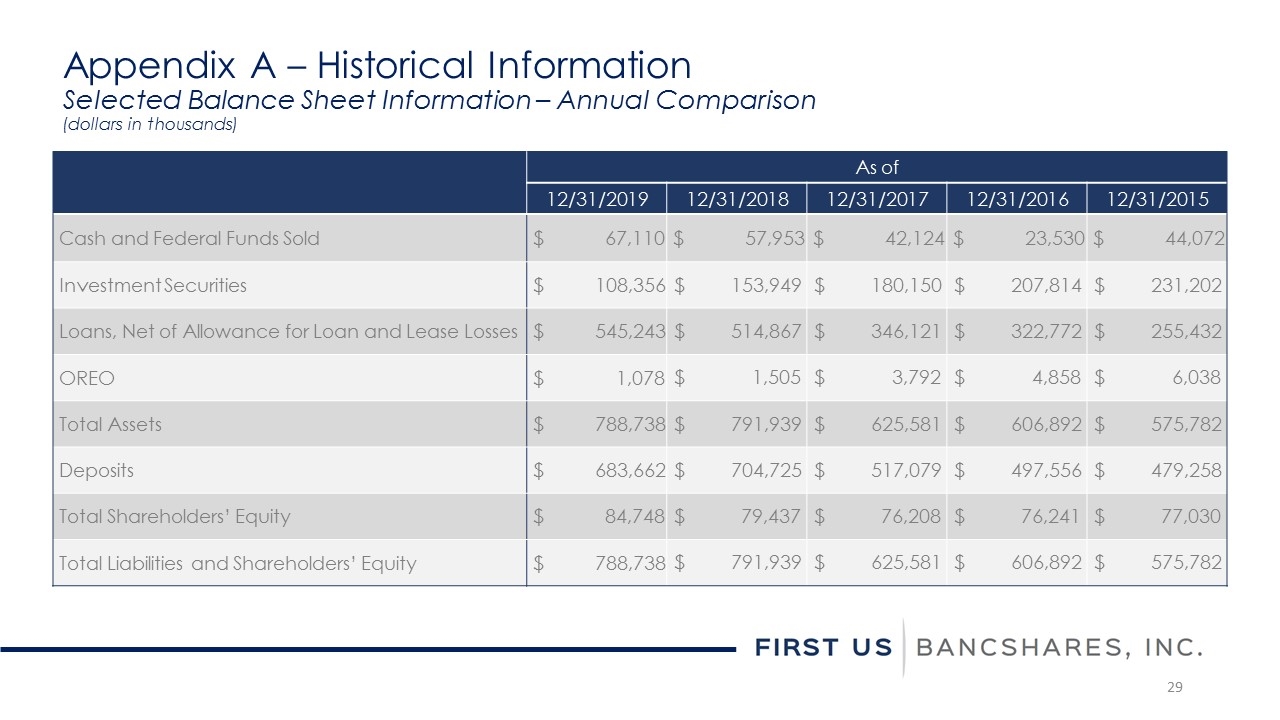
Appendix A – Historical Information Selected Balance Sheet Information – Annual Comparison (dollars in thousands) As of 12/31/2019 12/31/2018 12/31/2017 12/31/2016 12/31/2015 Cash and Federal Funds Sold $ 67,110 $ 57,953 $ 42,124 $ 23,530 $ 44,072 Investment Securities $ 108,356 $ 153,949 $ 180,150 $ 207,814 $ 231,202 Loans, Net of Allowance for Loan and Lease Losses $ 545,243 $ 514,867 $ 346,121 $ 322,772 $ 255,432 OREO $ 1,078 $ 1,505 $ 3,792 $ 4,858 $ 6,038 Total Assets $ 788,738 $ 791,939 $ 625,581 $ 606,892 $ 575,782 Deposits $ 683,662 $ 704,725 $ 517,079 $ 497,556 $ 479,258 Total Shareholders’ Equity $ 84,748 $ 79,437 $ 76,208 $ 76,241 $ 77,030 Total Liabilities and Shareholders’ Equity $ 788,738 $ 791,939 $ 625,581 $ 606,892 $ 575,782
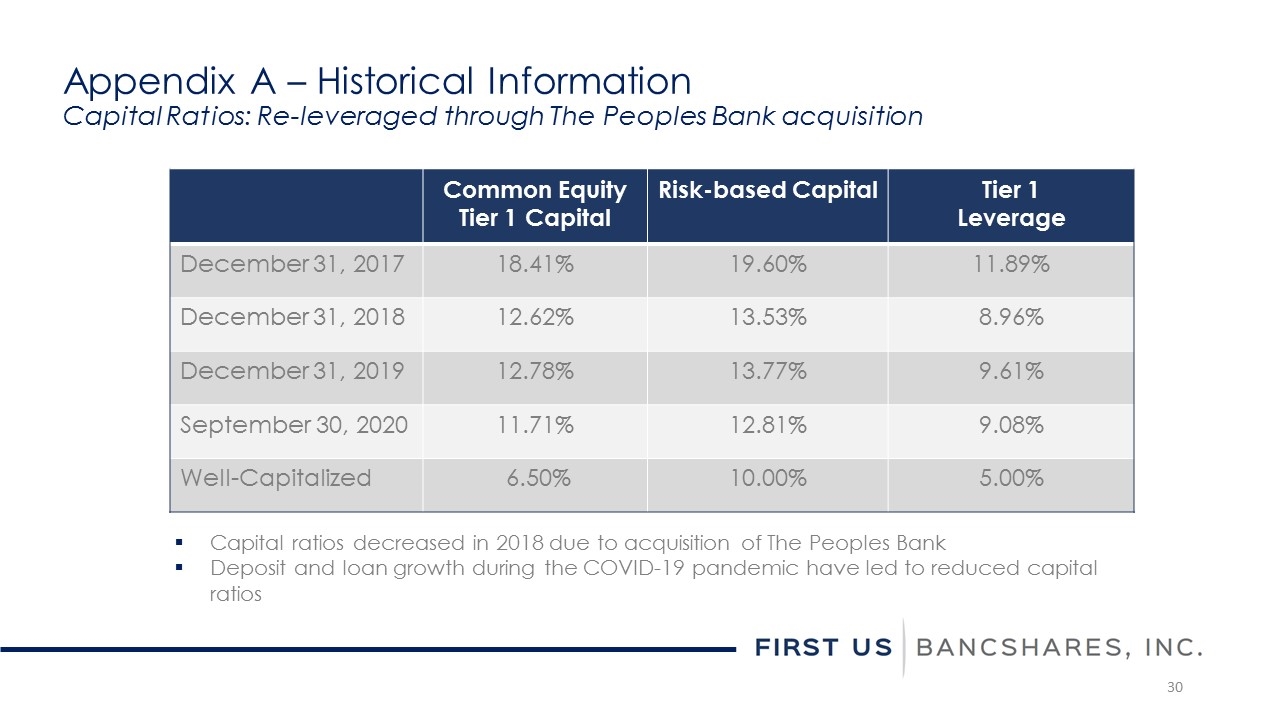
Appendix A – Historical Information Capital Ratios: Re-leveraged through The Peoples Bank acquisition Common Equity Tier 1 Capital Risk-based Capital Tier 1 Leverage December 31, 2017 18.41% 19.60% 11.89% December 31, 2018 12.62% 13.53% 8.96% December 31, 2019 12.78% 13.77% 9.61% September 30, 2020 11.71% 12.81% 9.08% Well-Capitalized 6.50% 10.00% 5.00% Capital ratios decreased in 2018 due to acquisition of The Peoples Bank Deposit and loan growth during the COVID-19 pandemic have led to reduced capital ratios
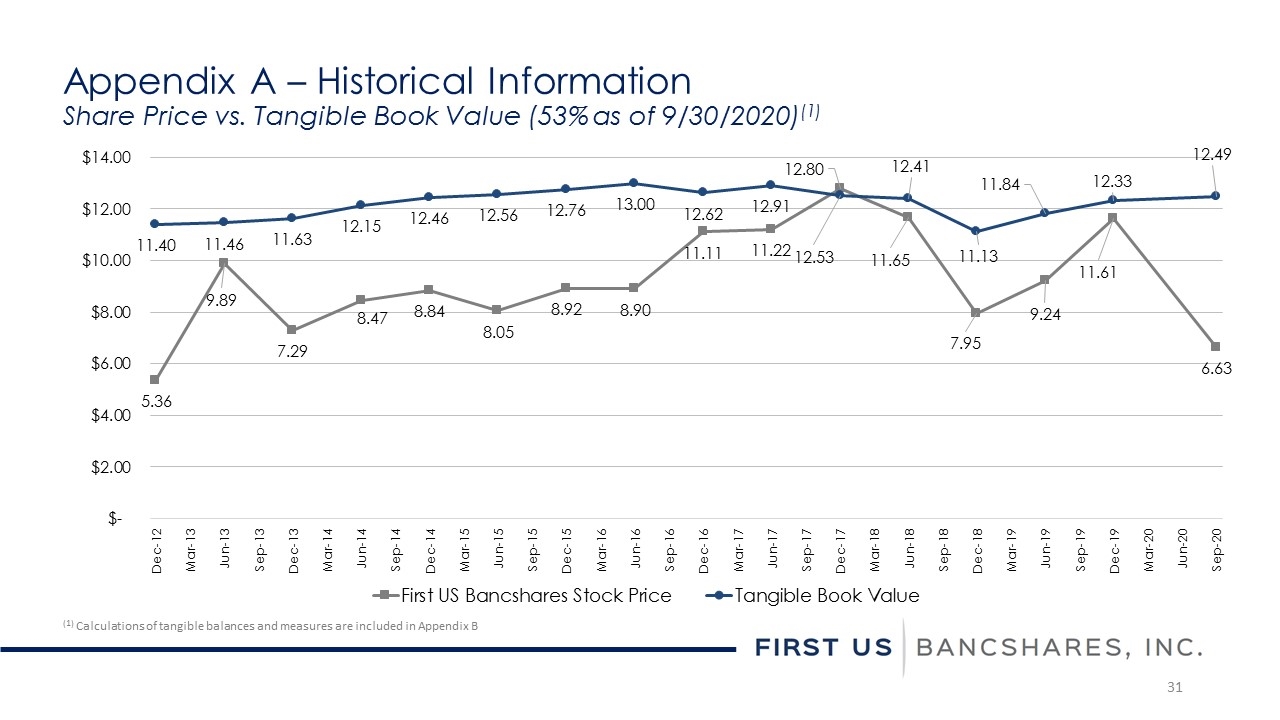
Appendix A – Historical Information Share Price vs. Tangible Book Value (53% as of 9/30/2020)(1) (1) Calculations of tangible balances and measures are included in Appendix B
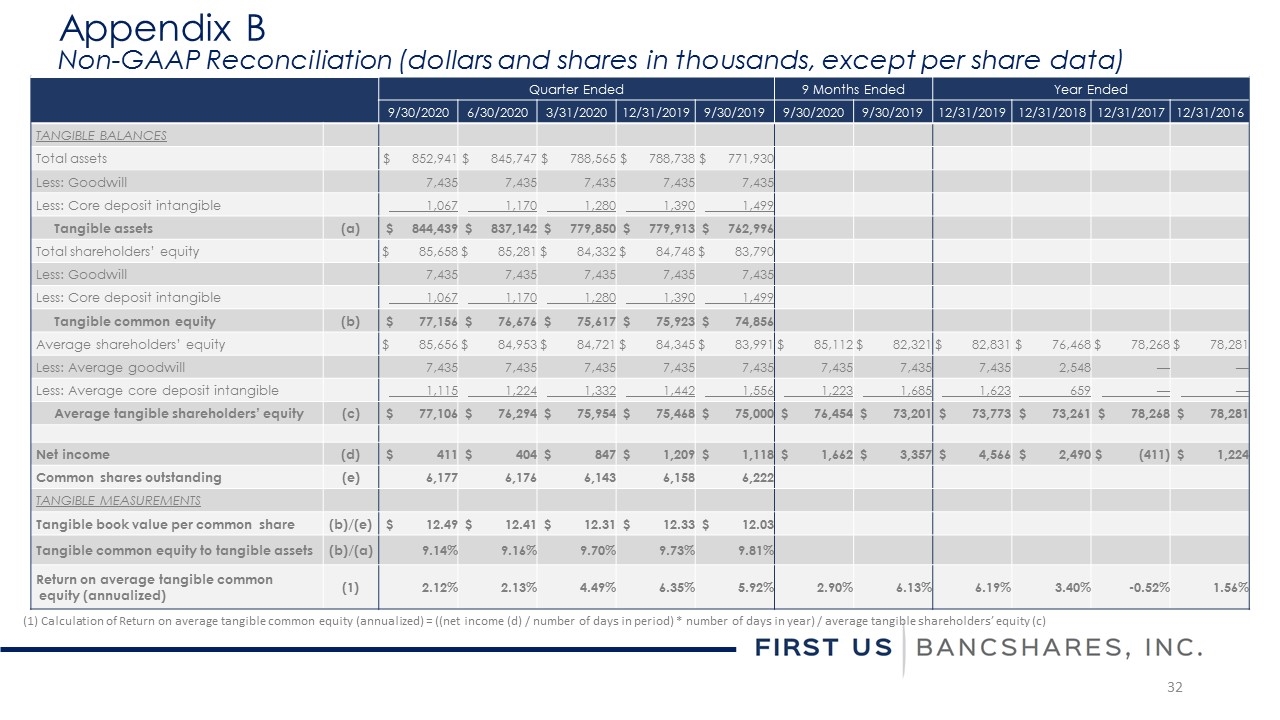
Quarter Ended 9 Months Ended Year Ended 9/30/2020 6/30/2020 3/31/2020 12/31/2019 9/30/2019 9/30/2020 9/30/2019 12/31/2019 12/31/2018 12/31/2017 12/31/2016 TANGIBLE BALANCES Total assets $ 852,941 $ 845,747 $ 788,565 $ 788,738 $ 771,930 Less: Goodwill 7,435 7,435 7,435 7,435 7,435 Less: Core deposit intangible 1,067 1,170 1,280 1,390 1,499 Tangible assets (a) $ 844,439 $ 837,142 $ 779,850 $ 779,913 $ 762,996 Total shareholders’ equity $ 85,658 $ 85,281 $ 84,332 $ 84,748 $ 83,790 Less: Goodwill 7,435 7,435 7,435 7,435 7,435 Less: Core deposit intangible 1,067 1,170 1,280 1,390 1,499 Tangible common equity (b) $ 77,156 $ 76,676 $ 75,617 $ 75,923 $ 74,856 Average shareholders’ equity $ 85,656 $ 84,953 $ 84,721 $ 84,345 $ 83,991 $ 85,112 $ 82,321 $ 82,831 $ 76,468 $ 78,268 $ 78,281 Less: Average goodwill 7,435 7,435 7,435 7,435 7,435 7,435 7,435 7,435 2,548 — — Less: Average core deposit intangible 1,115 1,224 1,332 1,442 1,556 1,223 1,685 1,623 659 — — Average tangible shareholders’ equity (c) $ 77,106 $ 76,294 $ 75,954 $ 75,468 $ 75,000 $ 76,454 $ 73,201 $ 73,773 $ 73,261 $ 78,268 $ 78,281 Net income (d) $ 411 $ 404 $ 847 $ 1,209 $ 1,118 $ 1,662 $ 3,357 $ 4,566 $ 2,490 $ (411) $ 1,224 Common shares outstanding (e) 6,177 6,176 6,143 6,158 6,222 TANGIBLE MEASUREMENTS Tangible book value per common share (b)/(e) $ 12.49 $ 12.41 $ 12.31 $ 12.33 $ 12.03 Tangible common equity to tangible assets (b)/(a) 9.14% 9.16% 9.70% 9.73% 9.81% Return on average tangible common equity (annualized) (1) 2.12% 2.13% 4.49% 6.35% 5.92% 2.90% 6.13% 6.19% 3.40% -0.52% 1.56% Appendix B Non-GAAP Reconciliation (dollars and shares in thousands, except per share data) (1) Calculation of Return on average tangible common equity (annualized) = ((net income (d) / number of days in period) * number of days in year) / average tangible shareholders’ equity (c)
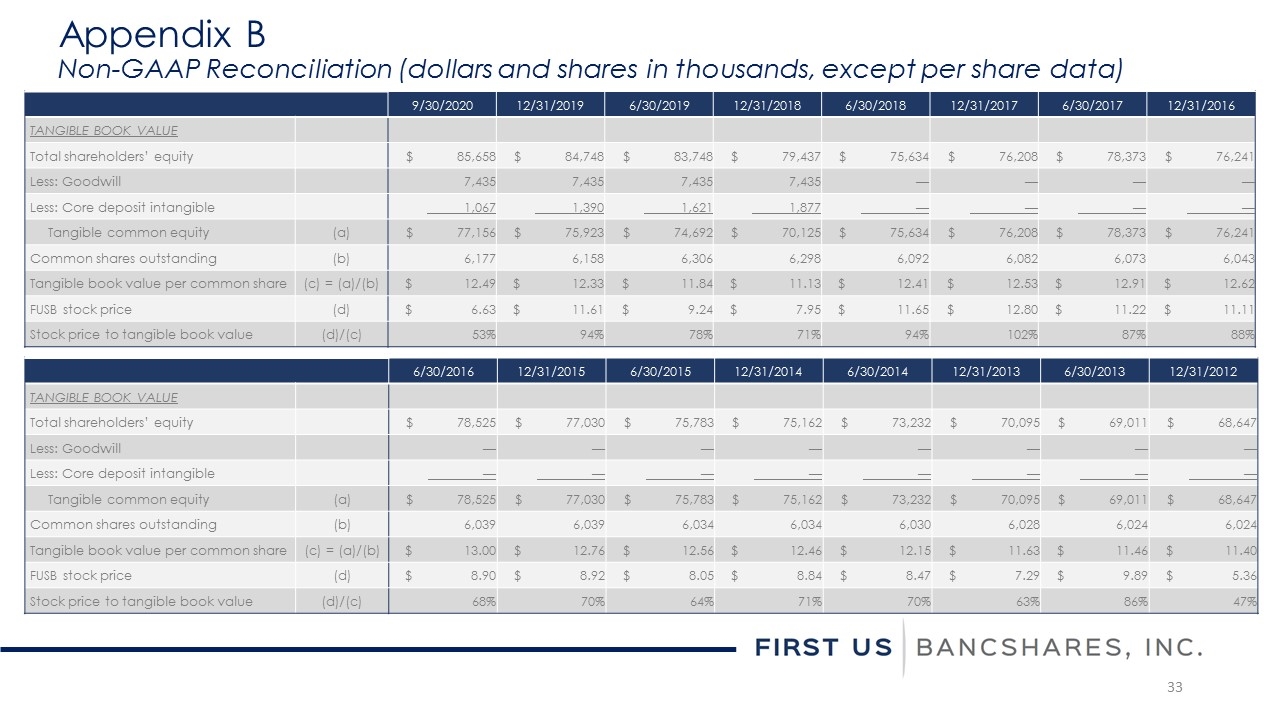
9/30/2020 12/31/2019 6/30/2019 12/31/2018 6/30/2018 12/31/2017 6/30/2017 12/31/2016 TANGIBLE BOOK VALUE Total shareholders’ equity $ 85,658 $ 84,748 $ 83,748 $ 79,437 $ 75,634 $ 76,208 $ 78,373 $ 76,241 Less: Goodwill 7,435 7,435 7,435 7,435 — — — — Less: Core deposit intangible 1,067 1,390 1,621 1,877 — — — — Tangible common equity (a) $ 77,156 $ 75,923 $ 74,692 $ 70,125 $ 75,634 $ 76,208 $ 78,373 $ 76,241 Common shares outstanding (b) 6,177 6,158 6,306 6,298 6,092 6,082 6,073 6,043 Tangible book value per common share (c) = (a)/(b) $ 12.49 $ 12.33 $ 11.84 $ 11.13 $ 12.41 $ 12.53 $ 12.91 $ 12.62 FUSB stock price (d) $ 6.63 $ 11.61 $ 9.24 $ 7.95 $ 11.65 $ 12.80 $ 11.22 $ 11.11 Stock price to tangible book value (d)/(c) 53% 94% 78% 71% 94% 102% 87% 88% Appendix B Non-GAAP Reconciliation (dollars and shares in thousands, except per share data) 6/30/2016 12/31/2015 6/30/2015 12/31/2014 6/30/2014 12/31/2013 6/30/2013 12/31/2012 TANGIBLE BOOK VALUE Total shareholders’ equity $ 78,525 $ 77,030 $ 75,783 $ 75,162 $ 73,232 $ 70,095 $ 69,011 $ 68,647 Less: Goodwill — — — — — — — — Less: Core deposit intangible — — — — — — — — Tangible common equity (a) $ 78,525 $ 77,030 $ 75,783 $ 75,162 $ 73,232 $ 70,095 $ 69,011 $ 68,647 Common shares outstanding (b) 6,039 6,039 6,034 6,034 6,030 6,028 6,024 6,024 Tangible book value per common share (c) = (a)/(b) $ 13.00 $ 12.76 $ 12.56 $ 12.46 $ 12.15 $ 11.63 $ 11.46 $ 11.40 FUSB stock price (d) $ 8.90 $ 8.92 $ 8.05 $ 8.84 $ 8.47 $ 7.29 $ 9.89 $ 5.36 Stock price to tangible book value (d)/(c) 68% 70% 64% 71% 70% 63% 86% 47%

www.firstusbank.com Contact: Thomas S. Elley Chief Financial Officer telley@firstusbank.com 205.582.1200