UNITED STATES
SECURITIES AND EXCHANGE COMMISSION
Washington, D.C. 20549
FORM N-CSR
CERTIFIED SHAREHOLDER REPORT OF REGISTERED MANAGEMENT INVESTMENT COMPANIES
| Investment Company Act file number: | 811-03712 | |
| Exact name of registrant as specified in charter: | Prudential Investment Portfolios, Inc. 14 | |
| Address of principal executive offices: | 655 Broad Street, 6th Floor | |
| Newark, New Jersey 07102 | ||
| Name and address of agent for service: | Andrew R. French | |
| 655 Broad Street, 6th Floor | ||
| Newark, New Jersey 07102 | ||
| Registrant’s telephone number, including area code: | 800-225-1852 | |
| Date of fiscal year end: | 2/29/2024 | |
| Date of reporting period: | 2/29/2024 | |
Item 1 – Reports to Stockholders

PGIM GOVERNMENT INCOME FUND
ANNUAL REPORT
FEBRUARY 29, 2024

To enroll in e-delivery, go to pgim.com/investments/resource/edelivery
| 3 | ||||
| 4 | ||||
| 5 | ||||
| 8 | ||||
| 11 | ||||
| 13 | ||||
This report is not authorized for distribution to prospective investors unless preceded or accompanied by a current prospectus.
The views expressed in this report and information about the Fund’s portfolio holdings are for the period covered by this report and are subject to change thereafter.
Mutual funds are distributed by Prudential Investment Management Services LLC (PIMS), member SIPC. PGIM Fixed Income is a unit of PGIM, Inc. (PGIM), a registered investment adviser. PIMS and PGIM are Prudential Financial companies. © 2024 Prudential Financial, Inc. and its related entities. PGIM and the PGIM logo are service marks of Prudential Financial, Inc. and its related entities, registered in many jurisdictions worldwide.
| 2 | Visit our website at pgim.com/investments |
 | Dear Shareholder:
We hope you find the annual report for the PGIM Government Income Fund informative and useful. The report covers performance for the 12-month period that ended February 29, 2024.
Despite elevated inflation, recession fears, and a banking industry crisis, financial markets rallied and the global economy remained resilient throughout the period. Employers continued hiring, consumers continued spending, and home prices rose as inflation eventually cooled and the economic outlook improved. |
Stocks rose for much of the period and then surged late in the period when the Federal Reserve (the Fed) signaled several potential interest-rate cuts in 2024. For the entire period, equities in both US and international markets posted gains.
After falling much of the period, bond markets rebounded when the Fed began moderating its rate-hiking cycle. Higher interest rates also offered investors an additional cushion from fixed income volatility. US and global investment-grade bonds, along with US high yield corporate bonds and emerging market debt, all posted gains during the period.
Regarding your investments with PGIM, we believe it is important to maintain a diversified portfolio of funds consistent with your tolerance for risk, time horizon, and financial goals. Your financial advisor can help you create a diversified investment plan that may include funds covering a broad spectrum of asset classes and that reflects your personal investor profile and risk tolerance. However, diversification and asset allocation strategies do not assure a profit or protect against loss in declining markets.
At PGIM Investments, we provide access to active investment strategies across the global markets in the pursuit of consistent outperformance for investors. PGIM is the world’s 14th-largest investment manager with more than $1.3 trillion in assets under management. Our scale and investment expertise allow us to deliver a diversified suite of actively managed solutions across a broad spectrum of asset classes and investment styles.
Thank you for choosing our family of funds.
Sincerely,

Stuart S. Parker, President and Principal Executive Officer
PGIM Government Income Fund
April 15, 2024
PGIM Government Income Fund | 3 |
Your Fund’s Performance (unaudited)
Performance data quoted represent past performance. Past performance does not guarantee future results. The investment return and principal value of an investment will fluctuate so that an investor’s shares, when redeemed, may be worth more or less than their original cost. Current performance may be lower or higher than the past performance data quoted. An investor may obtain performance data as of the most recent month-end by visiting our website at pgim.com/investments or by calling (800) 225-1852.
| Average Annual Total Returns as of 2/29/24 | ||||||||
One Year (%)
| Five Years (%)
| Ten Years (%)
| Since Inception (%)
| |||||
| Class A | ||||||||
| (with sales charges) | -1.43 | -1.72 | -0.16 | — | ||||
(without sales charges)
| 1.88
| -1.07
| 0.17
| —
| ||||
| Class C | ||||||||
| (with sales charges) | -0.01 | -1.92 | -0.65 | — | ||||
(without sales charges)
| 0.97
| -1.92
| -0.65
| —
| ||||
| Class R | ||||||||
(without sales charges)
| 1.80
| -1.31
| -0.09
| —
| ||||
| Class Z | ||||||||
(without sales charges)
| 2.45
| -0.55
| 0.56
| —
| ||||
| Class R6 | ||||||||
(without sales charges)
| 2.46
| -0.53
| N/A
| -0.31 (8/9/2016)
| ||||
| Bloomberg US Aggregate ex-Credit Index | ||||||||
| 2.39 | 0.06 | 1.01 | — | |||||
| Bloomberg US Government Bond Index | ||||||||
| 2.35
| 0.21
| 0.95
| —
| |||||
| Average Annual Total Returns as of 2/29/24 Since Inception (%) | ||||||||||||||
Class R6 (8/9/2016) | ||||||||||||||
Bloomberg US Aggregate ex-Credit Index
|
|
0.10
|
| |||||||||||
Bloomberg US Government Bond Index
|
|
-0.01
|
| |||||||||||
Since Inception returns are provided for any share class with less than 10 fiscal years of returns. Since Inception returns for the Indexes are measured from the closest month-end to the class’s inception date.
| 4 | Visit our website at pgim.com/investments |
Growth of a $10,000 Investment (unaudited)
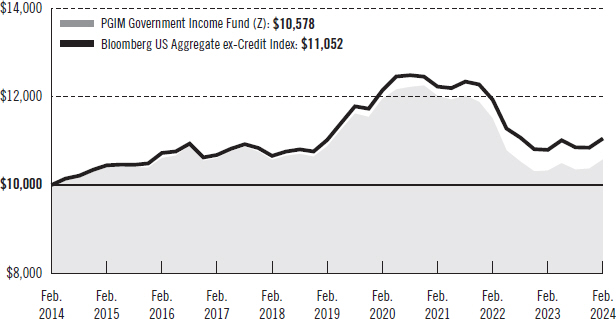
The graph compares a $10,000 investment in the Fund’s Class Z shares with a similar investment in the Bloomberg US Aggregate ex-Credit Index by portraying the initial account values at the beginning of the 10-year period for Class Z shares (February 28, 2014) and the account values at the end of the current fiscal year (February 29, 2024) as measured on a quarterly basis. For purposes of the graph, and unless otherwise indicated, it has been assumed that (a) all recurring fees (including management fees) were deducted and (b) all dividends and distributions were reinvested. The line graph provides information for Class Z shares only. As indicated in the tables provided earlier, performance for other share classes will vary due to the differing fees and expenses applicable to each share class (as indicated in the following paragraphs). Without waiver of fees and/or expense reimbursements, if any, the returns would have been lower.
Past performance does not predict future performance. Total returns and the ending account values in the graphs include changes in share price and reinvestment of dividends and capital gains distributions in a hypothetical investment for the periods shown. The Fund’s total returns in the table and the graph do not reflect the deduction of income taxes on an individual’s investment. Taxes may reduce your actual investment returns on income or gains paid by the Fund or any gains you may realize if you sell your shares.
PGIM Government Income Fund | 5 |
Your Fund’s Performance (continued)
The returns in the tables do not reflect the deduction of taxes that a shareholder would pay on Fund distributions or following the redemption of Fund shares. The average annual total returns take into account applicable sales charges, which are described for each share class in the table below.
| Class A | Class C | Class R | Class Z | Class R6 | ||||||
| Maximum initial sales charge | 3.25% of the public offering price | None | None | None | None | |||||
| Contingent deferred sales charge (CDSC) (as a percentage of the lower of the original purchase price or the net asset value at redemption) | 1.00% on sales of $500,000 or more made within 12 months of purchase | 1.00% on sales made within 12 months of purchase | None | None | None | |||||
Annual distribution and service (12b-1) fees (shown as a percentage of average daily net assets)
| 0.25% | 1.00% | 0.75% (0.50% currently) | None | None | |||||
Benchmark Definitions
Bloomberg US Aggregate ex-Credit Index—The Bloomberg US Aggregate ex-Credit Index represents securities that are taxable and US dollar denominated. The Index covers the US investment grade fixed rate bond market, excluding the credit component.
Bloomberg US Government Bond Index—The Bloomberg US Government Bond Index is an unmanaged index of securities issued or backed by the US government, its agencies, and instrumentalities with between one and 30 years remaining to maturity. It gives a broad look at how US government bonds have performed.
Investors cannot invest directly in an index. The returns for the Indexes would be lower if they included the effects of sales charges, operating expenses of a mutual fund, or taxes that may be paid by an investor.
| 6 | Visit our website at pgim.com/investments |
Credit Quality expressed as a percentage of total investments as of 2/29/24 (%)
| ||||
| AAA | 95.9 | |||
| Not Rated | -0.1 | |||
| Cash/Cash Equivalents | 4.2 | |||
| Total | 100.0 | |||
Credit ratings reflect the highest rating assigned by a nationally recognized statistical rating organization (NRSRO) such as Moody’s Investors Service, Inc. (Moody’s), S&P Global Ratings (S&P), or Fitch Ratings, Inc. (Fitch). Credit ratings reflect the common nomenclature used by both S&P and Fitch. Where applicable, ratings are converted to the comparable S&P/Fitch rating tier nomenclature. These rating agencies are independent and are widely used. The Not Rated category consists of securities that have not been rated by an NRSRO. Credit ratings are subject to change.
Distributions and Yields as of 2/29/24
| ||||||
| Total Distributions Paid for One Year ($) | SEC 30-Day Subsidized Yield* (%) | SEC 30-Day Unsubsidized Yield** (%) | ||||
| Class A | 0.25 | 3.99 | 3.91 | |||
| Class C | 0.18 | 3.76 | 3.68 | |||
| Class R | 0.23 | 3.68 | 3.35 | |||
| Class Z | 0.29 | 3.85 | 3.81 | |||
| Class R6 | 0.29 | 3.87 | 3.81 | |||
*SEC 30-Day Subsidized Yield (%)—A standardized yield calculation created by the Securities and Exchange Commission, it reflects the income earned during a 30-day period, after the deduction of the Fund’s net expenses (net of any expense waivers or reimbursements). The investor experience is represented by the SEC 30-Day Subsidized Yield.
**SEC 30-Day Unsubsidized Yield (%)—A standardized yield calculation created by the Securities and Exchange Commission, it reflects the income earned during a 30-day period, after the deduction of the Fund’s gross expenses. The investor experience is represented by the SEC 30-Day Subsidized Yield.
PGIM Government Income Fund | 7 |
Strategy and Performance Overview*
(unaudited)
How did the Fund perform?
The PGIM Government Income Fund’s Class Z shares returned 2.45% in the 12-month reporting period that ended February 29, 2024, outperforming the 2.39% return of the Bloomberg US Aggregate ex-Credit Index (the Index).
What were the market conditions?
| ● | From a starting point of stubbornly high inflation and low unemployment, the US Federal Reserve (the Fed) tightened monetary policy by an additional 75 basis points (bps) during the reporting period. (One basis point equals 0.01%.) |
| ● | Volatility remained elevated in US Treasuries as investors were uncertain about the trajectory of the Fed’s monetary policy going forward. Investors began to price in monetary policy easing as the Fed approached the end of its hiking path. Surging Treasury issuance was also prominent given the Fed’s quantitative tightening approach, which allowed its portfolio to run off as bonds matured. In addition, the US 10-year yield breached 5% for the first time in 16 years, spurred by the continued rise in real yields. |
| ● | At the close of 2023, the US 10-year Treasury yield dropped from 5% to a 3% handle in a matter of weeks, while credit spreads tightened sharply as expectations of a soft landing and a dovish central bank pivot gathered steam. (A dovish view indicates a looser monetary policy supported by holding interest rates steady or lowering them.) The US economy proved resilient despite moderating consumer spending, and inflation showed signs of cooling although it remained above the Fed’s 2% target. |
| ● | In January, the Federal Open Market Committee (FOMC) kept interest rates on hold for a fourth consecutive meeting. The FOMC also held off on signaling an interest rate cut at its March meeting, with Fed Chairman Jerome Powell citing the need for “more good data” before lowering the federal funds rate. Thereafter, higher-than-expected January inflation data set off a rapid repricing of the federal funds rate, pushing the first fully priced hike this year to July from May. |
| ● | The US Treasury yield curve steepened over the reporting period. (A yield curve is a line graph that illustrates the relationship between the yields and maturities of fixed income securities. It is created by plotting the yields of different maturities for the same type of bonds.) From –0.89% on February 28, 2023, the 10-year/2-year Treasury spread tightened to end the reporting period at –0.39%. US 10-year Treasury yields began the reporting period at 3.92% and ended at 4.25%. Meanwhile, the yield on the 2-year Treasury note ended the reporting period at 4.64%, a decline of 17 bps since the beginning of the reporting period. |
| ● | Agency mortgage-backed securities (MBS) posted modestly negative excess returns over the reporting period, succumbing to renewed bank-selling concerns during the last month of the reporting period. Meanwhile, in securitized credits, high-quality collateralized loan obligation (CLO) spreads tightened over the reporting period, and high-quality commercial mortgage-backed securities (CMBS) spreads outperformed corporates over the final months of the reporting period. |
| 8 | Visit our website at pgim.com/investments |
What worked?
| ● | Overall security selection contributed to the Fund’s performance during the reporting period, with selections in US Treasuries, MBS, CLOs, and US-dollar sovereign credit contributing the most. |
| ● | Overall sector allocation contributed also to performance, with overweights to MBS, CLOs, and US-dollar sovereign credit contributing most. |
| ● | The duration of the Fund was tactically managed over the reporting period and contributed to performance. (Duration measures the sensitivity of the price—the value of principal—of a bond to a change in interest rates.) |
What didn’t work?
| ● | While overall security selection contributed to performance, selection in US-dollar sovereign credit and agency CMBS detracted. |
| ● | Yield curve positioning detracted from performance over the period. |
Did the Fund use derivatives?
The Fund held futures contracts on US Treasuries and options to help manage its duration and yield curve exposure during the reporting period. In aggregate, the use of futures detracted from performance.
Current outlook
| ● | Overall, US economic data remains aligned with PGIM Fixed Income’s “weakflation” model economic scenario. While meaningfully reducing its recession probabilities over the past several months, PGIM Fixed Income still forecasts slower growth in 2024 amid fragilities (e.g., consumer health and commercial real estate). |
| ● | PGIM Fixed Income continues to anticipate three cuts to the federal funds rate this year, starting in the second quarter, and believes these reductions are likely to leave Fed policy in restrictive territory (depending on one’s view of the neutral interest rate). Until recently, markets had been pricing in more cuts in 2024 than PGIM Fixed Income had forecast. As a result, the Fund’s duration positioning remains modest, with a curve steepening bias. |
| ● | In securitized products, PGIM Fixed Income still favors senior, credit-risk remote tranches due to their attractive risk-adjusted return potential and robust structural credit protection. PGIM Fixed Income believes spreads at the top of the capital structure will remain rangebound, making carry the dominant theme in 2024. In CMBS, higher interest rates have led to softness in capitalization rates, which pressured valuations in 2023. PGIM Fixed Income expects this trend to continue in 2024. Going forward, PGIM Fixed Income expects that property values will generally decline by about 20% but dispersion will abound, with office properties likely to perform the worst. Despite these challenges, PGIM Fixed Income sees value in AAA conduit bonds, which now trade wider than corporates, and select single-asset single-borrower securities. Higher interest rates and a more challenging financing environment are expected to keep issuance suppressed. |
PGIM Government Income Fund | 9 |
Strategy and Performance Overview* (continued)
| ● | While bank loan spreads have been supported by low loan supply and strong demand, PGIM Fixed Income expects to see some credit deterioration in the underlying CLO collateral via downgrades to CCC, increased default rates, and lower recovery rates. PGIM Fixed Income expects higher interest costs to pressure loan issuers’ free cash flows, leading to negative credit migration and more price volatility. Thus, PGIM Fixed Income continues to favor AAA/AA CLO tranches. |
| ● | In MBS, the end of the Fed’s hiking cycle and the reduced optionality around future policy moves could produce some interest-rate volatility over the near term. Longer term, however, once the Fed has remained on hold for a prolonged period or fine-tuned monetary policy, volatility should subside, thus benefiting the MBS sector. While the interest rate rally also dropped primary mortgage rates from 23-year highs, PGIM Fixed Income does not expect an immediate influx of supply beyond a seasonal increase in activity. From a longer-term perspective, the lack of affordable housing units in the US remains a headwind for purchase loan activity. |
*This strategy and performance overview, which discusses what strategies or holdings (including derivatives, if applicable) affected the Fund’s performance, is compiled based on how the Fund performed relative to the Index and is viewed for performance attribution purposes at the aggregate Fund level, which in most instances will not directly correlate to the amounts disclosed in the Statement of Operations which conform to US generally accepted accounting principles.
| 10 | Visit our website at pgim.com/investments |
As a shareholder of the Fund, you incur two types of costs: (1) transaction costs, including sales charges (loads) on purchase payments and redemptions, as applicable, and (2) ongoing costs, including management fees, distribution and/or service (12b-1) fees, and other Fund expenses, as applicable. This example is intended to help you understand your ongoing costs (in dollars) of investing in the Fund and to compare these costs with the ongoing costs of investing in other mutual funds.
The example is based on an investment of $1,000 held through the six-month period ended February 29, 2024. The example is for illustrative purposes only; you should consult the Prospectus for information on initial and subsequent minimum investment requirements.
Actual Expenses
The first line for each share class in the table on the following page provides information about actual account values and actual expenses. You may use the information on this line, together with the amount you invested, to estimate the expenses that you paid over the period. Simply divide your account value by $1,000 (for example, an $8,600 account value ÷ $1,000 = 8.6), then multiply the result by the number on the first line under the heading “Expenses Paid During the Six-Month Period” to estimate the expenses you paid on your account during this period.
Hypothetical Example for Comparison Purposes
The second line for each share class in the table on the following page provides information about hypothetical account values and hypothetical expenses based on the Fund’s actual expense ratio and an assumed rate of return of 5% per year before expenses, which is not the Fund’s actual return. The hypothetical account values and expenses may not be used to estimate the actual ending account balance or expenses you paid for the period. You may use this information to compare the ongoing costs of investing in the Fund and other funds. To do so, compare this 5% hypothetical example with the 5% hypothetical examples that appear in the shareholder reports of the other funds.
The Fund’s transfer agent may charge additional fees to holders of certain accounts that are not included in the expenses shown in the table on the following page. These fees apply to individual retirement accounts (IRAs) and Section 403(b) accounts. As of the close of the six-month period covered by the table, IRA fees included an annual maintenance fee of $15 per account (subject to a maximum annual maintenance fee of $25 for all accounts held by the same shareholder). Section 403(b) accounts are charged an annual $25 fiduciary maintenance fee. Some of the fees may vary in amount, or may be waived, based on your total account balance or the number of PGIM funds, including the Fund, that you own. You should consider the additional fees that were charged to your Fund account over the six-month period when you estimate the total ongoing expenses paid over the period and the impact of these fees on your ending account value, as these additional expenses are not reflected in the information
PGIM Government Income Fund | 11 |
Fees and Expenses (continued)
provided in the expense table. Additional fees have the effect of reducing investment returns.
Please note that the expenses shown in the table are meant to highlight your ongoing costs only and do not reflect any transactional costs such as sales charges (loads). Therefore, the second line for each share class in the table is useful in comparing ongoing costs only and will not help you determine the relative total costs of owning different funds. In addition, if these transactional costs were included, your costs would have been higher.
PGIM Government Income Fund
| Beginning
| Ending
| Annualized Ratio Based on
| Expenses Paid Period*
| ||||||
| Class A | Actual | $1,000.00 | $1,018.30 | 1.00% | $5.02 | |||||
| Hypothetical | $1,000.00 | $1,019.89 | 1.00% | $5.02 | ||||||
| Class C | Actual | $1,000.00 | $1,014.30 | 1.78% | $8.91 | |||||
| Hypothetical | $1,000.00 | $1,016.01 | 1.78% | $8.92 | ||||||
| Class R | Actual | $1,000.00 | $1,018.80 | 1.15% | $5.77 | |||||
| Hypothetical | $1,000.00 | $1,019.14 | 1.15% | $5.77 | ||||||
| Class Z | Actual | $1,000.00 | $1,022.20 | 0.48% | $2.41 | |||||
| Hypothetical | $1,000.00 | $1,022.48 | 0.48% | $2.41 | ||||||
| Class R6 | Actual | $1,000.00 | $1,022.30 | 0.47% | $2.36 | |||||
| Hypothetical | $1,000.00 | $1,022.53 | 0.47% | $2.36 | ||||||
*Fund expenses (net of fee waivers or subsidies, if any) for each share class are equal to the annualized expense ratio for each share class (provided in the table), multiplied by the average account value over the period, multiplied by the 182 days in the six-month period ended February 29, 2024, and divided by the 366 days in the Fund’s fiscal year ended February 29, 2024 (to reflect the six-month period). Expenses presented in the table include the expenses of any underlying portfolios in which the Fund may invest.
| 12 | Visit our website at pgim.com/investments |
as of February 29, 2024
| Description | Interest Rate | Maturity Date | Principal Amount (000)# | Value | ||||||||
| LONG-TERM INVESTMENTS 98.1% | ||||||||||||
| ASSET-BACKED SECURITIES 8.0% | ||||||||||||
| Collateralized Loan Obligations | ||||||||||||
Anchorage Capital CLO Ltd. (Cayman Islands), | 6.708%(c) | 04/20/35 | 2,250 | $ | 2,252,302 | |||||||
Apidos CLO Ltd. (United Kingdom), | 7.324(c) | 04/26/35 | 5,250 | 5,269,796 | ||||||||
Bain Capital Credit CLO Ltd. (Cayman Islands), | 6.618(c) | 04/18/35 | 1,500 | 1,500,449 | ||||||||
Battalion CLO Ltd. (Cayman Islands), | 7.031(c) | 05/17/31 | 4,103 | 4,100,975 | ||||||||
CarVal CLO Ltd. (United Kingdom), | 7.518(c) | 01/20/35 | 2,250 | 2,252,640 | ||||||||
Elevation CLO Ltd. (Cayman Islands), | 6.796(c) | 01/25/35 | 1,000 | 999,990 | ||||||||
ICG US CLO Ltd. (Cayman Islands), | 6.946(c) | 01/16/33 | 2,236 | 2,237,738 | ||||||||
OFSI BSL Ltd. (Cayman Islands), | 7.718(c) | 01/20/35 | 2,500 | 2,502,636 | ||||||||
Venture CLO Ltd. (Cayman Islands), | 6.816(c) | 04/15/34 | 5,500 | 5,499,055 | ||||||||
|
| |||||||||||
| TOTAL ASSET-BACKED SECURITIES | ||||||||||||
(cost $26,589,179) |
| 26,615,581 | ||||||||||
|
| |||||||||||
| COMMERCIAL MORTGAGE-BACKED SECURITIES 10.4% | ||||||||||||
Barclays Commercial Mortgage Securities Trust, | 2.661 | 08/15/52 | 6,000 | 5,424,871 | ||||||||
Fannie Mae-Aces, | ||||||||||||
Series 2019-M22, Class A2 | 2.522 | 08/25/29 | 5,782 | 5,178,004 | ||||||||
Series 2021-M01G, Class A2 | 1.469(cc) | 11/25/30 | 2,500 | 2,028,806 | ||||||||
Series 2022-M03, Class A2 | 1.707(cc) | 11/25/31 | 8,500 | 6,825,741 | ||||||||
Series 2022-M13, Class A2 | 2.593(cc) | 06/25/32 | 5,000 | 4,271,922 | ||||||||
See Notes to Financial Statements.
PGIM Government Income Fund | 13 |
Schedule of Investments (continued)
as of February 29, 2024
| Description | Interest Rate | Maturity Date | Principal Amount (000)# | Value | ||||||||||||
| COMMERCIAL MORTGAGE-BACKED SECURITIES (Continued) | ||||||||||||||||
FHLMC Multifamily Structured Pass-Through Certificates, | ||||||||||||||||
Series K0151, Class A3 | 3.511% | 04/25/30 | 900 | $ | 839,172 | |||||||||||
Series K0152, Class A2 | 3.080 | 01/25/31 | 375 | 337,146 | ||||||||||||
Series K1513, Class A3 | 2.797 | 08/25/34 | 6,500 | 5,436,035 | ||||||||||||
Series K1514, Class A2 | 2.859 | 10/25/34 | 5,217 | 4,358,300 | ||||||||||||
|
| |||||||||||||||
| TOTAL COMMERCIAL MORTGAGE-BACKED SECURITIES | ||||||||||||||||
(cost $39,677,801) |
| 34,699,997 | ||||||||||||||
|
| |||||||||||||||
| CORPORATE BOND 0.3% | ||||||||||||||||
| Diversified Financial Services | ||||||||||||||||
Private Export Funding Corp., | ||||||||||||||||
U.S. Gov’t. Gtd. Notes, Series PP (cost $1,003,430) | 1.400 | 07/15/28 | 1,005 | 880,250 | ||||||||||||
|
| |||||||||||||||
| U.S. GOVERNMENT AGENCY OBLIGATIONS 57.2% | ||||||||||||||||
Fannie Mae Interest Strips | 5.372(s) | 07/15/32 | 635 | 412,109 | ||||||||||||
Federal Agricultural Mortgage Corp. | 3.950 | 02/02/26 | 15 | 14,757 | ||||||||||||
Federal Farm Credit Bank | 1.680 | 09/17/35 | 160 | 112,072 | ||||||||||||
Federal Farm Credit Bank | 1.730 | 09/22/31 | 600 | 483,836 | ||||||||||||
Federal Farm Credit Bank | 1.770 | 02/04/31 | 1,245 | 1,009,791 | ||||||||||||
Federal Farm Credit Bank | 1.900 | 10/21/30 | 196 | 164,971 | ||||||||||||
Federal Farm Credit Bank | 2.040 | 03/19/40 | 1,330 | 856,491 | ||||||||||||
Federal Farm Credit Bank | 2.150 | 12/01/31 | 3,430 | 2,828,002 | ||||||||||||
Federal Farm Credit Bank | 2.170 | 10/29/29 | 370 | 321,902 | ||||||||||||
Federal Farm Credit Bank | 2.200 | 12/09/31 | 1,545 | 1,280,656 | ||||||||||||
Federal Farm Credit Bank | 2.350 | 03/10/36 | 340 | 252,678 | ||||||||||||
Federal Farm Credit Bank | 2.400 | 03/24/36 | 222 | 165,899 | ||||||||||||
Federal Farm Credit Bank | 2.460 | 02/05/35 | 925 | 716,066 | ||||||||||||
Federal Farm Credit Bank | 2.490 | 05/19/36 | 165 | 123,277 | ||||||||||||
Federal Farm Credit Bank | 2.500 | 04/14/36 | 430 | 327,268 | ||||||||||||
Federal Farm Credit Bank | 5.480 | 06/27/42 | 1,000 | 965,292 | ||||||||||||
Federal Home Loan Bank | 1.150(cc) | 02/10/31 | 485 | 387,110 | ||||||||||||
Federal Home Loan Bank | 1.250(cc) | 03/17/31 | 100 | 85,921 | ||||||||||||
Federal Home Loan Bank | 1.350 | 02/18/31 | 20 | 15,843 | ||||||||||||
Federal Home Loan Bank | 1.500(cc) | 05/27/31 | 100 | 86,296 | ||||||||||||
Federal Home Loan Bank | 1.750 | 06/20/31 | 980 | 794,317 | ||||||||||||
Federal Home Loan Bank | 1.790 | 12/21/35 | 965 | 680,452 | ||||||||||||
Federal Home Loan Bank | 1.870 | 02/08/36 | 245 | 173,823 | ||||||||||||
Federal Home Loan Bank | 2.000(cc) | 05/27/31 | 140 | 121,531 | ||||||||||||
Federal Home Loan Bank | 2.050 | 05/12/31 | 145 | 119,197 | ||||||||||||
Federal Home Loan Bank | 2.090 | 02/22/36 | 325 | 233,360 | ||||||||||||
Federal Home Loan Bank | 4.250 | 09/10/32 | 370 | 360,107 | ||||||||||||
See Notes to Financial Statements.
| 14 |
| Description | Interest Rate | Maturity Date | Principal Amount (000)# | Value | ||||||||||
| U.S. GOVERNMENT AGENCY OBLIGATIONS (Continued) | ||||||||||||||
Federal Home Loan Mortgage Corp. | 1.220% | 08/19/30 | 280 | $ | 224,214 | |||||||||
Federal Home Loan Mortgage Corp. | 1.300 | 08/12/30 | 50 | 40,297 | ||||||||||
Federal Home Loan Mortgage Corp. | 1.460 | 08/17/35 | 280 | 192,959 | ||||||||||
Federal Home Loan Mortgage Corp. | 1.500 | 11/01/50 | 804 | 600,313 | ||||||||||
Federal Home Loan Mortgage Corp. | 1.899(s) | 11/15/38 | 2,070 | 1,018,279 | ||||||||||
Federal Home Loan Mortgage Corp. | 2.000 | 01/01/32 | 156 | 143,038 | ||||||||||
Federal Home Loan Mortgage Corp. | 2.000 | 05/01/51 | 880 | 694,437 | ||||||||||
Federal Home Loan Mortgage Corp. | 2.500 | 05/01/28 | 339 | 324,333 | ||||||||||
Federal Home Loan Mortgage Corp. | 2.500 | 05/01/28 | 417 | 398,895 | ||||||||||
Federal Home Loan Mortgage Corp. | 2.500 | 03/01/30 | 289 | 272,599 | ||||||||||
Federal Home Loan Mortgage Corp. | 2.500 | 09/01/31 | 201 | 188,085 | ||||||||||
Federal Home Loan Mortgage Corp. | 2.500 | 10/01/32 | 259 | 240,710 | ||||||||||
Federal Home Loan Mortgage Corp. | 2.500 | 11/01/46 | 950 | 804,308 | ||||||||||
Federal Home Loan Mortgage Corp. | 2.500 | 04/01/51 | 5,045 | 4,170,501 | ||||||||||
Federal Home Loan Mortgage Corp. | 3.000 | 10/01/28 | 46 | 44,438 | ||||||||||
Federal Home Loan Mortgage Corp. | 3.000 | 06/01/29 | 157 | 150,261 | ||||||||||
Federal Home Loan Mortgage Corp. | 3.000 | 12/01/30 | 239 | 228,069 | ||||||||||
Federal Home Loan Mortgage Corp. | 3.000 | 01/01/37 | 410 | 376,897 | ||||||||||
Federal Home Loan Mortgage Corp. | 3.000 | 04/01/43 | 672 | 597,695 | ||||||||||
Federal Home Loan Mortgage Corp. | 3.000 | 07/01/43 | 718 | 638,912 | ||||||||||
Federal Home Loan Mortgage Corp. | 3.000 | 10/01/46 | 297 | 260,227 | ||||||||||
Federal Home Loan Mortgage Corp. | 3.000 | 11/01/46 | 256 | 223,886 | ||||||||||
Federal Home Loan Mortgage Corp. | 3.000 | 12/01/46 | 238 | 208,298 | ||||||||||
Federal Home Loan Mortgage Corp. | 3.000 | 01/01/47 | 823 | 719,276 | ||||||||||
Federal Home Loan Mortgage Corp. | 3.000 | 03/01/47 | 187 | 163,640 | ||||||||||
Federal Home Loan Mortgage Corp. | 3.000 | 06/01/50 | 683 | 590,399 | ||||||||||
Federal Home Loan Mortgage Corp. | 3.500 | 11/01/37 | 176 | 164,731 | ||||||||||
Federal Home Loan Mortgage Corp. | 3.500 | 06/01/42 | 472 | 432,643 | ||||||||||
Federal Home Loan Mortgage Corp. | 3.500 | 06/01/43 | 344 | 315,218 | ||||||||||
Federal Home Loan Mortgage Corp. | 3.500 | 07/01/43 | 1,020 | 931,414 | ||||||||||
Federal Home Loan Mortgage Corp. | 3.500 | 07/01/47 | 1,145 | 1,042,770 | ||||||||||
Federal Home Loan Mortgage Corp. | 3.500 | 08/01/47 | 856 | 776,443 | ||||||||||
Federal Home Loan Mortgage Corp. | 3.500 | 10/01/47 | 79 | 71,737 | ||||||||||
Federal Home Loan Mortgage Corp. | 4.000 | 06/01/26 | 13 | 12,422 | ||||||||||
Federal Home Loan Mortgage Corp. | 4.000 | 09/01/26 | 36 | 35,804 | ||||||||||
Federal Home Loan Mortgage Corp. | 4.000 | 11/01/39 | 387 | 365,364 | ||||||||||
Federal Home Loan Mortgage Corp. | 4.000 | 09/01/40 | 221 | 208,331 | ||||||||||
Federal Home Loan Mortgage Corp. | 4.000 | 12/01/40 | 139 | 131,292 | ||||||||||
Federal Home Loan Mortgage Corp. | 4.000 | 12/01/40 | 174 | 164,022 | ||||||||||
Federal Home Loan Mortgage Corp. | 4.000 | 04/01/42 | 306 | 287,785 | ||||||||||
Federal Home Loan Mortgage Corp. | 4.000 | 04/01/42 | 471 | 444,519 | ||||||||||
Federal Home Loan Mortgage Corp. | 4.000 | 05/01/46 | 420 | 396,077 | ||||||||||
Federal Home Loan Mortgage Corp. | 4.000 | 08/01/46 | 123 | 115,565 | ||||||||||
Federal Home Loan Mortgage Corp. | 4.000 | 12/01/46 | 108 | 101,619 | ||||||||||
Federal Home Loan Mortgage Corp. | 4.000 | 07/01/47 | 221 | 207,870 | ||||||||||
See Notes to Financial Statements.
PGIM Government Income Fund | 15 |
Schedule of Investments (continued)
as of February 29, 2024
| Description | Interest Rate | Maturity Date | Principal Amount (000)# | Value | ||||||||||
| U.S. GOVERNMENT AGENCY OBLIGATIONS (Continued) | ||||||||||||||
Federal Home Loan Mortgage Corp. | 4.000% | 08/01/47 | 77 | $ | 72,355 | |||||||||
Federal Home Loan Mortgage Corp. | 4.000 | 08/01/47 | 233 | 217,248 | ||||||||||
Federal Home Loan Mortgage Corp. | 4.000 | 06/01/48 | 53 | 49,276 | ||||||||||
Federal Home Loan Mortgage Corp. | 4.000 | 11/01/48 | 103 | 96,467 | ||||||||||
Federal Home Loan Mortgage Corp. | 4.500 | 09/01/39 | 490 | 478,784 | ||||||||||
Federal Home Loan Mortgage Corp. | 4.500 | 07/01/47 | 80 | 77,120 | ||||||||||
Federal Home Loan Mortgage Corp. | 4.500 | 07/01/47 | 88 | 85,375 | ||||||||||
Federal Home Loan Mortgage Corp. | 4.500 | 08/01/47 | 271 | 262,276 | ||||||||||
Federal Home Loan Mortgage Corp. | 4.500 | 07/01/52 | 474 | 449,230 | ||||||||||
Federal Home Loan Mortgage Corp. | 5.000 | 06/01/33 | 287 | 284,728 | ||||||||||
Federal Home Loan Mortgage Corp. | 5.000 | 03/01/34 | 15 | 14,581 | ||||||||||
Federal Home Loan Mortgage Corp. | 5.000 | 05/01/34 | 27 | 27,225 | ||||||||||
Federal Home Loan Mortgage Corp. | 5.000 | 05/01/34 | 180 | 178,543 | ||||||||||
Federal Home Loan Mortgage Corp. | 5.000 | 02/01/48 | 106 | 104,865 | ||||||||||
Federal Home Loan Mortgage Corp. | 5.500 | 05/01/37 | 42 | 42,302 | ||||||||||
Federal Home Loan Mortgage Corp. | 5.500 | 01/01/38 | 34 | 34,829 | ||||||||||
Federal Home Loan Mortgage Corp. | 5.500 | 11/01/52 | 3,093 | 3,071,376 | ||||||||||
Federal Home Loan Mortgage Corp. | 6.000 | 12/01/33 | 14 | 14,471 | ||||||||||
Federal Home Loan Mortgage Corp. | 6.000 | 09/01/34 | 73 | 74,156 | ||||||||||
Federal Home Loan Mortgage Corp. | 6.500 | 09/01/32 | 20 | 20,625 | ||||||||||
Federal Home Loan Mortgage Corp. | 6.500 | 09/01/32 | 24 | 24,852 | ||||||||||
Federal Home Loan Mortgage Corp. | 6.750 | 03/15/31 | 335 | 382,518 | ||||||||||
Federal Home Loan Mortgage Corp. | 7.000 | 09/01/32 | 22 | 22,230 | ||||||||||
Federal National Mortgage Assoc. | 0.875 | 08/05/30 | 130 | 104,791 | ||||||||||
Federal National Mortgage Assoc. | 1.301(s) | 11/15/30 | 3,000 | 2,207,186 | ||||||||||
Federal National Mortgage Assoc. | 1.500 | 10/01/50 | 372 | 278,446 | ||||||||||
Federal National Mortgage Assoc. | 1.500 | 11/01/50 | 2,742 | 2,053,155 | ||||||||||
Federal National Mortgage Assoc. | 1.500 | 12/01/50 | 2,030 | 1,516,511 | ||||||||||
Federal National Mortgage Assoc. | 1.780 | 11/16/35 | 100 | 72,500 | ||||||||||
Federal National Mortgage Assoc. | 2.000 | 08/01/31 | 196 | 180,922 | ||||||||||
Federal National Mortgage Assoc. | 2.000 | 05/01/36 | 2,083 | 1,846,779 | ||||||||||
Federal National Mortgage Assoc. | 2.000 | 06/01/40 | 592 | 499,138 | ||||||||||
Federal National Mortgage Assoc. | 2.000 | 02/01/41 | 4,028 | 3,378,656 | ||||||||||
Federal National Mortgage Assoc. | 2.000 | 05/01/41 | 1,942 | 1,627,957 | ||||||||||
Federal National Mortgage Assoc. | 2.000 | 09/01/50 | 4,369 | 3,461,197 | ||||||||||
Federal National Mortgage Assoc.(k) | 2.000 | 10/01/50 | 11,612 | 9,201,915 | ||||||||||
Federal National Mortgage Assoc. | 2.000 | 11/01/50 | 863 | 680,846 | ||||||||||
Federal National Mortgage Assoc. | 2.000 | 01/01/51 | 1,146 | 907,037 | ||||||||||
Federal National Mortgage Assoc. | 2.000 | 01/01/51 | 1,636 | 1,294,806 | ||||||||||
Federal National Mortgage Assoc. | 2.000 | 02/01/51 | 408 | 322,237 | ||||||||||
Federal National Mortgage Assoc. | 2.000 | 05/01/51 | 2,191 | 1,729,168 | ||||||||||
Federal National Mortgage Assoc. | 2.500 | 06/01/28 | 143 | 136,555 | ||||||||||
Federal National Mortgage Assoc. | 2.500 | 08/01/28 | 174 | 165,736 | ||||||||||
Federal National Mortgage Assoc. | 2.500 | 08/01/29 | 36 | 34,290 | ||||||||||
Federal National Mortgage Assoc. | 2.500 | 11/01/31 | 140 | 130,745 | ||||||||||
See Notes to Financial Statements.
| 16 |
| Description | Interest Rate | Maturity Date | Principal Amount (000)# | Value | ||||||||||
| U.S. GOVERNMENT AGENCY OBLIGATIONS (Continued) | ||||||||||||||
Federal National Mortgage Assoc. | 2.500% | 02/01/36 | 435 | $ | 395,363 | |||||||||
Federal National Mortgage Assoc. | 2.500 | 05/01/41 | 773 | 661,532 | ||||||||||
Federal National Mortgage Assoc. | 2.500 | 06/01/41 | 1,200 | 1,040,160 | ||||||||||
Federal National Mortgage Assoc. | 2.500 | 02/01/43 | 132 | 112,190 | ||||||||||
Federal National Mortgage Assoc. | 2.500 | 12/01/46 | 613 | 514,836 | ||||||||||
Federal National Mortgage Assoc. | 2.500 | 01/01/50 | 1,344 | 1,115,059 | ||||||||||
Federal National Mortgage Assoc. | 2.500 | 03/01/50 | 196 | 162,993 | ||||||||||
Federal National Mortgage Assoc. | 2.500 | 05/01/50 | 991 | 822,092 | ||||||||||
Federal National Mortgage Assoc. | 2.500 | 06/01/50 | 505 | 418,346 | ||||||||||
Federal National Mortgage Assoc. | 2.500 | 08/01/50 | 4,312 | 3,570,833 | ||||||||||
Federal National Mortgage Assoc. | 2.500 | 09/01/50 | 4,413 | 3,653,330 | ||||||||||
Federal National Mortgage Assoc. | 2.500 | 10/01/50 | 3,787 | 3,136,664 | ||||||||||
Federal National Mortgage Assoc. | 2.500 | 03/01/51 | 2,446 | 2,024,053 | ||||||||||
Federal National Mortgage Assoc. | 2.500 | 04/01/51 | 5,077 | 4,198,558 | ||||||||||
Federal National Mortgage Assoc. | 2.500 | 05/01/51 | 1,359 | 1,122,930 | ||||||||||
Federal National Mortgage Assoc. | 2.500 | 05/01/52 | 876 | 727,861 | ||||||||||
Federal National Mortgage Assoc. | 3.000 | 01/01/27 | 101 | 97,524 | ||||||||||
Federal National Mortgage Assoc. | 3.000 | 08/01/28 | 279 | 268,711 | ||||||||||
Federal National Mortgage Assoc. | 3.000 | 02/01/31 | 238 | 226,004 | ||||||||||
Federal National Mortgage Assoc. | 3.000 | 11/01/36 | 145 | 133,351 | ||||||||||
Federal National Mortgage Assoc. | 3.000 | 12/01/42 | 759 | 673,697 | ||||||||||
Federal National Mortgage Assoc. | 3.000 | 02/01/43 | 339 | 301,005 | ||||||||||
Federal National Mortgage Assoc. | 3.000 | 03/01/43 | 282 | 250,079 | ||||||||||
Federal National Mortgage Assoc. | 3.000 | 04/01/43 | 314 | 278,824 | ||||||||||
Federal National Mortgage Assoc. | 3.000 | 06/01/43 | 142 | 126,015 | ||||||||||
Federal National Mortgage Assoc. | 3.000 | 06/01/43 | 274 | 243,033 | ||||||||||
Federal National Mortgage Assoc. | 3.000 | 07/01/43 | 945 | 838,899 | ||||||||||
Federal National Mortgage Assoc. | 3.000 | 09/01/46 | 748 | 653,277 | ||||||||||
Federal National Mortgage Assoc. | 3.000 | 11/01/46 | 888 | 779,946 | ||||||||||
Federal National Mortgage Assoc. | 3.000 | 11/01/46 | 954 | 837,785 | ||||||||||
Federal National Mortgage Assoc. | 3.000 | 01/01/47 | 115 | 101,474 | ||||||||||
Federal National Mortgage Assoc. | 3.000 | 04/01/47 | 1,942 | 1,696,437 | ||||||||||
Federal National Mortgage Assoc. | 3.000 | 12/01/49 | 257 | 222,893 | ||||||||||
Federal National Mortgage Assoc. | 3.000 | 12/01/49 | 576 | 499,365 | ||||||||||
Federal National Mortgage Assoc. | 3.000 | 01/01/50 | 42 | 36,324 | ||||||||||
Federal National Mortgage Assoc. | 3.000 | 06/01/50 | 241 | 208,547 | ||||||||||
Federal National Mortgage Assoc. | 3.000 | 06/01/50 | 662 | 572,357 | ||||||||||
Federal National Mortgage Assoc. | 3.000 | 11/01/51 | 3,231 | 2,775,577 | ||||||||||
Federal National Mortgage Assoc. | 3.000 | 02/01/52 | 3,059 | 2,621,306 | ||||||||||
Federal National Mortgage Assoc. | 3.000 | 04/01/52 | 879 | 763,510 | ||||||||||
Federal National Mortgage Assoc. | 3.000 | 05/01/52 | 3,217 | 2,807,016 | ||||||||||
Federal National Mortgage Assoc. | 3.500 | 12/01/30 | 27 | 26,257 | ||||||||||
Federal National Mortgage Assoc. | 3.500 | 11/01/32 | 863 | 829,628 | ||||||||||
Federal National Mortgage Assoc. | 3.500 | 02/01/33 | 48 | 46,122 | ||||||||||
Federal National Mortgage Assoc. | 3.500 | 05/01/33 | 80 | 76,698 | ||||||||||
See Notes to Financial Statements.
PGIM Government Income Fund | 17 |
Schedule of Investments (continued)
as of February 29, 2024
| Description | Interest Rate | Maturity Date | Principal Amount (000)# | Value | ||||||||||
| U.S. GOVERNMENT AGENCY OBLIGATIONS (Continued) | ||||||||||||||
Federal National Mortgage Assoc. | 3.500% | 10/01/41 | 703 | $ | 644,576 | |||||||||
Federal National Mortgage Assoc. | 3.500 | 12/01/41 | 202 | 185,241 | ||||||||||
Federal National Mortgage Assoc. | 3.500 | 03/01/42 | 251 | 229,843 | ||||||||||
Federal National Mortgage Assoc. | 3.500 | 05/01/42 | 878 | 803,706 | ||||||||||
Federal National Mortgage Assoc. | 3.500 | 07/01/42 | 302 | 275,992 | ||||||||||
Federal National Mortgage Assoc. | 3.500 | 12/01/42 | 706 | 645,086 | ||||||||||
Federal National Mortgage Assoc. | 3.500 | 03/01/43 | 237 | 216,273 | ||||||||||
Federal National Mortgage Assoc. | 3.500 | 06/01/45 | 1,503 | 1,362,741 | ||||||||||
Federal National Mortgage Assoc. | 3.500 | 01/01/46 | 400 | 361,627 | ||||||||||
Federal National Mortgage Assoc. | 3.500 | 12/01/46 | 751 | 680,286 | ||||||||||
Federal National Mortgage Assoc. | 3.500 | 03/01/48 | 1,388 | 1,258,102 | ||||||||||
Federal National Mortgage Assoc. | 3.500 | 04/01/48 | 1,191 | 1,078,820 | ||||||||||
Federal National Mortgage Assoc. | 3.500 | 11/01/48 | 787 | 713,212 | ||||||||||
Federal National Mortgage Assoc. | 3.500 | 04/01/52 | 304 | 270,564 | ||||||||||
Federal National Mortgage Assoc. | 4.000 | 07/01/37 | 885 | 852,270 | ||||||||||
Federal National Mortgage Assoc. | 4.000 | 09/01/40 | 375 | 353,067 | ||||||||||
Federal National Mortgage Assoc. | 4.000 | 01/01/41 | 464 | 436,927 | ||||||||||
Federal National Mortgage Assoc. | 4.000 | 09/01/44 | 306 | 287,675 | ||||||||||
Federal National Mortgage Assoc. | 4.000 | 06/01/47 | 1,105 | 1,036,469 | ||||||||||
Federal National Mortgage Assoc. | 4.000 | 06/01/47 | 1,157 | 1,084,366 | ||||||||||
Federal National Mortgage Assoc. | 4.000 | 08/01/47 | 240 | 225,560 | ||||||||||
Federal National Mortgage Assoc. | 4.000 | 09/01/47 | 1,404 | 1,321,588 | ||||||||||
Federal National Mortgage Assoc. | 4.000 | 10/01/47 | 70 | 66,061 | ||||||||||
Federal National Mortgage Assoc. | 4.000 | 10/01/47 | 701 | 655,146 | ||||||||||
Federal National Mortgage Assoc. | 4.000 | 11/01/47 | 805 | 754,872 | ||||||||||
Federal National Mortgage Assoc. | 4.000 | 12/01/47 | 166 | 156,054 | ||||||||||
Federal National Mortgage Assoc. | 4.000 | 06/01/48 | 79 | 73,786 | ||||||||||
Federal National Mortgage Assoc. | 4.000 | 06/01/52 | 3,202 | 2,947,991 | ||||||||||
Federal National Mortgage Assoc. | 4.336(s) | 03/17/31 | 530 | 379,936 | ||||||||||
Federal National Mortgage Assoc. | 4.500 | 04/01/41 | 344 | 335,581 | ||||||||||
Federal National Mortgage Assoc. | 4.500 | 05/01/41 | 289 | 281,470 | ||||||||||
Federal National Mortgage Assoc. | 4.500 | 01/01/45 | 102 | 99,013 | ||||||||||
Federal National Mortgage Assoc. | 4.500 | 12/01/47 | 706 | 677,004 | ||||||||||
Federal National Mortgage Assoc. | 4.500 | 06/01/48 | 145 | 139,413 | ||||||||||
Federal National Mortgage Assoc. | 4.500 | 10/01/48 | 558 | 536,935 | ||||||||||
Federal National Mortgage Assoc. | 4.500 | 06/01/52 | 1,498 | 1,418,309 | ||||||||||
Federal National Mortgage Assoc. | 5.000 | 12/01/31 | 47 | 46,204 | ||||||||||
Federal National Mortgage Assoc. | 5.000 | 03/01/34 | 136 | 135,195 | ||||||||||
Federal National Mortgage Assoc. | 5.000 | 07/01/35 | 55 | 55,027 | ||||||||||
Federal National Mortgage Assoc. | 5.000 | 09/01/35 | 40 | 40,083 | ||||||||||
Federal National Mortgage Assoc. | 5.000 | 11/01/35 | 46 | 46,051 | ||||||||||
Federal National Mortgage Assoc. | 5.000 | 05/01/36 | 21 | 20,584 | ||||||||||
Federal National Mortgage Assoc. | 5.000 | 07/01/52 | 2,956 | 2,869,724 | ||||||||||
Federal National Mortgage Assoc. | 5.500 | 02/01/34 | 127 | 128,748 | ||||||||||
Federal National Mortgage Assoc. | 5.500 | 09/01/34 | 215 | 218,380 | ||||||||||
See Notes to Financial Statements.
| 18 |
| Description | Interest Rate | Maturity Date | Principal Amount (000)# | Value | ||||||||||
| U.S. GOVERNMENT AGENCY OBLIGATIONS (Continued) | ||||||||||||||
Federal National Mortgage Assoc. | 5.500% | 02/01/35 | 190 | $ | 193,214 | |||||||||
Federal National Mortgage Assoc. | 5.500 | 06/01/35 | 48 | 48,384 | ||||||||||
Federal National Mortgage Assoc. | 5.500 | 06/01/35 | 79 | 79,569 | ||||||||||
Federal National Mortgage Assoc. | 5.500 | 09/01/35 | 69 | 70,096 | ||||||||||
Federal National Mortgage Assoc. | 5.500 | 09/01/35 | 145 | 147,313 | ||||||||||
Federal National Mortgage Assoc. | 5.500 | 10/01/35 | 144 | 146,353 | ||||||||||
Federal National Mortgage Assoc. | 5.500 | 11/01/35 | 92 | 93,700 | ||||||||||
Federal National Mortgage Assoc. | 5.500 | 11/01/35 | 123 | 123,409 | ||||||||||
Federal National Mortgage Assoc. | 5.500 | 11/01/36 | 4 | 3,617 | ||||||||||
Federal National Mortgage Assoc. | 5.500 | 10/01/52 | 446 | 442,201 | ||||||||||
Federal National Mortgage Assoc. | 5.500 | 11/01/52 | 2,264 | 2,247,117 | ||||||||||
Federal National Mortgage Assoc. | 6.000 | 09/01/33 | —(r | ) | 381 | |||||||||
Federal National Mortgage Assoc. | 6.000 | 11/01/33 | —(r | ) | 50 | |||||||||
Federal National Mortgage Assoc. | 6.000 | 02/01/34 | —(r | ) | 63 | |||||||||
Federal National Mortgage Assoc. | 6.000 | 06/01/34 | —(r | ) | 55 | |||||||||
Federal National Mortgage Assoc. | 6.000 | 09/01/34 | —(r | ) | 148 | |||||||||
Federal National Mortgage Assoc. | 6.000 | 09/01/34 | 10 | 10,336 | ||||||||||
Federal National Mortgage Assoc. | 6.000 | 09/01/34 | 14 | 13,762 | ||||||||||
Federal National Mortgage Assoc. | 6.000 | 11/01/34 | 3 | 3,179 | ||||||||||
Federal National Mortgage Assoc. | 6.000 | 11/01/34 | 22 | 22,760 | ||||||||||
Federal National Mortgage Assoc. | 6.000 | 02/01/35 | —(r | ) | 77 | |||||||||
Federal National Mortgage Assoc. | 6.000 | 03/01/35 | 4 | 3,696 | ||||||||||
Federal National Mortgage Assoc. | 6.000 | 04/01/35 | —(r | ) | 312 | |||||||||
Federal National Mortgage Assoc. | 6.000 | 12/01/35 | 52 | 52,732 | ||||||||||
Federal National Mortgage Assoc. | 6.000 | 01/01/36 | 137 | 139,036 | ||||||||||
Federal National Mortgage Assoc. | 6.000 | 05/01/36 | 37 | 38,065 | ||||||||||
Federal National Mortgage Assoc. | 6.000 | 05/01/36 | 215 | 220,344 | ||||||||||
Federal National Mortgage Assoc. | 6.500 | 07/01/32 | 214 | 222,365 | ||||||||||
Federal National Mortgage Assoc. | 6.500 | 08/01/32 | 70 | 72,111 | ||||||||||
Federal National Mortgage Assoc. | 6.500 | 09/01/32 | 36 | 37,650 | ||||||||||
Federal National Mortgage Assoc. | 6.500 | 10/01/32 | 37 | 38,561 | ||||||||||
Federal National Mortgage Assoc. | 6.500 | 10/01/32 | 217 | 225,593 | ||||||||||
Federal National Mortgage Assoc. | 6.500 | 10/01/37 | 186 | 194,934 | ||||||||||
Federal National Mortgage Assoc.(k) | 6.625 | 11/15/30 | 600 | 677,303 | ||||||||||
Federal National Mortgage Assoc. | 7.000 | 05/01/24 | —(r | ) | 265 | |||||||||
Federal National Mortgage Assoc. | 7.000 | 05/01/24 | —(r | ) | 490 | |||||||||
Federal National Mortgage Assoc. | 7.000 | 05/01/24 | 1 | 955 | ||||||||||
Federal National Mortgage Assoc. | 7.000 | 12/01/31 | 65 | 67,144 | ||||||||||
Federal National Mortgage Assoc. | 7.000 | 09/01/33 | 52 | 52,935 | ||||||||||
Federal National Mortgage Assoc. | 7.000 | 11/01/33 | 54 | 55,078 | ||||||||||
Federal National Mortgage Assoc. | 9.000 | 04/01/25 | —(r | ) | 146 | |||||||||
Federal National Mortgage Assoc. | 9.500 | 01/01/25 | 1 | 912 | ||||||||||
Freddie Mac Coupon Strips, Notes | 5.245(s) | 03/15/31 | 505 | 360,393 | ||||||||||
Freddie Mac Strips | 5.389(s) | 07/15/32 | 565 | 385,992 | ||||||||||
Government National Mortgage Assoc. | 2.500 | 12/20/46 | 160 | 137,374 | ||||||||||
See Notes to Financial Statements.
PGIM Government Income Fund | 19 |
Schedule of Investments (continued)
as of February 29, 2024
| Description | Interest Rate | Maturity Date | Principal Amount (000)# | Value | ||||||||||
| U.S. GOVERNMENT AGENCY OBLIGATIONS (Continued) | ||||||||||||||
Government National Mortgage Assoc. | 2.500% | 08/20/51 | 2,105 | $ | 1,782,373 | |||||||||
Government National Mortgage Assoc. | 3.000 | 03/15/45 | 515 | 455,039 | ||||||||||
Government National Mortgage Assoc. | 3.000 | 07/20/45 | 1,186 | 1,057,043 | ||||||||||
Government National Mortgage Assoc. | 3.000 | 07/20/46 | 573 | 509,514 | ||||||||||
Government National Mortgage Assoc. | 3.000 | 08/20/46 | 1,072 | 952,715 | ||||||||||
Government National Mortgage Assoc. | 3.000 | 10/20/46 | 87 | 76,826 | ||||||||||
Government National Mortgage Assoc. | 3.000 | 02/20/47 | 1,621 | 1,439,129 | ||||||||||
Government National Mortgage Assoc. | 3.000 | 05/20/47 | 303 | 268,966 | ||||||||||
Government National Mortgage Assoc. | 3.000 | 12/20/47 | 108 | 95,974 | ||||||||||
Government National Mortgage Assoc. | 3.000 | 04/20/49 | 442 | 391,640 | ||||||||||
Government National Mortgage Assoc. | 3.000 | 09/20/51 | 938 | 822,495 | ||||||||||
Government National Mortgage Assoc. | 3.500 | 04/20/42 | 123 | 113,786 | ||||||||||
Government National Mortgage Assoc. | 3.500 | 01/20/43 | 768 | 709,490 | ||||||||||
Government National Mortgage Assoc. | 3.500 | 04/20/43 | 340 | 314,178 | ||||||||||
Government National Mortgage Assoc. | 3.500 | 03/20/45 | 448 | 411,236 | ||||||||||
Government National Mortgage Assoc. | 3.500 | 04/20/45 | 241 | 221,236 | ||||||||||
Government National Mortgage Assoc. | 3.500 | 07/20/46 | 873 | 799,686 | ||||||||||
Government National Mortgage Assoc. | 3.500 | 03/20/47 | 82 | 75,202 | ||||||||||
Government National Mortgage Assoc. | 3.500 | 07/20/47 | 500 | 457,844 | ||||||||||
Government National Mortgage Assoc. | 3.500 | 02/20/48 | 1,085 | 992,776 | ||||||||||
Government National Mortgage Assoc. | 3.500 | 11/20/48 | 286 | 261,443 | ||||||||||
Government National Mortgage Assoc. | 3.500 | 01/20/49 | 248 | 227,094 | ||||||||||
Government National Mortgage Assoc. | 3.500 | 02/20/49 | 1,511 | 1,382,980 | ||||||||||
Government National Mortgage Assoc. | 3.500 | 05/20/49 | 399 | 365,065 | ||||||||||
Government National Mortgage Assoc. | 3.500 | 06/20/49 | 927 | 847,909 | ||||||||||
Government National Mortgage Assoc. | 4.000 | 02/20/41 | 162 | 154,736 | ||||||||||
Government National Mortgage Assoc. | 4.000 | 06/20/44 | 320 | 304,482 | ||||||||||
Government National Mortgage Assoc. | 4.000 | 08/20/44 | 98 | 93,979 | ||||||||||
Government National Mortgage Assoc. | 4.000 | 11/20/45 | 188 | 178,179 | ||||||||||
Government National Mortgage Assoc. | 4.000 | 11/20/46 | 174 | 164,642 | ||||||||||
Government National Mortgage Assoc. | 4.000 | 02/20/47 | 152 | 142,816 | ||||||||||
Government National Mortgage Assoc. | 4.000 | 10/20/47 | 159 | 149,163 | ||||||||||
Government National Mortgage Assoc. | 4.000 | 12/20/47 | 116 | 108,973 | ||||||||||
Government National Mortgage Assoc. | 4.000 | 07/20/48 | 336 | 314,974 | ||||||||||
Government National Mortgage Assoc. | 4.000 | 02/20/49 | 392 | 369,889 | ||||||||||
Government National Mortgage Assoc. | 4.000 | 03/20/49 | 643 | 605,246 | ||||||||||
Government National Mortgage Assoc. | 4.500 | 02/20/40 | 99 | 97,076 | ||||||||||
Government National Mortgage Assoc. | 4.500 | 01/20/41 | 62 | 60,262 | ||||||||||
Government National Mortgage Assoc. | 4.500 | 02/20/41 | 290 | 284,007 | ||||||||||
Government National Mortgage Assoc. | 4.500 | 03/20/41 | 146 | 143,441 | ||||||||||
Government National Mortgage Assoc. | 4.500 | 06/20/44 | 216 | 211,037 | ||||||||||
Government National Mortgage Assoc. | 4.500 | 02/20/46 | 18 | 17,513 | ||||||||||
Government National Mortgage Assoc. | 4.500 | 03/20/46 | 92 | 90,376 | ||||||||||
Government National Mortgage Assoc. | 4.500 | 03/20/47 | 422 | 410,552 | ||||||||||
Government National Mortgage Assoc. | 4.500 | 08/20/47 | 75 | 72,607 | ||||||||||
See Notes to Financial Statements.
| 20 |
| Description | Interest Rate | Maturity Date | Principal Amount (000)# | Value | ||||||||||
| U.S. GOVERNMENT AGENCY OBLIGATIONS (Continued) | ||||||||||||||
Government National Mortgage Assoc. | 4.500% | 01/20/48 | 58 | $ | 55,930 | |||||||||
Government National Mortgage Assoc. | 4.500 | 02/20/48 | 352 | 341,129 | ||||||||||
Government National Mortgage Assoc. | 4.500 | 05/20/52 | 1,917 | 1,834,117 | ||||||||||
Government National Mortgage Assoc. | 5.000 | 07/15/33 | 188 | 188,579 | ||||||||||
Government National Mortgage Assoc. | 5.000 | 09/15/33 | 289 | 288,988 | ||||||||||
Government National Mortgage Assoc. | 5.000 | 04/15/34 | 13 | 13,225 | ||||||||||
Government National Mortgage Assoc. | 5.500 | 02/15/34 | 138 | 140,968 | ||||||||||
Government National Mortgage Assoc. | 5.500 | 02/15/36 | 76 | 77,248 | ||||||||||
Government National Mortgage Assoc. | 7.000 | 04/15/24 | —(r | ) | 23 | |||||||||
Government National Mortgage Assoc. | 7.000 | 04/15/24 | —(r | ) | 143 | |||||||||
Government National Mortgage Assoc. | 7.000 | 04/15/24 | —(r | ) | 248 | |||||||||
Government National Mortgage Assoc. | 7.000 | 05/15/24 | —(r | ) | 6 | |||||||||
Government National Mortgage Assoc. | 7.000 | 05/15/24 | —(r | ) | 18 | |||||||||
Government National Mortgage Assoc. | 7.000 | 05/15/24 | —(r | ) | 26 | |||||||||
Government National Mortgage Assoc. | 7.000 | 05/15/24 | —(r | ) | 26 | |||||||||
Government National Mortgage Assoc. | 7.000 | 05/15/24 | —(r | ) | 66 | |||||||||
Government National Mortgage Assoc. | 7.000 | 06/15/24 | —(r | ) | 11 | |||||||||
Government National Mortgage Assoc. | 7.000 | 06/15/24 | —(r | ) | 64 | |||||||||
Government National Mortgage Assoc. | 7.000 | 06/15/24 | —(r | ) | 151 | |||||||||
Government National Mortgage Assoc. | 7.000 | 06/15/24 | —(r | ) | 165 | |||||||||
Government National Mortgage Assoc. | 7.000 | 06/15/24 | —(r | ) | 211 | |||||||||
Government National Mortgage Assoc. | 7.000 | 07/15/24 | —(r | ) | 28 | |||||||||
Government National Mortgage Assoc. | 7.000 | 02/15/29 | 4 | 3,935 | ||||||||||
Government National Mortgage Assoc. | 7.500 | 04/15/24 | —(r | ) | 87 | |||||||||
Government National Mortgage Assoc. | 7.500 | 05/15/24 | —(r | ) | 1 | |||||||||
Government National Mortgage Assoc. | 7.500 | 06/15/24 | —(r | ) | 55 | |||||||||
Government National Mortgage Assoc. | 7.500 | 06/15/24 | —(r | ) | 70 | |||||||||
Government National Mortgage Assoc. | 7.500 | 06/15/24 | —(r | ) | 288 | |||||||||
Government National Mortgage Assoc. | 8.500 | 04/15/25 | 3 | 2,810 | ||||||||||
Resolution Funding Corp. Interest Strips, Bonds | 4.330(s) | 01/15/29 | 1,335 | 1,065,650 | ||||||||||
Resolution Funding Corp. Interest Strips, Bonds | 4.333(s) | 07/15/28 | 2,835 | 2,320,151 | ||||||||||
Resolution Funding Corp. Interest Strips, Bonds | 4.343(s) | 01/15/28 | 1,040 | 862,762 | ||||||||||
Resolution Funding Corp. Interest Strips | 2.776(s) | 01/15/30 | 630 | 480,248 | ||||||||||
Resolution Funding Corp. Interest Strips | 3.564(s) | 04/15/30 | 1,290 | 973,383 | ||||||||||
Resolution Funding Corp. Principal Strips | 4.075(s) | 04/15/30 | 5,595 | 4,207,579 | ||||||||||
Resolution Funding Corp. Principal Strips | 4.273(s) | 01/15/30 | 10,230 | 7,800,106 | ||||||||||
Tennessee Valley Authority, Sr. Unsec’d. Notes | 0.750 | 05/15/25 | 1,485 | 1,412,040 | ||||||||||
Tennessee Valley Authority, Sr. Unsec’d. Notes | 1.500 | 09/15/31 | 885 | 709,974 | ||||||||||
Tennessee Valley Authority, Sr. Unsec’d. Notes | 2.875 | 02/01/27 | 335 | 319,931 | ||||||||||
Tennessee Valley Authority, Sr. Unsec’d. Notes | 5.880 | 04/01/36 | 170 | 189,203 | ||||||||||
Tennessee Valley Authority, Sr. Unsec’d. Notes | 6.750 | 11/01/25 | 1,300 | 1,338,452 | ||||||||||
Tennessee Valley Authority, Sr. Unsec’d. Notes | 7.125 | 05/01/30 | 1,000 | 1,139,292 | ||||||||||
|
| |||||||||||||
| TOTAL U.S. GOVERNMENT AGENCY OBLIGATIONS | ||||||||||||||
(cost $213,897,230) |
| 191,206,786 | ||||||||||||
|
| |||||||||||||
See Notes to Financial Statements.
PGIM Government Income Fund | 21 |
Schedule of Investments (continued)
as of February 29, 2024
| Description | Interest Rate | Maturity Date | Principal Amount (000)# | Value | ||||||||||||
| U.S. TREASURY OBLIGATIONS 22.2% | ||||||||||||||||
U.S. Treasury Bonds | 2.000% | 11/15/41 | 9,475 | $ | 6,558,477 | |||||||||||
U.S. Treasury Bonds | 2.250 | 05/15/41 | 5,125 | 3,742,051 | ||||||||||||
U.S. Treasury Bonds | 2.500 | 02/15/46 | 3,850 | 2,762,977 | ||||||||||||
U.S. Treasury Bonds(k) | 3.000 | 11/15/44 | 4,565 | 3,621,329 | ||||||||||||
U.S. Treasury Bonds | 3.375 | 11/15/48 | 8,165 | 6,782,053 | ||||||||||||
U.S. Treasury Bonds | 3.625 | 02/15/53 | 270 | 236,166 | ||||||||||||
U.S. Treasury Notes | 4.000 | 02/15/34 | 160 | 156,875 | ||||||||||||
U.S. Treasury Strips Coupon | 1.389(s) | 05/15/43 | 4,320 | 1,750,781 | ||||||||||||
U.S. Treasury Strips Coupon | 1.463(s) | 11/15/42 | 475 | 196,995 | ||||||||||||
U.S. Treasury Strips Coupon | 1.677(s) | 02/15/43 | 19,320 | 7,933,275 | ||||||||||||
U.S. Treasury Strips Coupon | 1.787(s) | 02/15/39 | 8,740 | 4,427,356 | ||||||||||||
U.S. Treasury Strips Coupon | 2.010(s) | 08/15/30 | 1,409 | 1,066,437 | ||||||||||||
U.S. Treasury Strips Coupon | 2.351(s) | 11/15/40 | 3,415 | 1,562,896 | ||||||||||||
U.S. Treasury Strips Coupon | 2.365(s) | 11/15/44 | 2,240 | 846,650 | ||||||||||||
U.S. Treasury Strips Coupon | 2.472(s) | 08/15/40 | 2,420 | 1,124,638 | ||||||||||||
U.S. Treasury Strips Coupon | 3.243(s) | 02/15/46 | 9,895 | 3,553,697 | ||||||||||||
U.S. Treasury Strips Coupon | 3.490(s) | 02/15/42 | 7,070 | 3,042,309 | ||||||||||||
U.S. Treasury Strips Coupon | 3.815(s) | 02/15/41 | 2,650 | 1,199,643 | ||||||||||||
U.S. Treasury Strips Coupon | 4.350(s) | 08/15/41 | 8,735 | 3,853,636 | ||||||||||||
U.S. Treasury Strips Coupon | 4.427(s) | 11/15/41 | 2,145 | 935,086 | ||||||||||||
U.S. Treasury Strips Coupon | 4.800(s) | 05/15/42 | 115 | 48,821 | ||||||||||||
U.S. Treasury Strips Coupon | 4.920(s) | 08/15/48 | 225 | 73,037 | ||||||||||||
U.S. Treasury Strips Coupon | 4.924(s) | 02/15/49 | 240 | 76,434 | ||||||||||||
U.S. Treasury Strips Coupon | 5.035(s) | 02/15/40 | 17,855 | 8,546,686 | ||||||||||||
U.S. Treasury Strips Coupon(h) | 5.339(s) | 05/15/40 | 21,795 | 10,278,556 | ||||||||||||
|
| |||||||||||||||
TOTAL U.S. TREASURY OBLIGATIONS | 74,376,861 | |||||||||||||||
|
| |||||||||||||||
TOTAL LONG-TERM INVESTMENTS | 327,779,475 | |||||||||||||||
|
| |||||||||||||||
Shares | ||||||||||||||||
SHORT-TERM INVESTMENT 0.7% | ||||||||||||||||
AFFILIATED MUTUAL FUND | ||||||||||||||||
PGIM Core Government Money Market Fund (7-day effective yield 5.545%) (cost $2,425,135)(wb) | 2,425,135 | 2,425,135 | ||||||||||||||
|
| |||||||||||||||
TOTAL INVESTMENTS 98.8% |
| 330,204,610 | ||||||||||||||
Other assets in excess of liabilities(z) 1.2% | 4,069,769 | |||||||||||||||
|
| |||||||||||||||
NET ASSETS 100.0% | $ | 334,274,379 | ||||||||||||||
|
| |||||||||||||||
See Notes to Financial Statements.
| 22 |
Below is a list of the abbreviation(s) used in the annual report:
USD—US Dollar
144A—Security was purchased pursuant to Rule 144A under the Securities Act of 1933 and, pursuant to the requirements of Rule 144A, may not be resold except to qualified institutional buyers.
A—Annual payment frequency for swaps
Aces—Alternative Credit Enhancements Securities
CGM—Citigroup Global Markets, Inc.
CLO—Collateralized Loan Obligation
CME—Chicago Mercantile Exchange
FHLMC—Federal Home Loan Mortgage Corporation
JPM—JPMorgan Chase Bank N.A.
SOFR—Secured Overnight Financing Rate
T—Swap payment upon termination
TBA—To Be Announced
UMBS—Uniform Mortgage-Backed Securities
| # | Principal or notional amount is shown in U.S. dollars unless otherwise stated. |
| (c) | Variable rate instrument. The interest rate shown reflects the rate in effect at February 29, 2024. |
| (cc) | Variable rate instrument. The rate shown is based on the latest available information as of February 29, 2024. Certain variable rate securities are not based on a published reference rate and spread but are determined by the issuer or agent and are based on current market conditions. These securities do not indicate a reference rate and spread in their description. |
| (h) | Represents security, or a portion thereof, segregated as collateral for OTC derivatives. |
| (k) | Represents security, or a portion thereof, segregated as collateral for centrally cleared/exchange-traded derivatives. |
| (r) | Principal or notional amount is less than $500 par. |
| (s) | Represents zero coupon bond or principal only security. Rate represents yield to maturity at purchase date. |
| (wb) | Represents an investment in a Fund affiliated with the Manager. |
| (z) | Includes net unrealized appreciation/(depreciation) and/or market value of the below holdings which are excluded from the Schedule of Investments: |
Forward Commitment Contracts:
U.S. Government Agency Obligations | Interest Rate | Maturity Date | Settlement Date | Principal Amount (000)# | Value | |||||||||||||||
Federal National Mortgage Assoc. | 2.500 | % | TBA | 03/13/24 | $ | (2,500 | ) | $ | (2,053,775 | ) | ||||||||||
Federal National Mortgage Assoc. | 4.000 | % | TBA | 03/13/24 | (3,000 | ) | (2,759,925 | ) | ||||||||||||
Federal National Mortgage Assoc. | 5.500 | % | TBA | 03/13/24 | (4,250 | ) | (4,203,984 | ) | ||||||||||||
|
| |||||||||||||||||||
TOTAL FORWARD COMMITMENT CONTRACTS | $ | (9,017,684 | ) | |||||||||||||||||
|
| |||||||||||||||||||
Futures contracts outstanding at February 29, 2024:
Number | Type | Expiration Date | Current Notional Amount | Value / Unrealized Appreciation (Depreciation) | ||||||||||
Long Positions: | ||||||||||||||
| 50 | 3 Month CME SOFR | Mar. 2024 | $ | 11,830,938 | $ | 10,021 | ||||||||
| 80 | 3 Month CME SOFR | Sep. 2024 | 18,978,000 | (86,147 | ) | |||||||||
See Notes to Financial Statements.
PGIM Government Income Fund | 23 |
Schedule of Investments (continued)
as of February 29, 2024
Futures contracts outstanding at February 29, 2024 (continued):
Number | Type | Expiration | Current Notional Amount | Value / Unrealized Appreciation (Depreciation) | ||||||||||
Long Positions (cont’d): | ||||||||||||||
| 200 | 2 Year U.S. Treasury Notes | Jun. 2024 | $ | 40,950,000 | $ | (13,705 | ) | |||||||
| 411 | 5 Year U.S. Treasury Notes | Jun. 2024 | 43,938,469 | (22,152 | ) | |||||||||
| 414 | 10 Year U.S. Treasury Notes | Jun. 2024 | 45,721,125 | 31,358 | ||||||||||
| 42 | 30 Year U.S. Ultra Treasury Bonds | Jun. 2024 | 5,370,750 | 64,217 | ||||||||||
|
| |||||||||||||
| (16,408 | ) | |||||||||||||
|
| |||||||||||||
Short Positions: | ||||||||||||||
| 221 | 10 Year U.S. Ultra Treasury Notes | Jun. 2024 | 25,231,985 | (128,962 | ) | |||||||||
| 779 | 20 Year U.S. Treasury Bonds | Jun. 2024 | 92,895,750 | (956,914 | ) | |||||||||
| 25 | 30 Year UMBS TBA – 3.0% Coupon | Apr. 2024 | 2,137,305 | (4,622 | ) | |||||||||
| 30 | 30 Year UMBS TBA – 3.5% Coupon | Apr. 2024 | 2,667,422 | (7,070 | ) | |||||||||
| 5 | 30 Year UMBS TBA – 4.0% Coupon | Apr. 2024 | 460,313 | (1,706 | ) | |||||||||
| 10 | 30 Year UMBS TBA – 4.5% Coupon | Apr. 2024 | 945,938 | (2,513 | ) | |||||||||
| 5 | 30 Year UMBS TBA – 5.0% Coupon | Apr. 2024 | 485,273 | (1,881 | ) | |||||||||
|
| |||||||||||||
| (1,103,668 | ) | |||||||||||||
|
| |||||||||||||
| $ | (1,120,076 | ) | ||||||||||||
|
| |||||||||||||
Interest rate swap agreements outstanding at February 29, 2024:
| Notional Amount (000)# | Termination Date | Fixed Rate | Floating Rate | Value at Trade Date | Value at February 29, 2024 | Unrealized Appreciation (Depreciation) | ||||||||||||||||
Centrally Cleared Interest Rate Swap Agreements: | ||||||||||||||||||||||
| 15,195 | 08/31/24 | 5.384 | %(T) | 1 Day SOFR(2)(T)/5.320% | $ | — | $ | (3,408 | ) | $ | (3,408 | ) | ||||||||||
| 5,936 | 03/08/25 | 4.946 | %(A) | 1 Day SOFR(2)(A)/ 5.320% | — | (19,915 | ) | (19,915 | ) | |||||||||||||
| 7,632 | 03/09/25 | 5.110 | %(A) | 1 Day SOFR(2)(A)/ 5.320% | — | (913 | ) | (913 | ) | |||||||||||||
| 7,835 | 08/31/25 | 4.805 | %(A) | 1 Day SOFR(1)(A)/ 5.320% | — | 21,475 | 21,475 | |||||||||||||||
|
|
|
|
|
| |||||||||||||||||
| $ | — | $ | (2,761 | ) | $ | (2,761 | ) | |||||||||||||||
|
|
|
|
|
| |||||||||||||||||
| (1) | The Fund pays the fixed rate and receives the floating rate. |
| (2) | The Fund pays the floating rate and receives the fixed rate. |
See Notes to Financial Statements.
| 24 |
Total return swap agreement outstanding at February 29, 2024:
Reference Entity | Financing | Counterparty | Termination Date | Long (Short) Notional Amount (000)#(1) | Fair Value | Upfront Premiums Paid (Received) | Unrealized Appreciation (Depreciation)(2) | |||||||||||||||||
OTC Total Return Swap Agreement: |
| |||||||||||||||||||||||
| U.S. Treasury Bond(T) | 1 Day USOIS +24 bps(T)/ 5.570% | JPM | 07/09/24 | 7,295 | $ | (339,494 | ) | $ | — | $ | (339,494 | ) | ||||||||||||
|
|
|
|
|
| |||||||||||||||||||
| (1) | On a long total return swap, the Fund receives payments for any positive return on the reference entity (makes payments for any negative return) and pays the financing rate. On a short total return swap, the Fund makes payments for any positive return on the reference entity (receives payments for any negative return) and receives the financing rate. |
| (2) | Upfront/recurring fees or commissions, as applicable, are included in the net unrealized appreciation (depreciation). |
Balances Reported in the Statement of Assets and Liabilities for OTC Swap Agreements:
| Premiums Paid | Premiums Received | Unrealized Appreciation | Unrealized Depreciation | |||||||||||||
OTC Swap Agreements | $ | — | $ | — | $ | — | $ | (339,494 | ) | |||||||
Summary of Collateral for Centrally Cleared/Exchange-traded Derivatives:
Cash and securities segregated as collateral, including pending settlement for closed positions, to cover requirements for centrally cleared/exchange-traded derivatives are listed by broker as follows:
Broker | Cash and/or Foreign Currency | Securities Market Value | ||
| CGM | $— | $3,706,258 | ||
Fair Value Measurements:
Various inputs are used in determining the value of the Fund’s investments. These inputs are summarized in the three broad levels listed below.
Level 1—unadjusted quoted prices generally in active markets for identical securities.
Level 2—quoted prices for similar securities, interest rates and yield curves, prepayment speeds, foreign currency exchange rates and other observable inputs.
Level 3—unobservable inputs for securities valued in accordance with Board approved fair valuation procedures.
See Notes to Financial Statements.
PGIM Government Income Fund | 25 |
Schedule of Investments (continued)
as of February 29, 2024
The following is a summary of the inputs used as of February 29, 2024 in valuing such portfolio securities:
| Level 1 | Level 2 | Level 3 | ||||||||||
Investments in Securities | ||||||||||||
Assets | ||||||||||||
Long-Term Investments | ||||||||||||
| Asset-Backed Securities | ||||||||||||
Collateralized Loan Obligations. | $ | — | $ | 26,615,581 | $ | — | ||||||
Commercial Mortgage-Backed Securities | — | 34,699,997 | — | |||||||||
Corporate Bond | — | 880,250 | — | |||||||||
U.S. Government Agency Obligations | — | 191,206,786 | — | |||||||||
U.S. Treasury Obligations | — | 74,376,861 | — | |||||||||
| Short-Term Investment | ||||||||||||
Affiliated Mutual Fund | 2,425,135 | — | — | |||||||||
|
|
|
|
|
| |||||||
Total | $ | 2,425,135 | $ | 327,779,475 | $ | — | ||||||
|
|
|
|
|
| |||||||
Other Financial Instruments* | ||||||||||||
Assets | ||||||||||||
Futures Contracts. | $ | 105,596 | $ | — | $ | — | ||||||
Centrally Cleared Interest Rate Swap Agreement. | — | 21,475 | — | |||||||||
|
|
|
|
|
| |||||||
Total | $ | 105,596 | $ | 21,475 | $ | — | ||||||
|
|
|
|
|
| |||||||
Liabilities | ||||||||||||
Forward Commitment Contracts. | $ | — | $ | (9,017,684 | ) | $ | — | |||||
Futures Contracts. | (1,225,672 | ) | — | — | ||||||||
Centrally Cleared Interest Rate Swap Agreements. | — | (24,236 | ) | — | ||||||||
OTC Total Return Swap Agreement. | — | (339,494 | ) | — | ||||||||
|
|
|
|
|
| |||||||
Total | $ | (1,225,672 | ) | $ | (9,381,414 | ) | $ | — | ||||
|
|
|
|
|
| |||||||
| * | Other financial instruments are derivative instruments not reflected in the Schedule of Investments, such as futures, forwards and centrally cleared swap contracts, which are recorded at unrealized appreciation (depreciation) on the instrument, and OTC swap contracts which are recorded at fair value. |
Industry Classification:
The industry classification of investments and other assets in excess of liabilities shown as a percentage of net assets as of February 29, 2024 were as follows:
U.S. Government Agency Obligations | 57.2 | % | ||
U.S. Treasury Obligations | 22.2 | |||
Commercial Mortgage-Backed Securities | 10.4 | |||
Collateralized Loan Obligations | 8.0 | |||
Affiliated Mutual Fund | 0.7 |
Diversified Financial Services | 0.3 | % | ||
|
| |||
| 98.8 | ||||
Other assets in excess of liabilities | 1.2 | |||
|
| |||
| 100.0 | % | |||
|
|
See Notes to Financial Statements.
| 26 |
Effects of Derivative Instruments on the Financial Statements and Primary Underlying Risk Exposure:
The Fund invested in derivative instruments during the reporting period. The primary type of risk associated with these derivative instruments is interest rate risk. See the Notes to Financial Statements for additional detail regarding these derivative instruments and their risks. The effect of such derivative instruments on the Fund’s financial position and financial performance as reflected in the Statement of Assets and Liabilities and Statement of Operations is presented in the summary below.
Fair values of derivative instruments as of February 29, 2024 as presented in the Statement of Assets and Liabilities:
| Asset Derivatives | Liability Derivatives | |||||||||||||
Derivatives not accounted for | Statement of Assets and Liabilities Location | Fair Value | Statement of Assets and Liabilities Location | Fair Value | ||||||||||
| Interest rate contracts | | Due from/to broker-variation margin futures | | $ | 105,596 | * | Due from/to broker-variation margin futures | $ | 1,225,672 | * | ||||
| Interest rate contracts | | Due from/to broker- variation margin swaps | 21,475 | * | Due from/to broker- variation margin swaps | 24,236 | * | |||||||
Interest rate contracts | — | — | Unrealized depreciation on OTC swap agreements | 339,494 | ||||||||||
|
|
|
| |||||||||||
| $ | 127,071 | $ | 1,589,402 | |||||||||||
|
|
|
| |||||||||||
| * | Includes cumulative appreciation (depreciation) as reported in the schedule of open futures and centrally cleared swap contracts. Only unsettled variation margin receivable (payable) is reported within the Statement of Assets and Liabilities. |
The effects of derivative instruments on the Statement of Operations for the year ended February 29, 2024 are as follows:
Amount of Realized Gain (Loss) on Derivatives Recognized in Income | ||||||||||||
Derivatives not accounted for as hedging instruments, carried at fair value | Options Written | Futures | Swaps | |||||||||
Interest rate contracts | $ | 19,688 | $ | 7,971,295 | $ | 106,098 | ||||||
|
|
|
|
|
| |||||||
Change in Unrealized Appreciation (Depreciation) on Derivatives Recognized in Income | ||||||||||||
Derivatives not accounted for as hedging instruments, carried at fair value | Options Written | Futures | Swaps | |||||||||
Interest rate contracts | $ | (7,339 | ) | $ | (1,502,505 | ) | $ | (342,255 | ) | |||
|
|
|
|
|
| |||||||
For the year ended February 29, 2024, the Fund’s average volume of derivative activities is as follows:
| Derivative Contract Type | Average Volume of Derivative Activities* | |
Options Written (1) | $ 800,000 |
See Notes to Financial Statements.
PGIM Government Income Fund | 27 |
Schedule of Investments (continued)
as of February 29, 2024
| Derivative Contract Type | Average Volume of Derivative Activities* | |
Futures Contracts - Long Positions (1) | $206,497,197 | |
Futures Contracts - Short Positions (1) | 174,936,078 | |
Interest Rate Swap Agreements (1) | 24,672,400 | |
Total Return Swap Agreements (1) | 1,459,000 |
| * | Average volume is based on average quarter end balances for the year ended February 29, 2024. |
| (1) | Notional Amount in USD. |
Financial Instruments/Transactions—Summary of Offsetting and Netting Arrangements:
The Fund invested in OTC derivatives during the reporting period that are either offset in accordance with current requirements or are subject to enforceable master netting arrangements or similar agreements that permit offsetting. The information about offsetting and related netting arrangements for OTC derivatives where the legal right to set-off exists is presented in the summary below.
Offsetting of OTC derivative assets and liabilities:
Counterparty | Gross Amounts of Recognized Assets(1) | Gross Amounts of Recognized Liabilities(1) | Net Amounts of Recognized Assets/(Liabilities) | Collateral Pledged/(Received)(2) | Net Amount | |||||
JPM | $— | $(339,494) | $(339,494) | $339,494 | $— |
| (1) | Includes unrealized appreciation/(depreciation) on swaps and forwards, premiums paid/(received) on swap agreements and market value of purchased and written options, as represented on the Statement of Assets and Liabilities. |
| (2) | Collateral amount disclosed by the Fund is limited to the market value of financial instruments/transactions and the Fund’s OTC derivative exposure by counterparty. |
See Notes to Financial Statements.
| 28 |
Statement of Assets and Liabilities
as of February 29, 2024
Assets | ||||
Investments at value: | ||||
Unaffiliated investments (cost $370,674,526) | $ | 327,779,475 | ||
Affiliated investments (cost $2,425,135) | 2,425,135 | |||
Cash | 1,753 | |||
Receivable for investments sold | 13,482,905 | |||
Dividends and interest receivable | 1,113,869 | |||
Receivable for Fund shares sold | 589,409 | |||
Due from broker—variation margin swaps | 15,466 | |||
Prepaid expenses | 2,488 | |||
|
| |||
Total Assets | 345,410,500 | |||
|
| |||
| Liabilities | ||||
Forward commitment contracts, at value (proceeds receivable $9,140,869) | 9,017,684 | |||
Payable for Fund shares purchased | 999,249 | |||
Due to broker—variation margin futures | 366,663 | |||
Unrealized depreciation on OTC swap agreements | 339,494 | |||
Accrued expenses and other liabilities | 172,119 | |||
Management fee payable | 113,731 | |||
Dividends payable | 64,476 | |||
Distribution fee payable | 34,927 | |||
Affiliated transfer agent fee payable | 25,352 | |||
Directors’ fees payable | 2,426 | |||
|
| |||
Total Liabilities | 11,136,121 | |||
|
| |||
Net Assets | $ | 334,274,379 | ||
|
| |||
Net assets were comprised of: | ||||
Common stock, at par | $ | 429 | ||
Paid-in capital in excess of par | 444,785,523 | |||
Total distributable earnings (loss) | (110,511,573 | ) | ||
|
| |||
Net assets, February 29, 2024 | $ | 334,274,379 | ||
|
| |||
See Notes to Financial Statements.
PGIM Government Income Fund | 29 |
Statement of Assets and Liabilities
as of February 29, 2024
| Class A | ||||
Net asset value and redemption price per share, | $ | 7.80 | ||
Maximum sales charge (3.25% of offering price) | 0.26 | |||
|
| |||
Maximum offering price to public | $ | 8.06 | ||
|
| |||
| Class C | ||||
Net asset value, offering price and redemption price per share, | $ | 7.82 | ||
|
| |||
| Class R | ||||
Net asset value, offering price and redemption price per share, | $ | 7.82 | ||
|
| |||
| Class Z | ||||
Net asset value, offering price and redemption price per share, | $ | 7.79 | ||
|
| |||
| Class R6 | ||||
Net asset value, offering price and redemption price per share, | $ | 7.78 | ||
|
| |||
See Notes to Financial Statements.
| 30 |
Statement of Operations
Year Ended February 29, 2024
Net Investment Income (Loss) | ||||||||
Income | ||||||||
Interest income | $ | 17,532,456 | ||||||
Affiliated dividend income | 355,981 | |||||||
Unaffiliated dividend income | 42,540 | |||||||
|
| |||||||
Total income | 17,930,977 | |||||||
|
| |||||||
Expenses | ||||||||
Management fee | 2,154,492 | |||||||
Distribution fee(a) | 513,173 | |||||||
Transfer agent’s fees and expenses (including affiliated expense of $145,760)(a) | 811,638 | |||||||
Registration fees(a) | 87,951 | |||||||
Custodian and accounting fees | 63,204 | |||||||
Shareholders’ reports | 58,282 | |||||||
Professional fees | 46,697 | |||||||
Audit fee | 39,220 | |||||||
Directors’ fees | 16,072 | |||||||
Miscellaneous | 31,730 | |||||||
|
| |||||||
Total expenses | 3,822,459 | |||||||
Less: Fee waiver and/or expense reimbursement(a) | (520,085 | ) | ||||||
Distribution fee waiver(a) | (16,040 | ) | ||||||
|
| |||||||
Net expenses | 3,286,334 | |||||||
|
| |||||||
Net investment income (loss) | 14,644,643 | |||||||
|
| |||||||
| Realized And Unrealized Gain (Loss) On Investment And Foreign Currency Transactions | ||||||||
Net realized gain (loss) on: | ||||||||
Investment transactions | (47,477,963 | ) | ||||||
Futures transactions | 7,971,295 | |||||||
Options written transactions | 19,688 | |||||||
Swap agreement transactions | 106,098 | |||||||
|
| |||||||
| (39,380,882 | ) | |||||||
|
| |||||||
Net change in unrealized appreciation (depreciation) on: | ||||||||
Investments | 31,741,398 | |||||||
Futures | (1,502,505 | ) | ||||||
Options written | (7,339 | ) | ||||||
Swap agreements | (342,255 | ) | ||||||
Foreign currencies | (1 | ) | ||||||
|
| |||||||
| 29,889,298 | ||||||||
|
| |||||||
Net gain (loss) on investment and foreign currency transactions | (9,491,584 | ) | ||||||
|
| |||||||
Net Increase (Decrease) In Net Assets Resulting From Operations | $ | 5,153,059 | ||||||
|
| |||||||
See Notes to Financial Statements.
PGIM Government Income Fund | 31 |
Statement of Operations
Year Ended February 29, 2024
| (a) | Class specific expenses and waivers were as follows: |
Class A | Class C | Class R | Class Z | Class R6 | ||||||||||||||||
Distribution fee | 427,005 | 38,048 | 48,120 | — | — | |||||||||||||||
Transfer agent’s fees and expenses | 550,986 | 8,332 | 11,108 | 238,166 | 3,046 | |||||||||||||||
Registration fees | 20,474 | 9,741 | 6,905 | 31,636 | 19,195 | |||||||||||||||
Fee waiver and/or expense reimbursement | (93,672 | ) | (2,087 | ) | (3,519 | ) | (356,120 | ) | (64,687 | ) | ||||||||||
Distribution fee waiver | — | — | (16,040 | ) | — | — | ||||||||||||||
See Notes to Financial Statements.
| 32 |
Statements of Changes in Net Assets
Year Ended February 28/29, | ||||||||
| 2024 | 2023 | |||||||
Increase (Decrease) in Net Assets | ||||||||
Operations | ||||||||
Net investment income (loss) | $ | 14,644,643 | $ | 10,178,045 | ||||
Net realized gain (loss) on investment transactions | (39,380,882 | ) | 398,492 | |||||
Net change in unrealized appreciation (depreciation) on investments and foreign currencies | 29,889,298 | (62,278,719 | ) | |||||
|
|
|
| |||||
Net increase (decrease) in net assets resulting from operations | 5,153,059 | (51,702,182 | ) | |||||
|
|
|
| |||||
Dividends and Distributions | ||||||||
Distributions from distributable earnings | ||||||||
Class A | (5,325,979 | ) | (4,473,862 | ) | ||||
Class C | (84,766 | ) | (57,299 | ) | ||||
Class R | (187,944 | ) | (151,118 | ) | ||||
Class Z | (7,330,778 | ) | (5,477,363 | ) | ||||
Class R6 | (2,864,489 | ) | (2,482,546 | ) | ||||
|
|
|
| |||||
| (15,793,956 | ) | (12,642,188 | ) | |||||
|
|
|
| |||||
Fund share transactions (Net of share conversions) | ||||||||
Net proceeds from shares sold | 138,535,893 | 336,202,472 | ||||||
Net asset value of shares issued in reinvestment of dividends and distributions | 14,733,326 | 11,768,728 | ||||||
Cost of shares purchased | (338,190,696 | ) | (209,127,641 | ) | ||||
|
|
|
| |||||
Net increase (decrease) in net assets from Fund share transactions | (184,921,477 | ) | 138,843,559 | |||||
|
|
|
| |||||
Total increase (decrease) | (195,562,374 | ) | 74,499,189 | |||||
Net Assets: | ||||||||
Beginning of year | 529,836,753 | 455,337,564 | ||||||
|
|
|
| |||||
End of year | $ | 334,274,379 | $ | 529,836,753 | ||||
|
|
|
| |||||
See Notes to Financial Statements.
PGIM Government Income Fund | 33 |
Financial Highlights
| Class A Shares | ||||||||||||||||||||
Year Ended February 28/29, | ||||||||||||||||||||
| 2024 | 2023 | 2022 | 2021 | 2020 | ||||||||||||||||
| Per Share Operating Performance(a): | ||||||||||||||||||||
| Net Asset Value, Beginning of Year | $7.90 | $9.08 | $9.86 | $10.01 | $9.33 | |||||||||||||||
| Income (loss) from investment operations: | ||||||||||||||||||||
| Net investment income (loss) | 0.22 | 0.15 | 0.07 | 0.06 | 0.16 | |||||||||||||||
| Net realized and unrealized gain (loss) on investment and foreign currency transactions | (0.07 | ) | (1.14 | ) | (0.53 | ) | (0.05 | ) | 0.72 | |||||||||||
| Total from investment operations | 0.15 | (0.99 | ) | (0.46 | ) | 0.01 | 0.88 | |||||||||||||
| Less Dividends and Distributions: | ||||||||||||||||||||
| Dividends from net investment income | (0.25 | ) | (0.19 | ) | (0.16 | ) | (0.16 | ) | (0.20 | ) | ||||||||||
| Distributions from net realized gains | - | - | (0.16 | ) | - | - | ||||||||||||||
| Total dividends and distributions | (0.25 | ) | (0.19 | ) | (0.32 | ) | (0.16 | ) | (0.20 | ) | ||||||||||
| Net asset value, end of year | $7.80 | $7.90 | $9.08 | $9.86 | $10.01 | |||||||||||||||
| Total Return(b): | 1.88 | % | (10.90 | )% | (4.72 | )% | 0.08 | % | 9.48 | % | ||||||||||
| Ratios/Supplemental Data: | ||||||||||||||||||||
| Net assets, end of year (000) | $146,542 | $185,497 | $217,848 | $268,126 | $258,869 | |||||||||||||||
| Average net assets (000) | $170,802 | $188,326 | $244,663 | $357,068 | $255,449 | |||||||||||||||
| Ratios to average net assets(c): | ||||||||||||||||||||
| Expenses after waivers and/or expense reimbursement | 1.06 | % | 1.08 | % | 0.98 | % | 0.95 | % | 1.05 | % | ||||||||||
| Expenses before waivers and/or expense reimbursement | 1.11 | % | 1.13 | % | 1.02 | % | 1.00 | % | 1.05 | % | ||||||||||
| Net investment income (loss) | 2.87 | % | 1.84 | % | 0.74 | % | 0.56 | % | 1.67 | % | ||||||||||
| Portfolio turnover rate(d)(e) | 111 | % | 197 | % | 143 | % | 232 | % | 119 | % | ||||||||||
| (a) | Calculated based on average shares outstanding during the year. |
| (b) | Total return does not consider the effects of sales loads. Total return is calculated assuming a purchase of a share on the first day and a sale on the last day of each year reported and includes reinvestment of dividends and distributions, if any. Total returns may reflect adjustments to conform to GAAP. |
| (c) | Does not include expenses of the underlying funds in which the Fund invests. |
| (d) | The Fund accounts for mortgage dollar roll transactions, when applicable, as purchases and sales which, as a result, can increase its portfolio turnover rate. |
| (e) | The Fund’s portfolio turnover rate is calculated in accordance with regulatory requirements, without regard to transactions involving short-term investments, certain derivatives and in-kind transactions (if any). If such transactions were included, the Fund’s portfolio turnover rate may be higher. |
See Notes to Financial Statements.
| 34 |
| Class C Shares | ||||||||||||||||||||
| Year Ended February 28/29, | ||||||||||||||||||||
| 2024 | 2023 | 2022 | 2021 | 2020 | ||||||||||||||||
| Per Share Operating Performance(a): | ||||||||||||||||||||
| Net Asset Value, Beginning of Year | $7.92 | $9.10 | $9.88 | $10.04 | $9.35 | |||||||||||||||
| Income (loss) from investment operations: | ||||||||||||||||||||
| Net investment income (loss) | 0.16 | 0.06 | (0.01 | )(b) | (0.02 | )(b) | 0.08 | |||||||||||||
| Net realized and unrealized gain (loss) on investment and foreign currency transactions | (0.08 | ) | (1.13 | ) | (0.53 | ) | (0.05 | ) | 0.73 | |||||||||||
| Total from investment operations | 0.08 | (1.07 | ) | (0.54 | ) | (0.07 | ) | 0.81 | ||||||||||||
| Less Dividends and Distributions: | ||||||||||||||||||||
| Dividends from net investment income | (0.18 | ) | (0.11 | ) | (0.08 | ) | (0.09 | ) | (0.12 | ) | ||||||||||
| Distributions from net realized gains | - | - | (0.16 | ) | - | - | ||||||||||||||
| Total dividends and distributions | (0.18 | ) | (0.11 | ) | (0.24 | ) | (0.09 | ) | (0.12 | ) | ||||||||||
| Net asset value, end of year | $7.82 | $7.92 | $9.10 | $9.88 | $10.04 | |||||||||||||||
| Total Return(c): | 0.97 | % | (11.79 | )% | (5.50 | )% | (0.75 | )% | 8.67 | % | ||||||||||
| Ratios/Supplemental Data: | ||||||||||||||||||||
| Net assets, end of year (000) | $3,622 | $3,554 | $6,098 | $12,166 | $7,768 | |||||||||||||||
| Average net assets (000) | $3,805 | $4,311 | $8,379 | $13,921 | $7,755 | |||||||||||||||
| Ratios to average net assets(d): | ||||||||||||||||||||
| Expenses after waivers and/or expense reimbursement | 1.95 | % | 2.11 | % | 1.81 | % | 1.69 | % | 1.88 | % | ||||||||||
| Expenses before waivers and/or expense reimbursement | 2.00 | % | 2.16 | % | 1.85 | % | 1.74 | % | 1.88 | % | ||||||||||
| Net investment income (loss) | 1.98 | % | 0.78 | % | (0.09 | )% | (0.20 | )% | 0.85 | % | ||||||||||
| Portfolio turnover rate(e)(f) | 111 | % | 197 | % | 143 | % | 232 | % | 119 | % | ||||||||||
| (a) | Calculated based on average shares outstanding during the year. |
| (b) | The per share amount of net investment income (loss) does not directly correlate to the amounts reported in the Statement of Operations due to class specific expenses. |
| (c) | Total return does not consider the effects of sales loads. Total return is calculated assuming a purchase of a share on the first day and a sale on the last day of each year reported and includes reinvestment of dividends and distributions, if any. Total returns may reflect adjustments to conform to GAAP. |
| (d) | Does not include expenses of the underlying funds in which the Fund invests. |
| (e) | The Fund accounts for mortgage dollar roll transactions, when applicable, as purchases and sales which, as a result, can increase its portfolio turnover rate. |
| (f) | The Fund’s portfolio turnover rate is calculated in accordance with regulatory requirements, without regard to transactions involving short-term investments, certain derivatives and in-kind transactions (if any). If such transactions were included, the Fund’s portfolio turnover rate may be higher. |
See Notes to Financial Statements.
PGIM Government Income Fund | 35 |
Financial Highlights (continued)
| Class R Shares | ||||||||||||||||||||
| Year Ended February 28/29, | ||||||||||||||||||||
| 2024 | 2023 | 2022 | 2021 | 2020 | ||||||||||||||||
| Per Share Operating Performance(a): | ||||||||||||||||||||
| Net Asset Value, Beginning of Year | $7.91 | $9.09 | $9.87 | $10.03 | $9.34 | |||||||||||||||
| Income (loss) from investment operations: | ||||||||||||||||||||
| Net investment income (loss) | 0.21 | 0.13 | 0.04 | 0.03 | 0.13 | |||||||||||||||
| Net realized and unrealized gain (loss) on investment and foreign currency transactions | (0.07 | ) | (1.14 | ) | (0.52 | ) | (0.06 | ) | 0.73 | |||||||||||
| Total from investment operations | 0.14 | (1.01 | ) | (0.48 | ) | (0.03 | ) | 0.86 | ||||||||||||
| Less Dividends and Distributions: | ||||||||||||||||||||
| Dividends from net investment income | (0.23 | ) | (0.17 | ) | (0.14 | ) | (0.13 | ) | (0.17 | ) | ||||||||||
| Distributions from net realized gains | - | - | (0.16 | ) | - | - | ||||||||||||||
| Total dividends and distributions | (0.23 | ) | (0.17 | ) | (0.30 | ) | (0.13 | ) | (0.17 | ) | ||||||||||
| Net asset value, end of year | $7.82 | $7.91 | $9.09 | $9.87 | $10.03 | |||||||||||||||
| Total Return(b): | 1.80 | % | (11.12 | )% | (5.01 | )% | (0.30 | )% | 9.26 | % | ||||||||||
| Ratios/Supplemental Data: | ||||||||||||||||||||
| Net assets, end of year (000) | $6,504 | $6,586 | $8,465 | $11,915 | $11,346 | |||||||||||||||
| Average net assets (000) | $6,416 | $7,218 | $10,282 | $12,173 | $11,439 | |||||||||||||||
| Ratios to average net assets(c): | ||||||||||||||||||||
| Expenses after waivers and/or expense reimbursement | 1.25 | % | 1.35 | % | 1.28 | % | 1.24 | % | 1.35 | % | ||||||||||
| Expenses before waivers and/or expense reimbursement | 1.55 | % | 1.65 | % | 1.57 | % | 1.54 | % | 1.60 | % | ||||||||||
| Net investment income (loss) | 2.68 | % | 1.56 | % | 0.44 | % | 0.29 | % | 1.38 | % | ||||||||||
| Portfolio turnover rate(d)(e) | 111 | % | 197 | % | 143 | % | 232 | % | 119 | % | ||||||||||
| (a) | Calculated based on average shares outstanding during the year. |
| (b) | Total return is calculated assuming a purchase of a share on the first day and a sale on the last day of each year reported and includes reinvestment of dividends and distributions, if any. Total returns may reflect adjustments to conform to GAAP. |
| (c) | Does not include expenses of the underlying funds in which the Fund invests. |
| (d) | The Fund accounts for mortgage dollar roll transactions, when applicable, as purchases and sales which, as a result, can increase its portfolio turnover rate. |
| (e) | The Fund’s portfolio turnover rate is calculated in accordance with regulatory requirements, without regard to transactions involving short-term investments, certain derivatives and in-kind transactions (if any). If such transactions were included, the Fund’s portfolio turnover rate may be higher. |
See Notes to Financial Statements.
| 36 |
| Class Z Shares | ||||||||||||||||||||
| Year Ended February 28/29, | ||||||||||||||||||||
| 2024 | 2023 | 2022 | 2021 | 2020 | ||||||||||||||||
| Per Share Operating Performance(a): | ||||||||||||||||||||
| Net Asset Value, Beginning of Year | $7.89 | $9.06 | $9.84 | $9.99 | $9.31 | |||||||||||||||
| Income (loss) from investment operations: | ||||||||||||||||||||
| Net investment income (loss) | 0.27 | 0.21 | 0.12 | 0.10 | 0.20 | |||||||||||||||
| Net realized and unrealized gain (loss) on investment and foreign currency transactions | (0.08 | ) | (1.14 | ) | (0.53 | ) | (0.04 | ) | 0.71 | |||||||||||
| Total from investment operations | 0.19 | (0.93 | ) | (0.41 | ) | 0.06 | 0.91 | |||||||||||||
| Less Dividends and Distributions: | ||||||||||||||||||||
| Dividends from net investment income | (0.29 | ) | (0.24 | ) | (0.21 | ) | (0.21 | ) | (0.23 | ) | ||||||||||
| Distributions from net realized gains | - | - | (0.16 | ) | - | - | ||||||||||||||
| Total dividends and distributions | (0.29 | ) | (0.24 | ) | (0.37 | ) | (0.21 | ) | (0.23 | ) | ||||||||||
| Net asset value, end of year | $7.79 | $7.89 | $9.06 | $9.84 | $9.99 | |||||||||||||||
| Total Return(b): | 2.45 | % | (10.27 | )% | (4.26 | )% | 0.55 | % | 9.93 | % | ||||||||||
| Ratios/Supplemental Data: | ||||||||||||||||||||
| Net assets, end of year (000) | $112,247 | $250,587 | $128,655 | $233,898 | $98,625 | |||||||||||||||
| Average net assets (000) | $199,984 | $179,454 | $163,472 | $272,278 | $82,582 | |||||||||||||||
| Ratios to average net assets(c): | ||||||||||||||||||||
| Expenses after waivers and/or expense reimbursement | 0.48 | % | 0.48 | % | 0.48 | % | 0.48 | % | 0.65 | % | ||||||||||
| Expenses before waivers and/or expense reimbursement | 0.66 | % | 0.64 | % | 0.61 | % | 0.66 | % | 0.72 | % | ||||||||||
| Net investment income (loss) | 3.42 | % | 2.53 | % | 1.23 | % | 1.00 | % | 2.06 | % | ||||||||||
| Portfolio turnover rate(d)(e) | 111 | % | 197 | % | 143 | % | 232 | % | 119 | % | ||||||||||
| (a) | Calculated based on average shares outstanding during the year. |
| (b) | Total return is calculated assuming a purchase of a share on the first day and a sale on the last day of each year reported and includes reinvestment of dividends and distributions, if any. Total returns may reflect adjustments to conform to GAAP. |
| (c) | Does not include expenses of the underlying funds in which the Fund invests. |
| (d) | The Fund accounts for mortgage dollar roll transactions, when applicable, as purchases and sales which, as a result, can increase its portfolio turnover rate. |
| (e) | The Fund’s portfolio turnover rate is calculated in accordance with regulatory requirements, without regard to transactions involving short-term investments, certain derivatives and in-kind transactions (if any). If such transactions were included, the Fund’s portfolio turnover rate may be higher. |
See Notes to Financial Statements.
PGIM Government Income Fund | 37 |
Financial Highlights (continued)
| Class R6 Shares | ||||||||||||||||||||
| Year Ended February 28/29, | ||||||||||||||||||||
| 2024 | 2023 | 2022 | 2021 | 2020 | ||||||||||||||||
| Per Share Operating Performance(a): | ||||||||||||||||||||
| Net Asset Value, Beginning of Year | $7.88 | $9.05 | $9.83 | $9.98 | $9.30 | |||||||||||||||
| Income (loss) from investment operations: | ||||||||||||||||||||
| Net investment income (loss) | 0.27 | 0.20 | 0.12 | 0.10 | 0.21 | |||||||||||||||
| Net realized and unrealized gain (loss) on investment and foreign currency transactions | (0.08 | ) | (1.13 | ) | (0.53 | ) | (0.04 | ) | 0.71 | |||||||||||
| Total from investment operations | 0.19 | (0.93 | ) | (0.41 | ) | 0.06 | 0.92 | |||||||||||||
| Less Dividends and Distributions: | ||||||||||||||||||||
| Dividends from net investment income | (0.29 | ) | (0.24 | ) | (0.21 | ) | (0.21 | ) | (0.24 | ) | ||||||||||
| Distributions from net realized gains | - | - | (0.16 | ) | - | - | ||||||||||||||
| Total dividends and distributions | (0.29 | ) | (0.24 | ) | (0.37 | ) | (0.21 | ) | (0.24 | ) | ||||||||||
| Net asset value, end of year | $7.78 | $7.88 | $9.05 | $9.83 | $9.98 | |||||||||||||||
| Total Return(b): | 2.46 | % | (10.28 | )% | (4.26 | )% | 0.46 | % | 10.14 | % | ||||||||||
| Ratios/Supplemental Data: | ||||||||||||||||||||
| Net assets, end of year (000) | $65,360 | $83,613 | $94,271 | $113,817 | $70,584 | |||||||||||||||
| Average net assets (000) | $77,396 | $82,904 | $106,410 | $103,539 | $59,164 | |||||||||||||||
| Ratios to average net assets(c): | ||||||||||||||||||||
| Expenses after waivers and/or expense reimbursement | 0.47 | % | 0.47 | % | 0.47 | % | 0.47 | % | 0.57 | % | ||||||||||
| Expenses before waivers and/or expense reimbursement | 0.55 | % | 0.56 | % | 0.54 | % | 0.54 | % | 0.59 | % | ||||||||||
| Net investment income (loss) | 3.45 | % | 2.45 | % | 1.25 | % | 1.02 | % | 2.14 | % | ||||||||||
| Portfolio turnover rate(d)(e) | 111 | % | 197 | % | 143 | % | 232 | % | 119 | % | ||||||||||
| (a) | Calculated based on average shares outstanding during the year. |
| (b) | Total return is calculated assuming a purchase of a share on the first day and a sale on the last day of each year reported and includes reinvestment of dividends and distributions, if any. Total returns may reflect adjustments to conform to GAAP. |
| (c) | Does not include expenses of the underlying funds in which the Fund invests. |
| (d) | The Fund accounts for mortgage dollar roll transactions, when applicable, as purchases and sales which, as a result, can increase its portfolio turnover rate. |
| (e) | The Fund’s portfolio turnover rate is calculated in accordance with regulatory requirements, without regard to transactions involving short-term investments, certain derivatives and in-kind transactions (if any). If such transactions were included, the Fund’s portfolio turnover rate may be higher. |
See Notes to Financial Statements.
| 38 |
Notes to Financial Statements
| 1. | Organization |
Prudential Investment Portfolios, Inc. 14 (the “Registered Investment Company” or “RIC”) is registered under the Investment Company Act of 1940, as amended (“1940 Act”), as an open-end management investment company. The RIC is organized as a Maryland Corporation. These financial statements relate only to the PGIM Government Income Fund (the “Fund’), a series of the RIC. The Fund is classified as a diversified fund for purposes of the 1940 Act.
The investment objective of the Fund is to seek high current return.
| 2. | Accounting Policies |
The Fund follows the investment company accounting and reporting guidance of the Financial Accounting Standards Board (“FASB”) Accounting Standard Codification (“ASC”) Topic 946 Financial Services — Investment Companies. The following is a summary of significant accounting policies followed by the Fund in the preparation of its financial statements. The policies conform to U.S. generally accepted accounting principles (“GAAP”). The Fund consistently follows such policies in the preparation of its financial statements.
Securities Valuation: The Fund holds securities and other assets and liabilities that are fair valued as of the close of each day (generally, 4:00 PM Eastern time) the New York Stock Exchange (“NYSE”) is open for trading. As described in further detail below, the Fund’s investments are valued daily based on a number of factors, including the type of investment and whether market quotations are readily available. The RIC’s Board of Directors (the “Board”) has approved the Fund’s valuation policies and procedures for security valuation and designated PGIM Investments LLC (“PGIM Investments” or the “Manager”) as the “Valuation Designee,” as defined by Rule 2a-5(b) under the 1940 Act, to perform the fair value determination relating to all Fund investments. Pursuant to the Board’s oversight, the Valuation Designee has established a Valuation Committee to perform the duties and responsibilities as Valuation Designee under Rule 2a-5. The valuation procedures permit the Fund to utilize independent pricing vendor services, quotations from market makers, and alternative valuation methods when market quotations are either not readily available or not deemed representative of fair value. Fair value is the estimated price that would be received to sell an asset or paid to transfer a liability in an orderly transaction between market participants on the measurement date.
For the fiscal reporting year-end, securities and other assets and liabilities were fair valued at the close of the last U.S. business day. Trading in certain foreign securities may occur when the NYSE is closed (including weekends and holidays). Because such foreign securities
PGIM Government Income Fund | 39 |
Notes to Financial Statements (continued)
trade in markets that are open on weekends and U.S. holidays, the values of some of the Fund’s foreign investments may change on days when investors cannot purchase or redeem Fund shares.
Various inputs determine how the Fund’s investments are valued, all of which are categorized according to the three broad levels (Level 1, 2, or 3) detailed in the Schedule of Investments and referred to herein as the “fair value hierarchy” in accordance with FASB ASC Topic 820 Fair Value Measurement.
Common or preferred stocks, exchange-traded funds (“ETFs”) and derivative instruments, if applicable, that are traded on a national securities exchange are valued at the last sale price as of the close of trading on the applicable exchange where the security principally trades. Securities traded via NASDAQ are valued at the NASDAQ official closing price. To the extent these securities are valued at the last sale price or NASDAQ official closing price, they are classified as Level 1 in the fair value hierarchy. In the event that no sale or official closing price on a valuation date exists, these securities are generally valued at the mean between the last reported bid and ask prices, or at the last bid price in the absence of an ask price. These securities are classified as Level 2 in the fair value hierarchy.
Investments in open-end funds (other than ETFs) are valued at their net asset values as of the close of the NYSE on the date of valuation. These securities are classified as Level 1 in the fair value hierarchy since they may be purchased or sold at their net asset values on the date of valuation.
Fixed income securities traded in the OTC market are generally classified as Level 2 in the fair value hierarchy. Such fixed income securities are typically valued using the market approach which generally involves obtaining data from an approved independent third-party vendor source. The Fund utilizes the market approach as the primary method to value securities when market prices of identical or comparable instruments are available. The third-party vendors’ valuation techniques used to derive the evaluated bid price are based on evaluating observable inputs, including but not limited to, yield curves, yield spreads, credit ratings, deal terms, tranche level attributes, default rates, cash flows, prepayment speeds, broker/dealer quotations and reported trades. Certain Level 3 securities are also valued using the market approach when obtaining a single broker quote or when utilizing transaction prices for identical securities that have been used in excess of five business days. During the reporting period, there were no changes to report with respect to the valuation approach and/or valuation techniques discussed above.
OTC and centrally cleared derivative instruments are generally classified as Level 2 in the fair value hierarchy. Such derivative instruments are typically valued using the market approach and/or income approach which generally involves obtaining data from an
| 40 |
approved independent third-party vendor source. The Fund utilizes the market approach when quoted prices in broker-dealer markets are available but also includes consideration of alternative valuation approaches, including the income approach. In the absence of reliable market quotations, the income approach is typically utilized for purposes of valuing derivatives such as interest rate swaps based on a discounted cash flow analysis whereby the value of the instrument is equal to the present value of its future cash inflows or outflows. Such analysis includes projecting future cash flows and determining the discount rate (including the present value factors that affect the discount rate) used to discount the future cash flows. In addition, the third-party vendors’ valuation techniques used to derive the evaluated derivative price is based on evaluating observable inputs, including but not limited to, underlying asset prices, indices, spreads, interest rates and exchange rates. Certain derivatives may be classified as Level 3 when valued using the market approach by obtaining a single broker quote or when utilizing unobservable inputs in the income approach. During the reporting period, there were no changes to report with respect to the valuation approach and/or valuation techniques discussed above.
Securities and other assets that cannot be priced according to the methods described above are valued based on policies and procedures approved by the Board. In the event that unobservable inputs are used when determining such valuations, the securities will be classified as Level 3 in the fair value hierarchy. Altering one or more unobservable inputs may result in a significant change to a Level 3 security’s fair value measurement.
When determining the fair value of securities, some of the factors influencing the valuation include: the nature of any restrictions on disposition of the securities; assessment of the general liquidity of the securities; the issuer’s financial condition and the markets in which it does business; the cost of the investment; the size of the holding and the capitalization of the issuer; the prices of any recent transactions or bids/offers for such securities or any comparable securities; and any available analyst media or other reports or information deemed reliable by the Valuation Designee regarding the issuer or the markets or industry in which it operates. Using fair value to price securities may result in a value that is different from a security’s most recent closing price and from the price used by other unaffiliated mutual funds to calculate their net asset values.
Options: The Fund purchased and/or wrote options in order to hedge against adverse market movements or fluctuations in value caused by changes in prevailing interest rates, value of equities or foreign currency exchange rates with respect to securities or financial instruments which the Fund currently owns or intends to purchase. The Fund may also use options to gain additional market exposure. The Fund’s principal reason for writing options is to realize, through receipt of premiums, a greater current return than would be realized on the underlying security alone. When the Fund purchases an option, it pays a premium and an amount equal to that premium is recorded as an asset. When the Fund writes an option, it receives a premium and an amount equal to that premium is recorded as a liability. The asset or liability is adjusted daily to reflect the current market value of the option. If an option expires unexercised, the Fund realizes a gain (loss) to the extent of the premium received or paid. If an option is exercised, the premium received or paid is recorded as an adjustment to
PGIM Government Income Fund | 41 |
Notes to Financial Statements (continued)
the proceeds from the sale or the cost of the purchase in determining whether the Fund has realized a gain (loss). The difference between the premium and the amount received or paid at the closing of a purchase or sale transaction is also treated as a realized gain (loss). Gain (loss) on purchased options is included in net realized gain (loss) on investment transactions. Gain (loss) on written options is presented separately as net realized gain (loss) on options written transactions.
The Fund, as writer of an option, may have no control over whether the underlying securities or financial instruments may be sold (called) or purchased (put). As a result, the Fund bears the market risk of an unfavorable change in the price of the security or financial instrument underlying the written option. The Fund, as purchaser of an OTC option, bears the risk of the potential inability of the counterparties to meet the terms of their contracts. With exchange-traded options contracts, there is minimal counterparty credit risk to the Fund since the exchanges’ clearinghouse acts as counterparty to all exchange-traded options and guarantees the options contracts against default.
When the Fund writes an option on a swap, an amount equal to any premium received by the Fund is recorded as a liability and is subsequently adjusted to the current market value of the written option on the swap. If a call option on a swap is exercised, the Fund becomes obligated to pay a fixed interest rate (noted as the strike price) and receive a variable interest rate on a notional amount. If a put option on a swap is exercised, the Fund becomes obligated to pay a variable interest rate and receive a fixed interest rate (noted as the strike price) on a notional amount. Premiums received from writing options on swaps that expire or are exercised are treated as realized gains upon the expiration or exercise of such options on swaps. The risk associated with writing put and call options on swaps is that the Fund will be obligated to be party to a swap agreement if an option on a swap is exercised.
Financial Futures Contracts: A financial futures contract is an agreement to purchase (long) or sell (short) an agreed amount of securities at a set price for delivery on a future date. Upon entering into a financial futures contract, the Fund is required to pledge to the broker an amount of cash and/or other assets equal to a certain percentage of the contract amount. This amount is known as the “initial margin.” Subsequent payments, known as “variation margin,” are made or received by the Fund each day, depending on the daily fluctuations in the value of the underlying security. Such variation margin is recorded for financial statement purposes on a daily basis as unrealized gain (loss). When the contract expires or is closed, the gain (loss) is realized and is presented in the Statement of Operations as net realized gain (loss) on futures transactions.
The Fund invested in financial futures contracts in order to hedge its existing portfolio securities, or securities the Fund intends to purchase, against fluctuations in value caused by changes in prevailing interest rates. Should interest rates move unexpectedly, the Fund
| 42 |
may not achieve the anticipated benefits of the financial futures contracts and may realize a loss. The use of futures transactions involves the risk of imperfect correlation in movements in the price of futures contracts, interest rates and the underlying hedged assets. Since futures contracts are exchange-traded, there is minimal counterparty credit risk to the Fund since the exchanges’ clearinghouse acts as counterparty to all exchange-traded futures and guarantees the futures contracts against default.
Swap Agreements: The Fund entered into certain types of swap agreements detailed in the disclosures below. A swap agreement is an agreement to exchange the return generated by one instrument for the return generated by another instrument. Swap agreements are negotiated in the OTC market and may be executed either directly with a counterparty (“OTC-traded”) or through a central clearing facility, such as a registered exchange. Swap agreements are valued daily at current market value and any change in value is included in the net unrealized appreciation or depreciation on swap agreements. Centrally cleared swaps pay or receive an amount known as “variation margin”, based on daily changes in the valuation of the swap contract. For OTC-traded, upfront premiums paid and received are shown as swap premiums paid and swap premiums received in the Statement of Assets and Liabilities. Risk of loss may exceed amounts recognized on the Statement of Assets and Liabilities. Swap agreements outstanding at period end, if any, are listed on the Schedule of Investments.
Interest Rate Swaps: Interest rate swaps represent an agreement between counterparties to exchange cash flows based on the difference between two interest rates, applied to a notional principal amount for a specified period. The Fund is subject to interest rate risk exposure in the normal course of pursuing its investment objective. The Fund used interest rate swaps to maintain its ability to generate steady cash flow by receiving a stream of fixed rate payments or to increase exposure to prevailing market rates by receiving floating rate payments. The Fund’s maximum risk of loss from counterparty credit risk is the discounted net present value of the cash flows to be received from the counterparty over the contract’s remaining life.
Total Return Swaps: In a total return swap, one party receives payments based on the market value of the security or the commodity involved, or total return of a specific referenced asset, such as an equity, index or bond, and in return pays a defined amount. The Fund is subject to risk exposures associated with the referenced asset in the normal course of pursuing its investment objectives. The Fund entered into total return swaps to manage its exposure to a security or an index. The Fund’s maximum risk of loss from counterparty credit risk is the change in the value of the security, in the Fund’s favor, from the point of entering into the contract.
Delayed-Delivery Transactions: The Fund purchased or sold securities on a when-issued or delayed-delivery and forward commitment basis, including TBA securities. These transactions involve a commitment by the Fund to purchase or sell securities for a predetermined price or yield, with payment and delivery taking place beyond the customary settlement period. When delayed-delivery purchases are outstanding, the Fund will set aside
PGIM Government Income Fund | 43 |
Notes to Financial Statements (continued)
and maintain an amount of liquid assets sufficient to meet the purchase price in a segregated account until the settlement date. When purchasing a security on a delayed-delivery basis, the Fund assumes the rights and risks of ownership of the security, including the risk of price and yield fluctuations, and takes such fluctuations into account when determining its net asset value. The Fund may dispose of or renegotiate a delayed-delivery transaction subsequent to establishment, and may sell when-issued securities before they are delivered, which may result in a realized gain (loss). When selling a security on a delayed-delivery basis, the Fund forfeits its eligibility to realize future gains (losses) with respect to the security.
Mortgage Dollar Rolls: The Fund entered into mortgage dollar rolls in which the Fund sells mortgage securities for delivery in the current month, realizing a gain (loss), and simultaneously enter into contracts to repurchase somewhat similar (same type, coupon and maturity) securities on a specified future date. During the roll period, the Fund forgoes principal and interest paid on the securities. The Fund is compensated by the interest earned on the cash proceeds of the initial sale and by the lower repurchase price at the future date. The difference between the sale proceeds and the lower repurchase price is recorded as a realized gain on investment transactions. The Fund maintains a segregated account, the dollar value of which is at least equal to its obligations, with respect to dollar rolls. The Fund is subject to the risk that the market value of the securities the Fund is obligated to repurchase under the agreement may decline below the repurchase price.
Securities Transactions and Net Investment Income: Securities transactions are recorded on the trade date. Realized gains (losses) from investment and currency transactions are calculated on the specific identification method. Dividend income is recorded on the ex-date, or for certain foreign securities, when the Fund becomes aware of such dividends. Interest income, including amortization of premium and accretion of discount on debt securities, as required, is recorded on the accrual basis. Expenses are recorded on an accrual basis, which may require the use of certain estimates by management that may differ from actual expense amounts. Net investment income or loss (other than class specific expenses and waivers, which are allocated as noted below) and unrealized and realized gains (losses) are allocated daily to each class of shares based upon the relative proportion of adjusted net assets of each class at the beginning of the day. Class specific expenses and waivers, where applicable, are charged to the respective share classes. Such class specific expenses and waivers include distribution fees and distribution fee waivers, shareholder servicing fees, transfer agent’s fees and expenses, registration fees and fee waivers and/or expense reimbursements, as applicable.
Taxes: It is the Fund’s policy to continue to meet the requirements of the Internal Revenue Code applicable to regulated investment companies and to distribute all of its taxable net investment income and capital gains, if any, to its shareholders. Therefore, no federal
| 44 |
income tax provision is required. Withholding taxes on foreign dividends, interest and capital gains, if any, are recorded, net of reclaimable amounts, at the time the related income is earned.
Dividends and Distributions: Dividends and distributions to shareholders, which are determined in accordance with federal income tax regulations and which may differ from GAAP, are recorded on the ex-date. Permanent book/tax differences relating to income and gain (loss) are reclassified between total distributable earnings (loss) and paid-in capital in excess of par, as appropriate. The chart below sets forth the expected frequency of dividend and capital gains distributions to shareholders. Various factors may impact the frequency of dividend distributions to shareholders, including but not limited to adverse market conditions or portfolio holding-specific events.
Expected Distribution Schedule to Shareholders*
| Frequency
| |||
Net Investment Income | Monthly | |||
Short-Term Capital Gains | Annually | |||
Long-Term Capital Gains | Annually | |||
| * | Under certain circumstances, the Fund may make more than one distribution of short-term and/or long-term capital gains during a fiscal year. |
Estimates: The preparation of financial statements requires management to make estimates and assumptions that affect the reported amounts and disclosures in the financial statements. Actual results could differ from those estimates.
3. Agreements
The RIC, on behalf of the Fund, has a management agreement with the Manager pursuant to which it has responsibility for all investment advisory services, including supervision of the subadviser’s performance of such services, and for rendering administrative services.
The Manager has entered into a subadvisory agreement with PGIM, Inc. (the “subadviser”), which provides subadvisory services to the Fund through its business unit PGIM Fixed Income. The Manager pays for the services of PGIM, Inc.
Fees payable under the management agreement are computed daily and paid monthly. For the reporting period ended February 29, 2024, the contractual and effective management fee rates were as follows:
Contractual Management Rate
| Effective Management Fee, before any waivers
| |
0.470% of average daily net assets up to $1 billion; | 0.47% | |
0.420% of average daily net assets from $1 billion to $2 billion; | ||
0.320% of average daily net assets from $2 billion to $3 billion; | ||
0.270% of average daily net assets over $3 billion. |
PGIM Government Income Fund | 45 |
Notes to Financial Statements (continued)
The Manager has contractually agreed, through June 30, 2025, to limit total annual operating expenses after fee waivers and/or expense reimbursements. This contractual waiver excludes interest, brokerage, taxes (such as income and foreign withholding taxes, stamp duty and deferred tax expenses), acquired fund fees and expenses, extraordinary expenses, and certain other Fund expenses such as dividend and interest expense and broker charges on short sales.
Where applicable, the Manager agrees to waive management fees or shared operating expenses on any share class to the same extent that it waives such expenses on any other share class. In addition, total annual operating expenses for Class R6 shares will not exceed total annual operating expenses for Class Z shares. Fees and/or expenses waived and/or reimbursed by the Manager for the purpose of preventing the expenses from exceeding a certain expense ratio limit may be recouped by the Manager within the same fiscal year during which such waiver and/or reimbursement is made if such recoupment can be realized without exceeding the expense limit in effect at the time of the recoupment for that fiscal year. The expense limitations attributable to each class are as follows:
| Class | Expense Limitations | ||||
A | —% | ||||
C | — | ||||
R | — | ||||
Z | 0.48 | ||||
R6 | 0.47 | ||||
The RIC, on behalf of the Fund, has a distribution agreement with Prudential Investment Management Services LLC (“PIMS”), which acts as the distributor of the Class A, Class C, Class R, Class Z and Class R6 shares of the Fund. The Fund compensates PIMS for distributing and servicing the Fund’s Class A, Class C and Class R shares, pursuant to the plans of distribution (the “Distribution Plans”), regardless of expenses actually incurred by PIMS.
Pursuant to the Distribution Plans, the Fund compensates PIMS for distribution related activities at an annual rate based on average daily net assets per class. PIMS has contractually agreed through June 30, 2025 to limit such fees on certain classes based on the average daily net assets. The distribution fees are accrued daily and payable monthly.
The Fund’s annual gross and net distribution rates, where applicable, are as follows:
| Class | Gross Distribution Fee | Net Distribution Fee | ||||||||
A | 0.25 | % | 0.25 | % | ||||||
C | 1.00 | 1.00 | ||||||||
R | 0.75 | 0.50 | ||||||||
| 46 |
| Class | Gross Distribution Fee | Net Distribution Fee | ||||||||
Z | N/A | % | N/A | % | ||||||
R6 | N/A | N/A | ||||||||
For the year ended February 29, 2024, PIMS received front-end sales charges (“FESL”) resulting from sales of certain class shares and contingent deferred sales charges (“CDSC”) imposed upon redemptions by certain shareholders. From these fees, PIMS paid such sales charges to broker-dealers, who in turn paid commissions to salespersons and incurred other distribution costs. The sales charges are as follows where applicable:
| Class | FESL | CDSC | ||||||
A | $ | 36,671 | $ | — | ||||
C | —272 | |||||||
PGIM Investments, PGIM, Inc. and PIMS are indirect, wholly-owned subsidiaries of Prudential Financial, Inc. (“Prudential”).
4. Other Transactions with Affiliates
Prudential Mutual Fund Services LLC (“PMFS”), an affiliate of PGIM Investments and an indirect, wholly-owned subsidiary of Prudential, serves as the Fund’s transfer agent and shareholder servicing agent. Transfer agent’s fees and expenses in the Statement of Operations include certain out-of-pocket expenses paid to non-affiliates, where applicable.
The Fund may invest its overnight sweep cash in the PGIM Core Government Money Market Fund (the “Core Government Fund”), a series of the Prudential Government Money Market Fund, Inc., registered under the 1940 Act and managed by PGIM Investments. PGIM Investments and/or its affiliates are paid fees or reimbursed for providing their services to the Core Government Fund. In addition to the realized and unrealized gains on investments in the Core Government Fund, earnings from such investments are disclosed on the Statement of Operations as “Affiliated dividend income”.
The Fund may enter into certain securities purchase or sale transactions under Board approved Rule 17a-7 procedures. Rule 17a-7 is an exemptive rule under the 1940 Act that, subject to certain conditions, permits purchase and sale transactions among affiliated investment companies, or between an investment company and a person that is affiliated solely by reason of having a common (or affiliated) investment adviser, common directors/trustees, and/or common officers. For the year ended February 29, 2024, no Rule 17a-7 transactions were entered into by the Fund.
PGIM Government Income Fund | 47 |
Notes to Financial Statements (continued)
5. Portfolio Securities
The aggregate cost of purchases and proceeds from sales of portfolio securities (excluding short-term investments and U.S. Government securities) for the reporting period ended February 29, 2024, were as follows:
| Cost of Purchases | Proceeds from Sales | |
$298,497,177 | $355,881,133 |
A summary of the cost of purchases and proceeds from sales of shares of an affiliated mutual fund for the year ended February 29, 2024, is presented as follows:
| Value, Beginning of Year | Cost of Purchases | Proceeds from Sales | Change in Unrealized Gain (Loss) | Realized Gain (Loss) | Value, End of Year | Shares, End of Year | Income | |||||||||||||||||||||
Short-Term Investments - Affiliated Mutual Fund: |
| |||||||||||||||||||||||||||
PGIM Core Government Money Market Fund (7-day effective yield 5.545%)(1)(wb) |
| |||||||||||||||||||||||||||
$— | $201,856,187 | $199,431,052 | $— | $— | $2,425,135 | 2,425,135 | $355,981 | |||||||||||||||||||||
| (1) | The Fund did not have any capital gain distributions during the reporting period. |
| (wb) | Represents an investment in a Fund affiliated with the Manager. |
6. Distributions and Tax Information
Distributions to shareholders, which are determined in accordance with federal income tax regulations and which may differ from GAAP, are recorded on the ex-date.
For the year ended February 29, 2024, the tax character of dividends paid as reflected in the Statement of Changes in Net Assets were as follows:
Ordinary Income
| Long-Term Capital Gains
| Tax Return of Capital
| Total Dividends and Distributions
| |||
$15,793,956 | $— | $— | $15,793,956 |
For the year ended February 28, 2023, the tax character of dividends paid as reflected in the Statement of Changes in Net Assets were as follows:
Ordinary Income
| Long-Term Capital Gains
| Tax Return of Capital
| Total Dividends and Distributions
| |||
$12,642,188 | $— | $— | $12,642,188 |
| 48 |
For the year ended February 29, 2024, the Fund had the following amounts of accumulated undistributed earnings on a tax basis:
Undistributed Ordinary Income | Undistributed Long-Term Capital Gains | |
$118,896 | $— |
The United States federal income tax basis of the Fund’s investments and the net unrealized depreciation as of February 29, 2024 were as follows:
| Tax Basis | Gross Unrealized Appreciation | Gross Unrealized Depreciation | Net Unrealized Depreciation | |||
| $367,662,422 | $2,852,069 | $(50,789,896) | $(47,937,827) |
The difference between GAAP basis and tax basis was primarily attributable to deferred losses on wash sales, the difference in the treatment of premium amortization for GAAP and tax purposes, and futures.
For federal income tax purposes, the Fund had an approximated capital loss carryforward as of February 29, 2024 which can be carried forward for an unlimited period. No capital gains distributions are expected to be paid to shareholders until net gains have been realized in excess of such losses.
Capital Loss Carryforward | Capital Loss Carryforward Utilized | |
$62,063,000 | $— |
The Manager has analyzed the Fund’s tax positions taken on federal, state and local income tax returns for all open tax years and has concluded that no provision for income tax is required in the Fund’s financial statements for the current reporting period. Since tax authorities can examine previously filed tax returns, the Fund’s U.S. federal and state tax returns for each of the four fiscal years up to the most recent fiscal year ended February 29, 2024 are subject to such review.
7. Capital and Ownership
The Fund offers Class A, Class C, Class R, Class Z and Class R6 shares. Class A shares are sold with a maximum front-end sales charge of 3.25%. Investors who purchase $500,000 or more of Class A shares and sell those shares within 12 months of purchase are subject to a CDSC of 1% on sales although these purchases are not subject to a front-end sales charge. The Class A CDSC is waived for certain retirement and/or benefit plans. A special exchange privilege is also available for shareholders who qualified to purchase Class A shares at net asset value. Class C shares are sold with a CDSC of 1% on sales made within 12 months of purchase. Class C shares will automatically convert to Class A shares on a monthly basis approximately eight years (ten years prior to January 22, 2021) after purchase. Class R shares are available to certain retirement plans, clearing and settlement firms. Class R,
PGIM Government Income Fund | 49 |
Notes to Financial Statements (continued)
Class Z and Class R6 shares are not subject to any sales or redemption charges and are available exclusively for sale to a limited group of investors.
Under certain circumstances, an exchange may be made from specified share classes of the Fund to one or more other share classes of the Fund as presented in the table of transactions in shares of common stock, below.
The RIC is authorized to issue 5,750,000,000 shares of common stock, $0.00001 par value per share, 2.5 billon of which are designated as shares of the Fund. The shares are further classified and designated as follows:
| Class | Number of Shares | |||
A | 230,000,000 | |||
B | 5,000,000 | |||
C | 495,000,000 | |||
R | 500,000,000 | |||
Z | 500,000,000 | |||
T | 270,000,000 | |||
R6 | 500,000,000 | |||
The Fund currently does not have any Class B or Class T shares outstanding.
As of February 29, 2024, Prudential, through its affiliated entities, including affiliated funds (if applicable), did not own any shares of the Fund.
At the reporting period end, the number of shareholders holding greater than 5% of the Fund are as follows:
| Number of Shareholders | Percentage of Outstanding Shares | |||
Affiliated | — | —% | ||
Unaffiliated | 5 | 64.9 |
| 50 |
Transactions in shares of common stock were as follows:
| Share Class | Shares | Amount | ||||||
Class A | ||||||||
Year ended February 29, 2024: | ||||||||
Shares sold | 2,092,789 | $ | 16,456,529 | |||||
Shares issued in reinvestment of dividends and distributions | 606,196 | 4,744,361 | ||||||
Shares purchased | (7,366,723 | ) | (56,576,939 | ) | ||||
Net increase (decrease) in shares outstanding before conversion | (4,667,738 | ) | (35,376,049 | ) | ||||
Shares issued upon conversion from other share class(es) | 63,531 | 500,603 | ||||||
Shares purchased upon conversion into other share class(es) | (98,040 | ) | (769,598 | ) | ||||
Net increase (decrease) in shares outstanding | (4,702,247 | ) | $ | (35,645,044 | ) | |||
Year ended February 28, 2023: | ||||||||
Shares sold | 4,272,702 | $ | 34,537,178 | |||||
Shares issued in reinvestment of dividends and distributions | 479,356 | 3,910,638 | ||||||
Shares purchased | (5,244,114 | ) | (43,234,498 | ) | ||||
Net increase (decrease) in shares outstanding before conversion | (492,056 | ) | (4,786,682 | ) | ||||
Shares issued upon conversion from other share class(es) | 71,819 | 598,227 | ||||||
Shares purchased upon conversion into other share class(es) | (100,343 | ) | (813,262 | ) | ||||
Net increase (decrease) in shares outstanding | (520,580 | ) | $ | (5,001,717) | ||||
Class C | ||||||||
Year ended February 29, 2024: | ||||||||
Shares sold | 175,000 | $ | 1,396,842 | |||||
Shares issued in reinvestment of dividends and distributions | 10,580 | 83,011 | ||||||
Shares purchased | (130,478 | ) | (1,027,318 | ) | ||||
Net increase (decrease) in shares outstanding before conversion | 55,102 | 452,535 | ||||||
Shares purchased upon conversion into other share class(es) | (40,986 | ) | (322,915 | ) | ||||
Net increase (decrease) in shares outstanding | 14,116 | $ | 129,620 | |||||
Year ended February 28, 2023: | ||||||||
Shares sold | 67,770 | $ | 548,016 | |||||
Shares issued in reinvestment of dividends and distributions | 6,958 | 57,173 | ||||||
Shares purchased | (252,768 | ) | (2,083,657 | ) | ||||
Net increase (decrease) in shares outstanding before conversion | (178,040 | ) | (1,478,468 | ) | ||||
Shares purchased upon conversion into other share class(es) | (43,340 | ) | (364,700 | ) | ||||
Net increase (decrease) in shares outstanding | (221,380 | ) | $ | (1,843,168) | ||||
Class R | ||||||||
Year ended February 29, 2024: | ||||||||
Shares sold | 126,722 | $ | 995,171 | |||||
Shares issued in reinvestment of dividends and distributions | 20,457 | 160,416 | ||||||
Shares purchased | (147,424 | ) | (1,160,834 | ) | ||||
Net increase (decrease) in shares outstanding | (245 | ) | $ | (5,247) | ||||
PGIM Government Income Fund | 51 |
Notes to Financial Statements (continued)
| Share Class | Shares | Amount | ||||||
Year ended February 28, 2023: | ||||||||
Shares sold | 78,246 | $ | 642,704 | |||||
Shares issued in reinvestment of dividends and distributions | 16,137 | 131,919 | ||||||
Shares purchased | (193,185 | ) | (1,581,432 | ) | ||||
Net increase (decrease) in shares outstanding | (98,802 | ) | $ | (806,809) | ||||
Class Z | ||||||||
Year ended February 29, 2024: | ||||||||
Shares sold | 13,220,362 | $ | 104,238,443 | |||||
Shares issued in reinvestment of dividends and distributions | 879,580 | 6,883,849 | ||||||
Shares purchased | (31,514,217 | ) | (243,910,667 | ) | ||||
Net increase (decrease) in shares outstanding before conversion | (17,414,275 | ) | (132,788,375 | ) | ||||
Shares issued upon conversion from other share class(es) | 79,533 | 624,979 | ||||||
Shares purchased upon conversion into other share class(es) | (32,073 | ) | (253,948 | ) | ||||
Net increase (decrease) in shares outstanding | (17,366,815 | ) | $ | (132,417,344 | ) | |||
Year ended February 28, 2023: | ||||||||
Shares sold | 32,640,817 | $ | 267,906,788 | |||||
Shares issued in reinvestment of dividends and distributions | 643,267 | 5,189,768 | ||||||
Shares purchased | (15,770,656 | ) | (128,300,206 | ) | ||||
Net increase (decrease) in shares outstanding before conversion | 17,513,428 | 144,796,350 | ||||||
Shares issued upon conversion from other share class(es) | 93,110 | 752,811 | ||||||
Shares purchased upon conversion into other share class(es) | (30,322 | ) | (248,269 | ) | ||||
Net increase (decrease) in shares outstanding | 17,576,216 | $ | 145,300,892 | |||||
Class R6 | ||||||||
Year ended February 29, 2024: | ||||||||
Shares sold | 1,964,322 | $ | 15,448,908 | |||||
Shares issued in reinvestment of dividends and distributions | 366,468 | 2,861,689 | ||||||
Shares purchased | (4,573,433 | ) | (35,514,938 | ) | ||||
Net increase (decrease) in shares outstanding before conversion | (2,242,643 | ) | (17,204,341 | ) | ||||
Shares issued upon conversion from other share class(es) | 29,858 | 233,228 | ||||||
Shares purchased upon conversion into other share class(es) | (1,562 | ) | (12,349 | ) | ||||
Net increase (decrease) in shares outstanding | (2,214,347 | ) | $ | (16,983,462 | ) | |||
| 52 |
| Share Class | Shares | Amount | ||||||
Year ended February 28, 2023: | ||||||||
Shares sold | 4,029,387 | $ | 32,567,786 | |||||
Shares issued in reinvestment of dividends and distributions | 304,818 | 2,479,230 | ||||||
Shares purchased | (4,145,725 | ) | (33,927,848 | ) | ||||
Net increase (decrease) in shares outstanding before conversion | 188,480 | 1,119,168 | ||||||
Shares issued upon conversion from other share class(es) | 14,993 | 121,246 | ||||||
Shares purchased upon conversion into other share class(es) | (5,692 | ) | (46,053 | ) | ||||
Net increase (decrease) in shares outstanding | 197,781 | $ | 1,194,361 | |||||
8. Borrowings
The RIC, on behalf of the Fund, along with other affiliated registered investment companies (the “Participating Funds”), is a party to a Syndicated Credit Agreement (“SCA”) with a group of banks. The purpose of the SCA is to provide an alternative source of temporary funding for capital share redemptions. The table below provides details of the current SCA in effect at the reporting period-end as well as the prior SCA.
| Current SCA | Prior SCA | |||
Term of Commitment | 9/29/2023 - 9/26/2024 | 9/30/2022 – 9/28/2023 | ||
Total Commitment | $ 1,200,000,000 | $ 1,200,000,000 | ||
Annualized Commitment Fee on the Unused Portion of the SCA | 0.15% | 0.15% | ||
Annualized Interest Rate on Borrowings | 1.00% plus the higher of (1) the effective federal funds rate, (2) the daily SOFR rate plus 0.10% or (3) zero percent | 1.00% plus the higher of (1) the effective federal funds rate, (2) the daily SOFR rate plus 0.10% or (3) zero percent |
Certain affiliated registered investment companies that are parties to the SCA include portfolios that are subject to a predetermined mathematical formula used to manage certain benefit guarantees offered under variable annuity contracts. The formula may result in large scale asset flows into and out of these portfolios. Consequently, these portfolios may be more likely to utilize the SCA for purposes of funding redemptions. It may be possible for those portfolios to fully exhaust the committed amount of the SCA, thereby requiring the Manager to allocate available funding per a Board-approved methodology designed to treat the Participating Funds in the SCA equitably.
The Fund utilized the SCA during the year ended February 29, 2024. The average daily balance for the 2 days that the Fund had loans outstanding during the period was approximately $578,500, borrowed at a weighted average interest rate of 6.41%. The maximum loan outstanding amount during the period was $853,000. At February 29, 2024, the Fund did not have an outstanding loan amount.
PGIM Government Income Fund | 53 |
Notes to Financial Statements (continued)
9. Risks of Investing in the Fund
The Fund’s risks include, but are not limited to, some or all of the risks discussed below. For further information on the Fund’s risks, please refer to the Fund’s Prospectus and Statement of Additional Information.
Credit Risk: This is the risk that the issuer, the guarantor, or the insurer of a fixed income security, or the counterparty to a contract may be unable or unwilling to make timely principal and interest payments or to otherwise honor its obligations. Additionally, fixed income securities could lose value due to a loss of confidence in the ability of the issuer, guarantor, insurer, or counterparty to pay back debt. The lower the credit quality of a bond, the more sensitive it is to credit risk.
Debt Obligations Risk: Debt obligations are subject to credit risk, market risk and interest rate risk. The Fund’s holdings, share price, yield and total return may also fluctuate in response to bond market movements. The value of bonds may decline for issuer-related reasons, including management performance, financial leverage and reduced demand for the issuer’s goods and services. Certain types of fixed income obligations also may be subject to “call and redemption risk,” which is the risk that the issuer may call a bond held by the Fund for redemption before it matures and the Fund may not be able to reinvest at the same rate of interest and therefore would earn less income.
Derivatives Risk: Derivatives involve special risks and costs and may result in losses to the Fund. The successful use of derivatives requires sophisticated management, and, to the extent that derivatives are used, the Fund will depend on the subadviser’s ability to analyze and manage derivatives transactions. The prices of derivatives may move in unexpected ways, especially in abnormal market conditions. Some derivatives are “leveraged” or may create economic leverage for the Fund. and therefore may magnify or otherwise increase investment losses to the Fund. The Fund’s use of derivatives may also increase the amount of taxes payable by shareholders.
Other risks arise from the potential inability to terminate or sell derivatives positions. A liquid secondary market may not always exist for the Fund’s derivatives positions. In fact, many over-the-counter derivative instruments will not have liquidity beyond the counterparty to the instrument. Over-the-counter derivative instruments also involve the risk that the other party will not meet its obligations to the Fund. The use of derivatives also exposes the Fund to operational issues, such as documentation and settlement issues, systems failures, inadequate control and human error.
Derivatives may also involve legal risks, such as insufficient documentation, the lack of capacity or authority of a counterparty to execute or settle a transaction, and the legality and enforceability of derivatives contracts. The U.S. Government and foreign governments have
| 54 |
adopted (and may adopt further) regulations governing derivatives markets, including mandatory clearing of certain derivatives, margin and reporting requirements and risk exposure limitations. Regulation of derivatives may make derivatives more costly, limit their availability or utility to the Fund, or otherwise adversely affect their performance or disrupt markets.
Economic and Market Events Risk: Events in the U.S. and global financial markets, including actions taken by the U.S. Federal Reserve or foreign central banks to stimulate or stabilize economic growth or the functioning of the securities markets, or otherwise reduce inflation, may at times result in unusually high market volatility, which could negatively impact performance. Governmental efforts to curb inflation often have negative effects on the level of economic activity. Relatively reduced liquidity in credit and fixed income markets could adversely affect issuers worldwide.
Increase in Expenses Risk: Your actual cost of investing in the Fund may be higher than the expenses shown in the expense table in the Fund’s prospectus for a variety of reasons. For example, expense ratios may be higher than those shown if average net assets decrease. Net assets are more likely to decrease and Fund expense ratios are more likely to increase when markets are volatile. Active and frequent trading of Fund securities can increase expenses.
Interest Rate Risk: The value of your investment may go down when interest rates rise. A rise in rates tends to have a greater impact on the prices of longer term or duration debt securities. Similarly, a rise in interest rates may also have a greater negative impact on the value of equity securities whose issuers expect earnings further out in the future. For example, a fixed income security with a duration of three years is expected to decrease in value by approximately 3% if interest rates increase by 1%. This is referred to as “duration risk.” When interest rates fall, the issuers of debt obligations may prepay principal more quickly than expected, and the Fund may be required to reinvest the proceeds at a lower interest rate. This is referred to as “prepayment risk.” For premium bonds (bonds acquired at prices that exceed their par or principal value) purchased by the Fund, prepayment risk may be enhanced. When interest rates rise, debt obligations may be repaid more slowly than expected, and the value of the Fund’s holdings may fall sharply. This is referred to as “extension risk.” The Fund may lose money if short-term or long-term interest rates rise sharply or in a manner not anticipated by the subadviser.
Large Shareholder and Large Scale Redemption Risk: Certain individuals, accounts, funds (including funds affiliated with the Manager) or institutions, including the Manager and its affiliates, may from time to time own or control a substantial amount of the Fund’s shares. There is no requirement that these entities maintain their investment in the Fund. There is a risk that such large shareholders or that the Fund’s shareholders generally may redeem all or a substantial portion of their investments in the Fund in a short period of time, which could have a significant negative impact on the Fund’s NAV, liquidity, and brokerage costs. Large redemptions could also result in tax consequences to shareholders and impact the Fund’s ability to implement its investment strategy. The Fund’s ability to pursue its
PGIM Government Income Fund | 55 |
Notes to Financial Statements (continued)
investment objective after one or more large scale redemptions may be impaired and, as a result, the Fund may invest a larger portion of its assets in cash or cash equivalents.
Market Disruption and Geopolitical Risks: Market disruption can be caused by economic, financial or political events and factors, including but not limited to, international wars or conflicts (including Russia’s military invasion of Ukraine and the Israel-Hamas war), geopolitical developments (including trading and tariff arrangements, sanctions and cybersecurity attacks), instability in regions such as Asia, Eastern Europe and the Middle East, terrorism, natural disasters and public health epidemics (including the outbreak of COVID-19 globally).
The extent and duration of such events and resulting market disruptions cannot be predicted, but could be substantial and could magnify the impact of other risks to the Fund. These and other similar events could adversely affect the U.S. and foreign financial markets and lead to increased market volatility, reduced liquidity in the securities markets, significant negative impacts on issuers and the markets for certain securities and commodities and/or government intervention. They may also cause short- or long-term economic uncertainties in the United States and worldwide. As a result, whether or not the Fund invests in securities of issuers located in or with significant exposure to the countries directly affected, the value and liquidity of the Fund’s investments may be negatively impacted. Further, due to closures of certain markets and restrictions on trading certain securities, the value of certain securities held by the Fund could be significantly impacted, which could lead to such securities being valued at zero.
Market Risk: Securities markets may be volatile and the market prices of the Fund’s securities may decline. Securities fluctuate in price based on changes in an issuer’s financial condition and overall market and economic conditions. If the market prices of the securities owned by the Fund fall, the value of your investment in the Fund will decline.
Mortgage-Backed and Asset-Backed Securities Risk: Mortgage-backed and asset-backed securities tend to increase in value less than other debt securities when interest rates decline, but are subject to similar risk of decline in market value during periods of rising interest rates. The values of mortgage-backed and asset-backed securities become more volatile as interest rates rise. In a period of declining interest rates, the Fund may be required to reinvest more frequent prepayments on mortgage-backed and asset-backed securities in lower-yielding investments.
Portfolio Turnover Risk: The length of time the Fund has held a particular security is not generally a consideration in investment decisions. Under certain market conditions, the Fund’s turnover rate may be higher than that of other mutual funds. Portfolio turnover
| 56 |
generally involves some expense to the Fund, including brokerage commissions or dealer mark-ups and other transaction costs on the sale of securities and reinvestment in other securities. These transactions may result in realization of taxable capital gains. The trading costs and tax effects associated with portfolio turnover may adversely affect the Fund’s investment performance.
U.S. Government and Agency Securities Risk: U.S. Treasury obligations are backed by the “full faith and credit” of the U.S. Government. Securities issued or guaranteed by federal agencies or authorities and U.S. Government-sponsored instrumentalities or enterprises may or may not be backed by the full faith and credit of the U.S. Government. For example, securities issued by the Federal Home Loan Mortgage Corporation, the Federal National Mortgage Association and the Federal Home Loan Banks are neither insured nor guaranteed by the U.S. Government. These securities may be supported by the ability to borrow from the U.S. Treasury or only by the credit of the issuing agency, authority, instrumentality or enterprise and, as a result, are subject to greater credit risk than securities issued or guaranteed by the U.S. Treasury. Further, the U.S. Government and its agencies, authorities, instrumentalities and enterprises do not guarantee the market value of their securities; consequently, the value of such securities will fluctuate. This may be the case especially when there is any controversy or ongoing uncertainty regarding the status of negotiations in the U.S. Congress to increase the statutory debt ceiling. Such controversy or uncertainty could, among other things, result in the credit quality rating of the U. S. Government being downgraded and reduced prices of U.S. Treasury securities. If the U. S. Congress is unable to negotiate an adjustment to the statutory debt ceiling, there is also the risk that the U.S. Government may default on payments on certain U.S. Government securities, including those held by the Fund, which could have a negative impact on the Fund. An increase in demand for U.S. Government securities resulting from an increase in demand for government money market funds may lead to lower yields on such securities.
10. Recent Regulatory Developments
Effective January 24, 2023, the Securities and Exchange Commission adopted rule and form amendments to require mutual funds and ETFs to transmit concise and visually engaging streamlined annual and semiannual reports to shareholders that highlight key information deemed important for retail investors to assess and monitor their fund investments (the “Rule”). Other information, including financial statements, will no longer appear in the funds’ streamlined shareholder reports but must be available online, delivered free of charge upon request, and filed on a semiannual basis on Form N-CSR. The Rule and form amendments have a compliance date of July 24, 2024. At this time, management is evaluating the Rule and its impact to the Fund.
PGIM Government Income Fund | 57 |
Report of Independent Registered Public Accounting Firm
To the Board of Trustees of Prudential Investment Portfolios, Inc. 14 and Shareholders of PGIM Government Income Fund
Opinion on the Financial Statements
We have audited the accompanying statement of assets and liabilities, including the schedule of investments, of PGIM Government Income Fund (one of the funds constituting Prudential Investment Portfolios, Inc. 14, referred to hereafter as the “Fund”) as of February 29, 2024, the related statement of operations for the year ended February 29, 2024, the statements of changes in net assets for each of the two years in the period ended February 29, 2024, including the related notes, and the financial highlights for each of the four years in the period ended February 29, 2024 (collectively referred to as the “financial statements”). In our opinion, the financial statements present fairly, in all material respects, the financial position of the Fund as of February 29, 2024, the results of its operations for the year then ended, the changes in its net assets for each of the two years in the period ended February 29, 2024 and the financial highlights for each of the four years in the period ended February 29, 2024 in conformity with accounting principles generally accepted in the United States of America.
The financial statements of the Fund as of and for the year ended February 29, 2020 and the financial highlights for the year ended February 29, 2020 (not presented herein, other than the financial highlights) were audited by other auditors whose report dated April 17, 2020 expressed an unqualified opinion on those financial statements and financial highlights.
Basis for Opinion
These financial statements are the responsibility of the Fund’s management. Our responsibility is to express an opinion on the Fund’s financial statements based on our audits. We are a public accounting firm registered with the Public Company Accounting Oversight Board (United States) (PCAOB) and are required to be independent with respect to the Fund in accordance with the U.S. federal securities laws and the applicable rules and regulations of the Securities and Exchange Commission and the PCAOB.
We conducted our audits of these financial statements in accordance with the standards of the PCAOB. Those standards require that we plan and perform the audit to obtain reasonable assurance about whether the financial statements are free of material misstatement, whether due to error or fraud.
Our audits included performing procedures to assess the risks of material misstatement of the financial statements, whether due to error or fraud, and performing procedures that respond to those risks. Such procedures included examining, on a test basis, evidence regarding the amounts and disclosures in the financial statements. Our audits also included evaluating the accounting principles used and significant estimates made by management, as well as evaluating the overall presentation of the financial statements. Our procedures included confirmation of securities owned as of February 29, 2024 by correspondence with the custodian, transfer agent and brokers. We believe that our audits provide a reasonable basis for our opinion.
/s/ PricewaterhouseCoopers LLP
New York, New York
April 16, 2024
We have served as the auditor of one or more investment companies in the PGIM Retail Funds complex since 2020.
| 58 |
Tax Information (unaudited)
For the year ended February 29, 2024, the Fund reports the maximum amount allowable but not less than 77.63% as interest-related dividends in accordance with Section 871(k)(1) and 881(e)(1) of the Internal Revenue Code.
For the year ended February 29, 2024 the Fund reports the maximum amount allowable but not less than 97.07% as interest dividends that are eligible to be treated as interest income in accordance with Section 163(j) of the Internal Revenue Code.
In January 2025, you will be advised on IRS Form 1099-DIV or substitute 1099-DIV, as to the Federal tax status of the dividends received by you in calendar year 2024.
We are required by Massachusetts, Missouri and Oregon to inform you that dividends which have been derived from interest on federal obligations are not taxable to shareholders provided that the Fund meets certain requirements mandated by the respective state’s taxing authorities. We are pleased to report that 33.12% of the dividends paid by the Fund qualify for such deduction.
For more detailed information regarding your state and local taxes, you should contact your tax adviser or the state/local taxing authorities.
PGIM Government Income Fund | 59 |
INFORMATION ABOUT BOARD MEMBERS AND OFFICERS (unaudited)
Information about Board Members and Officers of the Fund is set forth below. Board Members who are not deemed to be “interested persons” of the Fund, as defined in the 1940 Act, are referred to as “Independent Board Members.” Board Members who are deemed to be “interested persons” of the Fund are referred to as “Interested Board Members.” The Board Members are responsible for the overall supervision of the operations of the Fund and perform the various duties imposed on the directors of investment companies by the 1940 Act. The Board in turn elects the Officers, who are responsible for administering the day-to-day operations of the Fund.
| Independent Board Members | ||||||
Name Year of Birth Position(s) Portfolios Overseen | Principal Occupation(s) During Past Five Years | Other Directorships Held During Past Five Years | Length of Board Service | |||
Ellen S. Alberding 1958 Board Member Portfolios Overseen: 103 | Chief Executive Officer and President, The Joyce Foundation (charitable foundation) (since 2002); formerly Vice Chair, City Colleges of Chicago (community college system) (2011-2015); formerly Trustee, National Park Foundation (charitable foundation for national park system) (2009-2018); formerly Trustee, Economic Club of Chicago (2009-2016); Trustee, Loyola University (since 2018).
| None. | Since September 2013 | |||
Kevin J. Bannon 1952 Board Member Portfolios Overseen: 104 | Retired; formerly Managing Director (April 2008-May 2015) and Chief Investment Officer (October 2008-November 2013) of Highmount Capital LLC (registered investment adviser); formerly Executive Vice President and Chief Investment Officer (April 1993-August 2007) of Bank of New York Company; formerly President (May 2003-May 2007) of BNY Hamilton Family of Mutual Funds. | Director of Urstadt Biddle Properties (equity real estate investment trust) (September 2008-August 2023). | Since July 2008 | |||
PGIM Government Income Fund
| Independent Board Members | ||||||
Name Year of Birth Position(s) Portfolios Overseen | Principal Occupation(s) During Past Five Years | Other Directorships Held During Past Five Years | Length of Board Service | |||
Linda W. Bynoe 1952 Board Member Portfolios Overseen: 101 | President and Chief Executive Officer (since March 1995) and formerly Chief Operating Officer (December 1989-February 1995) of Telemat Limited LLC (formerly Telemat Ltd) (management consulting); formerly Vice President (January 1985-June 1989) at Morgan Stanley & Co. (broker-dealer).
| Trustee of Equity Residential (residential real estate) (since December 2009); Director of Northern Trust Corporation (financial services) (since April 2006); formerly Director of Anixter International, Inc. (communication products distributor) (January 2006-June 2020). | Since March 2005 | |||
Barry H. Evans 1960 Board Member Portfolios Overseen: 104 | Retired; formerly President (2005-2016), Global Chief Operating Officer (2014-2016), Chief Investment Officer - Global Head of Fixed Income (1998-2014), and various portfolio manager roles (1986-2006), Manulife Asset Management (asset management). | Formerly Director, Manulife Trust Company (2011-2018); formerly Director, Manulife Asset Management Limited (2015-2017); formerly Chairman of the Board of Directors of Manulife Asset Management U.S. (2005-2016); formerly Chairman of the Board, Declaration Investment Management and Research (2008-2016).
| Since September 2017 | |||
Keith F. Hartstein 1956 Board Member & Portfolios Overseen: 104 | Retired; formerly Member (November 2014-September 2022) of the Governing Council of the Independent Directors Council (IDC) (organization of independent mutual fund directors); formerly Executive Committee of the IDC Board of Governors (October 2019-December 2021); formerly President and Chief Executive Officer (2005-2012), Senior Vice President (2004-2005), Senior Vice President of Sales and Marketing (1997-2004), and various executive management positions (1990-1997), John Hancock Funds, LLC (asset management); formerly Chairman, Investment Company Institute’s Sales Force Marketing Committee (2003-2008).
| None. | Since September 2013 | |||
Visit our website at pgim.com/investments
| Independent Board Members | ||||||
Name Year of Birth Position(s) Portfolios Overseen | Principal Occupation(s) During Past Five Years | Other Directorships Held During Past Five Years | Length of Board Service | |||
Laurie Simon Hodrick 1962 Board Member Portfolios Overseen: 101 | A. Barton Hepburn Professor Emerita of Economics in the Faculty of Business, Columbia Business School (since 2018); Visiting Fellow at the Hoover Institution, Stanford University (since 2015); Sole Member, ReidCourt LLC (since 2008) (a consulting firm); formerly Visiting Professor of Law, Stanford Law School (2015-2021); formerly A. Barton Hepburn Professor of Economics in the Faculty of Business, Columbia Business School (1996-2017); formerly Managing Director, Global Head of Alternative Investment Strategies, Deutsche Bank (2006-2008).
| Independent Director, Andela (since January 2022) (global talent network); Independent Director, Roku (since December 2020) (communication services); formerly Independent Director, Synnex Corporation (2019-2021) (information technology); formerly Independent Director, Kabbage, Inc. (2018-2020) (financial services); formerly Independent Director, Corporate Capital Trust (2017-2018) (a business development company). | Since September 2017 | |||
Brian K. Reid 1961 Board Member Portfolios Overseen: 104 | Retired; formerly Chief Economist for the Investment Company Institute (ICI) (2005-2017); formerly Senior Economist and Director of Industry and Financial Analysis at the ICI (1998-2004); formerly Senior Economist, Industry and Financial Analysis at the ICI (1996-1998); formerly Staff Economist at the Federal Reserve Board (1989-1996); formerly Director, ICI Mutual Insurance Company (2012-2017).
| None. | Since March 2018 | |||
PGIM Government Income Fund
| Independent Board Members | ||||||
Name Year of Birth Position(s) Portfolios Overseen | Principal Occupation(s) During Past Five Years | Other Directorships Held During Past Five Years | Length of Board Service | |||
Grace C. Torres 1959 Board Member Portfolios Overseen: 104 | Retired; formerly Treasurer and Principal Financial and Accounting Officer of the PGIM Funds, Target Funds, Advanced Series Trust, Prudential Variable Contract Accounts and The Prudential Series Fund (1998-June 2014); Assistant Treasurer (March 1999-June 2014) and Senior Vice President (September 1999-June 2014) of PGIM Investments LLC; Assistant Treasurer (May 2003-June 2014) and Vice President (June 2005-June 2014) of AST Investment Services, Inc.; Senior Vice President and Assistant Treasurer (May 2003-June 2014) of Prudential Annuities Advisory Services, Inc. | Director (since January 2018) of OceanFirst Financial Corp. and OceanFirst Bank; formerly Director (July 2015-January 2018) of Sun Bancorp, Inc. N.A. and Sun National Bank. | Since November 2014 | |||
Visit our website at pgim.com/investments
| Interested Board Members | ||||||
Name Year of Birth Position(s) Portfolios Overseen | Principal Occupation(s) During Past Five Years | Other Directorships Held During Past Five Years | Length of Board Service | |||
Stuart S. Parker 1962 Board Member, President & Principal Executive Officer Portfolios Overseen: 104 | President, Chief Executive Officer and Officer in Charge of PGIM Investments LLC (formerly known as Prudential Investments LLC) (since January 2012); President and Principal Executive Officer (“PEO”) (since September 2023) of the PGIM Credit Income Fund and the PGIM Rock ETF Trust; President and PEO (since September 2022) of the PGIM Private Credit Fund; President and PEO (since March 2022) of the PGIM Private Real Estate Fund, Inc.; formerly Chief Operating Officer for PGIM Investments LLC (January 2012-January 2024); formerly Executive Vice President of Jennison Associates LLC and Head of Retail Distribution of PGIM Investments LLC (June 2005-December 2011); Investment Company Institute - Board of Governors (since May 2012).
| None. | Since January | |||
PGIM Government Income Fund
| Interested Board Members | ||||||
Name Year of Birth Position(s) Portfolios Overseen | Principal Occupation(s) During Past Five Years | Other Directorships Held During Past Five Years | Length of Board Service | |||
Scott E. Benjamin 1973 Board Member & Vice President Portfolios Overseen: 131 | Executive Vice President (since May 2009) of PGIM Investments LLC; Vice President (since June 2012) of Prudential Investment Management Services LLC; Executive Vice President (since September 2009) of AST Investment Services, Inc.; Senior Vice President of Global Product Management and Marketing, PGIM Investments (since February 2006); Vice President (since September 2023) of the PGIM Credit Income Fund and the PGIM Rock ETF Trust; Vice President (since September 2022) of the PGIM Private Credit Fund; Vice President (since March 2022) of the PGIM Private Real Estate Fund, Inc.; formerly Vice President of Product Development and Product Management, PGIM Investments LLC (2003-2006).
| None. | Since March 2010 | |||
| Fund Officers(a) | ||||
Name Year of Birth Fund Position | Principal Occupation(s) During Past Five Years | Length of Service as Fund Officer | ||
Claudia DiGiacomo 1974 Chief Legal Officer | Chief Legal Officer, Executive Vice President and Secretary of PGIM Investments (since August 2020); Chief Legal Officer of Prudential Mutual Fund Services LLC (since August 2020); Chief Legal Officer of PIFM Holdco, LLC (since August 2020); Corporate Counsel of AST Investment Services, Inc. (since August 2020) and Vice President and Corporate Counsel (since January 2005) of Prudential; Chief Legal Officer (since September 2023) of the PGIM Credit Income Fund and PGIM Rock ETF Trust; Chief Legal Officer (since September 2022) of the PGIM Private Credit Fund; Chief Legal Officer (since July 2022) of the PGIM Private Real Estate Fund, Inc.; formerly, Vice President and Assistant Secretary of PGIM Investments LLC (2005-2020); formerly Associate at Sidley Austin Brown & Wood LLP (1999-2004). | Since December 2005 | ||
Visit our website at pgim.com/investments
| Fund Officers(a) | ||||
Name Year of Birth Fund Position | Principal Occupation(s) During Past Five Years | Length of Service as Fund Officer | ||
Andrew Donohue 1972 Chief Compliance Officer | Vice President, Chief Compliance Officer of PGIM Investments LLC (since September 2022); Chief Compliance Officer of AST Investment Services, Inc. (since October 2022); Chief Compliance Officer (since May 2023) of the PGIM Funds, Target Funds, PGIM ETF Trust, PGIM Global High Yield Fund, Inc., PGIM High Yield Bond Fund, Inc., PGIM Short Duration High Yield Opportunities Fund, Advanced Series Trust, The Prudential Series Fund, Prudential’s Gibraltar Fund, Inc., PGIM Private Credit Fund, PGIM Private Real Estate Fund, Inc.; Chief Compliance Officer (since September 2023) of the PGIM Credit Income Fund and PGIM Rock ETF Trust; formerly various senior compliance roles within Principal Global Investors, LLC., global asset management for Principal Financial (2011-2022), most recently as Global Chief Compliance Officer (2016-2022).
| Since May | ||
Andrew R. French 1962 Secretary | Vice President (since December 2018) of PGIM Investments LLC; Secretary (since September 2023) of the PGIM Credit Income Fund and the PGIM Rock ETF Trust; Secretary (since September 2022) of the PGIM Private Credit Fund; Secretary (since March 2022) of the PGIM Private Real Estate Fund, Inc.; formerly Vice President and Corporate Counsel (2010-2018) of Prudential; formerly Director and Corporate Counsel (2006-2010) of Prudential; Vice President and Assistant Secretary (since January 2007) of PGIM Investments LLC; Vice President and Assistant Secretary (since January 2007) of Prudential Mutual Fund Services LLC.
| Since October 2006 | ||
Melissa Gonzalez 1980 Assistant Secretary | Vice President and Corporate Counsel (since September 2018) of Prudential; Vice President and Assistant Secretary (since August 2020) of PGIM Investments LLC; Assistant Secretary (since September 2023) of the PGIM Credit Income Fund and the PGIM Rock ETF Trust; Assistant Secretary (since September 2022) of the PGIM Private Credit Fund; Assistant Secretary (since March 2022) of the PGIM Private Real Estate Fund, Inc.; formerly Director and Corporate Counsel (March 2014-September 2018) of Prudential.
| Since March 2020 | ||
Patrick E. McGuinness 1986 Assistant Secretary | Vice President and Assistant Secretary (since August 2020) of PGIM Investments LLC; Director and Corporate Counsel (since February 2017) of Prudential; Assistant Secretary (since September 2023) of the PGIM Credit Income Fund and the PGIM Rock ETF Trust; Assistant Secretary (since September 2022) of the PGIM Private Credit Fund; Assistant Secretary (since March 2022) of the PGIM Private Real Estate Fund, Inc.
| Since June | ||
PGIM Government Income Fund
| Fund Officers(a) | ||||
Name Year of Birth Fund Position | Principal Occupation(s) During Past Five Years | Length of Service as Fund Officer | ||
Debra Rubano 1975 Assistant Secretary | Vice President and Corporate Counsel (since November 2020) of Prudential; Assistant Secretary (since September 2023) of the PGIM Credit Income Fund and the PGIM Rock ETF Trust; Assistant Secretary (since September 2022) of the PGIM Private Credit Fund; Assistant Secretary (since March 2022) of the PGIM Private Real Estate Fund, Inc; formerly Director and Senior Counsel of Allianz Global Investors U.S. Holdings LLC (2010-2020) and Assistant Secretary of numerous funds in the Allianz fund complex (2015-2020).
| Since December | ||
George Hoyt 1965 Assistant Secretary | Vice President and Corporate Counsel of Prudential (since September 2023); Assistant Secretary (since September 2023) of the PGIM Rock ETF Trust, PGIM Credit Income Fund, PGIM Private Credit Fund and PGIM Private Real Estate Fund, Inc.; formerly Associate General Counsel of Franklin Templeton and Secretary and Chief Legal Officer of certain funds in the Franklin Templeton complex (2020-2023) and Managing Director (2016-2020) and Associate General Counsel for Legg Mason, Inc. and its predecessors (2004-2020).
| Since December | ||
Devan Goolsby 1991 Assistant Secretary | Vice President and Corporate Counsel of Prudential (since May 2023); Assistant Secretary (since September 2023) of the PGIM Rock ETF Trust, PGIM Credit Income Fund, PGIM Private Credit Fund and PGIM Private Real Estate Fund, Inc.; formerly Associate at Eversheds Sutherland (US) LLP (2021-2023); Compliance Officer at Bloomberg LP (2019-2021); and an Examiner at the Financial Industry Regulatory Authority (2015-2019).
| Since December | ||
Kelly A. Coyne 1968 Assistant Secretary | Director, Investment Operations of Prudential Mutual Fund Services LLC (since 2010); Assistant Secretary (since September 2023) of the PGIM Credit Income Fund; Assistant Secretary (since September 2022) of the PGIM Private Credit Fund; Assistant Secretary (since March 2022) of the PGIM Private Real Estate Fund, Inc.
| Since March 2015 | ||
Visit our website at pgim.com/investments
| Fund Officers(a) | ||||
Name Year of Birth Fund Position | Principal Occupation(s) During Past Five Years | Length of Service as Fund Officer | ||
Christian J. Kelly 1975 Chief Financial Officer | Vice President, Global Head of Fund Administration of PGIM Investments LLC (since November 2018); Chief Financial Officer (since March 2023) of PGIM Investments mutual funds, closed end funds, the PGIM ETF Trust, and Advanced Series Trust, The Prudential Series Fund and Prudential’s Gibraltar Fund, Inc.; Chief Financial Officer (since September 2023) of the PGIM Credit Income Fund and the PGIM Rock ETF Trust; Chief Financial Officer of PGIM Private Credit Fund (since September 2022); Chief Financial Officer of PGIM Private Real Estate Fund, Inc. (since July 2022); formerly Treasurer and Principal Financial Officer (January 2019- March 2023) of PGIM Investments mutual funds, closed end funds, the PGIM ETF Trust, and Advanced Series Trust, The Prudential Series Fund and Prudential’s Gibraltar Fund, Inc.; formerly Treasurer and Principal Financial Officer (March 2022 – July 2022) of the PGIM Private Real Estate Fund, Inc.; formerly Director of Fund Administration of Lord Abbett & Co. LLC (2009-2018), Treasurer and Principal Accounting Officer of the Lord Abbett Family of Funds (2017-2018); Director of Accounting, Avenue Capital Group (2008-2009); Senior Manager, Investment Management Practice of Deloitte & Touche LLP (1998-2007).
| Since January | ||
Russ Shupak 1973 Treasurer and Principal Accounting Officer | Vice President (since 2017) within PGIM Investments Fund Administration; Treasurer and Principal Accounting Officer of PGIM Investments mutual funds, closed end funds and PGIM ETF Trust (since March 2023); Treasurer and Principal Accounting Officer (since September 2023) of the PGIM Credit Income Fund; Treasurer and Principal Accounting Officer (since July 2022) of the PGIM Private Real Estate Fund, Inc.; Assistant Treasurer (since September 2023) of the PGIM Rock ETF Trust; Assistant Treasurer (since September 2022) of the PGIM Private Credit Fund; formerly Assistant Treasurer (March 2022 – July 2022) of the PGIM Private Real Estate Fund, Inc.; Assistant Treasurer of Advanced Series Trust, The Prudential Series Fund and Prudential’s Gibraltar Fund, Inc. (since October 2019); formerly Director (2013-2017) within PGIM Investments Fund Administration.
| Since October | ||
Lana Lomuti 1967 Assistant Treasurer | Vice President (since 2007) within PGIM Investments Fund Administration; formerly Assistant Treasurer (December 2007-February 2014) of The Greater China Fund, Inc.; formerly Director (2005-2007) within PGIM Investments Fund Administration.
| Since April | ||
Deborah Conway 1969 Assistant Treasurer | Vice President (since 2017) within PGIM Investments Fund Administration; formerly Director (2007-2017) within PGIM Investments Fund Administration.
| Since October | ||
PGIM Government Income Fund
| Fund Officers(a) | ||||
Name Year of Birth Fund Position | Principal Occupation(s) During Past Five Years | Length of Service as Fund Officer | ||
Elyse M. McLaughlin 1974 Assistant Treasurer | Vice President (since 2017) within PGIM Investments Fund Administration; Treasurer and Principal Accounting Officer of the Advanced Series Trust, The Prudential Series Fund and Prudential’s Gibraltar Fund, Inc. (since March 2023); Treasurer and Principal Accounting Officer (since September 2023) of the PGIM Rock ETF Trust; Assistant Treasurer (since September 2023) of the PGIM Credit Income Fund; Treasurer and Principal Accounting Officer (since September 2022) of the PGIM Private Credit Fund; Assistant Treasurer (since March 2022) of the PGIM Private Real Estate Fund, Inc.; Assistant Treasurer of PGIM Investments mutual funds, closed end funds and the PGIM ETF Trust (since October 2019); formerly Director (2011-2017) within PGIM Investments Fund Administration.
| Since October 2019 | ||
Robert W. McCormack 1973 Assistant Treasurer | Vice President (since 2019) within PGIM Investments Fund Administration; Assistant Treasurer (since March 2023) of PGIM Investments mutual funds, closed end funds, PGIM ETF Trust, Advanced Series Trust, The Prudential Series Fund and Prudential’s Gibraltar Fund, Inc.; Assistant Treasurer (since September 2023) of the PGIM Credit Income Fund and the PGIM Rock ETF Trust; Assistant Treasurer (since September 2022) of the PGIM Private Credit Fund; Assistant Treasurer (since March 2022) of the PGIM Private Real Estate Fund, Inc.; formerly Director (2016-2019) within PGIM Investments Fund Administration; formerly Vice President within Goldman, Sachs & Co. Investment Management Controllers (2008-2016), Assistant Treasurer of Goldman Sachs Family of Funds (2015-2016).
| Since March 2023 | ||
Kelly Florio 1978 Anti-Money Laundering Compliance Officer | Vice President, Corporate Compliance, Global Compliance Programs and Compliance Risk Management (since December 2021) of Prudential; formerly Head of Fraud Risk Management (October 2019-December 2021) at New York Life Insurance Company; formerly Head of Key Risk Area Operations (November 2018-October 2019), Director of the US Anti-Money Laundering Compliance Unit (2009-2018) and Bank Loss Prevention Associate (2006-2009) at MetLife.
| Since June 2022 | ||
(a) Excludes Mr. Parker and Mr. Benjamin, interested Board Members who also serve as President and Vice President, respectively.
Explanatory Notes to Tables:
| ∎ | Board Members are deemed to be “Interested,” as defined in the 1940 Act, by reason of their affiliation with PGIM Investments LLC and/or an affiliate of PGIM Investments LLC. |
| ∎ | Unless otherwise noted, the address of all Board Members and Officers is c/o PGIM Investments LLC, 655 Broad Street, Newark, New Jersey 07102-4410. |
| ∎ | There is no set term of office for Board Members or Officers. The Board Members have adopted a retirement policy, which calls for the retirement of Board Members on December 31 of the year in which they reach the age of 75. |
| ∎ | “Other Directorships Held” includes all directorships of companies required to register or file reports with the SEC under the 1934 Act (that is, “public companies”) or other investment companies registered under the 1940 Act. |
Visit our website at pgim.com/investments
| ∎ | “Portfolios Overseen” includes such applicable investment companies managed by PGIM Investments LLC and overseen by the Board Member. The investment companies for which PGIM Investments LLC serves as manager include the PGIM Mutual Funds, Target Funds, PGIM ETF Trust, PGIM Rock ETF Trust, PGIM Private Real Estate Fund, Inc., PGIM Private Credit Fund, PGIM Credit Income Fund, PGIM High Yield Bond Fund, Inc., PGIM Global High Yield Fund, Inc., PGIM Short Duration High Yield Opportunities Fund, The Prudential Series Fund, Prudential’s Gibraltar Fund, Inc. and the Advanced Series Trust. |
| ∎ | As used in the Fund Officers table “Prudential” means The Prudential Insurance Company of America. |
PGIM Government Income Fund
| ∎ TELEPHONE | ∎ WEBSITE | |||
655 Broad Street Newark, NJ 07102 | (800) 225-1852 | pgim.com/investments | ||
| PROXY VOTING |
| The Board of Directors of the Fund has delegated to the Fund’s subadviser the responsibility for voting any proxies and maintaining proxy recordkeeping with respect to the Fund. A description of these proxy voting policies and procedures is available without charge, upon request, by calling (800) 225-1852 or by visiting the Securities and Exchange Commission’s website at sec.gov. Information regarding how the Fund voted proxies relating to portfolio securities during the most recent 12-month period ended June 30 is available on the Fund’s website and on the Securities and Exchange Commission’s website. |
| DIRECTORS |
| Ellen S. Alberding • Kevin J. Bannon • Scott E. Benjamin • Linda W. Bynoe • Barry H. Evans • Keith F. Hartstein • Laurie Simon Hodrick • Stuart S. Parker • Brian K. Reid • Grace C. Torres |
| OFFICERS |
| Stuart S. Parker, President and Principal Executive Officer • Scott E. Benjamin, Vice President • Christian J. Kelly, Chief Financial Officer • Claudia DiGiacomo, Chief Legal Officer • Andrew Donohue, Chief Compliance Officer • Russ Shupak, Treasurer and Principal Accounting Officer • Kelly Florio, Anti-Money Laundering Compliance Officer • Andrew R. French, Secretary • Melissa Gonzalez, Assistant Secretary • Kelly A. Coyne, Assistant Secretary • Patrick E. McGuinness, Assistant Secretary • Debra Rubano, Assistant Secretary • George Hoyt, Assistant Secretary • Devan Goolsby, Assistant Secretary • Lana Lomuti, Assistant Treasurer • Elyse M. McLaughlin, Assistant Treasurer • Deborah Conway, Assistant Treasurer • Robert W. McCormack, Assistant Treasurer |
| MANAGER | PGIM Investments LLC | 655 Broad Street Newark, NJ 07102 | ||
| ||||
| SUBADVISER | PGIM Fixed Income
| 655 Broad Street Newark, NJ 07102
| ||
| ||||
| DISTRIBUTOR | Prudential Investment Management Services LLC | 655 Broad Street Newark, NJ 07102 | ||
| ||||
| CUSTODIAN | The Bank of New York Mellon | 240 Greenwich Street New York, NY 10286 | ||
| ||||
| TRANSFER AGENT | Prudential Mutual Fund Services LLC | PO Box 534432 Pittsburgh, PA 15253 | ||
| ||||
INDEPENDENT REGISTERED PUBLIC ACCOUNTING FIRM | PricewaterhouseCoopers LLP | 300 Madison Avenue New York, NY 10017 | ||
| ||||
| FUND COUNSEL | Willkie Farr & Gallagher LLP | 787 Seventh Avenue New York, NY 10019 | ||
| ||||
| An investor should consider the investment objectives, risks, charges, and expenses of the Fund carefully before investing. The prospectus and summary prospectus contain this and other information about the Fund. An investor may obtain the prospectus and summary prospectus by visiting our website at pgim.com/investments or by calling (800) 225-1852. The prospectus and summary prospectus should be read carefully before investing. |
| E-DELIVERY |
| To receive your mutual fund documents online, go to pgim.com/investments/resource/edelivery and enroll. Instead of receiving printed documents by mail, you will receive notification via email when new materials are available. You can cancel your enrollment or change your email address at any time by visiting the website address above. |
| SHAREHOLDER COMMUNICATIONS WITH DIRECTORS |
| Shareholders can communicate directly with the Board of Directors by writing to the Chair of the Board, PGIM Government Income Fund, PGIM Investments, Attn: Board of Directors, 655 Broad Street, Newark, NJ 07102. Shareholders can communicate directly with an individual Director by writing to that Director at the same address. Communications are not screened before being delivered to the addressee. |
| AVAILABILITY OF PORTFOLIO HOLDINGS |
| The Fund files its complete schedule of portfolio holdings with the Securities and Exchange Commission for the first and third quarters of each fiscal year as an exhibit to its reports on Form N-PORT. The Fund’s Form N-PORT filings are available on the Commission’s website at sec.gov. |
| The Fund’s Statement of Additional Information contains additional information about the Fund’s Directors and is available without charge, upon request, by calling (800) 225-1852. |
Mutual Funds:
| ARE NOT INSURED BY THE FDIC OR ANY FEDERAL GOVERNMENT AGENCY | MAY LOSE VALUE | ARE NOT A DEPOSIT OF OR GUARANTEED BY ANY BANK OR ANY BANK AFFILIATE |

PGIM GOVERNMENT INCOME FUND
| SHARE CLASS | A | C | R | Z | R6 | |||||
| NASDAQ | PGVAX | PRICX | JDRVX | PGVZX | PGIQX | |||||
| CUSIP | 74439V107 | 74439V305 | 74439V503 | 74439V404 | 74439V875 | |||||
MF128E

PGIM FLOATING RATE INCOME FUND
ANNUAL REPORT
FEBRUARY 29, 2024

To enroll in e-delivery, go to pgim.com/investments/resource/edelivery
| 3 | ||||
| 4 | ||||
| 5 | ||||
| 8 | ||||
| 11 | ||||
| 13 | ||||
This report is not authorized for distribution to prospective investors unless preceded or accompanied by a current prospectus.
The views expressed in this report and information about the Fund’s portfolio holdings are for the period covered by this report and are subject to change thereafter.
Mutual funds are distributed by Prudential Investment Management Services LLC (PIMS), member SIPC. PGIM Fixed Income is a unit of PGIM, Inc. (PGIM), a registered investment adviser. PIMS and PGIM are Prudential Financial companies. © 2024 Prudential Financial, Inc. and its related entities. PGIM and the PGIM logo are service marks of Prudential Financial, Inc. and its related entities, registered in many jurisdictions worldwide.
2 Visit our website at pgim.com/investments
 | Dear Shareholder:
We hope you find the annual report for the PGIM Floating Rate Income Fund informative and useful. The report covers performance for the 12-month period that ended February 29, 2024.
Despite elevated inflation, recession fears, and a banking industry crisis, financial markets rallied and the global economy remained resilient throughout the period. Employers continued hiring, consumers continued spending, and home prices rose as inflation eventually cooled and the economic outlook improved. |
Stocks rose for much of the period and then surged late in the period when the Federal Reserve (the Fed) signaled several potential interest-rate cuts in 2024. For the entire period, equities in both US and international markets posted gains.
After falling much of the period, bond markets rebounded when the Fed began moderating its rate-hiking cycle. Higher interest rates also offered investors an additional cushion from fixed income volatility.US and global investment-grade bonds, along with US high yield corporate bonds and emerging market debt, all posted gains during the period.
Regarding your investments with PGIM, we believe it is important to maintain a diversified portfolio of funds consistent with your tolerance for risk, time horizon, and financial goals. Your financial advisor can help you create a diversified investment plan that may include funds covering a broad spectrum of asset classes and that reflects your personal investor profile and risk tolerance. However, diversification and asset allocation strategies do not assure a profit or protect against loss in declining markets.
At PGIM Investments, we provide access to active investment strategies across the global markets in the pursuit of consistent outperformance for investors. PGIM is the world’s14th-largest investment manager with more than $1.3 trillion in assets under management. Our scale and investment expertise allow us to deliver a diversified suite of actively managed solutions across a broad spectrum of asset classes and investment styles.
Thank you for choosing our family of funds.
Sincerely,

Stuart S. Parker, President and Principal Executive Officer
PGIM Floating Rate Income Fund
April 15, 2024
PGIM Floating Rate Income Fund 3
Your Fund’s Performance (unaudited)
Performance data quoted represent past performance. Past performance does not guarantee future results. The investment return and principal value of an investment will fluctuate so that an investor’s shares, when redeemed, may be worth more or less than their original cost. Current performance may be lower or higher than the past performance data quoted. An investor may obtain performance data as of the most recent month-end by visiting our website at pgim.com/investments or by calling (800) 225-1852.
| Average Annual Total Returns as of 2/29/24 | ||||||||||||||||
| One Year (%) | Five Years (%) | Ten Years (%) | Since Inception (%) | |||||||||||||
Class A | ||||||||||||||||
(with sales charges) | 8.53 | 4.36 | 3.87 | — | ||||||||||||
(without sales charges) | 11.03 | 4.84 | 4.11 | — | ||||||||||||
Class C | ||||||||||||||||
(with sales charges) | 9.33 | 4.08 | 3.33 | — | ||||||||||||
(without sales charges) | 10.33 | 4.08 | 3.33 | — | ||||||||||||
Class Z | ||||||||||||||||
(without sales charges) | 11.30 | 5.10 | 4.37 | — | ||||||||||||
Class R6 (without sales charges) |
| 11.36 |
|
| 5.15 |
|
| N/A |
|
| 4.59 (4/27/2015) |
| ||||
Credit Suisse Leveraged Loan Index | ||||||||||||||||
| 11.37 | 5.10 | 4.51 | — | |||||||||||||
| Average Annual Total Returns as of 2/29/24 Since Inception (%) | ||
Class R6 (4/27/2015) | ||
Credit Suisse Leveraged Loan Index | 4.65 | |
Since Inception returns are provided for any share class with less than 10 fiscal years of returns. Since Inception returns for the Index are measured from the closest month-end to the class’s inception date.
4 Visit our website at pgim.com/investments
Growth of a $10,000 Investment (unaudited)
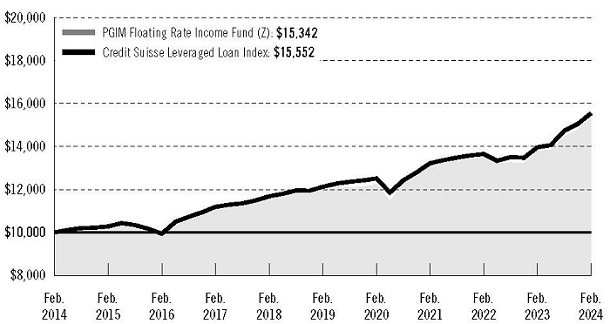
The graph compares a $10,000 investment in the Fund’s Class Z shares with a similar investment in the Credit Suisse Leveraged Loan Index by portraying the initial account values at the beginning of the 10-year period for Class Z shares (February 28, 2014) and the account values at the end of the current fiscal year (February 29, 2024) as measured on a quarterly basis. For purposes of the graph, and unless otherwise indicated, it has been assumed that (a) all recurring fees (including management fees) were deducted and (b) all dividends and distributions were reinvested. The line graph provides information for Class Z shares only. As indicated in the tables provided earlier, performance for other share classes will vary due to the differing fees and expenses applicable to each share class (as indicated in the following paragraphs). Without waiver of fees and/or expense reimbursements, if any, the returns would have been lower.
Past performance does not predict future performance. Total returns and the ending account values in the graphs include changes in share price and reinvestment of dividends and capital gains distributions in a hypothetical investment for the periods shown. The Fund’s total returns in the table and the graph do not reflect the deduction of income taxes on an individual’s investment. Taxes may reduce your actual investment returns on income or gains paid by the Fund or any gains you may realize if you sell your shares.
PGIM Floating Rate Income Fund 5
Your Fund’s Performance (continued)
The returns in the tables do not reflect the deduction of taxes that a shareholder would pay on Fund distributions or following the redemption of Fund shares. The average annual total returns take into account applicable sales charges, which are described for each share class in the table below.
| Class A | Class C | Class Z | Class R6 | |||||
| Maximum initial sales charge | 2.25% of the public offering price | None | None | None | ||||
| Contingent deferred sales charge (CDSC) (as a percentage of the lower of the original purchase price or the net asset value at redemption) | 1.00% on sales of $500,000 or more made within 12 months of purchase | 1.00% on sales made within 12 months of purchase | None | None | ||||
| Annual distribution and service (12b-1) fees (shown as a percentage of average daily net assets) | 0.25% | 1.00% | None | None | ||||
Benchmark Definition
Credit Suisse Leveraged Loan Index—The Credit Suisse Leveraged Loan Index is an unmanaged index that represents the investable universe of the US dollar-denominated leveraged loan market.
Investors cannot invest directly in an index. The returns for the Index would be lower if they included the effects of sales charges, operating expenses of a mutual fund, or taxes that may be paid by an investor.
6 Visit our website at pgim.com/investments
| Credit Quality expressed as a percentage of total investments as of 2/29/24 (%) | ||||
AAA | 1.6 | |||
AA | 18.1 | |||
A | 0.9 | |||
BBB | 13.1 | |||
BB | 25.8 | |||
B | 34.5 | |||
CCC | 3.1 | |||
Not Rated | 2.6 | |||
Cash/Cash Equivalents | 0.3 | |||
Total | 100.0 | |||
Credit ratings reflect the highest rating assigned by a nationally recognized statistical rating organization (NRSRO) such as Moody’s Investors Service, Inc. (Moody’s), S&P Global Ratings (S&P), or Fitch Ratings, Inc. (Fitch). Credit ratings reflect the common nomenclature used by both S&P and Fitch. Where applicable, ratings are converted to the comparable S&P/Fitch rating tier nomenclature. These rating agencies are independent and are widely used. The Not Rated category consists of securities that have not been rated by an NRSRO. Credit ratings are subject to change.
| Distributions and Yields as of 2/29/24 | ||||||
Total Distributions Paid for One Year ($) | SEC 30-Day Subsidized Yield* (%) | SEC 30-Day Unsubsidized Yield** (%) | ||||
Class A | 0.79 | 7.72 | 7.59 | |||
Class C | 0.73 | 7.13 | 7.15 | |||
Class Z | 0.82 | 8.15 | 8.11 | |||
Class R6 | 0.82 | 8.21 | 8.18 | |||
*SEC 30-Day Subsidized Yield (%)—A standardized yield calculation created by the Securities and Exchange Commission, it reflects the income earned during a 30-day period, after the deduction of the Fund’s net expenses (net of any expense waivers or reimbursements). The investor experience is represented by the SEC 30-Day Subsidized Yield.
**SEC 30-Day Unsubsidized Yield (%)—A standardized yield calculation created by the Securities and Exchange Commission, it reflects the income earned during a 30-day period, after the deduction of the Fund’s gross expenses. The investor experience is represented by the SEC 30-Day Subsidized Yield.
PGIM Floating Rate Income Fund 7
Strategy and Performance Overview*
(unaudited)
How did the Fund perform?
The PGIM Floating Rate Income Fund’s Class Z shares returned 11.30% in the 12-month reporting period that ended February 29, 2024, slightly underperforming the 11.37% return of the Credit Suisse Leveraged Loan Index (the Index).
What were the market conditions?
| · | US leveraged loans posted positive total returns over the reporting period, benefiting from increasingly benign inflation data, better-than-feared corporate earnings, and resilient economic data, which reinforced the likelihood of a soft economic landing. (When central banks raise interest rates just enough to slow the economy and lower inflation without causing a recession, it is known as a soft landing. When they raise rates enough to cause a significant economic slowdown or a recession, it is known as a hard landing.) Higher short-term interest rates, stronger investor demand, and robust collateralized loan obligation (CLO) formation provided a strong technical backdrop for the asset class, driving loan prices higher over the reporting period. |
| · | The average price of all loans in the Index started at $93.49 at the beginning of the reporting period and ended the reporting period at $95.74. Meanwhile, average spreads at the end of the reporting period were 519 basis points (bps), down from 586 bps at the beginning of the reporting period. (One basis point equals 0.01%.) Average yields declined to 9.39% at the end of the reporting period from 10.52% at the beginning, as the impact of robust capital market activity in the form of repricings and refinancings lowered issuers’ average coupon payments. |
| · | By quality, CCC-rated loans outperformed both B-rated loans and BB-rated loans over the reporting period, as investors became increasingly comfortable with the economic backdrop. |
| · | Still-solid credit fundamentals and rising access to capital markets helped keep defaults near the long-term average, with the par-weighted loan default rate ending the reporting period at 3.17%, up 88 bps over the prior reporting period. |
| · | Gross loan issuance was robust over the reporting period, totaling $517 billion. However, refinancing and repricing activity made up the bulk of that total. Excluding refinancings and repricings, net issuance totaled just $96 billion. |
What worked?
| · | Overall security selection contributed to the Fund’s performance during the reporting period, with selections in the banking, consumer non-cyclical, and cable & satellite industries contributing the most. |
| · | While overall sector allocation detracted from performance, overweights relative to the Index to emerging-markets high yield, US investment-grade corporates, and UK bank loans contributed. |
| · | Within industries, underweights relative to the Index to healthcare & pharmaceuticals, and transportation & environmental services, along with an overweight relative to the Index to finance companies, contributed to performance. |
8 Visit our website at pgim.com/investments
| · | From a single-name credit perspective, positions in Venator Materials LLC (chemicals), Digicel International (telecom), City Brewing Co. LLC (consumer non-cyclical), and Finastra USA Inc. (technology) added value. |
| · | From a market perspective, having more risk (i.e., a measure of a portfolio’s exposure to market-wide changes in credit spreads), on average, than the relevant Index was a strong contributor to performance over the reporting period. |
What didn’t work?
| · | Overall sector allocation detracted from the Fund’s performance during the reporting period, with overweights relative to the Index to the CLO AA and US high yield sectors, along with an underweight relative to the Index to US bank loans, detracting the most. |
| · | While overall security selection contributed to performance, selections in media & entertainment, technology, and healthcare & pharmaceuticals detracted. |
| · | Within industries, overweights relative to the Index to banking and chemicals, along with an underweight relative to the Index to other industrials, detracted from performance. |
| · | MLN US HoldCo LLC (technology), Sound Inpatient Physicians Holdings LLC (healthcare & pharmaceuticals), and Xplornet Communications Inc. (telecom) were the largest single-name detractors from performance. |
Did the Fund use derivatives?
The Fund used sovereign futures to help manage its duration and yield curve exposure and to reduce its sensitivity to changes in the levels of interest rates. (Duration measures the sensitivity of the price—the value of principal—of a bond to a change in interest rates. A yield curve is a line graph that illustrates the relationship between the yields and maturities of fixed income securities. It is created by plotting the yields of different maturities for the same type of bonds.) Overall, this strategy had a positive impact on performance during the reporting period. The Fund also used credit derivatives in the form of the Credit Default Swap Index (CDX) to manage credit risk. The use of CDX contributed to the Fund’s performance during the reporting period. The Fund also used foreign currency exchange contracts during the reporting period, but they had no impact on performance.
Current outlook
| · | Following the strong returns of 2023, PGIM Fixed Income expects US leveraged loans to post strong total returns in 2024, supported by high all-in current coupons and yields, accelerating inflows into bank loan mutual funds, modest net new supply, and a growing share of loans being refinanced in the private or high yield market. |
| · | Loan defaults rose slightly above their long-term average in recent months amid rising corporate headwinds and higher interest rates. PGIM Fixed Income expects the higher cost of capital to continue to pressure free cash flows in 2024, particularly for lower-quality, sponsor-owned companies with loan-only capital structures. Given that |
PGIM Floating Rate Income Fund 9
Strategy and Performance Overview* (continued)
these types of issuers currently comprise a larger portion of the overall market than in prior cycles, PGIM Fixed Income expects loan default rates (including distressed exchanges) to rise to 4%–4.5% by year-end from approximately 3.5% currently. |
| · | PGIM Fixed Income continues to favor public, BB-rated, and high single-B-rated loans over sponsor-owned, low single-B-rated, and CCC-rated loans in the expectation that those lower-quality loans are likely to be most impacted by the challenging fundamental backdrop. PGIM Fixed Income believes that credit selection and deep, fundamental credit research/modeling is becoming increasingly important, and that the avoidance of defaults will be the biggest driver of alpha over the next 12–24 months. (Alpha is a measure of an investment’s active return compared to a market or index.) |
*This strategy and performance overview, which discusses what strategies or holdings (including derivatives, if applicable) affected the Fund’s performance, is compiled based on how the Fund performed relative to the Index and is viewed for performance attribution purposes at the aggregate Fund level, which in most instances will not directly correlate to the amounts disclosed in the Statement of Operations which conform to US generally accepted accounting principles.
10 Visit our website at pgim.com/investments
As a shareholder of the Fund, you incur two types of costs: (1) transaction costs, including sales charges (loads) on purchase payments and redemptions, as applicable, and (2) ongoing costs, including management fees, distribution and/or service (12b-1) fees, and other Fund expenses, as applicable. This example is intended to help you understand your ongoing costs (in dollars) of investing in the Fund and to compare these costs with the ongoing costs of investing in other mutual funds.
The example is based on an investment of $1,000 held through the six-month period ended February 29, 2024. The example is for illustrative purposes only; you should consult the Prospectus for information on initial and subsequent minimum investment requirements.
Actual Expenses
The first line for each share class in the table on the following page provides information about actual account values and actual expenses. You may use the information on this line, together with the amount you invested, to estimate the expenses that you paid over the period. Simply divide your account value by $1,000 (for example, an $8,600 account value ÷ $1,000 =8.6), then multiply the result by the number on the first line under the heading “Expenses Paid During the Six-Month Period” to estimate the expenses you paid on your account during this period.
Hypothetical Example for Comparison Purposes
The second line for each share class in the table on the following page provides information about hypothetical account values and hypothetical expenses based on the Fund’s actual expense ratio and an assumed rate of return of 5% per year before expenses, which is not the Fund’s actual return. The hypothetical account values and expenses may not be used to estimate the actual ending account balance or expenses you paid for the period. You may use this information to compare the ongoing costs of investing in the Fund and other funds. To do so, compare this 5% hypothetical example with the 5% hypothetical examples that appear in the shareholder reports of the other funds.
The Fund’s transfer agent may charge additional fees to holders of certain accounts that are not included in the expenses shown in the table on the following page. These fees apply to individual retirement accounts (IRAs) and Section 403(b) accounts. As of the close of the six-month period covered by the table, IRA fees included an annual maintenance fee of $15 per account (subject to a maximum annual maintenance fee of $25 for all accounts held by the same shareholder). Section 403(b) accounts are charged an annual $25 fiduciary maintenance fee. Some of the fees may vary in amount, or may be waived, based on your total account balance or the number of PGIM funds, including the Fund, that you own. You should consider the additional fees that were charged to your Fund account over the six-month period when you estimate the total ongoing expenses paid over the period and the impact of these fees on your ending account value, as these additional expenses are not reflected in the information
PGIM Floating Rate Income Fund 11
Fees and Expenses (continued)
provided in the expense table. Additional fees have the effect of reducing investment returns.
Please note that the expenses shown in the table are meant to highlight your ongoing costs only and do not reflect any transactional costs such as sales charges (loads). Therefore, the second line for each share class in the table is useful in comparing ongoing costs only and will not help you determine the relative total costs of owning different funds. In addition, if these transactional costs were included, your costs would have been higher.
| PGIM Floating Rate Income Fund | Beginning Account Value September 1, 2023 | Ending Account Value | Annualized Expense Ratio Based on the Six-Month Period | Expenses Paid During the Six-Month Period* | ||||||
Class A | Actual | $1,000.00 | $1,059.60 | 0.96% | $4.92 | |||||
Hypothetical | $1,000.00 | $1,020.09 | 0.96% | $4.82 | ||||||
Class C | Actual | $1,000.00 | $1,055.70 | 1.71% | $8.74 | |||||
Hypothetical | $1,000.00 | $1,016.36 | 1.71% | $8.57 | ||||||
Class Z | Actual | $1,000.00 | $1,060.90 | 0.71% | $3.64 | |||||
Hypothetical | $1,000.00 | $1,021.33 | 0.71% | $3.57 | ||||||
Class R6 | Actual | $1,000.00 | $1,060.00 | 0.66% | $3.38 | |||||
Hypothetical | $1,000.00 | $1,021.58 | 0.66% | $3.32 | ||||||
*Fund expenses (net of fee waivers or subsidies, if any) for each share class are equal to the annualized expense ratio for each share class (provided in the table), multiplied by the average account value over the period, multiplied by the 182 days in the six-month period ended February 29, 2024, and divided by the 366 days in the Fund’s fiscal year ended February 29, 2024 (to reflect the six-month period). Expenses presented in the table include the expenses of any underlying portfolios in which the Fund may invest.
12 Visit our website at pgim.com/investments
as of February 29, 2024
| Description | Interest Rate | Maturity Date | Principal Amount (000)# | Value | ||||||||||||
LONG-TERM INVESTMENTS 98.2% | ||||||||||||||||
ASSET-BACKED SECURITIES 20.1% | ||||||||||||||||
Collateralized Loan Obligations 20.0% | ||||||||||||||||
Apex Credit CLO LLC (Cayman Islands), | ||||||||||||||||
Series 2021-02A, Class A2, 144A, 3 Month SOFR + 2.112% | 7.429 | %(c) | 10/20/34 | 4,725 | $ | 4,753,220 | ||||||||||
Apidos CLO Ltd. (United Kingdom), | ||||||||||||||||
Series 2022-42A, Class D, 144A, 3 Month SOFR + 5.760% | 11.078 | (c) | 01/20/36 | 1,500 | 1,527,712 | |||||||||||
Atlas Senior Loan Fund Ltd. (United Kingdom), | ||||||||||||||||
Series 2023-21A, Class B, 144A, 3 Month SOFR + 3.000% | 8.318 | (c) | 07/20/35 | 5,000 | 5,066,190 | |||||||||||
Atlas Static Senior Loan Fund Ltd. (Cayman Islands), | ||||||||||||||||
Series 2022-01A, Class BR, 144A, 3 Month SOFR + 2.650% | 7.964 | (c) | 07/15/30 | 14,250 | 14,251,244 | |||||||||||
Avoca Capital CLO Ltd. (Ireland), | ||||||||||||||||
Series 10A, Class B1RR, 144A, 3 Month EURIBOR + 1.350% | 5.292 | (c) | 04/15/35 | EUR | 3,750 | 3,962,153 | ||||||||||
Bain Capital Credit CLO Ltd. (United Kingdom), | ||||||||||||||||
Series 2023-03A, Class B, 144A, 3 Month SOFR + 2.700% | 8.019 | (c) | 07/24/36 | 16,525 | 16,549,079 | |||||||||||
Balboa Bay Loan Funding Ltd. (Cayman Islands), | ||||||||||||||||
Series 2021-01A, Class B, 144A, 3 Month SOFR + 1.912% | 7.229 | (c) | 07/20/34 | 250 | 248,909 | |||||||||||
Series 2023-01A, Class B, 144A, 3 Month SOFR + 2.550% | 7.868 | (c) | 04/20/35 | 13,500 | 13,533,097 | |||||||||||
Series 2023-01A, Class D, 144A, 3 Month SOFR + 5.500% | 10.818 | (c) | 04/20/35 | 7,220 | 7,294,318 | |||||||||||
Barrow Hanley CLO Ltd. (Cayman Islands), | ||||||||||||||||
Series 2023-01A, Class A1, 144A, 3 Month SOFR + 2.300% | 7.618 | (c) | 04/20/35 | 8,500 | 8,508,962 | |||||||||||
Series 2023-01A, Class B, 144A, 3 Month SOFR + 3.000% | 8.318 | (c) | 04/20/35 | 5,000 | 5,014,678 | |||||||||||
Series 2023-02A, Class B, 144A, 3 Month SOFR + 3.000% | 8.339 | (c) | 10/20/35 | 5,000 | 5,015,821 | |||||||||||
Battalion CLO Ltd. (Cayman Islands), | ||||||||||||||||
Series 2017-11A, Class BR, 144A, 3 Month SOFR + 1.982% | 7.300 | (c) | 04/24/34 | 5,000 | 4,976,332 | |||||||||||
Carlyle US CLO Ltd. (Cayman Islands), | ||||||||||||||||
Series 2023-05A, Class B, 144A, 3 Month SOFR + 2.650% | 8.007 | (c) | 01/27/36 | 18,250 | 18,349,587 | |||||||||||
See Notes to Financial Statements.
PGIM Floating Rate Income Fund 13
Schedule of Investments (continued)
as of February 29, 2024
| Description | Interest Rate | Maturity Date | Principal Amount (000)# | Value | ||||||||||||
ASSET-BACKED SECURITIES (Continued) | ||||||||||||||||
Collateralized Loan Obligations (cont’d.) | ||||||||||||||||
CarVal CLO Ltd. (United Kingdom), | ||||||||||||||||
Series 2023-01A, Class A2, 144A, 3 Month SOFR + 2.350% | 7.668%(c) | 01/20/35 | 4,125 | $ | 4,136,346 | |||||||||||
Series 2023-01A, Class B1, 144A, 3 Month SOFR + 2.750% | 8.068(c) | 01/20/35 | 3,975 | 3,979,645 | ||||||||||||
CIFC European Funding CLO DAC (Ireland), | ||||||||||||||||
Series 03A, Class B1, 144A, 3 Month EURIBOR + 1.500% | 5.442(c) | 01/15/34 | EUR | 2,000 | 2,121,412 | |||||||||||
Columbia Cent CLO Ltd. (Cayman Islands), | ||||||||||||||||
Series 2020-29A, Class BR, 144A, 3 Month SOFR + 1.962% | 7.279(c) | 10/20/34 | 15,000 | 14,947,500 | ||||||||||||
Gallatin CLO Ltd. (Bermuda), | ||||||||||||||||
Series 2023-01A, Class B, 144A, 3 Month SOFR + 3.050% | 8.364(c) | 10/14/35 | 10,000 | 10,069,830 | ||||||||||||
Golub Capital Partners CLO Ltd. (United Kingdom), | ||||||||||||||||
Series 2023-68A, Class B, 144A, 3 Month SOFR + 2.800% | 8.125(c) | 07/25/36 | 18,600 | 18,756,262 | ||||||||||||
Greywolf CLO Ltd. (Cayman Islands), | ||||||||||||||||
Series 2018-01A, Class A1, 144A, 3 Month SOFR + 1.290% | 6.614(c) | 04/26/31 | 1,446 | 1,447,430 | ||||||||||||
Guggenheim CLO Ltd. (Cayman Islands), | ||||||||||||||||
Series 2022-02A, Class B, 144A, 3 Month SOFR + 3.800% | 9.114(c) | 01/15/35 | 3,750 | 3,758,542 | ||||||||||||
HPS Loan Management Ltd. (Cayman Islands), | ||||||||||||||||
Series 2023-18A, Class B, 144A, 3 Month SOFR + 2.950% | 8.268(c) | 07/20/36 | 17,900 | 18,132,168 | ||||||||||||
Jefferson Mill CLO Ltd. (Cayman Islands), | ||||||||||||||||
Series 2015-01A, Class AR, 144A, 3 Month SOFR + 1.437% | 6.754(c) | 10/20/31 | 943 | 945,394 | ||||||||||||
KKR CLO Ltd. (Cayman Islands), | ||||||||||||||||
Series 2022-41A, Class B, 144A, 3 Month SOFR + 1.900% | 7.217(c) | 04/15/35 | 12,500 | 12,406,381 | ||||||||||||
LCM Ltd. (Cayman Islands), | ||||||||||||||||
Series 33A, Class B, 144A, 3 Month SOFR + 1.912% | 7.229(c) | 07/20/34 | 1,300 | 1,286,000 | ||||||||||||
Logan CLO Ltd. (Cayman Islands), | ||||||||||||||||
Series 2021-02A, Class B, 144A, 3 Month SOFR + 1.962% | 7.279(c) | 01/20/35 | 2,950 | 2,949,885 | ||||||||||||
Mountain View CLO Ltd. (Cayman Islands), | ||||||||||||||||
Series 2015-09A, Class A2R, 144A, 3 Month | 7.356(c) | 07/15/31 | 9,250 | 9,222,541 | ||||||||||||
See Notes to Financial Statements.
14
| Description | Interest Rate | Maturity Date | Principal Amount (000)# | Value | ||||||||||||
ASSET-BACKED SECURITIES (Continued) | ||||||||||||||||
Collateralized Loan Obligations (cont’d.) | ||||||||||||||||
Nassau Ltd. (United Kingdom), | ||||||||||||||||
Series 2022-01A, Class B, 144A, 3 Month SOFR + 3.620% | 8.934%(c) | 01/15/31 | 5,250 | $ | 5,252,005 | |||||||||||
Oaktree CLO Ltd. (Cayman Islands), | ||||||||||||||||
Series 2019-04A, Class BR, 144A, 3 Month SOFR + 1.962% | 7.279(c) | 10/20/32 | 9,500 | 9,541,751 | ||||||||||||
Ocean Trails CLO Ltd. (United Kingdom), | ||||||||||||||||
Series 2024-15A, Class B, 144A, 3 Month SOFR + 2.500% | 7.822(c) | 01/15/37 | 4,250 | 4,249,379 | ||||||||||||
OFSI BSL Ltd. (Cayman Islands), | ||||||||||||||||
Series 2023-12A, Class AJ, 144A, 3 Month SOFR + 2.900% | 8.218(c) | 01/20/35 | 3,200 | 3,218,593 | ||||||||||||
Series 2023-12A, Class B, 144A, 3 Month SOFR + 3.150% | 8.468(c) | 01/20/35 | 11,950 | 11,950,859 | ||||||||||||
Palmer Square Loan Funding Ltd. (Cayman Islands), | ||||||||||||||||
Series 2022-03A, Class A2, 144A, 3 Month SOFR + 3.000% | 8.314(c) | 04/15/31 | 7,000 | 7,002,724 | ||||||||||||
Rad CLO Ltd. (Cayman Islands), | ||||||||||||||||
Series 2023-19A, Class B, 144A, 3 Month SOFR + 2.650% | 7.968(c) | 04/20/35 | 18,900 | 18,944,549 | ||||||||||||
Silver Rock CLO Ltd. (Cayman Islands), | ||||||||||||||||
Series 2020-01A, Class BR, 144A, 3 Month SOFR + 2.900% | 2.953(c) | 10/20/33 | 12,500 | 12,504,627 | ||||||||||||
Sixth Street CLO Ltd. (Cayman Islands), | ||||||||||||||||
Series 2020-16A, Class BR, 144A, 3 Month SOFR + 2.450% | 7.783(c) | 01/20/37 | 17,200 | 17,242,979 | ||||||||||||
Sound Point CLO Ltd. (United Kingdom), | ||||||||||||||||
Series 2022-35A, Class B, 144A, 3 Month SOFR + 3.100% | 8.424(c) | 01/26/36 | 17,700 | 17,752,217 | ||||||||||||
Sound Point CLO Ltd. (Cayman Islands), | ||||||||||||||||
Series 2020-02A, Class DR, 144A, 3 Month SOFR + 3.612% | 8.936(c) | 10/25/34 | 1,500 | 1,447,053 | ||||||||||||
St. Pauls CLO (Netherlands), | ||||||||||||||||
Series 11A, Class C2R, 144A | 2.500 | 01/17/32 | EUR | 4,500 | 4,335,266 | |||||||||||
Symphony CLO Ltd. (Bermuda), | ||||||||||||||||
Series 2023-40A, Class B, 144A, 3 Month SOFR + 2.550% | 7.894(c) | 01/14/34 | 14,000 | 14,037,960 | ||||||||||||
Texas Debt Capital CLO Ltd. (Cayman Islands), | ||||||||||||||||
Series 2023-2A, Class B, 144A, 3 Month SOFR + 2.650% | 7.968(c) | 07/21/35 | 18,900 | 18,948,261 | ||||||||||||
See Notes to Financial Statements.
PGIM Floating Rate Income Fund 15
Schedule of Investments (continued)
as of February 29, 2024
| Description | Interest Rate | Maturity Date | Principal Amount (000)# | Value | ||||||||||||
ASSET-BACKED SECURITIES (Continued) | ||||||||||||||||
Collateralized Loan Obligations (cont’d.) | ||||||||||||||||
Tikehau US CLO Ltd. (Bermuda), | ||||||||||||||||
Series 2022-02A, Class BR, 144A, 3 Month SOFR + 2.750% | 8.068%(c) | 01/20/36 | 12,000 | $ | 12,035,494 | |||||||||||
Trinitas CLO Ltd. (Cayman Islands), | ||||||||||||||||
Series 2020-14A, Class B, 144A, 3 Month SOFR + 2.262% | 7.586(c) | 01/25/34 | 5,000 | 5,000,000 | ||||||||||||
Series 2021-15A, Class B1, 144A, 3 Month SOFR + 1.962% | 7.279(c) | 04/22/34 | 8,350 | 8,318,458 | ||||||||||||
Series 2022-20A, Class B, 144A, 3 Month SOFR + 2.460% | 7.778(c) | 07/20/35 | 10,000 | 9,991,789 | ||||||||||||
Valley Stream Park CLO Ltd. (United Kingdom), | ||||||||||||||||
Series 2022-01A, Class BR, 144A, 3 Month SOFR + 2.250% | 7.568(c) | 10/20/34 | 4,500 | 4,521,830 | ||||||||||||
Voya CLO Ltd. (Cayman Islands), | ||||||||||||||||
Series 2019-03A, Class BR, 144A, 3 Month SOFR + 1.912% | 7.228(c) | 10/17/32 | 8,650 | 8,662,914 | ||||||||||||
Zais CLO Ltd. (Cayman Islands), | ||||||||||||||||
Series 2015-03A, Class A2R, 144A, 3 Month SOFR + 2.452% | 7.766(c) | 07/15/31 | 1,500 | 1,498,795 | ||||||||||||
|
| |||||||||||||||
| 409,668,141 | ||||||||||||||||
Other 0.1% | ||||||||||||||||
Sierra Timeshare Receivables Funding LLC, | ||||||||||||||||
Series 2023-02A, Class D, 144A | 9.720 | 04/20/40 | 2,318 | 2,360,624 | ||||||||||||
|
| |||||||||||||||
TOTAL ASSET-BACKED SECURITIES | 412,028,765 | |||||||||||||||
|
| |||||||||||||||
CORPORATE BONDS 15.4% | ||||||||||||||||
Airlines 0.2% | ||||||||||||||||
Hawaiian Brand Intellectual Property | ||||||||||||||||
Ltd./HawaiianMiles Loyalty Ltd., | ||||||||||||||||
Sr. Sec’d. Notes, 144A | 5.750 | 01/20/26 | 110 | 103,813 | ||||||||||||
VistaJet Malta Finance PLC/Vista Management | ||||||||||||||||
Holding, Inc. (Switzerland), | ||||||||||||||||
Sr. Unsec’d. Notes, 144A | 6.375 | 02/01/30 | 375 | 273,750 | ||||||||||||
Sr. Unsec’d. Notes, 144A | 7.875 | 05/01/27 | 3,575 | 3,011,937 | ||||||||||||
|
| |||||||||||||||
| 3,389,500 | ||||||||||||||||
See Notes to Financial Statements.
16
| Description | Interest Rate | Maturity Date | Principal Amount (000)# | Value | ||||||||||||
CORPORATE BONDS (Continued) | ||||||||||||||||
Auto Parts & Equipment 0.0% | ||||||||||||||||
Dana, Inc., | ||||||||||||||||
Sr. Unsec’d. Notes | 4.500% | 02/15/32 | 830 | $ | 696,366 | |||||||||||
Banks 11.3% | ||||||||||||||||
Bank of America Corp., | ||||||||||||||||
Jr. Sub. Notes, Series MM(a) | 4.300(ff) | 01/28/25(oo) | 46,588 | 44,869,868 | ||||||||||||
Jr. Sub. Notes, Series RR | 4.375(ff) | 01/27/27(oo) | 5,384 | 4,976,327 | ||||||||||||
Citigroup, Inc., | ||||||||||||||||
Jr. Sub. Notes, Series AA(a) | 7.625(ff) | 11/15/28(oo) | 650 | 669,622 | ||||||||||||
Jr. Sub. Notes, Series U | 5.000(ff) | 09/12/24(oo) | 17,875 | 17,652,938 | ||||||||||||
Jr. Sub. Notes, Series V | 4.700(ff) | 01/30/25(oo) | 56,123 | 53,903,134 | ||||||||||||
Jr. Sub. Notes, Series X | 3.875(ff) | 02/18/26(oo) | 3,600 | 3,383,947 | ||||||||||||
Goldman Sachs Group, Inc. (The), | ||||||||||||||||
Jr. Sub. Notes, Series U | 3.650(ff) | 08/10/26(oo) | 3,000 | 2,723,793 | ||||||||||||
Jr. Sub. Notes, Series V | 4.125(ff) | 11/10/26(oo) | 20,058 | 18,359,053 | ||||||||||||
JPMorgan Chase & Co., | ||||||||||||||||
Jr. Sub. Notes, Series HH | 4.600(ff) | 02/01/25(oo) | 66,116 | 64,518,805 | ||||||||||||
Mitsubishi UFJ Financial Group, Inc. (Japan), | ||||||||||||||||
Jr. Sub. Notes, MTN | 8.200(ff) | 01/15/29(oo) | 500 | 536,875 | ||||||||||||
State Street Corp., | ||||||||||||||||
Jr. Sub. Notes, Series I | 6.700(ff) | 03/15/29(oo) | 2,045 | 2,042,616 | ||||||||||||
Sumitomo Mitsui Financial Group, Inc. (Japan), | ||||||||||||||||
Jr. Sub. Notes | 6.600(ff) | 06/05/34(oo) | 3,525 | 3,525,168 | ||||||||||||
Texas Capital Bank NA, | ||||||||||||||||
Sr. Unsec’d. Notes, 144A, 3 Month LIBOR + 4.500% | 10.092(c) | 09/30/24 | 2,669 | 2,654,433 | ||||||||||||
U.S. Bancorp, | ||||||||||||||||
Jr. Sub. Notes | 3.700(ff) | 01/15/27(oo) | 4,250 | 3,630,779 | ||||||||||||
Wells Fargo & Co., | ||||||||||||||||
Jr. Sub. Notes, Series BB(a) | 3.900(ff) | 03/15/26(oo) | 10,275 | 9,648,176 | ||||||||||||
|
| |||||||||||||||
| 233,095,534 | ||||||||||||||||
Building Materials 0.3% | ||||||||||||||||
Eco Material Technologies, Inc., | ||||||||||||||||
Sr. Sec’d. Notes, 144A | 7.875 | 01/31/27 | 2,695 | 2,698,950 | ||||||||||||
Smyrna Ready Mix Concrete LLC, | ||||||||||||||||
Sr. Sec’d. Notes, 144A | 6.000 | 11/01/28 | 2,603 | 2,531,618 | ||||||||||||
|
| |||||||||||||||
| 5,230,568 | ||||||||||||||||
See Notes to Financial Statements.
PGIM Floating Rate Income Fund 17
Schedule of Investments (continued)
as of February 29, 2024
| Description | Interest Rate | Maturity Date | Principal Amount (000)# | Value | ||||||||||||
CORPORATE BONDS (Continued) | ||||||||||||||||
Chemicals 0.1% | ||||||||||||||||
Chemours Co. (The), | ||||||||||||||||
Gtd. Notes, 144A(a) | 4.625% | 11/15/29 | 2,250 | $ | 1,850,468 | |||||||||||
Tronox, Inc., | ||||||||||||||||
Gtd. Notes, 144A | 4.625 | 03/15/29 | 175 | 154,968 | ||||||||||||
|
| |||||||||||||||
| 2,005,436 | ||||||||||||||||
Commercial Services 0.2% | ||||||||||||||||
Adtalem Global Education, Inc., | ||||||||||||||||
Sr. Sec’d. Notes, 144A | 5.500 | 03/01/28 | 1,846 | 1,756,738 | ||||||||||||
Allied Universal Holdco LLC/Allied Universal Finance Corp., | ||||||||||||||||
Sr. Unsec’d. Notes, 144A | 6.000 | 06/01/29 | 400 | 331,332 | ||||||||||||
Hertz Corp. (The), | ||||||||||||||||
Gtd. Notes, 144A(a) | 5.000 | 12/01/29 | 1,475 | 1,131,020 | ||||||||||||
|
| |||||||||||||||
| 3,219,090 | ||||||||||||||||
Electric 0.9% | ||||||||||||||||
Calpine Corp., | ||||||||||||||||
Sr. Unsec’d. Notes, 144A | 4.625 | 02/01/29 | 5,925 | 5,449,637 | ||||||||||||
Vistra Corp., | ||||||||||||||||
Jr. Sub. Notes, 144A | 7.000(ff) | 12/15/26(oo) | 7,375 | 7,133,280 | ||||||||||||
Jr. Sub. Notes, 144A | 8.000(ff) | 10/15/26(oo) | 5,225 | 5,225,254 | ||||||||||||
|
| |||||||||||||||
| 17,808,171 | ||||||||||||||||
Home Builders 0.2% | ||||||||||||||||
Ashton Woods USA LLC/Ashton Woods Finance Co., | ||||||||||||||||
Sr. Unsec’d. Notes, 144A | 4.625 | 04/01/30 | 835 | 752,066 | ||||||||||||
Brookfield Residential Properties, Inc./Brookfield | ||||||||||||||||
Residential US LLC (Canada), | ||||||||||||||||
Gtd. Notes, 144A | 4.875 | 02/15/30 | 4,200 | 3,713,934 | ||||||||||||
|
| |||||||||||||||
| 4,466,000 | ||||||||||||||||
Housewares 0.1% | ||||||||||||||||
Scotts Miracle-Gro Co. (The), | ||||||||||||||||
Gtd. Notes | 4.375 | 02/01/32 | 500 | 418,687 | ||||||||||||
SWF Escrow Issuer Corp., | ||||||||||||||||
Sr. Unsec’d. Notes, 144A | 6.500 | 10/01/29 | 2,550 | 1,796,359 | ||||||||||||
|
| |||||||||||||||
| 2,215,046 | ||||||||||||||||
See Notes to Financial Statements.
18
| Description | Interest Rate | Maturity Date | Principal Amount (000)# | Value | ||||||||||||
CORPORATE BONDS (Continued) | ||||||||||||||||
Internet 0.2% | ||||||||||||||||
United Group BV (Slovenia), | ||||||||||||||||
Sr. Sec’d. Notes, 144A, 3 Month EURIBOR + 4.250% (Cap N/A, Floor 4.250%) | 8.128 | %(c) | 02/01/29 | EUR | 4,000 | $ | 4,333,835 | |||||||||
Media 0.4% | ||||||||||||||||
CSC Holdings LLC, | ||||||||||||||||
Sr. Unsec’d. Notes, 144A | 4.625 | 12/01/30 | 700 | 389,845 | ||||||||||||
Sr. Unsec’d. Notes, 144A | 5.000 | 11/15/31 | 2,157 | 1,187,632 | ||||||||||||
Sr. Unsec’d. Notes, 144A | 5.750 | 01/15/30 | 200 | 117,568 | ||||||||||||
Diamond Sports Group LLC/Diamond Sports Finance Co., | ||||||||||||||||
Gtd. Notes, 144A (original cost $2,461,154; purchased 02/19/20 - 09/25/20)(f) | 6.625 | 08/15/27(d) | 3,075 | 179,724 | ||||||||||||
Sec’d. Notes, 144A (original cost $1,839,782; purchased 01/14/21 - 01/26/21)(f) | 5.375 | 08/15/26(d) | 2,080 | 123,625 | ||||||||||||
DISH DBS Corp., | ||||||||||||||||
Gtd. Notes | 7.750 | 07/01/26 | 1,000 | 628,925 | ||||||||||||
DISH Network Corp., | ||||||||||||||||
Sr. Sec’d. Notes, 144A | 11.750 | 11/15/27 | 2,800 | 2,921,005 | ||||||||||||
Sinclair Television Group, Inc., | ||||||||||||||||
Sr. Sec’d. Notes, 144A | 4.125 | 12/01/30 | 3,000 | 2,160,740 | ||||||||||||
|
| |||||||||||||||
| 7,709,064 | ||||||||||||||||
Oil & Gas 0.6% | ||||||||||||||||
Alta Mesa Holdings LP/Alta Mesa Finance Services Corp., | ||||||||||||||||
Gtd. Notes | 7.875 | 12/15/24(d) | 6,725 | 672 | ||||||||||||
Hilcorp Energy I LP/Hilcorp Finance Co., | ||||||||||||||||
Sr. Unsec’d. Notes, 144A | 6.000 | 04/15/30 | 2,775 | 2,698,112 | ||||||||||||
Sr. Unsec’d. Notes, 144A | 6.250 | 04/15/32 | 3,750 | 3,645,896 | ||||||||||||
Nabors Industries, Inc., | ||||||||||||||||
Gtd. Notes, 144A | 7.375 | 05/15/27 | 2,630 | 2,619,629 | ||||||||||||
SilverBow Resources, Inc., | ||||||||||||||||
Sec’d. Notes, 144A, 3 Month SOFR + 7.750% | 13.135 | (c) | 12/15/28 | 2,920 | 2,883,828 | |||||||||||
|
| |||||||||||||||
| 11,848,137 | ||||||||||||||||
Packaging & Containers 0.1% | ||||||||||||||||
Intelligent Packaging Ltd. Finco, Inc./Intelligent Packaging Ltd. Co-Issuer LLC (Canada), | ||||||||||||||||
Sr. Sec’d. Notes, 144A | 6.000 | 09/15/28 | 3,250 | 3,017,690 | ||||||||||||
See Notes to Financial Statements.
PGIM Floating Rate Income Fund 19
Schedule of Investments (continued)
as of February 29, 2024
| Description | Interest Rate | Maturity Date | Principal Amount (000)# | Value | ||||||||||||
CORPORATE BONDS (Continued) | ||||||||||||||||
Real Estate 0.1% | ||||||||||||||||
Howard Hughes Corp. (The), | ||||||||||||||||
Gtd. Notes, 144A | 4.375 | % | 02/01/31 | 1,745 | $ | 1,491,128 | ||||||||||
Hunt Cos., Inc., | ||||||||||||||||
Sr. Sec’d. Notes, 144A | 5.250 | 04/15/29 | 1,025 | 938,223 | ||||||||||||
|
| |||||||||||||||
| 2,429,351 | ||||||||||||||||
Real Estate Investment Trusts (REITs) 0.3% | ||||||||||||||||
Diversified Healthcare Trust, | ||||||||||||||||
Gtd. Notes | 4.375 | 03/01/31 | 7,519 | 5,706,763 | ||||||||||||
Gtd. Notes | 9.750 | 06/15/25 | 126 | 125,488 | ||||||||||||
Sr. Unsec’d. Notes | 4.750 | 02/15/28 | 1,275 | 1,015,788 | ||||||||||||
|
| |||||||||||||||
| 6,848,039 | ||||||||||||||||
Retail 0.1% | ||||||||||||||||
Gap, Inc. (The), | ||||||||||||||||
Gtd. Notes, 144A | 3.875 | 10/01/31 | 2,195 | 1,766,850 | ||||||||||||
Telecommunications 0.3% | ||||||||||||||||
Digicel Group Holdings Ltd. (Jamaica), | ||||||||||||||||
Sr. Sec’d. Notes, Series 1A14, 144A (original cost $45,030; purchased 11/14/23)^(f) | 0.000 | 12/31/30 | 40 | 45,031 | ||||||||||||
Sr. Sec’d. Notes, Series 1B14, 144A (original cost $17; purchased 11/14/23)^(f) | 0.000 | 12/31/30 | 170 | — | ||||||||||||
Sr. Sec’d. Notes, Series 3A14, 144A (original cost $4,612; purchased 11/14/23)^(f) | 0.000 | 12/31/30 | 2 | 4,612 | ||||||||||||
Sr. Sec’d. Notes, Series 3B14, 144A (original cost $20; purchased 11/14/23)^(f) | 0.000 | 12/31/30 | 198 | — | ||||||||||||
Digicel Intermediate Holdings Ltd./Digicel International Finance Ltd./DIFL US LLC (Jamaica), | ||||||||||||||||
Sr. Sec’d. Notes, Cash coupon 9.000% and PIK 1.500% (original cost $2,835,005; purchased 01/29/24 - 02/13/24)(f) | 12.000 | 05/25/27 | 3,070 | 3,008,144 | ||||||||||||
Digicel MidCo Ltd./DIFL US II LLC (Jamaica), | ||||||||||||||||
Sr. Unsec’d. Notes, PIK 10.500% (original cost $540,210; purchased 01/30/24)(f) | 10.500 | 11/25/28 | 837 | 669,569 | ||||||||||||
Level 3 Financing, Inc., | ||||||||||||||||
Gtd. Notes, 144A | 3.750 | 07/15/29 | 1,000 | 585,000 | ||||||||||||
Gtd. Notes, 144A | 4.250 | 07/01/28 | 325 | 199,875 | ||||||||||||
Gtd. Notes, 144A | 4.625 | 09/15/27 | 150 | 96,750 | ||||||||||||
See Notes to Financial Statements.
20
| Description | Interest Rate | Maturity Date | Principal Amount (000)# | Value | ||||||||||||
CORPORATE BONDS (Continued) | ||||||||||||||||
Telecommunications (cont’d.) | ||||||||||||||||
Level 3 Financing, Inc., (cont’d.) | ||||||||||||||||
Sr. Sec’d. Notes, 144A | 3.400 | % | 03/01/27 | 375 | $ | 382,500 | ||||||||||
Sr. Sec’d. Notes, 144A | 10.500 | 05/15/30 | 498 | 512,463 | ||||||||||||
|
| |||||||||||||||
| 5,503,944 | ||||||||||||||||
|
| |||||||||||||||
TOTAL CORPORATE BONDS | ||||||||||||||||
(cost $335,055,551) | 315,582,621 | |||||||||||||||
|
| |||||||||||||||
FLOATING RATE AND OTHER LOANS 61.7% | ||||||||||||||||
Advertising 0.4% | ||||||||||||||||
Summer BC Holdco B Sarl (Luxembourg), | ||||||||||||||||
Term Loan, 1 Month SOFR + 3.500% (Cap N/A, Floor 0.000%)^ | 5.000 | (c) | 02/12/29 | 2,250 | 2,233,125 | |||||||||||
Terrier Media Buyer, Inc., | ||||||||||||||||
2021 Refinancing Term B Loan, 3 Month SOFR + 3.600% | 8.948 | (c) | 12/17/26 | 8,041 | 6,782,274 | |||||||||||
|
| |||||||||||||||
| 9,015,399 | ||||||||||||||||
Aerospace & Defense 0.4% | ||||||||||||||||
TransDigm, Inc., | ||||||||||||||||
Tranche I Term Loan, 3 Month SOFR + 3.250% | 8.598 | (c) | 08/24/28 | 4,069 | 4,075,708 | |||||||||||
Tranche J Term Loan, 3 Month SOFR + 3.250% | 8.598 | (c) | 02/28/31 | 3,350 | 3,360,887 | |||||||||||
|
| |||||||||||||||
| 7,436,595 | ||||||||||||||||
Agriculture 0.3% | ||||||||||||||||
Alltech, Inc., | ||||||||||||||||
Term A Loan, 1 Month SOFR + 3.600%^ | 8.926 | (c) | 10/15/26 | 2,103 | 2,055,837 | |||||||||||
Term B Loan, 1 Month SOFR + 4.114% | 9.441 | (c) | 10/13/28 | 3,368 | 3,338,135 | |||||||||||
|
| |||||||||||||||
| 5,393,972 | ||||||||||||||||
Airlines 2.1% | ||||||||||||||||
Air Canada (Canada), | ||||||||||||||||
Term Loan, 1 Month SOFR + 3.614% | 8.935 | (c) | 08/11/28 | 5,767 | 5,766,673 | |||||||||||
American Airlines, Inc., | ||||||||||||||||
Initial Term Loan, 3 Month SOFR + 3.500% | 8.869 | (c) | 06/04/29 | 5,542 | 5,535,073 | |||||||||||
Initial Term Loan, 3 Month SOFR + 5.012% | 10.329 | (c) | 04/20/28 | 12,746 | 13,170,373 | |||||||||||
See Notes to Financial Statements.
PGIM Floating Rate Income Fund 21
Schedule of Investments (continued)
as of February 29, 2024
| Description | Interest Rate | Maturity Date | Principal (000)# | Value | ||||||||||||
FLOATING RATE AND OTHER LOANS (Continued) | ||||||||||||||||
Airlines (cont’d.) | ||||||||||||||||
Mileage Plus Holdings LLC, | ||||||||||||||||
Initial Term Loan, 3 Month SOFR + 5.400% | 10.770 | %(c) | 06/21/27 | 5,252 | $ | 5,404,937 | ||||||||||
United Airlines, Inc., | ||||||||||||||||
Class B Term Loan, 3 Month SOFR + 2.750% | 8.076 | (c) | 02/22/31 | 12,375 | 12,371,139 | |||||||||||
|
| |||||||||||||||
| 42,248,195 | ||||||||||||||||
Apparel 0.2% | ||||||||||||||||
Fanatics Commerce Intermediate Holdco LLC, | ||||||||||||||||
Initial Term Loan, 1 Month SOFR + 3.364% | 8.691 | (c) | 11/24/28 | 3,233 | 3,219,506 | |||||||||||
Auto Parts & Equipment 1.4% | ||||||||||||||||
Adient US LLC, | ||||||||||||||||
Term Loan B-2, 1 Month SOFR + 2.750% | 8.076 | (c) | 01/31/31 | 3,560 | 3,563,015 | |||||||||||
Dexko Global, Inc., | ||||||||||||||||
2023 Incremental Term Loan, 3 Month SOFR + 4.250% | 9.598 | (c) | 10/04/28 | 2,775 | 2,775,000 | |||||||||||
First Brands Group LLC, | ||||||||||||||||
2022-Ii Incremental Term Loan, 3 Month SOFR + 5.000% | 10.313 | (c) | 03/30/27 | 5,599 | 5,585,347 | |||||||||||
First Lien 2021 Term Loan, 3 Month SOFR + 5.262% | 10.574 | (c) | 03/30/27 | 5,305 | 5,311,176 | |||||||||||
RealTruck Group, Inc., | ||||||||||||||||
Initial Term Loan, 1 Month SOFR + 3.614% | 8.941 | (c) | 01/31/28 | 1,499 | 1,469,954 | |||||||||||
Tenneco, Inc., | ||||||||||||||||
Term A Loan, 3 Month SOFR + 4.850% | 10.169 | (c) | 11/17/28 | 1,966 | 1,835,561 | |||||||||||
Term B Loan, 3 Month SOFR + 5.100% | 10.434 | (c) | 11/17/28 | 8,747 | 8,230,832 | |||||||||||
|
| |||||||||||||||
| 28,770,885 | ||||||||||||||||
Banks 0.1% | ||||||||||||||||
Walker & Dunlop, Inc., | ||||||||||||||||
Incremental Term B Loan, 1 Month SOFR + 3.100%^ | 8.426 | (c) | 12/16/28 | 2,332 | 2,326,544 | |||||||||||
Beverages 0.3% | ||||||||||||||||
City Brewing Co. LLC, | ||||||||||||||||
First Lien Closing Date Term Loan, 3 Month SOFR + 3.762% | 9.078 | (c) | 04/05/28 | 9,090 | 6,946,268 | |||||||||||
See Notes to Financial Statements.
22
| Description | Interest Rate | Maturity Date | Principal (000)# | Value | ||||||||||||
FLOATING RATE AND OTHER LOANS (Continued) | ||||||||||||||||
Building Materials 1.4% | ||||||||||||||||
Cornerstone Building Brands, Inc., | ||||||||||||||||
Term Loan, 1 Month SOFR + 5.625% | 10.943 | %(c) | 08/01/28 | 8,584 | $ | 8,669,772 | ||||||||||
CP Atlas Buyer, Inc., | ||||||||||||||||
Term B Loan, 1 Month SOFR + 3.850% | 9.176 | (c) | 11/23/27 | 3,688 | 3,632,616 | |||||||||||
Emerald Borrower LP, | ||||||||||||||||
Initial Term B Loan, 3 Month SOFR + 3.000% | 7.790 | (c) | 05/31/30 | 7,647 | 7,623,592 | |||||||||||
Hunter Douglas, Inc. (Netherlands), | ||||||||||||||||
Tranche B-1 Term Loan, 3 Month SOFR + 3.500% | 8.869 | (c) | 02/26/29 | 2,289 | 2,259,370 | |||||||||||
Smyrna Ready Mix Concrete LLC, | ||||||||||||||||
New Term Loan B, 1 Month SOFR + 3.500%^ | 8.820 | (c) | 04/02/29 | 1,461 | 1,463,163 | |||||||||||
Vector WP HoldCo, Inc., | ||||||||||||||||
Initial Term B Loan, 1 Month SOFR + 5.114%^ | 10.441 | (c) | 10/12/28 | 4,181 | 4,181,437 | |||||||||||
Watlow Electric Manufacturing Co., | ||||||||||||||||
Term Loan B, 3 Month SOFR + 4.012% | 9.329 | (c) | 03/02/28 | 1,350 | 1,349,544 | |||||||||||
|
| |||||||||||||||
| 29,179,494 | ||||||||||||||||
Chemicals 3.4% | ||||||||||||||||
Ascend Performance Materials Operations LLC, | ||||||||||||||||
2021 Refinancing Term Loan, 6 Month SOFR + 4.850% | 10.317 | (c) | 08/27/26 | 5,740 | 5,569,721 | |||||||||||
Chemours Company (The), | ||||||||||||||||
Term Loan, 1 Month SOFR + 3.500% | 8.826 | (c) | 08/18/28 | 4,250 | 4,165,000 | |||||||||||
Consolidated Energy Finance SA (Switzerland), | ||||||||||||||||
2024 Incremental Term Loan, 1 Month SOFR + 4.500% | 9.817 | (c) | 11/15/30 | 5,000 | 4,843,750 | |||||||||||
Geon Performance Solutions LLC, | ||||||||||||||||
Initial Term Loan, 3 Month SOFR + 5.012%^ | 10.360 | (c) | 08/18/28 | 4,400 | 4,312,335 | |||||||||||
INEOS US Finance LLC (Luxembourg), | ||||||||||||||||
2030 Dollar Term Loan, 1 Month SOFR + 3.600% | 8.926 | (c) | 02/18/30 | 2,114 | 2,093,671 | |||||||||||
Ineos US Petrochem LLC, | ||||||||||||||||
2030 Tranche B Dollar Term Loan, 1 Month SOFR + 3.850% | 9.176 | (c) | 03/14/30 | 2,587 | 2,582,149 | |||||||||||
New Term Loan B, 1 Month SOFR + 4.350%^ | 9.676 | (c) | 04/02/29 | 1,849 | 1,842,369 | |||||||||||
Iris Holdings Ltd., | ||||||||||||||||
Initial Term Loan, 3 Month SOFR + 4.850% | 10.163 | (c) | 06/28/28 | 5,524 | 5,218,025 | |||||||||||
LSF11 A5 HoldCo, LLC, | ||||||||||||||||
Incremental Term Loan, 1 Month SOFR + 4.350% | 9.676 | (c) | 10/15/28 | 12,612 | 12,573,790 | |||||||||||
Nouryon USA LLC, | ||||||||||||||||
2023 Term Loan, 1 Month SOFR + 4.100% | 9.424 | (c) | 04/03/28 | 3,104 | 3,101,488 | |||||||||||
Extended Dollar Term Loan, 3 Month SOFR + 4.100% | 9.419 | (c) | 04/03/28 | 6,883 | 6,876,974 | |||||||||||
See Notes to Financial Statements.
PGIM Floating Rate Income Fund 23
Schedule of Investments (continued)
as of February 29, 2024
| Description | Interest Rate | Maturity Date | Principal (000)# | Value | ||||||||||||
FLOATING RATE AND OTHER LOANS (Continued) | ||||||||||||||||
Chemicals (cont’d.) | ||||||||||||||||
Olympus Water US Holding Corp., | ||||||||||||||||
Term B-4 Loan, 3 Month SOFR + 4.250% | 9.566 | %(c) | 11/09/28 | 4,589 | $ | 4,590,959 | ||||||||||
Schweitzer-Mauduit International, Inc., | ||||||||||||||||
Term B Loan, 1 Month SOFR + 3.864% | 9.191 | (c) | 04/20/28 | 657 | 656,190 | |||||||||||
SK Nepture Husky Group (Luxembourg), | ||||||||||||||||
Initial Term Loan | 10.434 | 01/03/29(d) | 6,859 | 2,383,634 | ||||||||||||
Vantage Specialty Chemicals, Inc., | ||||||||||||||||
First Lien 2023 Other Term Loan, 3 Month SOFR + 4.750% | 10.068 | (c) | 10/26/26 | 4,505 | 4,408,779 | |||||||||||
Venator Finance Sarl, | ||||||||||||||||
Initial First-Out Term Loan, 3 Month SOFR + 10.000%^ | 15.314 | (c) | 12/31/25 | 1,549 | 1,471,825 | |||||||||||
Term Loan, 3 Month SOFR + 10.000%^ | 15.326 | (c) | 10/12/28 | 3,895 | 3,856,202 | |||||||||||
|
| |||||||||||||||
| 70,546,861 | ||||||||||||||||
Commercial Services 6.2% | ||||||||||||||||
Albion Financing Sarl, | ||||||||||||||||
2023 Incremental USD Term Loan, 3 Month SOFR + 5.500% | 10.824 | (c) | 08/17/26 | 3,995 | 4,004,800 | |||||||||||
Allied Universal Holdco LLC, | ||||||||||||||||
Term Loan USD, 1 Month SOFR + 3.850% | 9.176 | (c) | 05/12/28 | 6,092 | 6,062,238 | |||||||||||
Amentum Government Services Holdings LLC, | ||||||||||||||||
Tranche 3 Term Loan, 1 Month SOFR + 4.000% | 9.320 | (c) | 02/15/29 | 5,579 | 5,574,113 | |||||||||||
ArchKey Holdings, Inc., | ||||||||||||||||
First Lien Initial Term Loan, 1 Month SOFR + 5.364%^ | 10.691 | (c) | 06/29/28 | 6,215 | 6,199,867 | |||||||||||
Boost Newco Borrower LLC, | ||||||||||||||||
Initial USD Term Loan, 1 Month SOFR + 3.000% | 8.326 | (c) | 01/31/31 | 8,820 | 8,840,471 | |||||||||||
Cimpress PLC, | ||||||||||||||||
Tranche B-1 Term Loan, 1 Month SOFR + 3.614% | 8.941 | (c) | 05/17/28 | 1,528 | 1,521,877 | |||||||||||
CoreLogic, Inc., | ||||||||||||||||
First Lien Initial Term Loan, 1 Month SOFR + 3.614% | 8.941 | (c) | 06/02/28 | 13,547 | 13,154,771 | |||||||||||
DS Parent, Inc., | ||||||||||||||||
Term B Loan, 2 Month SOFR + 5.500%^ | 10.813 | (c) | 01/31/31 | 1,325 | 1,298,500 | |||||||||||
Fly Funding II Sarl (Luxembourg), | ||||||||||||||||
Term Loan B, 3 Month LIBOR + 1.750% | 7.330 | (c) | 08/11/25 | 10,162 | 9,765,945 | |||||||||||
Garda World Security Corp. (Canada), | ||||||||||||||||
Fourth Additional Term Loan, 3 Month SOFR + 4.250% | 9.625 | (c) | 02/01/29 | 700 | 699,000 | |||||||||||
See Notes to Financial Statements.
24
| Description | Interest Rate | Maturity Date | Principal (000)# | Value | ||||||||||||
FLOATING RATE AND OTHER LOANS (Continued) | ||||||||||||||||
Commercial Services (cont’d.) | ||||||||||||||||
Hertz Corp. (The), | ||||||||||||||||
2023 Incremental Term Loan, 1 Month SOFR + 3.750% | 9.070 | %(c) | 06/30/28 | 400 | $ | 384,833 | ||||||||||
Term Loan, 1 Month LIBOR + 3.250% | 8.697 | (c) | 06/30/28 | 5,950 | 5,700,765 | |||||||||||
Term Loan, 3 Month LIBOR + 3.250% | 8.697 | (c) | 06/30/28 | 1,150 | 1,101,204 | |||||||||||
Indy US Holdco LLC, | ||||||||||||||||
Fifth Amendment Incremental Term Loan, 1 Month SOFR + 6.250% | 11.576 | (c) | 03/06/28 | 9,597 | 9,453,083 | |||||||||||
Inmar, Inc., | ||||||||||||||||
Term Loan, 1 Month SOFR + 5.500% | 10.837 | (c) | 05/01/26 | 2,000 | 1,984,166 | |||||||||||
Kingpin Intermediate Holdings LLC, | ||||||||||||||||
Amendment No. 8 Term Loan, 1 Month SOFR + 3.500% | 8.826 | (c) | 02/08/28 | 3,468 | 3,454,118 | |||||||||||
Kuehg Corp., | ||||||||||||||||
Initial Term Loan, 3 Month SOFR + 5.000% | 10.348 | (c) | 06/12/30 | 5,749 | 5,756,451 | |||||||||||
Latham Pool Products, Inc., | ||||||||||||||||
Initial Term Loan, 1 Month SOFR + 4.100% | 9.421 | (c) | 02/23/29 | 9,232 | 9,024,073 | |||||||||||
Learning Care Group (US) No. 2, Inc., | ||||||||||||||||
Initial Term Loan, 3 Month SOFR + 4.750% | 10.080 | (c) | 08/11/28 | 2,170 | 2,163,750 | |||||||||||
MPH Acquisition Holdings LLC, | ||||||||||||||||
Initial Term Loan, 3 Month SOFR + 4.512% | 9.855 | (c) | 09/01/28 | 6,268 | 6,060,232 | |||||||||||
Omnia Partners LLC, | ||||||||||||||||
Repriced Term Loan, 3 Month SOFR + 3.750% | 9.074 | (c) | 07/25/30 | 4,700 | 4,709,790 | |||||||||||
Ryan LLC, | ||||||||||||||||
Initial Term Loan, 1 Month SOFR + 4.500% | 9.826 | (c) | 11/14/30 | 1,832 | 1,836,723 | |||||||||||
Spectrum Group Buyer, Inc., | ||||||||||||||||
Term Loan B, 3 Month SOFR + 6.500% | 11.813 | (c) | 05/19/28 | 2,031 | 1,636,794 | |||||||||||
URSA Minor US Bidco LLC, | ||||||||||||||||
Term Loan | — | (p) | 04/30/31 | 3,625 | 3,596,797 | |||||||||||
Vestis, | ||||||||||||||||
Term Loan | — | (p) | 03/31/31 | 1,950 | 1,950,000 | |||||||||||
VT Topco, Inc., | ||||||||||||||||
Initial Term Loan, 1 Month SOFR + 4.250% | 9.576 | (c) | 08/09/30 | 2,100 | 2,105,053 | |||||||||||
Wand Newco 3, Inc., | ||||||||||||||||
Term Loan, 1 Month SOFR + 3.750% | 9.076 | (c) | 01/30/31 | 5,900 | 5,905,534 | |||||||||||
WMB Holdings, Inc., | ||||||||||||||||
Tranche B USD Term Loan, 1 Month SOFR + 2.750% | 8.076 | (c) | 11/02/29 | 4,014 | 4,011,658 | |||||||||||
|
| |||||||||||||||
| 127,956,606 | ||||||||||||||||
See Notes to Financial Statements.
PGIM Floating Rate Income Fund 25
Schedule of Investments (continued)
as of February 29, 2024
| Description | Interest Rate | Maturity Date | Principal (000)# | Value | ||||||||||||
FLOATING RATE AND OTHER LOANS (Continued) | ||||||||||||||||
Computers 2.6% | ||||||||||||||||
ConvergeOne Holdings Corp., | ||||||||||||||||
First Lien Initial Term Loan, PRIME + 4.000% | 12.500 | %(c) | 01/04/26 | 12,492 | $ | 5,660,297 | ||||||||||
McAfee Corp., | ||||||||||||||||
Tranche B-1 Term Loan, 1 Month SOFR + 3.850% | 9.178 | (c) | 03/01/29 | 10,274 | 10,204,732 | |||||||||||
NCR Atleos LLC, | ||||||||||||||||
Term B Loan, 1 Month SOFR + 4.850% | 10.166 | (c) | 03/27/29 | 8,400 | 8,400,000 | |||||||||||
Peraton Corp., | ||||||||||||||||
First Lien Term B Loan, 1 Month SOFR + 3.850% | 9.176 | (c) | 02/01/28 | 9,180 | 9,178,268 | |||||||||||
Redstone Holdco 2 LP, | ||||||||||||||||
First Lien Initial Term Loan, 1 Month SOFR + 4.864% | 10.191 | (c) | 04/27/28 | 4,656 | 3,843,899 | |||||||||||
Sandvine Corp. (Canada), | ||||||||||||||||
Initial Term Loan (First Lien), 1 Month SOFR + 4.614%^ | 9.941 | (c) | 10/31/25 | 7,731 | 6,107,842 | |||||||||||
SonicWall US Holdings, Inc., | ||||||||||||||||
2023 Term Loan, 3 Month SOFR + 5.000% | 10.360 | (c) | 05/18/28 | 3,050 | 2,994,719 | |||||||||||
VeriFone Systems, Inc., | ||||||||||||||||
First Lien Initial Term Loan, 3 Month SOFR + 4.262% | 9.585 | (c) | 08/20/25 | 8,219 | 7,240,531 | |||||||||||
|
| |||||||||||||||
| 53,630,288 | ||||||||||||||||
Cosmetics/Personal Care 0.6% | ||||||||||||||||
Rainbow UK Bidco, Ltd. (Luxembourg), | ||||||||||||||||
Facility B-3 Loan, SONIA + 4.500% | 9.689 | (c) | 02/23/29 | GBP | 9,275 | 11,459,041 | ||||||||||
Distribution/Wholesale 0.8% | ||||||||||||||||
AIP RD Buyer Corp., | ||||||||||||||||
2023 Incremental Term Loan, 1 Month SOFR + 5.000% | 10.326 | (c) | 12/22/28 | 731 | 731,782 | |||||||||||
Core & Main LP, | ||||||||||||||||
Tranche C Term Loan, 3 Month SOFR + 2.250% | 7.564 | (c) | 02/09/31 | 2,000 | 1,987,500 | |||||||||||
Fastlane Parent Co., Inc., | ||||||||||||||||
Term Loan B, 1 Month SOFR + 4.500% | 9.826 | (c) | 09/29/28 | 524 | 523,360 | |||||||||||
Gloves Buyer, Inc., | ||||||||||||||||
Amendment No. 5 First Lien Incremental Term Loan, 1 Month SOFR + 5.114% | 10.441 | (c) | 12/29/27 | 736 | 728,937 | |||||||||||
Term Loan | — | (p) | 12/29/27 | 1,700 | 1,687,250 | |||||||||||
Pearls Netherlands Bidco BV (Netherlands), | ||||||||||||||||
Term Loan, 3 Month SOFR + 3.750% | 9.063 | (c) | 02/26/29 | 1,000 | 988,750 | |||||||||||
See Notes to Financial Statements.
26
| Description | Interest Rate | Maturity Date | Principal Amount (000)# | Value | ||||||||||||
FLOATING RATE AND OTHER LOANS (Continued) | ||||||||||||||||
Distribution/Wholesale (cont’d.) | ||||||||||||||||
Quimper AB (Sweden), | ||||||||||||||||
New Facility B, 3 Month EURIBOR + 2.925% | 6.818 | %(c) | 02/16/26 | EUR | 4,500 | $ | 4,835,231 | |||||||||
Windsor Holdings III LLC, | ||||||||||||||||
Dollar Term B Loan, 1 Month SOFR + 4.500% | 9.824 | (c) | 08/01/30 | 5,523 | 5,525,608 | |||||||||||
|
| |||||||||||||||
| 17,008,418 | ||||||||||||||||
Diversified Financial Services 1.5% | ||||||||||||||||
Blackhawk Network Holdings, Inc., | ||||||||||||||||
Term Loan, 1 Month SOFR + 5.000% | 10.321 | (c) | 02/27/29 | 4,732 | 4,672,905 | |||||||||||
Castlelake Aviation Finance DAC, | ||||||||||||||||
2023 Incremental Term Loan, 3 Month SOFR + 2.750% | 8.135 | (c) | 10/22/27 | 3,206 | 3,205,822 | |||||||||||
Castlelake Aviation One, | ||||||||||||||||
Term Loan, 3 Month SOFR + 2.750% | 8.146 | (c) | 10/22/26 | 3,210 | 3,206,570 | |||||||||||
Hudson River Trading LLC, | ||||||||||||||||
Term Loan, 1 Month SOFR + 3.114% | 8.441 | (c) | 03/20/28 | 8,658 | 8,596,914 | |||||||||||
LHS Borrower LLC, | ||||||||||||||||
Initial Term Loan, 1 Month SOFR + 4.850% | 10.176 | (c) | 02/16/29 | 2,636 | 2,454,477 | |||||||||||
Nuvei Technologies Corp. (Canada), | ||||||||||||||||
Initial Term Loan, 1 Month SOFR + 3.000% | 8.392 | (c) | 12/19/30 | 6,575 | 6,571,712 | |||||||||||
VFH Parent LLC, | ||||||||||||||||
Initial Term Loan, 1 Month SOFR + 3.100% | 8.426 | (c) | 01/13/29 | 2,629 | 2,625,737 | |||||||||||
|
| |||||||||||||||
| 31,334,137 | ||||||||||||||||
Electric 0.8% | ||||||||||||||||
Discovery Energy Holding Corp., | ||||||||||||||||
Term Loan^ | — | (p) | 02/28/31 | 4,575 | 4,449,188 | |||||||||||
Generation Bridge Northeast LLC, | ||||||||||||||||
Term B Loan, 1 Month SOFR + 4.250% | 9.576 | (c) | 08/22/29 | 1,784 | 1,786,201 | |||||||||||
Heritage Power LLC, | ||||||||||||||||
Term Loan, 3 Month SOFR + 5.500% | 10.814 | (c) | 07/20/26 | 1,319 | 1,253,176 | |||||||||||
Lightstone HoldCo LLC, | ||||||||||||||||
Extended Term B Loan, 3 Month SOFR + 5.750% | 11.063 | (c) | 01/29/27 | 7,951 | 7,647,866 | |||||||||||
Extended Term C Loan, 3 Month SOFR + 5.750% | 11.063 | (c) | 01/29/27 | 450 | 432,515 | |||||||||||
|
| |||||||||||||||
| 15,568,946 | ||||||||||||||||
Electronics 0.8% | ||||||||||||||||
Coherent Corp., | ||||||||||||||||
Term Loan B, 1 Month SOFR + 2.864% | 8.191 | (c) | 07/02/29 | 8,408 | 8,395,381 | |||||||||||
See Notes to Financial Statements.
PGIM Floating Rate Income Fund 27
Schedule of Investments (continued)
as of February 29, 2024
| Description | Interest Rate | Maturity Date | Principal (000)# | Value | ||||||||||||
FLOATING RATE AND OTHER LOANS (Continued) | ||||||||||||||||
Electronics (cont’d.) | ||||||||||||||||
Ingram Micro, Inc., | ||||||||||||||||
Term B Loan, 3 Month SOFR + 3.262% | 8.610 | %(c) | 06/30/28 | 3,590 | $ | 3,585,961 | ||||||||||
Roper Industrial Products Investment Co., | ||||||||||||||||
Tranche B Dollar Term Loan, 3 Month SOFR + 4.000% | 9.348 | (c) | 11/22/29 | 1,985 | 1,990,980 | |||||||||||
TTM Technologies, Inc., | ||||||||||||||||
New Term B Loan, 1 Month SOFR + 2.750%^ | 8.078 | (c) | 05/30/30 | 2,059 | 2,050,905 | |||||||||||
|
| |||||||||||||||
| 16,023,227 | ||||||||||||||||
Engineering & Construction 0.6% | ||||||||||||||||
Aegion Corp., | ||||||||||||||||
New Initial Term Loan, 1 Month SOFR + 4.250% | 9.576 | (c) | 05/17/28 | 2,069 | 2,065,294 | |||||||||||
Brand Industrial Services, Inc., | ||||||||||||||||
Tranche B Term Loan, 3 Month SOFR + 5.500% | 10.806 | (c) | 08/01/30 | 698 | 699,268 | |||||||||||
Brown Group Holding LLC, | ||||||||||||||||
Term Loan, 1 Month SOFR + 2.750% | 8.176 | (c) | 06/07/28 | 7,107 | 7,077,548 | |||||||||||
Rockwood Service Corp., | ||||||||||||||||
Initial Term Loan, 1 Month SOFR + 4.364% | 9.691 | (c) | 01/23/27 | 2,213 | 2,215,337 | |||||||||||
|
| |||||||||||||||
| 12,057,447 | ||||||||||||||||
Entertainment 3.4% | ||||||||||||||||
Allen Media LLC, | ||||||||||||||||
Term B Loan, 3 Month SOFR + 5.650% | 10.998 | (c) | 02/10/27 | 14,266 | 12,475,481 | |||||||||||
AP Gaming I LLC, | ||||||||||||||||
Term B Loan, 1 Month SOFR + 4.000% | 9.076 | (c) | 02/15/29 | 4,269 | 4,263,940 | |||||||||||
Caesars Entertainment, Inc., | ||||||||||||||||
Incremental Term B-1 Loan, 3 Month SOFR + 2.750% | 8.040 | (c) | 02/06/31 | 9,925 | 9,902,252 | |||||||||||
Term B Loan, 3 Month SOFR + 3.350% | 8.663 | (c) | 02/06/30 | 7,880 | 7,877,941 | |||||||||||
Cinemark USA, Inc., | ||||||||||||||||
Term Loan, 3 Month SOFR + 3.750% | 9.085 | (c) | 05/24/30 | 6,349 | 6,350,071 | |||||||||||
Entain Holdings Gibraltar Ltd., | ||||||||||||||||
Facility B-2, 3 Month SOFR + 3.600% | 8.948 | (c) | 10/31/29 | 4,555 | 4,563,000 | |||||||||||
Flutter Entertainment PLC (Ireland), | ||||||||||||||||
Third Amendment 2028-B Term Loan, 3 Month SOFR + 3.515% | 8.863 | (c) | 07/22/28 | 490 | 490,987 | |||||||||||
Flutter Financing BV (Ireland), | ||||||||||||||||
Term B Loan, 3 Month SOFR + 2.350% | 7.698 | (c) | 11/25/30 | 2,425 | 2,411,735 | |||||||||||
Golden Entertainment, Inc., | ||||||||||||||||
Term B-1 Facility Term Loan, 1 Month SOFR + 2.850% | 8.176 | (c) | 05/28/30 | 4,106 | 4,097,900 | |||||||||||
See Notes to Financial Statements.
28
| Description | Interest Rate | Maturity Date | Principal (000)# | Value | ||||||||||||
FLOATING RATE AND OTHER LOANS (Continued) | ||||||||||||||||
Entertainment (cont’d.) | ||||||||||||||||
Great Canadian Gaming Co., | ||||||||||||||||
Term B Loan, 3 Month SOFR + 4.262% | 9.633 | %(c) | 11/01/26 | 4,734 | $ | 4,730,665 | ||||||||||
J&J Ventures Gaming LLC, | ||||||||||||||||
2023 Delayed Draw Term Loan (Montana), 1 Month SOFR + 4.364% | 9.691 | (c) | 04/26/28 | 6,800 | 6,638,500 | |||||||||||
Maverick Gaming LLC, | ||||||||||||||||
Term Loan B, 3 Month SOFR + 7.762% | 13.105 | (c) | 09/03/26 | 9,039 | 6,327,428 | |||||||||||
|
| |||||||||||||||
| 70,129,900 | ||||||||||||||||
Environmental Control 0.7% | ||||||||||||||||
Action Environmental Group, Inc. (The), | ||||||||||||||||
Initial Term Loan, 3 Month SOFR + 4.500%^ | 9.824 | (c) | 10/24/30 | 5,410 | 5,416,545 | |||||||||||
Covanta Holding Corp., | ||||||||||||||||
2023 Incremental Term B Loan, 1 Month SOFR + 2.500% | 8.068 | (c) | 11/30/28 | 3,178 | 3,164,177 | |||||||||||
2023 Incremental Term C Loan, 1 Month SOFR + 2.500% | 8.068 | (c) | 11/30/28 | 239 | 237,908 | |||||||||||
Initial Term B Loan, 1 Month SOFR + 2.500% | 7.826 | (c) | 11/30/28 | 2,255 | 2,243,035 | |||||||||||
Initial Term C Loan, 1 Month SOFR + 2.500% | 7.826 | (c) | 11/30/28 | 172 | 171,011 | |||||||||||
JFL-Tiger Acquisition Co., Inc., | ||||||||||||||||
Term Loan, 3 Month SOFR + 5.000% | 10.317 | (c) | 10/17/30 | 1,325 | 1,328,726 | |||||||||||
Madison IAQ LLC, | ||||||||||||||||
Initial Term Loan, 1 Month SOFR + 3.364% | 8.685 | (c) | 06/21/28 | 1,990 | 1,980,593 | |||||||||||
|
| |||||||||||||||
| 14,541,995 | ||||||||||||||||
Foods 0.4% | ||||||||||||||||
BCPE North Star U.S. Holdco, Inc., | ||||||||||||||||
First Lien Initial Term Loan, 1 Month SOFR + 4.114% | 9.441 | (c) | 06/09/28 | 6,493 | 6,038,648 | |||||||||||
Fiesta Purchaser, Inc., | ||||||||||||||||
Initial Term Loan, 2 Month SOFR + 4.000% | 9.318 | (c) | 01/31/31 | 2,725 | 2,720,744 | |||||||||||
|
| |||||||||||||||
| 8,759,392 | ||||||||||||||||
Healthcare-Products 0.3% | ||||||||||||||||
Medline Borrower LP, | ||||||||||||||||
Initial Dollar Term Loan, 1 Month SOFR + 3.114% | 8.441 | (c) | 10/23/28 | 5,742 | 5,740,069 | |||||||||||
Healthcare-Services 2.0% | ||||||||||||||||
Accelerated Health Systems LLC, | ||||||||||||||||
Initial Term B Loan, 3 Month SOFR + 4.400% | 9.748 | (c) | 02/15/29 | 11,361 | 8,477,917 | |||||||||||
See Notes to Financial Statements.
PGIM Floating Rate Income Fund 29
Schedule of Investments (continued)
as of February 29, 2024
| Description | Interest Rate | Maturity Date | Principal (000)# | Value | ||||||||||||
FLOATING RATE AND OTHER LOANS (Continued) | ||||||||||||||||
Healthcare-Services (cont’d.) | ||||||||||||||||
Charlotte Buyer, | ||||||||||||||||
Initial Term B Loan, 1 Month SOFR + 5.250% | 10.568 | %(c) | 02/11/28 | 4,159 | $ | 4,167,270 | ||||||||||
eResearch Technology, Inc., | ||||||||||||||||
First Lien Initial Term Loan, 1 Month SOFR + 4.614% | 9.941 | (c) | 02/04/27 | 2,993 | 2,994,227 | |||||||||||
Lifepoint Health, Inc., | ||||||||||||||||
Term Loan B, 3 Month SOFR + 5.762% | 11.087 | (c) | 11/16/28 | 2,485 | 2,485,813 | |||||||||||
Pacific Dental Services LLC, | ||||||||||||||||
Term Loan, 1 Month SOFR + 3.614% | 8.941 | (c) | 05/05/28 | 3,532 | 3,526,000 | |||||||||||
Phoenix Guarantor, Inc., | ||||||||||||||||
Tranche B-4 Term Loan, 1 Month SOFR + 3.250% | 8.576 | (c) | 02/21/31 | 8,190 | 8,092,529 | |||||||||||
Select Medical Corp., | ||||||||||||||||
Tranche B-1 Term loan, 1 Month SOFR + 3.000% | 8.326 | (c) | 03/06/27 | 4,752 | 4,743,615 | |||||||||||
Sound Inpatient Physicians, Inc., | ||||||||||||||||
First Lien 2021 Incremental Term Loan, 3 Month SOFR + 3.262%^ | 8.574 | (c) | 06/27/25 | 1,593 | 653,181 | |||||||||||
First Lien Initial Term Loan, 3 Month SOFR + 3.262%^ | 8.574 | (c) | 06/27/25 | 2,659 | 1,090,005 | |||||||||||
Second Lien Initial Loan, 3 Month SOFR + 7.012% | 12.324 | (c) | 06/26/26 | 12,776 | 511,057 | |||||||||||
Surgery Center Holdings, Inc., | ||||||||||||||||
New First Lien Term Loan, 1 Month SOFR + 3.500% | 8.820 | (c) | 12/19/30 | 3,725 | 3,730,502 | |||||||||||
|
| |||||||||||||||
| 40,472,116 | ||||||||||||||||
Holding Companies-Diversified 0.9% | ||||||||||||||||
Belfor Holdings, Inc., | ||||||||||||||||
Initial Tranche B-1 Term Loan, 1 Month SOFR + 3.750%^ | 9.076 | (c) | 11/01/30 | 7,725 | 7,734,656 | |||||||||||
Clue OpCo LLC, | ||||||||||||||||
Term B Loan, 1 Month SOFR + 4.500% | 9.826 | (c) | 12/19/30 | 11,843 | 11,473,229 | |||||||||||
|
| |||||||||||||||
| 19,207,885 | ||||||||||||||||
Home Furnishings 0.8% | ||||||||||||||||
Snap One Holdings Corp., | ||||||||||||||||
Initial Term Loan, 3 Month SOFR + 4.650% | 9.998 | (c) | 12/08/28 | 5,844 | 5,764,022 | |||||||||||
TGP Holdings III LLC, | ||||||||||||||||
First Lien Closing Date Term Loan, 1 Month SOFR + 3.350% | 8.676 | (c) | 06/29/28 | 5,279 | 4,906,159 | |||||||||||
See Notes to Financial Statements.
30
| Description | Interest Rate | Maturity Date | Principal (000)# | Value | ||||||||||||
FLOATING RATE AND OTHER LOANS (Continued) | ||||||||||||||||
Home Furnishings (cont’d.) | ||||||||||||||||
Weber-Stephen Products LLC, | ||||||||||||||||
2022 Incrementeal Term B Loan, 1 Month SOFR + 4.350% | 9.676 | %(c) | 10/30/27 | 4,102 | $ | 3,712,253 | ||||||||||
Initial Term B Loan, 1 Month SOFR + 3.364% | 8.691 | (c) | 10/30/27 | 2,265 | 2,050,275 | |||||||||||
|
| |||||||||||||||
| 16,432,709 | ||||||||||||||||
Housewares 0.3% | ||||||||||||||||
SWF Holdings I Corp., | ||||||||||||||||
Initial Term Loan, 1 Month SOFR + 4.114% | 9.441 | (c) | 10/06/28 | 6,214 | 5,603,028 | |||||||||||
Insurance 1.8% | ||||||||||||||||
Acrisure LLC, | ||||||||||||||||
First Lien 2021-2 Additional Term Loan, 1 Month LIBOR + 4.250% | 9.691 | (c) | 02/15/27 | 1,568 | 1,568,489 | |||||||||||
Term Loan B 2020, 1 Month LIBOR + 3.500% | 8.941 | (c) | 02/15/27 | 14,450 | 14,409,622 | |||||||||||
Assured Partners, Inc., | ||||||||||||||||
Term Loan | — | (p) | 03/31/31 | 1,481 | 1,480,016 | |||||||||||
Asurion LLC, | ||||||||||||||||
New B-04 Term Loan, 1 Month SOFR + 5.364% | 10.691 | (c) | 01/20/29 | 7,660 | 7,212,293 | |||||||||||
New B-09 Term Loan, 1 Month SOFR + 3.250% | 8.691 | (c) | 07/31/27 | 8,629 | 8,489,977 | |||||||||||
New B-10 Term Loan, 1 Month SOFR + 4.100% | 9.426 | (c) | 08/19/28 | 2,281 | 2,261,727 | |||||||||||
New B-11 Term Loan, 1 Month SOFR + 4.350% | 9.676 | (c) | 08/21/28 | 1,092 | 1,084,381 | |||||||||||
|
| |||||||||||||||
| 36,506,505 | ||||||||||||||||
Internet 0.5% | ||||||||||||||||
MH Sub I LLC, | ||||||||||||||||
2023 May New Term Loan, 1 Month SOFR + 4.250% | 9.576 | (c) | 05/03/28 | 11,013 | 10,828,946 | |||||||||||
Investment Companies 0.8% | ||||||||||||||||
EIG Management Co. LLC, | ||||||||||||||||
Initial Term Loan, 1 Month SOFR + 3.850%^ | 9.176 | (c) | 02/24/25 | 1,918 | 1,915,522 | |||||||||||
GIP Pilot Acquisition Partners LP, | ||||||||||||||||
Initial Term Loan, 3 Month SOFR + 3.000% | 8.327 | (c) | 10/04/30 | 4,200 | 4,196,501 | |||||||||||
Guardian US Holdco, | ||||||||||||||||
Initial Term Loan, 2 Month SOFR + 3.500% | 8.830 | (c) | 01/31/30 | 6,552 | 6,545,929 | |||||||||||
See Notes to Financial Statements.
PGIM Floating Rate Income Fund 31
Schedule of Investments (continued)
as of February 29, 2024
| Description | Interest Rate | Maturity Date | Principal (000)# | Value | ||||||||||||
FLOATING RATE AND OTHER LOANS (Continued) | ||||||||||||||||
Investment Companies (cont’d.) | ||||||||||||||||
Hurricane CleanCo Ltd. (United Kingdom), | ||||||||||||||||
Term Loan, 3 Month EURIBOR + 6.250%^ | 6.250 | %(c) | 10/31/29 | EUR | 2,000 | $ | 2,524,600 | |||||||||
WEC US Holdings Ltd., | ||||||||||||||||
Initial Term Loan, 1 Month SOFR + 2.750% | 8.076 | (c) | 01/27/31 | 1,850 | 1,843,063 | |||||||||||
|
| |||||||||||||||
| 17,025,615 | ||||||||||||||||
Iron/Steel 0.0% | ||||||||||||||||
Flame Newco LLC, | ||||||||||||||||
New Money Exit Term Loan, 1 Month SOFR + 6.100% | 11.426 | (c) | 06/30/28 | 852 | 801,588 | |||||||||||
Leisure Time 1.2% | ||||||||||||||||
Alterra Mountain Co., | ||||||||||||||||
Term Loan | — | (p) | 05/31/30 | 2,675 | 2,676,672 | |||||||||||
Amer Sports Co. (Finland), | ||||||||||||||||
Initial USD Term Loan, 3 Month SOFR + 3.250%^ | 8.576 | (c) | 02/17/31 | 2,525 | 2,525,000 | |||||||||||
Bombardier Recreational Products, Inc. (Canada), | ||||||||||||||||
2023 Replacement Term Loan, 1 Month SOFR + 2.750% | 8.076 | (c) | 12/13/29 | 10,865 | 10,865,387 | |||||||||||
2024 Extended Term Loan, 1 Month SOFR + 2.750% | 8.076 | (c) | 01/22/31 | 1,500 | 1,498,886 | |||||||||||
Fender Musical Instruments Corp., | ||||||||||||||||
Initial Term Loan, 1 Month SOFR + 4.100% | 9.421 | (c) | 12/01/28 | 3,974 | 3,821,642 | |||||||||||
Recess Holdings, Inc., | ||||||||||||||||
Initial Term Loan, 3 Month SOFR + 4.500%^ | 9.843 | (c) | 02/20/30 | 2,700 | 2,696,625 | |||||||||||
|
| |||||||||||||||
| 24,084,212 | ||||||||||||||||
Lodging 0.3% | ||||||||||||||||
Travel Leisure Co., | ||||||||||||||||
2023 Incremental Term Loan, 1 Month SOFR + 3.350% | 8.670 | (c) | 12/14/29 | 5,441 | 5,440,687 | |||||||||||
Machinery-Diversified 1.8% | ||||||||||||||||
CD&R Hydra Buyer, Inc., | ||||||||||||||||
Second Lien Initial Term Loan, 1 Month SOFR + 8.100% | 13.426 | (c) | 04/30/26 | 300 | 297,000 | |||||||||||
Chart Industries, Inc., | ||||||||||||||||
New Term Loan B, 1 Month SOFR + 3.350% | 8.674 | (c) | 03/15/30 | 8,591 | 8,599,558 | |||||||||||
CPM Holdings, Inc., | ||||||||||||||||
Initial Term Loan, 1 Month SOFR + 4.500% | 9.828 | (c) | 09/28/28 | 1,275 | 1,274,735 | |||||||||||
See Notes to Financial Statements.
32
| Description | Interest Rate | Maturity Date | Principal (000)# | Value | ||||||||||||
FLOATING RATE AND OTHER LOANS (Continued) | ||||||||||||||||
Machinery-Diversified (cont’d.) | ||||||||||||||||
DXP Enterprises, Inc., | ||||||||||||||||
Initial Term Loan, 6 Month SOFR + 4.850% | 10.291 | %(c) | 10/11/30 | 1,147 | $ | 1,144,257 | ||||||||||
Flint Group Packaging Inks North America | ||||||||||||||||
Holdings LLC (Luxembourg), | ||||||||||||||||
Facility B USD, 3 Month SOFR + 4.512% | 9.827 | (c) | 12/31/26 | 5,632 | 5,251,659 | |||||||||||
First Lien Facility B, 3 Month SOFR + 0.362% | 5.677 | (c) | 12/31/27 | 4,336 | 3,341,380 | |||||||||||
Second Lien Facility B, 3 Month SOFR + 0.362% | 5.677 | (c) | 12/31/27 | 5,877 | 685,708 | |||||||||||
Hyster-Yale Group, Inc., | ||||||||||||||||
Term Loan B Facility, 1 Month SOFR + 3.614% | 8.941 | (c) | 05/26/28 | 7,881 | 7,812,039 | |||||||||||
LSF12 Badger Bidco LLC, | ||||||||||||||||
Initial Term Loan, 1 Month SOFR + 6.000% | 11.326 | (c) | 08/30/30 | 2,525 | 2,515,531 | |||||||||||
Star US Bidco LLC, | ||||||||||||||||
Initial Term Loan, 1 Month SOFR + 4.350% | 9.676 | (c) | 03/17/27 | 424 | 424,164 | |||||||||||
TK Elevator Gmbh (Germany), | ||||||||||||||||
Term Loan B, 6 Month SOFR + 3.928% | 9.081 | (c) | 07/30/27 | 4,940 | 4,941,817 | |||||||||||
|
| |||||||||||||||
| 36,287,848 | ||||||||||||||||
Media 2.7% | ||||||||||||||||
Altice Financing SA (Luxembourg), | ||||||||||||||||
2022 Dollar Loan, 3 Month SOFR + 5.000% | 10.314 | (c) | 10/29/27 | 3,234 | 3,222,891 | |||||||||||
Audacy Capital Corp., | ||||||||||||||||
Term Loan, PRIME + 5.000% | 12.470 | (c) | 08/19/24 | 322 | 321,641 | |||||||||||
Term Loan B-2, 3 Month SOFR + 2.762% | 8.074 | (c) | 11/18/24 | 4,192 | 2,302,709 | |||||||||||
Charter Communications Operating LLC, | ||||||||||||||||
Term B-4 Loan, 3 Month SOFR + 2.000% | 7.329 | (c) | 12/07/30 | 1,600 | 1,571,555 | |||||||||||
CSC Holdings LLC, | ||||||||||||||||
2022 Refinancing Term Loan, 1 Month SOFR + 4.500% | 9.818 | (c) | 01/18/28 | 9,111 | 8,843,346 | |||||||||||
Diamond Sports Group LLC, | ||||||||||||||||
First Lien Term Loan, 1 Month SOFR + 10.100% | 12.775 | (c) | 05/25/26 | 1,894 | 1,823,123 | |||||||||||
Second Lien Term Loan | 8.175 | 08/24/26(d) | 55,772 | 3,020,975 | ||||||||||||
iHeartCommunications, Inc., | ||||||||||||||||
Incremental B Term Loan, 1 Month SOFR + 3.364% | 8.691 | (c) | 05/01/26 | 3,333 | 2,822,361 | |||||||||||
Radiate Holdco LLC, | ||||||||||||||||
Amendment No. 6 Term Loan, 1 Month SOFR + 3.364% | 8.691 | (c) | 09/25/26 | 11,344 | 9,291,603 | |||||||||||
Sinclair Television Group, Inc., | ||||||||||||||||
Term Loan B-4, 1 Month SOFR + 3.850% | 9.176 | (c) | 04/21/29 | 6,507 | 5,402,519 | |||||||||||
See Notes to Financial Statements.
PGIM Floating Rate Income Fund 33
Schedule of Investments (continued)
as of February 29, 2024
| Description | Interest Rate | Maturity Date | Principal (000)# | Value | ||||||||||||
FLOATING RATE AND OTHER LOANS (Continued) | ||||||||||||||||
Media (cont’d.) | ||||||||||||||||
Univision Communications, Inc., | ||||||||||||||||
2021 Replacement Term Loan, 1 Month SOFR + 3.364% | 8.691 | %(c) | 03/15/26 | 2,383 | $ | 2,378,676 | ||||||||||
2022 Incremental First-Lien Term Loan, 3 Month SOFR + 4.250% | 9.598 | (c) | 06/24/29 | 3,152 | 3,152,788 | |||||||||||
Initial First Lien Term Loan, 1 Month SOFR + 3.364% | 8.691 | (c) | 01/31/29 | 5,386 | 5,345,385 | |||||||||||
Virgin Media Bristol LLC, | ||||||||||||||||
Facility Y, 6 Month SOFR + 3.350% | 8.790 | (c) | 03/31/31 | 5,895 | 5,849,732 | |||||||||||
|
| |||||||||||||||
| 55,349,304 | ||||||||||||||||
Metal Fabricate/Hardware 1.4% | ||||||||||||||||
AZZ, Inc., | ||||||||||||||||
Initial Term Loan, 1 Month SOFR + 3.750% | 9.076 | (c) | 05/13/29 | 6,489 | 6,489,285 | |||||||||||
Crosby US Acquisition Corp., | ||||||||||||||||
Amendment No. 3 Replacement Term Loan, 1 Month SOFR + 4.000% | 9.322 | (c) | 08/16/29 | 5,900 | 5,920,284 | |||||||||||
Grinding Media, Inc., | ||||||||||||||||
First Lien Initial Term Loan, 3 Month SOFR + 4.262%^ | 9.591 | (c) | 10/12/28 | 9,735 | 9,662,393 | |||||||||||
Tank Holding Corp., | ||||||||||||||||
2023 Incremental Term Loan, 1 Month SOFR + 6.100% | 11.426 | (c) | 03/31/28 | 1,710 | 1,692,788 | |||||||||||
Delayed Draw Term Commitment, 1 Month SOFR + 6.100% | 11.424 | (c) | 03/31/28 | 332 | 328,318 | |||||||||||
Trulite Glass & Aluminum Solutions LLC, | ||||||||||||||||
Term Loan^ | — | (p) | 02/15/30 | 3,275 | 3,217,687 | |||||||||||
Wireco Worldgroup, Inc., | ||||||||||||||||
2023 Term Loan B, 3 Month SOFR + 3.750% | 9.068 | (c) | 11/13/28 | 1,952 | 1,949,973 | |||||||||||
|
| |||||||||||||||
| 29,260,728 | ||||||||||||||||
Mining 0.3% | ||||||||||||||||
Arsenal AIC Parent LLC, | ||||||||||||||||
2024 Refinancing Term B Loan, 1 Month SOFR + 3.750% | 9.070 | (c) | 08/18/30 | 6,259 | 6,263,225 | |||||||||||
Miscellaneous Manufacturing 0.1% | ||||||||||||||||
Gates Global LLC, | ||||||||||||||||
Initial B-4 Dollar Term Loan, 1 Month SOFR + 3.000% | 8.326 | (c) | 11/16/29 | 1,566 | 1,567,664 | |||||||||||
See Notes to Financial Statements.
34
| Description | Interest Rate | Maturity Date | Principal (000)# | Value | ||||||||||||
FLOATING RATE AND OTHER LOANS (Continued) | ||||||||||||||||
Packaging & Containers 1.2% | ||||||||||||||||
Clydesdale Acquisition Holdings, Inc., | ||||||||||||||||
Term B Loan, 1 Month SOFR + 3.775% | 9.101 | %(c) | 04/13/29 | 5,497 | $ | 5,488,678 | ||||||||||
Pregis TopCo LLC, | ||||||||||||||||
Facility Incremental Amendment No. 3, 1 Month SOFR + 3.864% | 9.191 | (c) | 07/31/26 | 2,063 | 2,059,447 | |||||||||||
Term Loan, 1 Month SOFR + 3.750% | 9.076 | (c) | 07/31/26 | 2,225 | 2,224,306 | |||||||||||
Pretium PKG Holdings, Inc., | ||||||||||||||||
Initial Third Amendment Tranche A-1 Term Loan | ||||||||||||||||
(First Lien), 3 Month SOFR + 4.600% | 9.906 | (c) | 10/02/28 | 2,056 | 1,809,179 | |||||||||||
Third Amendment Tranche A Term Loan, 3 Month SOFR + 7.500% | 10.306 | (c) | 10/02/28 | 1,018 | 1,020,363 | |||||||||||
ProAmpac PG Borrower LLC, | ||||||||||||||||
Term Loan B, 3 Month SOFR + 4.500% | 9.810 | (c) | 09/15/28 | 3,200 | 3,200,000 | |||||||||||
Trident TPI Holdings, Inc., | ||||||||||||||||
Tranche B-4 Initial Term Loan, 3 Month SOFR + 5.250% | 10.598 | (c) | 09/15/28 | 2,681 | 2,684,393 | |||||||||||
Tranche B-5 Initial Term Loan, 3 Month SOFR + 4.500% | 9.848 | (c) | 09/15/28 | 5,316 | 5,312,321 | |||||||||||
|
| |||||||||||||||
| 23,798,687 | ||||||||||||||||
Pharmaceuticals 0.7% | ||||||||||||||||
Amneal Pharmaceuticals LLC, | ||||||||||||||||
Term Loan, 1 Month SOFR + 5.500% | 10.826 | (c) | 05/04/28 | 1,609 | 1,600,463 | |||||||||||
Endo Luxembourg Finance Co., | ||||||||||||||||
2021 Term Loan, PRIME + 6.250% | 14.500 | (c) | 03/27/28 | 1,000 | 645,000 | |||||||||||
Gainwell Acquisition Corp., | ||||||||||||||||
Term B Loan, 3 Month SOFR + 4.100% | 9.448 | (c) | 10/01/27 | 8,292 | 8,098,249 | |||||||||||
Sharp Midco LLC, | ||||||||||||||||
First Lien Initial Term Loan, 3 Month SOFR + 4.100%^ | 9.448 | (c) | 12/29/28 | 1,000 | 998,750 | |||||||||||
Tranche B Term Loan, 3 Month SOFR + 4.500% | 9.848 | (c) | 12/31/28 | 2,750 | 2,748,281 | |||||||||||
|
| |||||||||||||||
| 14,090,743 | ||||||||||||||||
Pipelines 0.4% | ||||||||||||||||
BIP Pipeco Holdings LLC, | ||||||||||||||||
Term Loan, 3 Month SOFR + 3.250% | 8.580 | (c) | 12/05/30 | 2,675 | 2,669,428 | |||||||||||
See Notes to Financial Statements.
PGIM Floating Rate Income Fund 35
Schedule of Investments (continued)
as of February 29, 2024
| Description | Interest Rate | Maturity Date | Principal (000)# | Value | ||||||||||||
FLOATING RATE AND OTHER LOANS (Continued) | ||||||||||||||||
Pipelines (cont’d.) | ||||||||||||||||
Prairie ECI Acquiror LP, | ||||||||||||||||
Initial Term Loan, 1 Month SOFR + 4.850% | 10.176 | %(c) | 03/11/26 | 3,756 | $ | 3,731,255 | ||||||||||
Whitewater DBR Holdco LLC, | ||||||||||||||||
Term Loan | — | (p) | 03/31/31 | 1,300 | 1,298,375 | |||||||||||
|
| |||||||||||||||
| 7,699,058 | ||||||||||||||||
Private Equity 0.3% | ||||||||||||||||
Harbourvest Partners LP, | ||||||||||||||||
2024 Term Loan Facility, 3 Month SOFR + 2.500% | 7.843 | (c) | 04/19/30 | 6,808 | 6,790,918 | |||||||||||
Real Estate 0.8% | ||||||||||||||||
BRP Nimbus LLC, | ||||||||||||||||
Initial Term B Loan, 1 Month SOFR + 2.600% | 7.926 | (c) | 08/27/25 | 10,168 | 10,118,942 | |||||||||||
Greystar Real Estate Partners LLC, | ||||||||||||||||
Term Loan B-1, 3 Month SOFR + 3.250%^ | 8.576 | (c) | 08/21/30 | 5,539 | 5,531,702 | |||||||||||
|
| |||||||||||||||
| 15,650,644 | ||||||||||||||||
Real Estate Investment Trusts (REITs) 1.1% | ||||||||||||||||
Blackstone Mortgage Trust, Inc., | ||||||||||||||||
Term B-4 Loan, 1 Month SOFR + 3.500% | 8.826 | (c) | 05/09/29 | 17,981 | 17,464,532 | |||||||||||
Starwood Property Mortgage LLC, | ||||||||||||||||
Term Loan B, 1 Month SOFR + 3.250% | 8.576 | (c) | 11/18/27 | 2,616 | 2,607,473 | |||||||||||
Term Loan B-3, 1 Month SOFR + 3.350% | 8.676 | (c) | 07/24/26 | 2,311 | 2,304,001 | |||||||||||
|
| |||||||||||||||
| 22,376,006 | ||||||||||||||||
Retail 2.2% | ||||||||||||||||
Constellation Automotive Group Ltd. (United Kingdom), | ||||||||||||||||
Facility 1 Loan, SONIA + 7.500% | 12.689 | (c) | 07/27/29 | GBP | 1,500 | 1,351,923 | ||||||||||
Dave & Buster’s, Inc., | ||||||||||||||||
2024 Refinancing Term B Loan, 1 Month SOFR + 3.299% | 8.625 | (c) | 06/29/29 | 5,690 | 5,689,853 | |||||||||||
EG America LLC (United Kingdom), | ||||||||||||||||
Facility B Tranche C, SOFR + 5.928% | 11.287 | (c) | 02/07/28 | 5,316 | 5,236,547 | |||||||||||
EG Finco Ltd. (United Kingdom), | ||||||||||||||||
Term Loan | 4.750 | 02/07/25 | 893 | 1,087,772 | ||||||||||||
Term Loan B Tranche C, 3 Month EURIBOR + 5.500% | 9.477 | (c) | 02/07/28 | EUR | 2,706 | 2,881,785 | ||||||||||
See Notes to Financial Statements.
36
| Description | Interest Rate | Maturity Date | Principal (000)# | Value | ||||||||||||
FLOATING RATE AND OTHER LOANS (Continued) | ||||||||||||||||
Retail (cont’d.) | ||||||||||||||||
Foundation Building Materials, Inc., | ||||||||||||||||
Term Loan | — | %(p) | 01/29/31 | 300 | $ | 299,438 | ||||||||||
Great Outdoors Group LLC, | ||||||||||||||||
Term B-2 Loan, 1 Month SOFR + 3.864% | 9.191 | (c) | 03/06/28 | 12,915 | 12,910,805 | |||||||||||
LBM Acquisition LLC, | ||||||||||||||||
First Lien Initial Term Loan, 1 Month SOFR + 3.850% | 9.176 | (c) | 12/17/27 | 4,083 | 4,069,165 | |||||||||||
Petco Health & Wellness Co., Inc., | ||||||||||||||||
First Lien Initial Term Loan, 3 Month SOFR + 3.512% | 8.860 | (c) | 03/03/28 | 8,910 | 8,505,969 | |||||||||||
Rough Country LLC, | ||||||||||||||||
First Lien Initial Term Loan, 1 Month SOFR + 3.614% | 8.941 | (c) | 07/28/28 | 3,131 | 3,104,334 | |||||||||||
SRS Distribution, Inc., | ||||||||||||||||
2022 Refinancing Termloan, 1 Month SOFR + 3.350% | 8.676 | (c) | 06/02/28 | 1,136 | 1,133,303 | |||||||||||
|
| |||||||||||||||
| 46,270,894 | ||||||||||||||||
Semiconductors 0.4% | ||||||||||||||||
Altar Bidco, Inc., | ||||||||||||||||
Initial Term Loan, 12 Month SOFR + 3.100% | 8.239 | (c) | 02/01/29 | 1,067 | 1,064,228 | |||||||||||
Second Lien Initial Term Loan, 12 Month SOFR + 5.600% | 10.399 | (c) | 02/01/30 | 1,462 | 1,443,484 | |||||||||||
Natel Engineering Co., Inc., | ||||||||||||||||
Initial Term Loan, 1 Month SOFR + 6.364% | 11.686 | (c) | 04/30/26 | 6,358 | 5,584,705 | |||||||||||
|
| |||||||||||||||
| 8,092,417 | ||||||||||||||||
Shipbuilding 0.2% | ||||||||||||||||
LSF11 Trinity Bidco, Inc., | ||||||||||||||||
2023-2 Rolled Term B Loan, 1 Month SOFR + 4.000%^ | 9.320 | (c) | 06/14/30 | 4,587 | 4,506,488 | |||||||||||
Software 5.4% | ||||||||||||||||
Applovin Corp., | ||||||||||||||||
Initial Term Loan, 1 Month SOFR + 3.100% | 8.426 | (c) | 08/16/30 | 4,590 | 4,593,099 | |||||||||||
athenahealth, Inc., | ||||||||||||||||
Initial Term Loan, 1 Month SOFR + 3.250% | 8.576 | (c) | 02/15/29 | 16,259 | 16,104,465 | |||||||||||
Boxer Parent Co., Inc., | ||||||||||||||||
2028 Extended Dollar Term Loan, 1 Month SOFR + 4.250% | 9.576 | (c) | 12/29/28 | 9,087 | 9,112,936 | |||||||||||
See Notes to Financial Statements.
PGIM Floating Rate Income Fund 37
Schedule of Investments (continued)
as of February 29, 2024
| Description | Interest Rate | Maturity Date | Principal (000)# | Value | ||||||||||||
FLOATING RATE AND OTHER LOANS (Continued) | ||||||||||||||||
Software (cont’d.) | ||||||||||||||||
Camelot US Acquisition LLC, | ||||||||||||||||
Term Loan B-1, 1 Month SOFR + 2.750% | 8.076 | %(c) | 01/31/31 | 5,375 | $ | 5,356,188 | ||||||||||
Cloudera, Inc., | ||||||||||||||||
Second Lien Term Loan, 1 Month SOFR + 6.100% | 11.426 | (c) | 10/08/29 | 3,320 | 3,237,000 | |||||||||||
Term Loan, 1 Month SOFR + 3.850% | 9.176 | (c) | 10/08/28 | 5,329 | 5,284,030 | |||||||||||
Cotiviti, Inc., | ||||||||||||||||
Term Loan, 1 Month SOFR + 3.500% | 7.500 | (c) | 03/31/31 | 9,800 | 9,800,000 | |||||||||||
CT Technologies Intermediate Holdings, Inc., | ||||||||||||||||
Term Loan 2021 Reprice, 1 Month SOFR + 4.364% | 9.691 | (c) | 12/16/25 | 4,733 | 4,644,189 | |||||||||||
Dun & Bradstreet Corp., | ||||||||||||||||
Incremental Term B-2, 1 Month SOFR + 2.750% | 8.074 | (c) | 01/18/29 | 5,250 | 5,235,237 | |||||||||||
EagleView Technology Corp., | ||||||||||||||||
First Lien Term Loan, 3 Month SOFR + 3.763% | 9.111 | (c) | 08/14/25 | 3,694 | 3,595,456 | |||||||||||
Evertec Group LLC (Puerto Rico), | ||||||||||||||||
Term Loan B, 1 Month SOFR + 3.500% | 8.826 | (c) | 10/30/30 | 3,240 | 3,235,950 | |||||||||||
Genesys Cloud Services Holdings II LLC, | ||||||||||||||||
2024 Incremental Dollar Term Loan, 1 Month SOFR + 3.864% | 9.191 | (c) | 12/01/27 | 3,375 | 3,380,272 | |||||||||||
Hireright Holdings Group, | ||||||||||||||||
2023 Extending Term, 1 Month SOFR + 4.000% | 9.326 | (c) | 09/27/30 | 3,267 | 3,253,745 | |||||||||||
Instructure Holdings, Inc., | ||||||||||||||||
Initial Term Loan, 3 Month SOFR + 3.012% | 8.355 | (c) | 10/30/28 | 750 | 746,250 | |||||||||||
Polaris Newco LLC, | ||||||||||||||||
First Lien Dollar Term Loan, 3 Month SOFR + 4.262% | 9.574 | (c) | 06/02/28 | 7,607 | 7,444,649 | |||||||||||
Red Planet Borrower LLC, | ||||||||||||||||
First Lien Initial Term Loan, 1 Month SOFR + 3.850% | 9.176 | (c) | 10/02/28 | 5,476 | 5,337,278 | |||||||||||
Renaissance Holding Corp., | ||||||||||||||||
Covenant-Lite First-Lien Term Loan, 1 Month SOFR + 4.250% | 9.576 | (c) | 04/05/30 | 5,653 | 5,635,494 | |||||||||||
Skillsoft Finance II, Inc., | ||||||||||||||||
Initial Term Loan, 1 Month SOFR + 5.364% | 10.684 | (c) | 07/14/28 | 6,185 | 5,720,779 | |||||||||||
Waystar Technologies, Inc., | ||||||||||||||||
Initial Term Loan, 1 Month SOFR + 4.000% | 9.326 | (c) | 10/22/29 | 2,645 | 2,646,653 | |||||||||||
Weld North Education LLC, | ||||||||||||||||
2024 Term Loan, 1 Month SOFR + 3.614% | 8.941 | (c) | 12/21/29 | 3,225 | 3,211,900 | |||||||||||
Zelis Cost Management Buyer, Inc., | ||||||||||||||||
Term B-2 Loan, 3 Month SOFR + 2.750% | 8.067 | (c) | 09/28/29 | 2,775 | 2,769,988 | |||||||||||
|
| |||||||||||||||
| 110,345,558 | ||||||||||||||||
See Notes to Financial Statements.
38
| Description | Interest Rate | Maturity Date | Principal (000)# | Value | ||||||||||||
FLOATING RATE AND OTHER LOANS (Continued) | ||||||||||||||||
Telecommunications 4.1% | ||||||||||||||||
Altice France SA (France), | ||||||||||||||||
USD TLB-12 Term Loan, 3 Month LIBOR + 3.688% | 9.263 | %(c) | 01/31/26 | 2,662 | $ | 2,611,654 | ||||||||||
Aventiv Technologies LLC, | ||||||||||||||||
New Initial Term Loan (First Lien), 3 Month SOFR + 4.890% | 10.500 | (c) | 11/01/24 | 5,288 | 3,604,860 | |||||||||||
CCI Buyer, Inc., | ||||||||||||||||
First Lien Initial Term Loan, 3 Month SOFR + 4.000% | 9.348 | (c) | 12/17/27 | 7,636 | 7,574,315 | |||||||||||
CommScope, Inc., | ||||||||||||||||
Initial Term Loan, 1 Month SOFR + 3.364% | 8.691 | (c) | 04/06/26 | 7,365 | 6,612,731 | |||||||||||
Connect Finco Sarl (United Kingdom), | ||||||||||||||||
Amendment No. 1 Refinancing Term Loan, 1 Month SOFR + 3.500% | 8.826 | (c) | 12/11/26 | 3,588 | 3,580,887 | |||||||||||
Crown Subsea Communications Holding, Inc., | ||||||||||||||||
Initial Term Loan, 3 Month SOFR + 4.750% | 10.067 | (c) | 01/26/31 | 5,280 | 5,294,847 | |||||||||||
Digicel International Finance, Ltd. (Jamaica), | ||||||||||||||||
Initial Term Loan, 3 Month SOFR + 6.750% | 12.063 | (c) | 05/29/27 | 5,158 | 4,873,891 | |||||||||||
Global Tel Link Corp., | ||||||||||||||||
First Lien Term Loan, 1 Month SOFR + 4.250% | 9.576 | (c) | 11/29/25 | 1,936 | 1,881,312 | |||||||||||
GTT Communications, Inc., | ||||||||||||||||
Closing Date Term Loan, 3 Month SOFR + 9.100% | 14.448 | (c) | 06/30/28 | 1,585 | 1,109,767 | |||||||||||
Closing Date USD Term Loan, 1 Month SOFR + 7.100% | 12.426 | (c) | 12/30/27 | 1,963 | 1,786,779 | |||||||||||
Level 3 Financing, Inc., | ||||||||||||||||
Tranche B 2027 Term Loan, 1 Month SOFR + 1.864% | 7.191 | (c) | 03/01/27 | 330 | 321,750 | |||||||||||
Lumen Technologies, Inc., | ||||||||||||||||
Term B Loan, 1 Month SOFR + 2.364% | 7.691 | (c) | 03/15/27 | 3,255 | 2,354,598 | |||||||||||
Term Loan | — | (p) | 06/01/28 | 113 | 103,854 | |||||||||||
MLN US HoldCo LLC, | ||||||||||||||||
3L Term B Loan, 3 Month SOFR + 9.350% | 14.660 | (c) | 10/18/27 | 70 | 6,960 | |||||||||||
Initial Term Loan, 3 Month SOFR + 6.540% | 11.850 | (c) | 10/18/27 | 10,885 | 5,986,484 | |||||||||||
Initial Term Loan (Second Out (First Lien Roll-Up)), 3 Month SOFR + 6.800% | 12.110 | (c) | 10/18/27 | 19,121 | 2,868,215 | |||||||||||
Orbcomm, Inc., | ||||||||||||||||
Closing Date Term Loan, 1 Month SOFR + 4.364% | 9.745 | (c) | 09/01/28 | 2,061 | 1,957,495 | |||||||||||
Patagonia Holdco LLC, | ||||||||||||||||
Initial Term Loan, 3 Month SOFR + 5.750% | 11.064 | (c) | 08/01/29 | 10,107 | 9,293,352 | |||||||||||
See Notes to Financial Statements.
PGIM Floating Rate Income Fund 39
Schedule of Investments (continued)
as of February 29, 2024
| Description | Interest Rate | Maturity Date | Principal (000)# | Value | ||||||||||||
FLOATING RATE AND OTHER LOANS (Continued) | ||||||||||||||||
Telecommunications (cont’d.) | ||||||||||||||||
Viasat, Inc., | ||||||||||||||||
Initial Term Loan, 1 Month SOFR + 4.500% | 9.826 | %(c) | 03/02/29 | 5,679 | $ | 5,566,382 | ||||||||||
Initial Term Loan, 1 Month SOFR + 4.614% | 9.938 | (c) | 05/30/30 | 3,990 | 3,912,694 | |||||||||||
Xplornet Communications, Inc. (Canada), | ||||||||||||||||
First Lien Refinancing Term Loan, 3 Month SOFR + 4.262% | 9.610 | (c) | 10/02/28 | 11,412 | 5,171,212 | |||||||||||
Initial Term Loan- Second Lien, 3 Month SOFR + 7.262% | 12.610 | (c) | 10/01/29 | 6,630 | 1,326,000 | |||||||||||
Zayo Group Holdings, Inc., | ||||||||||||||||
Initial Dollar Term Loan, 1 Month SOFR + 3.114% | 8.441 | (c) | 03/09/27 | 8,275 | 7,426,812 | |||||||||||
|
| |||||||||||||||
| 85,226,851 | ||||||||||||||||
Textiles 0.4% | ||||||||||||||||
ASP Unifrax Holdings, Inc., | ||||||||||||||||
USD Term Loan (First Lien), 3 Month SOFR + 3.900% | 9.248 | (c) | 12/12/25 | 9,526 | 9,206,755 | |||||||||||
Transportation 0.9% | ||||||||||||||||
Daseke Cos., Inc., | ||||||||||||||||
Term Loan, 1 Month SOFR + 4.114% | 9.441 | (c) | 03/09/28 | 5,081 | 5,082,596 | |||||||||||
First transit Parent, Inc., | ||||||||||||||||
Initial Term B Loan, 3 Month SOFR + 3.262% | 8.610 | (c) | 07/21/28 | 4,897 | 4,853,783 | |||||||||||
Initial Term C Loan, 3 Month SOFR + 3.262% | 8.610 | (c) | 07/21/28 | 1,485 | 1,471,881 | |||||||||||
Kenan Advantage Group, Inc. (The), | ||||||||||||||||
Term Loan B-3, 1 Month SOFR + 3.750% | 9.076 | (c) | 01/25/29 | 600 | 597,300 | |||||||||||
Savage Enterprises LLC, | ||||||||||||||||
Term Loan B, 1 Month SOFR + 3.364% | 8.691 | (c) | 09/15/28 | 6,599 | 6,584,514 | |||||||||||
STG Logistics, Inc., | ||||||||||||||||
Initial Term Loan, 3 Month SOFR + 6.150% | 11.498 | (c) | 03/24/28 | 1,683 | 773,967 | |||||||||||
|
| |||||||||||||||
| 19,364,041 | ||||||||||||||||
|
| |||||||||||||||
TOTAL FLOATING RATE AND OTHER LOANS | 1,267,844,305 | |||||||||||||||
|
| |||||||||||||||
RESIDENTIAL MORTGAGE-BACKED SECURITY 0.2% | ||||||||||||||||
PMT Credit Risk Transfer Trust, | ||||||||||||||||
Series 2024-01R, Class A, 144A, 30 Day Average SOFR + 3.500% (Cap N/A, Floor 0.000%) (cost $5,000,000) | 8.810 | (c) | 05/25/33 | 5,000 | 5,000,000 | |||||||||||
|
| |||||||||||||||
See Notes to Financial Statements.
40
| Description | Shares | Value | ||||||
COMMON STOCKS 0.8% | ||||||||
Chemicals 0.5% | ||||||||
Venator Materials PLC (original cost $7,130,913; purchased 05/15/23 - 10/19/23)*(f) | 10,549 | $ | 10,249,451 | |||||
Oil, Gas & Consumable Fuels 0.2% | ||||||||
Chesapeake Energy Corp.(a) | 27,937 | 2,312,625 | ||||||
Heritage Power LLC*^ | 182,367 | 2,305,119 | ||||||
Heritage Power LLC*^ | 8,021 | 101,385 | ||||||
Heritage Power LLC*^ | 209,883 | 104,942 | ||||||
|
| |||||||
| 4,824,071 | ||||||||
Software 0.0% | ||||||||
Campfire Topco Ltd. (Jersey)*^ | 4,988,976 | 539 | ||||||
Wireless Telecommunication Services 0.1% | ||||||||
Digicel International Finance Ltd. (Jamaica) (original cost $335,332; purchased 01/29/24 - 01/30/24)*^(f) | 275,213 | 498,135 | ||||||
Intelsat Emergence SA (Luxembourg)* | 28,359 | 777,221 | ||||||
|
| |||||||
| 1,275,356 | ||||||||
|
| |||||||
TOTAL COMMON STOCKS | 16,349,417 | |||||||
|
| |||||||
PREFERRED STOCK 0.0% | ||||||||
Wireless Telecommunication Services | ||||||||
Digicel International Finance Ltd. (Jamaica) (original cost $774,460; purchased 01/26/24 - 01/29/24)*^(f) | 89,059 | 890,590 | ||||||
|
| |||||||
TOTAL LONG-TERM INVESTMENTS | 2,017,695,698 | |||||||
|
| |||||||
SHORT-TERM INVESTMENTS 2.5% | ||||||||
AFFILIATED MUTUAL FUNDS | ||||||||
PGIM Core Government Money Market Fund (7-day effective yield 5.545%)(wb) | 35,419,001 | 35,419,001 | ||||||
See Notes to Financial Statements.
PGIM Floating Rate Income Fund 41
Schedule of Investments (continued)
as of February 29, 2024
| Description | Shares | Value | ||||||
AFFILIATED MUTUAL FUNDS (Continued) | ||||||||
PGIM Institutional Money Market Fund (7-day effective yield 5.683%) | 16,680,606 | $ | 16,673,934 | |||||
|
| |||||||
TOTAL SHORT-TERM INVESTMENTS | 52,092,935 | |||||||
|
| |||||||
TOTAL INVESTMENTS 100.7% | 2,069,788,633 | |||||||
Liabilities in excess of other assets(z) (0.7)% | (15,136,180 | ) | ||||||
|
| |||||||
NET ASSETS 100.0% | $ | 2,054,652,453 | ||||||
|
| |||||||
Below is a list of the abbreviation(s) used in the annual report:
EUR—Euro
GBP—British Pound
USD—US Dollar
144A—Security was purchased pursuant to Rule 144A under the Securities Act of 1933 and, pursuant to the requirements of Rule 144A, may not be resold except to qualified institutional buyers.
BNP—BNP Paribas S.A.
BNYM—Bank of New York Mellon
CDX—Credit Derivative Index
CGM—Citigroup Global Markets, Inc.
CLO—Collateralized Loan Obligation
DAC—Designated Activity Company
ETF—Exchange-Traded Fund
EURIBOR—Euro Interbank Offered Rate
LIBOR—London Interbank Offered Rate
LP—Limited Partnership
MSI—Morgan Stanley & Co International PLC
MTN—Medium Term Note
OTC—Over-the-counter
PIK—Payment-in-Kind
Q—Quarterly payment frequency for swaps
REITs—Real Estate Investment Trust
SCB—Standard Chartered Bank
SOFR—Secured Overnight Financing Rate
SONIA—Sterling Overnight Index Average
SSB—State Street Bank & Trust Company
T—Swap payment upon termination
| * | Non-income producing security. |
| # | Principal or notional amount is shown in U.S. dollars unless otherwise stated. |
| ^ | Indicates a Level 3 instrument. The aggregate value of Level 3 instruments is $96,274,249 and 4.7% of net assets. |
See Notes to Financial Statements.
42
| (a) | All or a portion of security is on loan. The aggregate market value of such securities, including those sold and pending settlement, is $16,190,399; cash collateral of $16,603,275 (included in liabilities) was received with which the Fund purchased highly liquid short-term investments. In the event of significant appreciation in value of securities on loan on the last business day of the reporting period, the Fund may reflect a collateral value that is less than the market value of the loaned securities and such shortfall is remedied the following business day. |
| (b) | Represents security, or portion thereof, purchased with cash collateral received for securities on loan and includes dividend reinvestment. |
| (c) | Variable rate instrument. The interest rate shown reflects the rate in effect at February 29, 2024. |
| (d) | Represents issuer in default on interest payments and/or principal repayment. Non-income producing security. Such securities may be post-maturity. |
| (f) | Indicates a restricted security that is acquired in unregistered, private sales from the issuing company or from an affiliate of the issuer and is considered restricted as to disposition under federal securities law; the aggregate original cost of such securities is $15,966,535. The aggregate value of $15,668,881 is 0.8% of net assets. |
| (ff) | Variable rate security. Security may be issued at a fixed coupon rate, which converts to a variable rate at a specified date. Rate shown is the rate in effect as of period end. |
| (oo) | Perpetual security. Maturity date represents next call date. |
| (p) | Represents a security with a delayed settlement and therefore the interest rate is not available until settlement which is after the period end. |
| (wb) | Represents an investment in a Fund affiliated with the Manager. |
| (z) | Includes net unrealized appreciation/(depreciation) and/or market value of the below holdings which are excluded from the Schedule of Investments: |
Unfunded loan commitments outstanding at February 29, 2024:
Borrower | Principal Amount (000)# | Current Value | Unrealized Appreciation | Unrealized Depreciation | ||||||||||||||||||||||||||
Action Environmental Group, Inc. (The), Delayed Draw Term Loan, 2.250%, Maturity Date 10/24/30 (cost $664,446)^ | 665 | $ | 666,049 | $ | 1,603 | $ | — | |||||||||||||||||||||||
Ryan LLC, Delayed Draw Term Loan, —%(p), Maturity Date 11/14/30 (cost $192,857) | 193 | 193,339 | 482 | — | ||||||||||||||||||||||||||
Tank Holding Corp., Delayed Draw Term Commitment, 1.000%, Maturity Date 03/31/28 (cost $400,804) | 406 | 402,029 | 1,225 | — | ||||||||||||||||||||||||||
|
|
|
|
|
| |||||||||||||||||||||||||
| $ | 1,261,417 | $ | 3,310 | $ | — | |||||||||||||||||||||||||
|
|
|
|
|
| |||||||||||||||||||||||||
Futures contracts outstanding at February 29, 2024:
Number of Contracts | Type | Expiration Date | Current Notional Amount | Value / Unrealized Appreciation (Depreciation) | ||||||||||||||||||
Long Positions: |
| |||||||||||||||||||||
23 | 20 Year U.S. Treasury Bonds | Jun. 2024 | $ | 2,742,750 | $ | 20,826 | ||||||||||||||||
29 | 30 Year U.S. Ultra Treasury Bonds | Jun. 2024 | 3,708,375 | 45,183 | ||||||||||||||||||
|
| |||||||||||||||||||||
| 66,009 | ||||||||||||||||||||||
|
| |||||||||||||||||||||
Short Positions: | ||||||||||||||||||||||
650 | 2 Year U.S.Treasury Notes | Jun. 2024 | 133,087,500 | (37,226 | ) | |||||||||||||||||
19 | 5 Year Euro-Bobl | Mar. 2024 | 2,386,601 | 22,539 | ||||||||||||||||||
527 | 5 Year U.S.Treasury Notes | Jun. 2024 | 56,339,594 | (66,481 | ) | |||||||||||||||||
See Notes to Financial Statements.
PGIM Floating Rate Income Fund 43
Schedule of Investments (continued)
as of February 29, 2024
Futures contracts outstanding at February 29, 2024 (continued):
Number of Contracts | Type | Expiration Date | Current Notional Amount | Value / Unrealized Appreciation (Depreciation) | ||||||||||||||||||
Short Positions (cont’d): |
| |||||||||||||||||||||
7 | 10 Year Euro-Bund | Mar. 2024 | $ | 1,003,577 | $ | 6,047 | ||||||||||||||||
312 | 10 Year U.S. Treasury Notes | Jun. 2024 | 34,456,500 | (58,115 | ) | |||||||||||||||||
|
| |||||||||||||||||||||
| (133,236 | ) | |||||||||||||||||||||
|
| |||||||||||||||||||||
| $ | (67,227 | ) | ||||||||||||||||||||
|
| |||||||||||||||||||||
Forward foreign currency exchange contracts outstanding at February 29, 2024:
Purchase Contracts | Counterparty | Notional Amount (000) | Value at Settlement Date | Current Value | Unrealized Appreciation | Unrealized Depreciation | ||||||||||||||||||||||||||||||||||||
OTC Forward Foreign Currency Exchange Contracts: |
| |||||||||||||||||||||||||||||||||||||||||
British Pound, | ||||||||||||||||||||||||||||||||||||||||||
Expiring 03/04/24 | MSI | GBP | 10,344 | $ | 12,995,199 | $ | 13,056,979 | $ | 61,780 | $ | — | |||||||||||||||||||||||||||||||
Expiring 03/04/24 | SSB | GBP | 10,805 | 13,698,710 | 13,639,289 | — | (59,421 | ) | ||||||||||||||||||||||||||||||||||
Euro, | ||||||||||||||||||||||||||||||||||||||||||
Expiring 03/04/24 | BNYM | EUR | 23,141 | 25,070,802 | 25,015,008 | — | (55,794 | ) | ||||||||||||||||||||||||||||||||||
Expiring 03/04/24 | MSI | EUR | 7,767 | 8,338,578 | 8,395,987 | 57,409 | — | |||||||||||||||||||||||||||||||||||
Expiring 03/04/24 | MSI | EUR | 1,406 | 1,506,464 | 1,520,102 | 13,638 | — | |||||||||||||||||||||||||||||||||||
|
|
|
|
|
|
|
| |||||||||||||||||||||||||||||||||||
| $ | 61,609,753 | $ | 61,627,365 | 132,827 | (115,215 | ) | ||||||||||||||||||||||||||||||||||||
|
|
|
|
|
|
|
| |||||||||||||||||||||||||||||||||||
Sale Contracts | Counterparty | Notional Amount (000) | Value at Settlement Date | Current Value | Unrealized Appreciation | Unrealized Depreciation | ||||||||||||||||||||||||||||
OTC Forward Foreign Currency Exchange Contracts: |
| |||||||||||||||||||||||||||||||||
British Pound, | ||||||||||||||||||||||||||||||||||
Expiring 03/04/24 | BNYM | GBP | 18,457 | $ | 23,449,562 | $ | 23,298,140 | $ | 151,422 | $ | — | |||||||||||||||||||||||
Expiring 03/04/24 | MSI | GBP | 1,850 | 2,356,967 | 2,335,748 | 21,219 | — | |||||||||||||||||||||||||||
Expiring 03/04/24 | SCB | GBP | 842 | 1,068,241 | 1,062,380 | 5,861 | — | |||||||||||||||||||||||||||
Expiring 04/02/24 | SSB | GBP | 10,805 | 13,701,238 | 13,641,740 | 59,498 | — | |||||||||||||||||||||||||||
Expiring 04/02/24 | SSB | GBP | 729 | 925,780 | 920,858 | 4,922 | — | |||||||||||||||||||||||||||
Euro, | ||||||||||||||||||||||||||||||||||
Expiring 03/04/24 | BNYM | EUR | 28,315 | 30,734,033 | 30,607,239 | 126,794 | — | |||||||||||||||||||||||||||
Expiring 03/04/24 | SSB | EUR | 4,000 | 4,353,429 | 4,323,858 | 29,571 | — | |||||||||||||||||||||||||||
Expiring 04/02/24 | BNYM | EUR | 23,141 | 25,101,024 | 25,044,865 | 56,159 | — | |||||||||||||||||||||||||||
|
|
|
|
|
|
|
| |||||||||||||||||||||||||||
| $ | 101,690,274 | $ | 101,234,828 | 455,446 | — | |||||||||||||||||||||||||||||
|
|
|
|
|
|
|
| |||||||||||||||||||||||||||
| $ | 588,273 | $ | (115,215 | ) | ||||||||||||||||||||||||||||||
|
|
|
| |||||||||||||||||||||||||||||||
See Notes to Financial Statements.
44
Credit default swap agreements outstanding at February 29, 2024:
Reference Entity/ Obligation | Termination Date | Fixed Rate | Notional Amount (000)#(3) | Implied Credit Spread at February 29, 2024(4) | Value at Trade Date | Value at February 29, 2024 | Unrealized Appreciation (Depreciation) | |||||||||||||||||||||||||||||||||||||||||
Centrally Cleared Credit Default Swap Agreements on credit indices - Sell Protection(2): |
| |||||||||||||||||||||||||||||||||||||||||||||||
CDX.NA.HY.41.V2 | 12/20/28 | 5.000%(Q) | 117,543 | 3.383% | $ | 863,472 | $ | 8,634,152 | $ | 7,770,680 | ||||||||||||||||||||||||||||||||||||||
CDX.NA.IG.41.V1 | 12/20/28 | 1.000%(Q) | 184,750 | 0.520% | 2,395,337 | 4,181,699 | 1,786,362 | |||||||||||||||||||||||||||||||||||||||||
|
|
|
|
|
| |||||||||||||||||||||||||||||||||||||||||||
| $ | 3,258,809 | $ | 12,815,851 | $ | 9,557,042 | |||||||||||||||||||||||||||||||||||||||||||
|
|
|
|
|
| |||||||||||||||||||||||||||||||||||||||||||
The Fund entered into credit default swaps (“CDS”) to provide a measure of protection against defaults or to take an active long or short position with respect to the likelihood of a particular issuer’s default or the reference entity’s credit soundness. CDS contracts generally trade based on a spread which represents the cost a protection buyer has to pay the protection seller. The protection buyer is said to be short the credit as the value of the contract rises the more the credit deteriorates. The value of the CDS contract increases for the protection buyer if the spread increases.
| (1) | If the Fund is a buyer of protection, it pays the fixed rate. When a credit event occurs, as defined under the terms of that particular swap agreement, the Fund will either (i) receive from the seller of protection an amount equal to the notional amount of the swap and make delivery of the referenced obligation or underlying securities comprising the referenced index or (ii) receive a net settlement amount in the form of cash or securities equal to the notional amount of the swap less the recovery value of the referenced obligation or underlying securities comprising the referenced index. |
| (2) | If the Fund is a seller of protection, it receives the fixed rate. When a credit event occurs, as defined under the terms of that particular swap agreement, the Fund will either (i) pay to the buyer of protection an amount equal to the notional amount of the swap and take delivery of the referenced obligation or underlying securities comprising the referenced index or (ii) pay a net settlement amount in the form of cash or securities equal to the notional amount of the swap less the recovery value of the referenced obligation or underlying securities comprising the referenced index. |
| (3) | Notional amount represents the maximum potential amount the Fund could be required to pay as a seller of credit protection or receive as a buyer of credit protection if a credit event occurs as defined under the terms of that particular swap agreement. |
| (4) | Implied credit spreads, represented in absolute terms, utilized in determining the fair value of credit default swap agreements where the Fund is the seller of protection as of the reporting date serve as an indicator of the current status of the payment/ performance risk and represent the likelihood of risk of default for the credit derivative. The implied credit spread of a particular referenced entity reflects the cost of buying/selling protection and may include up-front payments required to be made to enter into the agreement. Wider credit spreads represent a deterioration of the referenced entity’s credit soundness and a greater likelihood of risk of default or other credit event occurring as defined under the terms of the agreement. |
See Notes to Financial Statements.
PGIM Floating Rate Income Fund 45
Schedule of Investments (continued)
as of February 29, 2024
Total return swap agreement outstanding at February 29, 2024:
Reference Entity | Financing Rate | Counterparty | Termination Date | Long (Short) Notional Amount (000)#(1) | Fair Value | Upfront Premiums Paid (Received) | Unrealized Appreciation (Depreciation)(2) | |||||||||||||||||||||||||||||
OTC Total Return Swap Agreement: |
| |||||||||||||||||||||||||||||||||||
Invesco Senior Loan ETF(T) | | 1 Day SOFR 5.320 | (T)/ % |
| BNP |
|
| 05/07/24 |
|
| 4,575 |
|
| $(1,124) |
|
| $ | — |
|
|
|
| $(1,124) |
|
| |||||||||||
|
|
|
|
|
| |||||||||||||||||||||||||||||||
Balances Reported in the Statement of Assets and Liabilities for OTC Swap Agreements:
Premiums Paid | Premiums Received | Unrealized Appreciation | Unrealized Depreciation | |||||
| ||||||||
OTC Swap Agreement | $— | $— | $— | $(1,124) | ||||
| ||||||||
Summary of Collateral for Centrally Cleared/Exchange-traded Derivatives:
Cash and securities segregated as collateral, including pending settlement for closed positions, to cover requirements for centrally cleared/exchange-traded derivatives are listed by broker as follows:
Broker | Cash and/or Foreign Currency | Securities Market Value | ||||||||||||||||||||||
CGM | $ | 13,788,000 | $ | — | ||||||||||||||||||||
|
|
|
| |||||||||||||||||||||
Fair Value Measurements:
Various inputs are used in determining the value of the Fund’s investments. These inputs are summarized in the three broad levels listed below.
Level 1—unadjusted quoted prices generally in active markets for identical securities.
Level 2—quoted prices for similar securities, interest rates and yield curves, prepayment speeds, foreign currency exchange rates and other observable inputs.
Level 3—unobservable inputs for securities valued in accordance with Board approved fair valuation procedures.
The following is a summary of the inputs used as of February 29, 2024 in valuing such portfolio securities:
| Level 1 | Level 2 | Level 3 | ||||||||||
Investments in Securities | ||||||||||||
Assets | ||||||||||||
Long-Term Investments | ||||||||||||
Asset-Backed Securities | ||||||||||||
Collateralized Loan Obligations | $ | — | $ | 409,668,141 | $ | — | ||||||
Other | — | 2,360,624 | — | |||||||||
Corporate Bonds | — | 315,532,978 | 49,643 | |||||||||
Floating Rate and Other Loans | — | 1,175,522,012 | 92,322,293 | |||||||||
Residential Mortgage-Backed Security | — | 5,000,000 | — | |||||||||
See Notes to Financial Statements.
46
| Level 1 | Level 2 | Level 3 | ||||||||||
Investments in Securities (continued) | ||||||||||||
Assets (continued) | ||||||||||||
Long-Term Investments (continued) | ||||||||||||
Common Stocks | $ | 2,312,625 | $ | 11,026,672 | $ | 3,010,120 | ||||||
Preferred Stock | — | — | 890,590 | |||||||||
Short-Term Investments | ||||||||||||
Affiliated Mutual Funds | 52,092,935 | — | — | |||||||||
|
|
|
|
|
| |||||||
Total | $ | 54,405,560 | $ | 1,919,110,427 | $ | 96,272,646 | ||||||
|
|
|
|
|
| |||||||
Other Financial Instruments* | ||||||||||||
Assets | ||||||||||||
Unfunded Loan Commitments | $ | — | $ | 1,707 | $ | 1,603 | ||||||
Futures Contracts | 94,595 | — | — | |||||||||
OTC Forward Foreign Currency Exchange Contracts | — | 588,273 | — | |||||||||
Centrally Cleared Credit Default Swap Agreements | — | 9,557,042 | — | |||||||||
|
|
|
|
|
| |||||||
Total | $ | 94,595 | $ | 10,147,022 | $ | 1,603 | ||||||
|
|
|
|
|
| |||||||
Liabilities | ||||||||||||
Futures Contracts | $ | (161,822 | ) | $ | — | $ | — | |||||
OTC Forward Foreign Currency Exchange Contracts | — | (115,215 | ) | — | ||||||||
OTC Total Return Swap Agreement | — | (1,124 | ) | — | ||||||||
|
|
|
|
|
| |||||||
Total | $ | (161,822 | ) | $ | (116,339 | ) | $ | — | ||||
|
|
|
|
|
| |||||||
| * | Other financial instruments are derivative instruments, with the exception of unfunded loan commitments, and are not reflected in the Schedule of Investments. Futures, forwards, centrally cleared swap contracts and unfunded loan commitments are recorded at unrealized appreciation (depreciation) and OTC swap contracts are recorded at fair value. |
The following is a reconciliation of assets in which unobservable inputs (Level 3) were used in determining fair value:
| Corporate Bonds | Floating Rate and Other Loans | Common Stocks | Preferred Stocks | Rights | Unfunded Loan Commitments | |||||||||||||||||||||||||||
Balance as of 02/28/23 | $ | 45,733 | $ | 93,591,879 | $ | — | $ | — | $ | 34,094 | $ | (25,444 | ) | |||||||||||||||||||
Realized gain (loss) | (7,366 | ) | (1,706,778 | ) | (1 | ) | — | 55,516 | — | |||||||||||||||||||||||
Change in unrealized appreciation (depreciation) | (7 | ) | 5,369,659 | 681,193 | 116,130 | (34,094 | ) | 27,047 | ||||||||||||||||||||||||
Purchases/Exchanges/Issuances | 94,944 | 63,734,071 | 2,328,929 | 774,460 | 69 | — | ||||||||||||||||||||||||||
Sales/Paydowns | (37,864 | ) | (45,849,336 | ) | (1 | ) | — | (55,585 | ) | — | ||||||||||||||||||||||
Accrued discount/premium | (67 | ) | (4,656 | ) | — | — | — | — | ||||||||||||||||||||||||
Transfers into Level 3* | — | 26,984,137 | — | — | — | — | ||||||||||||||||||||||||||
Transfers out of Level 3* | (45,730 | ) | (49,796,683 | ) | — | — | — | — | ||||||||||||||||||||||||
|
|
|
|
|
|
|
|
|
|
|
| |||||||||||||||||||||
Balance as of 02/29/24 | $ | 49,643 | $ | 92,322,293 | $ | 3,010,120 | $ | 890,590 | $ | — | $ | 1,603 | ||||||||||||||||||||
|
|
|
|
|
|
|
|
|
|
|
| |||||||||||||||||||||
See Notes to Financial Statements.
PGIM Floating Rate Income Fund 47
Schedule of Investments (continued)
as of February 29, 2024
| Corporate Bonds | Floating Rate and Other Loans | Common Stocks | Preferred Stocks | Rights | Unfunded Loan Commitments | |||||||||||||||||||||||||
Change in unrealized appreciation (depreciation) relating to securities still held at reporting period end | $ | (4 | ) | $ | (1,205,093 | ) | $ | 681,193 | $ | 116,130 | $ | — | $ | 1,603 | ||||||||||||||||
|
|
|
|
|
|
|
|
|
|
|
| |||||||||||||||||||
| * | It is the Fund’s policy to recognize transfers in and transfers out at the securities’ fair values as of the beginning of period. Securities transferred between Level 2 and Level 3 are due to changes in the method utilized in valuing the investments. Transfers from Level 2 to Level 3 are typically a result of a change from the use of methods used by independent pricing services (Level 2) to the use of a single broker quote or valuation technique which utilizes significant unobservable inputs due to an absence of current or reliable market quotations (Level 3). Transfers from Level 3 to Level 2 are a result of the availability of current and reliable market data provided by independent pricing services or other valuation techniques which utilize observable inputs. In accordance with the requirements of ASC 820, the amounts of transfers into and out of Level 3, if material, are disclosed in the Notes to the Schedule of Investments of the Fund. |
Level 3 securities as presented in the table above are being fair valued using pricing methodologies approved by the Board, which contain unobservable inputs as follows:
Level 3 Securities** | Fair Value as of February 29, 2024 | Valuation Approach | Valuation Methodology | Unobservable Inputs | Rate (Weighted Average) | |||||||||||||||
Corporate Bonds | $ | 49,643 | Market | Recovery Value | Recovery Rate | $ | 0.00-$228.83($12.10 | ) | ||||||||||||
Floating Rate and Other Loans | 2,524,600 | Market | Enterprise | EBITDA Multiple | $ | 1.26 | ||||||||||||||
Common Stocks | 539 | Market | Discounted Value | Discount Factor | $ | 0.00 | ||||||||||||||
Common Stocks | 3,009,581 | Market | Enterprise Value | Implied/Recovery Rate | $ | 0.50-$12.64($4.46 | ) | |||||||||||||
Preferred Stocks | 890,590 | Market | Enterprise Value | Implied/Recovery Rate | $ | 10.00 | ||||||||||||||
|
| |||||||||||||||||||
| $ | 6,474,953 | |||||||||||||||||||
|
| |||||||||||||||||||
| ** | The table does not include Level 3 securities and/or derivatives that are valued by independent pricing vendors or brokers. As of February 29, 2024, the aggregate value of these securities and/or derivatives was $89,799,296. The unobservable inputs for these investments were not developed by the Fund and are not readily available (e.g. single broker quotes). |
Industry Classification:
The industry classification of investments and liabilities in excess of other assets shown as a percentage of net assets as of February 29, 2024 were as follows:
Collateralized Loan Obligations | 20.0 | % | ||
Banks | 11.4 | |||
Commercial Services | 6.4 | |||
Software | 5.4 |
Telecommunications | 4.4 | % | ||
Chemicals | 4.0 | |||
Entertainment | 3.4 | |||
Media | 3.1 |
See Notes to Financial Statements.
48
Industry Classification (continued):
Computers | 2.6 | % | ||
Affiliated Mutual Funds (0.8% represents investments purchased with collateral from securities on loan) | 2.5 | |||
Retail | 2.3 | |||
Airlines | 2.3 | |||
Healthcare-Services | 2.0 | |||
Insurance | 1.8 | |||
Machinery-Diversified | 1.8 | |||
Building Materials | 1.7 | |||
Electric | 1.7 | |||
Diversified Financial Services | 1.5 | |||
Auto Parts & Equipment | 1.4 | |||
Metal Fabricate/Hardware | 1.4 | |||
Real Estate Investment Trusts (REITs) | 1.4 | |||
Packaging & Containers | 1.3 | |||
Leisure Time | 1.2 | |||
Transportation | 0.9 | |||
Holding Companies-Diversified | 0.9 | |||
Real Estate | 0.9 | |||
Investment Companies | 0.8 | |||
Distribution/Wholesale | 0.8 | |||
Home Furnishings | 0.8 | |||
Electronics | 0.8 | |||
Internet | 0.7 | |||
Environmental Control | 0.7 | |||
Pharmaceuticals | 0.7 | |||
Engineering & Construction | 0.6 | |||
Oil & Gas | 0.6 | |||
Cosmetics/Personal Care | 0.6 |
Textiles | 0.4 | % | ||
Advertising | 0.4 | |||
Foods | 0.4 | |||
Semiconductors | 0.4 | |||
Housewares | 0.4 | |||
Pipelines | 0.4 | |||
Aerospace & Defense | 0.4 | |||
Beverages | 0.3 | |||
Private Equity | 0.3 | |||
Mining | 0.3 | |||
Healthcare-Products | 0.3 | |||
Lodging | 0.3 | |||
Agriculture | 0.3 | |||
Residential Mortgage-Backed Security | 0.2 | |||
Oil, Gas & Consumable Fuels | 0.2 | |||
Shipbuilding | 0.2 | |||
Home Builders | 0.2 | |||
Apparel | 0.2 | |||
Other | 0.1 | |||
Wireless Telecommunication Services | 0.1 | |||
Miscellaneous Manufacturing | 0.1 | |||
Iron/Steel | 0.0 | * | ||
|
| |||
| 100.7 | ||||
Liabilities in excess of other assets | (0.7 | ) | ||
|
| |||
| 100.0 | % | |||
|
|
| * | Lessthan 0.05% |
Effects of Derivative Instruments on the Financial Statements and Primary Underlying Risk Exposure:
The Fund invested in derivative instruments during the reporting period. The primary types of risk associated with these derivative instruments are credit risk, foreign exchange risk and interest rate risk. See the Notes to Financial Statements for additional detail regarding these derivative instruments and their risks. The effect of such derivative instruments on the Fund’s financial position and financial performance as reflected in the Statement of Assets and Liabilities and Statement of Operations is presented in the summary below.
Fair values of derivative instruments as of February 29, 2024 as presented in the Statement of Assets and Liabilities:
See Notes to Financial Statements.
PGIM Floating Rate Income Fund 49
Schedule of Investments (continued)
as of February 29, 2024
Asset Derivatives | Liability Derivatives | |||||||||||
Derivatives not accounted for as hedging instruments, carried at fair value | Statement of Assets and Liabilities Location | Fair Value | Statement of Assets and Liabilities Location | Fair Value | ||||||||
Credit contracts | Due from/to broker-variation margin swaps | $ | 9,557,042 | * | — | $ | — | |||||
Foreign exchange contracts | Unrealized appreciation on OTC forward foreign currency exchange contracts | 588,273 | Unrealized depreciation on OTC forward foreign currency exchange contracts | 115,215 | ||||||||
Interest rate contracts | Due from/to broker-variation margin futures | 94,595 | * | Due from/to broker-variation margin futures | 161,822 | * | ||||||
Interest rate contracts | — | — | Unrealized depreciation on OTC swap agreements | 1,124 | ||||||||
|
|
|
| |||||||||
| $ | 10,239,910 | $ | 278,161 | |||||||||
|
|
|
| |||||||||
| * | Includes cumulative appreciation (depreciation) as reported in the schedule of open futures and centrally cleared swap contracts. Only unsettled variation margin receivable (payable) is reported within the Statement of Assets and Liabilities. |
The effects of derivative instruments on the Statement of Operations for the year ended February 29, 2024 are as follows:
Amount of Realized Gain (Loss) on Derivatives Recognized in Income | ||||||||||||
Derivatives not accounted for as hedging instruments, carried at fair value | Futures | Forward & Cross Currency Exchange Contracts | Swaps | |||||||||
Credit contracts | $ | — | $ | — | $ | 3,905,581 | ||||||
Foreign exchange contracts | — | 216,044 | — | |||||||||
Interest rate contracts | 4,133,993 | — | 74,615 | |||||||||
|
|
|
|
|
| |||||||
Total | $ | 4,133,993 | $ | 216,044 | $ | 3,980,196 | ||||||
|
|
|
|
|
| |||||||
Change in Unrealized Appreciation (Depreciation) on Derivatives Recognized in Income | ||||||||||||
Derivatives not accounted for as hedging instruments, carried at fair value | Futures | Forward & Cross Currency Exchange Contracts | Swaps | |||||||||
Credit contracts | $ | — | $ | — | $ | 9,421,816 | ||||||
Foreign exchange contracts | — | (1,731,787 | ) | — | ||||||||
Interest rate contracts | (1,239,418 | ) | — | (1,124 | ) | |||||||
|
|
|
|
|
| |||||||
Total | $ | (1,239,418 | ) | $ | (1,731,787 | ) | $ | 9,420,692 | ||||
|
|
|
|
|
| |||||||
See Notes to Financial Statements.
50
For the year ended February 29, 2024, the Fund’s average volume of derivative activities is as follows:
| Derivative Contract Type | Average Volume of Derivative Activities* | |
Futures Contracts - Long Positions (1) | $ 14,546,500 | |
Futures Contracts - Short Positions (1) | 256,799,745 | |
Forward Foreign Currency Exchange Contracts - Purchased (2) | 64,424,714 | |
Forward Foreign Currency Exchange Contracts - Sold (2) | 117,886,078 | |
Cross Currency Exchange Contracts (3) | 939,215 | |
Credit Default Swap Agreements - Sell Protection (1) | 154,035,480 | |
Total Return Swap Agreements (1) | 915,040 |
| * | Average volume is based on average quarter end balances for the year ended February 29, 2024. |
| (1) | Notional Amount in USD. |
| (2) | Value at Settlement Date. |
| (3) | Value at Trade Date. |
Financial Instruments/Transactions—Summary of Offsetting and Netting Arrangements:
The Fund invested in OTC derivatives and entered into financial instruments/transactions during the reporting period that are either offset in accordance with current requirements or are subject to enforceable master netting arrangements or similar agreements that permit offsetting. The information about offsetting and related netting arrangements for OTC derivatives and financial instruments/transactions where the legal right to set-off exists is presented in the summary below.
Offsetting of financial instrument/transaction assets and liabilities:
| Description | Gross Market Value of Recognized Assets/(Liabilities) | Collateral Pledged/(Received)(2) | Net Amount | |||
| Securities on Loan | $16,190,399 | $(16,190,399) | $— |
Offsetting of OTC derivative assets and liabilities:
Counterparty | Gross Amounts of Recognized Assets(1) | Gross Amounts of Recognized Liabilities(1) | Net Amounts of Recognized Assets/(Liabilities) | Collateral Pledged/(Received)(2) | Net Amount | |||||||||||||||
| BNP | $ | — | $ | (1,124 | ) | $ | (1,124 | ) | $ | — | $ | (1,124 | ) | |||||||
| BNYM | 334,375 | (55,794 | ) | 278,581 | (278,581 | ) | — | |||||||||||||
| MSI | 154,046 | — | 154,046 | — | 154,046 | |||||||||||||||
| SCB | 5,861 | — | 5,861 | — | 5,861 | |||||||||||||||
| SSB | 93,991 | (59,421 | ) | 34,570 | — | 34,570 | ||||||||||||||
|
|
|
|
|
|
|
|
|
| |||||||||||
| $ | 588,273 | $ | (116,339 | ) | $ | 471,934 | $ | (278,581 | ) | $ | 193,353 | |||||||||
|
|
|
|
|
|
|
|
|
| |||||||||||
| (1) | Includes unrealized appreciation/(depreciation) on swaps and forwards, premiums paid/(received) on swap agreements and market value of purchased and written options, as represented on the Statement of Assets and Liabilities. |
| (2) | Collateral amount disclosed by the Fund is limited to the market value of financial instruments/transactions and the Fund’s OTC derivative exposure by counterparty. |
See Notes to Financial Statements.
PGIM Floating Rate Income Fund 51
Statement of Assets and Liabilities
as of February 29, 2024
Assets | ||||
Investments at value, including securities on loan of $16,190,399: | ||||
Unaffiliated investments (cost $2,132,326,944) | $ | 2,017,695,698 | ||
Affiliated investments (cost $52,091,705) | 52,092,935 | |||
Cash | 829,076 | |||
Foreign currency, at value (cost $1,632,848) | 1,627,327 | |||
Receivable for investments sold | 68,665,912 | |||
Dividends and interest receivable | 15,816,307 | |||
Deposit with broker for centrally cleared/exchange-traded derivatives | 13,788,000 | |||
Receivable for Fund shares sold | 9,012,618 | |||
Receivable from custodian | 3,528,277 | |||
Unrealized appreciation on OTC forward foreign currency exchange contracts | 588,273 | |||
Due from broker—variation margin swaps | 285,304 | |||
Unrealized appreciation on unfunded loan commitment | 3,310 | |||
Prepaid expenses and other assets | 99,119 | |||
|
| |||
Total Assets | 2,184,032,156 | |||
|
| |||
Liabilities | ||||
Payable for investments purchased | 97,604,577 | |||
Payable to broker for collateral for securities on loan | 16,603,275 | |||
Payable for Fund shares purchased | 12,246,923 | |||
Dividends payable | 1,013,885 | |||
Management fee payable | 972,615 | |||
Accrued expenses and other liabilities | 719,623 | |||
Unrealized depreciation on OTC forward foreign currency exchange contracts | 115,215 | |||
Distribution fee payable | 78,064 | |||
Directors’ fees payable | 10,146 | |||
Due to broker—variation margin futures | 8,634 | |||
Affiliated transfer agent fee payable | 5,622 | |||
Unrealized depreciation on OTC swap agreements | 1,124 | |||
|
| |||
Total Liabilities | 129,379,703 | |||
|
| |||
Net Assets | $ | 2,054,652,453 | ||
|
| |||
Net assets were comprised of: | ||||
Common stock, at par | $ | 2,248 | ||
Paid-in capital in excess of par | 2,451,578,809 | |||
Total distributable earnings (loss) | (396,928,604 | ) | ||
|
| |||
Net assets, February 29, 2024 | $ | 2,054,652,453 | ||
|
| |||
See Notes to Financial Statements.
52
Class A | ||||
Net asset value and redemption price per share, | $ | 9.13 | ||
Maximum sales charge (2.25% of offering price) | 0.21 | |||
|
| |||
Maximum offering price to public | $ | 9.34 | ||
|
| |||
Class C | ||||
Net asset value, offering price and redemption price per share, | $ | 9.14 | ||
|
| |||
Class Z | ||||
Net asset value, offering price and redemption price per share, | $ | 9.14 | ||
|
| |||
Class R6 | ||||
Net asset value, offering price and redemption price per share, | $ | 9.14 | ||
|
| |||
See Notes to Financial Statements.
PGIM Floating Rate Income Fund 53
Statement of Operations
Year Ended February 29, 2024
Net Investment Income (Loss) | ||||
Income | ||||
Interest income | $ | 204,939,575 | ||
Affiliated dividend income | 670,946 | |||
Unaffiliated dividend income | 240,843 | |||
Income from securities lending, net (including affiliated income of $55,852) | 56,210 | |||
|
| |||
Total income | 205,907,574 | |||
|
| |||
Expenses | ||||
Management fee | 13,838,610 | |||
Distribution fee(a) | 1,002,228 | |||
Transfer agent’s fees and expenses (including affiliated expense of $31,241)(a) | 1,940,367 | |||
Interest expense | 1,163,576 | |||
Custodian and accounting fees | 460,092 | |||
Registration fees(a) | 163,106 | |||
Shareholders’ reports | 125,319 | |||
Professional fees | 85,283 | |||
Audit fee | 66,780 | |||
Directors’ fees | 29,343 | |||
Miscellaneous | 240,169 | |||
|
| |||
Total expenses | 19,114,873 | |||
Less: Fee waiver and/or expense reimbursement(a) | (2,183,605 | ) | ||
|
| |||
Net expenses | 16,931,268 | |||
|
| |||
Net investment income (loss) | 188,976,306 | |||
|
| |||
Realized And Unrealized Gain (Loss) On Investment And Foreign Currency Transactions | ||||
Net realized gain (loss) on: | ||||
Investment transactions (including affiliated of $13,971) | (105,005,082 | ) | ||
Futures transactions | 4,133,993 | |||
Forward and cross currency contract transactions | 216,044 | |||
Swap agreement transactions | 3,980,196 | |||
Foreign currency transactions | (2,912,897 | ) | ||
|
| |||
| (99,587,746 | ) | |||
|
| |||
Net change in unrealized appreciation (depreciation) on: | ||||
Investments (including affiliated of $(20,688)) | 121,351,899 | |||
Futures | (1,239,418 | ) | ||
Forward and cross currency contracts | (1,731,787 | ) | ||
Swap agreements | 9,420,692 | |||
Foreign currencies | 89,662 | |||
Unfunded loan commitments | 132,362 | |||
|
| |||
| 128,023,410 | ||||
|
| |||
Net gain (loss) on investment and foreign currency transactions | 28,435,664 | |||
|
| |||
Net Increase (Decrease) In Net Assets Resulting From Operations | $ | 217,411,970 | ||
|
| |||
See Notes to Financial Statements.
54
| (a) | Class specific expenses and waivers were as follows: |
| Class A | Class C | Class Z | Class R6 | |||||||||||||
Distribution fee | 456,791 | 545,437 | — | — | ||||||||||||
Transfer agent’s fees and expenses | 149,199 | 46,183 | 1,741,228 | 3,757 | ||||||||||||
Registration fees | 29,169 | 19,768 | 89,872 | 24,297 | ||||||||||||
Fee waiver and/or expense reimbursement | (170,041 | ) | (63,858 | ) | (1,785,283 | ) | (164,423 | ) | ||||||||
See Notes to Financial Statements.
PGIM Floating Rate Income Fund 55
Statements of Changes in Net Assets
Year Ended February 28/29, | ||||||||
| 2024 | 2023 | |||||||
Increase (Decrease) in Net Assets | ||||||||
Operations | ||||||||
Net investment income (loss) | $ | 188,976,306 | $ | 232,590,056 | ||||
Net realized gain (loss) on investment and foreign currency transactions | (99,587,746 | ) | (118,418,523 | ) | ||||
Net change in unrealized appreciation (depreciation) on investments and foreign currencies | 128,023,410 | (153,710,400 | ) | |||||
|
|
|
| |||||
Net increase (decrease) in net assets resulting from operations | 217,411,970 | (39,538,867 | ) | |||||
|
|
|
| |||||
Dividends and Distributions | ||||||||
Distributions from distributable earnings | ||||||||
Class A | (15,999,658 | ) | (13,656,461 | ) | ||||
Class C | (4,363,945 | ) | (4,270,073 | ) | ||||
Class Z | (144,217,161 | ) | (208,424,892 | ) | ||||
Class R6 | (25,887,178 | ) | (30,385,223 | ) | ||||
|
|
|
| |||||
| (190,467,942 | ) | (256,736,649 | ) | |||||
|
|
|
| |||||
Tax return of capital distributions | ||||||||
Class A | (185,554 | ) | — | |||||
Class C | (50,610 | ) | — | |||||
Class Z | (1,672,536 | ) | — | |||||
Class R6 | (300,223 | ) | — | |||||
|
|
|
| |||||
| (2,208,923 | ) | — | ||||||
|
|
|
| |||||
Fund share transactions (Net of share conversions) | ||||||||
Net proceeds from shares sold | 751,016,841 | 2,005,357,293 | ||||||
Net asset value of shares issued in reinvestment of dividends and distributions | 181,634,610 | 247,283,405 | ||||||
Cost of shares purchased | (1,569,821,253 | ) | (3,771,723,482 | ) | ||||
|
|
|
| |||||
Net increase (decrease) in net assets from Fund share transactions | (637,169,802 | ) | (1,519,082,784 | ) | ||||
|
|
|
| |||||
Total increase (decrease) | (612,434,697 | ) | (1,815,358,300 | ) | ||||
Net Assets: | ||||||||
Beginning of year | 2,667,087,150 | 4,482,445,450 | ||||||
|
|
|
| |||||
End of year | $ | 2,054,652,453 | $ | 2,667,087,150 | ||||
|
|
|
| |||||
See Notes to Financial Statements.
56
Financial Highlights
Class A Shares | ||||||||||||||||||||
| Year Ended February 28/29, | ||||||||||||||||||||
| 2024 | 2023 | 2022 | 2021 | 2020 | ||||||||||||||||
Per Share Operating Performance(a): | ||||||||||||||||||||
Net Asset Value, Beginning of Year | $8.98 | $9.51 | $9.65 | $9.38 | $9.72 | |||||||||||||||
Income (loss) from investment operations: | ||||||||||||||||||||
Net investment income (loss) | 0.78 | 0.54 | 0.32 | 0.45 | 0.53 | |||||||||||||||
| Net realized and unrealized gain (loss) on investment and foreign currency transactions | 0.16 | (0.45) | (0.13 | ) | 0.27 | (b) | (0.33) | |||||||||||||
Total from investment operations | 0.94 | 0.09 | 0.19 | 0.72 | 0.20 | |||||||||||||||
Less Dividends and Distributions: | ||||||||||||||||||||
Dividends from net investment income | (0.78 | ) | (0.62 | ) | (0.33 | ) | (0.45 | ) | (0.54 | ) | ||||||||||
Tax return of capital distributions | (0.01 | ) | - | - | - | - | ||||||||||||||
Total dividends and distributions | (0.79 | ) | (0.62 | ) | (0.33 | ) | (0.45 | ) | (0.54 | ) | ||||||||||
Net asset value, end of year | $9.13 | $8.98 | $9.51 | $9.65 | $9.38 | |||||||||||||||
Total Return(c): | 11.03 | % | 1.22 | % | 1.93 | % | 8.25 | % | 2.14 | % | ||||||||||
Ratios/Supplemental Data: | ||||||||||||||||||||
Net assets, end of year (000) | $189,497 | $177,406 | $221,472 | $60,644 | $61,392 | |||||||||||||||
Average net assets (000) | $182,716 | $203,544 | $132,395 | $48,786 | $79,796 | |||||||||||||||
Ratios to average net assets(d): | ||||||||||||||||||||
Expenses after waivers and/or expense reimbursement | 1.00 | %(e) | 1.00 | %(e) | 0.95 | % | 0.97 | %(e) | 0.97 | % | ||||||||||
Expenses before waivers and/or expense reimbursement | 1.09 | % | 1.11 | %(e) | 1.07 | % | 1.17 | %(e) | 1.11 | % | ||||||||||
Net investment income (loss) | 8.67 | % | 6.01 | % | 3.29 | % | 5.04 | % | 5.53 | % | ||||||||||
Portfolio turnover rate(f) | 68 | % | 43 | % | 43 | % | 125 | % | 66 | % | ||||||||||
| (a) | Calculated based on average shares outstanding during the year. |
| (b) | The per share amount of realized and unrealized gain (loss) on investments does not directly correlate to the amounts reported in the Statement of Operations due to the timing of portfolio share transactions in relation to fluctuating market values. |
| (c) | Total return does not consider the effects of sales loads. Total return is calculated assuming a purchase of a share on the first day and a sale on the last day of each year reported and includes reinvestment of dividends and distributions, if any. Total returns may reflect adjustments to conform to GAAP. |
| (d) | Does not include expenses of the underlying funds in which the Fund invests. |
| (e) | Includes interest expense on borrowings from the Syndicated Credit Agreement and certain non-recurring expenses of 0.05%, 0.05% and 0.02%, respectively, which are being excluded from the Fund’s contractual waiver for the years ended February 28/29, 2024, 2023 and 2021, respectively. |
| (f) | The Fund’s portfolio turnover rate is calculated in accordance with regulatory requirements, without regard to transactions involving short-term investments, certain derivatives and in-kind transactions (if any). If such transactions were included, the Fund’s portfolio turnover rate may be higher. |
See Notes to Financial Statements.
PGIM Floating Rate Income Fund 57
Financial Highlights (continued)
Class C Shares | ||||||||||||||||||||
| Year Ended February 28/29, | ||||||||||||||||||||
| 2024 | 2023 | 2022 | 2021 | 2020 | ||||||||||||||||
Per Share Operating Performance(a): | ||||||||||||||||||||
Net Asset Value, Beginning of Year | $8.98 | $9.52 | $9.66 | $9.38 | $9.72 | |||||||||||||||
Income (loss) from investment operations: | ||||||||||||||||||||
Net investment income (loss) | 0.71 | 0.48 | 0.25 | 0.39 | 0.46 | |||||||||||||||
| Net realized and unrealized gain (loss) on investment and foreign currency transactions | 0.18 | (0.47 | ) | (0.14 | ) | 0.28 | (b) | (0.33 | ) | |||||||||||
Total from investment operations | 0.89 | 0.01 | 0.11 | 0.67 | 0.13 | |||||||||||||||
Less Dividends and Distributions: | ||||||||||||||||||||
Dividends from net investment income | (0.72 | ) | (0.55 | ) | (0.25 | ) | (0.39 | ) | (0.47 | ) | ||||||||||
Tax return of capital distributions | (0.01 | ) | - | - | - | - | ||||||||||||||
Total dividends and distributions | (0.73 | ) | (0.55 | ) | (0.25 | ) | (0.39 | ) | (0.47 | ) | ||||||||||
Net asset value, end of year | $9.14 | $8.98 | $9.52 | $9.66 | $9.38 | |||||||||||||||
Total Return(c): | 10.33 | % | 0.36 | % | 1.16 | % | 7.56 | % | 1.38 | % | ||||||||||
Ratios/Supplemental Data: | ||||||||||||||||||||
Net assets, end of year (000) | $51,783 | $61,349 | $69,648 | $24,973 | $32,673 | |||||||||||||||
Average net assets (000) | $54,544 | $70,642 | $45,432 | $25,795 | $44,099 | |||||||||||||||
Ratios to average net assets(d): | ||||||||||||||||||||
Expenses after waivers and/or expense reimbursement | 1.75 | %(e) | 1.76 | %(e) | 1.70 | % | 1.72 | %(e) | 1.72 | % | ||||||||||
Expenses before waivers and/or expense reimbursement | 1.87 | % | 1.90 | %(e) | 1.84 | % | 1.94 | %(e) | 1.88 | % | ||||||||||
Net investment income (loss) | 7.92 | % | 5.32 | % | 2.54 | % | 4.31 | % | 4.78 | % | ||||||||||
Portfolio turnover rate(f) | 68 | % | 43 | % | 43 | % | 125 | % | 66 | % | ||||||||||
| (a) | Calculated based on average shares outstanding during the year. |
| (b) | The per share amount of realized and unrealized gain (loss) on investments does not directly correlate to the amounts reported in the Statement of Operations due to the timing of portfolio share transactions in relation to fluctuating market values. |
| (c) | Total return does not consider the effects of sales loads. Total return is calculated assuming a purchase of a share on the first day and a sale on the last day of each year reported and includes reinvestment of dividends and distributions, if any. Total returns may reflect adjustments to conform to GAAP. |
| (d) | Does not include expenses of the underlying funds in which the Fund invests. |
| (e) | Includes interest expense on borrowings from the Syndicated Credit Agreement and certain non-recurring expenses of 0.05%, 0.06% and 0.02%, respectively, which are being excluded from the Fund’s contractual waiver for the years ended February 28/29, 2024, 2023 and 2021, respectively. |
| (f) | The Fund’s portfolio turnover rate is calculated in accordance with regulatory requirements, without regard to transactions involving short-term investments, certain derivatives and in-kind transactions (if any). If such transactions were included, the Fund’s portfolio turnover rate may be higher. |
See Notes to Financial Statements.
58
Class Z Shares |
| |||||||||||||||||||
| Year Ended February 28/29, | ||||||||||||||||||||
| 2024 | 2023 | 2022 | 2021 | 2020 | ||||||||||||||||
Per Share Operating Performance(a): | ||||||||||||||||||||
Net Asset Value, Beginning of Year | $8.99 | $9.52 | $9.66 | $9.39 | $9.73 | |||||||||||||||
Income (loss) from investment operations: | ||||||||||||||||||||
Net investment income (loss) | 0.80 | 0.55 | 0.35 | 0.47 | 0.56 | |||||||||||||||
| Net realized and unrealized gain (loss) on investment and foreign currency transactions | 0.17 | (0.43 | ) | (0.14 | ) | 0.28 | (b) | (0.33 | ) | |||||||||||
Total from investment operations | 0.97 | 0.12 | 0.21 | 0.75 | 0.23 | |||||||||||||||
Less Dividends and Distributions: | ||||||||||||||||||||
Dividends from net investment income | (0.81 | ) | (0.65 | ) | (0.35 | ) | (0.48 | ) | (0.57 | ) | ||||||||||
Tax return of capital distributions | (0.01 | ) | - | - | - | - | ||||||||||||||
Total dividends and distributions | (0.82 | ) | (0.65 | ) | (0.35 | ) | (0.48 | ) | (0.57 | ) | ||||||||||
Net asset value, end of year | $9.14 | $8.99 | $9.52 | $9.66 | $9.39 | |||||||||||||||
Total Return(c): | 11.30 | % | 1.48 | % | 2.18 | % | 8.51 | % | 2.40 | % | ||||||||||
Ratios/Supplemental Data: | ||||||||||||||||||||
Net assets, end of year (000) | $1,542,156 | $2,077,632 | $3,794,840 | $564,615 | $424,819 | |||||||||||||||
Average net assets (000) | $1,605,227 | $3,121,921 | $1,828,765 | $283,976 | $584,427 | |||||||||||||||
Ratios to average net assets(d): | ||||||||||||||||||||
Expenses after waivers and/or expense reimbursement | 0.76 | %(e) | 0.75 | %(e) | 0.70 | % | 0.72 | %(e) | 0.72 | % | ||||||||||
Expenses before waivers and/or expense reimbursement | 0.87 | % | 0.88 | %(e) | 0.81 | % | 0.90 | %(e) | 0.87 | % | ||||||||||
Net investment income (loss) | 8.91 | % | 6.06 | % | 3.55 | % | 5.18 | % | 5.78 | % | ||||||||||
Portfolio turnover rate(f) | 68 | % | 43 | % | 43 | % | 125 | % | 66 | % | ||||||||||
| (a) | Calculated based on average shares outstanding during the year. |
| (b) | The per share amount of realized and unrealized gain (loss) on investments does not directly correlate to the amounts reported in the Statement of Operations due to the timing of portfolio share transactions in relation to fluctuating market values. |
| (c) | Total return is calculated assuming a purchase of a share on the first day and a sale on the last day of each year reported and includes reinvestment of dividends and distributions, if any. Total returns may reflect adjustments to conform to GAAP. |
| (d) | Does not include expenses of the underlying funds in which the Fund invests. |
| (e) | Includes interest expense on borrowings from the Syndicated Credit Agreement and certain non-recurring expenses of 0.06%, 0.05% and 0.02%, respectively, which are being excluded from the Fund’s contractual waiver for the years ended February 28/29, 2024, 2023 and 2021, respectively. |
| (f) | The Fund’s portfolio turnover rate is calculated in accordance with regulatory requirements, without regard to transactions involving short-term investments, certain derivatives and in-kind transactions (if any). If such transactions were included, the Fund’s portfolio turnover rate may be higher. |
See Notes to Financial Statements.
PGIM Floating Rate Income Fund 59
Financial Highlights (continued)
Class R6 Shares | ||||||||||||||||||||
| Year Ended February 28/29, | ||||||||||||||||||||
| 2024 | 2023 | 2022 | 2021 | 2020 | ||||||||||||||||
Per Share Operating Performance(a): | ||||||||||||||||||||
Net Asset Value, Beginning of Year | $8.99 | $9.53 | $9.66 | $9.39 | $9.73 | |||||||||||||||
Income (loss) from investment operations: | ||||||||||||||||||||
Net investment income (loss) | 0.80 | 0.58 | 0.35 | 0.48 | 0.56 | |||||||||||||||
| Net realized and unrealized gain (loss) on investment and foreign currency transactions | 0.17 | (0.47 | ) | (0.13 | ) | 0.27 | (b) | (0.33 | ) | |||||||||||
Total from investment operations | 0.97 | 0.11 | 0.22 | 0.75 | 0.23 | |||||||||||||||
Less Dividends and Distributions: | ||||||||||||||||||||
Dividends from net investment income | (0.81 | ) | (0.65 | ) | (0.35 | ) | (0.48 | ) | (0.57 | ) | ||||||||||
Tax return of capital distributions | (0.01 | ) | - | - | - | - | ||||||||||||||
Total dividends and distributions | (0.82 | ) | (0.65 | ) | (0.35 | ) | (0.48 | ) | (0.57 | ) | ||||||||||
Net asset value, end of year | $9.14 | $8.99 | $9.53 | $9.66 | $9.39 | |||||||||||||||
Total Return(c): | 11.36 | % | 1.42 | % | 2.34 | % | 8.57 | % | 2.45 | % | ||||||||||
Ratios/Supplemental Data: | ||||||||||||||||||||
Net assets, end of year (000) | $271,216 | $350,700 | $396,487 | $16,970 | $14,790 | |||||||||||||||
Average net assets (000) | $286,529 | $428,601 | $180,674 | $11,040 | $25,645 | |||||||||||||||
Ratios to average net assets(d): | ||||||||||||||||||||
Expenses after waivers and/or expense reimbursement | 0.71 | %(e) | 0.70 | %(e) | 0.65 | % | 0.67 | %(e) | 0.67 | % | ||||||||||
Expenses before waivers and/or expense reimbursement | 0.77 | % | 0.76 | %(e) | 0.72 | % | 0.93 | %(e) | 0.81 | % | ||||||||||
Net investment income (loss) | 8.97 | % | 6.38 | % | 3.62 | % | 5.31 | % | 5.84 | % | ||||||||||
Portfolio turnover rate(f) | 68 | % | 43 | % | 43 | % | 125 | % | 66 | % | ||||||||||
| (a) | Calculated based on average shares outstanding during the year. |
| (b) | The per share amount of realized and unrealized gain (loss) on investments does not directly correlate to the amounts reported in the Statement of Operations due to the timing of portfolio share transactions in relation to fluctuating market values. |
| (c) | Total return is calculated assuming a purchase of a share on the first day and a sale on the last day of each year reported and includes reinvestment of dividends and distributions, if any. Total returns may reflect adjustments to conform to GAAP. |
| (d) | Does not include expenses of the underlying funds in which the Fund invests. |
| (e) | Includes interest expense on borrowings from the Syndicated Credit Agreement and certain non-recurring expenses of 0.06%, 0.05% and 0.02%, respectively, which are being excluded from the Fund’s contractual waiver for the years ended February 28/29, 2024, 2023 and 2021, respectively. |
| (f) | The Fund’s portfolio turnover rate is calculated in accordance with regulatory requirements, without regard to transactions involving short-term investments, certain derivatives and in-kind transactions (if any). If such transactions were included, the Fund’s portfolio turnover rate may be higher. |
See Notes to Financial Statements.
60
Notes to Financial Statements
| 1. | Organization |
Prudential Investment Portfolios, Inc. 14 (the “Registered Investment Company” or “RIC”) is registered under the Investment Company Act of 1940, as amended (“1940 Act”), as an open-end management investment company. The RIC is organized as a Maryland Corporation. These financial statements relate only to the PGIM Floating Rate Income Fund (the “Fund’), a series of the RIC. The Fund is classified as a diversified fund for purposes of the 1940 Act.
The primary objective of the Fund is to maximize current income. The secondary objective is to seek capital appreciation when consistent with the Fund’s primary objective.
| 2. | Accounting Policies |
The Fund follows the investment company accounting and reporting guidance of the Financial Accounting Standards Board (“FASB”) Accounting Standard Codification (“ASC”) Topic 946 Financial Services — Investment Companies. The following is a summary of significant accounting policies followed by the Fund in the preparation of its financial statements. The policies conform to U.S. generally accepted accounting principles (“GAAP”). The Fund consistently follows such policies in the preparation of its financial statements.
Securities Valuation: The Fund holds securities and other assets and liabilities that are fair valued as of the close of each day (generally, 4:00 PM Eastern time) the New York Stock Exchange (“NYSE”) is open for trading. As described in further detail below, the Fund’s investments are valued daily based on a number of factors, including the type of investment and whether market quotations are readily available. The RIC’s Board of Directors (the “Board”) has approved the Fund’s valuation policies and procedures for security valuation and designated PGIM Investments LLC (“PGIM Investments” or the “Manager”) as the “Valuation Designee,” as defined by Rule 2a-5(b) under the 1940 Act, to perform the fair value determination relating to all Fund investments. Pursuant to the Board’s oversight, the Valuation Designee has established a Valuation Committee to perform the duties and responsibilities as Valuation Designee under Rule 2a-5. The valuation procedures permit the Fund to utilize independent pricing vendor services, quotations from market makers, and alternative valuation methods when market quotations are either not readily available or not deemed representative of fair value. Fair value is the estimated price that would be received to sell an asset or paid to transfer a liability in an orderly transaction between market participants on the measurement date.
For the fiscal reporting year-end, securities and other assets and liabilities were fair valued at the close of the last U.S. business day. Trading in certain foreign securities may occur when the NYSE is closed (including weekends and holidays). Because such foreign securities
PGIM Floating Rate Income Fund 61
Notes to Financial Statements (continued)
trade in markets that are open on weekends and U.S. holidays, the values of some of the Fund’s foreign investments may change on days when investors cannot purchase or redeem Fund shares.
Various inputs determine how the Fund’s investments are valued, all of which are categorized according to the three broad levels (Level 1, 2, or 3) detailed in the Schedule of Investments and referred to herein as the “fair value hierarchy” in accordance with FASB ASC Topic 820 Fair Value Measurement.
Common or preferred stocks, exchange-traded funds (“ETFs”) and derivative instruments, if applicable, that are traded on a national securities exchange are valued at the last sale price as of the close of trading on the applicable exchange where the security principally trades. Securities traded via NASDAQ are valued at the NASDAQ official closing price. To the extent these securities are valued at the last sale price or NASDAQ official closing price, they are classified as Level 1 in the fair value hierarchy. In the event that no sale or official closing price on a valuation date exists, these securities are generally valued at the mean between the last reported bid and ask prices, or at the last bid price in the absence of an ask price. These securities are classified as Level 2 in the fair value hierarchy.
Investments in open-end funds (other than ETFs) are valued at their net asset values as of the close of the NYSE on the date of valuation. These securities are classified as Level 1 in the fair value hierarchy since they may be purchased or sold at their net asset values on the date of valuation.
Fixed income securities traded in the OTC market are generally classified as Level 2 in the fair value hierarchy. Such fixed income securities are typically valued using the market approach which generally involves obtaining data from an approved independent third-party vendor source. The Fund utilizes the market approach as the primary method to value securities when market prices of identical or comparable instruments are available. The third-party vendors’ valuation techniques used to derive the evaluated bid price are based on evaluating observable inputs, including but not limited to, yield curves, yield spreads, credit ratings, deal terms, tranche level attributes, default rates, cash flows, prepayment speeds, broker/dealer quotations and reported trades. Certain Level 3 securities are also valued using the market approach when obtaining a single broker quote or when utilizing transaction prices for identical securities that have been used in excess of five business days. During the reporting period, there were no changes to report with respect to the valuation approach and/or valuation techniques discussed above.
Floating rate and other loans are generally valued at prices provided by approved independent pricing vendors. The pricing vendors utilize broker/dealer quotations and provide prices based on the average of such quotations. Floating rate and other loans valued
62
using such vendor prices are generally classified as Level 2 in the fair value hierarchy. Floating rate and other loans valued based on a single broker quote or at the original transaction price in excess of five business days are classified as Level 3 in the fair value hierarchy.
OTC and centrally cleared derivative instruments are generally classified as Level 2 in the fair value hierarchy. Such derivative instruments are typically valued using the market approach and/or income approach which generally involves obtaining data from an approved independent third-party vendor source. The Fund utilizes the market approach when quoted prices in broker-dealer markets are available but also includes consideration of alternative valuation approaches, including the income approach. In the absence of reliable market quotations, the income approach is typically utilized for purposes of valuing derivatives such as interest rate swaps based on a discounted cash flow analysis whereby the value of the instrument is equal to the present value of its future cash inflows or outflows. Such analysis includes projecting future cash flows and determining the discount rate (including the present value factors that affect the discount rate) used to discount the future cash flows. In addition, the third-party vendors’ valuation techniques used to derive the evaluated derivative price is based on evaluating observable inputs, including but not limited to, underlying asset prices, indices, spreads, interest rates and exchange rates. Certain derivatives may be classified as Level 3 when valued using the market approach by obtaining a single broker quote or when utilizing unobservable inputs in the income approach. During the reporting period, there were no changes to report with respect to the valuation approach and/or valuation techniques discussed above.
Securities and other assets that cannot be priced according to the methods described above are valued based on policies and procedures approved by the Board. In the event that unobservable inputs are used when determining such valuations, the securities will be classified as Level 3 in the fair value hierarchy. Altering one or more unobservable inputs may result in a significant change to a Level 3 security’s fair value measurement.
When determining the fair value of securities, some of the factors influencing the valuation include: the nature of any restrictions on disposition of the securities; assessment of the general liquidity of the securities; the issuer’s financial condition and the markets in which it does business; the cost of the investment; the size of the holding and the capitalization of the issuer; the prices of any recent transactions or bids/offers for such securities or any comparable securities; and any available analyst media or other reports or information deemed reliable by the Valuation Designee regarding the issuer or the markets or industry in which it operates. Using fair value to price securities may result in a value that is different from a security’s most recent closing price and from the price used by other unaffiliated mutual funds to calculate their net asset values.
Foreign Currency Translation: The books and records of the Fund are maintained in U.S. dollars. Foreign currency amounts are translated into U.S. dollars on the following basis:
PGIM Floating Rate Income Fund 63
Notes to Financial Statements (continued)
(i) market value of investment securities, other assets and liabilities — at the exchange rate as of the valuation date;
(ii) purchases and sales of investment securities, income and expenses — at the rates of exchange prevailing on the respective dates of such transactions.
Although the net assets of the Fund are presented at the foreign exchange rates and market values at the close of the period, the Fund does not generally isolate that portion of the results of operations arising as a result of changes in the foreign exchange rates from the fluctuations arising from changes in the market prices of long-term portfolio securities held at the end of the period. Similarly, the Fund does not isolate the effect of changes in foreign exchange rates from the fluctuations arising from changes in the market prices of long-term portfolio securities sold during the period. Accordingly, holding period unrealized and realized foreign currency gains (losses) are included in the reported net change in unrealized appreciation (depreciation) on investments and net realized gains (losses) on investment transactions on the Statements of Operations. Notwithstanding the above, the Fund does isolate the effect of fluctuations in foreign currency exchange rates when determining the gain (loss) upon the sale or maturity of foreign currency denominated debt obligations; such amounts are included in net realized gains (losses) on foreign currency transactions.
Additionally, net realized gains (losses) on foreign currency transactions represent net foreign exchange gains (losses) from the disposition of holdings of foreign currencies, currency gains (losses) realized between the trade and settlement dates on investment transactions, and the difference between the amounts of interest, dividends and foreign withholding taxes recorded on the Fund’s books and the U.S. dollar equivalent amounts actually received or paid. Net unrealized currency gains (losses) arise from valuing foreign currency denominated assets and liabilities (other than investments) at period end exchange rates.
Forward and Cross Currency Contracts: A forward currency contract is a commitment to purchase or sell a foreign currency at a future date at a negotiated forward rate. The Fund enters into forward currency contracts, as defined in the prospectus, in order to hedge its exposure to changes in foreign currency exchange rates on its foreign portfolio holdings or on specific receivables and payables denominated in a foreign currency and to gain exposure to certain currencies. The contracts are valued daily at current forward exchange rates and any unrealized gain (loss) is included in net unrealized appreciation or depreciation on forward and cross currency contracts. Gain (loss) is realized on the settlement date of the contract equal to the difference between the settlement value of the original and negotiated forward contracts. This gain (loss), if any, is included in net realized gain (loss) on forward and cross currency contract transactions. Risks may arise upon
64
entering into these contracts from the potential inability of the counterparties to meet the terms of their contracts. Forward currency contracts involve risks from currency exchange rate and credit risk in excess of the amounts reflected on the Statement of Assets and Liabilities. The Fund’s maximum risk of loss from counterparty credit risk is the net value of the cash flows to be received from the counterparty at the end of the contract’s life. A cross currency contract is a forward contract where a specified amount of one foreign currency will be exchanged for a specified amount of another foreign currency.
Financial Futures Contracts: A financial futures contract is an agreement to purchase (long) or sell (short) an agreed amount of securities at a set price for delivery on a future date. Upon entering into a financial futures contract, the Fund is required to pledge to the broker an amount of cash and/or other assets equal to a certain percentage of the contract amount. This amount is known as the “initial margin.” Subsequent payments, known as “variation margin,” are made or received by the Fund each day, depending on the daily fluctuations in the value of the underlying security. Such variation margin is recorded for financial statement purposes on a daily basis as unrealized gain (loss). When the contract expires or is closed, the gain (loss) is realized and is presented in the Statement of Operations as net realized gain (loss) on futures transactions. The cash amounts pledged for futures contracts are considered restricted cash and are included in “Due to broker-variation margin futures” in the Statement of Assets and Liabilities.
The Fund invested in financial futures contracts in order to hedge its existing portfolio securities, or securities the Fund intends to purchase, against fluctuations in value caused by changes in prevailing interest rates. Should interest rates move unexpectedly, the Fund may not achieve the anticipated benefits of the financial futures contracts and may realize a loss. The use of futures transactions involves the risk of imperfect correlation in movements in the price of futures contracts, interest rates and the underlying hedged assets. Since futures contracts are exchange-traded, there is minimal counterparty credit risk to the Fund since the exchanges’ clearinghouse acts as counterparty to all exchange-traded futures and guarantees the futures contracts against default.
Swap Agreements: The Fund entered into certain types of swap agreements detailed in the disclosures below. A swap agreement is an agreement to exchange the return generated by one instrument for the return generated by another instrument. Swap agreements are negotiated in the OTC market and may be executed either directly with a counterparty (“OTC-traded”) or through a central clearing facility, such as a registered exchange. Swap agreements are valued daily at current market value and any change in value is included in the net unrealized appreciation or depreciation on swap agreements. Centrally cleared swaps pay or receive an amount known as “variation margin”, based on daily changes in the valuation of the swap contract. For OTC-traded, upfront premiums paid and received are shown as swap premiums paid and swap premiums received in the Statement of Assets and Liabilities. Risk of loss may exceed amounts recognized on the Statement of Assets and Liabilities. Swap agreements outstanding at period end, if any, are listed on the Schedule of Investments. The cash amounts pledged for swaps contracts are considered restricted cash
PGIM Floating Rate Income Fund 65
Notes to Financial Statements (continued)
and are included in “Deposit with broker for centrally cleared/exchange-traded derivatives” in the Statement of Assets and Liabilities.
Credit Default Swaps (“CDS”): CDS involve one party (the protection buyer) making a stream of payments to another party (the protection seller) in exchange for the right to receive a specified payment in the event of a default or as a result of a default (collectively a “credit event”) for the referenced entity (typically corporate issues or sovereign issues of an emerging country) on its obligation; or in the event of a write-down, principal shortfall, interest shortfall or default of all or part of the referenced entities comprising a credit index.
The Fund is subject to credit risk in the normal course of pursuing its investment objectives, and as such, has entered into CDS contracts to provide a measure of protection against defaults or to take an active long or short position with respect to the likelihood of a particular issuer’s default or the reference entity’s credit soundness. CDS contracts generally trade based on a spread which represents the cost a protection buyer has to pay the protection seller. The protection buyer is said to be “short the credit” because the higher the contract value rises, the more the credit deteriorates. The value of the CDS contract increases for the protection buyer if the spread increases. The Fund’s maximum risk of loss from counterparty credit risk for purchased CDS is the inability of the counterparty to honor the contract up to the notional value due to a credit event.
As a seller of protection on credit default swap agreements, the Fund generally receives an agreed upon payment from the buyer of protection throughout the term of the swap, provided no credit event occurs. As the seller, the Fund effectively increases its investment risk because, in addition to its total net assets, the Fund may be subject to investment exposure on the notional amount of the swap.
The maximum amount of the payment that the Fund, as a seller of protection, could be required to make under a credit default swap agreement would be equal to the notional amount of the underlying security or index contract as a result of a credit event. This potential amount will be partially offset by any recovery values of the respective referenced obligations or net amounts received from the settlement of buy protection credit default swap agreements which the Fund entered into for the same referenced entity or index. As a buyer of protection, the Fund generally receives an amount up to the notional value of the swap if a credit event occurs.
Implied credit spreads, represented in absolute terms, utilized in determining the market value of credit default swap agreements where the Fund is the seller of protection as of period end are disclosed in the footnotes to the Schedule of Investments, if applicable. These spreads serve as indicators of the current status of the payment/performance risk and represent the likelihood of default risk for the credit derivative. The implied credit spread of a
66
particular referenced entity reflects the cost of buying/selling protection and may include upfront payments required to enter into the agreement. Wider credit spreads and increased market value in absolute terms, when compared to the notional amount of the swap, represent a deterioration of the referenced entity’s credit soundness and a greater likelihood of risk of default or other credit event occurring as defined under the terms of the agreement.
Floating Rate and Other Loans: The Fund invested at least 80% of its investable assets in floating rate and other loans. Floating rate and other loans include loans that are privately negotiated between a corporate borrower and one or more financial institutions, including, but not limited to, term loans, revolvers, and other instruments issued in the floating rate and other loans market. Most bank loans are senior in rank (“senior loans”) in the event of bankruptcy to most other securities of the issuer, such as common stock or publicly-issued bonds. Bank loans are often secured by specific collateral of the issuer so that holders of the loans will have a priority claim on those assets in the event of default or bankruptcy of the issuer. The Fund acquire interests in loans directly (by way of assignment from the selling institution) and/or indirectly (by way of the purchase of a participation interest from the selling institution). Under a floating rate and other loans assignment, the Fund generally will succeed to all the rights and obligations of an assigning lending institution and become a lender under the loan agreement with the relevant borrower in connection with that loan. Under a floating rate and other loans participation, the Fund generally will have a contractual relationship only with the lender, not with the relevant borrower. As a result, the Fund generally will have the right to receive payments of principal, interest, and any fees to which they are entitled only from the lender selling the participation and only upon receipt by the lender of the payments from the relevant borrower. The Fund may not directly benefit from the collateral supporting the debt obligation in which they have purchased the participation. As a result, the Fund will assume the credit risk of both the borrower and the institution selling the participation to the Fund. In addition, loans trade in an over-the counter market, and confirmation and settlement, which are effected through standardized procedures and documentation, may take significantly longer than seven days to complete. Extended trade settlement periods may, in unusual market conditions with a high volume of shareholder redemptions, present a risk to shareholders regarding the Fund’s ability to pay redemption proceeds within the allowable time periods.
Master Netting Arrangements: The RIC, on behalf of the Fund, is subject to various Master Agreements, or netting arrangements, with select counterparties. These are agreements which a subadviser may have negotiated and entered into on behalf of all or a portion of the Fund. A master netting arrangement between the Fund and the counterparty permits the Fund to offset amounts payable by the Fund to the same counterparty against amounts to be received and by the receipt of collateral from the counterparty by the Fund to cover the Fund’s exposure to the counterparty. However, there is no assurance that such mitigating factors are easily enforceable. In addition to master netting arrangements, the right to set-off exists when all the conditions are met such that each of the parties owes the other determinable amounts, the reporting party has the right to set-off the amount owed with the
PGIM Floating Rate Income Fund 67
Notes to Financial Statements (continued)
amount owed by the other party, the reporting party intends to set-off and the right of set-off is enforceable by law.
The RIC, on behalf of the Fund, is a party to International Swaps and Derivatives Association, Inc. (“ISDA”) Master Agreements with certain counterparties that govern OTC derivative and foreign exchange contracts entered into from time to time. The Master Agreements may contain provisions regarding, among other things, the parties’ general obligations, representations, agreements, collateral requirements, events of default and early termination. With respect to certain counterparties, in accordance with the terms of the Master Agreements, collateral posted to the Fund is held in a segregated account by the Fund’s custodian and with respect to those amounts which can be sold or re-pledged, is presented in the Schedule of Investments. Collateral pledged by the Fund is segregated by the Fund’s custodian and identified in the Schedule of Investments. Collateral can be in the form of cash or debt securities issued by the U.S. Government or related agencies or other securities as agreed to by the Fund and the applicable counterparty. Collateral requirements are determined based on the Fund’s net position with each counterparty. Termination events applicable to the Fund may occur upon a decline in the Fund’s net assets below a specified threshold over a certain period of time. Termination events applicable to counterparties may occur upon a decline in the counterparty’s long-term and short-term credit ratings below a specified level. In each case, upon occurrence, the other party may elect to terminate early and cause settlement of all derivative and foreign exchange contracts outstanding, including the payment of any losses and costs resulting from such early termination, as reasonably determined by the terminating party. Any decision by one or more of the Fund’s counterparties to elect early termination could impact the Fund’s future derivative activity.
In addition to each instrument’s primary underlying risk exposure (e.g. interest rate, credit, equity or foreign exchange, etc.), swap agreements involve, to varying degrees, elements of credit, market and documentation risk. Such risks involve the possibility that no liquid market for these agreements will exist, the counterparty to the agreement may default on its obligation to perform or disagree on the contractual terms of the agreement, and changes in net interest rates will be unfavorable. In connection with these agreements, securities in the portfolio may be identified or received as collateral from the counterparty in accordance with the terms of the respective swap agreements to provide or receive assets of value and to serve as recourse in the event of default or bankruptcy/insolvency of either party. Such OTC derivative agreements include conditions which, when materialized, give the counterparty the right to cause an early termination of the transactions under those agreements. Any election by the counterparty for early termination of the contract(s) may impact the amounts reported on financial statements.
Short sales and OTC contracts, including forward foreign currency exchange contracts, swaps, forward rate agreements and written options involve elements of both market and
68
credit risk in excess of the amounts reflected on the Statement of Assets and Liabilities, if applicable. Such risks may be mitigated by engaging in master netting arrangements.
Rights: The Fund held rights acquired either through a direct purchase or pursuant to corporate actions. Rights entitle the holder to buy a proportionate amount of common stock, or such other security that the issuer may specify, at a specific price and time through the expiration dates. Such rights are held as long positions by the Fund until exercised, sold or expired. Rights are valued at fair value in accordance with the Board approved fair valuation procedures.
Payment-In-Kind: The Fund invested in the open market or received pursuant to debt restructuring securities that pay-in-kind (PIK) the interest due on such debt instruments. The PIK interest, computed at the contractual rate specified, is added to the existing principal balance of the debt when issued bonds have the same terms as the bond or recorded as a separate bond when terms are different from the existing debt, and is recorded as interest income.
Securities Lending: The Fund lends its portfolio securities to banks and broker-dealers. The loans are secured by collateral at least equal to the market value of the securities loaned. Collateral pledged by each borrower is invested in an affiliated money market fund and is marked to market daily, based on the previous day’s market value, such that the value of the collateral exceeds the value of the loaned securities. In the event of significant appreciation in value of the securities on loan on the last business day of the reporting period, the financial statements may reflect a collateral value that is less than the market value of the loaned securities. Such shortfall is remedied as described above. Loans are subject to termination at the option of the borrower or the Fund. Upon termination of the loan, the borrower will return to the Fund securities identical to the loaned securities. The remaining open loans of the securities lending transactions are considered overnight and continuous. Should the borrower of the securities fail financially, the Fund has the right to repurchase the securities in the open market using the collateral.
The Fund recognizes income, net of any rebate and securities lending agent fees, for lending its securities in the form of fees or interest on the investment of any cash received as collateral. The borrower receives all interest and dividends from the securities loaned and such payments are passed back to the lender in amounts equivalent thereto, which are reflected in interest income or unaffiliated dividend income based on the nature of the payment on the Statement of Operations. The Fund also continues to recognize any unrealized gain (loss) in the market price of the securities loaned and on the change in the value of the collateral invested that may occur during the term of the loan. In addition, realized gain (loss) is recognized on changes in the value of the collateral invested upon liquidation of the collateral. Net earnings from securities lending are disclosed in the Statement of Operations.
Securities Transactions and Net Investment Income: Securities transactions are recorded on the trade date. Realized gains (losses) from investment and currency transactions are
PGIM Floating Rate Income Fund 69
Notes to Financial Statements (continued)
calculated on the specific identification method. Dividend income is recorded on the ex-date, or for certain foreign securities, when the Fund becomes aware of such dividends. Interest income, including amortization of premium and accretion of discount on debt securities, as required, is recorded on the accrual basis. Expenses are recorded on an accrual basis, which may require the use of certain estimates by management that may differ from actual expense amounts. Net investment income or loss (other than class specific expenses and waivers, which are allocated as noted below) and unrealized and realized gains (losses) are allocated daily to each class of shares based upon the relative proportion of adjusted net assets of each class at the beginning of the day. Class specific expenses and waivers, where applicable, are charged to the respective share classes. Such class specific expenses and waivers include distribution fees and distribution fee waivers, shareholder servicing fees, transfer agent’s fees and expenses, registration fees and fee waivers and/or expense reimbursements, as applicable.
Taxes: It is the Fund’s policy to continue to meet the requirements of the Internal Revenue Code applicable to regulated investment companies and to distribute all of its taxable net investment income and capital gains, if any, to its shareholders. Therefore, no federal income tax provision is required. Withholding taxes on foreign dividends, interest and capital gains, if any, are recorded, net of reclaimable amounts, at the time the related income is earned.
Dividends and Distributions: Dividends and distributions to shareholders, which are determined in accordance with federal income tax regulations and which may differ from GAAP, are recorded on the ex-date. Permanent book/tax differences relating to income and gain (loss) are reclassified between total distributable earnings (loss) and paid-in capital in excess of par, as appropriate. The chart below sets forth the expected frequency of dividend and capital gains distributions to shareholders. Various factors may impact the frequency of dividend distributions to shareholders, including but not limited to adverse market conditions or portfolio holding-specific events.
| Expected Distribution Schedule to Shareholders* | Frequency | |||
Net Investment Income | Monthly | |||
Short-Term Capital Gains | Annually | |||
Long-Term Capital Gains | Annually | |||
| * | Under certain circumstances, the Fund may make more than one distribution of short-term and/or long-term capital gains during a fiscal year. |
Estimates: The preparation of financial statements requires management to make estimates and assumptions that affect the reported amounts and disclosures in the financial statements. Actual results could differ from those estimates.
70
| 3. | Agreements |
The RIC, on behalf of the Fund, has a management agreement with the Manager pursuant to which it has responsibility for all investment advisory services, including supervision of the subadviser’s performance of such services, and for rendering administrative services.
The Manager has entered into a subadvisory agreement with PGIM, Inc., which provides subadvisory services to the Fund through its business unit PGIM Fixed Income, and PGIM Limited (collectively the “subadviser”). The Manager pays for the services of the subadviser.
Fees payable under the management agreement are computed daily and paid monthly. For the reporting period ended February 29, 2024, the contractual and effective management fee rates were as follows:
| Contractual Management Rate | Effective Management Fee, before any waivers and/or expense reimbursements | |||
0.65% on average daily net assets up to and including $5 billion; | 0.65% | |||
0.625% on average daily net assets exceeding $5 billion. | ||||
The Manager has contractually agreed, through June 30, 2025, to limit total annual operating expenses after fee waivers and/or expense reimbursements. This contractual waiver excludes interest, brokerage, taxes (such as income and foreign withholding taxes, stamp duty and deferred tax expenses), acquired fund fees and expenses, extraordinary expenses, and certain other Fund expenses such as dividend and interest expense and broker charges on short sales.
Where applicable, the Manager agrees, to waive management fees or shared operating expenses on any share class to the same extent that it waives such expenses on any other share class and, in addition, total annual operating expenses for Class R6 shares will not exceed total annual operating expenses for Class Z shares. Fees and/or expenses waived and/or reimbursed by the Manager for the purpose of preventing the expenses from exceeding a certain expense ratio limit may be recouped by the Manager within the same fiscal year during which such waiver and/or reimbursement is made if such recoupment can be realized without exceeding the expense limit in effect at the time of the recoupment for that fiscal year. The expense limitations attributable to each class are as follows:
| Class | Expense Limitations | |||
A | 0.95% | |||
C | 1.70 | |||
Z | 0.70 | |||
R6 | 0.65 | |||
The RIC, on behalf of the Fund, has a distribution agreement with Prudential Investment Management Services LLC (“PIMS”), which acts as the distributor of the Class A, Class C, Class Z and Class R6 shares of the Fund. The Fund compensates PIMS for distributing and
PGIM Floating Rate Income Fund 71
Notes to Financial Statements (continued)
servicing the Fund’s Class A and Class C shares, pursuant to the plans of distribution (the “Distribution Plans”), regardless of expenses actually incurred by PIMS.
Pursuant to the Distribution Plans, the Fund compensates PIMS for distribution related activities at an annual rate based on average daily net assets per class. The distribution fees are accrued daily and payable monthly.
The Fund’s annual gross and net distribution rates, where applicable, are as follows:
| Class | Gross Distribution Fee | Net Distribution Fee | ||
A | 0.25% | 0.25% | ||
C | 1.00 | 1.00 | ||
Z | N/A | N/A | ||
R6 | N/A | N/A | ||
For the year ended February 29, 2024, PIMS received front-end sales charges (“FESL”) resulting from sales of certain class shares and contingent deferred sales charges (“CDSC”) imposed upon redemptions by certain shareholders. From these fees, PIMS paid such sales charges to broker-dealers, who in turn paid commissions to salespersons and incurred other distribution costs. The sales charges are as follows where applicable:
| Class | FESL | CDSC | ||||||
A | $159,686 | $54,622 | ||||||
C | — | 5,419 | ||||||
PGIM Investments, PGIM, Inc., PGIM Limited and PIMS are indirect, wholly-owned subsidiaries of Prudential Financial, Inc. (“Prudential”).
| 4. | Other Transactions with Affiliates |
Prudential Mutual Fund Services LLC (“PMFS”), an affiliate of PGIM Investments and an indirect, wholly-owned subsidiary of Prudential, serves as the Fund’s transfer agent and shareholder servicing agent. Transfer agent’s fees and expenses in the Statement of Operations include certain out-of-pocket expenses paid to non-affiliates, where applicable.
The Fund may invest its overnight sweep cash in the PGIM Core Government Money Market Fund (the “Core Government Fund”), a series of the Prudential Government Money Market Fund, Inc., and its securities lending cash collateral in the PGIM Institutional Money Market Fund (the “Money Market Fund”), a series of Prudential Investment Portfolios 2, each registered under the 1940 Act and managed by PGIM Investments. PGIM Investments and/or its affiliates are paid fees or reimbursed for providing their services to the Core Government Fund and the Money Market Fund. In addition to the realized and unrealized gains on investments in the Core Government Fund and the Money Market Fund, earnings
72
from such investments are disclosed on the Statement of Operations as “Affiliated dividend income” and “Income from securities lending, net”, respectively.
The Fund may enter into certain securities purchase or sale transactions under Board approved Rule 17a-7 procedures. Rule 17a-7 is an exemptive rule under the 1940 Act that, subject to certain conditions, permits purchase and sale transactions among affiliated investment companies, or between an investment company and a person that is affiliated solely by reason of having a common (or affiliated) investment adviser, common directors/trustees, and/or common officers. For the year ended February 29, 2024, no Rule 17a-7 transactions were entered into by the Fund.
| 5. | Portfolio Securities |
The aggregate cost of purchases and proceeds from sales of portfolio securities (excluding short-term investments and U.S. Government securities) for the reporting period ended February 29, 2024, were as follows:
| Cost of Purchases | Proceeds from Sales | |
$1,436,260,824 | $2,089,197,251 | |
A summary of the cost of purchases and proceeds from sales of shares of affiliated mutual funds for the year ended February 29, 2024, is presented as follows:
|
| |||||||||||||||||||||||||||
Value, Beginning of Year | Cost of Purchases | Proceeds | Change in Unrealized Gain (Loss) | Realized Gain (Loss) | Value, End of Year | Shares, End of Year | Income | |||||||||||||||||||||
|
| |||||||||||||||||||||||||||
Short-Term Investments - Affiliated Mutual Funds: | ||||||||||||||||||||||||||||
PGIM Core Government Money Market Fund (7-day effective yield 5.545%)(1)(wb) | ||||||||||||||||||||||||||||
| $ — | $557,281,433 | $521,862,432 | $ — | $ — | $35,419,001 | 35,419,001 | $670,946 | |||||||||||||||||||||
PGIM Institutional Money Market Fund (7-day effective yield 5.683%)(1)(b)(wb) | ||||||||||||||||||||||||||||
| 31,387,995 | 123,457,052 | 138,164,396 | (20,688) | 13,971 | 16,673,934 | 16,680,606 | 55,852(2) | |||||||||||||||||||||
|
| |||||||||||||||||||||||||||
| $31,387,995 | $680,738,485 | $660,026,828 | $(20,688) | $13,971 | $52,092,935 | $726,798 | ||||||||||||||||||||||
|
| |||||||||||||||||||||||||||
| (1) | The Fund did not have any capital gain distributions during the reporting period. |
| (2) | The amount, or a portion thereof, represents the affiliated securities lending income shown on the Statement of Operations. |
| (b) | Represents security, or portion thereof, purchased with cash collateral received for securities on loan and includes dividend reinvestment. |
| (wb) | Represents an investment in a Fund affiliated with the Manager. |
| 6. | Distributions and Tax Information |
Distributions to shareholders, which are determined in accordance with federal income tax regulations and which may differ from GAAP, are recorded on the ex-date.
PGIM Floating Rate Income Fund 73
Notes to Financial Statements (continued)
For the year ended February 29, 2024, the tax character of dividends paid as reflected in the Statement of Changes in Net Assets were as follows:
Ordinary Income | Long-Term Capital Gains | Tax Return of Capital | Total Dividends and Distributions | |||
$190,467,942 | $— | $2,208,923 | $192,676,865 |
For the year ended February 28, 2023, the tax character of dividends paid as reflected in the Statement of Changes in Net Assets were as follows:
Ordinary Income | Long-Term Capital Gains | Tax Return of Capital | Total Dividends and Distributions | |||
$256,736,649 | $— | $— | $256,736,649 |
As of February 29, 2024, there were no accumulated undistributed earnings on a tax basis.
The United States federal income tax basis of the Fund’s investments and the net unrealized depreciation as of February 29, 2024 were as follows:
| Tax Basis | Gross Unrealized Appreciation | Gross Unrealized Depreciation | Net Unrealized Depreciation | |||
$2,190,251,506 | $37,686,862 | $(148,184,676) | $(110,497,814) |
The difference between GAAP and tax basis was primarily attributable to deferred losses on wash sales, mark-to-market of futures and forwards contracts, swap, interest accrual on defaulted securities, and bond amortization adjustment.
For federal income tax purposes, the Fund had an approximated capital loss carryforward as of February 29, 2024 which can be carried forward for an unlimited period. No capital gains distributions are expected to be paid to shareholders until net gains have been realized in excess of such losses.
Capital Loss Carryforward | Capital Loss Carryforward Utilized | |
$283,802,000 | $— |
The Manager has analyzed the Fund’s tax positions taken on federal, state and local income tax returns for all open tax years and has concluded that no provision for income tax is required in the Fund’s financial statements for the current reporting period. Since tax authorities can examine previously filed tax returns, the Fund’s U.S. federal and state tax returns for each of the four fiscal years up to the most recent fiscal year ended February 29, 2024 are subject to such review.
74
| 7. | Capital and Ownership |
The Fund offers Class A, Class C, Class Z and Class R6 shares. Class A shares are sold with a maximum front-end sales charge of 2.25%. Investors who purchase $500,000 or more of Class A shares and sell those shares within 12 months of purchase are subject to a CDSC of 1% on sales although these purchases are not subject to a front-end sales charge. The Class A CDSC is waived for certain retirement and/or benefit plans. A special exchange privilege is also available for shareholders who qualified to purchase Class A shares at net asset value. Class C shares are sold with a CDSC of 1% on sales made within 12 months of purchase. Class C shares will automatically convert to Class A shares on a monthly basis approximately eight years (ten years prior to January 22, 2021) after purchase. Class Z and Class R6 shares are not subject to any sales or redemption charges and are available exclusively for sale to a limited group of investors.
Under certain circumstances, an exchange may be made from specified share classes of the Fund to one or more other share classes of the Fund as presented in the table of transactions in shares of common stock, below.
The RIC is authorized to issue 5,750,000,000 shares of common stock, $0.00001 par value per share, 3,250,000,000 of which are designated as shares of the Fund. The authorized shares of the Fund are currently classified and designated as follows:
| Class | Number of Shares | |||
A | 150,000,000 | |||
C | 100,000,000 | |||
Z | 2,000,000,000 | |||
R6 | 1,000,000,000 | |||
As of February 29, 2024, Prudential, through its affiliated entities, including affiliated funds (if applicable), owned shares of the Fund as follows:
| Class | Number of Shares | Percentage of Outstanding Shares | ||
Z | 47,688 | 0.1% | ||
At the reporting period end, the number of shareholders holding greater than 5% of the Fund are as follows:
| Number of Shareholders | Percentage of Outstanding Shares | |||
Affiliated | — | —% | ||
Unaffiliated | 6 | 72.8 | ||
PGIM Floating Rate Income Fund 75
Notes to Financial Statements (continued)
Transactions in shares of common stock were as follows:
| Share Class | Shares | Amount | ||||||
Class A | ||||||||
Year ended February 29, 2024: | ||||||||
Shares sold | 8,314,896 | $ | 74,659,942 | |||||
Shares issued in reinvestment of dividends and distributions | 1,768,914 | 15,885,043 | ||||||
Shares purchased | (9,304,086 | ) | (83,493,240 | ) | ||||
Net increase (decrease) in shares outstanding before conversion | 779,724 | 7,051,745 | ||||||
Shares issued upon conversion from other share class(es) | 735,188 | 6,591,587 | ||||||
Shares purchased upon conversion into other share class(es) | (524,808 | ) | (4,701,155 | ) | ||||
Net increase (decrease) in shares outstanding | 990,104 | $ | 8,942,177 | |||||
Year ended February 28, 2023: | ||||||||
Shares sold | 10,461,610 | $ | 95,781,755 | |||||
Shares issued in reinvestment of dividends and distributions | 1,502,285 | 13,424,845 | ||||||
Shares purchased | (16,081,797 | ) | (144,674,237 | ) | ||||
Net increase (decrease) in shares outstanding before conversion | (4,117,902 | ) | (35,467,637 | ) | ||||
Shares issued upon conversion from other share class(es) | 941,052 | 8,528,701 | ||||||
Shares purchased upon conversion into other share class(es) | (339,254 | ) | (3,087,674 | ) | ||||
Net increase (decrease) in shares outstanding | (3,516,104 | ) | $ | (30,026,610 | ) | |||
Class C | ||||||||
Year ended February 29, 2024: | ||||||||
Shares sold | 1,264,260 | $ | 11,361,003 | |||||
Shares issued in reinvestment of dividends and distributions | 490,706 | 4,406,751 | ||||||
Shares purchased | (2,491,857 | ) | (22,314,005 | ) | ||||
Net increase (decrease) in shares outstanding before conversion | (736,891 | ) | (6,546,251 | ) | ||||
Shares purchased upon conversion into other share class(es) | (425,682 | ) | (3,819,670 | ) | ||||
Net increase (decrease) in shares outstanding | (1,162,573 | ) | $ | (10,365,921 | ) | |||
Year ended February 28, 2023: | ||||||||
Shares sold | 2,560,466 | $ | 23,633,596 | |||||
Shares issued in reinvestment of dividends and distributions | 477,522 | 4,261,778 | ||||||
Shares purchased | (3,094,084 | ) | (27,713,901 | ) | ||||
Net increase (decrease) in shares outstanding before conversion | (56,096 | ) | 181,473 | |||||
Shares purchased upon conversion into other share class(es) | (430,134 | ) | (3,887,115 | ) | ||||
Net increase (decrease) in shares outstanding | (486,230 | ) | $ | (3,705,642 | ) | |||
76
| Share Class | Shares | Amount | ||||||
Class Z | ||||||||
Year ended February 29, 2024: | ||||||||
Shares sold | 65,135,149 | $ | 585,895,333 | |||||
Shares issued in reinvestment of dividends and distributions | 16,051,718 | 144,180,446 | ||||||
Shares purchased | (143,083,136 | ) | (1,277,412,597 | ) | ||||
Net increase (decrease) in shares outstanding before conversion | (61,896,269 | ) | (547,336,818 | ) | ||||
Shares issued upon conversion from other share class(es) | 732,134 | 6,557,433 | ||||||
Shares purchased upon conversion into other share class(es) | (1,322,616 | ) | (11,849,732 | ) | ||||
Net increase (decrease) in shares outstanding | (62,486,751 | ) | $ | (552,629,117 | ) | |||
Year ended February 28, 2023: | ||||||||
Shares sold | 186,135,025 | $ | 1,718,100,890 | |||||
Shares issued in reinvestment of dividends and distributions | 23,143,123 | 207,352,169 | ||||||
Shares purchased | (375,347,406 | ) | (3,382,158,723 | ) | ||||
Net increase (decrease) in shares outstanding before conversion | (166,069,258 | ) | (1,456,705,664 | ) | ||||
Shares issued upon conversion from other share class(es) | 781,639 | 7,069,214 | ||||||
Shares purchased upon conversion into other share class(es) | (1,970,405 | ) | (17,902,188 | ) | ||||
Net increase (decrease) in shares outstanding | (167,258,024 | ) | $ | (1,467,538,638 | ) | |||
Class R6 | ||||||||
Year ended February 29, 2024: | ||||||||
Shares sold | 8,760,863 | $ | 79,100,563 | |||||
Shares issued in reinvestment of dividends and distributions | 1,911,747 | 17,162,370 | ||||||
Shares purchased | (20,832,111 | ) | (186,601,411 | ) | ||||
Net increase (decrease) in shares outstanding before conversion | (10,159,501 | ) | (90,338,478 | ) | ||||
Shares issued upon conversion from other share class(es) | 925,337 | 8,286,812 | ||||||
Shares purchased upon conversion into other share class(es) | (119,554 | ) | (1,065,275 | ) | ||||
Net increase (decrease) in shares outstanding | (9,353,718 | ) | $ | (83,116,941 | ) | |||
Year ended February 28, 2023: | ||||||||
Shares sold | 18,065,678 | $ | 167,841,052 | |||||
Shares issued in reinvestment of dividends and distributions | 2,487,878 | 22,244,613 | ||||||
Shares purchased | (24,179,996 | ) | (217,176,621 | ) | ||||
Net increase (decrease) in shares outstanding before conversion | (3,626,440 | ) | (27,090,956 | ) | ||||
Shares issued upon conversion from other share class(es) | 1,288,933 | 11,694,624 | ||||||
Shares purchased upon conversion into other share class(es) | (268,075 | ) | (2,415,562 | ) | ||||
Net increase (decrease) in shares outstanding | (2,605,582 | ) | $ | (17,811,894 | ) | |||
| 8. | Borrowings |
The RIC, on behalf of the Fund, along with other affiliated registered investment companies (the “Participating Funds”), is a party to a Syndicated Credit Agreement (“SCA”) with a group of banks. The purpose of the SCA is to provide an alternative source of temporary
PGIM Floating Rate Income Fund 77
Notes to Financial Statements (continued)
funding for capital share redemptions. The table below provides details of the current SCA in effect at the reporting period-end as well as the prior SCA.
| Current SCA | Prior SCA | |||
Term of Commitment | 9/29/2023 – 9/26/2024 | 9/30/2022 – 9/28/2023 | ||
Total Commitment | Tranche A: $1,200,000,000 Tranche B: $125,000,000* | Tranche A: $1,200,000,000 Tranche B: $125,000,000* | ||
Annualized Commitment Fee on the Unused Portion of the SCA | 0.15% | 0.15% | ||
Annualized Interest Rate on Borrowings | 1.00% plus the higher of (1) the effective federal funds rate, (2) the daily SOFR rate plus 0.10% or (3) zero percent | 1.00% plus the higher of (1) the effective federal funds rate, (2) the daily SOFR rate plus 0.10% or (3) zero percent | ||
| * | Only PGIM Floating Rate Income Fund and one other fund are party to, and are allocated commitment fees related to, Tranche B of the SCA, in addition to Tranche A. The other Participating Funds are only party to Tranche A of the SCA. |
Certain affiliated registered investment companies that are parties to the SCA include portfolios that are subject to a predetermined mathematical formula used to manage certain benefit guarantees offered under variable annuity contracts. The formula may result in large scale asset flows into and out of these portfolios. Consequently, these portfolios may be more likely to utilize the SCA for purposes of funding redemptions. It may be possible for those portfolios to fully exhaust the committed amount of the SCA, thereby requiring the Manager to allocate available funding per a Board-approved methodology designed to treat the Participating Funds in the SCA equitably.
The Fund utilized the SCA during the year ended February 29, 2024. The average daily balance for the 151 days that the Fund had loans outstanding during the period was approximately $46,101,682, borrowed at a weighted average interest rate of 6.02%. The maximum loan outstanding amount during the period was $122,632,000. At February 29, 2024, the Fund did not have an outstanding loan amount.
| 9. | Risks of Investing in the Fund |
The Fund’s risks include, but are not limited to, some or all of the risks discussed below. For further information on the Fund’s risks, please refer to the Fund’s Prospectus and Statement of Additional Information.
Adjustable and Floating Rate Securities Risk: The value of adjustable and floating rate securities may lag behind the value of fixed rate securities when interest rates change. Such securities may be subject to extended settlement periods (longer than seven days) and in
78
unusual market conditions, with a high volume of shareholder redemptions, may present a risk of loss to the Fund or may impair the Fund’s ability satisfy shareholder redemption requests.
“Covenant-Lite” Risk: Some of the loans or debt obligations in which the Fund may invest or get exposure to may be “covenant-lite”, which means the loans or obligations contain fewer financial maintenance covenants than other loans or obligations (in some cases, none) and do not include terms which allow the lender to monitor the borrower’s performance and declare a default if certain criteria are breached. An investment by the Fund in a covenant-lite loan may potentially hinder the ability to reprice credit risk associated with the issuer and reduce the ability to restructure a problematic loan and mitigate potential loss. The Fund may also experience difficulty, expenses or delays in enforcing its rights on its holdings of covenant-lite loans or obligations. As a result of these risks, the Fund’s exposure to losses may be increased, which could result in an adverse impact on the Fund’s net income and NAV.
Credit Risk: This is the risk that the issuer, the guarantor or the insurer of a fixed income security, or the counterparty to a contract, may be unable or unwilling to make timely principal and interest payments, or to otherwise honor its obligations. Additionally, fixed income securities could lose value due to a loss of confidence in the ability of the issuer, guarantor, insurer or counterparty to pay back debt. The lower the credit quality of a bond, the more sensitive it is to credit risk.
Debt Obligations Risk: Debt obligations are subject to credit risk, market risk and interest rate risk. The Fund’s holdings, share price, yield and total return may also fluctuate in response to bond market movements. The value of bonds may decline for issuer-related reasons, including management performance, financial leverage and reduced demand for the issuer’s goods and services. Certain types of fixed income obligations also may be subject to “call and redemption risk,” which is the risk that the issuer may call a bond held by the Fund for redemption before it matures and the Fund may not be able to reinvest at the same rate of interest and therefore would earn less income.
Derivatives Risk: Derivatives involve special risks and costs and may result in losses to the Fund. The successful use of derivatives requires sophisticated management, and, to the extent that derivatives are used, the Fund will depend on the subadviser’s ability to analyze and manage derivatives transactions. The prices of derivatives may move in unexpected ways, especially in abnormal market conditions. Some derivatives are “leveraged” or may create economic leverage for the Fund. and therefore may magnify or otherwise increase investment losses to the Fund. The Fund’s use of derivatives may also increase the amount of taxes payable by shareholders.
Other risks arise from the potential inability to terminate or sell derivatives positions. A liquid secondary market may not always exist for the Fund’s derivatives positions. In fact, many over-the-counter derivative instruments will not have liquidity beyond the counterparty to the instrument. Over-the-counter derivative instruments also involve the risk that the other party
PGIM Floating Rate Income Fund 79
Notes to Financial Statements (continued)
will not meet its obligations to the Fund. The use of derivatives also exposes the Fund to operational issues, such as documentation and settlement issues, systems failures, inadequate control and human error.
Derivatives may also involve legal risks, such as insufficient documentation, the lack of capacity or authority of a counterparty to execute or settle a transaction, and the legality and enforceability of derivatives contracts. The U.S. Government and foreign governments have adopted (and may adopt further) regulations governing derivatives markets, including mandatory clearing of certain derivatives, margin and reporting requirements and risk exposure limitations. Regulation of derivatives may make derivatives more costly, limit their availability or utility to the Fund, or otherwise adversely affect their performance or disrupt markets.
Economic and Market Events Risk: Events in the U.S. and global financial markets, including actions taken by the U.S. Federal Reserve or foreign central banks to stimulate or stabilize economic growth or the functioning of the securities markets, or otherwise reduce inflation, may at times result in unusually high market volatility, which could negatively impact performance. Governmental efforts to curb inflation often have negative effects on the level of economic activity. Relatively reduced liquidity in credit and fixed income markets could adversely affect issuers worldwide.
Emerging Markets Risk: The risks of foreign investments are greater for investments in or exposed to emerging markets. Emerging market countries typically have economic and political systems that are less fully developed, and can be expected to be less stable, than those of more developed countries. For example, the economies of such countries can be subject to rapid and unpredictable rates of inflation or deflation. Low trading volumes may result in a lack of liquidity and price volatility. Emerging market countries may have policies that restrict investment by non-U.S. investors, or that prevent non-U.S. investors from withdrawing their money at will.
The Fund may invest in some emerging markets that subject it to risks such as those associated with illiquidity, custody of assets, different settlement and clearance procedures and asserting legal title under a developing legal and regulatory regime to a greater degree than in developed markets or even in other emerging markets.
Floating Rate and Other Loans Risk: The Fund’s ability to receive payments of principal and interest and other amounts in connection with loans (whether through participations, assignments or otherwise) will depend primarily on the financial condition of the borrower. The failure by the Fund to receive scheduled interest or principal payments on a loan because of a default, bankruptcy or any other reason would adversely affect the income of the Fund and would likely reduce the value of its assets. Even with loans secured by
80
collateral, there is the risk that the value of the collateral may decline, may be insufficient to meet the obligations of the borrower, or be difficult to liquidate. In the event of a default, the Fund may have difficulty collecting on any collateral and would not have the ability to collect on any collateral for an uncollateralized loan. Further, the Fund’s access to collateral, if any, may be limited by bankruptcy laws. Due to the nature of the private syndication of senior loans, including, for example, lack of publicly-available information, some senior loans are not as easily purchased or sold as publicly-traded securities. In addition, loan participations generally are subject to restrictions on transfer, and only limited opportunities may exist to sell loan participations in secondary markets. As a result, it may be difficult for the Fund to value loans or sell loans at an acceptable price when it wants to sell them. Loans trade in an OTC market, and confirmation and settlement, which are effected through standardized procedures and documentation, may take significantly longer than seven days to complete. Extended trade settlement periods may, in unusual market conditions with a high volume of shareholder redemptions, present a risk to shareholders regarding the Fund’s ability to pay redemption proceeds in a timely manner. In some instances, loans and loan participations are not rated by independent credit rating agencies; in such instances, a decision by the Fund to invest in a particular loan or loan participation could depend exclusively on the subadviser’s credit analysis of the borrower, or in the case of a loan participation, of the intermediary holding the portion of the loan that the Fund has purchased. To the extent the Fund invests in loans of non-U.S. issuers, the risks of investing in non-U.S. issuers are applicable. Loans may not be considered to be “securities” and as a result may not benefit from the protections of the federal securities laws, including anti-fraud protections and those with respect to the use of material non-public information, so that purchasers, such as the Fund, may not have the benefit of these protections. If the Fund is in possession of material non-public information about a borrower as a result of its investment in such borrower’s loan, the Fund may not be able to enter into a transaction with respect to a publicly-traded security of the borrower when it would otherwise be advantageous to do so.
Foreign Securities Risk: Investments in securities of non-U.S. issuers (including those denominated in U.S. dollars) may involve more risk than investing in securities of U.S. issuers. Foreign political, economic and legal systems, especially those in developing and emerging market countries, may be less stable and more volatile than in the United States. Foreign legal systems generally have fewer regulatory requirements than the U.S. legal system, particularly those of emerging markets. In general, less information is publicly available with respect to non-U.S. companies than U.S. companies. Non-U.S. companies generally are not subject to the same accounting, auditing, and financial reporting standards as are U.S. companies. Additionally, the changing value of foreign currencies and changes in exchange rates could also affect the value of the assets the Fund holds and the Fund’s performance. Certain foreign countries may impose restrictions on the ability of issuers of foreign securities to make payment of principal and interest or dividends to investors located outside the country, due to blockage of foreign currency exchanges or otherwise. Investments in emerging markets are subject to greater volatility and price declines.
In addition, the Fund’s investments in non-U.S. securities may be subject to the risks of nationalization or expropriation of assets, imposition of currency exchange controls or
PGIM Floating Rate Income Fund 81
Notes to Financial Statements (continued)
restrictions on the repatriation of non-U.S. currency, confiscatory taxation and adverse diplomatic developments. Special U.S. tax considerations may apply.
Increase in Expenses Risk: Your actual cost of investing in the Fund may be higher than the expenses shown in the expense table in the Fund’s prospectus for a variety of reasons. For example, expense ratios may be higher than those shown if average net assets decrease. Net assets are more likely to decrease and Fund expense ratios are more likely to increase when markets are volatile. Active and frequent trading of Fund securities can increase expenses.
Interest Rate Risk: The value of your investment may go down when interest rates rise. A rise in rates tends to have a greater impact on the prices of longer term or duration debt securities. Similarly, a rise in interest rates may also have a greater negative impact on the value of equity securities whose issuers expect earnings further out in the future. For example, a fixed income security with a duration of three years is expected to decrease in value by approximately 3% if interest rates increase by 1%. This is referred to as “duration risk.” When interest rates fall, the issuers of debt obligations may prepay principal more quickly than expected, and the Fund may be required to reinvest the proceeds at a lower interest rate. This is referred to as “prepayment risk.” For premium bonds (bonds acquired at prices that exceed their par or principal value) purchased by the Fund, prepayment risk may be enhanced. When interest rates rise, debt obligations may be repaid more slowly than expected, and the value of the Fund’s holdings may fall sharply. This is referred to as “extension risk.” The Fund may lose money if short-term or long-term interest rates rise sharply or in a manner not anticipated by the subadviser.
Junk Bonds Risk: High-yield, high-risk bonds have predominantly speculative characteristics, including particularly high credit risk. Junk bonds tend to have lower market liquidity than higher-rated securities. The liquidity of particular issuers or industries within a particular investment category may shrink or disappear suddenly and without warning. The non-investment grade bond market can experience sudden and sharp price swings and become illiquid due to a variety of factors, including changes in economic forecasts, stock market activity, large sustained sales by major investors, a high profile default or a change in the market’s psychology.
Large Shareholder and Large Scale Redemption Risk: Certain individuals, accounts, funds (including funds affiliated with the Manager) or institutions, including the Manager and its affiliates, may from time to time own or control a substantial amount of the Fund’s shares. There is no requirement that these entities maintain their investment in the Fund. There is a risk that such large shareholders or that the Fund’s shareholders generally may redeem all or a substantial portion of their investments in the Fund in a short period of time, which could have a significant negative impact on the Fund’s NAV, liquidity, and brokerage costs.
82
Large redemptions could also result in tax consequences to shareholders and impact the Fund’s ability to implement its investment strategy. The Fund’s ability to pursue its investment objective after one or more large scale redemptions may be impaired and, as a result, the Fund may invest a larger portion of its assets in cash or cash equivalents.
Leverage Risk: Certain transactions in which the Fund may engage may give rise to leverage. The use of leverage exaggerates the effect of any increase or decrease in the value of the Fund’s holdings, and makes any change in the Fund’s net asset value (“NAV”) greater than it would be without the use of leverage. This could result in increased volatility of investment return.
Liquidity Risk: Liquidity risk is the risk that the Fund could not meet requests to redeem shares issued by the Fund without significant dilution of remaining investors’ interests in the Fund. The Fund may invest in instruments that trade in lower volumes and are more illiquid than other investments. If the Fund is forced to sell these investments to pay redemption proceeds or for other reasons, the Fund may lose money. In addition, when there is no willing buyer and investments cannot be readily sold at the desired time or price, the Fund may have to accept a lower price or may not be able to sell the instrument at all. An inability to sell a portfolio position can adversely affect the Fund’s value or prevent the Fund from being able to take advantage of other investment opportunities.
Loan Liquidity and Settlement Risk: The Fund’s investments in loans may subject it to additional illiquidity risks. Loans generally are subject to legal or contractual restrictions on resale. The liquidity of loans, including the volume and frequency of secondary market trading in such loans, varies significantly over time and among individual loans. For example, if the credit quality of a loan unexpectedly declines significantly, secondary market trading in that loan can also decline for a period of time. During periods of infrequent trading, valuing a loan can be more difficult and buying and selling a loan at an acceptable price can be more difficult and delayed. Difficulty in selling a loan can result in a loss. Certain of the Fund’s assets may be invested in assets that are considerably less liquid than debt instruments traded on national exchanges. Market quotations for such assets may be volatile and/or subject to large spreads between bid and ask prices. Loans trade in an over-the-counter market, and confirmation and settlement may take significantly longer than seven days to complete. Extended trade settlement periods may, in unusual market conditions with a high volume of shareholder redemptions, present a risk to shareholders regarding the Fund’s ability to pay redemption proceeds within the allowable time periods stated in the Fund’s prospectus. To the extent the extended loan settlement process gives rise to short-term liquidity needs, such as the need to satisfy redemption requests, the Fund may hold cash, sell investments or borrow from banks.
The Fund may borrow to meet redemptions and may choose to keep such borrowings outstanding until loans or other portfolio transactions settle or for other extended periods. During the period when borrowings are outstanding, the Fund will incur interest expense. The Fund’s portfolio may also be subject to greater volatility during periods of borrowing, which can have an adverse impact on the Fund’s net asset value. The Fund will be required
PGIM Floating Rate Income Fund 83
Notes to Financial Statements (continued)
to maintain specified asset coverage by applicable federal securities laws and the terms of its credit facility with the lender with respect to its borrowings. The Fund may be required to dispose of portfolio investments on unfavorable terms if market fluctuations or other factors cause the Fund to fail to meet its asset coverage requirements.
Management Risk: Actively managed funds are subject to management risk. The subadviser will apply investment techniques and risk analyses in making investment decisions for the Fund, but the subadviser’s judgments about the attractiveness, value or market trends affecting a particular security, industry or sector or about market movements may be incorrect. Additionally, the investments selected for the Fund may underperform the markets in general, the Fund’s benchmark and other funds with similar investment objectives.
Market Disruption and Geopolitical Risks: Market disruption can be caused by economic, financial or political events and factors, including but not limited to, international wars or conflicts (including Russia’s military invasion of Ukraine and the Israel-Hamas war), geopolitical developments (including trading and tariff arrangements, sanctions and cybersecurity attacks), instability in regions such as Asia, Eastern Europe and the Middle East, terrorism, natural disasters and public health epidemics (including the outbreak of COVID-19 globally).
The extent and duration of such events and resulting market disruptions cannot be predicted, but could be substantial and could magnify the impact of other risks to the Fund. These and other similar events could adversely affect the U.S. and foreign financial markets and lead to increased market volatility, reduced liquidity in the securities markets, significant negative impacts on issuers and the markets for certain securities and commodities and/or government intervention. They may also cause short- or long-term economic uncertainties in the United States and worldwide. As a result, whether or not the Fund invests in securities of issuers located in or with significant exposure to the countries directly affected, the value and liquidity of the Fund’s investments may be negatively impacted. Further, due to closures of certain markets and restrictions on trading certain securities, the value of certain securities held by the Fund could be significantly impacted, which could lead to such securities being valued at zero.
Market Risk: Securities markets may be volatile and the market prices of the Fund’s securities may decline. Securities fluctuate in price based on changes in an issuer’s financial condition and overall market and economic conditions. If the market prices of the securities owned by the Fund fall, the value of your investment in the Fund will decline.
Portfolio Turnover Risk: The length of time the Fund has held a particular security is not generally a consideration in investment decisions. Under certain market conditions, the
84
Fund’s turnover rate may be higher than that of other mutual funds. Portfolio turnover generally involves some expense to the Fund, including brokerage commissions or dealer mark-ups and other transaction costs on the sale of securities and reinvestment in other securities. These transactions may result in realization of taxable capital gains. The trading costs and tax effects associated with portfolio turnover may adversely affect the Fund’s investment performance.
| 10. | Recent Regulatory Developments |
Effective January 24, 2023, the Securities and Exchange Commission adopted rule and form amendments to require mutual funds and ETFs to transmit concise and visually engaging streamlined annual and semiannual reports to shareholders that highlight key information deemed important for retail investors to assess and monitor their fund investments (the “Rule”). Other information, including financial statements, will no longer appear in the funds’ streamlined shareholder reports but must be available online, delivered free of charge upon request, and filed on a semiannual basis on Form N-CSR. The Rule and form amendments have a compliance date of July 24, 2024. At this time, management is evaluating the Rule and its impact to the Fund.
PGIM Floating Rate Income Fund 85
Report of Independent Registered Public Accounting Firm
To the Board of Trustees of Prudential Investment Portfolios, Inc. 14 and Shareholders of PGIM Floating Rate Income Fund
Opinion on the Financial Statements
We have audited the accompanying statement of assets and liabilities, including the schedule of investments, of PGIM Floating Rate Income Fund (one of the funds constituting Prudential Investment Portfolios, Inc. 14, referred to hereafter as the “Fund”) as of February 29, 2024, the related statement of operations for the year ended February 29, 2024, the statements of changes in net assets for each of the two years in the period ended February 29, 2024, including the related notes, and the financial highlights for each of the four years in the period ended February 29, 2024 (collectively referred to as the “financial statements”). In our opinion, the financial statements present fairly, in all material respects, the financial position of the Fund as of February 29, 2024, the results of its operations for the year then ended, the changes in its net assets for each of the two years in the period ended February 29, 2024 and the financial highlights for each of the four years in the period ended February 29, 2024 in conformity with accounting principles generally accepted in the United States of America.
The financial statements of the Fund as of and for the year ended February 29, 2020 and the financial highlights for the year ended February 29, 2020 (not presented herein, other than the financial highlights) were audited by other auditors whose report dated April 17, 2020 expressed an unqualified opinion on those financial statements and financial highlights.
Basis for Opinion
These financial statements are the responsibility of the Fund’s management. Our responsibility is to express an opinion on the Fund’s financial statements based on our audits. We are a public accounting firm registered with the Public Company Accounting Oversight Board (United States) (PCAOB) and are required to be independent with respect to the Fund in accordance with the U.S. federal securities laws and the applicable rules and regulations of the Securities and Exchange Commission and the PCAOB.
We conducted our audits of these financial statements in accordance with the standards of the PCAOB. Those standards require that we plan and perform the audit to obtain reasonable assurance about whether the financial statements are free of material misstatement, whether due to error or fraud.
Our audits included performing procedures to assess the risks of material misstatement of the financial statements, whether due to error or fraud, and performing procedures that respond to those risks. Such procedures included examining, on a test basis, evidence regarding the amounts and disclosures in the financial statements. Our audits also included evaluating the accounting principles used and significant estimates made by management, as well as evaluating the overall presentation of the financial statements. Our procedures included confirmation of securities owned as of February 29, 2024 by correspondence with the custodian, transfer agent, brokers and agent banks; when replies were not received from brokers or agent banks, we performed other auditing procedures. We believe that our audits provide a reasonable basis for our opinion.
| /s/PricewaterhouseCoopers LLP |
| New York, New York |
| April 18, 2024 |
We have served as the auditor of one or more investment companies in the PGIM Retail Funds complex since 2020.
86
Tax Information (unaudited)
For the year ended February 29, 2024, the Fund reports the maximum amount allowable under Section 854 of the Internal Revenue Code, but not less than, the following percentages of the ordinary income dividends paid as 1) qualified dividend income (QDI); and 2) eligible for corporate dividends received deduction (DRD):
| Fund | QDI | DRD | ||||||||||
PGIM Floating Rate Income Fund | 5.34 | % | 5.34 | % | ||||||||
For the year ended February 29, 2024, the Fund reports the maximum amount allowable but not less than 79.13% as interest-related dividends in accordance with Sections 871(k)(1) and 881(e)(1) of the Internal Revenue Code.
For the year ended February 29, 2024, the Fund reports the maximum amount allowable but not less than 98.93% as interest dividends that are eligible to be treated as interest income in accordance with Section 163(j) of the Internal Revenue Code.
In January 2025, you will be advised on IRS Form 1099-DIV or substitute 1099-DIV, as to the federal tax status of the dividends received by you in calendar year 2024.
PGIM Floating Rate Income Fund 87
INFORMATION ABOUT BOARD MEMBERS AND OFFICERS (unaudited)
Information about Board Members and Officers of the Fund is set forth below. Board Members who are not deemed to be “interested persons” of the Fund, as defined in the 1940 Act, are referred to as “Independent Board Members.” Board Members who are deemed to be “interested persons” of the Fund are referred to as “Interested Board Members.” The Board Members are responsible for the overall supervision of the operations of the Fund and perform the various duties imposed on the directors of investment companies by the 1940 Act. The Board in turn elects the Officers, who are responsible for administering the day-to-day operations of the Fund.
| Independent Board Members | ||||||
Name Year of Birth Position(s) Portfolios Overseen | Principal Occupation(s) During Past Five Years | Other Directorships Held During Past Five Years | Length of Board Service | |||
Ellen S. Alberding 1958 Board Member Portfolios Overseen: 103 | Chief Executive Officer and President, The Joyce Foundation (charitable foundation) (since 2002); formerly Vice Chair, City Colleges of Chicago (community college system) (2011-2015); formerly Trustee, National Park Foundation (charitable foundation for national park system) (2009-2018); formerly Trustee, Economic Club of Chicago (2009-2016); Trustee, Loyola University (since 2018). | None. | Since September 2013 | |||
Kevin J. Bannon 1952 Board Member Portfolios Overseen: 104 | Retired; formerly Managing Director (April 2008-May 2015) and Chief Investment Officer (October 2008-November 2013) of Highmount Capital LLC (registered investment adviser); formerly Executive Vice President and Chief Investment Officer (April 1993-August 2007) of Bank of New York Company; formerly President (May 2003-May 2007) of BNY Hamilton Family of Mutual Funds. | Director of Urstadt Biddle Properties (equity real estate investment trust) (September 2008-August 2023). | Since July 2008 | |||
PGIM Floating Rate Income Fund
| Independent Board Members | ||||||
Name Year of Birth Position(s) Portfolios Overseen | Principal Occupation(s) During Past Five Years | Other Directorships Held During Past Five Years | Length of Board Service | |||
Linda W. Bynoe 1952 Board Member Portfolios Overseen: 101 | President and Chief Executive Officer (since March 1995) and formerly Chief Operating Officer (December 1989-February 1995) of Telemat Limited LLC (formerly Telemat Ltd) (management consulting); formerly Vice President (January 1985-June 1989) at Morgan Stanley & Co. (broker-dealer). | Trustee of Equity Residential (residential real estate) (since December 2009); Director of Northern Trust Corporation (financial services) (since April 2006); formerly Director of Anixter International, Inc. (communication products distributor) (January 2006-June 2020). | Since March 2005 | |||
Barry H. Evans 1960 Board Member Portfolios Overseen: 104 | Retired; formerly President (2005-2016), Global Chief Operating Officer (2014-2016), Chief Investment Officer - Global Head of Fixed Income (1998-2014), and various portfolio manager roles (1986-2006), Manulife Asset Management (asset management). | Formerly Director, Manulife Trust Company (2011-2018); formerly Director, Manulife Asset Management Limited (2015-2017); formerly Chairman of the Board of Directors of Manulife Asset Management U.S. (2005-2016); formerly Chairman of the Board, Declaration Investment Management and Research (2008-2016). | Since September 2017 | |||
Keith F. Hartstein 1956 Board Member & Independent Chair Portfolios Overseen: 104 | Retired; formerly Member (November 2014-September 2022) of the Governing Council of the Independent Directors Council (IDC) (organization of independent mutual fund directors); formerly Executive Committee of the IDC Board of Governors (October 2019-December 2021); formerly President and Chief Executive Officer (2005-2012), Senior Vice President (2004-2005), Senior Vice President of Sales and Marketing (1997-2004), and various executive management positions (1990-1997), John Hancock Funds, LLC (asset management); formerly Chairman, Investment Company Institute’s Sales Force Marketing Committee (2003-2008). | None. | Since September 2013 | |||
Visit our website at pgim.com/investments
| Independent Board Members | ||||||
Name Year of Birth Position(s) Portfolios Overseen | Principal Occupation(s) During Past Five Years | Other Directorships Held During Past Five Years | Length of Board Service | |||
Laurie Simon Hodrick 1962 Board Member Portfolios Overseen: 101 | A. Barton Hepburn Professor Emerita of Economics in the Faculty of Business, Columbia Business School (since 2018); Visiting Fellow at the Hoover Institution, Stanford University (since 2015); Sole Member, ReidCourt LLC (since 2008) (a consulting firm); formerly Visiting Professor of Law, Stanford Law School (2015-2021); formerly A. Barton Hepburn Professor of Economics in the Faculty of Business, Columbia Business School (1996-2017); formerly Managing Director, Global Head of Alternative Investment Strategies, Deutsche Bank (2006-2008). | Independent Director, Andela (since January 2022) (global talent network); Independent Director, Roku (since December 2020) (communication services); formerly Independent Director, Synnex Corporation (2019-2021) (information technology); formerly Independent Director, Kabbage, Inc. (2018-2020) (financial services); formerly Independent Director, Corporate Capital Trust (2017-2018) (a business development company). | Since September 2017 | |||
Brian K. Reid 1961 Board Member Portfolios Overseen: 104 | Retired; formerly Chief Economist for the Investment Company Institute (ICI) (2005-2017); formerly Senior Economist and Director of Industry and Financial Analysis at the ICI (1998-2004); formerly Senior Economist, Industry and Financial Analysis at the ICI (1996-1998); formerly Staff Economist at the Federal Reserve Board (1989-1996); formerly Director, ICI Mutual Insurance Company (2012-2017). | None. | Since March 2018 | |||
PGIM Floating Rate Income Fund
| Independent Board Members | ||||||
Name Year of Birth Position(s) Portfolios Overseen | Principal Occupation(s) During Past Five Years | Other Directorships Held During Past Five Years | Length of Board Service | |||
Grace C. Torres 1959 Board Member Portfolios Overseen: 104 | Retired; formerly Treasurer and Principal Financial and Accounting Officer of the PGIM Funds, Target Funds, Advanced Series Trust, Prudential Variable Contract Accounts and The Prudential Series Fund (1998-June 2014); Assistant Treasurer (March 1999-June 2014) and Senior Vice President (September 1999-June 2014) of PGIM Investments LLC; Assistant Treasurer (May 2003-June 2014) and Vice President (June 2005-June 2014) of AST Investment Services, Inc.; Senior Vice President and Assistant Treasurer (May 2003-June 2014) of Prudential Annuities Advisory Services, Inc. | Director (since January 2018) of OceanFirst Financial Corp. and OceanFirst Bank; formerly Director (July 2015-January 2018) of Sun Bancorp, Inc. N.A. and Sun National Bank. | Since November 2014 | |||
Visit our website at pgim.com/investments
| Interested Board Members | ||||||
Name Year of Birth Position(s) Portfolios Overseen | Principal Occupation(s) During Past Five Years | Other Directorships Held During Past Five Years | Length of Board Service | |||
Stuart S. Parker 1962 Board Member, President & Principal Executive Officer Portfolios Overseen: 104 | President, Chief Executive Officer and Officer in Charge of PGIM Investments LLC (formerly known as Prudential Investments LLC) (since January 2012); President and Principal Executive Officer (“PEO”) (since September 2023) of the PGIM Credit Income Fund and the PGIM Rock ETF Trust; President and PEO (since September 2022) of the PGIM Private Credit Fund; President and PEO (since March 2022) of the PGIM Private Real Estate Fund, Inc.; formerly Chief Operating Officer for PGIM Investments LLC (January 2012-January 2024); formerly Executive Vice President of Jennison Associates LLC and Head of Retail Distribution of PGIM Investments LLC (June 2005-December 2011); Investment Company Institute - Board of Governors (since May 2012). | None. | Since January 2012 | |||
PGIM Floating Rate Income Fund
| Interested Board Members | ||||||
Name Year of Birth Position(s) Portfolios Overseen | Principal Occupation(s) During Past Five Years | Other Directorships Held During Past Five Years | Length of Board Service | |||
Scott E. Benjamin 1973 Board Member & Vice President Portfolios Overseen: 131 | Executive Vice President (since May 2009) of PGIM Investments LLC; Vice President (since June 2012) of Prudential Investment Management Services LLC; Executive Vice President (since September 2009) of AST Investment Services, Inc.; Senior Vice President of Global Product Management and Marketing, PGIM Investments (since February 2006); Vice President (since September 2023) of the PGIM Credit Income Fund and the PGIM Rock ETF Trust; Vice President (since September 2022) of the PGIM Private Credit Fund; Vice President (since March 2022) of the PGIM Private Real Estate Fund, Inc.; formerly Vice President of Product Development and Product Management, PGIM Investments LLC (2003-2006). | None. | Since March 2010 | |||
| Fund Officers(a) | ||||
Name Year of Birth Fund Position | Principal Occupation(s) During Past Five Years | Length of Service as Fund Officer | ||
Claudia DiGiacomo 1974 Chief Legal Officer | Chief Legal Officer, Executive Vice President and Secretary of PGIM Investments (since August 2020); Chief Legal Officer of Prudential Mutual Fund Services LLC (since August 2020); Chief Legal Officer of PIFM Holdco, LLC (since August 2020); Corporate Counsel of AST Investment Services, Inc. (since August 2020) and Vice President and Corporate Counsel (since January 2005) of Prudential; Chief Legal Officer (since September 2023) of the PGIM Credit Income Fund and PGIM Rock ETF Trust; Chief Legal Officer (since September 2022) of the PGIM Private Credit Fund; Chief Legal Officer (since July 2022) of the PGIM Private Real Estate Fund, Inc.; formerly, Vice President and Assistant Secretary of PGIM Investments LLC (2005-2020); formerly Associate at Sidley Austin Brown & Wood LLP (1999-2004). | Since December 2005 | ||
Visit our website at pgim.com/investments
| Fund Officers(a) | ||||
Name Year of Birth Fund Position | Principal Occupation(s) During Past Five Years | Length of Service as Fund Officer | ||
Andrew Donohue 1972 Chief Compliance Officer | Vice President, Chief Compliance Officer of PGIM Investments LLC (since September 2022); Chief Compliance Officer of AST Investment Services, Inc. (since October 2022); Chief Compliance Officer (since May 2023) of the PGIM Funds, Target Funds, PGIM ETF Trust, PGIM Global High Yield Fund, Inc., PGIM High Yield Bond Fund, Inc., PGIM Short Duration High Yield Opportunities Fund, Advanced Series Trust, The Prudential Series Fund, Prudential’s Gibraltar Fund, Inc., PGIM Private Credit Fund, PGIM Private Real Estate Fund, Inc.; Chief Compliance Officer (since September 2023) of the PGIM Credit Income Fund and PGIM Rock ETF Trust; formerly various senior compliance roles within Principal Global Investors, LLC., global asset management for Principal Financial (2011-2022), most recently as Global Chief Compliance Officer (2016-2022). | Since May 2023 | ||
Andrew R. French 1962 Secretary | Vice President (since December 2018) of PGIM Investments LLC; Secretary (since September 2023) of the PGIM Credit Income Fund and the PGIM Rock ETF Trust; Secretary (since September 2022) of the PGIM Private Credit Fund; Secretary (since March 2022) of the PGIM Private Real Estate Fund, Inc.; formerly Vice President and Corporate Counsel (2010-2018) of Prudential; formerly Director and Corporate Counsel (2006-2010) of Prudential; Vice President and Assistant Secretary (since January 2007) of PGIM Investments LLC; Vice President and Assistant Secretary (since January 2007) of Prudential Mutual Fund Services LLC. | Since October 2006 | ||
Melissa Gonzalez 1980 Assistant Secretary | Vice President and Corporate Counsel (since September 2018) of Prudential; Vice President and Assistant Secretary (since August 2020) of PGIM Investments LLC; Assistant Secretary (since September 2023) of the PGIM Credit Income Fund and the PGIM Rock ETF Trust; Assistant Secretary (since September 2022) of the PGIM Private Credit Fund; Assistant Secretary (since March 2022) of the PGIM Private Real Estate Fund, Inc.; formerly Director and Corporate Counsel (March 2014-September 2018) of Prudential. | Since March 2020 | ||
Patrick E. McGuinness 1986 Assistant Secretary | Vice President and Assistant Secretary (since August 2020) of PGIM Investments LLC; Director and Corporate Counsel (since February 2017) of Prudential; Assistant Secretary (since September 2023) of the PGIM Credit Income Fund and the PGIM Rock ETF Trust; Assistant Secretary (since September 2022) of the PGIM Private Credit Fund; Assistant Secretary (since March 2022) of the PGIM Private Real Estate Fund, Inc. | Since June 2020 | ||
PGIM Floating Rate Income Fund
| Fund Officers(a) | ||||
Name Year of Birth Fund Position | Principal Occupation(s) During Past Five Years | Length of Service as Fund Officer | ||
Debra Rubano 1975 Assistant Secretary | Vice President and Corporate Counsel (since November 2020) of Prudential; Assistant Secretary (since September 2023) of the PGIM Credit Income Fund and the PGIM Rock ETF Trust; Assistant Secretary (since September 2022) of the PGIM Private Credit Fund; Assistant Secretary (since March 2022) of the PGIM Private Real Estate Fund, Inc; formerly Director and Senior Counsel of Allianz Global Investors U.S. Holdings LLC (2010-2020) and Assistant Secretary of numerous funds in the Allianz fund complex (2015-2020). | Since December 2020 | ||
George Hoyt 1965 Assistant Secretary | Vice President and Corporate Counsel of Prudential (since September 2023); Assistant Secretary (since September 2023) of the PGIM Rock ETF Trust, PGIM Credit Income Fund, PGIM Private Credit Fund and PGIM Private Real Estate Fund, Inc.; formerly Associate General Counsel of Franklin Templeton and Secretary and Chief Legal Officer of certain funds in the Franklin Templeton complex (2020-2023) and Managing Director (2016-2020) and Associate General Counsel for Legg Mason, Inc. and its predecessors (2004-2020). | Since December 2023 | ||
Devan Goolsby 1991 Assistant Secretary | Vice President and Corporate Counsel of Prudential (since May 2023); Assistant Secretary (since September 2023) of the PGIM Rock ETF Trust, PGIM Credit Income Fund, PGIM Private Credit Fund and PGIM Private Real Estate Fund, Inc.; formerly Associate at Eversheds Sutherland (US) LLP (2021-2023); Compliance Officer at Bloomberg LP (2019-2021); and an Examiner at the Financial Industry Regulatory Authority (2015-2019). | Since December 2023 | ||
Kelly A. Coyne 1968 Assistant Secretary | Director, Investment Operations of Prudential Mutual Fund Services LLC (since 2010); Assistant Secretary (since September 2023) of the PGIM Credit Income Fund; Assistant Secretary (since September 2022) of the PGIM Private Credit Fund; Assistant Secretary (since March 2022) of the PGIM Private Real Estate Fund, Inc. | Since March 2015 | ||
Visit our website at pgim.com/investments
| Fund Officers(a) | ||||
Name Year of Birth Fund Position | Principal Occupation(s) During Past Five Years | Length of Service as Fund Officer | ||
Christian J. Kelly 1975 Chief Financial Officer | Vice President, Global Head of Fund Administration of PGIM Investments LLC (since November 2018); Chief Financial Officer (since March 2023) of PGIM Investments mutual funds, closed end funds, the PGIM ETF Trust, and Advanced Series Trust, The Prudential Series Fund and Prudential’s Gibraltar Fund, Inc.; Chief Financial Officer (since September 2023) of the PGIM Credit Income Fund and the PGIM Rock ETF Trust; Chief Financial Officer of PGIM Private Credit Fund (since September 2022); Chief Financial Officer of PGIM Private Real Estate Fund, Inc. (since July 2022); formerly Treasurer and Principal Financial Officer (January 2019- March 2023) of PGIM Investments mutual funds, closed end funds, the PGIM ETF Trust, and Advanced Series Trust, The Prudential Series Fund and Prudential’s Gibraltar Fund, Inc.; formerly Treasurer and Principal Financial Officer (March 2022 – July 2022) of the PGIM Private Real Estate Fund, Inc.; formerly Director of Fund Administration of Lord Abbett & Co. LLC (2009-2018), Treasurer and Principal Accounting Officer of the Lord Abbett Family of Funds (2017-2018); Director of Accounting, Avenue Capital Group (2008-2009); Senior Manager, Investment Management Practice of Deloitte & Touche LLP (1998-2007). | Since January 2019 | ||
Russ Shupak 1973 Treasurer and Principal Accounting Officer | Vice President (since 2017) within PGIM Investments Fund Administration; Treasurer and Principal Accounting Officer of PGIM Investments mutual funds, closed end funds and PGIM ETF Trust (since March 2023); Treasurer and Principal Accounting Officer (since September 2023) of the PGIM Credit Income Fund; Treasurer and Principal Accounting Officer (since July 2022) of the PGIM Private Real Estate Fund, Inc.; Assistant Treasurer (since September 2023) of the PGIM Rock ETF Trust; Assistant Treasurer (since September 2022) of the PGIM Private Credit Fund; formerly Assistant Treasurer (March 2022 – July 2022) of the PGIM Private Real Estate Fund, Inc.; Assistant Treasurer of Advanced Series Trust, The Prudential Series Fund and Prudential’s Gibraltar Fund, Inc. (since October 2019); formerly Director (2013-2017) within PGIM Investments Fund Administration. | Since October 2019 | ||
Lana Lomuti 1967 Assistant Treasurer | Vice President (since 2007) within PGIM Investments Fund Administration; formerly Assistant Treasurer (December 2007-February 2014) of The Greater China Fund, Inc.; formerly Director (2005-2007) within PGIM Investments Fund Administration. | Since April 2014 | ||
Deborah Conway 1969 Assistant Treasurer | Vice President (since 2017) within PGIM Investments Fund Administration; formerly Director (2007-2017) within PGIM Investments Fund Administration. | Since October 2019 | ||
PGIM Floating Rate Income Fund
| Fund Officers(a) | ||||
Name Year of Birth Fund Position | Principal Occupation(s) During Past Five Years | Length of Service as Fund Officer | ||
Elyse M. McLaughlin 1974 Assistant Treasurer | Vice President (since 2017) within PGIM Investments Fund Administration; Treasurer and Principal Accounting Officer of the Advanced Series Trust, The Prudential Series Fund and Prudential’s Gibraltar Fund, Inc. (since March 2023); Treasurer and Principal Accounting Officer (since September 2023) of the PGIM Rock ETF Trust; Assistant Treasurer (since September 2023) of the PGIM Credit Income Fund; Treasurer and Principal Accounting Officer (since September 2022) of the PGIM Private Credit Fund; Assistant Treasurer (since March 2022) of the PGIM Private Real Estate Fund, Inc.; Assistant Treasurer of PGIM Investments mutual funds, closed end funds and the PGIM ETF Trust (since October 2019); formerly Director (2011-2017) within PGIM Investments Fund Administration. | Since October 2019 | ||
Robert W. McCormack 1973 Assistant Treasurer | Vice President (since 2019) within PGIM Investments Fund Administration; Assistant Treasurer (since March 2023) of PGIM Investments mutual funds, closed end funds, PGIM ETF Trust, Advanced Series Trust, The Prudential Series Fund and Prudential’s Gibraltar Fund, Inc.; Assistant Treasurer (since September 2023) of the PGIM Credit Income Fund and the PGIM Rock ETF Trust; Assistant Treasurer (since September 2022) of the PGIM Private Credit Fund; Assistant Treasurer (since March 2022) of the PGIM Private Real Estate Fund, Inc.; formerly Director (2016-2019) within PGIM Investments Fund Administration; formerly Vice President within Goldman, Sachs & Co. Investment Management Controllers (2008-2016), Assistant Treasurer of Goldman Sachs Family of Funds (2015-2016). | Since March 2023 | ||
Kelly Florio 1978 Anti-Money Laundering Compliance Officer | Vice President, Corporate Compliance, Global Compliance Programs and Compliance Risk Management (since December 2021) of Prudential; formerly Head of Fraud Risk Management (October 2019-December 2021) at New York Life Insurance Company; formerly Head of Key Risk Area Operations (November 2018-October 2019), Director of the US Anti-Money Laundering Compliance Unit (2009-2018) and Bank Loss Prevention Associate (2006-2009) at MetLife. | Since June 2022 | ||
| (a) | Excludes Mr. Parker and Mr. Benjamin, interested Board Members who also serve as President and Vice President, respectively. |
Explanatory Notes to Tables:
| ∎ | Board Members are deemed to be “Interested,” as defined in the 1940 Act, by reason of their affiliation with PGIM Investments LLC and/or an affiliate of PGIM Investments LLC. |
| ∎ | Unless otherwise noted, the address of all Board Members and Officers is c/o PGIM Investments LLC, 655 Broad Street, Newark, New Jersey 07102-4410. |
| ∎ | There is no set term of office for Board Members or Officers. The Board Members have adopted a retirement policy, which calls for the retirement of Board Members on December 31 of the year in which they reach the age of 75. |
| ∎ | “Other Directorships Held” includes all directorships of companies required to register or file reports with the SEC under the 1934 Act (that is, “public companies”) or other investment companies registered under the 1940 Act. |
Visit our website at pgim.com/investments
| ∎ | “Portfolios Overseen” includes such applicable investment companies managed by PGIM Investments LLC and overseen by the Board Member. The investment companies for which PGIM Investments LLC serves as manager include the PGIM Mutual Funds, Target Funds, PGIM ETF Trust, PGIM Rock ETF Trust, PGIM Private Real Estate Fund, Inc., PGIM Private Credit Fund, PGIM Credit Income Fund, PGIM High Yield Bond Fund, Inc., PGIM Global High Yield Fund, Inc., PGIM Short Duration High Yield Opportunities Fund, The Prudential Series Fund, Prudential’s Gibraltar Fund, Inc. and the Advanced Series Trust. |
| ∎ | As used in the Fund Officers table “Prudential” means The Prudential Insurance Company of America. |
PGIM Floating Rate Income Fund
∎ TELEPHONE | ∎ WEBSITE | |||
655 Broad Street Newark, NJ 07102
| (800) 225-1852 | pgim.com/investments |
PROXY VOTING
The Board of Directors of the Fund has delegated to the Fund’s subadvisers the responsibility for voting any proxies and maintaining proxy recordkeeping with respect to the Fund. A description of these proxy voting policies and procedures is available without charge, upon request, by calling (800) 225-1852 or by visiting the Securities and Exchange Commission’s website at sec.gov.Information regarding how the Fund voted proxies relating to portfolio securities during the most recent 12-month period ended June 30 is available on the Fund’s website and on the Securities and Exchange Commission’s website. |
DIRECTORS Ellen S. Alberding · Kevin J. Bannon · Scott E. Benjamin · Linda W. Bynoe · Barry H. Evans · Keith F. Hartstein · Laurie Simon Hodrick · Stuart S. Parker · Brian K. Reid · Grace C. Torres |
OFFICERS Stuart S. Parker, President and Principal Executive Officer · Scott E. Benjamin, Vice President · Christian J. Kelly, Chief Financial Officer · Claudia DiGiacomo, Chief Legal Officer · Andrew Donohue, Chief Compliance Officer · Russ Shupak, Treasurer and Principal Accounting Officer · Kelly Florio, Anti-Money Laundering Compliance Officer · Andrew R. French, Secretary · Melissa Gonzalez, Assistant Secretary · Kelly A. Coyne, Assistant Secretary · Patrick E. McGuinness, Assistant Secretary · Debra Rubano, Assistant Secretary · George Hoyt, Assistant Secretary · Devan Goolsby, Assistant Secretary · Lana Lomuti, Assistant Treasurer · Elyse M. McLaughlin, Assistant Treasurer · Deborah Conway, Assistant Treasurer · Robert W. McCormack, Assistant Treasurer |
MANAGER | PGIM Investments LLC | 655 Broad Street Newark, NJ 07102 | ||
SUBADVISERS | PGIM Fixed Income | 655 Broad Street Newark, NJ 07102 | ||
| PGIM Limited | Grand Buildings, 1-3 Strand Trafalgar Square London, WC2N 5HR United Kingdom | |||
DISTRIBUTOR | Prudential Investment Management Services LLC | 655 Broad Street Newark, NJ 07102 | ||
CUSTODIAN | The Bank of New York Mellon | 240 Greenwich Street New York, NY 10286 | ||
TRANSFER AGENT | Prudential Mutual Fund Services LLC | PO Box 534432 Pittsburgh, PA 15253 | ||
INDEPENDENT REGISTERED PUBLIC ACCOUNTING FIRM | PricewaterhouseCoopers LLP | 300 Madison Avenue New York, NY 10017 | ||
FUND COUNSEL | Willkie Farr &Gallagher LLP | 787 Seventh Avenue New York, NY 10019 | ||
| An investor should consider the investment objectives, risks, charges, and expenses of the Fund carefully before investing. The prospectus and summary prospectus contain this and other information about the Fund. An investor may obtain the prospectus and summary prospectus by visiting our website at pgim.com/investments or by calling (800) 225-1852. The prospectus and summary prospectus should be read carefully before investing. |
E-DELIVERY
To receive your mutual fund documents online, go to pgim.com/investments/resource/edelivery and enroll. Instead of receiving printed documents by mail, you will receive notification via email when new materials are available. You can cancel your enrollment or change your email address at any time by visiting the website address above. |
SHAREHOLDER COMMUNICATIONS WITH DIRECTORS
Shareholders can communicate directly with the Board of Directors by writing to the Chair of the Board, PGIM Floating Rate Income Fund, PGIM Investments, Attn: Board of Directors, 655 Broad Street, Newark, NJ 07102. Shareholders can communicate directly with an individual Director by writing to that Director at the same address. Communications are not screened before being delivered to the addressee. |
AVAILABILITY OF PORTFOLIO HOLDINGS
The Fund files its complete schedule of portfolio holdings with the Securities and Exchange Commission for the first and third quarters of each fiscal year as an exhibit to its reports on Form N-PORT. The Fund’s Form N-PORT filings are available on the Commission’s website at sec.gov. |
| The Fund’s Statement of Additional Information contains additional information about the Fund’s Directors and is available without charge, upon request, by calling (800) 225-1852. |
Mutual Funds:
ARE NOT INSURED BY THE FDIC OR ANY FEDERAL GOVERNMENT AGENCY | MAY LOSE VALUE | ARE NOT A DEPOSIT OF OR GUARANTEED BY ANY BANK OR ANY BANK AFFILIATE | ||

PGIM FLOATING RATE INCOME FUND
| ||||||||
| SHARE CLASS | A | C | Z | R6 | ||||
NASDAQ | FRFAX | FRFCX | FRFZX | PFRIX | ||||
CUSIP | 74439V602 | 74439V701 | 74439V800 | 74439V883 | ||||
MF211E
| Item 2 – | Code of Ethics — See Exhibit (a) |
As of the end of the period covered by this report, the registrant has adopted a code of ethics (the “Section 406 Standards for Investment Companies – Ethical Standards for Principal Executive and Financial Officers”) that applies to the registrant’s Principal Executive Officer, Principal Financial Officer and Principal Accounting Officer.
The registrant hereby undertakes to provide any person, without charge, upon request, a copy of the code of ethics. To request a copy of the code of ethics, contact the registrant 800-225-1852, and ask for a copy of the Section 406 Standards for Investment Companies - Ethical Standards for Principal Executive and Financial Officers.
| Item 3 – | Audit Committee Financial Expert – |
The registrant’s Board has determined that Ms. Grace C. Torres, member of the Board’s Audit Committee is an “audit committee financial expert,” and that she is “independent,” for purposes of this item.
| Item 4 – | Principal Accountant Fees and Services – |
(a) Audit Fees
For the fiscal years ended February 29, 2024 and February 28, 2023, PricewaterhouseCoopers LLP (“PwC”), the Registrant’s principal accountant, billed the Registrant $106,000 and $100,000, respectively, for professional services rendered for the audit of the Registrant’s annual financial statements or services that are normally provided in connection with statutory and regulatory filings.
(b) Audit-Related Fees
For the fiscal years ended February 29, 2024 and February 28, 2023: none.
(c) Tax Fees
For the fiscal years ended February 29, 2024 and February 28, 2023: none.
(d) All Other Fees
For the fiscal years ended February 29, 2024 and February 28, 2023: none.
(e) (1) Audit Committee Pre-Approval Policies and Procedures
THE PGIM MUTUAL FUNDS
AUDIT COMMITTEE POLICY
on
Pre-Approval of Services Provided by the Independent
Accountants
The Audit Committee of each PGIM Mutual Fund is charged with the responsibility to monitor the independence of the Fund’s independent accountants. As part of this responsibility, the Audit Committee must pre-approve the independent accounting firm’s engagement to render audit and/or permissible non-audit services, as required by law. In evaluating a proposed engagement of the independent accountants, the Audit Committee will assess the effect that the engagement might reasonably be expected to have on the accountant’s independence. The Committee’s evaluation will be based on:
| • | a review of the nature of the professional services expected to be provided, |
| • | a review of the safeguards put into place by the accounting firm to safeguard independence, and |
| • | periodic meetings with the accounting firm. |
Policy for Audit and Non-Audit Services Provided to the Funds
On an annual basis, the scope of audits for each Fund, audit fees and expenses, and audit-related and non-audit services (and fees proposed in respect thereof) proposed to be performed by the Fund’s independent accountants will be presented by the Treasurer and the independent accountants to the Audit Committee for review and, as appropriate, approval prior to the initiation of such services.
Such presentation shall be accompanied by confirmation by both the Treasurer and the independent accountants that the proposed non-audit services will not adversely affect the independence of the independent accountants. Such proposed non-audit services shall be described in sufficient detail to enable the Audit Committee to assess the appropriateness of such services and fees, and the compatibility of the provision of such services with the auditor’s independence. The Committee shall receive periodic reports on the progress of the audit and other services which are approved by the Committee or by the Committee Chair pursuant to authority delegated in this Policy.
The categories of services enumerated under “Audit Services”, “Audit-related Services”, and “Tax Services” are intended to provide guidance to the Treasurer and the independent accountants as to those categories of services which the Committee believes are generally consistent with the independence of the independent accountants and which the Committee (or the Committee Chair) would expect upon the presentation of specific proposals to pre-approve. The enumerated categories are not intended as an exclusive list of audit, audit-related or tax services, which the Committee (or the Committee Chair) would consider for pre-approval.
Audit Services
The following categories of audit services are considered to be consistent with the role of the Fund’s independent accountants:
| • | Annual Fund financial statement audits |
| • | Seed audits (related to new product filings, as required) |
| • | SEC and regulatory filings and consents |
Audit-related Services
The following categories of audit-related services are considered to be consistent with the role of the Fund’s independent accountants:
| • | Accounting consultations |
| • | Fund merger support services |
| • | Agreed Upon Procedure Reports |
| • | Attestation Reports |
| • | Other Internal Control Reports |
Individual audit-related services that fall within one of these categories (except for fund merger support services) and are not presented to the Audit Committee as part of the annual pre-approval process are subject to an authorized pre-approval by the Audit Committee so long as the estimated fee for those services does not exceed $30,000. Any services provided under such pre-approval will be reported to the Audit Committee at its next regular meeting. Should the amount of such services exceed $30,000 any additional fees will be subject to pre-approval by the Committee Chair (or any other Committee member on whom this responsibility has been delegated). Fees related to fund merger support services are subject to a separate authorized pre-approval by the Audit Committee with fees determined on a per occurrence and merger complexity basis.
Tax Services
The following categories of tax services are considered to be consistent with the role of the Fund’s independent accountants:
| • | Tax compliance services related to the filing or amendment of the following: |
| • | Federal, state and local income tax compliance; and, |
| • | Sales and use tax compliance |
| • | Timely RIC qualification reviews |
| • | Tax distribution analysis and planning |
| • | Tax authority examination services |
| • | Tax appeals support services |
| • | Accounting methods studies |
| • | Fund merger support services |
| • | Tax consulting services and related projects |
Individual tax services that fall within one of these categories and are not presented to the Audit Committee as part of the annual pre-approval process are subject to an authorized pre-approval by the Audit Committee so long as the estimated fee for those services does not exceed $30,000. Any services provided under such pre-approval will be reported to the Audit Committee at its next regular meeting. Should the amount of such services exceed $30,000 any additional fees will be subject to pre-approval by the Committee Chair (or any other Committee member on whom this responsibility has been delegated).
Other Non-Audit Services
Certain non-audit services that the independent accountants are legally permitted to render will be subject to pre-approval by the Committee or by one or more Committee members to whom the Committee has delegated this authority and who will report to the full Committee any pre-approval decisions made pursuant to this Policy. Non-audit services presented for pre-approval pursuant to this paragraph will be accompanied by a confirmation from both the Treasurer and the independent accountants that the proposed services will not adversely affect the independence of the independent accountants.
Proscribed Services
The Fund’s independent accountants will not render services in the following categories of non-audit services:
| • | Bookkeeping or other services related to the accounting records or financial statements of the Fund |
| • | Financial information systems design and implementation |
| • | Appraisal or valuation services, fairness opinions, or contribution-in-kind reports |
| • | Actuarial services |
| • | Internal audit outsourcing services |
| • | Management functions or human resources |
| • | Broker or dealer, investment adviser, or investment banking services |
| • | Legal services and expert services unrelated to the audit |
| • | Any other service that the Public Company Accounting Oversight Board determines, by regulation, is |
impermissible. |
Pre-approval of Non-Audit Services Provided to Other Entities Within the PGIM Fund Complex
Certain non-audit services provided to PGIM Investments LLC or any of its affiliates that also provide ongoing services to the PGIM Mutual Funds will be subject to pre-approval by the Audit Committee. The only non-audit services provided to these entities that will require pre-approval are those related directly to the operations and financial reporting of the Funds. Individual projects that are not presented to the Audit Committee as part of the annual pre-approval process will be subject to pre-approval by the Committee Chair (or any other Committee member on whom this responsibility has been delegated) so long as the estimated fee for those services does not exceed $30,000. Services presented for pre-approval pursuant to this paragraph will be accompanied by a confirmation from both the Treasurer and the independent accountants that the proposed services will not adversely affect the independence of the independent accountants.
Although the Audit Committee will not pre-approve all services provided to PGIM Investments LLC and its affiliates, the Committee will receive an annual report from the Fund’s independent accounting firm showing the aggregate fees for all services provided to PGIM Investments and its affiliates.
| (e) | (2) Percentage of services described in each of paragraphs (b) through (d) of this Item that were approved by the audit committee pursuant to paragraph (c)(7)(i)(C) of Rule 2-01 of Regulation S-X – |
| Fiscal Year Ended February 29, 2024 | Fiscal Year Ended February 28, 2023 | |||||||
| 4(b) | Not applicable. | Not applicable. | ||||||
| 4(c) | Not applicable. | Not applicable. | ||||||
| 4(d) | Not applicable. | Not applicable. |
(f) Percentage of hours expended attributable to work performed by other than full time employees of principal accountant if greater than 50%.
The percentage of hours expended on the principal accountant’s engagement to audit the registrant’s financial statements for the most recent fiscal year that were attributed to work performed by persons other than the principal accountant’s full-time, permanent employees was 0%.
(g) Non-Audit Fees
The aggregate non-audit fees billed by the Registrant’s principal accountant for services rendered to the registrant’s investment adviser and any entity controlling, controlled by, or under common control with the investment adviser that provides ongoing services to the registrant for the fiscal years ended February 29, 2024 and February 28, 2023 was $0 and $0, respectively.
(h) Principal Accountant’s Independence
Not applicable as the Registrant’s principal accountant has not provided non-audit services to the registrant’s investment adviser and any entity controlling, controlled by, or under common control with the investment adviser that provides ongoing services to the registrant that were not pre-approved pursuant to Rule 2-01(c)(7)(ii) of Regulation S-X.
(i) Not applicable.
(j) Not applicable.
| Item 5 – | Audit Committee of Listed Registrants – Not applicable. |
| Item 6 – | Schedule of Investments – The schedule is included as part of the report to shareholders filed under Item 1 of this Form. |
| Item 7 – | Disclosure of Proxy Voting Policies and Procedures for Closed-End Management Investment Companies – Not applicable. |
| Item 8 – | Portfolio Managers of Closed-End Management Investment Companies – Not applicable. |
| Item 9 – | Purchases of Equity Securities by Closed-End Management Investment Company and Affiliated Purchasers – Not applicable. |
| Item 10 – | Submission of Matters to a Vote of Security Holders – There have been no material changes to these procedures. |
| Item 11 – | Controls and Procedures |
| (a) | It is the conclusion of the registrant’s principal executive officer and principal financial officer that the effectiveness of the registrant’s current disclosure controls and procedures (such disclosure controls and procedures having been evaluated within 90 days of the date of this filing) provide reasonable assurance that the information required to be disclosed by the registrant has been recorded, processed, summarized and reported within the time period specified in the Commission’s rules and forms and that the information required to be disclosed by the registrant has been accumulated and communicated to the registrant’s principal executive officer and principal financial officer in order to allow timely decisions regarding required disclosure. |
| (b) | There has been no significant change in the registrant’s internal control over financial reporting (as defined in Rule 30a-3(d) under the Act (17 CFR 270.30a-3(d)) that occurred during the period covered by this report that has materially affected, or is reasonably likely to materially affect, the registrant’s internal control over financial reporting. |
| Item 12 – | Controls and Procedures - Disclosure of Securities Lending Activities for Closed-End Management Investment Companies – Not applicable. |
| Item 13 – | Exhibits |
| (a)(1) |
| (a)(2) |
(a)(2)(1) Any written solicitation to purchase securities under Rule 23c-1 – Not applicable.
(a)(2)(2) Change in the registrant’s independent public accountant – Not applicable.
| (b) |
SIGNATURES
Pursuant to the requirements of the Securities Exchange Act of 1934 and the Investment Company Act of 1940, the registrant has duly caused this report to be signed on its behalf by the undersigned, thereunto duly authorized.
Registrant: | Prudential Investment Portfolios, Inc. 14 | |
By: | /s/ Andrew R. French | |
Andrew R. French | ||
Secretary | ||
Date: | April 18, 2024 | |
Pursuant to the requirements of the Securities Exchange Act of 1934 and the Investment Company Act of 1940, this report has been signed below by the following persons on behalf of the registrant and in the capacities and on the dates indicated.
By: | /s/ Stuart S. Parker | |
| Stuart S. Parker | ||
| President and Principal Executive Officer | ||
Date: | April 18, 2024 | |
By: | /s/ Christian J. Kelly | |
| Christian J. Kelly | ||
Chief Financial Officer (Principal Financial Officer) | ||
Date: | April 18, 2024 | |