Table of Contents
SECURITIES AND EXCHANGE COMMISSION
Washington, D.C. 20549
FORM6-K
REPORT OF FOREIGN ISSUER
Pursuant to Rule13a-16 or15d-16 of
the Securities Exchange Act of 1934
July 18, 2017
Commission File Number
000-12033
LM ERICSSON TELEPHONE COMPANY
(Translation of registrant’s name into English)
Torshamnsgatan 21, Kista
SE-164 83, Stockholm, Sweden
(Address of principal executive offices)
Indicate by check mark whether the registrant files or will file annual reports under cover Form20-F or Form40-F.Form 20-F ☒ Form 40-F ☐
Indicate by check mark if the registrant is submitting the Form6-K in paper as permitted by RegulationS-T Rule 101(b)(1): ☐
Indicate by check mark if the registrant is submitting the Form6-K in paper as permitted by RegulationS-T Rule 101(b)(7): ☐
Announcement of LM Ericsson Telephone Company, July 18, 2017 regarding “Ericsson reports second quarter results 2017”.
Table of Contents
SIGNATURES
Pursuant to the requirements of the Securities Exchange Act of 1934, the registrant has duly caused this report to be signed on its behalf by the undersigned, thereunto duly authorized.
| TELEFONAKTIEBOLAGET LM ERICSSON (publ) | ||
| By: | /s/ NINAMACPHERSON | |
| Nina Macpherson | ||
| Senior Vice President & Chief Legal Officer | ||
| By: | /s/ HELENANORRMAN | |
| Helena Norrman | ||
| Senior Vice President | ||
| Corporate Marketing & Communications Officer | ||
Date:July 18, 2017
Table of Contents

SECOND QUARTER 2017
Stockholm, July 18, 2017
SECOND QUARTER HIGHLIGHTS | Read more | |||
| • | Reported sales decreased by-8% YoY. Sales, adjusted for comparable units and currency, decreased by-13% YoY. The RAN equipment market for 2017 is estimated to show a high single-digit percentage decline compared with previous estimate of-2% to-6%. | 2 | ||
| • | Gross margin was 27.9% (32.3%). Gross margin, excluding restructuring charges, was 29.8% (33.2%). | 3 | ||
| • | Operating income was SEK-1.2 b. Operating income, excluding restructuring charges was SEK 0.3 b., with a YoY decline in all segments. | 4 | ||
| • | Networks operating margin was 7%. Operating margin, excluding restructuring charges, declined to 10% (13%) negatively impacted by continued lower software sales. | 6 | ||
| • | IT & Cloud operating income was negatively impacted by less capitalization of development expenses QoQ and YoY. | 7 | ||
| • | Planned cost reduction activities will be accelerated, due to current market environment, to achieve an annual run rate reduction of at least SEK 10 b. bymid-2018. | 2 | ||
| • | The company sees an increased risk of further market and customer project adjustments with an estimated negative impact on operating income of SEK3-5 b. for the coming 12 months. | 2 | ||
| • | Due to technology and portfolio shifts capitalization of costs will be reduced and is estimated to result in a net negative impact on operating income of SEK-2.9 (1.3) b. in the second half 2017, with no impact on cash. | 2 | ||
| • | Cash flow from operating activities was SEK 0.0(-0.7) b. | 9 | ||
SEK b. | Q2 2017 | Q2 2016 | YoY change | Q1 2017 | QoQ change | 6 months 2017 | 6 months 2016 | |||||||||||||||||||||
Net sales | 49.9 | 54.1 | -8 | % | 46.4 | 8 | % | 96.3 | 106.3 | |||||||||||||||||||
Net sales adjusted for items affecting comparability in Q1 2017 | 49.9 | 54.1 | -8 | % | 47.8 | 4 | % | 97.7 | 106.3 | |||||||||||||||||||
Sales growth adj. for comparable units and currency | — | — | -13 | % | — | 9 | % | -15 | % | -4 | % | |||||||||||||||||
Gross margin | 27.9 | % | 32.3 | % | — | 13.9 | % | — | 21.2 | % | 32.8 | % | ||||||||||||||||
Gross margin excluding restructuring charges and adjusted for items affecting comparability in Q1 2017 | 29.8 | % | 33.2 | % | — | 30.5 | % | — | 30.1 | % | 33.6 | % | ||||||||||||||||
Operating income | -1.2 | 2.8 | -145 | % | -12.3 | -90 | % | -13.6 | 6.2 | |||||||||||||||||||
Operating income excluding restructuring charges and adjusted for items affecting comparability in Q1 2017 | 0.3 | 3.8 | -93 | % | 1.1 | -74 | % | 1.4 | 7.9 | |||||||||||||||||||
Operating margin | -2.5 | % | 5.1 | % | — | -26.6 | % | — | -14.1 | % | 5.9 | % | ||||||||||||||||
Operating margin excluding restructuring charges and adjusted for items affecting comparability in Q1 2017 | 0.6 | % | 7.0 | % | — | 2.3 | % | — | 1.4 | % | 7.4 | % | ||||||||||||||||
Net income | -1.0 | 1.6 | -164 | % | -10.9 | -91 | % | -11.9 | 3.7 | |||||||||||||||||||
EPS diluted, SEK | -0.30 | 0.48 | -163 | % | -3.29 | -91 | % | -3.59 | 1.08 | |||||||||||||||||||
EPS(non-IFRS), SEK1) | 0.17 | 0.83 | -80 | % | -2.42 | -107 | % | -2.25 | 1.70 | |||||||||||||||||||
Cash flow from operating activities | 0.0 | -0.7 | -100 | % | -1.5 | -100 | % | -1.5 | -3.1 | |||||||||||||||||||
Net cash, end of period | 24.0 | 21.0 | 14 | % | 28.3 | -15 | % | 24.0 | 21.0 | |||||||||||||||||||
| 1) | EPS diluted, excl. amortizations and write-downs of acquired intangible assets, and excluding restructuring charges. |
Non-IFRS financial measures are reconciled to the most directly reconcilable line items in the financial statements at the end of this report.
1 Ericsson | Second Quarter Report 2017
Table of Contents
CEO COMMENTS
We are not satisfied with our underlying performance with continued declining sales and increasing losses in the quarter. Execution of our focused business strategy is gaining traction. However, in light of current market conditions, we are accelerating the planned actions to reduce costs.
Sales adjusted for comparable units and currency declined by-13%. Based on the development in the first half of the year, our current view of the Radio Access Network (RAN) equipment market outlook is in line with external estimates of a high single-digit percentage decline for the full year 2017.
Considering the current market environment, the company position, and the more focused business strategy, we continue to assess risk exposure in ongoing contracts. Depending on the outcome, we see an increased risk of further market and customer project adjustments, which would have a negative impact on results, estimated to SEK3-5 b. for the coming 12 months, of which 30% is estimated to impact cash.
Due to technology and portfolio shifts we will reduce the capitalization of product platform, software release development expenses and hardware costs. Together this is estimated to result in a net negative impact on operating income of SEK-2.9 (1.3) b. in the second half of 2017, with no impact on cash. This is to be compared with SEK-0.3 (1.2) b. of total impact on operating income in the quarter.
One key component in our focused business strategy is to reduce costs and increase efficiency. In light of the current market outlook, we will accelerate our actions to ensure that we can meet our target of doubling the 2016 operating margin beyond 2018. Actions will be taken primarily in service delivery and common costs and do not include R&D. Our plan is to implement cost savings with an annual run rate effect of at least SEK 10 b. bymid-2018, of which approximately half will be related to common costs.
The decline in the Networks result in the quarter was mainly caused by lower software sales, driven by two key factors; unusually strong software sales in the second quarter last year and cautious mobile broadband investment levels. On the positive side, we were ranked number one in radio by a leading global operator.
Performance improvements in Networks will be generated through both the continuedramp-up of Ericsson Radio System (ERS) and cost reductions, mainly in service delivery. The ERS continues to prove its competitiveness and now represents 49% of radio unit deliveries in the quarter. During the quarter, we announced a break-through contract to support Vodafone UK to evolve its 4G network and to provide 5G radio technology. To safeguard a future leading portfolio, we have started to increase R&D investments in Networks with a total increase of SEK 0.2 b. in the quarter. In line with our more focused strategy, we signed an agreement in the quarter to divest the power modules business.
The work to refocus our Managed Services business to improve profitability is well underway. So far, we have identified 42 contracts, with sales of SEK 7 b. in 2016, which we will either exit, renegotiate or transform. To date, we have either exited, renegotiated or transformed nine of these contracts resulting in an annualized profit improvement of approximately SEK 140 million going forward.
IT & Cloud had another challenging quarter with significant losses. The sequential increase in losses is largely explained by lower capitalization of R&D expenses. Gross margin continued to be negatively impacted by large digital transformation projects.
Our IT & Cloud business is of strategic importance as our customers are preparing for 5G and will digitalize their operations and invest in a future network architecture based on software-defined logic. A key driver of performance in the business is the success of our new product portfolio, for which the rolling 12 month sales have grown 7%.
We are taking firm actions to improve performance in IT & Cloud, including stabilizing product roadmaps, addressing underperforming customer projects, improving new project delivery scoping and reducing costs, primarily in service delivery.
The operating income in our Media business improved sequentially as a result of increased sales, improved business mix and reduced costs. We continue the work to explore strategic opportunities for the Media business.
In this report, we have included a table on page 4 to track progress in the execution of our focused business strategy.
In light of current market environment and company performance, we are accelerating actions to reduce costs. Our focused business strategy is designed to take us back to technology and market leadership and improve company performance, also in a tough market. We see initial signs of traction in strategy execution including increased investments in R&D in Networks and ramp up of deliveries of Ericsson Radio System, increasing our competitiveness in the market.
Börje Ekholm
President and CEO
2 Ericsson | Second Quarter Report 2017
Table of Contents
FINANCIAL HIGHLIGHTS
SEK b. | Q2 2017 | Q2 2016 | YoY change | Q1 2017 | QoQ change | 6 months 2017 | 6 months 2016 | |||||||||||||||||||||
Net sales | 49.9 | 54.1 | -8 | % | 46.4 | 8 | % | 96.3 | 106.3 | |||||||||||||||||||
Of which Networks | 36.8 | 40.2 | -8 | % | 34.9 | 6 | % | 71.7 | 80.2 | |||||||||||||||||||
Of which IT & Cloud | 10.9 | 11.5 | -5 | % | 9.5 | 14 | % | 20.4 | 21.3 | |||||||||||||||||||
Of which Other | 2.2 | 2.4 | -6 | % | 2.0 | 13 | % | 4.2 | 4.8 | |||||||||||||||||||
Gross income | 13.9 | 17.5 | -20 | % | 6.4 | 116 | % | 20.4 | 34.9 | |||||||||||||||||||
Gross margin (%) | 27.9 | % | 32.3 | % | — | 13.9 | % | — | 21.2 | % | 32.8 | % | ||||||||||||||||
Research and development expenses | -8.4 | -7.4 | 13 | % | -9.1 | -8 | % | -17.4 | -14.9 | |||||||||||||||||||
Selling and administrative expenses | -7.1 | -7.1 | -1 | % | -9.9 | -28 | % | -16.9 | -13.8 | |||||||||||||||||||
Other operating income and expenses | 0.2 | -0.2 | -204 | % | 0.1 | 70 | % | 0.4 | 0.0 | |||||||||||||||||||
Operating income | -1.2 | 2.8 | -145 | % | -12.3 | -90 | % | -13.6 | 6.2 | |||||||||||||||||||
Operating margin | -2.5 | % | 5.1 | % | — | -26.6 | % | — | -14.1 | % | 5.9 | % | ||||||||||||||||
for Networks | 7 | % | 12 | % | — | -2 | % | — | 3 | % | 13 | % | ||||||||||||||||
for IT & Cloud | -26 | % | -13 | % | — | -94 | % | — | -58 | % | -17 | % | ||||||||||||||||
for Other | -44 | % | -20 | % | — | -143 | % | — | -90 | % | -16 | % | ||||||||||||||||
Financial net | 0.1 | -0.5 | -112 | % | -0.4 | -114 | % | -0.4 | -1.0 | |||||||||||||||||||
Taxes | 0.2 | -0.7 | -126 | % | 1.9 | -91 | % | 2.1 | -1.6 | |||||||||||||||||||
Net income | -1.0 | 1.6 | -164 | % | -10.9 | -91 | % | -11.9 | 3.7 | |||||||||||||||||||
Restructuring charges | -1.5 | -1.0 | 48 | % | -1.7 | -13 | % | -3.3 | -1.7 | |||||||||||||||||||
PLANNING ASSUMPTIONS GOING FORWARD
Market related
| • | Based on the development in the first half of the year, the company’s current view of the Radio Access Network (RAN) equipment market outlook is in line with external estimates of a high single-digit percentage decline for the full year 2017. This is to be compared with the company’s previous estimate of-2% to-6%. |
Ericsson focused strategy related
| • | Addressinglow-performing operations in Managed Services and optimizing the offering in Network Rollout are expected to reduce full-year sales by up to SEK 10 b. by 2019. |
| • | The plan is to implement cost savings with an annual run rate effect of at least SEK 10 b. bymid-2018, split 50/50 between service delivery and common costs (G&A, IT, real estate etc). |
| • | The company aims to increase R&D efficiency. However, R&D expenses will increase short term, primarily in Networks. |
| • | Restructuring charges for 2017 are estimated to be in the higher end of the range SEK6-8 b. |
| • | The company sees an increased risk of further market and customer project adjustments, which would have a negative impact on results, estimated to SEK3-5 b. for the coming 12 months, of which 30% is estimated to impact cash. |
| • | Reduced capitalization of development expenses and hardware costs is expected to result in a net negative impact on operating income of SEK-2.9 (1.3) b. in second half 2017, with no impact on cash. |
Other Ericsson related
| • | The earlier communicated rescoped managed services contract in North America will impact sales negatively YoY in Q3 2017. |
| • | Industry trends and business mix in mobile broadband in 2016 are expected to prevail in 2017. |
Q1 items affecting comparability:
Net sales: Provisions and adjustments (SEK 1.4 b.)
Gross income: Restructuring charges (SEK 1.5 b.), and provisions and adjustments (SEK 6.7 b.)
Operating income: Restructuring charges (SEK 1.7 b.), asset write-downs (SEK 3.3 b.) and provisions and adjustments (SEK 8.4 b.)
Net sales
Sales as reported decreased by-8% YoY. The mobile broadband market remained weak in the quarter. Networks sales, adjusted for comparable units and currency, declined by-14% YoY, driven mainly by lower sales in market areas Europe & Latin America and Middle East & Africa.
Sales in North America declined YoY mainly due to the earlier communicated rescoped managed services contract effective as from Q4 2016. Sales in North East Asia declined slightly YoY. Sales in Mainland China were negatively impacted by lower Networks sales, partly offset by increased IT & Cloud sales.
Networks sales in Japan and South Korea increased. Sales in market area South East Asia, Oceania and India were stable YoY with growth in Vietnam and Australia while investments in India continued to decline.
As anticipated, sequential sales growth was below normal seasonality, following continued low investments in mobile broadband. Sales increased by 8% QoQ. Sales in Q2 compared with Q1 sales, adjusted for items affecting comparability, increased 4%.
Total sales of Managed Services, as defined in 2016, including Broadcast Services, were SEK 6.3 (7.3) b. The decline mainly refers to the earlier communicated rescoped managed services contract in North America. The definition of Managed Services will be adjusted in 2018, at the latest, to mirror the new organization.
3 Ericsson | Second Quarter Report 2017
Table of Contents
IPR licensing revenues
IPR licensing revenues declined YoY to SEK 2.0 (2.2) b. IPR licensing revenues were flat QoQ.
Gross margin
Gross margin declined to 27.9% (32.3%). Gross margin, excluding restructuring charges, declined to 29.8% (33.2%) with lower gross margin in all segments.
Gross margin increased sequentially to 27.9% from 13.9%. Gross margin adjusted for items affecting comparability in Q1 and excluding restructuring charges in Q2 declined slightly to 29.8% from 30.5%, mainly due to lower gross margin in Networks.
Operating expenses
Operating expenses increased to SEK 15.4 (14.5) b. Operating expenses, excluding restructuring charges, increased to SEK 14.8 (14.0) b. due to increased R&D expenses. R&D expenses, excluding restructuring charges, were SEK 8.0 (7.0) b. mainly due to less capitalized development expenses with a net impact of SEK-0.4 (0.7) b. Selling and administrative expenses, excluding restructuring charges, declined to SEK 6.8 (7.0) b. YoY, despite a negative currency effect.
Operating expenses declined sequentially to SEK 15.4 b. from SEK 18.9 b. Operating expenses, excluding restructuring charges and items affecting comparability in Q1 increased to SEK 14.8 b. from SEK 13.7 b., mainly due to seasonality and lower capitalization of development expenses.
The net effect on operating expenses of capitalized development expenses and related amortizations was SEK 0.2 b. in Q1 and SEK-0.4 b. in Q2.
Other operating income and expenses
Other operating income and expenses improved both YoY and QoQ. Several minor items contributed to the SEK 0.2 b. of other operating income and expenses in Q2 2017. The revaluation and realization effects of currency hedge contracts, impacting other operating income and expenses, were SEK 0.0(-0.5) b.
As of Q1 2017, the funding of foreign exchange forecast hedging is managed through foreign exchange loans (USD) instead of foreign exchange derivatives. Therefore, as of Q1 2017, revaluation and realization effects of SEK 0.3 b. are included in financial expenses instead of in other operating income and expenses.
Restructuring charges
Restructuring charges were SEK-1.5(-1.0) b. Restructuring charges were SEK-1.7 b. in Q1 2017. For full-year 2017, the restructuring charges are estimated to be in the higher end of the range SEK6-8 b.
Operating income
Operating income decreased to SEK-1.2 (2.8) b. Operating income, excluding restructuring charges, declined to SEK 0.3
(3.8) b. due to lower gross margin, lower sales and increased operating expenses.
Operating income improved sequentially from SEK-12.3 b. Operating income, excluding restructuring charges and items affecting comparability in Q1 2017, decreased to SEK 0.3 b. from SEK 1.1 b. due to increased operating expenses.
Changes in treatment of cost going forward
Due to technology and portfolio shifts the company will reduce the capitalization of product platform, software release development expenses and hardware costs. This is estimated to result in a net negative impact on operating income of SEK-2.9 b. in the second half of 2017, with no impact on cash. The total impact on operating income in the quarter amounted to SEK-0.3 (1.2) b.
Financial net
Financial net improved both YoY and QoQ, mainly due to positive revaluation and realization effects of currency hedge contracts of SEK 0.3 b., and positive currency revaluation effects of SEK 0.2 b. The SEK strengthened against the USD between March 31, 2017 (SEK/USD rate 8.93) and June 30, 2017 (SEK/ USD rate 8.46). The hedge balance is in USD.
Taxes
Taxes were positive in the quarter following the negative income.
Net income and EPS
Net income and EPS diluted decreased YoY following the reduced operating income. EPS diluted was SEK-0.30 (0.48) and EPS(non-IFRS) was SEK 0.17 (0.83). Net income and EPS diluted improved QoQ following the improved operating income.
Employees
The number of employees on June 30, 2017 was 109,127 - a reduction of more than 7,000 employees in 12 months.
Focused strategy execution
The company has so far identified three indicators to measure the progress of strategy execution. KPIs for cost reduction will be added later.
Area | Activity | Status Q2 2017 | ||
| Networks | Transition to new Ericsson Radio System | 49% (ERS radio unit deliveries out of total) | ||
| IT & Cloud | Growth in sales of new product portfolio | Net sales growth of 7%, rolling 12 months | ||
| Managed Services | Addressinglow-performing contracts | Out of 42 contracts identified, 9 have been renegotiated to result in an annualized future profit improvement of SEK 0.1 b. | ||
In addition, the company announced in the quarter that it has signed an agreement to divest its power modules business.
4 Ericsson | Second Quarter Report 2017
Table of Contents
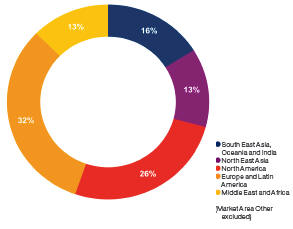
MARKET AREA SALES
| Second quarter 2017 | Change | |||||||||||||||||||||||
SEK b. | Networks | IT & Cloud | Other | Total | YoY | QoQ | ||||||||||||||||||
South East Asia, Oceania and India | 6.3 | 1.3 | 0.1 | 7.7 | 0 | % | -3 | % | ||||||||||||||||
North East Asia | 4.1 | 1.7 | 0.0 | 5.9 | -3 | % | 5 | % | ||||||||||||||||
North America | 10.0 | 2.1 | 0.5 | 12.5 | -7 | % | 5 | % | ||||||||||||||||
Europe and Latin America | 10.5 | 3.9 | 0.9 | 15.2 | -11 | % | 20 | % | ||||||||||||||||
Middle East and Africa | 4.2 | 1.8 | 0.1 | 6.0 | -17 | % | 11 | % | ||||||||||||||||
Other1) | 1.8 | 0.2 | 0.7 | 2.7 | 0 | % | -8 | % | ||||||||||||||||
|
|
|
|
|
|
|
|
|
|
|
| |||||||||||||
Total | 36.8 | 10.9 | 2.2 | 49.9 | -8 | % | 8 | % | ||||||||||||||||
|
|
|
|
|
|
|
|
|
|
|
| |||||||||||||
| 1) | Market Area “Other” includes licensing revenues, power modules, mobile broadband modules,Ericsson-LG Enterprise and other businesses. |
South East Asia, Oceania and India
Sales were stable YoY. A negative impact from reduced Networks services sales was offset by mobile broadband growth in Vietnam and increased IT & Cloud sales, driven by the delivery of a core network project in Australia. Sales in India were still impacted by consolidations and tariff competition between operators.
North East Asia
Sales declined slightly YoY. Sales in Mainland China declined due to continued reduced investments by one customer, partly offset by increased IT & Cloud sales. Networks sales in Japan and South Korea increased.
North America
North America sales declined YoY, mainly due to the earlier communicated rescoped managed services contract. IT & Cloud sales declined due to fewer project milestones in the quarter. Mobile broadband infrastructure sales remained at a stable level. All major operators’ 5G trials are ongoing with good momentum.
Europe and Latin America
Sales declined YoY, reflecting capex constraints in Europe where 4G modernizations are largely completed. In addition, sales declined in Mexico and South America. The decline was partially offset by increased mobile broadband investments in Brazil and timing of deployments in Russia. In the quarter, a break-through contract was announced to support Vodafone UK to evolve its 4G network and to provide 5G radio technology.
Middle East and Africa
Sales declined YoY with some, still limited, signs of recovery in the macroeconomic environment. Challenges in capacity business continued, accompanied by decline in services domains.
Other
IPR licensing revenues amounted to SEK 2.0 (2.2) b.
5 Ericsson | Second Quarter Report 2017
Table of Contents
SEGMENT RESULTS
NETWORKS
| Q2 | Q2 | YoY | Q1 | QoQ | 6 months | 6 months | ||||||||||||||||||||||
SEK b. | 2017 | 2016 | change | 2017 | change | 2017 | 2016 | |||||||||||||||||||||
Net sales | 36.8 | 40.2 | -8 | % | 34.9 | 6 | % | 71.7 | 80.2 | |||||||||||||||||||
Of which products | 20.8 | 23.0 | -10 | % | 19.4 | 7 | % | 40.2 | 45.8 | |||||||||||||||||||
Of which IPR licensing revenues | 1.6 | 1.7 | -9 | % | 1.6 | -3 | % | 3.2 | 4.8 | |||||||||||||||||||
Of which services | 16.1 | 17.2 | -7 | % | 15.5 | 4 | % | 31.5 | 34.3 | |||||||||||||||||||
Net sales adjusted for items affecting comparability in Q1 2017 | 36.8 | 40.2 | -8 | % | 36.2 | 2 | % | 73.0 | 80.2 | |||||||||||||||||||
Sales growth adj. for comparable units and currency | — | — | -14 | % | — | 7 | % | -16 | % | — | ||||||||||||||||||
Gross income | 10.4 | 12.5 | -17 | % | 8.0 | 30 | % | 18.3 | 25.5 | |||||||||||||||||||
Gross income excluding restructuring charges and adj. for items affecting comparability in Q1 2017 | 11.0 | 12.9 | -15 | % | 11.3 | -3 | % | 22.2 | 26.1 | |||||||||||||||||||
Gross margin | 28 | % | 31 | % | — | 23 | % | — | 26 | % | 32 | % | ||||||||||||||||
Gross margin excluding restructuring charges and adj. for items affecting comparability in Q1 2017 | 30 | % | 32 | % | — | 31 | % | — | 30 | % | 33 | % | ||||||||||||||||
Operating income | 2.6 | 4.8 | -46 | % | -0.5 | — | 2.1 | 10.6 | ||||||||||||||||||||
Operating income excluding restructuring charges and adj. for items affecting comparability in Q1 2017 | 3.5 | 5.3 | -33 | % | 4.3 | -19 | % | 7.9 | 11.5 | |||||||||||||||||||
Operating margin | 7 | % | 12 | % | — | -2 | % | — | 3 | % | 13 | % | ||||||||||||||||
Operating margin excluding restructuring charges and adj. for items affecting comparability in Q1 2017 | 10 | % | 13 | % | — | 12 | % | — | 11 | % | 14 | % | ||||||||||||||||
EBITA margin | 7 | % | 12 | % | — | -1 | % | — | 3 | % | 14 | % | ||||||||||||||||
Restructuring charges | -0.9 | -0.5 | 97 | % | -1.4 | — | -2.4 | -0.9 | ||||||||||||||||||||
Q1 items affecting comparability:
Net sales: Provisions and adjustments (SEK 1.3 b.)
Gross income: Restructuring charges (SEK 1.3 b.), and provisions and adjustments (SEK 2.0 b.)
Operating income: Restructuring charges (SEK 1.4 b.), assetwrite-downs (SEK 0.1 b.) and provisions and adjustments (SEK 3.3 b.)
Net sales
Sales as reported declined by-8% YoY. Sales adjusted for comparable units and currency decreased by-14% YoY. Investments in mobile broadband in certain markets remained low, impacting mainly product sales. The decline in network services sales YoY is due to lower managed services sales following the earlier communicated rescoped contract in North America.
The mobile broadband market remained weak in the second quarter. The sales decline YoY is primarily driven by market areas Europe and Latin America as well as Middle East and Africa.
Reported sales increased by 6% QoQ. Sales in Q2 compared with Q1 sales, adjusted for items affecting comparability, increased 2%. Sales in market areas North East Asia and South East Asia, Oceania and India declined QoQ with lower sales in Japan and Vietnam – two markets that reported strong sales in Q1 2017.
The Ericsson Radio System (ERS) continued to generate new business. The transition to the new ERS is tracking towards the target of accounting for 100% of total deliveries in 2018, with 49% YTD.
Gross margin
Gross margin declined YoY to 28% (31%) due to lower software sales with slightly lower IPR licensing revenues, increased restructuring charges and lower services margins. Improved hardware margins partly offset the decline. The lower services margins refer to a few managed services contracts with increased losses. These contracts are on the list of contracts that will be either exited, renegotiated, or transformed in order to improve the gross income. Gross margin, excluding restructuring charges, was 30% (32%).
Gross margin increased sequentially to 28% from 23% following provisions, adjustments and large restructuring charges made in Q1. Gross margin, adjusted for items affecting comparability in Q1 and excluding restructuring charges in Q2 declined to 30% from 31%. This was mainly due to lower software sales, partly offset by an improved hardware margin.
Operating income and margin
Operating income and margin decreased YoY, mainly due to lower sales, lower gross margin, increased restructuring charges and increased operating expenses. Improved other operating income and expenses had a positive impact on operating income. The YoY increase in operating expenses refers to increased R&D, mainly related to the already communicated focused business strategy. Selling and administrative expenses were flat YoY. Operating margin excluding restructuring charges was 10% (13%).
Operating income and margin increased sequentially. Operating margin, adjusted for items affecting comparability in Q1, and excluding restructuring charges in Q2, declined to 10% from 12%. The decline is due to seasonally higher operating expenses and lower gross margin. The decline was only partly offset by increased sales.
6 Ericsson | Second Quarter Report 2017
Table of Contents
IT & CLOUD
| Q2 | Q2 | YoY | Q1 | QoQ | 6 months | 6 months | ||||||||||||||||||||||
SEK b. | 2017 | 2016 | change | 2017 | change | 2017 | 2016 | |||||||||||||||||||||
Net sales | 10.9 | 11.5 | -5 | % | 9.5 | 14 | % | 20.4 | 21.3 | |||||||||||||||||||
Of which products | 5.1 | 5.3 | -4 | % | 4.1 | 23 | % | 9.2 | 10.1 | |||||||||||||||||||
Of which IPR licensing revenues | 0.2 | 0.2 | -10 | % | 0.2 | -3 | % | 0.4 | 0.6 | |||||||||||||||||||
Of which services | 5.8 | 6.2 | -6 | % | 5.4 | 7 | % | 11.3 | 11.3 | |||||||||||||||||||
Net sales adjusted for items affecting comparability in Q1 2017 | 10.9 | 11.5 | -5 | % | 9.6 | 13 | % | 20.5 | 21.3 | |||||||||||||||||||
Sales growth adj. for comparable units and currency | — | — | -10 | % | — | 16 | % | -8 | % | — | ||||||||||||||||||
Gross income | 2.8 | 4.1 | -30 | % | -2.1 | — | 0.7 | 7.3 | ||||||||||||||||||||
Gross income excluding restructuring charges and adj. for items affecting comparability in Q1 2017 | 3.1 | 4.2 | -26 | % | 2.7 | 13 | % | 5.8 | 7.5 | |||||||||||||||||||
Gross margin | 26 | % | 35 | % | — | -22 | % | — | 4 | % | 34 | % | ||||||||||||||||
Gross margin excluding restructuring charges and adj. for items affecting comparability in Q1 2017 | 28 | % | 36 | % | — | 28 | % | — | 28 | % | 35 | % | ||||||||||||||||
Operating income | -2.9 | -1.5 | 86 | % | -9.0 | -68 | % | -11.9 | -3.5 | |||||||||||||||||||
Operating income excluding restructuring charges and adj. for items affecting comparability in Q1 2017 | -2.4 | -1.1 | 126 | % | -2.2 | 8 | % | -4.7 | -2.9 | |||||||||||||||||||
Operating margin | -26 | % | -13 | % | — | -94 | % | — | -58 | % | -17 | % | ||||||||||||||||
Operating margin excluding restructuring charges and adj. for items affecting comparability in Q1 2017 | -22 | % | -9 | % | — | -23 | % | — | -23 | % | -13 | % | ||||||||||||||||
EBITA margin | -24 | % | -11 | % | — | -86 | % | — | -53 | % | -14 | % | ||||||||||||||||
Restructuring charges | -0.5 | -0.5 | — | -0.2 | — | -0.7 | -0.7 | |||||||||||||||||||||
Q1 items affecting comparability:
Net sales: Provisions and adjustments (SEK 0.1 b.)
Gross income: Restructuring charges (SEK 0.2 b.), and provisions and adjustments (SEK 4.5 b.)
Operating income: Restructuring charges (SEK 0.2 b.), assetwrite-downs (SEK 1.5 b.) and provisions and adjustments (SEK 5.0 b.)
Net sales
Sales as reported declined by-5% YoY. Sales adjusted for comparable units and currency decreased by-10% YoY. Sales of legacy portfolio products, primarily in OSS & BSS, continued to decline and were not offset by growth in the new portfolio. Services sales declined following lower activity in large transformation projects.
Sales increased by 14% QoQ after a seasonally weak Q1. Sales in North East Asia grew 90% QoQ, driven by software licensing sales for telecom core in Mainland China. It is not unusual that such sales vary between quarters.
Gross margin
Gross margin decreased YoY primarily due to lower services and hardware margins. The services margin continues to be negatively impacted by ongoing large transformation projects and by IT managed services projects being in their initial transformation phase.
Gross income and margin increased QoQ. Q1 2017 included SEK-4.8 b. in restructuring charges, provisions and adjustments related to certain customer projects. Gross margin, excluding these items and excluding restructuring charges in Q1 and Q2, was stable QoQ.
Operating income and margin
Operating income decreased YoY mainly due to a lower gross margin. In addition, less capitalization and increased amortization of R&D platform development impacted operating expenses negatively. In Q2 2017, the net amount of capitalized and amortized R&D was SEK-0.2 b, compared with SEK 0.6 b. in Q2 2016 and SEK 0.3 b. in Q1 2017.
Operating income improved QoQ. Q1 2017 included SEK-6.8 b. in restructuring charges, write-down of assets as well as provisions and adjustments related to certain customer projects. Excluding these items, operating income declined to SEK-2.4 b. from SEK-2.2 b. The positive impact from increased sales was more than offset by the negative net effect of capitalized and amortized R&D.
7 Ericsson | Second Quarter Report 2017
Table of Contents
OTHER
| Q2 | Q2 | YoY | Q1 | QoQ | 6 months | 6 months | ||||||||||||||||||||||
SEK b. | 2017 | 2016 | change | 2017 | change | 2017 | 2016 | |||||||||||||||||||||
Net sales | 2.2 | 2.4 | -6 | % | 2.0 | 13 | % | 4.2 | 4.8 | |||||||||||||||||||
Of which IPR licensing revenues | 0.2 | 0.2 | -10 | % | 0.2 | -3 | % | 0.4 | 0.6 | |||||||||||||||||||
Sales growth adj. for comparable units and currency | — | — | -11 | % | — | 13 | % | -17 | % | — | ||||||||||||||||||
Gross income | 0.7 | 0.9 | -18 | % | 0.6 | 34 | % | 1.3 | 2.0 | |||||||||||||||||||
Gross income excluding restructuring charges and adj. for items affecting comparability in Q1 2017 | 0.8 | 0.9 | -12 | % | 0.6 | 33 | % | 1.4 | 2.0 | |||||||||||||||||||
Gross margin | 34 | % | 39 | % | — | 28 | % | — | 31 | % | 42 | % | ||||||||||||||||
Gross margin excluding restructuring charges and adj. for items affecting comparability in Q1 2017 | 37 | % | 39 | % | — | 31 | % | — | 34 | % | 42 | % | ||||||||||||||||
Operating income | -1.0 | -0.5 | 101 | % | -2.8 | -66 | % | -3.8 | -0.8 | |||||||||||||||||||
Operating income excluding restructuring charges and adj for items affecting comparability in Q1 2017 | -0.8 | -0.4 | 105 | % | -1.0 | -16 | % | -1.8 | -0.7 | |||||||||||||||||||
Operating margin | -44 | % | -20 | % | — | -143 | % | — | -90 | % | -16 | % | ||||||||||||||||
Operating margin excluding restructuring charges and adj. for items affecting comparability in Q1 2017 | -38 | % | -17 | % | — | -51 | % | — | -44 | % | -15 | % | ||||||||||||||||
EBITA margin | -38 | % | -12 | % | — | -95 | % | — | -65 | % | -8 | % | ||||||||||||||||
Restructuring charges | -0.1 | -0.1 | — | -0.1 | — | -0.2 | -0.1 | |||||||||||||||||||||
The former Media segment is renamed to “Other” in the external reporting as per Q2 2017.
Q1 items affecting comparability:
Gross income: Restructuring charges (SEK 0.0 b.)
Operating income: Restructuring charges (SEK 0.1 b.) and asset write-downs (SEK 1.7 b.)
Net sales
Sales as reported declined-6% YoY. Sales adjusted for comparable units and currency decreased by-11% YoY. The decline was primarily due to lower sales of legacy products. Sales of next-generation MediaFirst platform started in the quarter, as the product went live in commercial networks. The iconectiv business (number portability solutions) continued to show double-digit growth YoY.
Sales as reported increased by 13% QoQ, driven by growth in Media Solutions following a seasonally weak Q1.
Gross margin
Gross margin declined YoY partly due to increased restructuring charges. Gross margin excluding restructuring charges declined slightly YoY.
Gross margin increased QoQ, driven by a changed sales mix with a larger share of Media Solutions. In addition, efficiency improvements in service delivery contributed to improved gross margins QoQ.
Operating income and margin
Operating income decreased YoY partly due to lower sales and lower gross margin. In addition, lower capitalization and increased amortization of R&D platform development impacted operating expenses negatively. In Q2 2017, the net amount of capitalized and amortized R&D was SEK-0.1 0.1) b.
Operating income improved QoQ. Operating income in Q1 2017 included SEK-1.7 b. in additional asset write-downs related to the new focused business strategy announced March 28.
8 Ericsson | Second Quarter Report 2017
Table of Contents
CASH FLOW
| Q2 | Q2 | Q1 | ||||||||||
SEK b. | 2017 | 2016 | 2017 | |||||||||
Net income reconciled to cash | -0.8 | 1.3 | -9.2 | |||||||||
Changes in operating net assets | 0.8 | -2.0 | 7.7 | |||||||||
Cash flow from operating activities | 0.0 | -0.7 | -1.5 | |||||||||
Cash flow from investing activities | -2.0 | 1.4 | -13.6 | |||||||||
Cash flow from financing activities | -8.9 | -9.3 | 10.9 | |||||||||
Net change in cash and cash equivalents | -11.5 | -7.0 | -4.0 | |||||||||
Cash conversion (%) | 0 | % | -54 | % | n/a | |||||||
Operating activities
Cash flow from operating activities was SEK 0.0 b. in the quarter. A negative net income reconciled to cash was fully offset by a positive effect from changes in operating net assets. Cash flow from inventory was negative at SEK-1.1 b. in the quarter while customer finance decreased resulting in a cash flow effect of SEK 1.1 b. Trade receivables decreased resulting in a cash flow effect of SEK 0.5 b.
Cash outlays related to restructuring charges were SEK-1.1(-0.6) b. in the quarter.
Investing activities
Cash flow from investing activities was negative at SEK-2.0 b. Investments in property, plant and equipment continued to decline YoY as investments in the Global ICT centers decreased. The cash flow effect from capitalized development expenses was significantly reduced and amounted to SEK-0.3 b. in the quarter.
Financing activities
Cash flow from financing activities was negatively impacted by repayment of one Euro bond of SEK 5.1 b. (EUR 0.5 b.) at maturity date. In addition, dividends of SEK 3.3 (12.1) b. were paid out.
Net cash was SEK 24.0 b. at the end of the quarter.
| Jan-Jun | Jan-Mar | Jan-Dec | Jan-Sep | Jan-Jun | ||||||||||||||||
Working capital KPIs, number of days | 2017 | 2017 | 2016 | 2016 | 2016 | |||||||||||||||
Sales outstanding (target: <90) | 114 | 117 | 95 | 122 | 115 | |||||||||||||||
Inventory (target: <65) | 78 | 73 | 69 | 79 | 81 | |||||||||||||||
Payable (target: >60) | 60 | 58 | 56 | 56 | 59 | |||||||||||||||
9 Ericsson | Second Quarter Report 2017
Table of Contents
FINANCIAL POSITION
SEK b. | Jun 30 2017 | Jun 30 2016 | Mar 31 2017 | |||||||||
+ Cash and cash equivalents | 21.4 | 28.9 | 33.0 | |||||||||
+ Interest-bearing securities, current | 10.8 | 19.8 | 13.5 | |||||||||
+ Interest-bearing securities,non-current | 22.1 | — | 19.1 | |||||||||
|
|
|
|
|
| |||||||
Gross cash | 54.3 | 48.8 | 65.6 | |||||||||
– Borrowings, current | 3.2 | 9.7 | 9.5 | |||||||||
– Borrowings,non-current | 27.1 | 18.2 | 27.8 | |||||||||
|
|
|
|
|
| |||||||
Net cash | 24.0 | 21.0 | 28.3 | |||||||||
Equity | 123.8 | 136.7 | 126.8 | |||||||||
Total assets | 274.9 | 277.4 | 292.2 | |||||||||
Capital turnover (times) | 1.0 | 1.1 | 1.0 | |||||||||
Return on capital employed (%) | -14.8 | % | 6.5 | % | -26.2 | % | ||||||
Equity ratio (%) | 45.0 | % | 49.3 | % | 43.4 | % | ||||||
Return on equity (%) | -18.1 | % | 5.0 | % | -32.8 | % | ||||||
Net cash decreased by SEK-4.3 b. in the quarter, mainly as a result of payment of dividends and investments in property, plant and equipment. The net cash position was SEK 24.0 b.
Post-employment benefits were SEK 23.6 b., compared with SEK 23.8 b. on March 31, 2017.
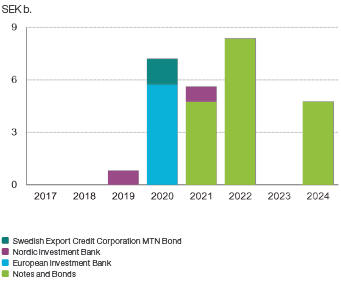
The average maturity of long-term borrowings as of June 30, 2017, was 4.5 years, the same as 12 months earlier.
Debt maturity profile, Parent Company
10 Ericsson | Second Quarter Report 2017
Table of Contents
PARENT COMPANY
Income after financial items was SEK 2.3 (13.2) b. The decrease was mainly due to lower recognized dividends from subsidiaries.
At the end of the quarter, gross cash: cash, cash equivalents, short-term investments and interest-bearing securitiesnon- current, amounted to SEK 41.1 b., compared with SEK 42.9 b. at the end of 2016.
In the quarter, a dividend of SEK 3.3 b. was paid out in the first week of April after decision by the Annual General Meeting on March 29.
In June, the Parent Company repaid bonds of EUR 500 million at maturity date. There has been an increase in intercompany lending of SEK 5.4 b. and intercompany borrowing of SEK 0.3 b. in the second quarter.
In accordance with the conditions of the long-term variable compensation program (LTV) for Ericsson employees, 3,193,142 shares from treasury stock were sold or distributed to employees during the second quarter. The holding of treasury stock on June 30, 2017, was 58,148,194 Class B shares.
11 Ericsson | Second Quarter Report 2017
Table of Contents
OTHER INFORMATION
Ericsson’s Nomination Committee appointed
On May 9, 2017, Ericsson announced that the Nomination Committee for the Annual General Meeting (AGM) 2018 had been appointed in accordance with the instruction for the Nomination Committee, resolved by the Annual General Meeting 2012. The Nomination Committee consists of: Petra Hedengran, Investor AB; Johan Held, Afa Försäkring, Leif Johansson, the Chairman of the Board of Directors, Bengt Kjell, AB Industrivärden and Handelsbankens Pensionsstiftelse; and Anders Oscarsson, AMF Försäkring och Fonder. Petra Hedengran is the Chairman of the Nomination Committee.
Ericsson announced change in Executive Team
On May 11, 2017, Ericsson announced that Rima Qureshi had decided to leave Ericsson to pursue another opportunity in the industry. She would leave her role as Senior Vice President and Head of Market Area North America effective May 11, 2017. Niklas Heuveldop has been appointed acting Head of Market Area North America, effective May 11, 2017.
Erik Ekudden named Group CTO for Ericsson
On May 30, 2017, Ericsson announced that Erik Ekudden has been appointed as Group CTO and Head of Technology & Architecture, effective July 1, 2017. Ekudden will lead the company’s technology strategy with a focus on driving the evolution of the network as the platform to secure the success of Ericsson’s service provider customers.
Increase in total number of shares and votes in Telefon-aktiebolaget LM Ericsson
On May 31, 2017, Ericsson announced that the company’s share capital amounts to SEK 16,670,758,678 and the total number of shares is 3,334,151,735; of which 261,755,983 are Class A shares and 3,072,395,752 are Class B shares. The total number of votes is 568,995,558.2, of which Class A shares represent 261,755,983 votes and Class B shares represent 307,239,575.2 votes.
The increase in the number of shares and votes is a result of the company’s recent issue of 3,000,000 Class C shares, shares which have subsequently been repurchased by the company and converted into Class B shares, by virtue of a conversion clause in the articles of association. This is in accordance with the resolution by the Annual General Meeting 2017 to expand the treasury stock as part of the financing of Ericsson’s Long-Term Variable Compensation Program (LTV) 2017. The company held 58,382,336 shares as treasury stock on May 31.
Changes to Ericsson’s Nomination Committee
On June 1, 2017, Ericsson announced that Cevian Funds will be part of the Nomination Committee. The Nomination Committee now consists of: Petra Hedengran, Investor AB (Chairman); Bengt Kjell, AB Industrivärden and Handelsbankens Pensionss-tiftelse; Christer Gardell, Cevian Funds; Anders Oscarsson, AMF Försäkring och Fonder; Johan Held, Afa Försäkring; and Leif Johansson, the Chairman of the Board of Directors.
Patent infringement lawsuit
In 2012 and 2013, Intellectual Ventures (“IV”) filed patent infringement lawsuits in the United States District Court for the District of Delaware accusing a number of Ericsson’s U.S. customers of infringing 16 U.S. patents, seeking an injunction and monetary damages. The first of these cases is set to go to trial in January 2018. IV subsequently filed another wave of lawsuits in the District of Delaware accusing a number of Ericsson’s U.S. customers of infringing 12 U.S. patents, seeking monetary damages. The first of these cases, scheduled to go to trial in July 2017, has been cancelled.
Ericsson to divest its power modules business to Flex
On June 21, 2017, Ericsson announced that it has signed an agreement with multinational technology andSketch-to-Scale™ solutions provider, Flex, to divest Ericsson Power Modules (EPM). The divestment is in line with Ericsson’s focused business strategy, presented on March 28, to strengthen its core business and portfolio areas (networks, digital services and IoT). The Ericsson Power Modules business, excluding the brand, will on closing be transferred to Flex as part of the agreement. This includes Shanghai Ericsson Electronics Corporation Ltd, a manufacturing site in China, and business assets in Sweden. More than 300 employees and consultants are expected to transfer from Ericsson to Flex Power.
POST-CLOSING EVENTS
The Chairman Leif Johansson informed that he will not make himself available for reelection
On July 5, 2017, Ericsson announced that the Chairman of the Board of Directors, Leif Johansson, has informed that he will not make himself available for reelection at the Annual General Meeting of shareholders in 2018. The Nomination Committee has initiated the search for a replacement.
Changes to Ericsson’s Nomination Committee
On July 14, 2017, Ericsson announced that Johan Forssell, Investor AB, will replace Petra Hedengran, Investor AB, as chairman of Ericssons Nomination Committee.
12 Ericsson | Second Quarter Report 2017
Table of Contents
RISK FACTORS
Ericsson’s operational and financial risk factors and uncertainties are described in our Annual Report 2016.
Risk factors and uncertainties in focus short term for the Parent Company and the Ericsson Group include, but are not limited to:
| • | Potential negative effects on operators’ willingness to invest in network development due to uncertainty in the financial markets and a weak economic business environment, or reduced consumer telecom spending, or increased pressure on us to provide financing, or delayed auctions of spectrums; |
| • | Uncertainty regarding the financial stability of suppliers, for example due to lack of financing; |
| • | Effects on gross margins and/or working capital of the business mix in the Networks segment between capacity sales and new coverage build-outs; |
| • | Effects on gross margins of the business mix in the Networks and IT & Cloud segments including new network build-outs and new managed services or digital transformation deals with initial transition costs; |
| • | Effects of the ongoing industry consolidation among our customers as well as between our largest competitors, e.g. with postponed investments and intensified price competition as a consequence; |
| • | New and ongoing partnerships which may not be successful and expose us to future costs; |
| • | Changes in foreign exchange rates, in particular USD; |
| • | Political unrest and uncertainty in certain markets; |
| • | Effects on production and sales from restrictions with respect to timely and adequate supply of materials, components and production capacity and other vital services on competitive terms; |
| • | No guarantees that strategy execution, specific restructuring or cost-savings initiatives, profitability restoring efforts and/or organizational changes will be sufficient, successful or executed in time to deliver any improvements in earnings; |
| • | Cybersecurity incidents, which may have a material negative impact. |
Ericsson stringently monitors the compliance with all relevant trade regulations and trade embargos applicable to dealings with customers operating in countries where there are trade restrictions or trade restrictions are discussed. Ericsson operates globally in accordance with Group policies and directives for business ethics and conduct and has a dedicated anti-corruption program. However, in some of the countries where the company operates, corruption risks can be high and compliance failure could have a material adverse impact on our business, financial condition and brand.
This report has not been reviewed by Telefonaktiebolaget LM Ericsson’s auditors.
Date for next report: October 20, 2017
13 Ericsson | Second Quarter Report 2017
Table of Contents
BOARD ASSURANCE
The Board of Directors and the CEO certify that the financial report for the six months gives a fair view of the performance of the business, position and profit or loss of the Company and the Group, and describes the principal risks and uncertainties that the Company and the companies in the Group face.
Stockholm, July 18, 2017
Telefonaktiebolaget LM Ericsson (publ)
Org. Nr. 556016-0680
Helena Stjernholm | Leif Johansson | Jacob Wallenberg | ||
Deputy Chairman | Chairman | Deputy Chairman | ||
Jon Fredrik Baksaas | Jan Carlson | Nora Denzel | ||
Member of the Board | Member of the Board | Member of the Board | ||
Eric A. Elzvik | Kristin Skogen Lund | |
Member of the Board | Member of the Board | |
Kristin S. Rinne | Sukhinder Singh Cassidy | |
Member of the Board | Member of the Board | |
Börje Ekholm |
President, CEO and member of the Board |
Kjell-Åke Soting | Roger Svensson | Karin Åberg | ||
Member of the Board | Member of the Board | Member of the Board |
14 Ericsson | Second Quarter Report 2017
Table of Contents
EDITOR’S NOTE
Ericsson invites media, investors and analysts to conference calls on July 18, 2017; one starting at 09.00 (CET) and the other at 14.00 (CET).
Live audio webcasts of the conference calls as well as supporting slides will be available at:
www. ericsson.com/press and
www. ericsson.com/investors
Replay of the conference calls will be available approximately one hour after each call has ended and will remain available for seven days.
For further information, please contact:
Helena Norrman, Senior Vice President, Chief Marketing and Communications Officer
Phone: +46 10 719 34 72
E-mail: investor.relations@ericsson.com or media.relations@ericsson.com
Telefonaktiebolaget LM Ericsson
Org. number: 556016-0680
Torshamnsgatan 21
SE-164 83 Stockholm
Phone: +46 10 719 00 00
www.ericsson.com
| Investors | ||
| Peter Nyquist, Vice President, | ||
| Head of Investor Relations | ||
| Phone: | +46 10 714 64 49, +46 70 575 29 06 | |
| E-mail: | peter.nyquist@ericsson.com | |
| Stefan Jelvin, Director, | ||
| Investor Relations | ||
| Phone: | +46 10 714 20 39, +46 70 986 02 27 | |
| E-mail: | stefan.jelvin@ericsson.com | |
| Åsa Konnbjer, Director, | ||
| Investor Relations | ||
| Phone: | +46 10 713 39 28, +46 73 082 59 28 | |
| E-mail: | asa.konnbjer@ericsson.com | |
| Rikard Tunedal, Director, | ||
| Investor Relations | ||
| Phone: | +46 10 714 54 00, +46 761 005 400 | |
| E-mail: | rikard.tunedal@ericsson.com | |
| Media | ||
| Ola Rembe, Vice President, | ||
| Head of External Communications | ||
| Phone: | +46 10 719 97 27, +46 73 024 48 73 | |
| E-mail: | media.relations@ericsson.com | |
| Corporate Communications | ||
| Phone: | +46 10 719 69 92 | |
| E-mail: | media.relations@ericsson.com | |
15 Ericsson | Second Quarter Report 2017
Table of Contents
SAFE HARBOR STATEMENT
All statements made or incorporated by reference in this release, other than statements or characterizations of historical facts, are forward-looking statements. These forward-looking statements are based on our current expectations, estimates and projections about our industry, management’s beliefs and certain assumptions made by us. Forward-looking statements can often be identified by words such as “anticipates”, “expects”, “intends”, “plans”, “predicts”, “believes”, “seeks”, “estimates”, “may”, “will”, “should”, “would”, “potential”, “continue”, and variations or negatives of these words, and include, among others, statements regarding: (i) strategies, outlook and growth prospects; (ii) positioning to deliver future plans and to realize potential for future growth; (iii) liquidity and capital resources and expenditure, and our credit ratings; (iv) growth in demand for our products and services; (v) our joint venture activities; (vi) economic outlook and industry trends; (vii) developments of our markets; (viii) the impact of regulatory initiatives; (ix) research and development expenditures; (x) the strength of our competitors; (xi) future cost savings and profitability; (xii) plans to launch new products and services; (xiii) assessments of risks; (xiv) integration of acquired businesses; (xv) compliance with rules and regulations and (xvi) infringements of intellectual property rights of others.
In addition, any statements that refer to expectations, projections or other characterizations of future events or circumstances, including any underlying assumptions, are forward-looking statements. These forward-looking statements speak only as of the date hereof and are based upon the information available to us at this time. Such information is subject to change, and we will not necessarily inform you of such changes. These statements are not guarantees of future performance and are subject to risks, uncertainties and assumptions that are difficult to predict. Therefore, our actual results could differ materially and adversely from those expressed in any forward-looking statements as a result of various factors, such as those factors described under the risk factor section. Important factors that may cause such a difference for Ericsson include, but are not limited to: (i) material adverse changes in the markets in which we operate or in global economic conditions; (ii) increased product and price competition; (iii) reductions in capital expenditure by network operators; (iv) the cost of technological innovation and increased expenditure to improve quality of service; (v) significant changes in market share for our principal products and services; (vi) foreign exchange rate or interest rate fluctuations; and (vii) the failure to successfully implement our business and operational initiatives
16 Ericsson | Second Quarter Report 2017
Table of Contents
FINANCIAL STATEMENTS
AND OTHER INFORMATION
| Contents | ||||
| 18 | ||||
| 18 | ||||
| 19 | ||||
| 20 | ||||
| 21 | ||||
| 21 | ||||
| 22 | ||||
| 23 | ||||
| 23 | ||||
| 24 | ||||
| 25 | ||||
| 26 | ||||
| 27 | ||||
| 27 | ||||
| 28 | ||||
| 28 | ||||
| 29 | ||||
| 30 | ||||
| 30 | ||||
| 30 | ||||
| 31 | ||||
| 31 | ||||
| 32 | ||||
| 32 | ||||
| 33 | ||||
| 33 | ||||
Gross income and gross margin excluding restructuring by segment by quarter | 34 | |||
Operating income and operating margin excluding restructuring by segment by quarter | 34 | |||
| 35 | ||||
| 36 | ||||
| 37 | ||||
| 37 | ||||
| 37 | ||||
| 38 | ||||
| 38 | ||||
| 38 | ||||
| 39 | ||||
| 39 | ||||
| 39 | ||||
| 40 | ||||
17 Ericsson | Second Quarter Report 2017
Table of Contents
| Apr-Jun | Jan-Jun | |||||||||||||||||||||||
SEK million | 2017 | 2016 | Change | 2017 | 2016 | Change | ||||||||||||||||||
Net sales | 49,939 | 54,108 | -8 | % | 96,308 | 106,317 | -9 | % | ||||||||||||||||
Cost of sales | -36,006 | -36,613 | -2 | % | -75,937 | -71,432 | 6 | % | ||||||||||||||||
|
|
|
|
|
|
|
|
|
|
|
| |||||||||||||
Gross income | 13,933 | 17,495 | -20 | % | 20,371 | 34,885 | -42 | % | ||||||||||||||||
Gross margin (%) | 27.9 | % | 32.3 | % | 21.2 | % | 32.8 | % | ||||||||||||||||
Research and development expenses | -8,365 | -7,405 | 13 | % | -17,433 | -14,890 | 17 | % | ||||||||||||||||
Selling and administrative expenses | -7,052 | -7,109 | -1 | % | -16,913 | -13,829 | 22 | % | ||||||||||||||||
|
|
|
|
|
|
|
|
|
|
|
| |||||||||||||
Operating expenses | -15,417 | -14,514 | 6 | % | -34,346 | -28,719 | 20 | % | ||||||||||||||||
Other operating income and expenses | 239 | -230 | 380 | 43 | ||||||||||||||||||||
Shares in earnings of JV and associated companies | 12 | 12 | 23 | 29 | ||||||||||||||||||||
|
|
|
|
|
|
|
|
|
|
|
| |||||||||||||
Operating income | -1,233 | 2,763 | -145 | % | -13,572 | 6,238 | -318 | % | ||||||||||||||||
Financial income | -22 | 139 | -104 | 50 | ||||||||||||||||||||
Financial expenses | 83 | -666 | -267 | -1,043 | ||||||||||||||||||||
|
|
|
|
|
|
|
|
|
|
|
| |||||||||||||
Income after financial items | -1,172 | 2,236 | -152 | % | -13,943 | 5,245 | -366 | % | ||||||||||||||||
Taxes | 176 | -670 | 2,092 | -1,573 | ||||||||||||||||||||
|
|
|
|
|
|
|
|
|
|
|
| |||||||||||||
Net income | -996 | 1,566 | -164 | % | -11,851 | 3,672 | -423 | % | ||||||||||||||||
|
|
|
|
|
|
|
|
|
|
|
| |||||||||||||
Net income attributable to: | ||||||||||||||||||||||||
Stockholders of the Parent Company | -1,010 | 1,587 | -11,907 | 3,553 | ||||||||||||||||||||
Non-controlling interests | 14 | -21 | 56 | 119 | ||||||||||||||||||||
Other information | ||||||||||||||||||||||||
Average number of shares, basic (million) | 3,275 | 3,261 | 3,273 | 3,259 | ||||||||||||||||||||
Earnings per share, basic (SEK)1) | -0.31 | 0.49 | -3.64 | 1.09 | ||||||||||||||||||||
Earnings per share, diluted (SEK)1) | -0.30 | 0.48 | -3.59 | 1.08 | ||||||||||||||||||||
|
|
|
|
|
|
|
| |||||||||||||||||
| 1) | Based on Net income attributable to stockholders of the Parent Company. |
STATEMENT OF COMPREHENSIVE INCOME
| Apr-Jun | Jan-Jun | |||||||||||||||
SEK million | 2017 | 2016 | 2017 | 2016 | ||||||||||||
Net income | -996 | 1,566 | -11,851 | 3,672 | ||||||||||||
Other comprehensive income | ||||||||||||||||
Items that will not be reclassified to profit or loss | ||||||||||||||||
Remeasurements of defined benefits pension plans incl. asset ceiling | 574 | -941 | 972 | -4,443 | ||||||||||||
Tax on items that will not be reclassified to profit or loss | -160 | 235 | -329 | 1,188 | ||||||||||||
Items that may be reclassified to profit or loss | ||||||||||||||||
Available-for-sale financial assets | ||||||||||||||||
Gains/losses arising during the period | 41 | — | 73 | — | ||||||||||||
Reclassification adjustments on gains/losses included in profit or loss | 2 | — | 5 | — | ||||||||||||
Revaluation of other investments in shares and participations | ||||||||||||||||
Fair value remeasurement | 0 | — | 2 | -4 | ||||||||||||
Changes in cumulative translation adjustments | -2,773 | 1,981 | -2,794 | 848 | ||||||||||||
Share of other comprehensive income on JV and associated companies | -9 | 10 | 1 | -366 | ||||||||||||
Tax on items that may be reclassified to profit or loss | -9 | — | -18 | — | ||||||||||||
|
|
|
|
|
|
|
| |||||||||
Total other comprehensive income, net of tax | -2,334 | 1,285 | -2,088 | -2,777 | ||||||||||||
|
|
|
|
|
|
|
| |||||||||
Total comprehensive income | -3,330 | 2,851 | -13,939 | 895 | ||||||||||||
|
|
|
|
|
|
|
| |||||||||
Total comprehensive income attributable to: | ||||||||||||||||
Stockholders of the Parent Company | -3,305 | 2,843 | -13,979 | 750 | ||||||||||||
Non-controlling interest | -25 | 8 | 40 | 145 | ||||||||||||
18 Ericsson | Second Quarter Report 2017
Table of Contents
SEK million | Jun 30 2017 | Mar 31 2017 | Dec 31 2016 | |||||||||
ASSETS | ||||||||||||
Non-current assets | ||||||||||||
Intangible assets | ||||||||||||
Capitalized development expenses | 6,085 | 6,460 | 8,076 | |||||||||
Goodwill | 41,364 | 43,042 | 43,387 | |||||||||
Intellectual property rights, brands and other intangible assets | 5,234 | 5,869 | 7,747 | |||||||||
Property, plant and equipment | 16,276 | 16,645 | 16,734 | |||||||||
Financial assets | ||||||||||||
Equity in JV and associated companies | 791 | 792 | 775 | |||||||||
Other investments in shares and participations | 1,115 | 1,112 | 1,179 | |||||||||
Customer finance,non-current | 2,288 | 2,728 | 2,128 | |||||||||
Interest-bearing securities,non-current | 22,122 | 19,124 | 7,586 | |||||||||
Other financial assets,non-current | 4,409 | 4,466 | 4,442 | |||||||||
Deferred tax assets | 17,463 | 17,435 | 15,522 | |||||||||
|
|
|
|
|
| |||||||
| 117,147 | 117,673 | 107,576 | ||||||||||
Current assets | ||||||||||||
Inventories | 34,194 | 33,938 | 30,307 | |||||||||
Trade receivables | 62,493 | 65,687 | 68,117 | |||||||||
Customer finance, current | 2,156 | 2,882 | 2,625 | |||||||||
Other current receivables | 26,741 | 25,525 | 24,431 | |||||||||
Interest-bearing securities, current | 10,754 | 13,548 | 13,325 | |||||||||
Cash and cash equivalents | 21,446 | 32,954 | 36,966 | |||||||||
|
|
|
|
|
| |||||||
| 157,784 | 174,534 | 175,771 | ||||||||||
|
|
|
|
|
| |||||||
Total assets | 274,931 | 292,207 | 283,347 | |||||||||
|
|
|
|
|
| |||||||
EQUITY AND LIABILITIES | ||||||||||||
Equity | ||||||||||||
Stockholders’ equity | 123,045 | 126,105 | 139,817 | |||||||||
Non-controlling interest in equity of subsidiaries | 710 | 736 | 675 | |||||||||
|
|
|
|
|
| |||||||
| 123,755 | 126,841 | 140,492 | ||||||||||
Non–current liabilities | ||||||||||||
Post-employment benefits | 23,624 | 23,774 | 23,723 | |||||||||
Provisions,non-current | 4,794 | 4,867 | 946 | |||||||||
Deferred tax liabilities | 1,838 | 1,888 | 2,147 | |||||||||
Borrowings,non-current | 27,100 | 27,823 | 18,653 | |||||||||
Othernon-current liabilities | 2,602 | 2,699 | 2,621 | |||||||||
|
|
|
|
|
| |||||||
| 59,958 | 61,051 | 48,090 | ||||||||||
Current liabilities | ||||||||||||
Provisions, current | 5,618 | 5,694 | 5,411 | |||||||||
Borrowings, current | 3,230 | 9,514 | 8,033 | |||||||||
Trade payables | 25,025 | 25,814 | 25,318 | |||||||||
Other current liabilities | 57,345 | 63,293 | 56,003 | |||||||||
|
|
|
|
|
| |||||||
| 91,218 | 104,315 | 94,765 | ||||||||||
|
|
|
|
|
| |||||||
Total equity and liabilities | 274,931 | 292,207 | 283,347 | |||||||||
|
|
|
|
|
| |||||||
Of which interest-bearing liabilities | 30,330 | 37,337 | 26,686 | |||||||||
Assets pledged as collateral | 5,076 | 3,064 | 2,584 | |||||||||
Contingent liabilities | 1,679 | 1,729 | 1,186 | |||||||||
19 Ericsson | Second Quarter Report 2017
Table of Contents
CONSOLIDATED STATEMENT OF CASH FLOWS
| Apr-Jun | Jan-Jun | Jan-Dec | ||||||||||||||||||
SEK million | 2017 | 2016 | 2017 | 2016 | 2016 | |||||||||||||||
Operating activities | ||||||||||||||||||||
Net income | -996 | 1,566 | -11,851 | 3,672 | 1,895 | |||||||||||||||
Adjustments to reconcile net income to cash | ||||||||||||||||||||
Taxes | -1,978 | -3,410 | -6,323 | -4,618 | -6,200 | |||||||||||||||
Earnings/dividends in JV and associated companies | -8 | 73 | -15 | 57 | 58 | |||||||||||||||
Depreciation, amortization and impairment losses | 2,197 | 2,104 | 7,628 | 4,201 | 9,119 | |||||||||||||||
Other | -48 | 988 | 479 | 1,640 | 3,135 | |||||||||||||||
|
|
|
|
|
|
|
|
|
| |||||||||||
Net income reconciled to cash | -833 | 1,321 | -10,082 | 4,952 | 8,007 | |||||||||||||||
Changes in operating net assets | ||||||||||||||||||||
Inventories | -1,146 | -1,667 | -4,731 | -5,879 | -613 | |||||||||||||||
Customer finance, current andnon-current | 1,140 | -816 | 306 | -1,067 | -950 | |||||||||||||||
Trade receivables | 450 | -564 | 2,847 | 2,844 | 5,933 | |||||||||||||||
Trade payables | 41 | 2,457 | 667 | 1,840 | 2,775 | |||||||||||||||
Provisions and post-employment benefits | 324 | 218 | 4,969 | 204 | 3,106 | |||||||||||||||
Other operating assets and liabilities, net | 25 | -1,662 | 4,484 | -5,979 | -4,248 | |||||||||||||||
| 834 | -2,034 | 8,542 | -8,037 | 6,003 | ||||||||||||||||
Cash flow from operating activities | 1 | -713 | -1,540 | -3,085 | 14,010 | |||||||||||||||
Investing activities | ||||||||||||||||||||
Investments in property, plant and equipment | -1,018 | -1,572 | -2,033 | -3,046 | -6,129 | |||||||||||||||
Sales of property, plant and equipment | 37 | 50 | 106 | 94 | 482 | |||||||||||||||
Acquisitions/divestments of subsidiaries and other operations, net | 9 | -480 | 12 | -588 | -622 | |||||||||||||||
Product development | -315 | -1,099 | -1,180 | -2,307 | -4,483 | |||||||||||||||
Other investing activities | -42 | -890 | 68 | -155 | -3,004 | |||||||||||||||
Interest-bearing securities | -676 | 5,355 | -12,562 | 6,368 | 5,473 | |||||||||||||||
|
|
|
|
|
|
|
|
|
| |||||||||||
Cash flow from investing activities | -2,005 | 1,364 | -15,589 | 366 | -8,283 | |||||||||||||||
Cash flow before financing activities | -2,004 | 651 | -17,129 | -2,719 | 5,727 | |||||||||||||||
Financing activities | ||||||||||||||||||||
Dividends paid | -3,274 | -12,067 | -3,278 | -12,100 | -12,263 | |||||||||||||||
Other financing activities | -5,636 | 2,761 | 5,266 | 2,855 | 521 | |||||||||||||||
|
|
|
|
|
|
|
|
|
| |||||||||||
Cash flow from financing activities | -8,910 | -9,306 | 1,988 | -9,245 | -11,742 | |||||||||||||||
Effect of exchange rate changes on cash | -594 | 1,652 | -379 | 671 | 2,757 | |||||||||||||||
|
|
|
|
|
|
|
|
|
| |||||||||||
Net change in cash and cash equivalents | -11,508 | -7,003 | -15,520 | -11,293 | -3,258 | |||||||||||||||
|
|
|
|
|
|
|
|
|
| |||||||||||
Cash and cash equivalents, beginning of period | 32,954 | 35,934 | 36,966 | 40,224 | 40,224 | |||||||||||||||
|
|
|
|
|
|
|
|
|
| |||||||||||
Cash and cash equivalents, end of period | 21,446 | 28,931 | 21,446 | 28,931 | 36,966 | |||||||||||||||
20 Ericsson | Second Quarter Report 2017
Table of Contents
CONSOLIDATED STATEMENT OF CHANGES IN EQUITY
| Jan-Jun | Jan-Dec | |||||||||||
SEK million | 2017 | 2016 | 2016 | |||||||||
Opening balance | 140,492 | 147,366 | 147,366 | |||||||||
Total comprehensive income | -13,939 | 895 | 4,514 | |||||||||
Sale/repurchase of own shares | 34 | -74 | -216 | |||||||||
Stock issue (net) | 15 | 131 | 131 | |||||||||
Stock purchase plan | 431 | 472 | 957 | |||||||||
Dividends paid | -3,278 | -12,099 | -12,263 | |||||||||
Transactions withnon-controlling interests | — | — | 3 | |||||||||
|
|
|
|
|
| |||||||
Closing balance | 123,755 | 136,691 | 140,492 | |||||||||
|
|
|
|
|
| |||||||
CONSOLIDATED INCOME STATEMENT - ISOLATED QUARTERS
| 2017 | 2016 | |||||||||||||||||||||||
Isolated quarters, SEK million | Q2 | Q1 | Q4 | Q3 | Q2 | Q1 | ||||||||||||||||||
Net sales | 49,939 | 46,369 | 65,215 | 51,076 | 54,108 | 52,209 | ||||||||||||||||||
Cost of sales | -36,006 | -39,931 | -48,195 | -36,616 | -36,613 | -34,819 | ||||||||||||||||||
|
|
|
|
|
|
|
|
|
|
|
| |||||||||||||
Gross income | 13,933 | 6,438 | 17,020 | 14,460 | 17,495 | 17,390 | ||||||||||||||||||
Gross margin (%) | 27,9 | % | 13.9 | % | 26.1 | % | 28.3 | % | 32.3 | % | 33.3 | % | ||||||||||||
Research and development expenses | -8,365 | -9,068 | -8,890 | -7,855 | -7,405 | -7,485 | ||||||||||||||||||
Selling and administrative expenses | -7,052 | -9,861 | -8,799 | -6,238 | -7,109 | -6,720 | ||||||||||||||||||
|
|
|
|
|
|
|
|
|
|
|
| |||||||||||||
Operating expenses | -15,417 | -18,929 | -17,689 | -14,093 | -14,514 | -14,205 | ||||||||||||||||||
Other operating income and expenses | 239 | 141 | 364 | -3 | -230 | 273 | ||||||||||||||||||
Shares in earnings of JV and associated companies | 12 | 11 | 25 | -23 | 12 | 17 | ||||||||||||||||||
|
|
|
|
|
|
|
|
|
|
|
| |||||||||||||
Operating income | -1,233 | -12,339 | -280 | 341 | 2,763 | 3,475 | ||||||||||||||||||
Financial income | -22 | -82 | 61 | -226 | 139 | -89 | ||||||||||||||||||
Financial expenses | 83 | -350 | -744 | -371 | -666 | -377 | ||||||||||||||||||
|
|
|
|
|
|
|
|
|
|
|
| |||||||||||||
Income after financial items | -1,172 | -12,771 | -963 | -256 | 2,236 | 3,009 | ||||||||||||||||||
Taxes | 176 | 1,916 | -634 | 76 | -670 | -903 | ||||||||||||||||||
|
|
|
|
|
|
|
|
|
|
|
| |||||||||||||
Net income | -996 | -10,855 | -1,597 | -180 | 1,566 | 2,106 | ||||||||||||||||||
Net income attributable to: | ||||||||||||||||||||||||
Stockholders of the Parent Company | -1,010 | -10,897 | -1,604 | -233 | 1,587 | 1,966 | ||||||||||||||||||
Non-controlling interests | 14 | 42 | 7 | 53 | -21 | 140 | ||||||||||||||||||
Other information | ||||||||||||||||||||||||
Average number of shares, basic (million) | 3,275 | 3,272 | 3,268 | 3,264 | 3,261 | 3,258 | ||||||||||||||||||
Earnings per share, basic (SEK)1) | -0.31 | -3.33 | -0.49 | -0.07 | 0.49 | 0.60 | ||||||||||||||||||
Earnings per share, diluted (SEK)1) | -0.30 | -3.29 | -0.48 | -0.07 | 0.48 | 0.60 | ||||||||||||||||||
| 1) | Based on Net income attributable to stockholders of the Parent Company. |
21 Ericsson | Second Quarter Report 2017
Table of Contents
CONSOLIDATED STATEMENT OF CASH FLOWS - ISOLATED QUARTERS
| 2017 | 2016 | |||||||||||||||||||||||
Isolated quarters, SEK million | Q2 | Q1 | Q4 | Q3 | Q2 | Q1 | ||||||||||||||||||
Operating activities | �� | |||||||||||||||||||||||
Net income | -996 | -10,855 | -1,597 | -180 | 1,566 | 2,106 | ||||||||||||||||||
Adjustments to reconcile net income to cash | ||||||||||||||||||||||||
Taxes | -1,978 | -4,345 | -300 | -1,282 | -3,410 | -1,208 | ||||||||||||||||||
Earnings/dividends in JV and associated companies | -8 | -7 | -21 | 22 | 73 | -16 | ||||||||||||||||||
Depreciation, amortization and impairment losses | 2,197 | 5,431 | 2,610 | 2,308 | 2,104 | 2,097 | ||||||||||||||||||
Other | -48 | 527 | 865 | 630 | 988 | 652 | ||||||||||||||||||
|
|
|
|
|
|
|
|
|
|
|
| |||||||||||||
Net income reconciled to cash | -833 | -9,249 | 1,557 | 1,498 | 1,321 | 3,631 | ||||||||||||||||||
Changes in operating net assets | ||||||||||||||||||||||||
Inventories | -1,146 | -3,585 | 4,286 | 980 | -1,667 | -4,212 | ||||||||||||||||||
Customer finance, current andnon-current | 1,140 | -834 | -106 | 223 | -816 | -251 | ||||||||||||||||||
Trade receivables | 450 | 2,397 | 3,713 | -624 | -564 | 3,408 | ||||||||||||||||||
Trade payables | 41 | 626 | 3,306 | -2,371 | 2,457 | -617 | ||||||||||||||||||
Provisions and post-employment benefits | 324 | 4,645 | 2,772 | 130 | 218 | -14 | ||||||||||||||||||
Other operating assets and liabilities, net | 25 | 4,459 | 3,884 | -2,153 | -1,662 | -4,317 | ||||||||||||||||||
|
|
|
|
|
|
|
|
|
|
|
| |||||||||||||
| 834 | 7,708 | 17,855 | -3,815 | -2,034 | -6,003 | |||||||||||||||||||
Cash flow from operating activities | 1 | -1,541 | 19,412 | -2,317 | -713 | -2,372 | ||||||||||||||||||
Investing activities | ||||||||||||||||||||||||
Investments in property, plant and equipment | -1,018 | -1,015 | -1,699 | -1,384 | -1,572 | -1,474 | ||||||||||||||||||
Sales of property, plant and equipment | 37 | 69 | 277 | 111 | 50 | 44 | ||||||||||||||||||
Acquisitions/divestments of subsidiaries and other operations, net | 9 | 3 | -50 | 16 | -480 | -108 | ||||||||||||||||||
Product development | -315 | -865 | -1,291 | -885 | -1,099 | -1,208 | ||||||||||||||||||
Other investing activities | -42 | 110 | -2,341 | -508 | -890 | 735 | ||||||||||||||||||
Interest-bearing securities | -676 | -11,886 | -1,505 | 610 | 5,355 | 1,013 | ||||||||||||||||||
|
|
|
|
|
|
|
|
|
|
|
| |||||||||||||
Cash flow from investing activities | -2,005 | -13,584 | -6,609 | -2,040 | 1,364 | -998 | ||||||||||||||||||
Cash flow before financing activities | -2,004 | -15,125 | 12,803 | -4,357 | 651 | -3,370 | ||||||||||||||||||
Financing activities | ||||||||||||||||||||||||
Dividends paid | -3,274 | -4 | — | -163 | -12,067 | -33 | ||||||||||||||||||
Other financing activities | -5,636 | 10,902 | -1,039 | -1,295 | 2,761 | 94 | ||||||||||||||||||
|
|
|
|
|
|
|
|
|
|
|
| |||||||||||||
Cash flow from financing activities | -8,910 | 10,898 | -1,039 | -1,458 | -9,306 | 61 | ||||||||||||||||||
Effect of exchange rate changes on cash | -594 | 215 | 801 | 1,285 | 1,652 | -981 | ||||||||||||||||||
|
|
|
|
|
|
|
|
|
|
|
| |||||||||||||
Net change in cash and cash equivalents | -11,508 | -4,012 | 12,565 | -4,530 | -7,003 | -4,290 | ||||||||||||||||||
|
|
|
|
|
|
|
|
|
|
|
| |||||||||||||
Cash and cash equivalents, beginning of period | 32,954 | 36,966 | 24,401 | 28,931 | 35,934 | 40,224 | ||||||||||||||||||
|
|
|
|
|
|
|
|
|
|
|
| |||||||||||||
Cash and cash equivalents, end of period | 21,446 | 32,954 | 36,966 | 24,401 | 28,931 | 35,934 | ||||||||||||||||||
|
|
|
|
|
|
|
|
|
|
|
| |||||||||||||
22 Ericsson | Second Quarter Report 2017
Table of Contents
PARENT COMPANY INCOME STATEMENT
| Apr-Jun | Jan-Jun | Jan-Dec | ||||||||||||||||||
SEK million | 2017 | 2016 | 2017 | 2016 | 2016 | |||||||||||||||
Net sales | — | — | — | — | — | |||||||||||||||
Cost of sales | — | — | — | — | — | |||||||||||||||
|
|
|
|
|
|
|
|
|
| |||||||||||
Gross income | — | — | — | — | — | |||||||||||||||
Operating expenses | -355 | -267 | -644 | -490 | -1,185 | |||||||||||||||
Other operating income and expenses | 618 | 616 | 1,190 | 1,190 | 2,698 | |||||||||||||||
|
|
|
|
|
|
|
|
|
| |||||||||||
Operating income | 263 | 349 | 546 | 700 | 1,513 | |||||||||||||||
Financial net | 2,040 | 12,496 | 1,709 | 12,507 | 14,039 | |||||||||||||||
|
|
|
|
|
|
|
|
|
| |||||||||||
Income after financial items | 2,303 | 12,845 | 2,255 | 13,207 | 15,552 | |||||||||||||||
Transfers to (–) / from untaxed reserves | -120 | — | -120 | — | -1,100 | |||||||||||||||
Taxes | 22 | -89 | 12 | -134 | -206 | |||||||||||||||
|
|
|
|
|
|
|
|
|
| |||||||||||
Net income | 2,205 | 12,756 | 2,147 | 13,073 | 14,246 | |||||||||||||||
|
|
|
|
|
|
|
|
|
| |||||||||||
PARENT COMPANY STATEMENT OF COMPREHENSIVE INCOME
| Apr-Jun | Jan-Jun | Jan-Dec | ||||||||||||||||||
SEK million | 2017 | 2016 | 2017 | 2016 | 2016 | |||||||||||||||
Net income | 2,205 | 12,756 | 2,147 | 13,073 | 14,246 | |||||||||||||||
Available-for-sale financial assets | ||||||||||||||||||||
Gains/losses arising during the period | 41 | — | 73 | — | -7 | |||||||||||||||
Reclassification adjustments on gains/losses included in profit or loss | 2 | — | 5 | — | — | |||||||||||||||
Revaluation of other investments in shares and participations | ||||||||||||||||||||
Fair value remeasurement | — | — | — | -5 | -5 | |||||||||||||||
Tax on items that may be reclassified to profit or loss | -9 | — | -17 | — | — | |||||||||||||||
|
|
|
|
|
|
|
|
|
| |||||||||||
Total other comprehensive income, net of tax | 34 | — | 61 | -5 | -12 | |||||||||||||||
|
|
|
|
|
|
|
|
|
| |||||||||||
Total comprehensive income | 2,239 | 12,756 | 2,208 | 13,068 | 14,234 | |||||||||||||||
|
|
|
|
|
|
|
|
|
| |||||||||||
23 Ericsson | Second Quarter Report 2017
Table of Contents
SEK million | Jun 30 2017 | Dec 31 2016 | ||||||
ASSETS | ||||||||
Fixed assets | ||||||||
Intangible assets | 434 | 547 | ||||||
Tangible assets | 435 | 396 | ||||||
Financial assets* | 125,614 | 111,981 | ||||||
|
|
|
| |||||
| 126,483 | 112,924 | |||||||
Current assets | ||||||||
Inventories | 1 | 3 | ||||||
Receivables | 33,685 | 38,476 | ||||||
Short-term investments | 10,414 | 12,991 | ||||||
Cash and cash equivalents | 8,598 | 22,311 | ||||||
|
|
|
| |||||
| 52,698 | 73,781 | |||||||
|
|
|
| |||||
Total assets | 179,181 | 186,705 | ||||||
|
|
|
| |||||
STOCKHOLDERS’ EQUITY, PROVISIONS AND LIABILITIES | ||||||||
Equity | ||||||||
Restricted equity | 48,164 | 48,148 | ||||||
Non-restricted equity | 43,712 | 44,753 | ||||||
|
|
|
| |||||
| 91,876 | 92,901 | |||||||
Provisions | 656 | 885 | ||||||
Non-current liabilities | 58,857 | 50,428 | ||||||
Current liabilities | 27,792 | 42,491 | ||||||
|
|
|
| |||||
Total stockholders’ equity, provisions and liabilities | 179,181 | 186,705 | ||||||
|
|
|
| |||||
* Of which interest-bearing securities,non-current | 22,122 | 7,586 | ||||||
|
|
|
| |||||
24 Ericsson | Second Quarter Report 2017
Table of Contents
THE GROUP
This interim report is prepared in accordance with IAS 34. The term “IFRS” used in this document refers to the application of IAS and IFRS as well as interpretations of these standards as issued by IASB’s Standards Interpretation Committee (SIC) and IFRS Interpretations Committee (IFRIC). The accounting policies adopted are consistent with those of the annual report for the year ended December 31, 2016, and should be read in conjunction with that annual report.
There is no significant difference between IFRS effective as per June 30, 2017 and IFRS as endorsed by the EU.
None of the new or amended standards and interpretations that became effective January 1, 2017, have had a significant impact on the financial result or position of the Company.
25 Ericsson | Second Quarter Report 2017
Table of Contents
NET SALES BY SEGMENT BY QUARTER*
| 2017 | 2016 | |||||||||||||||||||||||
Isolated quarters, SEK million | Q2 | Q1 | Q4 | Q3 | Q2 | Q1 | ||||||||||||||||||
Networks | 36,839 | 34,860 | 47,791 | 37,020 | 40,245 | 39,935 | ||||||||||||||||||
Of which products | 20,786 | 19,410 | 27,519 | 19,249 | 23,037 | 22,795 | ||||||||||||||||||
Of which services | 16,053 | 15,450 | 20,272 | 17,771 | 17,208 | 17,140 | ||||||||||||||||||
IT & Cloud | 10,888 | 9,545 | 14,884 | 11,716 | 11,500 | 9,830 | ||||||||||||||||||
Of which products | 5,065 | 4,103 | 6,682 | 5,479 | 5,298 | 4,773 | ||||||||||||||||||
Of which services | 5,823 | 5,442 | 8,202 | 6,237 | 6,202 | 5,057 | ||||||||||||||||||
Other | 2,212 | 1,964 | 2,540 | 2,340 | 2,363 | 2,444 | ||||||||||||||||||
|
|
|
|
|
|
|
|
|
|
|
| |||||||||||||
Total | 49,939 | 46,369 | 65,215 | 51,076 | 54,108 | 52,209 | ||||||||||||||||||
|
|
|
|
|
|
|
|
|
|
|
| |||||||||||||
| 2017 | 2016 | |||||||||||||||||||||||
Sequential change, percent | Q2 | Q1 | Q4 | Q3 | Q2 | Q1 | ||||||||||||||||||
Networks | 6 | % | -27 | % | 29 | % | -8 | % | 1 | % | — | |||||||||||||
Of which products | 7 | % | -29 | % | 43 | % | -16 | % | 1 | % | — | |||||||||||||
Of which services | 4 | % | -24 | % | 14 | % | 3 | % | 0 | % | — | |||||||||||||
IT & Cloud | 14 | % | -36 | % | 27 | % | 2 | % | 17 | % | — | |||||||||||||
Of which products | 23 | % | -39 | % | 22 | % | 3 | % | 11 | % | — | |||||||||||||
Of which services | 7 | % | -34 | % | 32 | % | 1 | % | 23 | % | — | |||||||||||||
Other | 13 | % | -23 | % | 9 | % | -1 | % | -3 | % | — | |||||||||||||
|
|
|
|
|
|
|
|
|
|
|
| |||||||||||||
Total | 8 | % | -29 | % | 28 | % | -6 | % | 4 | % | -29 | % | ||||||||||||
|
|
|
|
|
|
|
|
|
|
|
| |||||||||||||
| 2017 | 2016 | |||||||||||||||||||||||
Year over year change, percent | Q2 | Q1 | Q4 | Q3 | Q2 | Q1 | ||||||||||||||||||
Networks | -8 | % | -13 | % | — | — | — | — | ||||||||||||||||
Of which products | -10 | % | -15 | % | — | — | — | — | ||||||||||||||||
Of which services | -7 | % | -10 | % | — | — | — | — | ||||||||||||||||
IT & Cloud | -5 | % | -3 | % | — | — | — | — | ||||||||||||||||
Of which products | -4 | % | -14 | % | — | — | — | — | ||||||||||||||||
Of which services | -6 | % | 8 | % | — | — | — | — | ||||||||||||||||
Other | -6 | % | -20 | % | — | — | — | — | ||||||||||||||||
|
|
|
|
|
|
|
|
|
|
|
| |||||||||||||
Total | -8 | % | -11 | % | -11 | % | -14 | % | -11 | % | -2 | % | ||||||||||||
|
|
|
|
|
|
|
|
|
|
|
| |||||||||||||
| 2017 | 2016 | |||||||||||||||||||||||
Year to date, SEK million | Jan-Jun | Jan-Mar | Jan-Dec | Jan-Sep | Jan-Jun | Jan-Mar | ||||||||||||||||||
Networks | 71,699 | 34,860 | 164,991 | 117,200 | 80,180 | 39,935 | ||||||||||||||||||
Of which products | 40,196 | 19,410 | 92,600 | 65,081 | 45,832 | 22,795 | ||||||||||||||||||
Of which services | 31,503 | 15,450 | 72,391 | 52,119 | 34,348 | 17,140 | ||||||||||||||||||
IT & Cloud | 20,433 | 9,545 | 47,930 | 33,046 | 21,330 | 9,830 | ||||||||||||||||||
Of which products | 9,168 | 4,103 | 22,232 | 15,550 | 10,071 | 4,773 | ||||||||||||||||||
Of which services | 11,265 | 5,442 | 25,698 | 17,496 | 11,259 | 5,057 | ||||||||||||||||||
Other | 4,176 | 1,964 | 9,687 | 7,147 | 4,807 | 2,444 | ||||||||||||||||||
|
|
|
|
|
|
|
|
|
|
|
| |||||||||||||
Total | 96,308 | 46,369 | 222,608 | 157,393 | 106,317 | 52,209 | ||||||||||||||||||
|
|
|
|
|
|
|
|
|
|
|
| |||||||||||||
| 2017 | 2016 | |||||||||||||||||||||||
Year to date, year over year change, percent | Jan-Jun | Jan-Mar | Jan-Dec | Jan-Sep | Jan-Jun | Jan-Mar | ||||||||||||||||||
Networks | -11 | % | -13 | % | -11 | % | — | — | — | |||||||||||||||
Of which products | -12 | % | -15 | % | -12 | % | — | — | — | |||||||||||||||
Of which services | -8 | % | -10 | % | -8 | % | — | — | — | |||||||||||||||
IT & Cloud | -4 | % | -3 | % | -7 | % | — | — | — | |||||||||||||||
Of which products | -9 | % | -14 | % | -16 | % | — | — | — | |||||||||||||||
Of which services | 0 | % | 8 | % | 1 | % | — | — | — | |||||||||||||||
Other | -13 | % | -20 | % | -7 | % | — | — | — | |||||||||||||||
|
|
|
|
|
|
|
|
|
|
|
| |||||||||||||
Total | -9 | % | -11 | % | -10 | % | -9 | % | -7 | % | -2 | % | ||||||||||||
|
|
|
|
|
|
|
|
|
|
|
| |||||||||||||
| * | Net sales by segment has been restated for each quarter of 2016 and for the full year 2015. Comparisons against isolated quarters in 2015 are not available by segment. As of Q2 2017, the former Media segment was renamed to “Other”. |
26 Ericsson | Second Quarter Report 2017
Table of Contents
SALES GROWTH ADJUSTED FOR COMPARABLE UNITS AND CURRENCY*
| 2017 | 2016 | |||||||||||||||||||||||
Sequential change, percent | Q2 | Q1 | Q4 | Q3 | Q2 | Q1 | ||||||||||||||||||
Networks | 7 | % | -27 | % | — | — | — | — | ||||||||||||||||
IT & Cloud | 16 | % | -35 | % | — | — | — | — | ||||||||||||||||
Other | 13 | % | -23 | % | — | — | — | — | ||||||||||||||||
|
|
|
|
|
|
|
|
|
|
|
| |||||||||||||
Total | 9 | % | -29 | % | 23 | % | -9 | % | 6 | % | -28 | % | ||||||||||||
|
|
|
|
|
|
|
|
|
|
|
| |||||||||||||
| 2017 | 2016 | |||||||||||||||||||||||
Isolated quarter, year over year change, percent | Q2 | Q1 | Q4 | Q3 | Q2 | Q1 | ||||||||||||||||||
Networks | -14 | % | -18 | % | — | — | — | — | ||||||||||||||||
IT & Cloud | -10 | % | -7 | % | — | — | — | — | ||||||||||||||||
Other | -11 | % | -22 | % | — | — | — | — | ||||||||||||||||
|
|
|
|
|
|
|
|
|
|
|
| |||||||||||||
Total | -13 | % | -16 | % | -15 | % | -14 | % | -7 | % | -1 | % | ||||||||||||
|
|
|
|
|
|
|
|
|
|
|
| |||||||||||||
| 2017 | 2016 | |||||||||||||||||||||||
Year to date, year over year change, percent | Jan-Jun | Jan-Mar | Jan-Dec | Jan-Sep | Jan-Jun | Jan-Mar | ||||||||||||||||||
Networks | -16 | % | -18 | % | — | — | — | — | ||||||||||||||||
IT & Cloud | -8 | % | -7 | % | — | — | — | — | ||||||||||||||||
Other | -17 | % | -22 | % | — | — | — | — | ||||||||||||||||
|
|
|
|
|
|
|
|
|
|
|
| |||||||||||||
Total | -15 | % | -16 | % | -10 | % | -8 | % | -4 | % | -1 | % | ||||||||||||
|
|
|
|
|
|
|
|
|
|
|
| |||||||||||||
| * | Sales growth adjusted for comparable units and currency has not been restated by segment for 2016. |
GROSS INCOME AND GROSS MARGIN BY SEGMENT BY QUARTER
| 2017 | 2016 | |||||||||||||||||||||||
Isolated quarters, SEK million | Q2 | Q1 | Q4 | Q3 | Q2 | Q1 | ||||||||||||||||||
Networks | 10,357 | 7,980 | 11,783 | 9,867 | 12,522 | 13,011 | ||||||||||||||||||
IT & Cloud | 2,828 | -2,100 | 4,676 | 3,833 | 4,061 | 3,281 | ||||||||||||||||||
Other | 748 | 558 | 561 | 760 | 912 | 1,098 | ||||||||||||||||||
|
|
|
|
|
|
|
|
|
|
|
| |||||||||||||
Total | 13,933 | 6,438 | 17,020 | 14,460 | 17,495 | 17,390 | ||||||||||||||||||
|
|
|
|
|
|
|
|
|
|
|
| |||||||||||||
| 2017 | 2016 | |||||||||||||||||||||||
Isolated quarters, As percentage of net sales | Q2 | Q1 | Q4 | Q3 | Q2 | Q1 | ||||||||||||||||||
Networks | 28 | % | 23 | % | 25 | % | 27 | % | 31 | % | 33 | % | ||||||||||||
IT & Cloud | 26 | % | -22 | % | 31 | % | 33 | % | 35 | % | 33 | % | ||||||||||||
Other | 34 | % | 28 | % | 22 | % | 32 | % | 39 | % | 45 | % | ||||||||||||
|
|
|
|
|
|
|
|
|
|
|
| |||||||||||||
Total | 28 | % | 14 | % | 26 | % | 28 | % | 32 | % | 33 | % | ||||||||||||
|
|
|
|
|
|
|
|
|
|
|
| |||||||||||||
| 2017 | 2016 | |||||||||||||||||||||||
Year to date, SEK million | Jan-Jun | Jan-Mar | Jan-Dec | Jan-Sep | Jan-Jun | Jan-Mar | ||||||||||||||||||
Networks | 18,337 | 7,980 | 47,183 | 35,400 | 25,533 | 13,011 | ||||||||||||||||||
IT & Cloud | 728 | -2,100 | 15,851 | 11,175 | 7,342 | 3,281 | ||||||||||||||||||
Other | 1,306 | 558 | 3,331 | 2,770 | 2,010 | 1,098 | ||||||||||||||||||
|
|
|
|
|
|
|
|
|
|
|
| |||||||||||||
Total | 20,371 | 6,438 | 66,365 | 49,345 | 34,885 | 17,390 | ||||||||||||||||||
|
|
|
|
|
|
|
|
|
|
|
| |||||||||||||
| 2017 | 2016 | |||||||||||||||||||||||
Year to date, As percentage of net sales | Jan-Jun | Jan-Mar | Jan-Dec | Jan-Sep | Jan-Jun | Jan-Mar | ||||||||||||||||||
Networks | 26 | % | 23 | % | 29 | % | 30 | % | 32 | % | 33 | % | ||||||||||||
IT & Cloud | 4 | % | -22 | % | 33 | % | 34 | % | 34 | % | 33 | % | ||||||||||||
Other | 31 | % | 28 | % | 34 | % | 39 | % | 42 | % | 45 | % | ||||||||||||
|
|
|
|
|
|
|
|
|
|
|
| |||||||||||||
Total | 21 | % | 14 | % | 30 | % | 31 | % | 33 | % | 33 | % | ||||||||||||
|
|
|
|
|
|
|
|
|
|
|
| |||||||||||||
27 Ericsson | Second Quarter Report 2017
Table of Contents
OPERATING INCOME AND OPERATING MARGIN BY SEGMENT BY QUARTER
| 2017 | 2016 | |||||||||||||||||||||||
Isolated quarters, SEK million | Q2 | Q1 | Q4 | Q3 | Q2 | Q1 | ||||||||||||||||||
Networks | 2,603 | -538 | 2,380 | 2,839 | 4,789 | 5,762 | ||||||||||||||||||
IT & Cloud | -2,869 | -8,997 | -1,819 | -1,740 | -1,546 | -1,977 | ||||||||||||||||||
Other | -967 | -2,804 | -841 | -758 | -480 | -310 | ||||||||||||||||||
|
|
|
|
|
|
|
|
|
|
|
| |||||||||||||
Total | -1,233 | -12,339 | -280 | 341 | 2,763 | 3,475 | ||||||||||||||||||
|
|
|
|
|
|
|
|
|
|
|
| |||||||||||||
| 2017 | 2016 | |||||||||||||||||||||||
Isolated quarters, As percentage of net sales | Q2 | Q1 | Q4 | Q3 | Q2 | Q1 | ||||||||||||||||||
Networks | 7 | % | -2 | % | 5 | % | 8 | % | 12 | % | 14 | % | ||||||||||||
IT & Cloud | -26 | % | -94 | % | -12 | % | -15 | % | -13 | % | -20 | % | ||||||||||||
Other | -44 | % | -143 | % | -33 | % | -32 | % | -20 | % | -13 | % | ||||||||||||
|
|
|
|
|
|
|
|
|
|
|
| |||||||||||||
Total | -2 | % | -27 | % | 0 | % | 1 | % | 5 | % | 7 | % | ||||||||||||
|
|
|
|
|
|
|
|
|
|
|
| |||||||||||||
| 2017 | 2016 | |||||||||||||||||||||||
Year to date, SEK million | Jan-Jun | Jan-Mar | Jan-Dec | Jan-Sep | Jan-Jun | Jan-Mar | ||||||||||||||||||
Networks | 2,065 | -538 | 15,770 | 13,390 | 10,551 | 5,762 | ||||||||||||||||||
IT & Cloud | -11,866 | -8,997 | -7,082 | -5,263 | -3,523 | -1,977 | ||||||||||||||||||
Other | -3,771 | -2,804 | -2,389 | -1,548 | -790 | -310 | ||||||||||||||||||
|
|
|
|
|
|
|
|
|
|
|
| |||||||||||||
Total | -13,572 | -12,339 | 6,299 | 6,579 | 6,238 | 3,475 | ||||||||||||||||||
|
|
|
|
|
|
|
|
|
|
|
| |||||||||||||
| 2017 | 2016 | |||||||||||||||||||||||
Year to date As percentage of net sales | Jan-Jun | Jan-Mar | Jan-Dec | Jan-Sep | Jan-Jun | Jan-Mar | ||||||||||||||||||
Networks | 3 | % | -2 | % | 10 | % | 11 | % | 13 | % | 14 | % | ||||||||||||
IT & Cloud | -58 | % | -94 | % | -15 | % | -16 | % | -17 | % | -20 | % | ||||||||||||
Other | -90 | % | -143 | % | -25 | % | -22 | % | -16 | % | -13 | % | ||||||||||||
|
|
|
|
|
|
|
|
|
|
|
| |||||||||||||
Total | -14 | % | -27 | % | 3 | % | 4 | % | 6 | % | 7 | % | ||||||||||||
|
|
|
|
|
|
|
|
|
|
|
| |||||||||||||
BY SEGMENT BY QUARTER
| 2017 | 2016 | |||||||||||||||||||||||
Isolated quarters, SEK million | Q2 | Q1 | Q4 | Q3 | Q2 | Q1 | ||||||||||||||||||
Networks | 2,687 | -353 | 2,586 | 3,042 | 4,994 | 5,970 | ||||||||||||||||||
IT & Cloud | -2,640 | -8,237 | -1,571 | -1,443 | -1,306 | -1,713 | ||||||||||||||||||
Other | -835 | -1,874 | -655 | -567 | -290 | -98 | ||||||||||||||||||
|
|
|
|
|
|
|
|
|
|
|
| |||||||||||||
Total | -788 | -10,464 | 360 | 1,032 | 3,398 | 4,159 | ||||||||||||||||||
|
|
|
|
|
|
|
|
|
|
|
| |||||||||||||
| 2017 | 2016 | |||||||||||||||||||||||
Isolated quarters As percentage of net sales | Q2 | Q1 | Q4 | Q3 | Q2 | Q1 | ||||||||||||||||||
Networks | 7 | % | -1 | % | 5 | % | 8 | % | 12 | % | 15 | % | ||||||||||||
IT & Cloud | -24 | % | -86 | % | -11 | % | -12 | % | -11 | % | -17 | % | ||||||||||||
Other | -38 | % | -95 | % | -26 | % | -24 | % | -12 | % | -4 | % | ||||||||||||
|
|
|
|
|
|
|
|
|
|
|
| |||||||||||||
Total | -2 | % | -23 | % | 1 | % | 2 | % | 6 | % | 8 | % | ||||||||||||
|
|
|
|
|
|
|
|
|
|
|
| |||||||||||||
| 2017 | 2016 | |||||||||||||||||||||||
Year to date, SEK million | Jan-Jun | Jan-Mar | Jan-Dec | Jan-Sep | Jan-Jun | Jan-Mar | ||||||||||||||||||
Networks | 2,334 | -353 | 16,592 | 14,006 | 10,964 | 5,970 | ||||||||||||||||||
IT & Cloud | -10,877 | -8,237 | -6,033 | -4,462 | -3,019 | -1,713 | ||||||||||||||||||
Other | -2,709 | -1,874 | -1,610 | -955 | -388 | -98 | ||||||||||||||||||
|
|
|
|
|
|
|
|
|
|
|
| |||||||||||||
Total | -11,252 | -10,464 | 8,949 | 8,589 | 7,557 | 4,159 | ||||||||||||||||||
|
|
|
|
|
|
|
|
|
|
|
| |||||||||||||
| 2017 | 2016 | |||||||||||||||||||||||
Year to date As a percentage of net sales | Jan-Jun | Jan-Mar | Jan-Dec | Jan-Sep | Jan-Jun | Jan-Mar | ||||||||||||||||||
Networks | 3 | % | -1 | % | 10 | % | 12 | % | 14 | % | 15 | % | ||||||||||||
IT & Cloud | -53 | % | -86 | % | -13 | % | -14 | % | -14 | % | -17 | % | ||||||||||||
Other | -65 | % | -95 | % | -17 | % | -13 | % | -8 | % | -4 | % | ||||||||||||
|
|
|
|
|
|
|
|
|
|
|
| |||||||||||||
Total | -12 | % | -23 | % | 4 | % | 5 | % | 7 | % | 8 | % | ||||||||||||
|
|
|
|
|
|
|
|
|
|
|
| |||||||||||||
28 Ericsson | Second Quarter Report 2017
Table of Contents
NET SALES BY MARKET AREA BY QUARTER*
| 2017 | 2016 | |||||||||||||||||||||||
Isolated quarters, SEK million | Q2 | Q1 | Q4 | Q3 | Q2 | Q1 | ||||||||||||||||||
South East Asia, Oceania and India | 7,730 | 8,009 | 9,718 | 7,678 | 7,730 | 7,905 | ||||||||||||||||||
North East Asia | 5,853 | 5,561 | 9,623 | 6,122 | 6,041 | 5,579 | ||||||||||||||||||
North America | 12,457 | 11,811 | 14,851 | 13,178 | 13,358 | 13,147 | ||||||||||||||||||
Europe and Latin America1) 2) | 15,231 | 12,707 | 19,128 | 15,104 | 17,082 | 15,100 | ||||||||||||||||||
Middle East and Africa | 6,018 | 5,414 | 9,129 | 6,298 | 7,239 | 5,699 | ||||||||||||||||||
Other1) 2) | 2,650 | 2,867 | 2,766 | 2,696 | 2,658 | 4,779 | ||||||||||||||||||
|
|
|
|
|
|
|
|
|
|
|
| |||||||||||||
Total | 49,939 | 46,369 | 65,215 | 51,076 | 54,108 | 52,209 | ||||||||||||||||||
|
|
|
|
|
|
|
|
|
|
|
| |||||||||||||
1) Of which in Sweden | 701 | 925 | 843 | 690 | 477 | 1,113 | ||||||||||||||||||
2) Of which in EU | 8,840 | 8,239 | 11,154 | 8,507 | 9,635 | 9,229 | ||||||||||||||||||
| 2017 | 2016 | |||||||||||||||||||||||
Sequential change, percent | Q2 | Q1 | Q4 | Q3 | Q2 | Q1 | ||||||||||||||||||
South East Asia, Oceania and India | -3 | % | -18 | % | 27 | % | -1 | % | -2 | % | -7 | % | ||||||||||||
North East Asia | 5 | % | -42 | % | 57 | % | 1 | % | 8 | % | -37 | % | ||||||||||||
North America | 5 | % | -20 | % | 13 | % | -1 | % | 2 | % | -21 | % | ||||||||||||
Europe and Latin America1) 2) | 20 | % | -34 | % | 27 | % | -12 | % | 13 | % | -31 | % | ||||||||||||
Middle East and Africa | 11 | % | -41 | % | 45 | % | -13 | % | 27 | % | -36 | % | ||||||||||||
Other1) 2) | -8 | % | 4 | % | 3 | % | 1 | % | -44 | % | -44 | % | ||||||||||||
|
|
|
|
|
|
|
|
|
|
|
| |||||||||||||
Total | 8 | % | -29 | % | 28 | % | -6 | % | 4 | % | -29 | % | ||||||||||||
|
|
|
|
|
|
|
|
|
|
|
| |||||||||||||
1) Of which in Sweden | -24 | % | 10 | % | 22 | % | 45 | % | -57 | % | 15 | % | ||||||||||||
2) Of which in EU | 7 | % | -26 | % | 31 | % | -12 | % | 4 | % | -27 | % | ||||||||||||
| 2017 | 2016 | |||||||||||||||||||||||
Year-over-year change, percent | Q2 | Q1 | Q4 | Q3 | Q2 | Q1 | ||||||||||||||||||
South East Asia, Oceania and India | 0 | % | 1 | % | 14 | % | -9 | % | -3 | % | 1 | % | ||||||||||||
North East Asia | -3 | % | 0 | % | 8 | % | -4 | % | -13 | % | -7 | % | ||||||||||||
North America | -7 | % | -10 | % | -11 | % | -8 | % | -8 | % | 8 | % | ||||||||||||
Europe and Latin America1) 2) | -11 | % | -16 | % | -13 | % | -20 | % | -12 | % | -15 | % | ||||||||||||
Middle East and Africa | -17 | % | -5 | % | 2 | % | -25 | % | -21 | % | -15 | % | ||||||||||||
Other1) 2) | 0 | % | -40 | % | -67 | % | -6 | % | -3 | % | 54 | % | ||||||||||||
|
|
|
|
|
|
|
|
|
|
|
| |||||||||||||
Total | -8 | % | -11 | % | -11 | % | -14 | % | -11 | % | -2 | % | ||||||||||||
|
|
|
|
|
|
|
|
|
|
|
| |||||||||||||
1) Of which in Sweden | 47 | % | -17 | % | -13 | % | -39 | % | -20 | % | 2 | % | ||||||||||||
2) Of which in EU | -8 | % | -11 | % | -12 | % | -20 | % | -16 | % | -15 | % | ||||||||||||
| 2017 | 2016 | |||||||||||||||||||||||
Year to date, SEK million | Jan-Jun | Jan-Mar | Jan-Dec | Jan-Sep | Jan-Jun | Jan-Mar | ||||||||||||||||||
South East Asia, Oceania and India | 15,739 | 8,009 | 33,031 | 23,313 | 15,635 | 7,905 | ||||||||||||||||||
North East Asia | 11,414 | 5,561 | 27,365 | 17,742 | 11,620 | 5,579 | ||||||||||||||||||
North America | 24,268 | 11,811 | 54,534 | 39,683 | 26,505 | 13,147 | ||||||||||||||||||
Europe and Latin America1) 2) | 27,938 | 12,707 | 66,414 | 47,286 | 32,182 | 15,100 | ||||||||||||||||||
Middle East and Africa | 11,432 | 5,414 | 28,365 | 19,236 | 12,938 | 5,699 | ||||||||||||||||||
Other1) 2) | 5,517 | 2,867 | 12,899 | 10,133 | 7,437 | 4,779 | ||||||||||||||||||
|
|
|
|
|
|
|
|
|
|
|
| |||||||||||||
Total | 96,308 | 46,369 | 222,608 | 157,393 | 106,317 | 52,209 | ||||||||||||||||||
|
|
|
|
|
|
|
|
|
|
|
| |||||||||||||
1) Of which in Sweden | 1,626 | 925 | 3,123 | 2,280 | 1,590 | 1,113 | ||||||||||||||||||
2)Of which in EU | 17,079 | 8,239 | 38,525 | 27,371 | 18,864 | 9,229 | ||||||||||||||||||
| 2017 | 2016 | |||||||||||||||||||||||
Year to date, year-over-year change, percent | Jan-Jun | Jan-Mar | Jan-Dec | Jan-Sep | Jan-Jun | Jan-Mar | ||||||||||||||||||
South East Asia, Oceania and India | 1 | % | 1 | % | 1 | % | -4 | % | -1 | % | 1 | % | ||||||||||||
North East Asia | -2 | % | 0 | % | -3 | % | -8 | % | -10 | % | -7 | % | ||||||||||||
North America | -8 | % | -10 | % | -6 | % | -3 | % | -1 | % | 8 | % | ||||||||||||
Europe and Latin America1) 2) | -13 | % | -16 | % | -15 | % | -15 | % | -13 | % | -15 | % | ||||||||||||
Middle East and Africa | -12 | % | -5 | % | -15 | % | -21 | % | -18 | % | -15 | % | ||||||||||||
Other1) 2) | -26 | % | -40 | % | -25 | % | 16 | % | 27 | % | 54 | % | ||||||||||||
|
|
|
|
|
|
|
|
|
|
|
| |||||||||||||
Total | -9 | % | -11 | % | -10 | % | -9 | % | -7 | % | -2 | % | ||||||||||||
|
|
|
|
|
|
|
|
|
|
|
| |||||||||||||
1) Of which in Sweden | 2 | % | -17 | % | -18 | % | -19 | % | -6 | % | 2 | % | ||||||||||||
2) Of which in EU | -9 | % | -11 | % | -15 | % | -17 | % | -16 | % | -15 | % | ||||||||||||
| * | As of Q2 2017, net sales by geographical area has been restated using the new structure of five Market Areas + Other, replacing the previous structure of 10 regions + Other. Broadcast services, reported as Region Other during 2016, is now reported per geographical area. In addition, part of the business related to former Telcordia, reported per geographical area during 2016, has been transferred to Other. All changes have been applied retrospectively to ensure valid comparisons between periods. |
29 Ericsson | Second Quarter Report 2017
Table of Contents
| Country | Q2 | Jan-Jun | ||||||||||||||
Percentage of Net sales | 2017 | 2016 | 2017 | 2016 | ||||||||||||
United States | 26 | % | 26 | % | 26 | % | 26 | % | ||||||||
China | 9 | % | 8 | % | 8 | % | 9 | % | ||||||||
India | 4 | % | 5 | % | 5 | % | 5 | % | ||||||||
Australia | 4 | % | 3 | % | 4 | % | 2 | % | ||||||||
Japan | 3 | % | 2 | % | 4 | % | 3 | % | ||||||||
NET SALES BY MARKET AREA BY SEGMENT
| Q2 2017 | Jan-Jun 2017 | |||||||||||||||||||||||||||||||
SEK million | Networks | IT & Cloud | Other | Total | Networks | IT & Cloud | Other | Total | ||||||||||||||||||||||||
South East Asia, Oceania and India | 6,292 | 1,319 | 119 | 7,730 | 12,945 | 2,597 | 197 | 15,739 | ||||||||||||||||||||||||
North East Asia | 4,118 | 1,693 | 42 | 5,853 | 8,743 | 2,582 | 89 | 11,414 | ||||||||||||||||||||||||
North America | 9,953 | 2,053 | 451 | 12,457 | 19,182 | 4,340 | 746 | 24,268 | ||||||||||||||||||||||||
Europe and Latin America | 10,513 | 3,865 | 853 | 15,231 | 19,099 | 7,191 | 1,648 | 27,938 | ||||||||||||||||||||||||
Middle East and Africa | 4,171 | 1,756 | 91 | 6,018 | 7,922 | 3,309 | 201 | 11,432 | ||||||||||||||||||||||||
Other | 1,792 | 202 | 656 | 2,650 | 3,808 | 414 | 1,295 | 5,517 | ||||||||||||||||||||||||
|
|
|
|
|
|
|
|
|
|
|
|
|
|
|
| |||||||||||||||||
Total | 36,839 | 10,888 | 2,212 | 49,939 | 71,699 | 20,433 | 4,176 | 96,308 | ||||||||||||||||||||||||
|
|
|
|
|
|
|
|
|
|
|
|
|
|
|
| |||||||||||||||||
Share of total | 74 | % | 22 | % | 4 | % | 100 | % | 75 | % | 21 | % | 4 | % | 100 | % | ||||||||||||||||
|
|
|
|
|
|
|
|
|
|
|
|
|
|
|
| |||||||||||||||||
| Q2 2017 | ||||||||||||||||
Sequential change, percent | Networks | IT & Cloud | Other | Total | ||||||||||||
South East Asia, Oceania and India | -5 | % | 3 | % | 53 | % | -3 | % | ||||||||
North East Asia | -11 | % | 90 | % | -11 | % | 5 | % | ||||||||
North America | 8 | % | -10 | % | 53 | % | 5 | % | ||||||||
Europe and Latin America | 22 | % | 16 | % | 7 | % | 20 | % | ||||||||
Middle East and Africa | 11 | % | 13 | % | -17 | % | 11 | % | ||||||||
Other | -11 | % | -5 | % | 3 | % | -8 | % | ||||||||
|
|
|
|
|
|
|
| |||||||||
Total | 6 | % | 14 | % | 13 | % | 8 | % | ||||||||
|
|
|
|
|
|
|
| |||||||||
| Q2 2017 | Jan-Jun 2017 | |||||||||||||||||||||||||||||||
Year over year change, percent | Networks | IT & Cloud | Other | Total | Networks | IT & Cloud | Other | Total | ||||||||||||||||||||||||
South East Asia, Oceania and India | -2 | % | 10 | % | 7 | % | 0 | % | -1 | % | 9 | % | 1 | % | 1 | % | ||||||||||||||||
North East Asia | -12 | % | 25 | % | 20 | % | -3 | % | -2 | % | -1 | % | 11 | % | -2 | % | ||||||||||||||||
North America | -5 | % | -11 | % | -23 | % | -7 | % | -10 | % | 8 | % | -33 | % | -8 | % | ||||||||||||||||
Europe and Latin America | -11 | % | -12 | % | -10 | % | -11 | % | -15 | % | -9 | % | -13 | % | -13 | % | ||||||||||||||||
Middle East and Africa | -19 | % | -13 | % | 23 | % | -17 | % | -13 | % | -10 | % | 19 | % | -12 | % | ||||||||||||||||
Other | 0 | % | -19 | % | 7 | % | 0 | % | -29 | % | -40 | % | -5 | % | -26 | % | ||||||||||||||||
|
|
|
|
|
|
|
|
|
|
|
|
|
|
|
| |||||||||||||||||
Total | -8 | % | -5 | % | -6 | % | -8 | % | -11 | % | -4 | % | -13 | % | -9 | % | ||||||||||||||||
|
|
|
|
|
|
|
|
|
|
|
|
|
|
|
| |||||||||||||||||
IPR LICENSING REVENUES BY SEGMENT BY QUARTER
| 2017 | 2016 | |||||||||||||||||||||||
Isolated quarters, SEK million | Q2 | Q1 | Q4 | Q3 | Q2 | Q1 | ||||||||||||||||||
Networks | 1,562 | 1,609 | 1,612 | 1,610 | 1,724 | 3,064 | ||||||||||||||||||
IT & Cloud | 195 | 201 | 202 | 201 | 216 | 383 | ||||||||||||||||||
Other | 195 | 201 | 202 | 201 | 216 | 383 | ||||||||||||||||||
|
|
|
|
|
|
|
|
|
|
|
| |||||||||||||
Total | 1,952 | 2,011 | 2,016 | 2,012 | 2,156 | 3,830 | ||||||||||||||||||
|
|
|
|
|
|
|
|
|
|
|
| |||||||||||||
| 2017 | 2016 | |||||||||||||||||||||||
Year to date, SEK million, | Jan-Jun | Jan-Mar | Jan-Dec | Jan-Sep | Jan-Jun | Jan-Mar | ||||||||||||||||||
Networks | 3,171 | 1,609 | 8,010 | 6,398 | 4,788 | 3,064 | ||||||||||||||||||
IT & Cloud | 396 | 201 | 1,002 | 800 | 599 | 383 | ||||||||||||||||||
Other | 396 | 201 | 1,002 | 800 | 599 | 383 | ||||||||||||||||||
|
|
|
|
|
|
|
|
|
|
|
| |||||||||||||
Total | 3,963 | 2,011 | 10,014 | 7,998 | 5,986 | 3,830 | ||||||||||||||||||
|
|
|
|
|
|
|
|
|
|
|
| |||||||||||||
30 Ericsson | Second Quarter Report 2017
Table of Contents
| 2017 | 2016 | |||||||||||||||||||||||
Isolated quarters, SEK million | Q2 | Q1 | Q4 | Q3 | Q2 | Q1 | ||||||||||||||||||
Opening balance | 10,560 | 6,357 | 3,245 | 3,387 | 3,532 | 3,838 | ||||||||||||||||||
Additions | 1,403 | 6,365 | 4,349 | 666 | 839 | 492 | ||||||||||||||||||
Utilization/Cash out | -1,324 | -2,085 | -976 | -716 | -794 | -667 | ||||||||||||||||||
Of which restructuring | -1,075 | -1,586 | -785 | -529 | -639 | -487 | ||||||||||||||||||
Reversal of excess amounts | -65 | -66 | -253 | -129 | -240 | -67 | ||||||||||||||||||
Reclassification, translation difference and other | -162 | -11 | -8 | 37 | 50 | -64 | ||||||||||||||||||
|
|
|
|
|
|
|
|
|
|
|
| |||||||||||||
Closing balance | 10,412 | 10,560 | 6,357 | 3,245 | 3,387 | 3,532 | ||||||||||||||||||
|
|
|
|
|
|
|
|
|
|
|
| |||||||||||||
| 2017 | 2016 | |||||||||||||||||||||||
Year to date, SEK million | Jan-Jun | Jan-Mar | Jan-Dec | Jan-Sep | Jan-Jun | Jan-Mar | ||||||||||||||||||
Opening balance | 6,357 | 6,357 | 3,838 | 3,838 | 3,838 | 3,838 | ||||||||||||||||||
Additions | 7,768 | 6,365 | 6,346 | 1,997 | 1,331 | 492 | ||||||||||||||||||
Utilization/Cash out | -3,409 | -2,085 | -3,153 | -2,177 | -1,461 | -667 | ||||||||||||||||||
Of which restructuring | -2,661 | -1,586 | -2,440 | -1,655 | -1,126 | -487 | ||||||||||||||||||
Reversal of excess amounts | -131 | -66 | -689 | -436 | -307 | -67 | ||||||||||||||||||
Reclassification, translation difference and other | -173 | -11 | 15 | 23 | -14 | -64 | ||||||||||||||||||
|
|
|
|
|
|
|
|
|
|
|
| |||||||||||||
Closing balance | 10,412 | 10,560 | 6,357 | 3,245 | 3,387 | 3,532 | ||||||||||||||||||
|
|
|
|
|
|
|
|
|
|
|
| |||||||||||||
Investments in assets subject to depreciation, amortization, impairment and write-downs
| 2017 | 2016 | |||||||||||||||||||||||
Isolated quarters, SEK million | Q2 | Q1 | Q4 | Q3 | Q2 | Q1 | ||||||||||||||||||
Additions | ||||||||||||||||||||||||
Property, plant and equipment | 1,018 | 1,015 | 1,699 | 1,384 | 1,572 | 1,474 | ||||||||||||||||||
Capitalized development expenses 1) | 315 | 865 | 1,291 | 885 | 1,099 | 1,208 | ||||||||||||||||||
IPR, brands and other intangible assets | 19 | 1 | 0 | -4 | 13 | 5 | ||||||||||||||||||
|
|
|
|
|
|
|
|
|
|
|
| |||||||||||||
Total | 1,352 | 1,881 | 2,990 | 2,265 | 2,684 | 2,687 | ||||||||||||||||||
|
|
|
|
|
|
|
|
|
|
|
| |||||||||||||
Depreciation, amortization and impairment losses | ||||||||||||||||||||||||
Property, plant and equipment | 1,061 | 1,075 | 1,318 | 1,106 | 1,083 | 1,062 | ||||||||||||||||||
Capitalized development expenses | 690 | 2,481 | 652 | 511 | 386 | 351 | ||||||||||||||||||
IPR, brands and other intangible assets | 446 | 1,875 | 640 | 691 | 635 | 684 | ||||||||||||||||||
|
|
|
|
|
|
|
|
|
|
|
| |||||||||||||
Total | 2,197 | 5,431 | 2,610 | 2,308 | 2,104 | 2,097 | ||||||||||||||||||
|
|
|
|
|
|
|
|
|
|
|
| |||||||||||||
| 1) | Including reclassification |
| 2017 | 2016 | |||||||||||||||||||||||
Year to date, SEK million | Jan-Jun | Jan-Mar | Jan-Dec | Jan-Sep | Jan-Jun | Jan-Mar | ||||||||||||||||||
Additions | ||||||||||||||||||||||||
Property, plant and equipment | 2,033 | 1,015 | 6,129 | 4,430 | 3,046 | 1,474 | ||||||||||||||||||
Capitalized development expenses 1) | 1,180 | 865 | 4,483 | 3,192 | 2,307 | 1,208 | ||||||||||||||||||
IPR, brands and other intangible assets | 20 | 1 | 14 | 14 | 18 | 5 | ||||||||||||||||||
|
|
|
|
|
|
|
|
|
|
|
| |||||||||||||
Total | 3,233 | 1,881 | 10,626 | 7,636 | 5,371 | 2,687 | ||||||||||||||||||
|
|
|
|
|
|
|
|
|
|
|
| |||||||||||||
Depreciation, amortization and impairment losses | ||||||||||||||||||||||||
Property, plant and equipment | 2,136 | 1,075 | 4,569 | 3,251 | 2,145 | 1,062 | ||||||||||||||||||
Capitalized development expenses | 3,171 | 2,481 | 1,900 | 1,248 | 737 | 351 | ||||||||||||||||||
IPR, brands and other intangible assets | 2,321 | 1,875 | 2,650 | 2,010 | 1,319 | 684 | ||||||||||||||||||
|
|
|
|
|
|
|
|
|
|
|
| |||||||||||||
Total | 7,628 | 5,431 | 9,119 | 6,509 | 4,201 | 2,097 | ||||||||||||||||||
|
|
|
|
|
|
|
|
|
|
|
| |||||||||||||
| 1) | Including reclassification |
31 Ericsson | Second Quarter Report 2017
Table of Contents
| Apr-Jun | Jan-Jun | Jan-Dec | ||||||||||||||||||
SEK million | 2017 | 2016 | 2017 | 2016 | 2016 | |||||||||||||||
Number of shares and earnings per share | ||||||||||||||||||||
Number of shares, end of period (million) | 3,334 | 3,331 | 3,334 | 3,331 | 3,331 | |||||||||||||||
Of which classA-shares (million) | 262 | 262 | 262 | 262 | 262 | |||||||||||||||
Of which classB-shares (million) | 3,072 | 3,069 | 3,072 | 3,069 | 3,069 | |||||||||||||||
Number of treasury shares, end of period (million) | 58 | 69 | 58 | 69 | 62 | |||||||||||||||
Number of shares outstanding, basic, end of period (million) | 3,276 | 3,262 | 3,276 | 3,262 | 3,269 | |||||||||||||||
Numbers of shares outstanding, diluted, end of period (million) | 3,319 | 3,298 | 3,319 | 3,298 | 3,309 | |||||||||||||||
Average number of treasury shares (million) | 58 | 55 | 59 | 55 | 60 | |||||||||||||||
Average number of shares outstanding, basic (million) | 3,275 | 3,261 | 3,273 | 3,259 | 3,263 | |||||||||||||||
Average number of shares outstanding, diluted (million) 1) | 3,318 | 3,297 | 3,316 | 3,296 | 3,303 | |||||||||||||||
Earnings per share, basic (SEK) | -0.31 | 0.49 | -3.64 | 1.09 | 0.53 | |||||||||||||||
Earnings per share, diluted (SEK) 1) | -0.30 | 0.48 | -3.59 | 1.08 | 0.52 | |||||||||||||||
Earnings per share(Non-IFRS), diluted (SEK) 2) | 0.17 | 0.83 | -2.25 | 1.70 | 2.66 | |||||||||||||||
Ratios | ||||||||||||||||||||
Days sales outstanding | — | — | 114 | 115 | 95 | |||||||||||||||
Inventory turnover days | 86 | 83 | 78 | 81 | 69 | |||||||||||||||
Payable days | 64 | 56 | 60 | 59 | 56 | |||||||||||||||
Equity ratio (%) | — | — | 45.0 | % | 49.3 | % | 49.6 | % | ||||||||||||
Return on equity (%) | -3.2 | % | 4.5 | % | -18.1 | % | 5.0 | % | 1.2 | % | ||||||||||
Return on capital employed (%) | -2.7 | % | 6.0 | % | -14.8 | % | 6.5 | % | 3.2 | % | ||||||||||
Capital turnover (times) | 1.1 | 1.1 | 1.0 | 1.1 | 1.2 | |||||||||||||||
Cash conversion (%) | -0.1 | % | -54.0 | % | 15.3 | % | -62.3 | % | 175.0 | % | ||||||||||
Exchange rates used in the consolidation | ||||||||||||||||||||
SEK/EUR- closing rate | — | — | 9.65 | 9.42 | 9.56 | |||||||||||||||
SEK/USD- closing rate | — | — | 8.46 | 8.45 | 9.06 | |||||||||||||||
Other | ||||||||||||||||||||
Regional inventory, end of period | 19,552 | 18,749 | 19,552 | 18,749 | 16,231 | |||||||||||||||
Export sales from Sweden | 21,697 | 27,797 | 43,157 | 51,051 | 107,036 | |||||||||||||||
| 1) | Potential ordinary shares are not considered when their conversion to ordinary shares would increase earnings per share. |
| 2) | Excluding amortizations and write-downs of acquired intangibles and restructuring charges. |
| 2017 | 2016 | |||||||||||||||||||||||
End of period | Jun 30 | Mar 31 | Dec 31 | Sep 30 | Jun 30 | Mar 31 | ||||||||||||||||||
South East Asia, Oceania and India | 26,748 | 27,221 | 26,570 | 26,453 | 26,725 | 26,602 | ||||||||||||||||||
North East Asia | 12,972 | 12,962 | 13,042 | 13,434 | 13,547 | 13,623 | ||||||||||||||||||
North America | 11,073 | 11,253 | 11,547 | 12,229 | 13,838 | 14,081 | ||||||||||||||||||
Europe and Latin America1) | 53,173 | 54,194 | 54,873 | 56,035 | 56,477 | 55,009 | ||||||||||||||||||
Middle East and Africa | 5,161 | 5,268 | 5,432 | 5,646 | 5,920 | 5,985 | ||||||||||||||||||
|
|
|
|
|
|
|
|
|
|
|
| |||||||||||||
Total | 109,127 | 110,898 | 111,464 | 113,797 | 116,507 | 115,300 | ||||||||||||||||||
|
|
|
|
|
|
|
|
|
|
|
| |||||||||||||
1) Of which in Sweden | 14,483 | 14,712 | 15,303 | 15,872 | 16,190 | 16,290 | ||||||||||||||||||
32 Ericsson | Second Quarter Report 2017
Table of Contents
RESTRUCTURING CHARGES
RESTRUCTURING CHARGES BY FUNCTION
| 2017 | 2016 | |||||||||||||||||||||||
Isolated quarters, SEK million | Q2 | Q1 | Q4 | Q3 | Q2 | Q1 | ||||||||||||||||||
Cost of sales | -927 | -1,460 | -2,140 | -546 | -461 | -328 | ||||||||||||||||||
Research and development expenses | -344 | -214 | -1,531 | -529 | -422 | -257 | ||||||||||||||||||
Selling and administrative expenses | -243 | -69 | -978 | -190 | -138 | -47 | ||||||||||||||||||
|
|
|
|
|
|
|
|
|
|
|
| |||||||||||||
Total | -1,514 | -1,743 | -4,649 | -1,265 | -1,021 | -632 | ||||||||||||||||||
|
|
|
|
|
|
|
|
|
|
|
| |||||||||||||
| 2017 | 2016 | |||||||||||||||||||||||
Year to date, SEK million | Jan-Jun | Jan-Mar | Jan-Dec | Jan-Sep | Jan-Jun | Jan-Mar | ||||||||||||||||||
Cost of sales | -2,387 | -1,460 | -3,475 | -1,335 | -789 | -328 | ||||||||||||||||||
Research and development expenses | -558 | -214 | -2,739 | -1,208 | -679 | -257 | ||||||||||||||||||
Selling and administrative expenses | -312 | -69 | -1,353 | -375 | -185 | -47 | ||||||||||||||||||
|
|
|
|
|
|
|
|
|
|
|
| |||||||||||||
Total | -3,257 | -1,743 | -7,567 | -2,918 | -1,653 | -632 | ||||||||||||||||||
|
|
|
|
|
|
|
|
|
|
|
| |||||||||||||
RESTRUCTURING CHARGES BY SEGMENT
| 2017 | 2016 | |||||||||||||||||||||||
Isolated quarters, SEK million | Q2 | Q1 | Q4 | Q3 | Q2 | Q1 | ||||||||||||||||||
Networks | -930 | -1,447 | -2,430 | -557 | -472 | -434 | ||||||||||||||||||
of which cost of sales | -616 | -1,254 | -1,341 | -365 | -342 | -250 | ||||||||||||||||||
of which operating expenses | -314 | -193 | -1,089 | -192 | -130 | -184 | ||||||||||||||||||
IT & Cloud | -454 | -241 | -1,810 | -604 | -478 | -191 | ||||||||||||||||||
of which cost of sales | -248 | -168 | -671 | -109 | -106 | -76 | ||||||||||||||||||
of which operating expenses | -206 | -73 | -1,139 | -495 | -372 | -115 | ||||||||||||||||||
Other | -130 | -55 | -409 | -104 | -71 | -7 | ||||||||||||||||||
of which cost of sales | -63 | -38 | -128 | -72 | -13 | -2 | ||||||||||||||||||
of which operating expenses | -67 | -17 | -281 | -32 | -58 | -5 | ||||||||||||||||||
|
|
|
|
|
|
|
|
|
|
|
| |||||||||||||
Total | -1,514 | -1,743 | -4,649 | -1,265 | -1,021 | -632 | ||||||||||||||||||
|
|
|
|
|
|
|
|
|
|
|
| |||||||||||||
| 2017 | 2016 | |||||||||||||||||||||||
Year to date, SEK million | Jan-Jun | Jan-Mar | Jan-Dec | Jan-Sep | Jan-Jun | Jan-Mar | ||||||||||||||||||
Networks | -2,377 | -1,447 | -3,893 | -1,463 | -906 | -434 | ||||||||||||||||||
of which cost of sales | -1,870 | -1,254 | -2,298 | -957 | -592 | -250 | ||||||||||||||||||
of which operating expenses | -507 | -193 | -1,595 | -506 | -314 | -184 | ||||||||||||||||||
IT & Cloud | -695 | -241 | -3,083 | -1,273 | -669 | -191 | ||||||||||||||||||
of which cost of sales | -416 | -168 | -962 | -291 | -182 | -76 | ||||||||||||||||||
of which operating expenses | -279 | -73 | -2,121 | -982 | -487 | -115 | ||||||||||||||||||
Other | -185 | -55 | -591 | -182 | -78 | -7 | ||||||||||||||||||
of which cost of sales | -101 | -38 | -215 | -87 | -15 | -2 | ||||||||||||||||||
of which operating expenses | -84 | -17 | -376 | -95 | -63 | -5 | ||||||||||||||||||
|
|
|
|
|
|
|
|
|
|
|
| |||||||||||||
Total | -3,257 | -1,743 | -7,567 | -2,918 | -1,653 | -632 | ||||||||||||||||||
|
|
|
|
|
|
|
|
|
|
|
| |||||||||||||
33 Ericsson | Second Quarter Report 2017
Table of Contents
EXCLUDING RESTRUCTURING BY SEGMENT BY QUARTER
| 2017 | 2016 | |||||||||||||||||||||||
Isolated quarters, SEK million | Q2 | Q1 | Q4 | Q3 | Q2 | Q1 | ||||||||||||||||||
Networks | 10,973 | 9,234 | 13,124 | 10,232 | 12,864 | 13,261 | ||||||||||||||||||
IT & Cloud | 3,076 | -1,932 | 5,347 | 3,942 | 4,167 | 3,357 | ||||||||||||||||||
Other | 811 | 596 | 689 | 832 | 925 | 1,100 | ||||||||||||||||||
|
|
|
|
|
|
|
|
|
|
|
| |||||||||||||
Total | 14,860 | 7,898 | 19,160 | 15,006 | 17,956 | 17,718 | ||||||||||||||||||
|
|
|
|
|
|
|
|
|
|
|
| |||||||||||||
| 2017 | 2016 | |||||||||||||||||||||||
Isolated quarters, As percentage of net sales | Q2 | Q1 | Q4 | Q3 | Q2 | Q1 | ||||||||||||||||||
Networks | 30 | % | 26 | % | 27 | % | 28 | % | 32 | % | 33 | % | ||||||||||||
IT & Cloud | 28 | % | -20 | % | 36 | % | 34 | % | 36 | % | 34 | % | ||||||||||||
Other | 37 | % | 30 | % | 27 | % | 36 | % | 39 | % | 45 | % | ||||||||||||
|
|
|
|
|
|
|
|
|
|
|
| |||||||||||||
Total | 30 | % | 17 | % | 29 | % | 29 | % | 33 | % | 34 | % | ||||||||||||
|
|
|
|
|
|
|
|
|
|
|
| |||||||||||||
| 2017 | 2016 | |||||||||||||||||||||||
Year to date, SEK million | Jan-Jun | Jan-Mar | Jan-Dec | Jan-Sep | Jan-Jun | Jan-Mar | ||||||||||||||||||
Networks | 20,207 | 9,234 | 49,481 | 36,357 | 26,125 | 13,261 | ||||||||||||||||||
IT & Cloud | 1,144 | -1,932 | 16,813 | 11,466 | 7,524 | 3,357 | ||||||||||||||||||
Other | 1,407 | 596 | 3,546 | 2,857 | 2,025 | 1,100 | ||||||||||||||||||
|
|
|
|
|
|
|
|
|
|
|
| |||||||||||||
Total | 22,758 | 7,898 | 69,840 | 50,680 | 35,674 | 17,718 | ||||||||||||||||||
|
|
|
|
|
|
|
|
|
|
|
| |||||||||||||
| 2017 | 2016 | |||||||||||||||||||||||
Year to date, As percentage of net sales | Jan-Jun | Jan-Mar | Jan-Dec | Jan-Sep | Jan-Jun | Jan-Mar | ||||||||||||||||||
Networks | 28 | % | 26 | % | 30 | % | 31 | % | 33 | % | 33 | % | ||||||||||||
IT & Cloud | 6 | % | -20 | % | 35 | % | 35 | % | 35 | % | 34 | % | ||||||||||||
Other | 34 | % | 30 | % | 37 | % | 40 | % | 42 | % | 45 | % | ||||||||||||
|
|
|
|
|
|
|
|
|
|
|
| |||||||||||||
Total | 24 | % | 17 | % | 31 | % | 32 | % | 34 | % | 34 | % | ||||||||||||
|
|
|
|
|
|
|
|
|
|
|
| |||||||||||||
OPERATING INCOME AND OPERATING MARGIN
EXCLUDING RESTRUCTURING BY SEGMENT BY QUARTER
| 2017 | 2016 | |||||||||||||||||||||||
Isolated quarters, SEK million | Q2 | Q1 | Q4 | Q3 | Q2 | Q1 | ||||||||||||||||||
Networks | 3,533 | 909 | 4,810 | 3,396 | 5,261 | 6,196 | ||||||||||||||||||
IT & Cloud | -2,415 | -8,756 | -9 | -1,136 | -1,068 | -1,786 | ||||||||||||||||||
Other | -837 | -2,749 | -432 | -654 | -409 | -303 | ||||||||||||||||||
|
|
|
|
|
|
|
|
|
|
|
| |||||||||||||
Total | 281 | -10,596 | 4,369 | 1,606 | 3,784 | 4,107 | ||||||||||||||||||
|
|
|
|
|
|
|
|
|
|
|
| |||||||||||||
| 2017 | 2016 | |||||||||||||||||||||||
Isolated quarters, As percentage of net sales | Q2 | Q1 | Q4 | Q3 | Q2 | Q1 | ||||||||||||||||||
Networks | 10 | % | 3 | % | 10 | % | 9 | % | 13 | % | 16 | % | ||||||||||||
IT & Cloud | -22 | % | -92 | % | 0 | % | -10 | % | -9 | % | -18 | % | ||||||||||||
Other | -38 | % | -140 | % | -17 | % | -28 | % | -17 | % | -12 | % | ||||||||||||
|
|
|
|
|
|
|
|
|
|
|
| |||||||||||||
Total | 1 | % | -23 | % | 7 | % | 3 | % | 7 | % | 8 | % | ||||||||||||
|
|
|
|
|
|
|
|
|
|
|
| |||||||||||||
| 2017 | 2016 | |||||||||||||||||||||||
Year to date, SEK million | Jan-Jun | Jan-Mar | Jan-Dec | Jan-Sep | Jan-Jun | Jan-Mar | ||||||||||||||||||
Networks | 4,442 | 909 | 19,663 | 14,853 | 11,457 | 6,196 | ||||||||||||||||||
IT & Cloud | -11,171 | -8,756 | -3,999 | -3,990 | -2,854 | -1,786 | ||||||||||||||||||
Other | -3,586 | -2,749 | -1,798 | -1,366 | -712 | -303 | ||||||||||||||||||
|
|
|
|
|
|
|
|
|
|
|
| |||||||||||||
Total | -10,315 | -10,596 | 13,866 | 9,497 | 7,891 | 4,107 | ||||||||||||||||||
|
|
|
|
|
|
|
|
|
|
|
| |||||||||||||
| 2017 | 2016 | |||||||||||||||||||||||
Year to date, As percentage of net sales | Jan-Jun | Jan-Mar | Jan-Dec | Jan-Sep | Jan-Jun | Jan-Mar | ||||||||||||||||||
Networks | 6 | % | 3 | % | 12 | % | 13 | % | 14 | % | 16 | % | ||||||||||||
IT & Cloud | -55 | % | -92 | % | -8 | % | -12 | % | -13 | % | -18 | % | ||||||||||||
Other | -86 | % | -140 | % | -19 | % | -19 | % | -15 | % | -12 | % | ||||||||||||
|
|
|
|
|
|
|
|
|
|
|
| |||||||||||||
Total | -11 | % | -23 | % | 6 | % | 6 | % | 7 | % | 8 | % | ||||||||||||
|
|
|
|
|
|
|
|
|
|
|
| |||||||||||||
34 Ericsson | Second Quarter Report 2017
Table of Contents
ALTERNATIVE PERFORMANCE MEASURES
This section includes a reconciliation of certain Alternative Performance Measures (APMs) to the most directly reconcilable line items in the financial statements. The presentation of APMs has limitations as analytical tools and should not be considered in isolation or as a substitute for related financial measures prepared in accordance with IFRS.
APMs are presented to enhance an investor’s evaluation of ongoing operating results, to aid in forecasting future periods and to facilitate meaningful comparison of results between periods.
Management uses these APMs to, among other things, evaluate ongoing operations in relation to historical results, for internal planning and forecasting purposes and in the calculation of certain performance-based compensation.
The APMs presented in this report may differ from similarly titled measures used by other companies.
For additional information, see Alternative Performance Measures in the Ericsson Annual Report 2016.
SALES GROWTH ADJUSTED FOR COMPARABLE UNITS AND CURRENCY
Sales growth adjusted for the impact of acquisitions and divestments as well as the effects of foreign currency fluctuations.
| 2017 | 2016 | |||||||||||||||||||||||
Isolated quarter, sequential change | Q2 | Q1 | Q4 | Q3 | Q2 | Q1 | ||||||||||||||||||
Reported net sales | 49,939 | 46,369 | 65,215 | 51,076 | 54,108 | 52,209 | ||||||||||||||||||
Acquired/divested business | — | — | — | -63 | -35 | — | ||||||||||||||||||
Net FX impact | 509 | 234 | -2,446 | -1,924 | 1,221 | 766 | ||||||||||||||||||
Comparable net sales, excluding FX impact | 50,448 | 46,603 | 62,769 | 49,089 | 55,294 | 52,975 | ||||||||||||||||||
Sales growth adjusted for comparable units and currency (%) | 9 | % | -29 | % | 23 | % | -9 | % | 6 | % | -28 | % | ||||||||||||
| 2017 | 2016 | |||||||||||||||||||||||
Isolated quarter, year over year change | Q2 | Q1 | Q4 | Q3 | Q2 | Q1 | ||||||||||||||||||
Reported net sales | 49,939 | 46,369 | 65,215 | 51,076 | 54,108 | 52,209 | ||||||||||||||||||
Acquired/divested business | — | — | -49 | -96 | -95 | -73 | ||||||||||||||||||
Net FX impact | -3,006 | -2,435 | -2,528 | -200 | 2,329 | 655 | ||||||||||||||||||
Comparable net sales, excluding FX impact | 46,933 | 43,934 | 62,638 | 50,780 | 56,342 | 52,791 | ||||||||||||||||||
Sales growth adjusted for comparable units and currency (%) | -13 | % | -16 | % | -15 | % | -14 | % | -7 | % | -1 | % | ||||||||||||
| 2017 | 2016 | |||||||||||||||||||||||
Year to date, year over year change | Jan-Jun | Jan-Mar | Jan-Dec | Jan-Sep | Jan-Jun | Jan-Mar | ||||||||||||||||||
Reported net sales | 96,308 | 46,369 | 222,608 | 157,393 | 106,317 | 52,209 | ||||||||||||||||||
Acquired/divested business | — | — | -313 | -264 | -168 | -73 | ||||||||||||||||||
Net FX impact | -5,441 | -2,435 | 254 | 2,783 | 2,983 | 655 | ||||||||||||||||||
Comparable net sales, excluding FX impact | 90,867 | 43,934 | 222,549 | 159,912 | 109,132 | 52,791 | ||||||||||||||||||
Sales growth adjusted for comparable units and currency (%) | -15 | % | -16 | % | -10 | % | -8 | % | -4 | % | -1 | % | ||||||||||||
35 Ericsson | Second Quarter Report 2017
Table of Contents
ITEMS EXCLUDING RESTRUCTURING CHARGES
Gross income, operating expenses, and operating income are presented excluding restructuring charges and, for certain measures, as a percentage of net sales.
| 2017 | 2016 | |||||||||||||||||||||||
Isolated quarters, SEK million | Q2 | Q1 | Q4 | Q3 | Q2 | Q1 | ||||||||||||||||||
Gross income | 13,933 | 6,438 | 17,020 | 14,460 | 17,495 | 17,390 | ||||||||||||||||||
Net sales | 49,939 | 46,369 | 65,215 | 51,076 | 54,108 | 52,209 | ||||||||||||||||||
Gross margin (%) | 27.9 | % | 13.9 | % | 26.1 | % | 28.3 | % | 32.3 | % | 33.3 | % | ||||||||||||
Gross income | 13,933 | 6,438 | 17,020 | 14,460 | 17,495 | 17,390 | ||||||||||||||||||
Restructuring charges included in cost of sales | 927 | 1,460 | 2,140 | 546 | 461 | 328 | ||||||||||||||||||
Gross income, excluding restructuring charges | 14,860 | 7,898 | 19,160 | 15,006 | 17,956 | 17,718 | ||||||||||||||||||
|
|
|
|
|
|
|
|
|
|
|
| |||||||||||||
Net sales | 49,939 | 46,369 | 65,215 | 51,076 | 54,108 | 52,209 | ||||||||||||||||||
Gross margin, excluding restructuring charges (%) | 29.8 | % | 17.0 | % | 29.4 | % | 29.4 | % | 33.2 | % | 33.9 | % | ||||||||||||
Operating expenses | -15,417 | -18,929 | -17,689 | -14,093 | -14,514 | -14,205 | ||||||||||||||||||
Restructuring charges included in R&D expenses | 344 | 214 | 1,531 | 529 | 422 | 257 | ||||||||||||||||||
Restructuring charges included in selling and administrative expenses | 243 | 69 | 978 | 190 | 138 | 47 | ||||||||||||||||||
Operating expenses, excluding restructuring charges | -14,830 | -18,646 | -15,180 | -13,374 | -13,954 | -13,901 | ||||||||||||||||||
Operating income | -1,233 | -12,339 | -280 | 341 | 2,763 | 3,475 | ||||||||||||||||||
Net sales | 49,939 | 46,369 | 65,215 | 51,076 | 54,108 | 52,209 | ||||||||||||||||||
Operating margin (%) | -2.5 | % | -26.6 | % | -0.4 | % | 0.7 | % | 5.1 | % | 6.7 | % | ||||||||||||
Operating income | -1,233 | -12,339 | -280 | 341 | 2,763 | 3,475 | ||||||||||||||||||
Total restructuring charges | 1,514 | 1,743 | 4,649 | 1,265 | 1,021 | 632 | ||||||||||||||||||
Operating income, excluding restructuring charges | 281 | -10,596 | 4,369 | 1,606 | 3,784 | 4,107 | ||||||||||||||||||
|
|
|
|
|
|
|
|
|
|
|
| |||||||||||||
Net sales | 49,939 | 46,369 | 65,215 | 51,076 | 54,108 | 52,209 | ||||||||||||||||||
Operating margin, excluding restructuring charges (%) | 0.6 | % | -22.9 | % | 6.7 | % | 3.1 | % | 7.0 | % | 7.9 | % | ||||||||||||
| 2017 | 2016 | |||||||||||||||||||||||
Year to date, SEK million | Jan-Jun | Jan-Mar | Jan-Dec | Jan-Sep | Jan-Jun | Jan-Mar | ||||||||||||||||||
Gross income | 20,371 | 6,438 | 66,365 | 49,345 | 34,885 | 17,390 | ||||||||||||||||||
Net sales | 96,308 | 46,369 | 222,608 | 157,393 | 106,317 | 52,209 | ||||||||||||||||||
Gross margin (%) | 21.2 | % | 13.9 | % | 29.8 | % | 31.4 | % | 32.8 | % | 33.3 | % | ||||||||||||
Gross income | 20,371 | 6,438 | 66,365 | 49,345 | 34,885 | 17,390 | ||||||||||||||||||
Restructuring charges included in cost of sales | 2,387 | 1,460 | 3,475 | 1,335 | 789 | 328 | ||||||||||||||||||
Gross income, excluding restructuring charges | 22,758 | 7,898 | 69,840 | 50,680 | 35,674 | 17,718 | ||||||||||||||||||
|
|
|
|
|
|
|
|
|
|
|
| |||||||||||||
Net sales | 96,308 | 46,369 | 222,608 | 157,393 | 106,317 | 52,209 | ||||||||||||||||||
Gross margin, excluding restructuring charges (%) | 23.6 | % | 17.0 | % | 31.4 | % | 32.2 | % | 33.6 | % | 33.9 | % | ||||||||||||
Operating expenses | -34,346 | -18,929 | -60,501 | -42,812 | -28,719 | -14,205 | ||||||||||||||||||
Restructuring charges included in R&D expenses | 558 | 214 | 2,739 | 1,208 | 679 | 257 | ||||||||||||||||||
Restructuring charges included in selling and administrative expenses | 312 | 69 | 1,353 | 375 | 185 | 47 | ||||||||||||||||||
Operating expenses, excluding restructuring charges | -33,476 | -18,646 | -56,409 | -41,229 | -27,855 | -13,901 | ||||||||||||||||||
Operating income | -13,572 | -12,339 | 6,299 | 6,579 | 6,238 | 3,475 | ||||||||||||||||||
Net sales | 96,308 | 46,369 | 222,608 | 157,393 | 106,317 | 52,209 | ||||||||||||||||||
Operating margin (%) | -14.1 | % | -26.6 | % | 2.8 | % | 4.2 | % | 5.9 | % | 6.7 | % | ||||||||||||
Operating income | -13,572 | -12,339 | 6,299 | 6,579 | 6,238 | 3,475 | ||||||||||||||||||
Total restructuring charges | 3,257 | 1,743 | 7,567 | 2,918 | 1,653 | 632 | ||||||||||||||||||
Operating income, excluding restructuring charges | -10,315 | -10,596 | 13,866 | 9,497 | 7,891 | 4,107 | ||||||||||||||||||
|
|
|
|
|
|
|
|
|
|
|
| |||||||||||||
Net sales | 96,308 | 46,369 | 222,608 | 157,393 | 106,317 | 52,209 | ||||||||||||||||||
Operating margin, excluding restructuring charges (%) | -10.7 | % | -22.9 | % | 6.2 | % | 6.0 | % | 7.4 | % | 7.9 | % | ||||||||||||
36 Ericsson | Second Quarter Report 2017
Table of Contents
Earnings before interest, taxes, amortization and write-downs of acquired intangibles, also expressed as a percentage of net sales.
| 2017 | 2016 | |||||||||||||||||||||||
Isolated quarters, SEK million | Q2 | Q1 | Q4 | Q3 | Q2 | Q1 | ||||||||||||||||||
Net income | -996 | -10,855 | -1,597 | -180 | 1,566 | 2,106 | ||||||||||||||||||
Taxes | -176 | -1,916 | 634 | -76 | 670 | 903 | ||||||||||||||||||
Financial income and expenses | -61 | 432 | 683 | 597 | 527 | 466 | ||||||||||||||||||
Amortization and write-downs of acquired intangibles | 445 | 1,875 | 640 | 691 | 635 | 684 | ||||||||||||||||||
EBITA | -788 | -10,464 | 360 | 1,032 | 3,398 | 4,159 | ||||||||||||||||||
Net sales | 49,939 | 46,369 | 65,215 | 51,076 | 54,108 | 52,209 | ||||||||||||||||||
EBITA margin (%) | -2 | % | -23 | % | 1 | % | 2 | % | 6 | % | 8 | % | ||||||||||||
| 2017 | 2016 | |||||||||||||||||||||||
Year to date, SEK million | Jan-Jun | Jan-Mar | Jan-Dec | Jan-Sep | Jan-Jun | Jan-Mar | ||||||||||||||||||
Net income | -11,851 | -10,855 | 1,895 | 3,492 | 3,672 | 2,106 | ||||||||||||||||||
Taxes | -2,092 | -1,916 | 2,131 | 1,497 | 1,573 | 903 | ||||||||||||||||||
Financial income and expenses | 371 | 432 | 2,273 | 1,590 | 993 | 466 | ||||||||||||||||||
Amortization and write-downs of acquired intangibles | 2,320 | 1,875 | 2,650 | 2,010 | 1,319 | 684 | ||||||||||||||||||
EBITA | -11,252 | -10,464 | 8,949 | 8,589 | 7,557 | 4,159 | ||||||||||||||||||
Net sales | 96,308 | 46,369 | 222,608 | 157,393 | 106,317 | 52,209 | ||||||||||||||||||
EBITA margin (%) | -12 | % | -23 | % | 4 | % | 5 | % | 7 | % | 8 | % | ||||||||||||
Cash flow from operating activities divided by the sum of net income and adjustments to reconcile net income to cash, expressed as a percentage.
| 2017 | 2016 | |||||||||||||||||||||||
Isolated quarters, SEK million | Q2 | Q1 | Q4 | Q3 | Q2 | Q1 | ||||||||||||||||||
Net income | -996 | -10,855 | -1,597 | -180 | 1,566 | 2,106 | ||||||||||||||||||
Net income reconciled to cash | -833 | -9,249 | 1,557 | 1,498 | 1,321 | 3,631 | ||||||||||||||||||
Cash flow from operating activities | 1 | -1,541 | 19,412 | -2,317 | -713 | -2,372 | ||||||||||||||||||
Cash conversion (%) | -0.1 | % | 16.7 | % | 1,246.8 | % | -154.7 | % | -54.0 | % | -65.3 | % | ||||||||||||
| 2017 | 2016 | |||||||||||||||||||||||
Year to date, SEK million | Jan-Jun | Jan-Mar | Jan-Dec | Jan-Sep | Jan-Jun | Jan-Mar | ||||||||||||||||||
Net income | -11,851 | -10,855 | 1,895 | 3,492 | 3,672 | 2,106 | ||||||||||||||||||
Net income reconciled to cash | -10,082 | -9,249 | 8,007 | 6,450 | 4,952 | 3,631 | ||||||||||||||||||
Cash flow from operating activities | -1,540 | -1,541 | 14,010 | -5,402 | -3,085 | -2,372 | ||||||||||||||||||
Cash conversion (%) | 15.3 | % | 16.7 | % | 175.0 | % | -83.8 | % | -62.3 | % | -65.3 | % | ||||||||||||
GROSS CASH AND NET CASH, END OF PERIOD
Gross cash: Cash and cash equivalents plus interest-bearing securities (current andnon-current).
Net cash: Cash and cash equivalents plus interest-bearing securities (current andnon-current) less interest–bearing liabilities (which include:non-current borrowings and current borrowings).
| 2017 | 2016 | |||||||||||||||||||||||
SEK million | Q2 | Q1 | Q4 | Q3 | Q2 | Q1 | ||||||||||||||||||
Cash and cash equivalents | 21,446 | 32,954 | 36,966 | 24,401 | 28,931 | 35,934 | ||||||||||||||||||
+ Interest-bearing securities, current | 10,754 | 13,548 | 13,325 | 18,663 | 19,846 | 25,077 | ||||||||||||||||||
+ Interest-bearing securities,non-current | 22,122 | 19,124 | 7,586 | 540 | — | — | ||||||||||||||||||
Gross cash, end of period | 54,322 | 65,626 | 57,877 | 43,604 | 48,777 | 61,011 | ||||||||||||||||||
– Borrowings, current | 3,230 | 9,514 | 8,033 | 9,007 | 9,653 | 2,414 | ||||||||||||||||||
– Borrowings,non-current | 27,100 | 27,823 | 18,653 | 18,283 | 18,164 | 22,110 | ||||||||||||||||||
Net cash, end of period | 23,992 | 28,289 | 31,191 | 16,314 | 20,960 | 36,487 | ||||||||||||||||||
37 Ericsson | Second Quarter Report 2017
Table of Contents
Total assets lessnon-interest-bearing provisions and liabilities.
| 2017 | 2016 | |||||||||||||||||||||||
SEK million | Q2 | Q1 | Q4 | Q3 | Q2 | Q1 | ||||||||||||||||||
Total assets | 274,931 | 292,207 | 283,347 | 275,718 | 277,387 | 280,325 | ||||||||||||||||||
Non-interest-bearing provisions and liabilities | ||||||||||||||||||||||||
Provisions,non-current | 4,794 | 4,867 | 946 | 170 | 245 | 158 | ||||||||||||||||||
Deferred tax liabilities | 1,838 | 1,888 | 2,147 | 2,052 | 2,036 | 2,098 | ||||||||||||||||||
Othernon-current liabilities | 2,602 | 2,699 | 2,621 | 2,127 | 2,030 | 1,834 | ||||||||||||||||||
Provisions, current | 5,618 | 5,694 | 5,411 | 3,075 | 3,142 | 3,374 | ||||||||||||||||||
Trade payables | 25,025 | 25,814 | 25,318 | 21,633 | 23,709 | 21,549 | ||||||||||||||||||
Other current liabilities | 57,345 | 63,293 | 56,003 | 52,896 | 54,394 | 55,429 | ||||||||||||||||||
Capital employed | 177,709 | 187,952 | 190,901 | 193,765 | 191,831 | 195,883 | ||||||||||||||||||
Annualized net sales divided by average capital employed.
| 2017 | 2016 | |||||||||||||||||||||||
Isolated quarters, SEK million | Q2 | Q1 | Q4 | Q3 | Q2 | Q1 | ||||||||||||||||||
Net sales | 49,939 | 46,369 | 65,215 | 51,076 | 54,108 | 52,209 | ||||||||||||||||||
Annualized net sales | 199,756 | 185,476 | 260,860 | 204,304 | 216,432 | 208,836 | ||||||||||||||||||
Average capital employed | ||||||||||||||||||||||||
Capital employed at beginning of period | 187,952 | 190,901 | 193,765 | 191,831 | 195,883 | 195,150 | ||||||||||||||||||
Capital employed at end of period | 177,709 | 187,952 | 190,901 | 193,765 | 191,831 | 195,883 | ||||||||||||||||||
Average capital employed | 182,831 | 189,427 | 192,333 | 192,798 | 193,857 | 195,517 | ||||||||||||||||||
Capital turnover (times) | 1.1 | 1.0 | 1.4 | 1.1 | 1.1 | 1.1 | ||||||||||||||||||
| 2017 | 2016 | |||||||||||||||||||||||
Year to date, SEK million | Jan-Jun | Jan-Mar | Jan-Dec | Jan-Sep | Jan-Jun | Jan-Mar | ||||||||||||||||||
Net sales | 96,308 | 46,369 | 222,608 | 157,393 | 106,317 | 52,209 | ||||||||||||||||||
Annualized net sales | 192,616 | 185,476 | 222,608 | 209,857 | 212,634 | 208,836 | ||||||||||||||||||
Average capital employed | ||||||||||||||||||||||||
Capital employed at beginning of period | 190,901 | 190,901 | 195,150 | 195,150 | 195,150 | 195,150 | ||||||||||||||||||
Capital employed at end of period | 177,709 | 187,952 | 190,901 | 193,765 | 191,831 | 195,883 | ||||||||||||||||||
Average capital employed | 184,305 | 189,427 | 193,026 | 194,458 | 193,491 | 195,517 | ||||||||||||||||||
Capital turnover (times) | 1.0 | 1.0 | 1.2 | 1.1 | 1.1 | 1.1 | ||||||||||||||||||
The annualized total of operating income plus financial income as a percentage of average capital employed.
| 2017 | 2016 | |||||||||||||||||||||||
Isolated quarters, SEK million | Q2 | Q1 | Q4 | Q3 | Q2 | Q1 | ||||||||||||||||||
Operating income | -1,233 | -12,339 | -280 | 341 | 2,763 | 3,475 | ||||||||||||||||||
Financial income | -22 | -82 | 61 | -226 | 139 | -89 | ||||||||||||||||||
Annualized operating income + financial income | -5,020 | -49,684 | -876 | 460 | 11,608 | 13,540 | ||||||||||||||||||
Average capital employed | ||||||||||||||||||||||||
Capital employed at beginning of period | 187,952 | 190,901 | 193,765 | 191,831 | 195,883 | 195,150 | ||||||||||||||||||
Capital employed at end of period | 177,709 | 187,952 | 190,901 | 193,765 | 191,831 | 195,883 | ||||||||||||||||||
Average capital employed | 182,831 | 189,427 | 192,333 | 192,798 | 193,857 | 195,517 | ||||||||||||||||||
Return on capital employed (%) | -2.7 | % | -26.2 | % | -0.5 | % | 0.2 | % | 6.0 | % | 6.9 | % | ||||||||||||
| 2017 | 2016 | |||||||||||||||||||||||
Year to date, SEK million | Jan-Jun | Jan-Mar | Jan-Dec | Jan-Sep | Jan-Jun | Jan-Mar | ||||||||||||||||||
Operating income | -13,572 | -12,339 | 6,299 | 6,579 | 6,238 | 3,475 | ||||||||||||||||||
Financial income | -104 | -82 | -115 | -176 | 50 | -89 | ||||||||||||||||||
Annualized operating income + financial income | -27,352 | -49,684 | 6,184 | 8,537 | 12,576 | 13,540 | ||||||||||||||||||
Average capital employed | ||||||||||||||||||||||||
Capital employed at beginning of period | 190,901 | 190,901 | 195,150 | 195,150 | 195,150 | 195,150 | ||||||||||||||||||
Capital employed at end of period | 177,709 | 187,952 | 190,901 | 193,765 | 191,831 | 195,883 | ||||||||||||||||||
Average capital employed | 184,305 | 189,427 | 193,026 | 194,458 | 193,491 | 195,517 | ||||||||||||||||||
Return on capital employed (%) | -14.8 | % | -26.2 | % | 3.2 | % | 4.4 | % | 6.5 | % | 6.9 | % | ||||||||||||
38 Ericsson | Second Quarter Report 2017
Table of Contents
Equity, expressed as a percentage of total assets.
| 2017 | 2016 | |||||||||||||||||||||||
SEK million | Q2 | Q1 | Q4 | Q3 | Q2 | Q1 | ||||||||||||||||||
Total equity | 123,755 | 126,841 | 140,492 | 134,012 | 136,691 | 145,644 | ||||||||||||||||||
Total assets | 274,931 | 292,207 | 283,347 | 275,718 | 277,387 | 280,325 | ||||||||||||||||||
Equity ratio (%) | 45.0 | % | 43.4 | % | 49.6 | % | 48.6 | % | 49.3 | % | 52.0 | % | ||||||||||||
Annualized net income attributable to stockholders of the Parent Company as a percentage of average Stockholders’ equity.
| 2017 | 2016 | |||||||||||||||||||||||
Isolated quarters, SEK million | Q2 | Q1 | Q4 | Q3 | Q2 | Q1 | ||||||||||||||||||
Net income attributable to stockholders of the parent company | -1,010 | -10,897 | -1,604 | -233 | 1,587 | 1,966 | ||||||||||||||||||
Annualized | -4,040 | -43,588 | -6,416 | -932 | 6,348 | 7,864 | ||||||||||||||||||
Average stockholders’ equity | ||||||||||||||||||||||||
Stockholders’ equity, beginning of period | 126,105 | 139,817 | 133,138 | 135,746 | 144,699 | 146,525 | ||||||||||||||||||
Stockholders’ equity, end of period | 123,045 | 126,105 | 139,817 | 133,138 | 135,746 | 144,699 | ||||||||||||||||||
Average stockholders’ equity | 124,575 | 132,961 | 136,478 | 134,442 | 140,223 | 145,612 | ||||||||||||||||||
Return on equity (%) | -3.2 | % | -32.8 | % | -4.7 | % | -0.7 | % | 4.5 | % | 5.4 | % | ||||||||||||
| 2017 | 2016 | |||||||||||||||||||||||
Year to date, SEK million | Jan-Jun | Jan-Mar | Jan-Dec | Jan-Sep | Jan-Jun | Jan-Mar | ||||||||||||||||||
Net income attributable to stockholders of the parent company | -11,907 | -10,897 | 1,716 | 3,320 | 3,553 | 1,966 | ||||||||||||||||||
Annualized | -23,814 | -43,588 | 1,716 | 4,427 | 7,106 | 7,864 | ||||||||||||||||||
Average stockholders’ equity | ||||||||||||||||||||||||
Stockholders’ equity, beginning of period | 139,817 | 139,817 | 146,525 | 146,525 | 146,525 | 146,525 | ||||||||||||||||||
Stockholders’ equity, end of period | 123,045 | 126,105 | 139,817 | 133,138 | 135,746 | 144,699 | ||||||||||||||||||
Average stockholders’ equity | 131,431 | 132,961 | 143,171 | 139,832 | 141,136 | 145,612 | ||||||||||||||||||
Return on equity (%) | -18.1 | % | -32.8 | % | 1.2 | % | 3.2 | % | 5.0 | % | 5.4 | % | ||||||||||||
EPS, diluted, excluding amortizations and write-down of acquired intangible assets and excluding restructuring charges.
| 2017 | 2016 | |||||||||||||||||||||||
Isolated quarters, SEK | Q2 | Q1 | Q4 | Q3 | Q2 | Q1 | ||||||||||||||||||
EPS diluted | -0.30 | -3.29 | -0.48 | -0.07 | 0.48 | 0.60 | ||||||||||||||||||
Restructuring charges | 0.38 | 0.45 | 0.97 | 0.27 | 0.22 | 0.13 | ||||||||||||||||||
Amortization and write-downs of acquired intangibles | 0.09 | 0.42 | 0.13 | 0.14 | 0.13 | 0.14 | ||||||||||||||||||
EPS(Non-IFRS) | 0.17 | -2.42 | 0.62 | 0.34 | 0.83 | 0.87 | ||||||||||||||||||
| 2017 | 2016 | |||||||||||||||||||||||
Year to date, SEK | Jan-Jun | Jan-Mar | Jan-Dec | Jan-Sep | Jan-Jun | Jan-Mar | ||||||||||||||||||
EPS diluted | -3.59 | -3.29 | 0.52 | 1.01 | 1.08 | 0.60 | ||||||||||||||||||
Restructuring charges | 0.83 | 0.45 | 1.59 | 0.62 | 0.35 | 0.13 | ||||||||||||||||||
Amortization and write-downs of acquired intangibles | 0.51 | 0.42 | 0.55 | 0.41 | 0.27 | 0.14 | ||||||||||||||||||
EPS(Non-IFRS) | -2.25 | -2.42 | 2.66 | 2.04 | 1.70 | 0.87 | ||||||||||||||||||
39 Ericsson | Second Quarter Report 2017
Table of Contents
ITEMS EXCLUDING RESTRUCTURING, WRITE-DOWNS AS WELL AS PROVISIONS AND ADJUSTMENTS RELATED TO CERTAIN CUSTOMER PROJECTS
Net sales, gross income, research and development expenses, selling and administrative expenses and operating income are presented excluding restructuring charges, write-down of assets as well as provisions and adjustments related to certain customer projects. Numbers excluding these items are referred to as “adjusted”. Certain measures are also expressed as a percentage of adjusted net sales.
| 2017 | 2016 | |||||||||||||||||||||||
Isolated quarters, SEK million | Q2 | Q1 | Q4 | Q3 | Q2 | Q1 | ||||||||||||||||||
Net sales | 49,939 | 46,369 | 65,215 | 51,076 | 54,108 | 52,209 | ||||||||||||||||||
Adjustments related to certain customer projects | — | 1,420 | — | — | — | — | ||||||||||||||||||
Adjusted net sales | 49,939 | 47,789 | 65,215 | 51,076 | 54,108 | 52,209 | ||||||||||||||||||
|
|
|
|
|
|
|
|
|
|
|
| |||||||||||||
Gross income | 13,933 | 6,438 | 17,020 | 14,460 | 17,495 | 17,390 | ||||||||||||||||||
Restructuring charges included in cost of sales | 927 | 1,460 | 2,140 | 546 | 461 | 328 | ||||||||||||||||||
Provisions and adjustments related to certain customer projects impacting gross income | — | 6,697 | — | — | — | — | ||||||||||||||||||
Adjusted gross income | 14,860 | 14,595 | 19,160 | 15,006 | 17,956 | 17,718 | ||||||||||||||||||
|
|
|
|
|
|
|
|
|
|
|
| |||||||||||||
Adjusted net sales | 49,939 | 47,789 | 65,215 | 51,076 | 54,108 | 52,209 | ||||||||||||||||||
Adjusted gross margin (%) | 29.8 | % | 30.5 | % | 29.4 | % | 29.4 | % | 33.2 | % | 33.9 | % | ||||||||||||
|
|
|
|
|
|
|
|
|
|
|
| |||||||||||||
Research and development expenses | –8,365 | –9,068 | –8,890 | –7,855 | –7,405 | –7,485 | ||||||||||||||||||
Restructuring charges included in R&D expenses | 344 | 214 | 1,531 | 529 | 422 | 257 | ||||||||||||||||||
Write-down of assets included in R&D expenses | — | 1,934 | — | — | — | — | ||||||||||||||||||
Provisions and adjustments related to certain customer projects included in R&D expenses | — | 217 | — | — | — | — | ||||||||||||||||||
Adjusted research and development expenses | –8,021 | –6,703 | –7,359 | –7,326 | –6,983 | –7,228 | ||||||||||||||||||
|
|
|
|
|
|
|
|
|
|
|
| |||||||||||||
Selling and administrative expenses | –7,052 | –9,861 | –8,799 | –6,238 | –7,109 | –6,720 | ||||||||||||||||||
Restructuring charges included in selling and administrative expenses | 243 | 69 | 978 | 190 | 138 | 47 | ||||||||||||||||||
Write-down of assets included in selling and administrative expenses | — | 1,362 | — | — | — | — | ||||||||||||||||||
Provisions and adjustments related to certain customer projects included in selling and administrative expenses | — | 1,479 | — | — | — | — | ||||||||||||||||||
Adjusted selling and administrative expenses | –6,809 | –6,951 | –7,821 | –6,048 | –6,971 | –6,673 | ||||||||||||||||||
|
|
|
|
|
|
|
|
|
|
|
| |||||||||||||
Operating income | –1,233 | –12,339 | –280 | 341 | 2,763 | 3,475 | ||||||||||||||||||
Total restructuring charges | 1,514 | 1,743 | 4,649 | 1,265 | 1,021 | 632 | ||||||||||||||||||
Total write-down of assets | — | 3,296 | — | — | — | — | ||||||||||||||||||
Total provisions and adjustments related to certain customer projects | — | 8,393 | — | — | — | — | ||||||||||||||||||
Adjusted operating income | 281 | 1,093 | 4,369 | 1,606 | 3,784 | 4,107 | ||||||||||||||||||
|
|
|
|
|
|
|
|
|
|
|
| |||||||||||||
Adjusted net sales | 49,939 | 47,789 | 65,215 | 51,076 | 54,108 | 52,209 | ||||||||||||||||||
Adjusted operating margin (%) | 0.6 | % | 2.3 | % | 6.7 | % | 3.1 | % | 7.0 | % | 7.9 | % | ||||||||||||
|
|
|
|
|
|
|
|
|
|
|
| |||||||||||||
40 Ericsson | Second Quarter Report 2017
Table of Contents
ITEMS EXCLUDING RESTRUCTURING, WRITE-DOWNS AS WELL AS PROVISIONS AND ADJUSTMENTS RELATED TO CERTAIN CUSTOMER PROJECTS
Net sales, gross income, research and development expenses, selling and administrative expenses and operating income are presented excluding restructuring charges, write-down of assets as well as provisions and adjustments related to certain customer projects. Numbers excluding these items are referred to as “adjusted”. Certain measures are also expressed as a percentage of adjusted net sales.
| 2017 | 2016 | |||||||||||||||||||||||
Year to date, SEK million | Jan-Jun | Jan-Mar | Jan-Dec | Jan-Sep | Jan-Jun | Jan-Mar | ||||||||||||||||||
Net sales | 96,308 | 46,369 | 222,608 | 157,393 | 106,317 | 52,209 | ||||||||||||||||||
Adjustments related to certain customer projects | 1,420 | 1,420 | — | — | — | — | ||||||||||||||||||
Adjusted net sales | 97,728 | 47,789 | 222,608 | 157,393 | 106,317 | 52,209 | ||||||||||||||||||
Gross income | 20,371 | 6,438 | 66,365 | 49,345 | 34,885 | 17,390 | ||||||||||||||||||
Restructuring charges included in cost of sales | 2,387 | 1,460 | 3,475 | 1,335 | 789 | 328 | ||||||||||||||||||
Provisions and adjustments related to certain customer projects impacting gross income | 6,697 | 6,697 | — | — | — | — | ||||||||||||||||||
Adjusted gross income | 29,455 | 14,595 | 69,840 | 50,680 | 35,674 | 17,718 | ||||||||||||||||||
|
|
|
|
|
|
|
|
|
|
|
| |||||||||||||
Adjusted net sales | 97,728 | 47,789 | 222,608 | 157,393 | 106,317 | 52,209 | ||||||||||||||||||
Adjusted gross margin (%) | 30.1 | % | 30.5 | % | 31.4 | % | 32.2 | % | 33.6 | % | 33.9 | % | ||||||||||||
Research and development expenses | -17,433 | -9,068 | -31,635 | -22,745 | -14,890 | -7,485 | ||||||||||||||||||
Restructuring charges included in R&D expenses | 558 | 214 | 2,739 | 1,208 | 679 | 257 | ||||||||||||||||||
Write-down of assets included in R&D expenses | 1,934 | 1,934 | — | — | — | — | ||||||||||||||||||
Provisions and adjustments related to certain customer projects included in R&D expenses | 217 | 217 | — | — | — | — | ||||||||||||||||||
Adjusted research and development expenses | -14,724 | -6,703 | -28,896 | -21,537 | -14,211 | -7,228 | ||||||||||||||||||
Selling and administrative expenses | -16,913 | -9,861 | -28,866 | -20,067 | -13,829 | -6,720 | ||||||||||||||||||
Restructuring charges included in selling and administrative expenses | 312 | 69 | 1,353 | 375 | 185 | 47 | ||||||||||||||||||
Write-down of assets included in selling and administrative expenses | 1,362 | 1,362 | — | — | — | — | ||||||||||||||||||
Provisions and adjustments related to certain customer projects included in selling and administrative expenses | 1,479 | 1,479 | — | — | — | — | ||||||||||||||||||
Adjusted selling and administrative expenses | -13,760 | -6,951 | -27,513 | -19,692 | -13,644 | -6,673 | ||||||||||||||||||
Operating income | -13,572 | -12,339 | 6,299 | 6,579 | 6,238 | 3,475 | ||||||||||||||||||
Total restructuring charges | 3,257 | 1,743 | 7,567 | 2,918 | 1,653 | 632 | ||||||||||||||||||
Total write-down of assets | 3,296 | 3,296 | — | — | — | — | ||||||||||||||||||
Total provisions and adjustments related to certain customer projects | 8,393 | 8,393 | — | — | — | — | ||||||||||||||||||
Adjusted operating income | 1,374 | 1,093 | 13,866 | 9,497 | 7,891 | 4,107 | ||||||||||||||||||
|
|
|
|
|
|
|
|
|
|
|
| |||||||||||||
Adjusted net sales | 97,728 | 47,789 | 222,608 | 157,393 | 106,317 | 52,209 | ||||||||||||||||||
Adjusted operating margin (%) | 1.4 | % | 2.3 | % | 6.2 | % | 6.0 | % | 7.4 | % | 7.9 | % | ||||||||||||
41 Ericsson | Second Quarter Report 2017