Table of Contents
SECURITIES AND EXCHANGE COMMISSION
Washington, D.C. 20549
FORM6-K
REPORT OF FOREIGN ISSUER
Pursuant to Rule13a-16 or15d-16 of
the Securities Exchange Act of 1934
July 18, 2018
Commission File Number
000-12033
LM ERICSSON TELEPHONE COMPANY
(Translation of registrant’s name into English)
Torshamnsgatan 21, Kista
SE-164 83, Stockholm, Sweden
(Address of principal executive offices)
Indicate by check mark whether the registrant files or will file annual reports under cover Form20-F or Form40-F. Form20-F ☒ Form40-F ☐
Indicate by check mark if the registrant is submitting the Form6-K in paper as permitted by RegulationS-T Rule 101(b)(1): ☐
Indicate by check mark if the registrant is submitting the Form6-K in paper as permitted by RegulationS-T Rule 101(b)(7): ☐
Announcement of LM Ericsson Telephone Company, July 18, 2018 regarding “Ericsson reports second quarter results 2018”.
Table of Contents
SIGNATURES
Pursuant to the requirements of the Securities Exchange Act of 1934, the registrant has duly caused this report to be signed on its behalf by the undersigned, thereunto duly authorized.
TELEFONAKTIEBOLAGET LM ERICSSON (publ) | ||
By: | /s/ XAVIER DEDULLEN | |
| Xavier Dedullen | ||
| Senior Vice President, Chief Legal Officer | ||
By: | /s/ CARL MELLANDER | |
| Carl Mellander | ||
| Senior Vice President, Chief Financial Officer | ||
Date:July 18, 2018
Table of Contents

Second quarter report 2018
Stockholm, July 18, 2018
| Second quarter highlights | ||
| • | Sales as reported and sales adjusted for comparable units and currency both decreased by-1% YoY. Segment Networks showed a sales growth of 2% YoY, both in reported sales and sales adjusted for comparable units and currency, with strong sales growth in North America. | |
| • | Gross margin was 34.8% (29.1%). Gross margin excluding restructuring charges improved to 36.7% (30.9%), driven mainly by cost reductions and the continuedramp-up of Ericsson Radio System (ERS). | |
| • | Operating expenses were SEK 17.2 (15.4) b. Operating expenses excluding restructuring charges increased to SEK 16.3 (14.8) b. Cost reductions in SG&A were offset by increased investments in R&D, higher provision for variable compensation and an increase in provision for overdue trade receivables. | |
| • | Operating income was SEK 0.2(-0.5) b. Operating income excluding restructuring charges was SEK 2.0 (1.0) b. | |
| • | Networks operating margin excluding restructuring charges was 13.3% (13.4%), with an improved gross margin offset by increased investments in R&D. | |
| • | Digital Services operating income (loss) excluding restructuring charges improved to SEK-1.5(-1.8) b. due to improved gross margin to 42.6% (35.7%), mainly driven by cost reductions. | |
| • | Managed Services operating margin excluding restructuring charges improved to 6.5%(-2.1%) as a result of cost reductions and customer contract reviews. | |
| • | Cash flow from operating activities was SEK 1.4 (0.0) b. and free cash flow was SEK-0.6(-1.3) b. Net cash increased to SEK 33.1 (24.0) b. | |
| Q2 | Q2 | YoY | Q1 | QoQ | 6 months | 6 months | ||||||||||||||||||||||
SEK b. | 2018 | 2017 | change | 2018 | change | 2018 | 2017 | |||||||||||||||||||||
Net sales | 49.8 | 50.3 | -1 | % | 43.4 | 15 | % | 93.2 | 98.1 | |||||||||||||||||||
Sales growth adj. for comparable units and currency | — | — | -1 | % | — | 9 | % | — | — | |||||||||||||||||||
Gross margin | 34.8 | % | 29.1 | % | — | 34.2 | % | — | 34.5 | % | 22.6 | % | ||||||||||||||||
Operating income (loss) | 0.2 | -0.5 | — | -0.3 | — | -0.1 | -11.8 | |||||||||||||||||||||
Operating margin | 0.3 | % | -1.1 | % | — | -0.7 | % | — | -0.2 | % | -12.0 | % | ||||||||||||||||
Net income (loss) | -1.8 | -0.5 | — | -0.7 | — | -2.5 | -10.5 | |||||||||||||||||||||
EPS diluted, SEK | -0.58 | -0.14 | — | -0.25 | — | -0.83 | -3.22 | |||||||||||||||||||||
EPS(non-IFRS), SEK1) | -0.09 | 0.33 | — | 0.11 | — | 0.02 | -1.86 | |||||||||||||||||||||
Cash flow from operating activities | 1.4 | 0.0 | — | 1.6 | -8 | % | 3.0 | -1.5 | ||||||||||||||||||||
Free cash flow2) | -0.6 | -1.3 | -54 | % | 0.3 | — | -0.3 | -4.6 | ||||||||||||||||||||
Net cash, end of period | 33.1 | 24.0 | 38 | % | 35.6 | -7 | % | 33.1 | 24.0 | |||||||||||||||||||
Gross margin excluding restructuring charges | 36.7 | % | 30.9 | % | — | 35.9 | % | — | 36.3 | % | 25.0 | % | ||||||||||||||||
Operating income (loss) excluding restructuring charges | 2.0 | 1.0 | 109 | % | 0.9 | 138 | % | 2.9 | -8.6 | |||||||||||||||||||
Operating margin excluding restructuring charges | 4.1 | % | 1.9 | % | — | 2.0 | % | — | 3.1 | % | -8.7 | % | ||||||||||||||||
| 1) | EPS diluted, excl. amortizations and write-downs of acquired intangible assets, and excluding restructuring charges. When a company reports a loss, the number of shares used for calculating earnings diluted per share shall be the same as for basic calculation. |
| 2) | Free cash flow: Cash flow from operating activities less net capital expenditures and other investments, see Alternative Performance Measures (APM) at the end of the report. |
Non-IFRS financial measures are reconciled to the most directly reconcilable line items in the financial statements at the end of this report.
1 Ericsson | Second Quarter Report 2018 |
Table of Contents
CEO comments
“We continue to execute on our focused business strategy and are tracking well towards our 2020 target of an operating margin1) of at least 10%. The investments in technology leadership have resultedin increased gross margin1) to 37% (31%) and growth in segment Networks.
Customers turn to new technology in order to manage growing demand for data with sustained quality and without increasing costs. This, together with fixed wireless access, represent the first business cases for 5G. We will continue to invest in securing leadership in 5G. This includes further investments in R&D, to solidify our complete 5G portfolio, and investments in field trials. We also intend to selectively capture new business opportunities, through our5G-ready 4G portfolio, to extend our footprint as operators prepare for 5G. We provide solutions for all frequency bands for 5G, which strengthens our global competitiveness.
We have good market traction in Networks, with a sales growth of 2%, particularly in North America where all major operators are preparing for 5G. Networks gross margin1) improved to 40% (36%). Digital Services is tracking towards a turnaround and gross margin1)improved to 43% (36%) YoY, and was stable QoQ. However, while losses decreased both YoY and QoQ, we still have a lot of work to do. The top priority is to turn around performance in the segment, but we are in parallel accelerating investments to make the portfolio 5G ready and cloud native. In Managed Services, gross margin1) improved to 14% (2%) supported by continued efficiency gains and customer contract reviews, resulting in a positive operating income. We have alsoon-boarded several new contracts in the quarter.
In segment Emerging Business and Other, we invest in strategic future growth areas such as Internet of Things (IoT). We see increasing momentum with several important customer wins with our connectivity platform in the quarter. However, sales are still low. Our media business generated a loss of SEK-0.4 b. in the quarter. We expect to close the announced divestment of Media Solutions, recently renamed MediaKind, by the end of the third quarter.
The SEK 10 b. cost reduction program, launched in Q2 2017, has been successfully completed. We reduced the total workforce by more than 2,000 in the quarter and by 20,500 in total as part of the program. These are tough but necessary actions to ensure competitiveness.Run-rate savings to date amount to more than SEK 10 b., and the effect is gradually becoming visible in the earnings, mainly through lower service delivery costs and common costs. Even though the cost reduction program is completed, our estimate for restructuring charges of SEK5-7 b. for the full year remains, as we will continue our efficiency activities throughout the year.
Free cash flow improved to SEK-0.6(-1.3) b. and our cash position remains strong. Our work to further strengthen the balance sheet continues.
We see strengthened momentum for 5G in the quarter and it is clear that our5G-ready portfolio is attractive and competitive in the market. We have gradually improved the cost position and will continue to have a strict cost focus in order to further increase competitiveness and efficiency. We are confident in reaching our long-term target of at least 12% operating margin1) beyond 2020.”
Börje Ekholm
President and CEO
| 1) | Excluding restructuring charges |
Planning assumptions going forward
Market related
| • | The Radio Access Network (RAN) equipment market is estimated to decline by-2% for full-year 2018 with 2% CAGR for 2017-2022. In 2018, the Chinese market is expected to decline due to reduced LTE investments, while there is positive momentum in North America. |
Currency exposure
| • | Rule of thumb: A weakening by 10% of USD to SEK would have a negative impact of approximately-5% on net sales and approximately-1 percentage point on operating margin (based on 2017 full-year currency exposure). For historical rates, see www.ericsson.com/en/investors |
Ericsson related, 2018
| • | Sales: Seasonality(5-year average sales) is-2% between Q2 and Q3 and 23% between Q3 and Q4. |
| • | The current annual revenue baseline of the IPR licensing contract portfolio is approximately SEK 7 b. |
| • | Restructuring charges for full-year 2018 are estimated to be SEK5-7 b. |
| • | Actual and estimated net impact from amortization and capitalization of development expenses and from recognition and deferral of hardware costs: |
Q2 2018 | Q3 2018 | Q3 2017 | FY 2017 | FY 2018 | FY 2019 | |||||||||||||||||||
SEK b. | Actual | Estimate | Actual | Actual | Estimate | Estimate | ||||||||||||||||||
Cost of sales | -0.2 | -0.2 | -0.9 | -2.6 | -1 | |||||||||||||||||||
R&D expenses | -0.3 | -0.3 | -0.6 | -0.3 | -1 | |||||||||||||||||||
|
|
|
|
|
|
|
|
|
|
|
| |||||||||||||
Total impact | -0.5 | -0.5 | -1.5 | -2.9 | -2 | -1 to -2 | ||||||||||||||||||
|
|
|
|
|
|
|
|
|
|
|
| |||||||||||||
| • | The divestment of Media Solutions is expected to be closed by the end of Q3 2018 with estimated additional expenses of SEK-0.3 b. in Q3, related to the divestment.Results after the divestment will be reported as share of earnings according to the equity method. Ericsson’s holding will be 49% of the shares. Media Solutions sales were SEK 3.2 b. in 2017. |
2 Ericsson | Second Quarter Report 2018 |
CEO comments |
Table of Contents
Financial highlights
SEK b. | Q2 2018 | Q2 2017 | YoY change | Q1 2018 | QoQ change | 6 months 2018 | 6 months 2017 | |||||||||||||||||||||
Net sales | 49.8 | 50.3 | -1 | % | 43.4 | 15 | % | 93.2 | 98.1 | |||||||||||||||||||
Sales growth adj. for comparable units and currency | — | — | -1 | % | — | 9 | % | — | — | |||||||||||||||||||
Gross income | 17.3 | 14.6 | 18 | % | 14.9 | 17 | % | 32.2 | 22.1 | |||||||||||||||||||
Gross margin (%) | 34.8 | % | 29.1 | % | — | 34.2 | % | — | 34.5 | % | 22.6 | % | ||||||||||||||||
Research and development expenses | -9.8 | -8.4 | 17 | % | -9.1 | 8 | % | -18.9 | -17.4 | |||||||||||||||||||
Selling and administrative expenses | -7.1 | -6.8 | 3 | % | -6.2 | 15 | % | -13.2 | -15.0 | |||||||||||||||||||
Impairment losses on trade receivables | -0.4 | -0.2 | 57 | % | 0.0 | — | -0.4 | -1.9 | ||||||||||||||||||||
Other operating income and expenses | 0.0 | 0.2 | -95 | % | 0.1 | -87 | % | 0.1 | 0.4 | |||||||||||||||||||
Operating income (loss) | 0.2 | -0.5 | — | -0.3 | — | -0.1 | -11.8 | |||||||||||||||||||||
Operating margin (%) | 0.3 | % | -1.1 | % | — | -0.7 | % | — | -0.2 | % | -12.0 | % | ||||||||||||||||
Financial net | -0.8 | 0.1 | — | -0.5 | 50 | % | -1.4 | -0.4 | ||||||||||||||||||||
Taxes | -1.2 | 0.0 | — | 0.1 | — | -1.0 | 1.7 | |||||||||||||||||||||
Net income (loss) | -1.8 | -0.5 | — | -0.7 | — | -2.5 | -10.5 | |||||||||||||||||||||
Restructuring charges | -1.9 | -1.5 | 24 | % | -1.2 | 60 | % | -3.1 | -3.3 | |||||||||||||||||||
Gross income excluding restructuring charges | 18.3 | 15.6 | 17 | % | 15.6 | 17 | % | 33.9 | 24.5 | |||||||||||||||||||
Gross margin excluding restructuring charges | 36.7 | % | 30.9 | % | — | 35.9 | % | — | 36.3 | % | 25.0 | % | ||||||||||||||||
Operating expenses excluding restructuring charges | -16.3 | -14.8 | 10 | % | -14.8 | 10 | % | -31.1 | -33.5 | |||||||||||||||||||
Operating income (loss) excl. restructuring charges | 2.0 | 1.0 | 109 | % | 0.9 | 138 | % | 2.9 | -8.6 | |||||||||||||||||||
Operating margin excluding restructuring charges | 4.1 | % | 1.9 | % | — | 2.0 | % | — | 3.1 | % | -8.7 | % | ||||||||||||||||
Net sales
Sales as reported decreased by-1 %YoY. Sales adjusted for comparable units and currency decreased by-1% YoY. Sales as reported in Networks increased by 2% YoY, driven by strong sales growth in North America. Digital Services sales declined by-11% YoY, mainly due to continued decline in legacy product sales and lower telecom core sales in North East Asia. Managed Services sales declined by-2% YoY, mainly as a result of customer contract reviews. Sales in Emerging Business and Other increased by 2% YoY, mainly driven by growth in iconectiv and IoT partly offset by lower sales in the media solutions business.
Sequential sales increased by 15%. Sales adjusted for comparable units and currency increased by 9% QoQ.
IPR licensing revenues
IPR licensing revenues declined to SEK 1.8 (2.0) b. YoY and decreased sequentially from SEK 1.9 b.
Gross margin
Gross margin improved to 34.8% (29.1%). Gross margin excluding restructuring charges increased to 36.7% (30.9%) with significant improvements in all segments. Key drivers of the improvement were cost reductions,ramp-up of Ericsson Radio System (ERS) product platform, market mix and good progress in addressingnon-strategic contracts in Managed Services. Completion in 2017 of the amortization of software release development expenses had a positive effect on gross margin YoY.
Sequentially, gross margin increased to 34.8% from 34.2%. Gross margin excluding restructuring charges improved sequentially to 36.7% from 35.9%.
Operating expenses
Operating expenses increased to SEK 17.2 (15.4) b. Operating expenses excluding restructuring charges increased to SEK 16.3 (14.8) b., mainly due to increased R&D expenses while selling and administrative expenses (SG&A) were stable YoY.
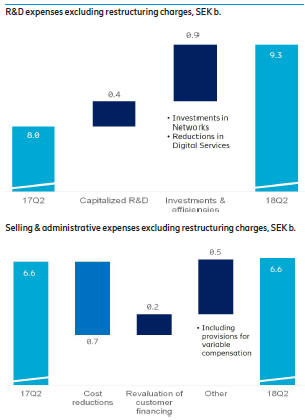
R&D expenses were SEK 9.8 (8.4) b. R&D expenses excluding restructuring charges increased to SEK 9.3 (8.0) b., mainly due to increased 4G and 5G investments in Networks, in line with the strategy. The net effect of higher amortized than capitalized R&D expenses was SEK-0.3 (0.1) b.
SG&A increased YoY due to higher restructuring charges. SG&A excluding restructuring charges were flat at SEK 6.6 b. YoY. Cost reductions of SEK 0.7 b. YoY were offset by costs related to revaluation of customer financing of SEK-0.2 b. and higher provision for variable compensation.
3 Ericsson | Second Quarter Report 2018 |
Financial highlights |
Table of Contents
Each quarter, 25% of the anticipated full year variable compensation is provisioned for. In Q2 2017, SG&A were positively impacted as provisions were reversed following the weak company results.
Impairment losses on trade receivables increased to SEK-0.4(-0.2) b. Impairment testing is made continuously using a methodology where country and customer risks are assessed.
Operating expenses increased sequentially following increased investments in Networks R&D, impacted by seasonality and currency effects. Operating expenses increased by approximately SEK-0.3 b. QoQ, due to currency effects.
Other operating income and expenses
Other operating income and expenses, which comprises several minor items, were SEK 0.0 (0.2) b. Other operating income and expenses in Q1 2018 were SEK 0.1 b.
Consequences of technology and portfolio shifts
Due to technology and portfolio shifts, the company is reducing the capitalization of development expenses for product platforms and software releases as well as the deferral of hardware costs. As a consequence, higher amortization than capitalization of development expenses and higher recognition than deferral of hardware costs had a negative impact on operating income YoY. The amounts related to capitalized software releases were fully amortized in 2017.
Net impact from amortization and capitalization of development expenses and from recognition and deferral of hardware costs
SEK b. | Q2 2018 | Q2 2017 | Q1 2018 | |||||||||
Cost of sales | -0.2 | -0.4 | -0.3 | |||||||||
R&D expenses | -0.3 | 0.1 | -0.4 | |||||||||
|
|
|
|
|
| |||||||
Total impact | -0.5 | -0.3 | -0.7 | |||||||||
|
|
|
|
|
| |||||||
Restructuring charges
Restructuring charges were SEK-1.9(-1.5) b. Restructuring charges in Q1 2018 were SEK-1.2 b.
Operating income and margin
Operating income increased to SEK 0.2(-0.5) b. YoY. Operating income excluding restructuring charges increased to 2.0 (1.0) b. driven by increased gross margin partly offset by increased R&D expenses. Operating margin excluding restructuring charges improved to 4.1% (1.9%).
Operating income improved sequentially to SEK 0.2 b. from-0.3 b. Operating income excluding restructuring charges improved to SEK 2.0 b. from SEK 0.9 b., driven by higher sales and increased gross margin. This was partly offset by increased operating expenses.
Financial net
Financial net was SEK-0.8 (0.1) b. mainly due to negative revaluation and realization effects of foreign exchange forecast hedging at SEK-0.3 (0.3) b. and negative return on assets. The financial net declined sequentially from SEK-0.5 b. In Q1 2018 the revaluation and realization effects of foreign exchange forecast hedging was SEK-0.1 b.
Taxes
Taxes amounted to SEK-1.2 (0.0) b. in the quarter and were impacted by SEK-0.7 b. as a result of revaluation of deferred tax assets due to a change in Swedish corporate tax rate. Certain profits realized in foreign jurisdictions and adjustments for taxes related to prior periods also impacted taxes negatively.
Net income (loss) and EPS
The losses in net income and the negative EPS diluted increased both YoY and QoQ, following increased taxes and negative financial net, partly offset by improved operating income.
Employees
The number of employees on June 30, 2018, was 95,260 – a net reduction of 2,321 employees in the quarter and of 13,867 employees compared with June 30, 2017. The decrease is mainly a result of activities under the cost reduction program.
Focused strategy execution
The following four measures are indicators of the progress of strategy execution.
| Area | Activity | Status Q2 2018 | ||
| Networks | Transition to new Ericsson Radio System | 84% (2017: 61%) YTD accumulated (ERS radio unit deliveries out of total radio unit deliveries) | ||
| Digital Services | - Growth in sales of new product portfolio - Addressing critical customer contracts | - Net sales 12 months rolling-14% - Out of 45 contracts identified, in total 16 have been addressed (8 in Q218 isolated) | ||
| Managed Services | Addressing low- performing customer contracts | Out of a total of 42 contracts identified, 33 (2 in Q218 isolated) have been addressed to result in an annualized profit improvement of SEK 0.8 b. (Q1 2018: SEK 0.7 b.) |
Changes in segment reporting
As of Q2 2018, sales related to Application Development and Maintenance (ADM) and certain sales related to Business Support Solutions (BSS) were moved between the segments Managed Services and Digital Services, with a sales increase in Managed Services and a corresponding sales decrease in Digital Services (net effect of SEK 1.9 b in 2017). The corresponding impact on 2017 gross income was SEK 0.2 b. (positive for Managed Services, negative for Digital Services). Historical data have been restated to reflect the organizational change.
4 Ericsson | Second Quarter Report 2018 |
Financial highlights |
Table of Contents
Market area sales
| Second quarter 2018 | Change | |||||||||||||||||||||||||||
SEK b. | Networks | Digital Services | Managed Services | Emerging Business and Other | Total | YoY | QoQ | |||||||||||||||||||||
South East Asia, Oceania and India | 5.0 | 1.1 | 0.9 | 0.0 | 7.0 | -3 | % | 9 | % | |||||||||||||||||||
North East Asia | 3.6 | 0.8 | 0.4 | 0.0 | 4.8 | -19 | % | 41 | % | |||||||||||||||||||
North America | 11.4 | 2.1 | 0.8 | 0.0 | 14.3 | 11 | % | 27 | % | |||||||||||||||||||
Europe and Latin America | 7.8 | 2.9 | 3.4 | 0.1 | 14.2 | 0 | % | 9 | % | |||||||||||||||||||
Middle East and Africa | 3.0 | 1.6 | 1.0 | 0.0 | 5.6 | -2 | % | -2 | % | |||||||||||||||||||
Other1) | 1.7 | 0.3 | 0.0 | 1.9 | 3.9 | -7 | % | 12 | % | |||||||||||||||||||
|
|
|
|
|
|
|
|
|
|
|
|
|
| |||||||||||||||
Total | 32.4 | 8.8 | 6.5 | 2.1 | 49.8 | -1 | % | 15 | % | |||||||||||||||||||
|
|
|
|
|
|
|
|
|
|
|
|
|
| |||||||||||||||
| 1) | Market Area “Other” includes primarily licensing revenues and the major part of segment Emerging Business and Other |
South East Asia, Oceania and India
Sales declined YoY. Large 4G deployments are ongoing, however timing of orders impacted Networks sales negatively YoY. Digital Services sales declined slightly YoY, due to timing of project milestones. Managed Services sales increased, partly driven by a newly signed contract.
North East Asia
Sales declined YoY due to lower Networks sales in Mainland China as a consequence of reduced LTE investments. Digital Services sales declined YoY, due to a telecom core contract delay. Sales in Japan recovered after finalization of spectrum allocations.
North America
Sales increased YoY, primarily in Networks, driven by investments in 5G readiness across all major customers. Digital Services sales declined slightly YoY, due to timing of project milestones.
Europe and Latin America
Sales were stable YoY. Continued sales growth in parts of Europe and Latin America was offset by a decline in certain markets. In addition, Managed Services sales declined YoY as a consequence of addressingnon-strategic contracts.
Middle East and Africa
Sales declined slightly YoY. Networks sales were negatively impacted by monetary restrictions in a few markets in the Middle East. The decline was partly offset by growth in Digital Services.
Other
Sales declined YoY, mainly in Media Solutions. IPR licensing revenues amounted to SEK 1.8 (2.0) b.
5 Ericsson | Second Quarter Report 2018 |
Market area sales |
Table of Contents
Segment results
Networks
SEK b. | Q2 2018 | Q2 2017 | YoY change | Q1 2018 | QoQ change | 6 months 2018 | 6 months 2017 | |||||||||||||||||||||
Net sales | 32.4 | 31.7 | 2 | % | 28.6 | 13 | % | 61.0 | 63.3 | |||||||||||||||||||
Of which products | 22.3 | 21.3 | 5 | % | 19.5 | 15 | % | 41.8 | 43.1 | |||||||||||||||||||
Of which IPR licensing revenues | 1.5 | 1.7 | -11 | % | 1.5 | -2 | % | 3.0 | 3.4 | |||||||||||||||||||
Of which services | 10.1 | 10.4 | -3 | % | 9.1 | 10 | % | 19.2 | 20.2 | |||||||||||||||||||
Sales growth adjusted for comparable units and currency | — | — | 2 | % | — | 7 | % | — | — | |||||||||||||||||||
Gross income | 12.6 | 10.9 | 15 | % | 11.1 | 13 | % | 23.7 | 20.9 | |||||||||||||||||||
Gross margin | 38.8 | % | 34.4 | % | — | 38.9 | % | — | 38.8 | % | 33.0 | % | ||||||||||||||||
Operating income | 3.5 | 3.4 | 4 | % | 3.4 | 5 | % | 6.9 | 6.1 | |||||||||||||||||||
Operating margin | 10.9 | % | 10.8 | % | — | 11.8 | % | — | 11.3 | % | 9.7 | % | ||||||||||||||||
Restructuring charges | -0.7 | -0.8 | -8 | % | -0.5 | 56 | % | -1.2 | -2.2 | |||||||||||||||||||
Gross income excl. restructuring charges | 13.0 | 11.4 | 14 | % | 11.5 | 13 | % | 24.6 | 22.6 | |||||||||||||||||||
Gross margin excl. restructuring charges | 40.2 | % | 36.0 | % | — | 40.4 | % | — | 40.3 | % | 35.7 | % | ||||||||||||||||
Operating income excl. restructuring charges | 4.3 | 4.2 | 1 | % | 3.9 | 12 | % | 8.1 | 8.3 | |||||||||||||||||||
Operating margin excl. restructuring charges | 13.3 | % | 13.4 | % | — | 13.5 | % | — | 13.4 | % | 13.1 | % | ||||||||||||||||
Net sales
Sales as reported and sales adjusted for comparable units and currency increased by 2% YoY. The increase is mainly due to strong growth in North America, driven by investments in 5G readiness. This was partly offset by lower sales in South East Asia, Oceania and India and in the Middle East and North East Asia.
Sales increased by 13% QoQ. Sales adjusted for comparable units and currency increased by 7% QoQ.
Gross margin
Gross margin increased to 38.8% (34.4%) YoY. Gross margin excluding restructuring charges increased to 40.2% (36.0%) due to improved margins of hardware and services, driven by cost reductions, a successful shift of the radio platform and favorable market mix.
Gross margin was flat QoQ at 38.8%. Gross margin excluding restructuring charges was 40.2%, compared with 40.4% in Q1 2018. Higher recognition than deferral of hardware costs impacted gross margin negatively by SEK-0.1 b. QoQ.
Operating margin
Operating margin was flat YoY at 10.9% (10.8%). Operating margin excluding restructuring charges was 13.3% (13.4%), with improved gross margin offset by increased R&D expenses. Restructuring charges were SEK-0.7(-0.8) b.
Operating margin declined QoQ to 10.9% from 11.8%. Operating margin excluding restructuring charges decreased to 13.3% from 13.5% due to increased R&D expenses, partly compensated by higher sales. The change in net impact from amortization and capitalization of development expenses and from recognition and deferral of hardware costs was SEK 0.2 b. QoQ.
| Net impact from amortization and capitalization of development expenses and from recognition and deferral of hardware costs | ||||||||||||
SEK b. | Q2 2018 | Q2 2017 | Q1 2018 | |||||||||
Cost of Sales | -0.2 | -0.1 | -0.3 | |||||||||
R&D expenses | 0.2 | 0.1 | 0.1 | |||||||||
|
|
|
|
|
| |||||||
Total impact | 0.0 | 0.0 | -0.2 | |||||||||
|
|
|
|
|
| |||||||
Strategy execution
As presented at the 2017 Capital Markets Day, the target for Networks is to improve the operating margin to15%-17% by 2020. Three important activities for profitability improvements are to
- invest in R&D to safeguard a leading portfolio
- fully transition the radio unit deliveries to Ericsson Radio System (ERS) for increased competitiveness
- continue to make savings in service delivery and common costs.
The ERS, which was introduced to the market in 2015, has proven to be competitive as well as creating a strong market position. For the first half of 2018, ERS accounted for 84% of total radio unit deliveries. The plan is to have fully transitioned the radio unit deliveries to ERS by the end of 2018.
In the quarter, a divestment of a Spanish fiber service operations, with approximately 600 service engineers, was completed.
6 Ericsson | Second Quarter Report 2018 |
Segment results | Networks |
Table of Contents
Digital Services
SEK b. | Q2 2018 | Q2 2017 | YoY change | Q1 2018 | QoQ change | 6 months 2018 | 6 months 2017 | |||||||||||||||||||||
Net sales | 8.8 | 9.9 | -11 | % | 7.3 | 22 | % | 16.1 | 18.0 | |||||||||||||||||||
Of which products | 4.5 | 5.4 | -17 | % | 3.9 | 13 | % | 8.4 | 9.7 | |||||||||||||||||||
Of which IPR licensing revenues | 0.3 | 0.4 | -11 | % | 0.3 | -2 | % | 0.7 | 0.7 | |||||||||||||||||||
Of which services | 4.4 | 4.5 | -4 | % | 3.3 | 32 | % | 7.7 | 8.3 | |||||||||||||||||||
Sales growth adjusted for comparable units and currency | — | — | -12 | % | — | 16 | % | — | — | |||||||||||||||||||
Gross income | 3.5 | 3.3 | 5 | % | 2.9 | 20 | % | 6.4 | 1.0 | |||||||||||||||||||
Gross margin | 39.1 | % | 33.2 | % | — | 39.8 | % | — | 39.5 | % | 5.4 | % | ||||||||||||||||
Operating income (loss) | -2.4 | -2.2 | 6 | % | -2.6 | -9 | % | -5.0 | -11.2 | |||||||||||||||||||
Operating margin | -26.9 | % | -22.6 | % | — | -35.9 | % | — | -30.9 | % | -62.4 | % | ||||||||||||||||
Restructuring charges | -0.9 | -0.5 | 94 | % | -0.6 | 52 | % | -1.5 | -0.7 | |||||||||||||||||||
Gross income excl. restructuring charges | 3.8 | 3.5 | 7 | % | 3.1 | 21 | % | 6.9 | 1.4 | |||||||||||||||||||
Gross margin excl. restructuring charges | 42.6 | % | 35.7 | % | — | 42.9 | % | — | 42.7 | % | 7.8 | % | ||||||||||||||||
Operating income (loss) excl. restructuring charges | -1.5 | -1.8 | -16 | % | -2.0 | -26 | % | -3.5 | -10.5 | |||||||||||||||||||
Operating margin excl. restructuring charges | -16.9 | % | -18.0 | % | — | -27.9 | % | — | -21.9 | % | -58.4 | % | ||||||||||||||||
Net sales
Sales as reported declined by-11% YoY. Sales adjusted for comparable units and currency decreased by -12% YoY. Legacy product sales continued to decline in the quarter. New product sales declined YoY, mainly due to lower telecom core sales in North East Asia as a consequence of a contract delay. The demand for our5G-ready and cloud-native products remains strong with several signed contracts in the quarter.
Sales increased by 22% QoQ driven by software and services, following a seasonally weaker Q1, and by increased sales in large transformation projects. Sales adjusted for comparable units and currency increased by 16% QoQ.
Gross margin
Gross margin improved to 39.1% (33.2%). Gross margin excluding restructuring charges increased to 42.6% (35.7%), supported by improved software margins and cost reductions in services. Reduced amortization of software release development expenses had a positive impact of SEK 0.3 b. on gross income YoY.
Gross margin declined QoQ to 39.1% from 39.8% . Gross margin excluding restructuring charges declined slightly QoQ to 42.6% from 42.9%, due to reduced services margins and an increased services share, driven by increased sales in large transformation contracts. This was partly compensated by continued cost reductions and improved software margins.
Operating income (loss)
Operating income (loss) decreased YoY to SEK-2.4(-2.2) b. Operating income (loss) excluding restructuring charges improved to SEK-1.5(-1.8) b., due to improved gross margin and reduced operating expenses partly offset by lower sales. Operating expenses decreased despite an impact from higher amortized than capitalized development expenses of SEK-0.4 (0.1) b. and impairment losses on trade receivables of SEK-0.2 (0.0) b. Total restructuring charges of SEK-0.9(-0.5) b. had a negative impact on operating income YoY.
Operating income (loss) improved QoQ to SEK-2.4 b. from-2.6 b. Operating income excluding restructuring charges improved to SEK-1.5 b. from-2.0 b., driven by increased sales.
| Net impact from amortization and capitalization of development expenses | ||||||||||||
SEK b. | Q2 2018 | Q2 2017 | Q1 2018 | |||||||||
Cost of Sales | 0.0 | -0.3 | 0.0 | |||||||||
R&D expenses | -0.4 | 0.1 | -0.4 | |||||||||
|
|
|
|
|
| |||||||
Total impact | -0.4 | -0.2 | -0.4 | |||||||||
|
|
|
|
|
| |||||||
Strategy execution
As presented at the Capital Markets Day 2017, the target is to turn around Digital Services into low single-digit operating margin by 2020. Cost reduction activities were intensified in the quarter across the areas of service delivery, selling and administrative expenses and R&D. These activities will continue, aiming for simplicity and efficiency. While new ways of working are improving R&D efficiency, at the same time investments continue in a portfolio of5G-ready and cloud-native products in order to defend current market position and prepare Digital Services for future growth.
A key activity for the turnaround is to manage and complete 34 identified critical multi-year customer contracts and to either exit or complete 11 identifiednon-strategic contracts. The plan is to complete or exit approximately 50% of the 45 contracts in 2018. 16 contracts have been addressed at the end of Q2 2018.
The ongoing digitalization drives opportunities for operators to reduce costs and be more agile by; automating operations, digitally serving and engaging with customers and building programmable core networks. Consequently, operators increasingly invest in the areas where Digital Services provide solutions. Rolling 12 months, however, sales of the new portfolio declined by-14%, mainly due to lower telecom core sales as a consequence of a contract delay in North East Asia. It is not unusual that such sales vary between quarters.
7 Ericsson | Second Quarter Report 2018 |
Segment results | Digital Services |
Table of Contents
Managed Services
SEK b. | Q2 2018 | Q2 2017 | YoY change | Q1 2018 | QoQ change | 6 months 2018 | 6 months 2017 | |||||||||||||||||||||
Net sales | 6.5 | 6.7 | -2 | % | 5.9 | 11 | % | 12.4 | 13.0 | |||||||||||||||||||
Sales growth adjusted for comparable units and currency | — | — | -3 | % | — | 6 | % | — | — | |||||||||||||||||||
Gross income (loss) | 0.8 | 0.0 | — | 0.5 | 65 | % | 1.3 | -0.5 | ||||||||||||||||||||
Gross margin | 12.4 | % | 0.3 | % | — | 8.3 | % | — | 10.5 | % | -4.0 | % | ||||||||||||||||
Operating income (loss) | 0.3 | -0.3 | 216 | % | 0.1 | 199 | % | 0.4 | -2.1 | |||||||||||||||||||
Operating margin | 4.6 | % | -3.9 | % | — | 1.7 | % | — | 3.2 | % | -16.1 | % | ||||||||||||||||
Restructuring charges | -0.1 | -0.1 | 7 | % | -0.1 | 141 | % | -0.2 | -0.2 | |||||||||||||||||||
Gross income (loss) excl. restructuring charges | 0.9 | 0.1 | — | 0.5 | 69 | % | 1.5 | -0.3 | ||||||||||||||||||||
Gross margin excl. restructuring charges | 14.0 | % | 2.0 | % | — | 9.1 | % | — | 11.7 | % | -2.5 | % | ||||||||||||||||
Operating income (loss) excl. restructuring charges | 0.4 | -0.1 | — | 0.2 | 179 | % | 0.6 | -1.9 | ||||||||||||||||||||
Operating margin excl. restructuring charges | 6.5 | % | -2.1 | % | — | 2.6 | % | — | 4.6 | % | -14.6 | % | ||||||||||||||||
Net sales
Sales as reported decreased by-2% YoY, mainly as a result of contract reviews. Sales in Managed Services IT showed good growth. Sales adjusted for comparable units and currency decreased by-3% YoY.
Sales as reported increased by 11% QoQ. Sales adjusted for comparable units and currency increased by 6% QoQ.
Gross margin
Gross margin increased to 12.4% (0.3%) YoY, and sequentially from 8.3%, supported by results of efficiency measures and by reviewed and addressed contracts. In the quarter, positive adjustments of SEK 0.1 b. were made, related to reversal of earlier provisions.
Operating income
Operating income increased to SEK 0.3(-0.3) b. YoY, due to higher gross margin. Restructuring charges were SEK-0.1(-0.1) b.
Sequentially, operating income increased due to higher gross margin and higher net sales.
Strategy execution
As part of the focused business strategy, Managed Services has its full attention on turning the business around through addressinglow-performing operations andnon-strategic contracts as well as improving efficiency in the service delivery process. Investments continue in machine intelligence, automation and analytics in order to further enhance user experience, improve efficiency and better manage the increasingly complex networks of tomorrow.
As presented at the 2017 Capital Markets Day, the ambition for Managed Services is to improve the operating margin to4%-6% in 2020. In order to focus the business and improve profitability, 42 managed services contracts (out of >300) have been identified for exit, renegotiation or transformation. At the end of Q2 2018, 33 of the 42 contracts have been addressed resulting in an annualized profit improvement of approximately SEK 0.8 b., already fully impacting gross margin.
8 Ericsson | Second Quarter Report 2018 |
Segment results | Managed Services |
Table of Contents
Emerging Business and Other (includes Emerging Business, Media Solutions, Red Bee Media and iconectiv)
SEK b. | Q2 2018 | Q2 2017 | YoY change | Q1 2018 | QoQ change | 6 months 2018 | 6 months 2017 | |||||||||||||||||||||
Net sales | 2.1 | 2.0 | 2 | % | 1.7 | 24 | % | 3.7 | 3.8 | |||||||||||||||||||
Sales growth adjusted for comparable units and currency | — | — | 1 | % | — | 18 | % | — | — | |||||||||||||||||||
Gross income | 0.5 | 0.4 | 17 | % | 0.3 | 44 | % | 0.8 | 0.8 | |||||||||||||||||||
Gross margin | 24.4 | % | 21.3 | % | — | 21.1 | % | — | 22.9 | % | 20.1 | % | ||||||||||||||||
Operating income (loss) | -1.3 | -1.5 | -11 | % | -1.2 | 11 | % | -2.5 | -4.6 | |||||||||||||||||||
Operating margin | -63.5 | % | -73.0 | % | — | -71.2 | % | — | -66.9 | % | -121.9 | % | ||||||||||||||||
Restructuring charges | -0.1 | -0.1 | -2 | % | -0.1 | 107 | % | -0.2 | -0.2 | |||||||||||||||||||
Gross income excl. restructuring charges | 0.6 | 0.5 | 15 | % | 0.4 | 40 | % | 1.0 | 0.9 | |||||||||||||||||||
Gross margin excl. restructuring charges | 27.4 | % | 24.3 | % | — | 24.3 | % | — | 26.0 | % | 22.5 | % | ||||||||||||||||
Operating income (loss) excl. restructuring charges | -1.2 | -1.3 | -12 | % | -1.1 | 6 | % | -2.3 | -4.4 | |||||||||||||||||||
Operating margin excl. restructuring charges | -57.4 | % | -66.6 | % | — | -67.5 | % | — | -61.9 | % | -117.3 | % | ||||||||||||||||
Net sales
Sales as reported increased by 2% YoY. Sales adjusted for comparable units and currency increased by 1%, driven by growth in the iconectiv business. Sales and deliveries started, in the quarter, on a multi-year number portability contract in United States. This contract was awarded to iconectiv in 2015. Sales in Emerging Business continued to grow, driven by IoT.
Sales in the media business (Media Solutions and Red Bee Media) were SEK 1.3 (1.5) b. Media Solutions sales declined YoY, mainly due to lower sales in the discontinued portfolio. Red Bee Media sales declined slightly, mainly due to scope changes in contracts.
Sales increased by 24% QoQ, mainly due to growth in iconectiv, Media Solutions and Red Bee Media. Sales adjusted for comparable units and currency increased by 18% QoQ.
Gross margin
Gross margin increased YoY to 24.4% (21.3%). Gross margin excluding restructuring charges increased to 27.4% (24.3%), supported by improvements in IoT, Media Solutions and Red Bee Media.
Gross margin increased QoQ to 24.4% from 21.1%. Gross margin excluding restructuring charges increased to 27.4% from 24.3%, with a positive impact from operational improvements in Red Bee Media.
Operating income (loss)
Operating income improved YoY to SEK-1.3(-1.5) b. Operating income excluding restructuring charges improved to SEK-1.2(-1.3) b. driven by improved results in Media Solutions and iconectiv. Emerging Business operating income declined YoY, driven by increased investments in line with the strategy.
Media Solutions and Red Bee Media combined operating income excluding restructuring charges and corporate allocations was SEK-0.4(-0.7) b. Results in Media Solutions improved YoY, driven by operational efficiencies, partly offset by costs related to the planned transaction for Media Solutions in Q3 2018.
Operating income declined QoQ to SEK-1.3 from-1.2 b. Operating income excluding restructuring charges declined to SEK-1.2 from-1.1 b. due to increased investments in Emerging Business in line with the strategy.
| Net impact from amortization and capitalization of development expenses | ||||||||||||
SEK b. | Q2 2018 | Q2 2017 | Q1 2018 | |||||||||
Cost of Sales | 0.0 | 0.0 | 0.0 | |||||||||
R&D expenses | -0.1 | -0.1 | -0.1 | |||||||||
|
|
|
|
|
| |||||||
Total impact | -0.1 | -0.1 | -0.1 | |||||||||
|
|
|
|
|
| |||||||
Strategy execution
As outlined at the Capital Markets Day in 2017, the target for segment Emerging Business and Other, including iconectiv, is a break-even result by 2020.
Selective investments will continue in Emerging Business to build a position and grow sales in new areas. Main investments are on IoT, UDN (Unified Delivery Network) and Emodo (mobile advertising and data monetization platform) business. Parts of the portfolio are still in an early phase, with focus on generating sales and scale the business, and do not yet cover the required investments, hence resulting in a negative bottom-line. The acquisition of Vidscale, a subcontractor to the Ericsson UDN business, was completed in the quarter and will lower the operational cost for the business.
For the media solutions business, Ericsson is partnering with One Equity Partners (OEP) and retaining a 49% ownership stake. This allows Ericsson to capture the upside of the business while at the same time taking an active part in the expected consolidation of the industry. Activities are accelerated to complete the transaction as planned during Q3 2018. Additional expenses related to the divestment of the media solutions business is estimated to be SEK-0.3 b. in Q3.
For Red Bee Media, the target is to achieve a sustainable profitable business, by continuing to develop and manage the business as an independent and focused media services entity within Ericsson. Operations and services propositions will be further developed, in line with the Red Bee Media tactical and transformational strategic execution plans.
9 Ericsson | Second Quarter Report 2018 |
Segment results | Emerging Business and other |
Table of Contents
Cash flow
SEK b. | Q2 2018 | Q2 2017 | Q1 2018 | |||||||||
Net income reconciled to cash | -0.3 | -0.1 | -1.0 | |||||||||
Changes in operating net assets | 1.7 | 0.1 | 2.6 | |||||||||
Cash flow from operating activities | 1.4 | 0.0 | 1.6 | |||||||||
Cash flow from investing activities | 1.6 | -2.0 | -1.8 | |||||||||
Cash flow from financing activities | -3.7 | -8.9 | -0.1 | |||||||||
Effect of exchange rate changes on cash | 1.0 | -0.6 | 1.1 | |||||||||
Net change in cash and cash equivalents | 0.4 | -11.5 | 0.8 | |||||||||
Free cash flow: Cash flow from operating activities less net capital expenditures and | -0.6 | -1.3 | 0.3 | |||||||||
Operating activities
Cash flow from operating activities was SEK 1.4 (0.0) b., driven by SEK 1.7 b. of positive change in net operating assets. Trade receivables were reduced, mainly due to good collection. Sales of trade receivables continued to trend downwards and were reduced both QoQ and YoY. Trade payables increased, mainly due to seasonal inventorybuild-up. Cash outlays related to restructuring charges were SEK-0.8(-1.1) b. in the quarter.
Investing activities
Cash flow from investing activities excluding interest-bearing securities was SEK-2.1(-1.3) b. M&A activities were SEK-0.4 (0.0) b., related to an acquisition in Emerging Business. Cash flow from investments in property, plant and equipment was SEK-1.0(-1.0) b. and capitalized development expenses were SEK-0.3(-0.3) b. Cash flow from interest-bearing securities was SEK 3.7(-0.7) b. Together, the above items generated a positive cash flow from investing activities of SEK 1.6(-2.0) b.
Financing activities
Cash flow from financing activities was negative at SEK-3.7(-8.9) b. Dividends of SEK 3.3 (3.3) b. were paid out. Net change in cash and cash equivalents was SEK 0.4(-11.5) b.
Free cash flow
Free cash flow improved to SEK-0.6(-1.3) b. due to increased cash flow from operating activities partly offset by increased acquisitions.
Free cash flow decreased QoQ from SEK 0.3 b. to SEK-0.6 b. mainly due to negative effects of currency fluctuations and lower cash flow from operating activities.
10 Ericsson | Second Quarter Report 2018 |
Cash flow |
Table of Contents
Financial position
SEK b. | Jun 30 2018 | Jun 30 2017 | Mar 31 2018 | |||||||||
+ Cash and cash equivalents | 37.0 | 21.4 | 36.7 | |||||||||
+ Interest-bearing securities, current | 8.3 | 10.8 | 5.5 | |||||||||
+ Interest-bearing securities,non-current | 21.5 | 22.1 | 27.1 | |||||||||
Gross cash | 66.9 | 54.3 | 69.3 | |||||||||
– Borrowings, current | 2.6 | 3.2 | 2.6 | |||||||||
– Borrowings,non-current | 31.1 | 27.1 | 31.1 | |||||||||
Net cash | 33.1 | 24.0 | 35.6 | |||||||||
Equity | 93.6 | 119.9 | 93.5 | |||||||||
Total assets | 265.3 | 275.2 | 260.7 | |||||||||
Capital turnover (times) | 1.2 | 1.1 | 1.1 | |||||||||
Return on capital employed (%) | 0.1 | % | -13.3 | % | -1.0 | % | ||||||
Equity ratio (%) | 35.3 | % | 43.6 | % | 35.9 | % | ||||||
Return on equity (%) | -5.7 | % | -16.6 | % | -3.5 | % | ||||||
Gross cash decreased by SEK-2.4 b. and net cash decreased by SEK-2.5 b. in the quarter, due to payment of dividends of SEK 3.3 b. Gross cash was SEK 66.9 b. and net cash was SEK 33.1 b.
Post-employments benefits increased in the quarter, to SEK 27.3 b. from SEK 25.6 b., due to decreased interest rates in Sweden and normal service and interest costs partly offset by return on pension assets and higher interest rates in the UK.
The Swedish defined benefit obligation (DBO) has been calculated using a discount rate based on the yields of Swedish government bonds. If the discount rate had been based on Swedish covered mortgage bonds, the DBO would have been approximately SEK 8.5 b. lower as of June 30, 2018.
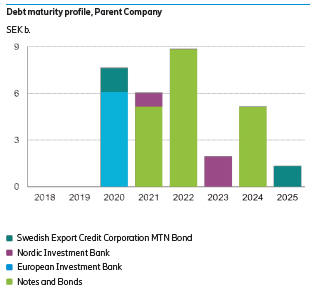
The average maturity of long-term borrowings as of June 30, 2018, was 3.9 years, a decrease from 4.5 years 12 months earlier.
A credit facility agreement of EUR 250 million was signed with the European Investment Bank (EIB) in the quarter but has not yet been disbursed. The credit facility will mature five years after disbursement.
11 Ericsson | Second Quarter Report 2018 |
Financial position |
Table of Contents
Parent Company
Income after financial items was SEK 1.7 (2.3) b. The decrease was mainly due to lower recognized dividends from subsidiaries.
At the end of the quarter, gross cash (cash, cash equivalents, short-term investments and interest-bearing securitiesnon-current) amounted to SEK 53.6 (41.1) b.
The dividend of SEK 3.3 b. was paid out in the first week of April after decision by the Annual General Meeting on the 28th of March.
There has been a decrease in intercompany lending of SEK 6.4 b. and a decrease in intercompany borrowing of SEK 4.6 b. in the second quarter.
In accordance with the conditions of the long-term variable compensation program (LTV) for Ericsson employees, 3,447,302 shares from treasury stock were sold or distributed to employees during the second quarter. The holding of treasury stock at June 30, 2018, was 43,381,932 Class B shares.
12 Ericsson | Second Quarter Report 2018 |
Parent Company |
Table of Contents
Other information
Ericsson’s Nomination Committee appointed
On April 26, 2018, Ericsson announced that the Nomination Committee for the Annual General Meeting 2019 had been appointed in accordance with the Instruction for the Nomination Committee, resolved by the Annual General Meeting 2012. The Nomination Committee consists of: Johan Forssell, Investor AB; Bengt Kjell, AB Industrivärden and Svenska Handelsbankens Pensionsstiftelse; Christer Gardell, Cevian Capital Partners Limited; Anders Oscarsson, AMF Försäkring och Fonder and Ronnie Leten, the Chairman of the Board of Directors. Johan Forssell is the Chairman of the Nomination Committee.
Ericsson signs credit facility agreement with the European Investment Bank
On May 31, 2018, Ericsson announced that it has signed a credit facility of EUR 250 million with the European Investment Bank (EIB). The funding will support research and development activities for 5G and is in line with Ericsson’s focused business strategy. The credit facility will mature five years after disbursement.
POST-CLOSING EVENTS
Ericsson to divest its field services business in Sweden to Transtema Group
On July 11, 2018, Ericsson announced that it has signed an agreement with the Swedish company Transtema Group AB to divest Ericsson Local Services AB (LSS), a subsidiary of Ericsson supplying field service operations and maintenance of fixed and mobile networks in Sweden. This divestment is in line with Ericsson’s business strategy. The transaction is expected to close in the third quarter of 2018 and is subject to customary closing conditions, including regulatory approvals.
13 Ericsson | Second Quarter Report 2018 |
Other information |
Table of Contents
Risk factors
Ericsson’s operational and financial risk factors and uncertainties are described in our Annual Report 2017. Risk factors and uncertainties in focus short term for the Parent Company and the Ericsson Group include, but are not limited to:
| • | Potential negative effects on operators’ willingness to invest in network development due to uncertainty in the financial markets and a weak economic business environment, or reduced consumer telecom spending, or increased pressure on Ericsson to provide financing, or delayed auctions of spectrum |
| • | Intense competition from existing competitors as well as new entrants, including IT companies entering the telecommunications market, which could have a material adverse effect on the results |
| • | Uncertainty regarding the financial stability of suppliers, for example due to lack of financing |
| • | Effects on gross margins and/or working capital of the business mix in the Networks segment between capacity sales and new coverage build-outs |
| • | Effects on gross margins of the business mix including new network build-outs and new managed services or digital transformation deals with initial transition costs |
| • | Effects of the ongoing industry consolidation among our customers as well as between our largest competitors, e.g. with postponed investments and intensified price competition as a consequence |
| • | New and ongoing partnerships which may not be successful and expose us to future costs |
| • | Changes in foreign exchange rates, in particular USD |
| • | Political unrest and uncertainty in certain markets, as well as escalating trade disputes and sanctions |
| • | Effects on production and sales from restrictions with respect to timely and adequate supply of materials, components and production capacity and other vital services on competitive terms |
| • | No guarantees that strategy execution, specific restructuring or cost-savings initiatives, profitability restoring efforts and/or organizational changes will be sufficient, successful or executed in time to deliver any improvements in earnings |
| • | Cybersecurity incidents, which may have a material negative impact |
| • | Rapidly changing technologies and the ways these are brought to the market, which could be disruptive to the business |
| • | Ericsson is subject to risks associated with the development and implementation of new solutions or technologies under existing customer contracts. The company may not be successful or incur delays in developing or implementing such solutions or technologies, which could result in damage claims and loss of customers which may have an adverse impact on liquidity and results of operations. |
Ericsson stringently monitors the compliance with all relevant trade regulations and trade embargoes applicable to dealings with customers operating in countries where there are trade restrictions or trade restrictions are discussed. Ericsson operates globally in accordance with Group policies and directives for business ethics and conduct and has a dedicated anti-corruption program. However, in some of the countries where the company operates, corruption risks can be high and compliance failure could have a material adverse impact on our business, financial condition and brand.
This report has not been reviewed by Telefonaktiebolaget LM Ericsson’s auditors.
Date for next report: October 18, 2018
14 Ericsson | Second Quarter Report 2018 |
Risk factors |
Table of Contents
Board Assurance
The Board of Directors and the CEO certify that the financial report for the six months gives a fair view of the performance of the business, position and profit or loss of the Company and the Group, and describes the principal risks and uncertainties that the Company and the companies in the Group face.
Stockholm, July 18, 2018
Telefonaktiebolaget LM Ericsson (publ)
Org. Nr. 556016-0680
Helena Stjernholm | Ronnie Leten | Jacob Wallenberg | ||
Deputy Chairman | Chairman | Deputy Chairman | ||
Jon Fredrik Baksaas | Jan Carlson | Nora Denzel | ||
Member of the Board | Member of the Board | Member of the Board | ||
Eric A. Elzvik | Kurt Jofs | Kristin S. Rinne | ||
Member of the Board | Member of the Board | Member of the Board | ||
Börje Ekholm
President, CEO and member of the Board
Torbjörn Nyman | Kjell-Åke Soting | Roger Svensson | ||
Member of the Board | Member of the Board | Member of the Board |
15 Ericsson | Second Quarter Report 2018 |
Board Assurance |
Table of Contents
Editor’s note
Ericsson invites media, investors and analysts to conference calls on July 18, 2018; one starting at 09.00 (CET) and the other at 14.00 (CET).
Live audio webcasts of the conference calls as well as supporting slides will be available at: www.ericsson.com/press and www.ericsson.com/investors Replay of the conference calls will be available approximately one hour after each call has ended and will remain available for seven days.
For further information, please contact:
Carl Mellander Senior Vice President, Chief Financial Officer Phone: +46 10 713 89 70
E-mail: investor.relations@ericsson.com or media.relations@ericsson.com
Helena Norrman, Senior Vice President, Chief Marketing and Communications Officer
Phone: +46 10 719 34 72
E-mail: investor.relations@ericsson.com or media.relations@ericsson.com
Telefonaktiebolaget LM Ericsson Org. number: 556016-0680 Torshamnsgatan 21
SE-164 83 Stockholm
Phone: +46 10 719 00 00
www.ericsson.com
Investors
| Peter Nyquist, Vice President, | ||
| Head of Investor Relations | ||
| Phone: | +46 10 714 64 99, +46 70 575 29 06 | |
| E-mail: | peter.nyquist@ericsson.com | |
| Stefan Jelvin, Director, | ||
| Investor Relations | ||
| Phone: | +46 10 714 20 39, +46 70 986 02 27 | |
| E-mail: | stefan.jelvin@ericsson.com | |
| Åsa Konnbjer, Director, | ||
| Investor Relations | ||
| Phone: | +46 10 713 39 28, +46 73 082 59 28 | |
| E-mail: | asa.konnbjer@ericsson.com | |
| Rikard Tunedal, Director, | ||
| Investor Relations | ||
| Phone: | +46 10 714 54 00, +46 761 005 400 | |
| E-mail: | rikard.tunedal@ericsson.com | |
Media
| Ola Rembe, Vice President, | ||
| Head of External Communications | ||
| Phone: | +46 10 719 97 27, +46 73 024 48 73 | |
| E-mail: | media.relations@ericsson.com | |
| Corporate Communications | ||
| Phone: | +46 10 719 69 92 | |
| E-mail: | media.relations@ericsson.com | |
16 Ericsson | Second Quarter Report 2018 |
Editor’s note |
Table of Contents
Forward-looking statements
This report includes forward-looking statements, including statements reflecting management’s current views relating to the growth of the market, future market conditions, future events, financial condition, and expected operational and financial performance, including, in particular the following:
| • | Our goals, strategies, planning assumptions and operational or financial performance expectations |
| • | Industry trends, future characteristics and development of the markets in which we operate |
| • | Our future liquidity, capital resources, capital expenditures, cost savings and profitability |
| • | The expected demand for our existing and new products and services as well as plans to launch new products and services including research and development expenditures |
| • | The ability to deliver on future plans and to realize potential for future growth |
| • | The expected operational or financial performance of strategic cooperation activities and joint ventures |
| • | The time until acquired entities and businesses will be integrated and accretive to income |
| • | Technology and industry trends including the regulatory and standardization environment in which we operate, competition and our customer structure. |
The words “believe,” “expect,” “foresee,” “anticipate,” “assume,” “intend,” “likely,” “projects,” “may,” “could,” “plan,” “estimate,” “forecast,” “will,” “should,” “would,” “predict,” “aim,” “ambition,” “seek,” “potential,” “target,” “might,” “continue,” or, in each case, their negative or variations, and similar words or expressions are used to identify forward-looking statements. Any statement that refers to expectations, projections or other characterizations of future events or circumstances, including any underlying assumptions, are forward-looking statements.
We caution investors that these statements are subject to risks and uncertainties many of which are difficult to predict and generally beyond our control that could cause actual results to differ materially from those expressed in, or implied or projected by, the forward-looking information and statements.
Important factors that could affect whether and to what extent any of our forward-looking statements materialize include, but are not limited to, the factors described in the section “Risk Factors”, and in “Risk Factors” in the Annual Report 2017.
These forward-looking statements also represent our estimates and assumptions only as of the date that they were made. We expressly disclaim a duty to provide updates to these forward-looking statements, and the estimates and assumptions associated with them, after the date of this report, to reflect events or changes in circumstances or changes in expectations or the occurrence of anticipated events, whether as a result of new information, future events or otherwise, except as required by applicable law or stock exchange regulation.
17 Ericsson | Second Quarter Report 2018 |
Forward-looking statements |
Table of Contents
Financial statements and
other information
18 Ericsson | Second Quarter Report 2018 |
Financial statements and other information |
Table of Contents
| Apr-Jun | Jan-Jun | |||||||||||||||||||||||
SEK million | 2018 | 2017 | Change | 2018 | 2017 | Change | ||||||||||||||||||
Net sales | 49,808 | 50,281 | -1 | % | 93,219 | 98,084 | -5 | % | ||||||||||||||||
Cost of sales | -32,475 | -35,652 | -9 | % | -61,028 | -75,954 | -20 | % | ||||||||||||||||
|
|
|
|
|
|
|
|
|
|
|
| |||||||||||||
Gross income | 17,333 | 14,629 | 18 | % | 32,191 | 22,130 | 45 | % | ||||||||||||||||
Gross margin (%) | 34.8 | % | 29.1 | % | 34.5 | % | 22.6 | % | ||||||||||||||||
Research and development expenses | -9,783 | -8,364 | 17 | % | -18,856 | -17,430 | 8 | % | ||||||||||||||||
Selling and administrative expenses | -7,053 | -6,818 | 3 | % | -13,209 | -15,041 | -12 | % | ||||||||||||||||
Impairment losses on trade receivables1) | -369 | -235 | 57 | % | -397 | -1,875 | -79 | % | ||||||||||||||||
|
|
|
|
|
|
|
|
|
|
|
| |||||||||||||
Operating expenses | -17,205 | -15,417 | 12 | % | -32,462 | -34,346 | -5 | % | ||||||||||||||||
Other operating income and expenses | 11 | 239 | 95 | 380 | ||||||||||||||||||||
Shares in earnings of JV and associated companies | 26 | 12 | 29 | 23 | ||||||||||||||||||||
|
|
|
|
|
|
|
|
|
|
|
| |||||||||||||
Operating income (loss) | 165 | -537 | -131 | % | -147 | -11,813 | -99 | % | ||||||||||||||||
Financial income | 275 | -27 | 203 | -109 | ||||||||||||||||||||
Financial expenses | -1,085 | 83 | -1,554 | -267 | ||||||||||||||||||||
|
|
|
|
|
|
|
|
|
|
|
| |||||||||||||
Income after financial items | -645 | -481 | 34 | % | -1,498 | -12,189 | -88 | % | ||||||||||||||||
Taxes | -1,157 | 24 | -1,029 | 1,706 | ||||||||||||||||||||
|
|
|
|
|
|
|
|
|
|
|
| |||||||||||||
Net income (loss) | -1,802 | -457 | 294 | % | -2,527 | -10,483 | -76 | % | ||||||||||||||||
|
|
|
|
|
|
|
|
|
|
|
| |||||||||||||
Net income (loss) attributable to: | ||||||||||||||||||||||||
Stockholders of the Parent Company | -1,885 | -471 | -2,722 | -10,539 | ||||||||||||||||||||
Non-controlling interests | 83 | 14 | 195 | 56 | ||||||||||||||||||||
Other information | ||||||||||||||||||||||||
Average number of shares, basic (million) | 3,290 | 3,275 | 3,288 | 3,273 | ||||||||||||||||||||
Earnings (loss) per share, basic (SEK)2) | -0.58 | -0.14 | -0.83 | -3.22 | ||||||||||||||||||||
Earnings (loss) per share, diluted (SEK)3) | -0.58 | -0.14 | -0.83 | -3.22 | ||||||||||||||||||||
| 1) | Impairment of trade receivables has been calculated according to IFRS 9 in 2018 and according to IAS 39 in 2017. Previously, these losses have been reported as selling and administrative expenses. |
| 2) | Based on net income (loss) attributable to stockholders of the Parent Company. |
| 3) | Potential ordinary shares are not considered when their conversion to ordinary shares would increase earnings per share. |
Statement of comprehensive income (loss)
| Apr-Jun | Jan-Jun | |||||||||||||||
SEK million | 2018 | 2017 | 2018 | 2017 | ||||||||||||
Net income (loss) | -1,802 | -457 | -2,527 | -10,483 | ||||||||||||
Other comprehensive income (loss) | ||||||||||||||||
Items that will not be reclassified to profit or loss | ||||||||||||||||
Remeasurements of defined benefits pension plans incl. asset ceiling | 123 | 574 | -726 | 972 | ||||||||||||
Revaluation of borrowings due to change in credit risk | 8 | — | 66 | — | ||||||||||||
Tax on items that will not be reclassified to profit or loss | -186 | -160 | -53 | -329 | ||||||||||||
Items that may be reclassified to profit or loss | ||||||||||||||||
Available-for-sale financial assets | ||||||||||||||||
Gains/losses arising during the period | — | 41 | — | 73 | ||||||||||||
Reclassification adjustments on gains/losses included in profit or loss | — | 2 | — | 5 | ||||||||||||
Revaluation of other investments in shares and participations | ||||||||||||||||
Fair value remeasurement | — | — | — | 2 | ||||||||||||
Changes in cumulative translation adjustments | 1,742 | -2,773 | 3,041 | -2,795 | ||||||||||||
Share of other comprehensive income on JV and associated companies | 9 | -9 | 20 | 1 | ||||||||||||
Tax on items that may be reclassified to profit or loss | — | -9 | — | -18 | ||||||||||||
|
|
|
|
|
|
|
| |||||||||
Total other comprehensive income (loss), net of tax | 1,696 | -2,334 | 2,348 | -2,089 | ||||||||||||
|
|
|
|
|
|
|
| |||||||||
Total comprehensive income (loss) | -106 | -2,791 | -179 | -12,572 | ||||||||||||
Total comprehensive income (loss) attributable to: | ||||||||||||||||
Stockholders of the Parent Company | -216 | -2,766 | -416 | -12,612 | ||||||||||||
Non-controlling interest | 110 | -25 | 237 | 40 | ||||||||||||
19 Ericsson | Second Quarter Report 2018 |
Financial statements |
Table of Contents
| Jun 30 | Mar 31 | Dec 31 | ||||||||||
SEK million | 2018 | 2018 | 2017 | |||||||||
ASSETS | ||||||||||||
Non-current assets | ||||||||||||
Intangible assets | ||||||||||||
Capitalized development expenses | 5,458 | 4,229 | 4,593 | |||||||||
Goodwill | 30,145 | 28,777 | 27,815 | |||||||||
Intellectual property rights, brands and other intangible assets | 3,883 | 3,853 | 4,148 | |||||||||
Property, plant and equipment | 12,894 | 12,912 | 12,857 | |||||||||
Financial assets | ||||||||||||
Equity in JV and associated companies | 658 | 630 | 624 | |||||||||
Other investments in shares and participations | 1,587 | 1,302 | 1,279 | |||||||||
Customer finance,non-current | 1,367 | 1,845 | 2,178 | |||||||||
Interest-bearing securities,non-current | 21,501 | 27,104 | 25,105 | |||||||||
Other financial assets,non-current | 6,805 | 5,192 | 5,897 | |||||||||
Deferred tax assets | 23,573 | 23,822 | 21,963 | |||||||||
|
|
|
|
|
| |||||||
| 107,871 | 109,666 | 106,459 | ||||||||||
Current assets | ||||||||||||
Inventories | 30,050 | 29,009 | 25,547 | |||||||||
Contract assets | 12,460 | 11,712 | 13,120 | |||||||||
Trade receivables | 41,580 | 42,455 | 48,105 | |||||||||
Customer finance, current | 1,664 | 1,709 | 1,753 | |||||||||
Other current receivables | 26,344 | 23,980 | 22,301 | |||||||||
Interest-bearing securities, current | 8,304 | 5,453 | 6,713 | |||||||||
Cash and cash equivalents | 37,049 | 36,697 | 35,884 | |||||||||
|
|
|
|
|
| |||||||
| 157,451 | 151,015 | 153,423 | ||||||||||
|
|
|
|
|
| |||||||
Total assets | 265,322 | 260,681 | 259,882 | |||||||||
|
|
|
|
|
| |||||||
EQUITY AND LIABILITIES | ||||||||||||
Equity | ||||||||||||
Stockholders’ equity | 92,689 | 92,703 | 96,935 | |||||||||
Non-controlling interest in equity of subsidiaries | 871 | 763 | 636 | |||||||||
|
|
|
|
|
| |||||||
| 93,560 | 93,466 | 97,571 | ||||||||||
Non-current liabilities | ||||||||||||
Post-employment benefits | 27,306 | 25,646 | 25,009 | |||||||||
Provisions,non-current | 2,819 | 2,597 | 3,596 | |||||||||
Deferred tax liabilities | 1,332 | 1,325 | 901 | |||||||||
Borrowings,non-current | 31,131 | 31,134 | 30,500 | |||||||||
Othernon-current liabilities | 4,549 | 2,792 | 2,776 | |||||||||
|
|
|
|
|
| |||||||
| 67,137 | 63,494 | 62,782 | ||||||||||
Current liabilities | ||||||||||||
Provisions, current | 6,715 | 6,435 | 6,283 | |||||||||
Borrowings, current | 2,642 | 2,554 | 2,545 | |||||||||
Contract liabilities | 30,959 | 30,391 | 29,076 | |||||||||
Trade payables | 28,563 | 26,453 | 26,320 | |||||||||
Other current liabilities | 35,746 | 37,888 | 35,305 | |||||||||
|
|
|
|
|
| |||||||
| 104,625 | 103,721 | 99,529 | ||||||||||
|
|
|
|
|
| |||||||
Total equity and liabilities | 265,322 | 260,681 | 259,882 | |||||||||
|
|
|
|
|
| |||||||
Of which interest-bearing liabilities | 33,773 | 33,688 | 33,045 | |||||||||
Assets pledged as collateral | 5,702 | 5,148 | 5,215 | |||||||||
Contingent liabilities | 1,363 | 1,412 | 1,561 | |||||||||
20 Ericsson | Second Quarter Report 2018 |
Financial statements |
Table of Contents
Consolidated statement of cash flows
| Apr-Jun | Jan-Jun | Jan-Dec | ||||||||||||||||||
SEK million | 2018 | 2017 | 2018 | 2017 | 2017 | |||||||||||||||
Operating activities | ||||||||||||||||||||
Net income (loss) | -1,802 | -457 | -2,527 | -10,483 | -32,433 | |||||||||||||||
Adjustments to reconcile net income to cash | ||||||||||||||||||||
Taxes | -1,071 | -1,826 | -3,386 | -5,938 | -9,064 | |||||||||||||||
Earnings/dividends in JV and associated companies | -19 | -8 | -15 | -15 | 56 | |||||||||||||||
Depreciation, amortization and impairment losses | 2,065 | 2,197 | 3,956 | 7,628 | 27,892 | |||||||||||||||
Other | 568 | -48 | 708 | 479 | 440 | |||||||||||||||
|
|
|
|
|
|
|
|
|
| |||||||||||
Net income reconciled to cash | -259 | -142 | -1,264 | -8,329 | -13,109 | |||||||||||||||
Changes in operating net assets | ||||||||||||||||||||
Inventories | -1,910 | -1,492 | -4,723 | -4,698 | 4,719 | |||||||||||||||
Customer finance, current andnon-current | 547 | 1,140 | 947 | 306 | 798 | |||||||||||||||
Trade receivables and contract assets | 1,661 | 184 | 8,977 | 3,002 | 1,379 | |||||||||||||||
Trade payables | 1,252 | 19 | 654 | 382 | 1,886 | |||||||||||||||
Provisions and post-employment benefits | 478 | 315 | -369 | 4,951 | 4,755 | |||||||||||||||
Contract liabilities | -233 | -573 | 524 | 4,234 | 5,024 | |||||||||||||||
Other operating assets and liabilities, net | -94 | 550 | -1,731 | -1,388 | 4,149 | |||||||||||||||
|
|
|
|
|
|
|
|
|
| |||||||||||
| 1,701 | 143 | 4,279 | 6,789 | 22,710 | ||||||||||||||||
Cash flow from operating activities | 1,442 | 1 | 3,015 | -1,540 | 9,601 | |||||||||||||||
Investing activities | ||||||||||||||||||||
Investments in property, plant and equipment | -951 | -1,018 | -1,807 | -2,033 | -3,877 | |||||||||||||||
Sales of property, plant and equipment | 52 | 37 | 175 | 106 | 1,016 | |||||||||||||||
Acquisitions/divestments of subsidiaries and other operations, net | -431 | 9 | -880 | 12 | 276 | |||||||||||||||
Product development | -325 | -315 | -579 | -1,180 | -1,444 | |||||||||||||||
Other investing activities | -398 | -42 | -237 | 68 | -463 | |||||||||||||||
Interest-bearing securities | 3,656 | -676 | 3,122 | -12,562 | -11,578 | |||||||||||||||
|
|
|
|
|
|
|
|
|
| |||||||||||
Cash flow from investing activities | 1,603 | -2,005 | -206 | -15,589 | -16,070 | |||||||||||||||
Cash flow before financing activities | 3,045 | -2,004 | 2,809 | -17,129 | -6,469 | |||||||||||||||
Financing activities | ||||||||||||||||||||
Dividends paid | -3,289 | -3,274 | -3,289 | -3,278 | -3,424 | |||||||||||||||
Other financing activities | -383 | -5,636 | -477 | 5,266 | 8,902 | |||||||||||||||
|
|
|
|
|
|
|
|
|
| |||||||||||
Cash flow from financing activities | -3,672 | -8,910 | -3,766 | 1,988 | 5,478 | |||||||||||||||
Effect of exchange rate changes on cash | 980 | -594 | 2,123 | -379 | -91 | |||||||||||||||
|
|
|
|
|
|
|
|
|
| |||||||||||
Net change in cash and cash equivalents | 353 | -11,508 | 1,166 | -15,520 | -1,082 | |||||||||||||||
|
|
|
|
|
|
|
|
|
| |||||||||||
Cash and cash equivalents, beginning of period | 36,697 | 32,954 | 35,884 | 36,966 | 36,966 | |||||||||||||||
|
|
|
|
|
|
|
|
|
| |||||||||||
Cash and cash equivalents, end of period | 37,050 | 21,446 | 37,050 | 21,446 | 35,884 | |||||||||||||||
|
|
|
|
|
|
|
|
|
| |||||||||||
21 Ericsson | Second Quarter Report 2018 |
Financial statements |
Table of Contents
of changes in equity
| Jan-Jun | Jan-Dec | |||||||||||
SEK million | 2018 | 2017 | 2017 | |||||||||
Opening balance1) | 97,571 | 135,257 | 135,257 | |||||||||
Opening balance adjustment due to IFRS 9 | -983 | — | — | |||||||||
|
|
|
| |||||||||
Adjusted opening balance | 96,588 | 135,257 | 135,257 | |||||||||
Total comprehensive income (loss) | -179 | -12,572 | -35,232 | |||||||||
Sale/repurchase of own shares | 49 | 34 | -5 | |||||||||
Stock issue (net) | — | 15 | 15 | |||||||||
Long-term variable compensation plans | 391 | 431 | 885 | |||||||||
Dividends paid | -3,289 | -3,278 | -3,424 | |||||||||
Transactions withnon-controlling interests | — | — | 75 | |||||||||
|
|
|
| |||||||||
Closing balance | 93,560 | 119,887 | 97,571 | |||||||||
|
|
|
| |||||||||
| 1) | The opening balance adjustment for IFRS 15 on initial application date (January 1, 2016) was SEK -4,353 million. Opening balances of 2017 and 2018 have been restated for IFRS 15. |
- isolated quarters
| 2018 | 2017 | |||||||||||||||||||||||
Isolated quarters, SEK million | Q2 | Q1 | Q4 | Q3 | Q2 | Q1 | ||||||||||||||||||
Net sales | 49,808 | 43,411 | 57,881 | 49,413 | 50,281 | 47,803 | ||||||||||||||||||
Cost of sales | -32,475 | -28,553 | -45,365 | -36,132 | -35,652 | -40,302 | ||||||||||||||||||
|
|
|
|
|
|
|
|
|
|
|
| |||||||||||||
Gross income | 17,333 | 14,858 | 12,516 | 13,281 | 14,629 | 7,501 | ||||||||||||||||||
Gross margin (%) | 34.8 | % | 34.2 | % | 21.6 | % | 26.9 | % | 29.1 | % | 15.7 | % | ||||||||||||
Research and development expenses | -9,783 | -9,073 | -9,938 | -10,519 | -8,364 | -9,066 | ||||||||||||||||||
Selling and administrative expenses | -7,053 | -6,156 | -8,245 | -5,741 | -6,818 | -8,223 | ||||||||||||||||||
Impairment losses on trade receivables1) | -369 | -28 | -680 | -1,094 | -235 | -1,640 | ||||||||||||||||||
|
|
|
|
|
|
|
|
|
|
|
| |||||||||||||
Operating expenses | -17,205 | -15,257 | -18,863 | -17,354 | -15,417 | -18,929 | ||||||||||||||||||
Other operating income and expenses | 11 | 84 | -12,926 | 2) | 415 | 239 | 141 | |||||||||||||||||
Shares in earnings of JV and associated companies | 26 | 3 | -5 | 6 | 12 | 11 | ||||||||||||||||||
|
|
|
|
|
|
|
|
|
|
|
| |||||||||||||
Operating income (loss) | 165 | -312 | -19,278 | -3,652 | -537 | -11,276 | ||||||||||||||||||
Financial income | 275 | -72 | -124 | -139 | -27 | -82 | ||||||||||||||||||
Financial expenses | -1,085 | -469 | -394 | -182 | 83 | -350 | ||||||||||||||||||
|
|
|
|
|
|
|
|
|
|
|
| |||||||||||||
Income after financial items | -645 | -853 | -19,796 | -3,973 | -481 | -11,708 | ||||||||||||||||||
Taxes | -1,157 | 128 | 1,303 | 516 | 24 | 1,682 | ||||||||||||||||||
|
|
|
|
|
|
|
|
|
|
|
| |||||||||||||
Net income (loss) | -1,802 | -725 | -18,493 | -3,457 | -457 | -10,026 | ||||||||||||||||||
|
|
|
|
|
|
|
|
|
|
|
| |||||||||||||
Net income (loss) attributable to: | ||||||||||||||||||||||||
Stockholders of the Parent Company | -1,885 | -837 | -18,476 | -3,561 | -471 | -10,068 | ||||||||||||||||||
Non-controlling interests | 83 | 112 | -17 | 104 | 14 | 42 | ||||||||||||||||||
Other information | ||||||||||||||||||||||||
Average number of shares, basic (million) | 3,290 | 3,286 | 3,283 | 3,279 | 3,275 | 3,272 | ||||||||||||||||||
Earnings (loss) per share, basic (SEK)3) | -0.58 | -0.25 | -5.63 | -1.09 | -0.14 | -3.08 | ||||||||||||||||||
Earnings (loss) per share, diluted (SEK)4) | -0.58 | -0.25 | -5.63 | -1.09 | -0.14 | -3.08 | ||||||||||||||||||
| 1) | Impairment of trade receivables has been calculated according to IFRS 9 in 2018 and according to IAS 39 in 2017. Previously, these losses have been reported as selling and administrative expenses. |
| 2) | Includes write-down of goodwill of SEK -13.0 billion. |
| 3) | Based on net income (loss) attributable to stockholders of the Parent Company. |
| 4) | Potential ordinary shares are not considered when their conversion to ordinary shares would increase earnings per share. |
22 Ericsson | Second Quarter Report 2018 |
Financial statements |
Table of Contents
of cash flows - isolated quarters
| 2018 | 2017 | |||||||||||||||||||||||
Isolated quarters, SEK million | Q2 | Q1 | Q4 | Q3 | Q2 | Q1 | ||||||||||||||||||
Operating activities | ||||||||||||||||||||||||
Net income (loss) | -1,802 | -725 | -18,493 | -3,457 | -457 | -10,026 | ||||||||||||||||||
Adjustments to reconcile net income to cash | ||||||||||||||||||||||||
Taxes | -1,071 | -2,315 | -1,803 | -1,323 | -1,826 | -4,112 | ||||||||||||||||||
Earnings/dividends in JV and associated companies | -19 | 4 | -2 | 73 | -8 | -7 | ||||||||||||||||||
Depreciation, amortization and impairment losses | 2,065 | 1,891 | 16,118 | 4,146 | 2,197 | 5,431 | ||||||||||||||||||
Other | 568 | 140 | 179 | -218 | -48 | 527 | ||||||||||||||||||
|
|
|
|
|
|
|
|
|
|
|
| |||||||||||||
Net income reconciled to cash | -259 | -1,005 | -4,001 | -779 | -142 | -8,187 | ||||||||||||||||||
Changes in operating net assets | ||||||||||||||||||||||||
Inventories | -1,910 | -2,813 | 8,356 | 1,061 | -1,492 | -3,206 | ||||||||||||||||||
Customer finance, current andnon-current | 547 | 400 | 36 | 456 | 1,140 | -834 | ||||||||||||||||||
Trade receivables and contract assets | 1,661 | 7,316 | -2,246 | 623 | 184 | 2,818 | ||||||||||||||||||
Trade payables | 1,252 | -598 | 2,565 | -1,061 | 19 | 363 | ||||||||||||||||||
Provisions and post-employment benefits | 478 | -847 | 412 | -608 | 315 | 4,636 | ||||||||||||||||||
Contract liabilities | -233 | 757 | 2,700 | -1,910 | -573 | 4,807 | ||||||||||||||||||
Other operating assets and liabilities, net | -94 | -1,637 | 3,337 | 2,200 | 550 | -1,938 | ||||||||||||||||||
|
|
|
|
|
|
|
|
|
|
|
| |||||||||||||
| 1,701 | 2,578 | 15,160 | 761 | 143 | 6,646 | |||||||||||||||||||
Cash flow from operating activities | 1,442 | 1,573 | 11,159 | -18 | 1 | -1,541 | ||||||||||||||||||
Investing activities | ||||||||||||||||||||||||
Investments in property, plant and equipment | -951 | -856 | -1,105 | -739 | -1,018 | -1,015 | ||||||||||||||||||
Sales of property, plant and equipment | 52 | 123 | 898 | 12 | 37 | 69 | ||||||||||||||||||
Acquisitions/divestments of subsidiaries and other operations, net | -431 | -449 | -107 | 371 | 9 | 3 | ||||||||||||||||||
Product development | -325 | -254 | -138 | -126 | -315 | -865 | ||||||||||||||||||
Other investing activities | -398 | 161 | -573 | 42 | -42 | 110 | ||||||||||||||||||
Interest-bearing securities | 3,656 | -534 | -2,772 | 3,756 | -676 | -11,886 | ||||||||||||||||||
|
|
|
|
|
|
|
|
|
|
|
| |||||||||||||
Cash flow from investing activities | 1,603 | -1,809 | -3,797 | 3,316 | -2,005 | -13,584 | ||||||||||||||||||
Cash flow before financing activities | 3,045 | -236 | 7,362 | 3,298 | -2,004 | -15,125 | ||||||||||||||||||
Financing activities | ||||||||||||||||||||||||
Dividends paid | -3,289 | — | -1 | -145 | -3,274 | -4 | ||||||||||||||||||
Other financing activities | -383 | -94 | 2,073 | 1,563 | -5,636 | 10,902 | ||||||||||||||||||
|
|
|
|
|
|
|
|
|
|
|
| |||||||||||||
Cash flow from financing activities | -3,672 | -94 | 2,072 | 1,418 | -8,910 | 10,898 | ||||||||||||||||||
Effect of exchange rate changes on cash | 980 | 1,143 | 240 | 48 | -594 | 215 | ||||||||||||||||||
|
|
|
|
|
|
|
|
|
|
|
| |||||||||||||
Net change in cash and cash equivalents | 353 | 813 | 9,674 | 4,764 | -11,508 | -4,012 | ||||||||||||||||||
|
|
|
|
|
|
|
|
|
|
|
| |||||||||||||
Cash and cash equivalents, beginning of period | 36,697 | 35,884 | 26,210 | 21,446 | 32,954 | 36,966 | ||||||||||||||||||
|
|
|
|
|
|
|
|
|
|
|
| |||||||||||||
Cash and cash equivalents, end of period | 37,050 | 36,697 | 35,884 | 26,210 | 21,446 | 32,954 | ||||||||||||||||||
|
|
|
|
|
|
|
|
|
|
|
| |||||||||||||
23 Ericsson | Second Quarter Report 2018 |
Financial statements |
Table of Contents
Parent Company income statement
| Apr-Jun | Jan-Jun | Jan-Dec | ||||||||||||||||||
SEK million | 2018 | 2017 | 2018 | 2017 | 2017 | |||||||||||||||
Net sales | — | — | — | — | — | |||||||||||||||
Cost of sales | — | — | — | — | — | |||||||||||||||
|
|
|
|
|
|
|
|
|
| |||||||||||
Gross income | — | — | — | — | — | |||||||||||||||
Operating expenses | -352 | -355 | -506 | -644 | -1,294 | |||||||||||||||
Other operating income and expenses | 411 | 618 | 754 | 1,190 | 1,616 | |||||||||||||||
|
|
|
|
|
|
|
|
|
| |||||||||||
Operating income | 59 | 263 | 248 | 546 | 322 | |||||||||||||||
Financial net | 1,295 | 2,040 | 1,472 | 1,709 | -2,297 | |||||||||||||||
|
|
|
|
|
|
|
|
|
| |||||||||||
Income after financial items | 1,354 | 2,303 | 1,720 | 2,255 | -1,975 | |||||||||||||||
Transfers to (-) / from untaxed reserves | — | — | — | — | -120 | |||||||||||||||
Taxes | -72 | -98 | -155 | -108 | -53 | |||||||||||||||
|
|
|
|
|
|
|
|
|
| |||||||||||
Net income (loss) | 1,282 | 2,205 | 1,565 | 2,147 | -2,148 | |||||||||||||||
|
|
|
|
|
|
|
|
|
| |||||||||||
of comprehensive income (loss)
| Apr-Jun | Jan-Jun | Jan-Dec | ||||||||||||||||||
SEK million | 2018 | 2017 | 2018 | 2017 | 2017 | |||||||||||||||
Net income (loss) | 1,282 | 2,205 | 1,565 | 2,147 | -2,148 | |||||||||||||||
Revaluation of borrowings due to change in credit risk | -8 | — | 50 | — | — | |||||||||||||||
Tax on items that will not be reclassified to profit or loss | 2 | — | -11 | — | — | |||||||||||||||
Available-for-sale financial assets | ||||||||||||||||||||
Gains/losses arising during the period | — | 41 | — | 73 | 68 | |||||||||||||||
Reclassification adjustments on gains/losses included in profit or loss | — | 2 | — | 5 | 5 | |||||||||||||||
Revaluation of other investments in shares and participations | ||||||||||||||||||||
Fair value remeasurement | — | — | — | — | 102 | |||||||||||||||
Tax on items that may be reclassified to profit or loss | — | -9 | — | -17 | -14 | |||||||||||||||
|
|
|
|
|
|
|
|
|
| |||||||||||
Total other comprehensive income, net of tax | -6 | 34 | 39 | 61 | 161 | |||||||||||||||
|
|
|
|
|
|
|
|
|
| |||||||||||
Total comprehensive income (loss) | 1,276 | 2,239 | 1,604 | 2,208 | -1,987 | |||||||||||||||
|
|
|
|
|
|
|
|
|
| |||||||||||
24 Ericsson | Second Quarter Report 2018 |
Financial statements |
Table of Contents
SEK million | Jun 30 2018 | Dec 31 2017 | ||||||
ASSETS | ||||||||
Fixed assets | ||||||||
Intangible assets | 223 | 329 | ||||||
Tangible assets | 292 | 346 | ||||||
Financial assets1)2) | 114,269 | 119,896 | ||||||
|
|
|
| |||||
| 114,784 | 120,571 | |||||||
Current assets | ||||||||
Inventories | — | 1 | ||||||
Receivables2) | 42,362 | 41,173 | ||||||
Short-term investments | 7,862 | 6,446 | ||||||
Cash and cash equivalents | 24,219 | 18,715 | ||||||
|
|
|
| |||||
| 74,443 | 66,335 | |||||||
|
|
|
| |||||
Total assets | 189,227 | 186,906 | ||||||
|
|
|
| |||||
STOCKHOLDERS’ EQUITY, PROVISIONS AND LIABILITIES | ||||||||
Equity | ||||||||
Restricted equity | 48,164 | 48,164 | ||||||
Non-restricted equity2) | 37,939 | 39,578 | ||||||
|
|
|
| |||||
| 86,103 | 87,742 | |||||||
Provisions | 533 | 602 | ||||||
Non-current liabilities2) | 62,862 | 60,623 | ||||||
Current liabilities | 39,729 | 37,939 | ||||||
|
|
|
| |||||
Total stockholders’ equity, provisions and liabilities | 189,227 | 186,906 | ||||||
|
|
|
| |||||
1) Of which interest-bearing securities,non-current | 21,501 | 25,105 | ||||||
|
|
|
| |||||
| 2) | The following 2018 opening balances have been adjusted due to IFRS 9: financial assets increased by SEK 8 million, receivables decreased by SEK –4 million,non-restricted equity decreased by SEK –28 million, andnon-current liabilities increased by SEK 31 million. |
25 Ericsson | Second Quarter Report 2018 |
Financial statements |
Table of Contents
The group
This interim report is prepared in accordance with IAS 34. The term “IFRS” used in this document refers to the application of IAS and IFRS as well as interpretations of these standards as issued by IASB’s Standards Interpretation Committee (SIC) and IFRS Interpretations Committee (IFRIC). The accounting policies adopted are consistent with those of the annual report for the year ended December 31,2017 and should be read in conjunction with that annual report, with exception for the accounting policies described below.
New standards as from January 1, 2018
Two new IFRS standards are effective as from January 1, 2018, IFRS 9 “Financial instruments” and IFRS 15 “Revenue from Customer Contracts”.
Presentation in the financial statements
For IFRS 15 the Company has adopted the full retrospective method for transition, which mean that prior year comparatives have been restated and equity has been adjusted at the initial application date (January 1, 2016). The Company has applied IFRS 9 retrospectively on the required effective date, January 1, 2018. The 2018 opening balances have been adjusted, but the previous periods have not been restated.
Based on the new requirements under IFRS 15, contract assets and contract liabilities have been added as new lines in the consolidated balance sheet and statement of cash flow. Previously, contract assets were reported as trade receivables and contract liabilities were reported as deferred revenue and as advances from customers within other current liabilities. Due to IFRS 9, impairment losses on trade receivables are reported on a separate line in the consolidated income statement. Previously, these losses have been reported as Selling and administrative expenses. In the statement of comprehensive income, a new line has been added for revaluation of borrowings due to changes in credit risk. A new line has been added to the consolidated statement of equity showing the adjustment to the opening balance.
The prior periods financial statements and key ratios presented in this quarterly report have been restated to reflect adoption of these new standards.
Accounting policy – IFRS 9 “Financial instruments”
Financial assets
The Company classifies its financial assets in the following categories: at amortized cost, at fair value through other comprehensive income (FVOCI), and at fair value through profit or loss (FVTPL). The classification depends on the characteristics of the asset and the business model in which it is held.
Financial assets at amortized cost
Financial assets are classified as amortized cost if the contractual terms give rise to payments that are solely payments of principal and interest on the principal amount outstanding and the financial asset is held in a business model whose objective is to hold financial assets in order to collect contractual cash flows. These assets are subsequently measured at amortized cost using the effective interest method, minus impairment allowances.
Financial assets at fair value through other comprehensive income (FVOCI)
Assets are classified as FVOCI if the contractual terms give rise to payments that are solely payments of principal and interest on the principal amount outstanding and the financial asset is held in a business model whose objective is achieved by both collecting contractual cash flows and selling financial assets. These assets are subsequently measured at fair value with changes in fair value recognized in other comprehensive income (OCI), except for effective interest, impairment gains and losses and foreign exchange gains and losses recognized in the income statement. Upon derecognition, the cumulative gain or loss in OCI is reclassified to the income statement.
Financial assets at fair value through profit or loss (FVTPL)
All financial assets that are not classified as either amortized cost or FVOCI are classified as FVTPL. A financial asset is classified as held for trading if it is acquired principally for the purpose of selling in the near term. Derivatives are classified as held for trading, unless they are designated as hedging instruments for the purpose of hedge accounting. Assets held for trading are classified as current assets. Debt instruments classified as FVTPL, but not held for trading, are classified on the balance sheet based on their maturity date (i.e. those with a maturity longer than one year are classified asnon-current). Investments in shares and participations are classified as FVTPL and classified asnon-current financial assets.
Gains or losses arising from changes in the fair values of the “Financial assets at fair value through profit or loss” category (excluding derivatives and customer financing) are presented in the income statement within Financial income in the period in which they arise. Gains and losses on derivatives are presented in the income statement either as Cost of sales, Other operating income, Financial income or Financial expense, depending on the intent with the transaction. Gains and losses on customer financing are presented in the income statement as Selling expenses.
Impairment in relation to financial assets
At each balance sheet date, financial assets classified as either amortized cost or FVOCI and contract assets are assessed for impairment based on Expected Credit Losses (ECL). Allowances for trade receivables and contract assets are always equal to lifetime ECL. The loss is recognized in the income statement. When there is no reasonable expectation of collection, the asset is written off.
Borrowings
Borrowings by the Parent Company are designated FVTPL because they are managed and evaluated on a fair value basis. Changes in fair value are recognized in the income statement, except for changes in fair value due to change in credit risk which are recognized in Other comprehensive income.
26 Ericsson | Second Quarter Report 2018 |
Additional information |
Table of Contents
| Summary of changes to classification of financial assets and financial liabilities | ||||||
Type of asset | IAS 39 classification | IFRS 9 classification | Reason for IFRS 9 classification | |||
| Cash equivalents, interest-bearing securities, and derivatives (held for trading) | FVTPL | FVTPL | Held for trading portfolios are classified as FVTPL (no change). | |||
| Cash equivalents (not held for trading) | Loans and receivables | Amortized cost | These assets are held to collect contractual cash flows. | |||
| Interest-bearing securities (not held for trading) | Available-for-sale | FVTPL | These assets are not held for trading but are managed and evaluated on a fair value basis. | |||
| Trade receivables | Loans and receivables | FVOCI | Trade receivables are managed in a business model whose objective is achieved through both collection of contractual cash flows and selling of assets. | |||
| Customer financing | Loans and receivables | FVTPL | Customer finance assets are managed in a business model with the objective to realize cash flows through the sale of assets. | |||
| Investments in shares and participations (equity instruments) | Available-for-sale | FVTPL | This is an accounting policy choice under IFRS 9. | |||
| Borrowings by parent company | Amortized cost | Designated FVTPL | These borrowings are managed and evaluated on a fair value basis. | |||
Fair value hedging and fair value hedge accounting
Fair value hedge accounting is no longer applied as of January 1, 2018.
Financial guarantees
Financial guarantee contracts are initially recognized at fair value (i.e., usually the fee received). Subsequently, these contracts are measured at the higher of:
– The expected credit losses.
– The recognized contractual fee less cumulative amortization when amortized over the guarantee period, using the straight-line-method.
Accounting policy – IFRS 15 “Revenue from Contracts with Customers”
IFRS 15, “Revenue from Contracts with Customers” establishes a new principle-based model of recognizing revenue from customer contracts. It introduces a five-step model that requires revenue to be recognized when control over goods and services are transferred to the customer.
The following paragraphs describes the types of contracts, when performance obligations are satisfied, and the timing of revenue recognition. They also describe the normal payment terms associated with such contracts and the resulting impact on the balance sheet over the duration of the contracts. The vast majority of Ericsson’s business is for the sale of standard products and services.
Standard products and services
Products and services are classified as standard solutions if they do not require significant installation and integration services to be delivered. Installation and integration services are generally completed within a short period of time, from the delivery of the related products. These products and services are viewed as separate distinct performance obligations. This type of customer contract is usually signed as a frame agreement and the customer issues individual purchase orders to commit to purchases of products and services over the duration of the agreement.
Revenue for standard products shall be recognized when control over the equipment is transferred to the customer at a point in time. This assessment shall be viewed from a customer’s perspective considering indicators such as transfer of titles and risks, customer acceptance, physical possession, and billing rights. For hardware sales, transfer of control is usually deemed to occur when the equipment arrives at the customer site and for software sales, when the licenses are made available to the customer. Contractual terms may vary, therefore judgment will be applied when assessing the indicators of transfer of control. Revenue for installation and integration services is recognized upon completion of the service.
Transaction prices under these contracts are mostly billed upon delivery of the hardware or software, and completion of installation services, although a proportion may be billed upon formal acceptance of the related installation services. This will result in a contract asset for the proportion of the transaction price that is not yet billed.
Revenue for recurring services such as customer support and managed services is recognized as the services are delivered, generallypro-rata over time. Transaction prices under these contracts are billed over time, often on a quarterly basis. Contract liabilities or receivables may arise depending on whether the quarterly billing is in advance or in arrears.
Contract for standard products and services applies to business in all segments.
Customized solution
Some products and services are sold together as part of a customized solution to the customer. This type of contract requires significant installation and integration services to be delivered within the solution, normally over a period of more than 1 year. These products and services are viewed together as a combined performance obligation. This type of contract is usually sold as a firm contract in which the scope of the solution and obligations of both parties are clearly defined for the duration of the contract.
27 Ericsson | Second Quarter Report 2018 |
Additional information |
Table of Contents
Revenue for the combined performance obligation shall be recognized over time if progress of completion can be reliably measured and enforceable right to payment exists over the duration of the contract. The progress of completion is estimated by reference to the output delivered such as achievement of contract milestones and customer acceptance. This method is considered appropriate as it reflects the nature of the customized solution and how integration service is delivered in these projects. Formal acceptance term is considered a key indicator of transfer of control for a customized solution and shall therefore be obtained prior to recognizing revenue. If the criteria above are not met, then all revenue shall be recognized upon the completion of the customized solution, when final acceptance is provided by the customer.
Transaction price under these contracts are represented by progress payments or billing milestones as defined in the contracts. In most cases, revenue recognized is limited to the progress payments or unconditional billing milestones over the duration of the contract, therefore no contract asset or contract liability arises on these contracts. In some contracts, revenue may be recognized in advance of billing milestones if enforceable payment rights exist at all times over the contract duration. This will result in a contract asset balance until billing milestones are reached.
Contract for customized solution applies to the Business Support Systems (BSS) business within the segment Digital Services and the Media Solutions business within the segment Emerging Business and Other.
Intellectual Property Rights (IPR)
This type of contract relates to the patent and licensing business. The Company has assessed that the nature of its IPR contracts is such that they provide customers a license with the right to access Ericsson intellectual properties over time, therefore revenue shall be recognized over the duration of the contract. Royalty revenue based on sales or usage is recognized when the sales and usage occurs.
The transaction price on these contracts is usually structured as a royalty fee based on sales or usage over the period, measured on a quarterly basis. This results in a receivable balance if the billing is performed the following quarter after measurement. Some contracts include lump sum amounts, payable either up front at commencement or on an annual basis. This results in a contract liability balance if payment is in advance of revenue, as revenue is recognized over time.
As described in Note C3 “Segment Information” of the Annual Report 2017, revenue from IPR licensing contracts are allocated to the segments Networks and Digital Services.
| Impact of IFRS 9 and IFRS 15 on balance sheet items | ||||||||||||||||||||
| Restated | Adjusted | |||||||||||||||||||
| As reported at | IFRS 15 | balance at | IFRS 9 | balance at | ||||||||||||||||
| 31.12 2017 | restatement | 31.12.2017 | adjustment | 1.1.2018 | ||||||||||||||||
ASSETS | ||||||||||||||||||||
Non-current assets | ||||||||||||||||||||
Deferred tax assets | 21,228 | 735 | 21,963 | 288 | 22,251 | |||||||||||||||
Current assets | ||||||||||||||||||||
Inventories | 24,960 | 587 | 25,547 | — | 25,547 | |||||||||||||||
Contract assets | — | 13,120 | 13,120 | — | 13,120 | |||||||||||||||
Trade receivables | 63,210 | -15,105 | 48,105 | -1,240 | 46,865 | |||||||||||||||
EQUITY AND LIABILITIES | ||||||||||||||||||||
Equity | ||||||||||||||||||||
Stockholder’s equity | 99,540 | -2,605 | 96,935 | -983 | 95,952 | |||||||||||||||
Non-current liabilities | ||||||||||||||||||||
Borrowings,non-current | 30,500 | — | 30,500 | 31 | 30,531 | |||||||||||||||
Current liabilities | ||||||||||||||||||||
Provisions | 6,350 | -67 | 6,283 | — | 6,283 | |||||||||||||||
Contract liabilities | — | 29,076 | 29,076 | — | 29,076 | |||||||||||||||
Other current liabilities | 62,370 | -27,065 | 35,305 | — | 35,305 | |||||||||||||||
Changes applied in Q1 2018
As of Q1 2018, sales related to 3PP routing business are reported in Networks (earlier Digital Services). Comparative periods have been restated to reflect this change. In Q1 2018, these sales were SEK 151 (160) million.
Changes applied in Q2 2018
As of Q2 2018, sales related to Application Development and Maintenance (ADM) and certain sales related to Business Support Solution (BSS) was moved between segments Managed Services and Digital Services, with increased sales in Managed Services and a corresponding sales decrease in Digital Services (net effect of SEK 1.9 b in 2017). The corresponding impact on 2017 gross income was SEK 0.2 b (positive for Managed Services, negative for Digital Services). Historical data has been restated to reflect the organizational change.
28 Ericsson | Second Quarter Report 2018 |
Additional information |
Table of Contents
29 Ericsson | Second Quarter Report 2018 |
Additional information |
Table of Contents
30 Ericsson | Second Quarter Report 2018 |
Additional information |
Table of Contents
31 Ericsson | Second Quarter Report 2018 |
Additional information |
Table of Contents
EBITA and EBITA margin by segment by quarter
| Isolated quarters, | 2018 | 2017 | ||||||||||||||||||||||
SEK million | Q2 | Q1 | Q4 | Q3 | Q2 | Q1 | ||||||||||||||||||
Networks | 3,618 | 3,461 | 2,032 | 2,460 | 3,509 | 2,892 | ||||||||||||||||||
Digital Services | -2,204 | -2,443 | -4,890 | -3,577 | -2,034 | -8,246 | ||||||||||||||||||
Managed Services | 303 | 105 | -1,268 | -726 | -259 | -1,825 | ||||||||||||||||||
Emerging Business and Other | -1,202 | -1,088 | -1,199 | -1,430 | -1,308 | -2,222 | ||||||||||||||||||
|
|
|
|
|
|
|
|
|
|
|
| |||||||||||||
Total | 515 | 35 | -5,325 | -3,273 | -92 | -9,401 | ||||||||||||||||||
|
|
|
|
|
|
|
|
|
|
|
| |||||||||||||
| Isolated quarters | 2018 | 2017 | ||||||||||||||||||||||
As percentage of net sales | Q2 | Q1 | Q4 | Q3 | Q2 | Q1 | ||||||||||||||||||
Networks | 11.2 | % | 12.1 | % | 5.5 | % | 7.7 | % | 11.1 | % | 9.1 | % | ||||||||||||
Digital Services | -25.0 | % | -33.6 | % | -41.4 | % | -40.1 | % | -20.5 | % | -101.8 | % | ||||||||||||
Managed Services | 4.6 | % | 1.8 | % | -18.4 | % | -11.0 | % | -3.9 | % | -29.0 | % | ||||||||||||
Emerging Business and Other | -58.5 | % | -65.9 | % | -57.5 | % | -71.7 | % | -65.1 | % | -124.8 | % | ||||||||||||
|
|
|
|
|
|
|
|
|
|
|
| |||||||||||||
Total | 1.0 | % | 0.1 | % | -9.2 | % | -6.6 | % | -0.2 | % | -19.7 | % | ||||||||||||
|
|
|
|
|
|
|
|
|
|
|
| |||||||||||||
| Year to date, | 2018 | 2017 | ||||||||||||||||||||||
SEK million | Jan-Jun | Jan-Mar | Jan-Dec | Jan-Sep | Jan-Jun | Jan-Mar | ||||||||||||||||||
Networks | 7,079 | 3,461 | 10,893 | 8,861 | 6,401 | 2,892 | ||||||||||||||||||
Digital Services | -4,647 | -2,443 | -18,747 | -13,857 | -10,280 | -8,246 | ||||||||||||||||||
Managed Services | 408 | 105 | -4,078 | -2,810 | -2,084 | -1,825 | ||||||||||||||||||
Emerging Business and Other | -2,290 | -1,088 | -6,159 | -4,960 | -3,530 | -2,222 | ||||||||||||||||||
|
|
|
|
|
|
|
|
|
|
|
| |||||||||||||
Total | 550 | 35 | -18,091 | -12,766 | -9,493 | -9,401 | ||||||||||||||||||
|
|
|
|
|
|
|
|
|
|
|
| |||||||||||||
| Year to date | 2018 | 2017 | ||||||||||||||||||||||
As a percentage of net sales | Jan-Jun | Jan-Mar | Jan-Dec | Jan-Sep | Jan-Jun | Jan-Mar | ||||||||||||||||||
Networks | 11.6 | % | 12.1 | % | 8.2 | % | 9.3 | % | 10.1 | % | 9.1 | % | ||||||||||||
Digital Services | -28.9 | % | -33.6 | % | -48.4 | % | -51.5 | % | -57.1 | % | -101.8 | % | ||||||||||||
Managed Services | 3.3 | % | 1.8 | % | -15.4 | % | -14.4 | % | -16.1 | % | -29.0 | % | ||||||||||||
Emerging Business and Other | -61.8 | % | -65.9 | % | -78.3 | % | -85.8 | % | -93.2 | % | -124.8 | % | ||||||||||||
|
|
|
|
|
|
|
|
|
|
|
| |||||||||||||
Total | 0.6 | % | 0.1 | % | -8.8 | % | -8.7 | % | -9.7 | % | -19.7 | % | ||||||||||||
|
|
|
|
|
|
|
|
|
|
|
| |||||||||||||
32 Ericsson | Second Quarter Report 2018 |
Additional information |
Table of Contents
Net sales by market area by quarter
| 2018 | 2017 | |||||||||||||||||||||||
Isolated quarters, SEK million | Q2 | Q1 | Q4 | Q3 | Q2 | Q1 | ||||||||||||||||||
South East Asia, Oceania and India | 6,981 | 6,379 | 7,844 | 7,858 | 7,234 | 8,410 | ||||||||||||||||||
North East Asia | 4,764 | 3,385 | 6,465 | 5,653 | 5,901 | 5,564 | ||||||||||||||||||
North America | 14,337 | 11,317 | 14,685 | 12,319 | 12,970 | 12,027 | ||||||||||||||||||
Europe and Latin America1)2) | 14,174 | 13,061 | 16,939 | 13,430 | 14,231 | 12,201 | ||||||||||||||||||
Middle East and Africa | 5,626 | 5,765 | 7,581 | 6,297 | 5,731 | 5,356 | ||||||||||||||||||
Other1)2) | 3,926 | 3,504 | 4,367 | 3,856 | 4,214 | 4,245 | ||||||||||||||||||
|
|
|
|
|
|
|
|
|
|
|
| |||||||||||||
Total | 49,808 | 43,411 | 57,881 | 49,413 | 50,281 | 47,803 | ||||||||||||||||||
|
|
|
|
|
|
|
|
|
|
|
| |||||||||||||
1)Of which in Sweden | 596 | 915 | 872 | 660 | 785 | 1,017 | ||||||||||||||||||
2)Of which in EU | 8,619 | 8,522 | 10,822 | 8,635 | 8,687 | 8,328 | ||||||||||||||||||
| 2018 | 2017 | |||||||||||||||||||||||
Sequential change, percent | Q2 | Q1 | Q4 | Q3 | Q2 | Q1 | ||||||||||||||||||
South East Asia, Oceania and India | 9 | % | -19 | % | 0 | % | 9 | % | -14 | % | — | |||||||||||||
North East Asia | 41 | % | -48 | % | 14 | % | -4 | % | 6 | % | — | |||||||||||||
North America | 27 | % | -23 | % | 19 | % | -5 | % | 8 | % | — | |||||||||||||
Europe and Latin America1)2) | 9 | % | -23 | % | 26 | % | -6 | % | 17 | % | — | |||||||||||||
Middle East and Africa | -2 | % | -24 | % | 20 | % | 10 | % | 7 | % | — | |||||||||||||
Other1)2) | 12 | % | -20 | % | 13 | % | -8 | % | -1 | % | — | |||||||||||||
|
|
|
|
|
|
|
|
|
|
|
| |||||||||||||
Total | 15 | % | -25 | % | 17 | % | -2 | % | 5 | % | — | |||||||||||||
|
|
|
|
|
|
|
|
|
|
|
| |||||||||||||
1)Of which in Sweden | -35 | % | 5 | % | 32 | % | -16 | % | -23 | % | — | |||||||||||||
2)Of which in EU | 1 | % | -21 | % | 25 | % | -1 | % | 4 | % | — | |||||||||||||
| 2018 | 2017 | |||||||||||||||||||||||
Year-over-year change, percent | Q2 | Q1 | Q4 | Q3 | Q2 | Q1 | ||||||||||||||||||
South East Asia, Oceania and India | -3 | % | -24 | % | — | — | — | — | ||||||||||||||||
North East Asia | -19 | % | -39 | % | — | — | — | — | ||||||||||||||||
North America | 11 | % | -6 | % | — | — | — | — | ||||||||||||||||
Europe and Latin America1)2) | 0 | % | 7 | % | — | — | — | — | ||||||||||||||||
Middle East and Africa | -2 | % | 8 | % | — | — | — | — | ||||||||||||||||
Other1)2) | -7 | % | -17 | % | — | — | — | — | ||||||||||||||||
|
|
|
|
|
|
|
|
|
|
|
| |||||||||||||
Total | -1 | % | -9 | % | — | — | — | — | ||||||||||||||||
|
|
|
|
|
|
|
|
|
|
|
| |||||||||||||
1)Of which in Sweden | -24 | % | -10 | % | — | — | — | — | ||||||||||||||||
2)Of which in EU | -1 | % | 2 | % | — | — | — | — | ||||||||||||||||
| 2018 | 2017 | |||||||||||||||||||||||
Year to date, SEK million | Jan-Jun | Jan-Mar | Jan-Dec | Jan-Sep | Jan-Jun | Jan-Mar | ||||||||||||||||||
South East Asia, Oceania and India | 13,360 | 6,379 | 31,346 | 23,502 | 15,644 | 8,410 | ||||||||||||||||||
North East Asia | 8,149 | 3,385 | 23,583 | 17,118 | 11,465 | 5,564 | ||||||||||||||||||
North America | 25,654 | 11,317 | 52,001 | 37,316 | 24,997 | 12,027 | ||||||||||||||||||
Europe and Latin America1)2) | 27,235 | 13,061 | 56,801 | 39,862 | 26,432 | 12,201 | ||||||||||||||||||
Middle East and Africa | 11,391 | 5,765 | 24,965 | 17,384 | 11,087 | 5,356 | ||||||||||||||||||
Other1)2) | 7,430 | 3,504 | 16,682 | 12,315 | 8,459 | 4,245 | ||||||||||||||||||
|
|
|
|
|
|
|
|
|
|
|
| |||||||||||||
Total | 93,219 | 43,411 | 205,378 | 147,497 | 98,084 | 47,803 | ||||||||||||||||||
|
|
|
|
|
|
|
|
|
|
|
| |||||||||||||
1)Of which in Sweden | 1,511 | 915 | 3,334 | 2,462 | 1,802 | 1,017 | ||||||||||||||||||
2)Of which in EU | 17,141 | 8,522 | 36,472 | 25,650 | 17,015 | 8,328 | ||||||||||||||||||
| Year to date, year-over-year change, | 2018 | 2017 | ||||||||||||||||||||||
percent | Jan-Jun | Jan-Mar | Jan-Dec | Jan-Sep | Jan-Jun | Jan-Mar | ||||||||||||||||||
South East Asia, Oceania and India | -15 | % | -24 | % | 0 | % | — | — | — | |||||||||||||||
North East Asia | -29 | % | -39 | % | -13 | % | — | — | — | |||||||||||||||
North America | 3 | % | -6 | % | 1 | % | — | — | — | |||||||||||||||
Europe and Latin America1)2) | 3 | % | 7 | % | -9 | % | — | — | — | |||||||||||||||
Middle East and Africa | 3 | % | 8 | % | -9 | % | — | — | — | |||||||||||||||
Other1)2) | -12 | % | -17 | % | -18 | % | — | — | — | |||||||||||||||
|
|
|
|
|
|
|
|
|
|
|
| |||||||||||||
Total | -5 | % | -9 | % | -7 | % | — | — | — | |||||||||||||||
|
|
|
|
|
|
|
|
|
|
|
| |||||||||||||
1)Of which in Sweden | -16 | % | -10 | % | -1 | % | — | — | — | |||||||||||||||
2)Of which in EU | 1 | % | 2 | % | -6 | % | — | — | — | |||||||||||||||
33 Ericsson | Second Quarter Report 2018 |
Additional information |
Table of Contents
| Country | Q2 | Jan-Jun | ||||||||||||||
Percentage of Net sales | 2018 | 2017 | 2018 | 2017 | ||||||||||||
United States | 30 | % | 28 | % | 29 | % | 27 | % | ||||||||
China | 6 | % | 9 | % | 5 | % | 8 | % | ||||||||
India | 5 | % | 4 | % | 5 | % | 5 | % | ||||||||
Australia | 3 | % | 4 | % | 3 | % | 4 | % | ||||||||
Japan | 3 | % | 2 | % | 3 | % | 3 | % | ||||||||
Net sales by market area by segment
| Q2 2018 | Jan-Jun 2018 | |||||||||||||||||||||||||||||||||||||||
SEK million | Networks | Digital Services | Managed Services | Emerging Business and Other | Total | Networks | Digital Services | Managed Services | Emerging Business and Other | Total | ||||||||||||||||||||||||||||||
South East Asia, Oceania and India | 4,987 | 1,077 | 915 | 2 | 6,981 | 9,406 | 2,304 | 1,640 | 10 | 13,360 | ||||||||||||||||||||||||||||||
North East Asia | 3,596 | 792 | 368 | 8 | 4,764 | 5,839 | 1,524 | 754 | 32 | 8,149 | ||||||||||||||||||||||||||||||
North America | 11,358 | 2,136 | 822 | 21 | 14,337 | 20,706 | 3,482 | 1,417 | 49 | 25,654 | ||||||||||||||||||||||||||||||
Europe and Latin America | 7,753 | 2,908 | 3,434 | 79 | 14,174 | 15,203 | 5,207 | 6,678 | 147 | 27,235 | ||||||||||||||||||||||||||||||
Middle East and Africa | 3,034 | 1,594 | 990 | 8 | 5,626 | 6,529 | 2,915 | 1,935 | 12 | 11,391 | ||||||||||||||||||||||||||||||
Other | 1,665 | 326 | -1 | 1,936 | 3,926 | 3,312 | 663 | — | 3,455 | 7,430 | ||||||||||||||||||||||||||||||
|
|
|
|
|
|
|
|
|
|
|
|
|
|
|
|
|
|
|
| |||||||||||||||||||||
Total | 32,393 | 8,833 | 6,528 | 2,054 | 49,808 | 60,995 | 16,095 | 12,424 | 3,705 | 93,219 | ||||||||||||||||||||||||||||||
|
|
|
|
|
|
|
|
|
|
|
|
|
|
|
|
|
|
|
| |||||||||||||||||||||
Share of total | 65 | % | 18 | % | 13 | % | 4 | % | 100 | % | 66 | % | 17 | % | 13 | % | 4 | % | 100 | % | ||||||||||||||||||||
| Q2 2018 | ||||||||||||||||||||
| Emerging | ||||||||||||||||||||
| Sequential change, | Digital | Managed | Business | |||||||||||||||||
percent | Networks | Services | Services | and Other | Total | |||||||||||||||
South East Asia, Oceania and | ||||||||||||||||||||
India | 13 | % | -12 | % | 26 | % | -75 | % | 9 | % | ||||||||||
North East Asia | 60 | % | 8 | % | -5 | % | -67 | % | 41 | % | ||||||||||
North America | 22 | % | 59 | % | 38 | % | -25 | % | 27 | % | ||||||||||
Europe and Latin America | 4 | % | 26 | % | 6 | % | 16 | % | 9 | % | ||||||||||
Middle East and Africa | -13 | % | 21 | % | 5 | % | 100 | % | -2 | % | ||||||||||
Other | 1 | % | -3 | % | — | 27 | % | 12 | % | |||||||||||
|
|
|
|
|
|
|
|
|
| |||||||||||
Total | 13 | % | 22 | % | 11 | % | 24 | % | 15 | % | ||||||||||
|
|
|
|
|
|
|
|
|
| |||||||||||
| Q2 2018 | Jan-Jun 2018 | |||||||||||||||||||||||||||||||||||||||
| Emerging | Emerging | |||||||||||||||||||||||||||||||||||||||
| Year over year change, | Digital | Managed | Business | Digital | Managed | Business | ||||||||||||||||||||||||||||||||||
percent | Networks | Services | Services | and Other | Total | Networks | Services | Services | and Other | Total | ||||||||||||||||||||||||||||||
South East Asia, Oceania and India | -5 | % | -12 | % | 18 | % | -33 | % | -3 | % | -19 | % | -5 | % | 6 | % | 233 | % | -15 | % | ||||||||||||||||||||
North East Asia | -5 | % | -52 | % | -17 | % | 700 | % | -19 | % | -28 | % | -39 | % | -11 | % | 967 | % | -29 | % | ||||||||||||||||||||
North America | 15 | % | -2 | % | -8 | % | -19 | % | 11 | % | 8 | % | -11 | % | -19 | % | -4 | % | 3 | % | ||||||||||||||||||||
Europe and Latin America | 1 | % | -1 | % | -3 | % | 84 | % | 0 | % | 8 | % | -5 | % | -2 | % | 116 | % | 3 | % | ||||||||||||||||||||
Middle East and Africa | -5 | % | 5 | % | -3 | % | — | -2 | % | 5 | % | 2 | % | -4 | % | — | 3 | % | ||||||||||||||||||||||
Other | -12 | % | -14 | % | — | 0 | % | -7 | % | -18 | % | -13 | % | — | -6 | % | -12 | % | ||||||||||||||||||||||
|
|
|
|
|
|
|
|
|
|
|
|
|
|
|
|
|
|
|
| |||||||||||||||||||||
Total | 2 | % | -11 | % | -2 | % | 2 | % | -1 | % | -4 | % | -11 | % | -4 | % | -2 | % | -5 | % | ||||||||||||||||||||
|
|
|
|
|
|
|
|
|
|
|
|
|
|
|
|
|
|
|
| |||||||||||||||||||||
34 Ericsson | Second Quarter Report 2018 |
Additional information |
Table of Contents
IPR licensing revenues by segment by quarter
| Isolated quarters, | 2018 | 2017 | ||||||||||||||||||||||
SEK million | Q2 | Q1 | Q4 | Q3 | Q2 | Q1 | ||||||||||||||||||
Networks | 1,486 | 1,522 | 1,731 | 1,640 | 1,670 | 1,724 | ||||||||||||||||||
Digital Services | 326 | 334 | 380 | 360 | 366 | 379 | ||||||||||||||||||
|
|
|
|
|
|
|
|
|
|
|
| |||||||||||||
Total | 1,812 | 1,856 | 2,111 | 2,000 | 2,036 | 2,103 | ||||||||||||||||||
|
|
|
|
|
|
|
|
|
|
|
| |||||||||||||
| 2018 | 2017 | |||||||||||||||||||||||
Year to date, SEK million | Jan-Jun | Jan-Mar | Jan-Dec | Jan-Sep | Jan-Jun | Jan-Mar | ||||||||||||||||||
Networks | 3,008 | 1,522 | 6,765 | 5,034 | 3,394 | 1,724 | ||||||||||||||||||
Digital Services | 660 | 334 | 1,485 | 1,105 | 745 | 379 | ||||||||||||||||||
|
|
|
|
|
|
|
|
|
|
|
| |||||||||||||
Total | 3,668 | 1,856 | 8,250 | 6,139 | 4,139 | 2,103 | ||||||||||||||||||
|
|
|
|
|
|
|
|
|
|
|
| |||||||||||||
| 2018 | 2017 | |||||||||||||||||||||||
Isolated quarters, SEK million | Q2 | Q1 | Q4 | Q3 | Q2 | Q1 | ||||||||||||||||||
Opening balance | 9,030 | 9,879 | 9,514 | 10,357 | 10,514 | 6,320 | ||||||||||||||||||
Additions | 1,974 | 1,315 | 2,769 | 1,942 | 1,403 | 6,365 | ||||||||||||||||||
Utilization/Cash out | -1,486 | -2,216 | -2,186 | -2,626 | -1,324 | -2,085 | ||||||||||||||||||
Of which restructuring | -832 | -1,424 | -1,204 | -1,461 | -1,075 | -1,586 | ||||||||||||||||||
Reversal of excess amounts | -191 | -117 | -199 | -32 | -65 | -66 | ||||||||||||||||||
Reclassification, translation difference and other | 207 | 169 | -19 | -127 | -171 | -20 | ||||||||||||||||||
|
|
|
|
|
|
|
|
|
|
|
| |||||||||||||
Closing balance | 9,534 | 9,030 | 9,879 | 9,514 | 10,357 | 10,514 | ||||||||||||||||||
|
|
|
|
|
|
|
|
|
|
|
| |||||||||||||
Of which restructuring | 4,029 | 3,524 | 4,043 | 3,458 | 4,003 | 4,059 | ||||||||||||||||||
| 2018 | 2017 | |||||||||||||||||||||||
Year to date, SEK million | Jan-Jun | Jan-Mar | Jan-Dec | Jan-Sep | Jan-Jun | Jan-Mar | ||||||||||||||||||
Opening balance | 9,879 | 9,879 | 6,320 | 6,320 | 6,320 | 6,320 | ||||||||||||||||||
Additions | 3,289 | 1,315 | 12,479 | 9,710 | 7,768 | 6,365 | ||||||||||||||||||
Utilization/Cash out | -3,702 | -2,216 | -8,221 | -6,035 | -3,409 | -2,085 | ||||||||||||||||||
Of which restructuring | -2,256 | -1,424 | -5,326 | -4,122 | -2,661 | -1,586 | ||||||||||||||||||
Reversal of excess amounts | -308 | -117 | -362 | -163 | -131 | -66 | ||||||||||||||||||
Reclassification, translation difference and other | 376 | 169 | -337 | -318 | -191 | -20 | ||||||||||||||||||
|
|
|
|
|
|
|
|
|
|
|
| |||||||||||||
Closing balance | 9,534 | 9,030 | 9,879 | 9,514 | 10,357 | 10,514 | ||||||||||||||||||
|
|
|
|
|
|
|
|
|
|
|
| |||||||||||||
Of which restructuring | 4,029 | 3,524 | 4,043 | 3,458 | 4,003 | 4,059 | ||||||||||||||||||
35 Ericsson | Second Quarter Report 2018 |
Additional information |
Table of Contents
Investments in assets subject to depreciation, amortization, impairment and write-downs
| 2018 | 2017 | |||||||||||||||||||||||
Isolated quarters, SEK million | Q2 | Q1 | Q4 | Q3 | Q2 | Q1 | ||||||||||||||||||
Additions | ||||||||||||||||||||||||
Property, plant and equipment | 951 | 856 | 1,105 | 739 | 1,018 | 1,015 | ||||||||||||||||||
Capitalized development expenses | 325 | 254 | 138 | 126 | 315 | 865 | ||||||||||||||||||
Goodwill, IPR, brands and other intangible assets | 124 | 421 | 315 | 1 | 19 | 1 | ||||||||||||||||||
|
|
|
|
|
|
|
|
|
|
|
| |||||||||||||
Total | 1,400 | 1,531 | 1,558 | 866 | 1,352 | 1,881 | ||||||||||||||||||
|
|
|
|
|
|
|
|
|
|
|
| |||||||||||||
Depreciation, amortization and impairment losses | ||||||||||||||||||||||||
Property, plant and equipment | 1,080 | 928 | 1,284 | 2,894 | 1,061 | 1,075 | ||||||||||||||||||
Capitalized development expenses | 635 | 616 | 881 | 874 | 690 | 2,481 | ||||||||||||||||||
Goodwill, IPR, brands and other intangible assets | 350 | 347 | 13,953 | 378 | 446 | 1,875 | ||||||||||||||||||
|
|
|
|
|
|
|
|
|
|
|
| |||||||||||||
Total | 2,065 | 1,891 | 16,118 | 4,146 | 2,197 | 5,431 | ||||||||||||||||||
|
|
|
|
|
|
|
|
|
|
|
| |||||||||||||
| 2018 | 2017 | |||||||||||||||||||||||
Year to date, SEK million | Jan-Jun | Jan-Mar | Jan-Dec | Jan-Sep | Jan-Jun | Jan-Mar | ||||||||||||||||||
Additions | ||||||||||||||||||||||||
Property, plant and equipment | 1,807 | 856 | 3,877 | 2,772 | 2,033 | 1,015 | ||||||||||||||||||
Capitalized development expenses | 579 | 254 | 1,444 | 1,306 | 1,180 | 865 | ||||||||||||||||||
Goodwill, IPR, brands and other intangible assets | 545 | 421 | 336 | 21 | 20 | 1 | ||||||||||||||||||
|
|
|
|
|
|
|
|
|
|
|
| |||||||||||||
Total | 2,931 | 1,531 | 5,657 | 4,099 | 3,233 | 1,881 | ||||||||||||||||||
|
|
|
|
|
|
|
|
|
|
|
| |||||||||||||
Depreciation, amortization and impairment losses | ||||||||||||||||||||||||
Property, plant and equipment | 2,008 | 928 | 6,314 | 5,030 | 2,136 | 1,075 | ||||||||||||||||||
Capitalized development expenses | 1,251 | 616 | 4,926 | 4,045 | 3,171 | 2,481 | ||||||||||||||||||
Goodwill, IPR, brands and other intangible assets | 697 | 347 | 16,652 | 2,699 | 2,321 | 1,875 | ||||||||||||||||||
|
|
|
|
|
|
|
|
|
|
|
| |||||||||||||
Total | 3,956 | 1,891 | 27,892 | 11,774 | 7,628 | 5,431 | ||||||||||||||||||
|
|
|
|
|
|
|
|
|
|
|
| |||||||||||||
36 Ericsson | Second Quarter Report 2018 |
Additional information |
Table of Contents
| 1) | Potential ordinary shares are not considered when their conversion to ordinary shares would increase earnings per share. |
| 2) | Excluding amortizations and write-downs of acquired intangibles and restructuring charges. |
37 Ericsson | Second Quarter Report 2018 |
Additional information |
Table of Contents
Items excluding restructuring charges
38 Ericsson | Second Quarter Report 2018 |
Items excluding restructuring charges |
Table of Contents
39 Ericsson | Second Quarter Report 2018 |
Items excluding restructuring charges |
Table of Contents
40 Ericsson | Second Quarter Report 2018 |
Items excluding restructuring charges |
Table of Contents
Alternative performance measures
This section includes a reconciliation of certain Alternative Performance Measures (APMs) to the most directly reconcilable line items in the financial statements. The presentation of APMs has limitations as analytical tools and should not be considered in isolation or as a substitute for related financial measures prepared in accordance with IFRS.
APMs are presented to enhance an investor’s evaluation of ongoing operating results, to aid in forecasting future periods and to facilitate meaningful comparison of results between periods.
Management uses these APMs to, among other things, evaluate ongoing operations in relation to historical results, for internal planning and forecasting purposes and in the calculation of certain performance-based compensation.
The APMs presented in this report may differ from similarly titled measures used by other companies.
For additional information, see Alternative Performance Measures in the Ericsson Annual Report 2017.
comparable units and currency
Sales growth adjusted for the impact of acquisitions and divestments as well as the effects of foreign currency fluctuations.
| 2018 | 2017 | |||||||||||||||||||||||
Isolated quarter, sequential change | Q2 | Q1 | Q4 | Q3 | Q2 | Q1 | ||||||||||||||||||
Reported net sales | 49,808 | 43,411 | — | — | — | — | ||||||||||||||||||
Acquired/divested business | — | — | — | — | — | — | ||||||||||||||||||
Net FX impact | -2,460 | 423 | — | — | — | — | ||||||||||||||||||
Comparable net sales, excluding FX impact | 47,348 | 43,834 | — | — | — | — | ||||||||||||||||||
Sales growth adjusted for comparable units and currency (%) | 9 | % | -24 | % | — | — | — | — | ||||||||||||||||
| 2018 | 2017 | |||||||||||||||||||||||
Isolated quarter, year over year change | Q2 | Q1 | Q4 | Q3 | Q2 | Q1 | ||||||||||||||||||
Reported net sales | 49,808 | 43,411 | — | — | — | — | ||||||||||||||||||
Acquired/divested business | — | — | — | — | — | — | ||||||||||||||||||
Net FX impact | -263 | 3,328 | — | — | — | — | ||||||||||||||||||
Comparable net sales, excluding FX impact | 49,545 | 46,739 | — | — | — | — | ||||||||||||||||||
Sales growth adjusted for comparable units and currency (%) | -1 | % | -2 | % | — | — | — | — | ||||||||||||||||
| 2018 | 2017 | |||||||||||||||||||||||
Year to date, year over year change | Jan-Jun | Jan-Mar | Jan-Dec | Jan-Sep | Jan-Jun | Jan-Mar | ||||||||||||||||||
Reported net sales | 93,219 | 43,411 | — | — | — | — | ||||||||||||||||||
Acquired/divested business | — | — | — | — | — | — | ||||||||||||||||||
Net FX impact | 3,065 | 3,328 | — | — | — | — | ||||||||||||||||||
Comparable net sales, excluding FX impact | 96,284 | 46,739 | — | — | — | — | ||||||||||||||||||
Sales growth adjusted for comparable units and currency (%) | -2 | % | -2 | % | — | — | — | — | ||||||||||||||||
41 Ericsson | Second Quarter Report 2018 |
Alternative performance measures |
Table of Contents
Items excluding restructuring charges
Gross income, operating expenses, and operating income (loss) are presented excluding restructuring charges and, for certain measures, as a percentage of net sales.
| 2018 | 2017 | |||||||||||||||||||||||
Isolated quarters, SEK million | Q2 | Q1 | Q4 | Q3 | Q2 | Q1 | ||||||||||||||||||
Gross income | 17,333 | 14,858 | 12,516 | 13,281 | 14,629 | 7,501 | ||||||||||||||||||
Net sales | 49,808 | 43,411 | 57,881 | 49,413 | 50,281 | 47,803 | ||||||||||||||||||
Gross margin (%) | 34.8 | % | 34.2 | % | 21.6 | % | 26.9 | % | 29.1 | % | 15.7 | % | ||||||||||||
Gross income | 17,333 | 14,858 | 12,516 | 13,281 | 14,629 | 7,501 | ||||||||||||||||||
Restructuring charges included in cost of sales | 937 | 743 | 2,038 | 817 | 927 | 1,460 | ||||||||||||||||||
Gross income, excluding restructuring charges | 18,270 | 15,601 | 14,554 | 14,098 | 15,556 | 8,961 | ||||||||||||||||||
Net sales | 49,808 | 43,411 | 57,881 | 49,413 | 50,281 | 47,803 | ||||||||||||||||||
Gross margin, excluding restructuring charges (%) | 36.7 | % | 35.9 | % | 25.1 | % | 28.5 | % | 30.9 | % | 18.7 | % | ||||||||||||
Operating expenses | -17,205 | -15,257 | -18,863 | -17,354 | -15,417 | -18,929 | ||||||||||||||||||
Restructuring charges included in R&D expenses | 502 | 326 | -147 | 1,896 | 344 | 214 | ||||||||||||||||||
Restructuring charges included in selling and administrative expenses | 441 | 103 | 534 | 106 | 243 | 69 | ||||||||||||||||||
Operating expenses, excluding restructuring charges | -16,262 | -14,828 | -18,476 | -15,352 | -14,830 | -18,646 | ||||||||||||||||||
Operating income (loss) | 165 | -312 | -19,278 | -3,652 | -537 | -11,276 | ||||||||||||||||||
Net sales | 49,808 | 43,411 | 57,881 | 49,413 | 50,281 | 47,803 | ||||||||||||||||||
Operating margin (%) | 0.3 | % | -0.7 | % | -33.3 | % | -7.4 | % | -1.1 | % | -23.6 | % | ||||||||||||
Operating income (loss) | 165 | -312 | -19,278 | -3,652 | -537 | -11,276 | ||||||||||||||||||
Total restructuring charges | 1,880 | 1,172 | 2,425 | 2,819 | 1,514 | 1,743 | ||||||||||||||||||
Operating income (loss), excluding restructuring charges | 2,045 | 860 | -16,853 | -833 | 977 | -9,533 | ||||||||||||||||||
Net sales | 49,808 | 43,411 | 57,881 | 49,413 | 50,281 | 47,803 | ||||||||||||||||||
Operating margin, excluding restructuring charges (%) | 4.1 | % | 2.0 | % | -29.1 | % | -1.7 | % | 1.9 | % | -19.9 | % | ||||||||||||
| 2018 | 2017 | |||||||||||||||||||||||
Year to date, SEK million | Jan-Jun | Jan-Mar | Jan-Dec | Jan-Sep | Jan-Jun | Jan-Mar | ||||||||||||||||||
Gross income | 32,191 | 14,858 | 47,927 | 35,411 | 22,130 | 7,501 | ||||||||||||||||||
Net sales | 93,219 | 43,411 | 205,378 | 147,497 | 98,084 | 47,803 | ||||||||||||||||||
Gross margin (%) | 34.5 | % | 34.2 | % | 23.3 | % | 24.0 | % | 22.6 | % | 15.7 | % | ||||||||||||
Gross income | 32,191 | 14,858 | 47,927 | 35,411 | 22,130 | 7,501 | ||||||||||||||||||
Restructuring charges included in cost of sales | 1,680 | 743 | 5,242 | 3,204 | 2,387 | 1,460 | ||||||||||||||||||
Gross income, excluding restructuring charges | 33,871 | 15,601 | 53,169 | 38,615 | 24,517 | 8,961 | ||||||||||||||||||
Net sales | 93,219 | 43,411 | 205,378 | 147,497 | 98,084 | 47,803 | ||||||||||||||||||
Gross margin, excluding restructuring charges (%) | 36.3 | % | 35.9 | % | 25.9 | % | 26.2 | % | 25.0 | % | 18.7 | % | ||||||||||||
Operating expenses | -32,462 | -15,257 | -70,563 | -51,700 | -34,346 | -18,929 | ||||||||||||||||||
Restructuring charges included in R&D expenses | 828 | 326 | 2,307 | 2,454 | 558 | 214 | ||||||||||||||||||
Restructuring charges included in selling and administrative expenses | 544 | 103 | 952 | 418 | 312 | 69 | ||||||||||||||||||
Operating expenses, excluding restructuring charges | -31,090 | -14,828 | -67,304 | -48,828 | -33,476 | -18,646 | ||||||||||||||||||
Operating income (loss) | -147 | -312 | -34,743 | -15,465 | -11,813 | -11,276 | ||||||||||||||||||
Net sales | 93,219 | 43,411 | 205,378 | 147,497 | 98,084 | 47,803 | ||||||||||||||||||
Operating margin (%) | -0.2 | % | -0.7 | % | -16.9 | % | -10.5 | % | -12.0 | % | -23.6 | % | ||||||||||||
Operating income (loss) | -147 | -312 | -34,743 | -15,465 | -11,813 | -11,276 | ||||||||||||||||||
Total restructuring charges | 3,052 | 1,172 | 8,501 | 6,076 | 3,257 | 1,743 | ||||||||||||||||||
Operating income (loss), excluding restructuring charges | 2,905 | 860 | -26,242 | -9,389 | -8,556 | -9,533 | ||||||||||||||||||
Net sales | 93,219 | 43,411 | 205,378 | 147,497 | 98,084 | 47,803 | ||||||||||||||||||
Operating margin, excluding restructuring charges (%) | 3.1 | % | 2.0 | % | -12.8 | % | -6.4 | % | -8.7 | % | -19.9 | % | ||||||||||||
42 Ericsson | Second Quarter Report 2018 |
Alternative performance measures |
Table of Contents
Earnings (loss) before interest, taxes, amortization and write-downs of acquired intangibles, also expressed as a percentage of net sales.
| 2018 | 2017 | |||||||||||||||||||||||
Isolated quarters, SEK million | Q2 | Q1 | Q4 | Q3 | Q2 | Q1 | ||||||||||||||||||
Net income (loss) | -1,802 | -725 | -18,493 | -3,457 | -457 | -10,026 | ||||||||||||||||||
Taxes | 1,157 | -128 | -1,303 | -516 | -24 | -1,682 | ||||||||||||||||||
Financial income and expenses | 810 | 541 | 518 | 321 | -56 | 432 | ||||||||||||||||||
Amortization and write-downs of acquired intangibles | 350 | 347 | 13,953 | 379 | 445 | 1,875 | ||||||||||||||||||
EBITA | 515 | 35 | -5,325 | -3,273 | -92 | -9,401 | ||||||||||||||||||
Net sales | 49,808 | 43,411 | 57,881 | 49,413 | 50,281 | 47,803 | ||||||||||||||||||
EBITA margin (%) | 1 | % | 0.1 | % | -9.2 | % | -6.6 | % | -0.2 | % | -19.7 | % | ||||||||||||
| 2018 | 2017 | |||||||||||||||||||||||
Year to date, SEK million | Jan-Jun | Jan-Mar | Jan-Dec | Jan-Sep | Jan-Jun | Jan-Mar | ||||||||||||||||||
Net income (loss) | -2,527 | -725 | -32,433 | -13,940 | -10,483 | -10,026 | ||||||||||||||||||
Taxes | 1,029 | -128 | -3,525 | -2,222 | -1,706 | -1,682 | ||||||||||||||||||
Financial income and expenses | 1,351 | 541 | 1,215 | 697 | 376 | 432 | ||||||||||||||||||
Amortization and write-downs of acquired intangibles | 697 | 347 | 16,652 | 2,699 | 2,320 | 1,875 | ||||||||||||||||||
EBITA | 550 | 35 | -18,091 | -12,766 | -9,493 | -9,401 | ||||||||||||||||||
Net sales | 93,219 | 43,411 | 205,378 | 147,497 | 98,084 | 47,803 | ||||||||||||||||||
EBITA margin (%) | 1 | % | 0.1 | % | -8.8 | % | -8.7 | % | -9.7 | % | -19.7 | % | ||||||||||||
Cash flow from operating activities divided by the sum of net income (loss) and adjustments to reconcile net income to cash, expressed as a percentage.
| 2018 | 2017 | |||||||||||||||||||||||
Isolated quarters, SEK million | Q2 | Q1 | Q4 | Q3 | Q2 | Q1 | ||||||||||||||||||
Net income (loss) | -1,802 | -725 | -18,493 | -3,457 | -457 | -10,026 | ||||||||||||||||||
Net income reconciled to cash | -259 | -1,005 | -4,001 | -779 | -142 | -8,187 | ||||||||||||||||||
Cash flow from operating activities | 1,442 | 1,573 | 11,159 | -18 | 1 | -1,541 | ||||||||||||||||||
Cash conversion (%) | -556.8 | % | -156.5 | % | -278.9 | % | 2.3 | % | -0.7 | % | 18.8 | % | ||||||||||||
| 2018 | 2017 | |||||||||||||||||||||||
Year to date, SEK million | Jan-Jun | Jan-Mar | Jan-Dec | Jan-Sep | Jan-Jun | Jan-Mar | ||||||||||||||||||
Net income (loss) | -2,527 | -725 | -32,433 | -13,940 | -10,483 | -10,026 | ||||||||||||||||||
Net income reconciled to cash | -1,264 | -1,005 | -13,109 | -9,108 | -8,329 | -8,187 | ||||||||||||||||||
Cash flow from operating activities | 3,015 | 1,573 | 9,601 | -1,558 | -1,540 | -1,541 | ||||||||||||||||||
Cash conversion (%) | -238.5 | % | -156.5 | % | -73.2 | % | 17.1 | % | 18.5 | % | 18.8 | % | ||||||||||||
Gross cash and net cash, end of period
Gross cash: Cash and cash equivalents plus interest-bearing securities (current andnon-current).
Net cash: Cash and cash equivalents plus interest-bearing securities (current andnon-current) less interest-bearing liabilities (which include:non-current borrowings and current borrowings).
| 2018 | 2017 | |||||||||||||||||||||||
SEK million | Q2 | Q1 | Q4 | Q3 | Q2 | Q1 | ||||||||||||||||||
Cash and cash equivalents | 37,049 | 36,697 | 35,884 | 26,210 | 21,446 | 32,954 | ||||||||||||||||||
+ Interest-bearing securities, current | 8,304 | 5,453 | 6,713 | 6,526 | 10,754 | 13,548 | ||||||||||||||||||
+ Interest-bearing securities,non-current | 21,501 | 27,104 | 25,105 | 22,405 | 22,122 | 19,124 | ||||||||||||||||||
Gross cash, end of period | 66,854 | 69,254 | 67,702 | 55,141 | 54,322 | 65,626 | ||||||||||||||||||
- Borrowings, current | 2,642 | 2,554 | 2,545 | 3,004 | 3,230 | 9,514 | ||||||||||||||||||
- Borrowings,non-current | 31,131 | 31,134 | 30,500 | 28,039 | 27,100 | 27,823 | ||||||||||||||||||
Net cash, end of period | 33,081 | 35,566 | 34,657 | 24,098 | 23,992 | 28,289 | ||||||||||||||||||
43 Ericsson | Second Quarter Report 2018 |
Alternative performance measures |
Table of Contents
Total assets lessnon-interest-bearing provisions and liabilities.
| 2018 | 2017 | |||||||||||||||||||||||
SEK million | Q2 | Q1 | Q4 | Q3 | Q2 | Q1 | ||||||||||||||||||
Total assets | 265,322 | 260,681 | 259,882 | 267,239 | 275,160 | 291,976 | ||||||||||||||||||
Non-interest-bearing provisions and liabilities | ||||||||||||||||||||||||
Provisions,non-current | 2,819 | 2,597 | 3,596 | 3,930 | 4,794 | 4,867 | ||||||||||||||||||
Deferred tax liabilities | 1,332 | 1,325 | 901 | 1,736 | 1,838 | 1,888 | ||||||||||||||||||
Othernon-current liabilities | 4,549 | 2,792 | 2,776 | 2,563 | 2,602 | 2,699 | ||||||||||||||||||
Provisions, current | 6,715 | 6,435 | 6,283 | 5,584 | 5,563 | 5,647 | ||||||||||||||||||
Contract liabilities | 30,959 | 30,391 | 29,076 | 26,185 | 28,657 | 29,930 | ||||||||||||||||||
Trade payables | 28,563 | 26,453 | 26,320 | 23,559 | 25,266 | 26,077 | ||||||||||||||||||
Other current liabilities | 35,746 | 37,888 | 35,305 | 33,395 | 32,599 | 37,323 | ||||||||||||||||||
Capital employed | 154,639 | 152,800 | 155,625 | 170,287 | 173,841 | 183,545 | ||||||||||||||||||
Annualized net sales divided by average capital employed.
| 2018 | 2017 | |||||||||||||||||||||||
Isolated quarters, SEK million | Q2 | Q1 | Q4 | Q3 | Q2 | Q1 | ||||||||||||||||||
Net sales | 49,808 | 43,411 | 57,881 | 49,413 | 50,281 | 47,803 | ||||||||||||||||||
Annualized net sales | 199,232 | 173,644 | 231,524 | 197,652 | 201,124 | 191,212 | ||||||||||||||||||
Average capital employed | ||||||||||||||||||||||||
Capital employed at beginning of period | 152,800 | 155,625 | 170,287 | 173,841 | 183,545 | 185,667 | ||||||||||||||||||
Capital employed at end of period | 154,639 | 152,800 | 155,625 | 170,287 | 173,841 | 183,545 | ||||||||||||||||||
Average capital employed | 153,720 | 154,213 | 162,956 | 172,064 | 178,693 | 184,606 | ||||||||||||||||||
Capital turnover (times) | 1.3 | 1.1 | 1.4 | 1.1 | 1.1 | 1.0 | ||||||||||||||||||
| 2018 | 2017 | |||||||||||||||||||||||
Year to date, SEK million | Jan-Jun | Jan-Mar | Jan-Dec | Jan-Sep | Jan-Jun | Jan-Mar | ||||||||||||||||||
Net sales | 93,219 | 43,411 | 205,378 | 147,497 | 98,084 | 47,803 | ||||||||||||||||||
Annualized net sales | 186,438 | 173,644 | 205,378 | 196,663 | 196,168 | 191,212 | ||||||||||||||||||
Average capital employed | ||||||||||||||||||||||||
Capital employed at beginning of period | 155,625 | 155,625 | 185,667 | 185,667 | 185,667 | 185,667 | ||||||||||||||||||
Capital employed at end of period | 154,639 | 152,800 | 155,625 | 170,287 | 173,841 | 183,545 | ||||||||||||||||||
Average capital employed | 155,132 | 154,213 | 170,646 | 177,977 | 179,754 | 184,606 | ||||||||||||||||||
Capital turnover (times) | 1.2 | 1.1 | 1.2 | 1.1 | 1.1 | 1.0 | ||||||||||||||||||
44 Ericsson | Second Quarter Report 2018 |
Alternative performance measures |
Table of Contents
The annualized total of operating income (loss) plus financial income as a percentage of average capital employed.
| 2018 | 2017 | |||||||||||||||||||||||
Isolated quarters, SEK million | Q2 | Q1 | Q4 | Q3 | Q2 | Q1 | ||||||||||||||||||
Operating income (loss) | 165 | -312 | -19,278 | -3,652 | -537 | -11,276 | ||||||||||||||||||
Financial income | 275 | -72 | -124 | -139 | -27 | -82 | ||||||||||||||||||
Annualized operating income (loss) + financial income | 1,760 | -1,536 | -77,608 | -15,164 | -2,256 | -45,432 | ||||||||||||||||||
Average capital employed | ||||||||||||||||||||||||
Capital employed at beginning of period | 152,800 | 155,625 | 170,287 | 173,841 | 183,545 | 185,667 | ||||||||||||||||||
Capital employed at end of period | 154,639 | 152,800 | 155,625 | 170,287 | 173,841 | 183,545 | ||||||||||||||||||
Average capital employed | 153,720 | 154,213 | 162,956 | 172,064 | 178,693 | 184,606 | ||||||||||||||||||
Return on capital employed (%) | 1.1 | % | -1.0 | % | -47.6 | % | -8.8 | % | -1.3 | % | -24.6 | % | ||||||||||||
| 2018 | 2017 | |||||||||||||||||||||||
Year to date, SEK million | Jan-Jun | Jan-Mar | Jan-Dec | Jan-Sep | Jan-Jun | Jan-Mar | ||||||||||||||||||
Operating income (loss) | -147 | -312 | -34,743 | -15,465 | -11,813 | -11,276 | ||||||||||||||||||
Financial income | 203 | -72 | -372 | -248 | -109 | -82 | ||||||||||||||||||
Annualized operating income (loss) + financial income | 112 | -1,536 | -35,115 | -20,951 | -23,844 | -45,432 | ||||||||||||||||||
Average capital employed | ||||||||||||||||||||||||
Capital employed at beginning of period | 155,625 | 155,625 | 185,667 | 185,667 | 185,667 | 185,667 | ||||||||||||||||||
Capital employed at end of period | 154,639 | 152,800 | 155,625 | 170,287 | 173,841 | 183,545 | ||||||||||||||||||
Average capital employed | 155,132 | 154,213 | 170,646 | 177,977 | 179,754 | 184,606 | ||||||||||||||||||
Return on capital employed (%) | 0.1 | % | -1.0 | % | -20.6 | % | -11.8 | % | -13.3 | % | -24.6 | % | ||||||||||||
Equity, expressed as a percentage of total assets.
| 2018 | 2017 | |||||||||||||||||||||||
SEK million | Q2 | Q1 | Q4 | Q3 | Q2 | Q1 | ||||||||||||||||||
Total equity | 93,560 | 93,466 | 97,571 | 112,710 | 119,887 | 122,434 | ||||||||||||||||||
Total assets | 265,322 | 260,681 | 259,882 | 267,239 | 275,160 | 291,976 | ||||||||||||||||||
Equity ratio (%) | 35.3 | % | 35.9 | % | 37.5 | % | 42.2 | % | 43.6 | % | 41.9 | % | ||||||||||||
Annualized net income (loss) attributable to stockholders of the Parent Company as a percentage of average Stockholders’ equity.
| 2018 | 2017 | |||||||||||||||||||||||
Isolated quarters, SEK million | Q2 | Q1 | Q4 | Q3 | Q2 | Q1 | ||||||||||||||||||
Net income (loss) attributable to stockholders of the parent company | -1,885 | -837 | -18,476 | -3,561 | -471 | -10,068 | ||||||||||||||||||
Annualized | -7,540 | -3,348 | -73,904 | -14,244 | -1,884 | -40,272 | ||||||||||||||||||
Average stockholders’ equity | ||||||||||||||||||||||||
Stockholders’ equity, beginning of period | 92,703 | 96,935 | 112,095 | 119,177 | 121,698 | 134,582 | ||||||||||||||||||
Stockholders’ equity, end of period | 92,689 | 92,703 | 96,935 | 112,095 | 119,177 | 121,698 | ||||||||||||||||||
Average stockholders’ equity | 92,696 | 94,819 | 104,515 | 115,636 | 120,438 | 128,140 | ||||||||||||||||||
Return on equity (%) | -8.1 | % | -3.5 | % | -70.7 | % | -12.3 | % | -1.6 | % | -31.4 | % | ||||||||||||
| 2018 | 2017 | |||||||||||||||||||||||
Year to date, SEK million | Jan-Jun | Jan-Mar | Jan-Dec | Jan-Sep | Jan-Jun | Jan-Mar | ||||||||||||||||||
Net income (loss) attributable to stockholders of the parent company | -2,722 | -837 | -32,576 | -14,100 | -10,539 | -10,068 | ||||||||||||||||||
Annualized | -5,444 | -3,348 | -32,576 | -18,800 | -21,078 | -40,272 | ||||||||||||||||||
Average stockholders’ equity | ||||||||||||||||||||||||
Stockholders’ equity, beginning of period | 96,935 | 96,935 | 134,582 | 134,582 | 134,582 | 134,582 | ||||||||||||||||||
Stockholders’ equity, end of period | 92,689 | 92,703 | 96,935 | 112,095 | 119,177 | 121,698 | ||||||||||||||||||
Average stockholders’ equity | 94,812 | 94,819 | 115,759 | 123,339 | 126,880 | 128,140 | ||||||||||||||||||
Return on equity (%) | -5.7 | % | -3.5 | % | -28.1 | % | -15.2 | % | -16.6 | % | -31.4 | % | ||||||||||||
45 Ericsson | Second Quarter Report 2018 |
Alternative performance measures |
Table of Contents
Earnings (loss) per share(non-IFRS)
Earnings (loss) per share, diluted, excluding amortizations and write-down of acquired intangible assets and excluding restructuring charges.
| 2018 | 2017 | |||||||||||||||||||||||
Isolated quarters, SEK | Q2 | Q1 | Q4 | Q3 | Q2 | Q1 | ||||||||||||||||||
Earnings (loss) per share, diluted | -0.58 | -0.25 | -5.63 | -1.09 | -0.14 | -3.08 | ||||||||||||||||||
Restructuring charges | 0.41 | 0.30 | 0.37 | 0.73 | 0.38 | 0.46 | ||||||||||||||||||
Amortization and write-downs of acquired intangibles | 0.08 | 0.06 | 4.17 | 0.07 | 0.09 | 0.43 | ||||||||||||||||||
Earnings (loss) per share(non-IFRS) | -0.09 | 0.11 | -1.09 | -0.29 | 0.33 | -2.19 | ||||||||||||||||||
| 2018 | 2017 | |||||||||||||||||||||||
Year to date, SEK | Jan-Jun | Jan-Mar | Jan-Dec | Jan-Sep | Jan-Jun | Jan-Mar | ||||||||||||||||||
Earnings (loss) per share, diluted | -0.83 | -0.25 | -9.94 | -4.31 | -3.22 | -3.08 | ||||||||||||||||||
Restructuring charges | 0.71 | 0.30 | 1.93 | 1.57 | 0.84 | 0.46 | ||||||||||||||||||
Amortization and write-downs of acquired intangibles | 0.14 | 0.06 | 4.77 | 0.59 | 0.52 | 0.43 | ||||||||||||||||||
Earnings (loss) per share(non-IFRS) | 0.02 | 0.11 | -3.24 | -2.15 | -1.86 | -2.19 | ||||||||||||||||||
Cash flow from operating activities less net capital expenditures and other investments.
| 2018 | 2017 | |||||||||||||||||||||||
Isolated quarters, SEK million | Q2 | Q1 | Q4 | Q3 | Q2 | Q1 | ||||||||||||||||||
Cash flow from operating activities | 1,442 | 1,573 | 11,159 | -18 | 1 | -1,541 | ||||||||||||||||||
Net capital expenditures and other investments | ||||||||||||||||||||||||
Investments in property, plant and equipment | -951 | -856 | -1,105 | -739 | -1,018 | -1,015 | ||||||||||||||||||
Sales of property, plant and equipment | 52 | 123 | 898 | 12 | 37 | 69 | ||||||||||||||||||
Acquisitions/divestments of subsidiaries and other operations, net | -431 | -449 | -107 | 371 | 9 | 3 | ||||||||||||||||||
Product development | -325 | -254 | -138 | -126 | -315 | -865 | ||||||||||||||||||
Other investing activities | -398 | 161 | -573 | 42 | -42 | 110 | ||||||||||||||||||
Free cash flow | -611 | 298 | 10,134 | -458 | -1,328 | -3,239 | ||||||||||||||||||
| 2018 | 2017 | |||||||||||||||||||||||
Year to date, SEK million | Jan-Jun | Jan-Mar | Jan-Dec | Jan-Sep | Jan-Jun | Jan-Mar | ||||||||||||||||||
Cash flow from operating activities | 3,015 | 1,573 | 9,601 | -1,558 | -1,540 | -1,541 | ||||||||||||||||||
Net capital expenditures and other investments | ||||||||||||||||||||||||
Investments in property, plant and equipment | -1,807 | -856 | -3,877 | -2,772 | -2,033 | -1,015 | ||||||||||||||||||
Sales of property, plant and equipment | 175 | 123 | 1,016 | 118 | 106 | 69 | ||||||||||||||||||
Acquisitions/divestments of subsidiaries and other operations, net | -880 | -449 | 276 | 383 | 12 | 3 | ||||||||||||||||||
Product development | -579 | -254 | -1,444 | -1,306 | -1,180 | -865 | ||||||||||||||||||
Other investing activities | -237 | 161 | -463 | 110 | 68 | 110 | ||||||||||||||||||
Free cash flow | -313 | 298 | 5,109 | -5,025 | -4,567 | -3,239 | ||||||||||||||||||
46 Ericsson | Second Quarter Report 2018 |
Alternative performance measures |