SECURITIES AND EXCHANGE COMMISSION
Washington, D.C. 20549
FORM6-K
REPORT OF FOREIGN ISSUER
Pursuant to Rule 13a-16 or 15d-16 of
the Securities Exchange Act of 1934
January 25, 2019
Commission File Number000-12033
LM ERICSSON TELEPHONE COMPANY
(Translation of registrant’s name into English)
Torshamnsgatan 21, Kista
SE-164 83,Stockholm, Sweden
(Address of principal executive offices)
Indicate by check mark whether the registrant files or will file annual reports under cover Form20-F or Form40-F. Form20-F ☒ Form40-F ☐
Indicate by check mark if the registrant is submitting the Form6-K in paper as permitted by RegulationS-T Rule 101(b)(1): ☐
Indicate by check mark if the registrant is submitting the Form6-K in paper as permitted by RegulationS-T Rule 101(b)(7): ☐
Announcement of LM Ericsson Telephone Company, January 25, 2019 regarding “Fourth quarter and full-year report 2018”.
SIGNATURES
Pursuant to the requirements of the Securities Exchange Act of 1934, the registrant has duly caused this report to be signed on its behalf by the undersigned, thereunto duly authorized.
| TELEFONAKTIEBOLAGET LM ERICSSON (publ) | ||
| By: | /s/ XAVIER DEDULLEN | |
| Xavier Dedullen | ||
| Senior Vice President, Chief Legal Officer | ||
| By: | /s/ CARL MELLANDER | |
| Carl Mellander | ||
| Senior Vice President, Chief Financial Officer | ||
Date:January 25, 2019

Fourth quarter and
full-year report 2018
Stockholm, January 25, 2019
Fourth quarter highlights
| • | Sales as reported increased by 10% YoY and sales adjusted for comparable units and currency increased by 4%. |
| • | Networks sales adjusted for comparable units and currency grew by 6% YoY. Digital Services sales adjusted for comparable units and currency grew by 5% YoY. |
| • | Costs related to revised Business Support Systems (BSS) strategy of SEK-6.1 b., of which SEK-3.1 b. were restructuring charges, impacted Digital Services operating income in Q4. |
| • | Gross margin was 25.7% (21.6%). Gross margin, excluding restructuring charges and other costs related to revised BSS strategy, improved to 36.3%, supported by cost reductions, theramp-up of Ericsson Radio System (ERS) and the contract review in Managed Services. |
| • | Operating margin was-2.9%(-33.3%). Operating margin, excluding restructuring charges and other costs related to revised BSS strategy, was 8.7%. |
| • | Networks operating margin excluding restructuring charges was 17.5% (8.6%). The increase was driven by cost reductions, the ERSramp-up and reversal of provisions for impairment losses on trade receivables, partly offset by increased investments in R&D. |
| • | Digital Services operating income, excluding restructuring charges and costs related to revised BSS strategy, was SEK-0.6 b. |
| • | Managed Services operating margin excluding restructuring charges increased to 5.2%(-13.0%). The review of all 42low-performing customer contracts has been completed. |
Full-year highlights
| • | Sales as reported increased by 3% and sales adjusted for comparable units and currency increased by 1%, with Networks growing by 3% – the first year of organic growth for Ericsson since 2013. |
| • | Gross margin was 32.3% (23.3%). Gross margin excluding restructuring charges improved to 35.2% (25.9%), supported by cost reductions, theramp-up of Ericsson Radio System (ERS) and the review of managed services contracts. |
| • | Operating income was SEK 1.2(-34.7) b. Operating income excluding restructuring charges was SEK 9.3(-26.2) b. driven by higher gross margin and sales as well as lower operating expenses. |
| • | Cash flow from operating activities was SEK 9.3 (9.6) b. Free cash flow excluding M&A amounted to SEK 4.3 (4.8) b. Net cash atyear-end was SEK 35.9 (34.7) b. |
| • | The Board of Directors will propose a dividend for 2018 of SEK 1.00 (1.00) per share to the AGM. |
SEK b. | Q4 2018 | Q4 2017 | YoY change | Q3 2018 | QoQ change | Full-year 2018 | Full-year 2017 | Full-year change | ||||||||||||||||||||||||
Net sales | 63.8 | 57.9 | 10 | % | 53.8 | 19 | % | 210.8 | 205.4 | 3 | % | |||||||||||||||||||||
Sales growth adj. for comparable units and currency | — | — | 4 | % | — | 19 | % | — | — | 1 | % | |||||||||||||||||||||
Gross margin | 25.7 | % | 21.6 | % | — | 36.5 | % | — | 32.3 | % | 23.3 | % | — | |||||||||||||||||||
Operating income (loss) | -1.9 | -19.3 | — | 3.2 | -157 | % | 1.2 | -34.7 | — | |||||||||||||||||||||||
Operating margin | -2.9 | % | -33.3 | % | — | 6.0 | % | — | 0.6 | % | -16.9 | % | — | |||||||||||||||||||
Net income (loss) | -6.5 | -18.5 | — | 2.7 | — | -6.3 | -32.4 | — | ||||||||||||||||||||||||
EPS diluted, SEK | -1.99 | -5.63 | — | 0.83 | — | -1.98 | -9.94 | — | ||||||||||||||||||||||||
EPS (non-IFRS), SEK1) | -0.77 | -1.09 | — | 1.03 | -175 | % | 0.27 | -3.24 | — | |||||||||||||||||||||||
Cash flow from operating activities | 4.3 | 11.2 | -62 | % | 2.0 | 110 | % | 9.3 | 9.6 | -3 | % | |||||||||||||||||||||
Free cash flow excluding M&A2) | 3.0 | 10.2 | -71 | % | 0.7 | — | 4.3 | 4.8 | -12 | % | ||||||||||||||||||||||
Net cash, end of period | 35.9 | 34.7 | 4 | % | 32.0 | 12 | % | 35.9 | 34.7 | 4 | % | |||||||||||||||||||||
Gross margin excluding restructuring charges | 32.0 | % | 25.1 | % | — | 36.9 | % | — | 35.2 | % | 25.9 | % | — | |||||||||||||||||||
Operating income (loss) excluding restructuring charges | 2.6 | -16.9 | — | 3.8 | -33 | % | 9.3 | -26.2 | -135 | % | ||||||||||||||||||||||
Operating margin excluding restructuring charges | 4.0 | % | -29.1 | % | — | 7.0 | % | — | 4.4 | % | -12.8 | % | — | |||||||||||||||||||
| 1) | EPS diluted, excl. amortizations and write-downs of acquired intangible assets, and excluding restructuring charges. Potential ordinary shares are not considered when their conversion to ordinary shares would increase earnings per share. |
| 2) | Free cash flow excluding M&A: See Alternative Performance Measures (APM) at the end of the report. |
Non-IFRS financial measures are reconciled to the most directly reconcilable line items in the financial statements at the end of this report.
| 1 Ericsson | Fourth Quarter and Full-Year Report 2018 | ||
CEO comments
Our focused strategy has yielded clear results. Ericsson is today a stronger company. Increased investments in R&D for future growth, managed services contract reviews, combined with efficient cost control have proven to be successful, with improved competitiveness and profitability as a result. As the industry moves to 5G and IoT, we will now take the next step, focusing on profitable growth in a selective and disciplined way.
Sales have gradually improved during 2018, resulting in full-year organic sales growth1) for the first time since 2013. This is partly due to an improved market, but also driven by market share gains in Networks as a result of a more competitive radio product portfolio. In parallel, gross margins2) have improved across all segments, with full-year gross margin2) of 35% (26%) and operating margin2) of 4%(-13%).
Segment Networks had another strong quarter with high business activity across multiple regions. Networks organic sales1) increased by 6% YoY, positively impacted by a recovering RAN market as well as strong performance in the product portfolio. Growth was partly due to a higher than anticipated activity level in North America driven by increased 5G demand among the US operators. Networks gross margin2) improved to 41% (35%) YoY, mainly due to improved hardware margins driven by the successful shift to Ericsson Radio System (ERS). Strategic contracts and 5G field trials had a negative impact on operating margin in the quarter. R&D investments continued to grow in the quarter, but are now expected to flatten out.
In Managed Services, gross margin2) improved to 12%(-5%) YoY, supported by efficiency gains and customer contract reviews. We have now addressed all 42 targeted contracts, resulting in an annualized profit improvement of SEK 0.9 b. During the year, we have increased our investments in automation, analytics and AI.
We continue to execute on our plan to turn the Digital Services business around. Focus has been on stabilizing top line, modernizing the portfolio and taking costs out. In Digital Services there has been solid progress in most portfolio areas. Underlying operating expenses3) in 2018 were SEK 2.6 b. lower than in 2017. However, the Business Support Systems (BSS) area has not shown satisfactory progress and we are now in the process of reshaping the business. To speed up restructuring of the BSS business, additional measures were communicated on January 10, 2019. These measures include provisions and restructuring charges of SEK-6.1 b.,
which were taken in Q4. The reshaped strategy will set Digital Services on a stronger path to achieve the 2020 financial targets. Organic sales1) in Digital Services grew by 5% YoY, driven by Cloud Core and OSS. Gross margin2), adjusted for above mentioned provisions, improved to 38%. Operating income, excluding restructuring charges and other costs related to revised BSS strategy, was SEK-0.6 b. in the quarter.
In segment Emerging Business and Other, we invest in initiatives that aim to scale and help create future business for Ericsson. We manage Emerging Business initiatives for growth case by case, based on positive net present value (NPV), within 2022 Group targets. Organic segment sales1) grew by 1% YoY and operating income2) was SEK-1.5(-7.6) b. Sales growth and operating income2) in the segment, excluding the media business, was 60% and SEK-0.9(-0.8) b. respectively.
Free cash flow excluding M&A in 2018 was lower than in 2017, primarily due to the return to growth and strong sales development at the end of the fourth quarter. In addition, sale of trade receivables was further reduced. The Board will propose a dividend of SEK 1.00 (1.00) per share to the AGM.
As previously disclosed, we are voluntarily cooperating with an investigation into Ericsson’s compliance with the U.S. Foreign Corrupt Practices Act (FCPA). The discussions with US authorities continue and we will provide updates as appropriate.
Our R&D investments over the past two years have secured a highly competitive and industry-leading offering. We will continue to invest in 5G, automation and AI to create both customer and shareholder value. Even though costs related to strategic contracts and 5G field trials will impact margins short term, they will help reaching our targets for 2020 and 2022 as well as strengthen our business in the long term.
Börje Ekholm
President and CEO
| 1) | Organic sales growth: Sales adjusted for comparable units and currency |
| 2) | Excluding restructuring charges |
| 3) | Excluding net impact from amortization and capitalization of development expenses, as well as of intangible assets, risk provisions and write-downs. |
Planning assumptions going forward
Market related
| • | The Radio Access Network (RAN) equipment market is estimated to increase by 2% for full-year 2019 with 2% CAGR for 2018-2023. (Source: Dell’Oro.) |
Currency exposure
| • | Rule of thumb: A weakening by 10% of USD to SEK would have a negative impact of approximately-5% on net sales and approximately-1 percentage point on operating margin. |
Ericsson related
| • | 5-year average sales seasonality between Q4 and Q1 is-26%. |
| • | The baseline for the current IPR licensing contract portfolio is approximately SEK 8 b. on an annual basis. |
| • | Strategic contracts in Networks, with initially lower margins, taken to strengthen the market position, will continue to have a negative impact on gross margin. The costs may vary between quarters, without jeopardizing 2020 financial targets. |
| • | Costs for 5G field trials mainly in Networks will continue in 2019. |
| • | R&D expenses are expected to flatten out, starting in Q1. |
| • | Operating expenses typically decrease between Q4 and Q1 due to seasonality. |
| • | Restructuring charges for full-year 2019 are estimated to be SEK-3 to-5 b. |
| • | Cost reductions and efficiency improvements will continue in Digital Services aiming to significantly reduce losses in 2019. |
| • | The planned divestment of MediaKind is ongoing: 2018 financials Media Solutions business (MediaKind incl. transaction-related costs etc): Net sales 2018: SEK 2.7 b. and Q4: SEK 0.7 b., operating income excl. restructuring charges 2018: SEK-1.7 b. and Q4: SEK-0.5 b. |
| • | The estimated net impact of amortization and capitalization of development expenses and of recognition and deferral of hardware costs will be approximately SEK-1 b. for 2019, compared with SEK-2.6 b. in 2018. |
| 2 Ericsson | Fourth Quarter and Full-Year Report 2018 | CEO comments | |
Financial highlights
SEK b. | Q4 2018 | Q4 2017 | YoY change | Q3 2018 | QoQ change | Full-year 2018 | Full-year 2017 | Full-year change | ||||||||||||||||||||||||
Net sales | 63.8 | 57.9 | 10 | % | 53.8 | 19 | % | 210.8 | 205.4 | 3 | % | |||||||||||||||||||||
Sales growth adj. for comparable units and currency | — | — | 4 | % | — | 19 | % | — | — | 1 | % | |||||||||||||||||||||
Gross income | 16.4 | 12.5 | 31 | % | 19.6 | -17 | % | 68.2 | 47.9 | 42 | % | |||||||||||||||||||||
Gross margin (%) | 25.7 | % | 21.6 | % | — | 36.5 | % | — | 32.3 | % | 23.3 | % | — | |||||||||||||||||||
Research and development (R&D) expenses | -10.7 | -9.9 | 7 | % | -9.4 | 14 | % | -38.9 | -37.9 | 3 | % | |||||||||||||||||||||
Selling and administrative expenses | -7.7 | -8.2 | -7 | % | -6.6 | 16 | % | -27.5 | -29.0 | -5 | % | |||||||||||||||||||||
Impairment losses on trade receivables | 0.4 | -0.7 | — | -0.4 | — | -0.4 | -3.6 | — | ||||||||||||||||||||||||
Other operating income and expenses | -0.3 | -12.9 | -98 | % | 0.0 | — | -0.2 | -12.1 | — | |||||||||||||||||||||||
Operating income (loss) | -1.9 | -19.3 | -90 | % | 3.2 | -157 | % | 1.2 | -34.7 | — | ||||||||||||||||||||||
Operating margin (%) | -2.9 | % | -33.3 | % | — | 6.0 | % | — | 0.6 | % | -16.9 | % | — | |||||||||||||||||||
Financial net | -0.7 | -0.5 | 38 | % | -0.6 | 12 | % | -2.7 | -1.2 | 123 | % | |||||||||||||||||||||
Taxes | -3.9 | 1.3 | — | 0.1 | — | -4.8 | 3.5 | — | ||||||||||||||||||||||||
Net income (loss) | -6.5 | -18.5 | -65 | % | 2.7 | — | -6.3 | -32.4 | — | |||||||||||||||||||||||
Restructuring charges | -4.4 | -2.4 | 82 | % | -0.6 | — | -8.0 | -8.5 | — | |||||||||||||||||||||||
Gross income excluding restructuring charges | 20.4 | 14.6 | 40 | % | 19.8 | 3 | % | 74.1 | 53.2 | 39 | % | |||||||||||||||||||||
Gross margin excluding restructuring charges | 32.0 | % | 25.1 | % | — | 36.9 | % | — | 35.2 | % | 25.9 | % | — | |||||||||||||||||||
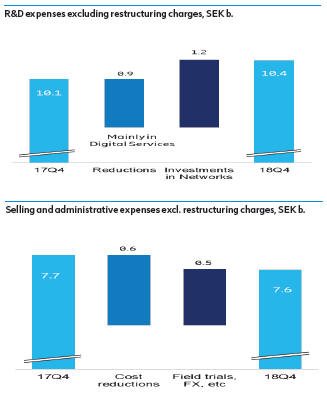
R&D expenses excluding restructuring charges | -10.4 | -10.1 | 3 | % | -9.2 | 14 | % | -37.6 | -35.6 | 6 | % | |||||||||||||||||||||
SG&A expenses excluding restructuring charges | -7.6 | -7.7 | -2 | % | -6.5 | 17 | % | -26.7 | -28.1 | — | ||||||||||||||||||||||
Operating income (loss) excl. restructuring charges | 2.6 | -16.9 | — | 3.8 | -33 | % | 9.3 | -26.2 | — | |||||||||||||||||||||||
Operating margin excluding restructuring charges | 4.0 | % | -29.1 | % | — | 7.0 | % | — | 4.4 | % | -12.8 | % | — | |||||||||||||||||||
FOURTH QUARTER COMMENTS
Costs related to revised Business Support Systems (BSS) strategy
Provisions of SEK-6.1 b. were made in the quarter to reshape the Business Support Systems (BSS) strategy in Digital Services. The impact on cost of sales was SEK-5.9 b., of which SEK-3.1 b. were restructuring charges, and the impact on R&D expenses was SEK-0.2 b. (write-down of capitalized development expenses). For more information see Other information on page 18.
Net sales
Sales increased by 10% YoY. Sales adjusted for comparable units and currency increased by 4% YoY, mainly driven by sales growth in Networks and Digital Services. Networks sales adjusted for comparable units and currency increased by 6% YoY, driven by sales growth in North America, Europe and Latin America as well as in North East Asia. Digital Services sales adjusted for comparable units and currency increased by 5% YoY, mainly due to increased sales in North East Asia and North America. Managed Services sales adjusted for comparable units and currency declined by-5% YoY, mainly as a result of exitednon-strategic contracts. Sales adjusted for comparable units and currency in Emerging Business and Other increased by 1% YoY, driven by growth in iconectiv.
Sequentially, sales and sales adjusted for comparable units and currency both increased by 19%, supported by sales growth of 45% in Digital Services. Networks sales adjusted for comparable units and currency grew by 16% .
IPR licensing revenues
IPR licensing revenues were flat YoY and QoQ at SEK 2.1 b.
Gross margin
Gross margin increased to 25.7% (21.6%). Gross margin excluding restructuring charges increased to 32.0% (25.1%), mainly driven by improvements in Networks and Managed Services partly offset by costs related to revised BSS strategy. Gross margin excluding total restructuring charges and other costs for revised BSS strategy was 36.3%. Cost reductions,ramp-up of Ericsson Radio System (ERS) product platform and good progress in customer contract reviews in Managed Services had a positive impact on gross margin YoY.
Write-down of assets, as well as provisions and adjustments related to certain customer projects had a significant negative impact on gross margin in 2017.
Sequentially, gross margin decreased to 25.7% from 36.5%. Gross margin excluding restructuring charges declined to 32.0% from 36.9%, mainly due to costs related to revised BSS strategy impacting cost of sales negatively.
Operating expenses
R&D expenses were SEK-10.7(-9.9) b. R&D expenses excluding restructuring charges increased to SEK-10.4(-10.1) b., due to increased 4G and 5G investments in Networks. The increase was partly offset by reductions in Digital Services.
Sequentially, R&D expenses increased, mainly due to seasonality.
Selling and administrative (SG&A) expenses decreased to SEK-7.7(-8.2) b. SG&A expenses excluding restructuring charges decreased to SEK-7.6(-7.7) b. YoY, with cost reductions of SEK 0.6 b. partly offset by increased costs for customer 5G field trials.
Sequentially, SG&A excluding restructuring charges increased due to seasonality and higher provisions for variable compensation, partly offset by reduced costs related to revaluation of customer financing.
Impairment losses on trade receivables were positive at SEK 0.4(-0.7) b. following reversals of earlier provisions due to customer payments. Impairment losses on trade receivables were SEK-0.4 b. in Q3 2018. As of 2018, impairment testing is made using a methodology where country and customer risks are continuously assessed.
Other operating income and expenses
Other operating income and expenses were SEK-0.3(-12.9) b. due to costs to reset the Edge Gravity (offering for edge computing) business in segment Emerging Business and Other. Write-down of assets had a significant negative impact on other operating income and expenses in 2017. There were no other operating income and expenses in Q3.
| 3 Ericsson | Fourth Quarter and Full-Year Report 2018 | Financial highlights | |
Consequences of technology and portfolio shifts
Due to technology and portfolio shifts, the Company is reducing the capitalization of development expenses for product platforms and software releases as well as the deferral of hardware costs. As a consequence, higher amortization than capitalization of development expenses and higher recognition than deferral of hardware costs have a negative impact on operating income. The amounts related to capitalized software releases were fully amortized in 2017.
Net impact from amortization and capitalization of development expenses and from recognition and deferral of hardware costs
SEK b. | Q4 2018 | Q4 2017 | Q3 2018 | FY 2018 | FY 2017 | |||||||||||||||
Cost of sales | -0.2 | -0.8 | -0.2 | -0.9 | -2.6 | |||||||||||||||
R&D expenses | -0.6 | -0.6 | -0.5 | -1.7 | -0.3 | |||||||||||||||
|
|
|
|
|
|
|
|
|
| |||||||||||
Total impact | -0.7 | -1.4 | -0.7 | -2.6 | -2.9 | |||||||||||||||
|
|
|
|
|
|
|
|
|
| |||||||||||
Restructuring charges
Restructuring charges increased to SEK-4.4(-2.4) b. YoY of which the main part, SEK-3.1 b., is costs related to revised BSS strategy. Restructuring charges in Q3 2018 were SEK-0.6 b.
Operating income and margin
Operating income (loss) was reduced to SEK-1.9(-19.3) b. YoY. Operating income excluding restructuring charges improved to SEK 2.6(-16.9) b. Improved gross margin, increased net sales and reversal of provisions for impairment losses on trade receivables had a positive impact YoY. The net impact of amortization and capitalization of development expenses and of recognition and deferral of hardware costs was SEK-0.7(-1.4) b.
Write-down of assets as well as provisions and adjustments related to certain customer projects had a significant impact on the 2017 operating expenses.
Operating income and operating margin excluding restructuring charges and other costs for revised BSS strategy were SEK 5.5 b. and 8.7% respectively.
Operating income declined sequentially to SEK-1.9 b. from SEK 3.2 b. Operating income excluding restructuring charges declined to SEK 2.6 b. from SEK 3.8 b. Negative effects from costs related to revised BSS strategy and seasonally higher operating expenses were partly offset by higher sales and reversal of provisions for impairment losses on trade receivables.
Financial net
Financial net declined to SEK-0.7(-0.5) b. mainly due to negative effects of interest rate revaluation. The revaluation and realization effects of foreign exchange forecast hedging were SEK-0.1(-0.1) b. In Q3 2018 there were no such effects.
Taxes
Taxes amounted to SEK-3.9 (1.3) b., negatively impacted by impairment of withholding tax assets and non-deductable expenses.
Net income (loss) and EPS
Net income and EPS diluted increased YoY, as a consequence of the improved operating income. Sequentially, net income and EPS diluted decreased due to costs related to revised BSS strategy and increased tax costs.
Employees
The number of employees on Dec 31, 2018, was 95,359, a net increase of 860 employees in the quarter. The employee increase in the quarter is mainly in R&D.
Focused strategy execution
The following four measures are indicators of the progress of strategy execution.
Area | Activity | Status Q4 2018 | ||
| Networks | Transition to new Ericsson Radio System | The transition is now successfully completed with 87% accumulated for full-year 2018 (2017: 61%) and 93% in Q4 2018 (ERS radio unit deliveries out of total radio unit deliveries). | ||
| Digital Services | • Growth in sales of new product portfolio | • Net sales full-year 2018: +4% | ||
• Addressing critical customer contracts | • Out of 45 contracts identified, in total 23 have been addressed (4 in Q418 isolated) | |||
| Managed Services | Addressinglow-performing customer contracts | The review of all 42 contracts identified (2 in Q418 isolated) has been completed resulting in an annualized profit improvement of SEK 0.9 b. (Q3 2018: SEK 0.9 b.) | ||
| 4 Ericsson | Fourth Quarter and Full-Year Report 2018 | Financial highlights | |
FULL-YEAR COMMENTS
Net sales
Sales increased by SEK 5.5 b. or 3% to SEK 210.8 (205.4) b. Networks sales increased by SEK 6.3 b. (5%), Digital Services sales decreased by SEK-0.7 b.(-2%), Managed Services sales decreased by SEK-0.7 b.(-3%) and Emerging Business and Other sales increased by SEK 0.5 b. (7%).
The sales increase in Networks was mainly driven by higher demand for radio access network (RAN) equipment. Networks sales growth adjusted for comparable units and currency was 3%. This should be compared with the Dell’Oro estimate that the RAN equipment market would increase by 2% for full-year 2018.
The sales decrease in segment Digital Services was due to lower sales in legacy products. The sales decline in Managed Services was mainly a result of exit of low-performing andnon-strategic contracts. The sales increase in segment Emerging Business and Other was driven by growth in iconectiv business due to the multi-year number portability contract in the United States.
In the geographical dimension, sales grew in North America and in Europe and Latin America.
Sales adjusted for comparable units and currency increased by 1%. The sales mix by commodity was: software 21% (21%), hardware 37% (35%) and services 42% (44%).
IPR licensing revenues
IPR licensing revenues decreased to SEK 8.0 (8.3) b. The baseline for the current IPR licensing contract portfolio is approximately SEK 8 b. on an annual basis.
Gross margin
Gross margin increased to 32.3% (23.3%) with improved margins in hardware and services mainly driven by cost reductions,ramp-up of Ericsson Radio System product platform and good progress in the review oflow-performing managed services contracts. A reduced share of services sales had a positive impact on gross margin. Restructuring charges included in the gross margin increased to SEK-5.9(-5.2) b. Costs of SEK-5.9 b., of which SEK-3.1 b. were restructuring charges, impacted gross margin in Digital Services.
Due to technology and portfolio shifts, the company has since 2017 reduced the capitalization of development expenses and the deferral of hardware costs, which had a net impact on gross income of SEK-0.9(-2.6) b. Write-down of assets, as well as provisions and adjustments related to certain customer projects had a significant negative impact on gross margin in 2017.
Operating expenses
Operating expenses decreased to SEK-66.8(-70.6) b. with SG&A expenses of SEK-27.5(-29.0) b., R&D expenses of SEK-38.9(-37.9) b. and impairment losses on trade receivables of SEK-0.4(-3.6) b. Restructuring charges included in operating expenses were SEK-2.1(-3.3) b.
R&D expenses increased due to increased investments in R&D for Networks. The increase was partly offset by R&D reductions in Digital Services. Higher amortized than capitalized development expenses had a negative effect on R&D expenses of SEK-1.7(-0.3) b.
SG&A expenses were reduced as a result of cost reduction activities. The reduction was more than offset by higher provisions for variable compensation, increased costs related to revaluation of customer financing and increased costs for 5G trials.
Other operating income and expenses
Other operating income and expenses was SEK-0.2(-12.1) b. In 2017, write-down of intangible assets had a significant negative impact on other operating expenses.
Restructuring charges
Restructuring charges amounted to SEK-8.0(-8.5) b., which was higher than the earlier estimate of SEK-5 to-7 b. The restructuring charges in 2018 mainly relate to the cost-reduction program announced in 2017 and costs related to revised BSS strategy. Total restructuring charges for 2019 are estimated to be SEK-3 to-5 b.
Operating income and margin
Operating income improved to SEK 1.2(-34.7) b. Higher gross margin and sales and lower operating expenses had a positive impact. Higher amortization than capitalization of development expenses and higher recognition than deferral of hardware costs impacted operating income by SEK-2.6(-2.9) b. Write-down of assets, as well as provisions and adjustments related to certain customer projects had a significant negative impact on operating income in 2017. Operating margin was 0.6%(-16.9%). Operating margin excluding restructuring charges of SEK-8.0(-8.5 ) b. was 4.4%(-12.8%).
Financial net
The financial net decreased to SEK-2.7(-1.2) b., mainly due to increased negative effects of foreign exchange revaluation, negative currency hedge effects and reduced interest rates. The currency hedge effects, which derive from the hedge loan balance in USD, impacted financial net by SEK-0.5 (0.5) b. The SEK weakened against the USD between December 31, 2017 (SEK/USD rate 8.20) and December 31, 2018 (SEK/USD rate 8.94).
Taxes
Taxes were SEK-4.8 (3.5) b., negatively impacted by impairment of withholding tax assets in Sweden mainly as a result of provisions related to revised BSS strategy. In addition,non-deductible expenses, withholding tax expenses outside of Sweden and revaluation of tax assets due to a change in Swedish corporate tax rate impacted tax costs negatively.
Net income and EPS
Net income improved to SEK-6.3(-32.4) b. driven by higher operating income partly offset by a negative financial net and increased tax costs. EPS diluted was SEK-1.98(-9.94) and EPS (non-IFRS) was SEK 0.27(-3.24).
Employees
The number of employees on December 31, 2018 was 95,359, a reduction of 5,376 employees compared with Dec 31, 2017.
The employee reduction was mainly in services as a consequence of the cost-reduction program. The number of R&D employees has increased by more than 1,100 in 2018.
| 5 Ericsson | Fourth Quarter and Full-Year Report 2018 | Financial highlights | |
Market area sales
| Fourth quarter 2018 | Change | |||||||||||||||||||||||||||
SEK b. | Networks | Digital Services | Managed Services | Emerging Busi- ness and Other | Total | YoY | QoQ | |||||||||||||||||||||
South East Asia, Oceania and India | 6.1 | 1.3 | 0.9 | 0.0 | 8.2 | 5 | % | 3 | % | |||||||||||||||||||
North East Asia | 5.5 | 2.5 | 0.4 | 0.0 | 8.4 | 30 | % | 45 | % | |||||||||||||||||||
North America | 14.0 | 2.8 | 1.2 | 0.0 | 18.0 | 23 | % | 21 | % | |||||||||||||||||||
Europe and Latin America | 10.5 | 4.3 | 3.4 | 0.1 | 18.2 | 8 | % | 23 | % | |||||||||||||||||||
Middle East and Africa | 3.6 | 1.8 | 1.0 | 0.0 | 6.5 | -14 | % | 14 | % | |||||||||||||||||||
Other1) | 1.9 | 0.4 | 0.0 | 2.1 | 4.4 | 2 | % | -3 | % | |||||||||||||||||||
|
|
|
|
|
|
|
|
|
|
|
|
|
| |||||||||||||||
Total | 41.6 | 13.0 | 6.9 | 2.3 | 63.8 | 10 | % | 19 | % | |||||||||||||||||||
|
|
|
|
|
|
|
|
|
|
|
|
|
| |||||||||||||||
| 1) | Market Area “Other” includes primarily licensing revenues and the major part of segment Emerging Business and Other |
FOURTH QUARTER COMMENTS
South East Asia, Oceania and India
Sales increased YoY, primarily in Managed Services where a new contract was won in 2018. Network sales increased slightly YoY, mainly in South East Asia. Digital Services sales declined YoY due to timing of project deliveries.
North East Asia
Sales increased YoY. In Mainland China, Network sales increased with continued deployment of Narrowband IoT. Digital Services sales also increased with signing of a telecom core contract that had been delayed from previous quarters. Sales in Japan remained flat while operators plan for 5G. Large scale field trials for 5G continue in Mainland China and Japan.
North America
Networks and Digital Services sales increased YoY, primarily driven by investments in 5G readiness and expansions across all major customers. Managed Services sales grew YoY, driven by strong variable sales in large customer contracts.
Europe and Latin America
Sales increased YoY, driven by growth in Latin America and parts of Europe. Managed Services sales declined YoY as a consequence of addressednon-strategic contracts.
Middle East and Africa
Sales declined YoY. Networks sales declined due to timing of investments and monetary restrictions in certain markets. Digital Services sales declined due to timing of project milestones. Managed services sales were stable YoY.
Other
Sales increased slightly YoY, mainly driven by growth in iconectiv (part of segment Emerging Business and Other). IPR licensing revenues amounted to SEK 2.1 (2.1) b.
| Full-year 2018 | Change | |||||||||||||||||||||||
SEK b. | Networks | Digital Services | Managed Services | Emerging Business and Other | Total | YoY | ||||||||||||||||||
South East Asia, Oceania and India | 21.3 | 4.8 | 3.4 | 0.0 | 29.6 | -6 | % | |||||||||||||||||
North East Asia | 15.9 | 4.8 | 1.5 | 0.1 | 22.3 | -5 | % | |||||||||||||||||
North America | 46.5 | 8.4 | 3.7 | 0.1 | 58.6 | 13 | % | |||||||||||||||||
Europe and Latin America | 34.4 | 12.3 | 13.2 | 0.3 | 60.3 | 6 | % | |||||||||||||||||
Middle East and Africa | 13.3 | 6.3 | 4.0 | 0.0 | 23.6 | -5 | % | |||||||||||||||||
Other1) | 7.2 | 1.4 | 0.0 | 7.9 | 16.5 | -1 | % | |||||||||||||||||
|
|
|
|
|
|
|
|
|
|
|
| |||||||||||||
Total | 138.6 | 38.1 | 25.8 | 8.4 | 210.8 | 3 | % | |||||||||||||||||
|
|
|
|
|
|
|
|
|
|
|
| |||||||||||||
| 1) | Market Area “Other” includes primarily licensing revenues and the major part of segment Emerging Business and Other |
FULL-YEAR COMMENTS
South East Asia, Oceania and India
Sales declined, mainly due to timing of major projects in Vietnam and India. Managed services sales grew slightly mainly due to a new contract, while sales in Digital Services remained flat.
North East Asia
Sales declined due to reduced operator investments in LTE whilst the operators plan for 5G.
North America
Networks sales increased, primarily driven by investments in 5G readiness across all major customers. Digital Services sales increased as operators digitalize operations and improve customer experience to prepare for 5G. Managed Services sales grew, driven by higher variable sales in large customer contracts.
Europe and Latin America
The strong growth in Networks sales in Latin America and parts of Europe was partly offset by lower sales in Managed Services due to exit ofnon-strategic contracts.
Middle East and Africa
Sales declined slightly. Networks sales declined due to monetary restrictions in certain markets, Digital Services declined due to timing of project milestones while Managed Services sales were flat.
Other
Sales declined slightly. IPR licensing revenues amounted to SEK 8.0 (8.3) b.
| 6 Ericsson | Fourth Quarter and Full-Year Report 2018 | Market area sales | |
Segment results
Networks
SEK b. | Q4 2018 | Q4 2017 | YoY change | Q3 2018 | QoQ change | Full-year 2018 | Full-year 2017 | Full-year change | ||||||||||||||||||||||||
Net sales | 41.6 | 37.1 | 12 | % | 35.9 | 16 | % | 138.6 | 132.3 | 5 | % | |||||||||||||||||||||
Of which products | 29.8 | 25.4 | 17 | % | 25.3 | 18 | % | 96.9 | 90.3 | 7 | % | |||||||||||||||||||||
Of which IPR licensing revenues | 1.8 | 1.7 | 2 | % | 1.8 | 0 | % | 6.5 | 6.8 | -4 | % | |||||||||||||||||||||
Of which services | 11.8 | 11.7 | 1 | % | 10.6 | 12 | % | 41.6 | 42.0 | -1 | % | |||||||||||||||||||||
Sales growth adjusted for comparable units and currency | — | — | 6 | % | — | 16 | % | — | — | 3 | % | |||||||||||||||||||||
Gross income | 16.6 | 11.8 | 40 | % | 14.8 | 12 | % | 55.2 | 43.4 | 27 | % | |||||||||||||||||||||
Gross margin | 39.9 | % | 32.0 | % | — | 41.3 | % | — | 39.8 | % | 32.8 | % | — | |||||||||||||||||||
Operating income | 6.9 | 1.9 | — | 5.7 | 21 | % | 19.4 | 10.5 | 86 | % | ||||||||||||||||||||||
Operating margin | 16.5 | % | 5.2 | % | — | 15.7 | % | — | 14.0 | % | 7.9 | % | — | |||||||||||||||||||
Restructuring charges | -0.4 | -1.3 | — | -0.1 | — | -1.8 | -4.8 | — | ||||||||||||||||||||||||
Gross income excl. restructuring charges | 17.1 | 12.9 | 32 | % | 14.9 | 15 | % | 56.5 | 46.6 | 21 | % | |||||||||||||||||||||
Gross margin excl. restructuring charges | 41.0 | % | 34.8 | % | — | 41.5 | % | — | 40.8 | % | 35.2 | % | — | |||||||||||||||||||
Operating income excl. restructuring charges | 7.3 | 3.2 | 127 | % | 5.8 | 26 | % | 21.2 | 15.3 | 39 | % | |||||||||||||||||||||
Operating margin excl. restructuring charges | 17.5 | % | 8.6 | % | — | 16.1 | % | — | 15.3 | % | 11.6 | % | — | |||||||||||||||||||
FOURTH QUARTER COMMENTS
Net sales
Sales increased by 12% YoY and sales adjusted for comparable units and currency increased by 6%. The increase is mainly due to strong growth in North America, Europe and Latin America as well as in North East Asia, driven by investments in 5G readiness and LTE networks.
Sales increased by 16% QoQ and sales adjusted for comparable units and currency also increased by 16%. The sequential sales growth was slightly lower than normal seasonality mainly due to lower sales in India. Sales in North America were higher than anticipated and driven by large hardware deliveries.
Gross margin
Gross margin increased to 39.9% (32.0%) YoY. Gross margin excluding restructuring charges increased to 41.0% (34.8%) due to improved margins in hardware and services as well as lower negative impact of higher recognition than deferral of hardware cost. In addition, the share of hardware sales increased whereas the share of services sales decreased, which impacted gross margin positively YoY.
Provisions and adjustments related to certain customer projects had a negative impact on gross margin in 2017.
Gross margin decreased to 39.9% from 41.3% QoQ. Gross margin excluding restructuring charges decreased to 41.0% from 41.5% QoQ. The decrease was due to hardware sales with initially lower margins, related to new strategic contracts taken to strengthen the market position. A lower share of services sales had a positive impact on gross margin QoQ.
Operating income and margin
Operating income increased to SEK 6.9 (1.9) b. YoY and operating margin improved to 16.5% (5.2%). Operating income excluding restructuring charges was SEK 7.3 (3.2) b. and the corresponding operating margin was 17.5% (8.6%). The improvement was mainly driven by higher gross margin and sales. Operating margin was positively impacted by reversal of provisions for impairment losses on trade receivables of SEK 0.3 (-0.6) b. in the quarter.
Operating income increased to SEK 6.9 b. from SEK 5.7 b. QoQ and operating margin increased to 16.5% from 15.7%. Operating income excluding restructuring charges increased to SEK 7.3 b. from SEK 5.8 b. and operating margin excluding restructuring charges increased to 17.5% from 16.1%. The improvement was driven by higher sales.
Provisions and adjustments related to certain customer projects as well as write-down of assets had a negative impact on operating income in 2017.
Net impact from amortization and capitalization of development expenses and from recognition and deferral of hardware costs
SEK b. | Q4 2018 | Q4 2017 | Q3 2018 | FY 2018 | FY 2017 | |||||||||||||||
Cost of Sales | -0.1 | -0.5 | -0.1 | -0.7 | -1.5 | |||||||||||||||
R&D expenses | 0.1 | -0.1 | 0.0 | 0.4 | 0.0 | |||||||||||||||
|
|
|
|
|
|
|
|
|
| |||||||||||
Total impact | 0.0 | -0.6 | -0.1 | -0.3 | -1.5 | |||||||||||||||
|
|
|
|
|
|
|
|
|
| |||||||||||
FULL-YEAR COMMENTS
Net sales
Sales increased by 5% YoY to SEK 138.6 (132.3) b. Sales adjusted for comparable units and currency increased by 3%. The sales increase was due to sales growth in North America and in Europe and Latin America, driven by telecom operator investments in 5G readiness and LTE networks. The Networks share of IPR licensing revenues was SEK 6.5 (6.8) b.
Gross margin
Gross income increased to SEK 55.2 (43.4) b. and gross margin increased to 39.8% (32.8%). Gross margin increased across all areas, mainly due to improved margins in hardware and a higher share of hardware sales at the expense of services sales. The impact on gross margin of higher recognition than deferral of hardware costs was SEK-0.7(-1.5) b. In 2017 the gross margin was negatively impacted by provisions and customer project adjustments.
| 7 Ericsson | Fourth Quarter and Full-Year Report 2018 | Segment results | Networks | |
Operating income and margin
Operating income increased to SEK 19.4 (10.5) b. due to lower restructuring charges as well as higher sales and gross margin. The increase was partly offset by increased operating expenses. Operating expenses increased mainly due to higher investments in R&D to strengthened technology leadership. Net impact from amortization and capitalization of development expenses and from recognition and deferral of hardware costs was SEK-0.3(-1.5) b. Restructuring charges were SEK-1.8(-4.8) b. Operating margin increased to 14.0% (7.9%).
Strategy execution
As presented at the 2018 Capital Markets Day, the target for Networks is to generate an operating margin between15%-17% (excluding restructuring charges) by 2020.
Four important ongoing strategic activities are to:
| • | invest in R&D to safeguard a leading portfolio and cost leadership |
| • | fully transition the radio unit deliveries to Ericsson Radio System (ERS) for increased competitiveness |
| • | continue to make savings in service delivery |
| • | selectively gain market share based on technology and cost competitiveness. |
The ERS, which was introduced to the market in 2015, has proven to be competitive as well as creating a strong market position. The ERS is now fully transitioned and it accounted for 93% of total radio unit deliveries in the fourth quarter and 87% for full-year 2018.
Byyear-end 2018 Ericsson had announced 10 commercial 5G deals and had 42 ongoing 5G trials. The market share of Ericsson RAN equipment has increased to 29.4% for the first nine months of 2018 compared with 28.2% for the same period in 2017, according to Dell’Oro’s report from November 2018.
| 8 Ericsson | Fourth Quarter and Full-Year Report 2018 | Segment results | Networks | |
Digital Services
SEK b. | Q4 2018 | Q4 2017 | YoY change | Q3 2018 | QoQ change | Full-year 2018 | Full-year 2017 | Full-year change | ||||||||||||||||||||||||
Net sales | 13.0 | 11.8 | 10 | % | 9.0 | 45 | % | 38.1 | 38.8 | -2 | % | |||||||||||||||||||||
Of which products | 7.5 | 6.5 | 16 | % | 4.6 | 63 | % | 20.5 | 21.0 | -3 | % | |||||||||||||||||||||
Of which IPR licensing revenues | 0.4 | 0.4 | 2 | % | 0.4 | 1 | % | 1.4 | 1.5 | -4 | % | |||||||||||||||||||||
Of which services | 5.5 | 5.4 | 3 | % | 4.4 | 26 | % | 17.6 | 17.7 | -1 | % | |||||||||||||||||||||
Sales growth adjusted for comparable units and currency | — | — | 5 | % | — | 45 | % | — | — | -4 | % | |||||||||||||||||||||
Gross income | -1.2 | 1.1 | — | 3.2 | -139 | % | 8.3 | 4.7 | 77 | % | ||||||||||||||||||||||
Gross margin | -9.5 | % | 9.4 | % | — | 35.7 | % | — | 21.8 | % | 12.1 | % | — | |||||||||||||||||||
Operating income (loss) | -7.1 | -12.3 | — | -1.8 | — | -13.9 | -27.3 | — | ||||||||||||||||||||||||
Operating margin | -54.5 | % | -103.8 | % | — | -19.9 | % | — | -36.4 | % | -70.4 | % | — | |||||||||||||||||||
Restructuring charges | -3.5 | -0.7 | — | -0.4 | — | -5.4 | -2.5 | — | ||||||||||||||||||||||||
Gross income excl. restructuring charges | 2.1 | 1.7 | 23 | % | 3.3 | -36 | % | 12.3 | 6.0 | 106 | % | |||||||||||||||||||||
Gross margin excl. restructuring charges | 16.4 | % | 14.6 | % | — | 36.9 | % | — | 32.4 | % | 15.4 | % | — | |||||||||||||||||||
Operating income (loss) excl. restructuring charges | -3.5 | -11.6 | — | -1.4 | 148 | % | -8.5 | -24.8 | — | |||||||||||||||||||||||
Operating margin excl. restructuring charges | -27.2 | % | -98.0 | % | — | -15.9 | % | — | -22.3 | % | -63.9 | % | — | |||||||||||||||||||
FOURTH QUARTER COMMENTS
Net sales
Sales increased by 10% YoY driven by strong sales of 5G-ready Cloud Core and OSS solutions in North East Asia and North America. Sales in the new product portfolio increased by 31% partly offset by continued decline in sales of the legacy product portfolio. The interest in Ericsson’s 5G-ready and cloud-native products remains strong with several signed contracts in the quarter. Sales adjusted for comparable units and currency increased by 5% YoY.
Sales increased by 45% QoQ, driven by seasonality and strong sales in Cloud Core and OSS in North East Asia and North America.
Gross margin
Provisions of SEK-6.1 b. were made in the quarter to reshape the Business Support Systems (BSS) strategy in Digital Services. The impact on cost of sales was SEK-5.9 b., of which SEK-3.1 b. were restructuring charges, and the impact on R&D expenses was SEK-0.2 b. (write-down of capitalized development expenses).
Gross margin decreased to-9.5% (9.4%) YoY, impacted by the above provisions.
Cost reductions and efficiency improvements had a significant impact on gross margin YoY. Gross margin excluding restructuring charges and other costs related to revised BSS strategy was 37.5%.
Gross margin declined to-9.5% from 35.7% QoQ, due to costs related to revised BSS strategy.
Operating income (loss)
Operating income was SEK-7.1(-12.3) b. and was impacted by costs related to revised BSS strategy. Operating income excluding restructuring charges and other costs related to revised BSS strategy was SEK-0.6 b. Cost reductions in both cost of sales and in operating expenses had a significant positive impact on operating income YoY. R&D expenses, excluding restructuring charges and excluding the net impact from amortized and capitalized development expenses, decreased by SEK 0.8 b. YoY. Total operating expenses excluding restructuring charges as a percentage of sales decreased by more than 10 percentage points compared with Q4 2017.
Operating income in Q4 2017 was negatively impacted by significant write-down of assets as well as provisions and customer project adjustments.
Operating income decreased to SEK-7.1 b. from SEK-1.8 b. QoQ, due to the BSS provisions of SEK-6.1 b. in the quarter. Operating income, excluding other costs related to revised BSS strategy and excluding total restructuring charges, improved to SEK-0.6 b. from SEK-1.4 b. QoQ, driven by increased sales, partly offset by seasonally higher operating expenses.
Net impact from amortization and capitalization of development expenses
SEK b. | Q4 2018 | Q4 2017 | Q3 2018 | FY 2018 | FY 2017 | |||||||||||||||
Cost of Sales | 0.0 | -0.3 | 0.0 | 0.0 | -1.1 | |||||||||||||||
R&D expenses | .-0.6 | -0.4 | -0.4 | -1.8 | -0.2 | |||||||||||||||
|
|
|
|
|
|
|
|
|
| |||||||||||
Total impact | -0.6 | -0.7 | -0.4 | -1.8 | -1.3 | |||||||||||||||
|
|
|
|
|
|
|
|
|
| |||||||||||
| 9 Ericsson | Fourth Quarter and Full-Year Report 2018 | Segment results | Digital Services | |
FULL-YEAR COMMENTS
Net sales
Sales decreased by-2% YoY. Sales in BSS declined by-11% while sales in OSS and Cloud Core grew YoY, driven by demand for the 5G-ready portfolio. Sales adjusted for comparable units and currency decreased by-4% YoY.
Gross margin
Gross margin increased YoY as a result of continuous work on service delivery efficiency. Gross margin was negatively impacted by costs related to revised BSS strategy, while cost reductions had a significant positive impact.
Gross margin was negatively impacted by significant write-down of assets as well as provisions and customer project adjustments in 2017.
Operating income (loss)
Operating income improved to SEK-13.9(-27.3) b. Full-year operating income wasSEK-5.5 b., excluding restructuring charges ofSEK-5.4 b. and excludingSEK-3.0 b. for other costs related to revised BSS strategy. This is a significant improvement compared with 2017, with profit improvements across all key portfolio areas. Most of the losses in 2018 are in BSS, and additional strategic actions to materially reduce the losses already in 2019 were announced in January 2019.
Write-down of assets as well as provisions and customer project adjustments had a significant negative impact on income in 2017. Cost reductions had a significant impact on gross margin and operating expenses compared with 2017.
Strategy execution
Top priority for Digital Services is to turn the segment into a profitable business, targeting low single-digit positive operating margin by 2020 (excluding restructuring charges). In 2018, the losses in the segment were significantly reduced, mainly through increased efficiency and reduced costs.
While new ways of working are improving R&D efficiency, investments in the portfolio of 5G-ready and cloud-native products will continue in order to defend the current market position and prepare Digital Services for future profitable growth. Hence the continued turnaround is performed in four strategic dimensions: customers, portfolio, commercial and operational. Key actions are to:
| • | Grow sales in line with the market development supported by a virtualized and 5G-ready portfolio, focusing on the installed base and large customers that are early 5G adopters. |
| • | Maintain a disciplined management of a focused portfolio that is optimized for business impact, with focused investments in cloud-native and automation technology. |
| • | Keep a strong commercial governance and discipline to maximize software value and avoid high-risk projects, such as large transformation deals. |
| • | Continue to improve operational efficiency across R&D, SG&A and service delivery. |
A key activity for the turnaround of Digital Services business is to complete, renegotiate or exit 45 identified critical andnon-strategic customer contracts. A total of 23 contracts had been addressed atyear-end and the plan is to complete an additional 25% of the 45 contracts in 2019. To reduce commercial risk and margin dilution, expert-team reviews of the performance of existing projects and reviews of scope and terms & conditions of new customer contracts, have been established.
The sales shift towards the new portfolio continues. Rolling 12 months sales of the new portfolio increased by 4%.
In January 2019, additional strategic measures for the BSS business were announced. The planned measures aim to materially contribute to reduce losses in BSS and Digital Services already in 2019, andde-risk the plan for Digital Services to reach the 2020 financial target.
| 10 Ericsson | Fourth Quarter and Full-Year Report 2018 | Segment results | Digital Services | |
Managed Services
| Q4 | Q4 | YoY | Q3 | QoQ | Full- year | Full- year | Full- year | |||||||||||||||||||||||||
SEK b. | 2018 | 2017 | change | 2018 | change | 2018 | 2017 | change | ||||||||||||||||||||||||
Net sales | 6.9 | 6.9 | 0 | % | 6.5 | 6 | % | 25.8 | 26.5 | -3 | % | |||||||||||||||||||||
Sales growth adjusted for comparable units and currency | — | — | -5 | % | — | 7 | % | — | — | -5 | % | |||||||||||||||||||||
Gross income (loss) | 0.8 | -0.7 | — | 0.8 | -3 | % | 2.9 | -1.6 | — | |||||||||||||||||||||||
Gross margin | 11.4 | % | -10.0 | % | — | 12.5 | % | — | 11.2 | % | -5.9 | % | — | |||||||||||||||||||
Operating income (loss) | 0.3 | -1.3 | — | 0.4 | -30 | % | 1.1 | -4.1 | — | |||||||||||||||||||||||
Operating margin | 4.1 | % | -18.5 | % | — | 6.3 | % | — | 4.2 | % | -15.4 | % | — | |||||||||||||||||||
Restructuring charges | -0.1 | -0.4 | — | 0.0 | — | -0.3 | -0.7 | — | ||||||||||||||||||||||||
Gross income (loss) excl. restructuring charges | 0.9 | -0.4 | — | 0.8 | 2 | % | 3.1 | -1.0 | — | |||||||||||||||||||||||
Gross margin excl. restructuring charges | 12.4 | % | -5.3 | % | — | 12.9 | % | — | 12.2 | % | -3.6 | % | — | |||||||||||||||||||
Operating income (loss) excl. restructuring charges | 0.4 | -0.9 | — | 0.4 | -20 | % | 1.4 | -3.4 | — | |||||||||||||||||||||||
Operating margin excl. restructuring charges | 5.2 | % | -13.0 | % | — | 6.8 | % | — | 5.3 | % | -12.9 | % | — | |||||||||||||||||||
FOURTH QUARTER COMMENTS
Net sales
Sales were flat YoY. Sales adjusted for comparable units and currency decreased by-5% YoY as a result of customer contract exits.
Sales increased by 6% QoQ. The increase was driven by growth across all service areas.
Sales adjusted for comparable units and currency increased by 7% QoQ.
Gross margin
Gross margin increased to 11.4%(-10.0%) YoY. Gross margin excluding restructuring charges increased to 12.4%(-5.3%) mainly as a results of customer contract reviews and efficiency measures.
Write-down of assets as well as provisions and customer project adjustments had a significant negative impact on gross margin in 2017.
Gross margin decreased to 11.4% from 12.5% QoQ. Gross margin excluding restructuring charges decreased to 12.4% from 12.9% QoQ.
Operating income and margin
Operating income increased to SEK 0.3(-1.3) b. YoY. Operating income excluding restructuring charges improved to SEK 0.4(-0.9) b. due to higher gross margin.
Sequentially, operating margin excluding restructuring charges decreased to 5.2% from 6.8%. The decrease was driven by seasonally higher operating expenses.
FULL-YEAR COMMENTS
Net sales
Sales decreased by-3% YoY. Sales adjusted for comparable units and currency decreased by-5% YoY, as a result of contract exits, partly offset by sales growth in Managed Services IT.
Gross margin
Gross margin increased YoY to 11.2%(-5.9%). Gross margin excluding restructuring charges increased to 12.2%(-3.6%) mainly as a result of customer contract reviews and efficiency measures.
Write-down of assets as well as provisions and customer project adjustments had a significant negative impact on gross margin in 2017.
Operating income
Operating income increased to SEK 1.1(-4.1) b. YoY. Operating income excluding restructuring charges improved to SEK 1.4(-3.4) b. due to higher gross margin.
Restructuring charges amounted to SEK-0.3(-0.7) b.
Strategy execution
Managed Services has introduced AI solutions which are patented and trialed in several customer engagements. The initial AI solutions already allow Ericsson to address network complexity and move network operations from being reactive to incidents, to becoming proactive – automatically identifying, proposing actions or even fixing the faults before they degrade network service quality. Further investments will be made in automation, analytics and AI-driven offerings to support 5G, IoT and cloud.
As presented at the 2018 Capital Markets Day, the ambition for Managed Services is to improve operating margin to5%-8% (excluding restructuring charges) in 2020. In order to focus the business and improve profitability, 42 managed services contracts have been identified for exit, renegotiation or transformation. Atyear-end 2018, all 42 contracts had been addressed, resulting in an annualized profit improvement of approximately SEK 0.9 b. Net sales reduction from contract exits is expected to be SEK 4b. at the end of 2019, compared to the 2016 base line.
| 11 Ericsson | Fourth Quarter and Full-Year Report 2018 | Segment results | Managed Services | |
Emerging Business and Other (includes Emerging Business, iconectiv, Red Bee Media and Media Solutions)
| Q4 | Q4 | YoY | Q3 | QoQ | Full year | Full year | Full year | |||||||||||||||||||||||||
SEK b. | 2018 | 2017 | change | 2018 | change | 2018 | 2017 | change | ||||||||||||||||||||||||
Net sales | 2.3 | 2.1 | 9 | % | 2.4 | -6 | % | 8.4 | 7.9 | 7 | % | |||||||||||||||||||||
Sales growth adjusted for comparable units and currency | — | — | 1 | % | — | -6 | % | — | — | 3 | % | |||||||||||||||||||||
Gross income | 0.2 | 0.2 | -13 | % | 0.8 | -73 | % | 1.8 | 1.4 | 34 | % | |||||||||||||||||||||
Gross margin | 9.3 | % | 11.7 | % | — | 32.3 | % | — | 21.9 | % | 17.5 | % | — | |||||||||||||||||||
Operating income (loss) | -1.9 | -7.7 | — | -1.0 | 83 | % | -5.4 | -13.8 | — | |||||||||||||||||||||||
Operating margin | -83.3 | % | -368.0 | % | — | -42.9 | % | — | -64.5 | % | -175.7 | % | — | |||||||||||||||||||
Restructuring charges | -0.4 | -0.1 | — | 0.0 | — | -0.6 | -0.5 | 22 | % | |||||||||||||||||||||||
Gross income excl. restructuring charges | 0.4 | 0.3 | 32 | % | 0.8 | -50 | % | 2.1 | 1.6 | 36 | % | |||||||||||||||||||||
Gross margin excl. restructuring charges | 17.1 | % | 14.1 | % | — | 32.3 | % | — | 25.4 | % | 19.9 | % | — | |||||||||||||||||||
Operating income (loss) excl. restructuring charges | -1.5 | -7.6 | — | -1.0 | 52 | % | -4.8 | -13.3 | — | |||||||||||||||||||||||
Operating margin excl. restructuring charges | -67.1 | % | -363.1 | % | — | -41.5 | % | — | -57.4 | % | -169.6 | % | — | |||||||||||||||||||
FOURTH QUARTER COMMENTS Net sales
Sales increased by 9% YoY. Sales adjusted for comparable units and currency increased by 1% YoY. Sales excluding the media businesses increased by 60%, driven by iconectiv. Sales in the media businesses (Media Solutions and Red Bee Media) declined to SEK 1.3 (1.4) b.
Sales decreased by-6% QoQ. Sales adjusted for comparable units and currency also decreased by-6% QoQ mainly due to reduced sales in the media businesses. The decrease was partly offset by growth in Emerging Business.
Gross margin
Gross margin decreased to 9.3% (11.7%) YoY. Gross margin excluding restructuring charges increased to 17.1% (14.1%). Write-down of assets had a significant negative impact on gross margin in Q4 2017.
Gross margin decreased to 9.3% from 32.3% QoQ, mainly as a consequence of reduced margins in the media businessespartly due to aone-time project cost of SEK-0.1 b. In addition, gross margin was negatively impacted by increased customization costs related to strategic contracts in Emerging Business.
Operating income (loss)
Operating income improved to SEK-1.9(-7.7) b. YoY. Operating income excluding restructuring charges improved to SEK-1.5(-7.6) b.
Q4 2018 (Q4 2017) financials, SEK b. excluding restructuring
| Media Solutions | Red Bee Media | Emerging Business, iconectiv and common costs | Segment Total | |||||||||||||
Net Sales | 0.7 (0.8 | ) | 0.6 (0.7 | ) | 1.0 (0.6 | ) | 2.3 (2.1 | ) | ||||||||
Op. Income | -0.5 (-6.0 | ) | -0.1 (-0.8 | ) | -0.9 (-0.8 | ) | -1.5 (-7.6 | ) | ||||||||
Media Solutions = MediaKind including transaction-related costs etc Write-down of assets had a significant negative impact on operating income in Q4 2017.
Media Solutions operating income was impacted byone-time project costs of SEK-0.1 b. and SEK-0.1 b. in costs related to the planned divestment of MediaKind.
While the iconectiv business continued to deliver solid profitable results, operating income in Emerging Business declined YoY negatively impacted by increased investments as well as costs of SEK-0.4 b. of which SEK-0.1 b. in restructuring charges for resetting the Edge Gravity business. The resetting allows for a leanerset-up of content delivery and for accelerated efforts in Edge Compute.
Sequentially, operating income declined to SEK-1.9 b. from SEK-1.0 b. Operating income excluding restructuring charges declined to SEK-1.5 b. from SEK-1.0 b. impacted by lower gross margin and by costs for resetting the Edge Gravity business.
Net impact from amortization and capitalization of development expenses
SEK b. | Q4 2018 | Q4 2017 | Q3 2018 | FY 2018 | FY 2017 | |||||||||||||||
Cost of Sales | -0.1 | 0.0 | -0.1 | -0.2 | 0.0 | |||||||||||||||
R&D expenses | -0.1 | -0.1 | 0.0 | -0.2 | -0.1 | |||||||||||||||
|
|
|
|
|
|
|
|
|
| |||||||||||
Total impact | -0.1 | -0.1 | -0.1 | -0.4 | -0.1 | |||||||||||||||
|
|
|
|
|
|
|
|
|
| |||||||||||
FULL-YEAR COMMENTS Net sales
Sales increased by 7% YoY. Sales adjusted for comparable units and currency increased by 3% YoY, driven by growth in the iconectiv business through a multi-year number portability contract in the United States. Sales in Emerging Business grew by more than 25% YoY. Media Solutions sales declined by-14% due to lower sales in the legacy portfolio. Red Bee Media sales declined by-4% YoY due to renegotiations and changes in scope of contracts.
Gross margin
Gross margin increased. Write-down of assets had a significant negative impact on gross margin in 2017.
| 12 Ericsson | Fourth Quarter and Full-Year Report 2018 | Segment results | Emerging Business and Other | |
Operating income (loss)
Full-year financials for 2018 (2017) , SEK b. excluding restructuring
| Emerging Business, | ||||||||||||||||
| Media | iconectiv and | |||||||||||||||
| Solutions | Red Bee Media | common costs | Segment Total | |||||||||||||
Net Sales | 2.7 | (3.2) | 2.3 | (2.4) | 3.4 | (2.3) | 8.4 | (7.9) | ||||||||
Op. Income | -1.7 | (-8.9) | -0.3 | (-1.8) | -2.8 | (-2.7) | -4.8 | (-13.3) | ||||||||
Cost reductions had a positive impact on Media Solutions operating income, partly offset by reduced sales and costs of SEK-0.3 b. related to the planned transaction with One Equity Partners. Write-down of assets had a significant negative impact on Media Solutions income in 2017.
Operational efficiencies and cost reductions had a positive impact on Red Bee Media income, while reduced sales impacted negatively. Write-down of assets had a significant negative impact on Red Bee Media income in 2017.
Losses increased due to costs of SEK-0.4 b., of which SEK-0.1 b. in restructuring charges, for resetting the Edge Gravity business and increased investments in new areas such as IoT and Emodo. The growth in iconectiv business had a positive impact on operating income.
Strategy execution
The target for Emerging Business and Other in 2020 is to reach a break-even operating income (excluding restructuring charges) with a net sales ambition of SEK5-7 b., given the current portfolio and strategy for the areas.
Selective investments will continue in Emerging Business in order to build a position and grow sales in new areas. Parts of the portfolio are still in an early phase, with focus on generating sales and scale the business. Emerging business sales grew by more than 25% in 2018, but do not yet cover required investments, resulting in a negative bottom line.
For Red Bee Media, the target remains to achieve a sustainable profitable business by continuing to develop and manage the business as an independent and focused media services entity within Ericsson.
The planned divestment of MediaKind is ongoing. The demand for MediaKind’s portfolio continues to be stable across the global customer base. Actions taken during 2018 are expected to result in improved sales and cost structures during second half 2019.
| 13 Ericsson | Fourth Quarter and Full-Year Report 2018 | Segment results | Emerging Business and Other | |
Cash flow
| Q4 | Q4 | Q3 | Full-year | Full-year | ||||||||||||||||
SEK b. | 2018 | 2017 | 2018 | 2018 | 2017 | |||||||||||||||
Net income reconciled to cash | -0.1 | -4.0 | 2.9 | 1.6 | -13.1 | |||||||||||||||
Changes in operating net assets | 4.4 | 15.2 | -0.9 | 7.8 | 22.7 | |||||||||||||||
Cash flow from operating activities | 4.3 | 11.2 | 2.0 | 9.3 | 9.6 | |||||||||||||||
Cash flow from investing activities | -2.2 | -3.8 | -1.7 | -4.1 | -16.1 | |||||||||||||||
Cash flow from financing activities | -0.6 | 2.1 | 0.3 | -4.1 | 5.5 | |||||||||||||||
Effect of exchange rate changes on cash | 0.8 | 0.2 | -1.6 | 1.4 | -0.1 | |||||||||||||||
Net change in cash and cash equivalents | 2.3 | 9.7 | -1.0 | 2.5 | -1.1 | |||||||||||||||
Free cash flow excluding M&A | 3.0 | 10.2 | 0.7 | 4.3 | 4.8 | |||||||||||||||
Free cash flow | 3.0 | 10.1 | 0.3 | 3.0 | 5.1 | |||||||||||||||
FOURTH QUARTER COMMENTS
Operating activities
Net income reconciled to cash was SEK-0.1(-4.0) b. Large provisions in Q4 impacted net income negatively. Cash flow from operating activities was SEK 4.3 (11.2) b. due to changes in operating net assets, including the increased provisions. Trade receivables increased on the back of the increased business activity in the quarter. Sale of trade receivables continued to trend downwards and decreased YoY. Quarterly cash flows may vary as the business develops. Cash outlays related to provisions were SEK-1.4(-2.2) b., of which cash outlays related to restructuring charges were SEK-0.7(-1.2) b. in the quarter.
Investing activities
Cash flow from investing activities was SEK-2.2(-3.8) b. Investments in M&A were SEK 0.0(-0.1) b. Cash flow from investments in property, plant and equipment was SEK-1.1(-1.1) b. and from capitalized development expenses SEK-0.2(-0.1) b.
Financing activities
Cash flow from financing activities was SEK-0.6 (2.1) b. due to a reduction in borrowings.
Free cash flow
Free cash flow was SEK 3.0 (10.1) b. generated by positive cash flow from operating activities and limited investing activities. The decrease in free cash flow YoY was due to higher business activity than last year with decreased cash flow from operating activities. In 2017, new credits were raised generating significant cash flow from financing activities.
Free cash flow excluding M&A was SEK 3.0 (10.2) b.
FULL-YEAR COMMENTS
Operating activities
Cash flow from operating activities reached SEK 9.3 (9.6) b. Working capital efficiency has improved as a result of a strong focus on cash flow. The business growth in 2018 and high delivery and invoicing volumes towards the end of the year led to somebuild-up of trade receivables, to be collected in the coming periods. Inventory and trade payables also increased to meet customer demand in a growing market. The combined working capital KPI improved to 89 (102) days. The ambition is to maintain working capital efficiency and thereby effectively convert income to cash. Cash outlays related to provisions were SEK-6.9(-8.2) b., of which cash outlays related to restructuring charges were SEK-4.1(-5.3) b.
Working capital KPIs, number of days | Jan-Dec 2018 | Jan-Dec 2017 | ||||||
+Sales outstanding (target: <90) | 91 | 96 | ||||||
+Inventory (target: <65) | 70 | 66 | ||||||
-Payable (target: >60) | 72 | 60 | ||||||
Combined working capital | 89 | 102 | ||||||
Investing activities
Cash flow from investing activities was SEK-4.1(-16.1) b., impacted by investments and sale of property, plant and equipment with a net effect of SEK-3.6(-2.9) b. and investments in M&A of SEK-1.3 (0.3) b. In addition, product development decreased by SEK-0.9(-1.4) b. due to reduced capitalization of product platform development following technology shifts.
Financing activities
Cash flow from financing activities was SEK-4.1 (5.5) b. Dividends of SEK 3.4 (3.4) b. were paid out.
Free cash flow
The focus on free cash flow and release of working capital, in combination with limited investing activities, resulted in free cash flow of SEK 3.0 (5.1) b. and in free cash flow excluding M&A of SEK 4.3 (4.8) b.
| 14 Ericsson | Fourth Quarter and Full-Year Report 2018 | Cash flow | |
Financial position
| Dec 31 | Dec 31 | Sep 30 | ||||||||||
SEK b. | 2018 | 2017 | 2018 | |||||||||
+ Cash and cash equivalents | 38.4 | 35.9 | 36.1 | |||||||||
+ Interest-bearing securities, current | 6.6 | 6.7 | 6.6 | |||||||||
+ Interest-bearing securities,non-current | 24.0 | 25.1 | 23.0 | |||||||||
|
|
|
|
|
| |||||||
Gross cash | 69.0 | 67.7 | 65.7 | |||||||||
|
|
|
|
|
| |||||||
– Borrowings, current | 2.3 | 2.5 | 2.5 | |||||||||
– Borrowings,non-current | 30.9 | 30.5 | 31.2 | |||||||||
|
|
|
|
|
| |||||||
Net cash | 35.9 | 34.7 | 32.0 | |||||||||
|
|
|
|
|
| |||||||
Equity | 87.8 | 97.6 | 96.0 | |||||||||
Total assets | 268.8 | 259.9 | 264.8 | |||||||||
Capital turnover (times) | 1.4 | 1.2 | 1.3 | |||||||||
Return on capital employed (%) | 0.6 | % | -20.6 | % | 2.6 | % | ||||||
Equity ratio (%) | 32.7 | % | 37.5 | % | 36.2 | % | ||||||
Return on equity (%) | -7.1 | % | -28.1 | % | 0.0 | % | ||||||
FOURTH QUARTER COMMENTS
Gross cash increased by SEK 3.3 b. and net cash increased by SEK 3.9 b. in the quarter, as a result of the positive free cash flow. Gross cash was SEK 69.0 b. and net cash was SEK 35.9 b.
Liability for post-employments benefits increased in the quarter, to SEK 28.7 b. from SEK 25.5 b., due to lower interest rates in Sweden.
FULL-YEAR COMMENTS
Gross cash increased to SEK 69.0 (67.7) b. and net cash increased to SEK 35.9 (34.7) b.
Liability for post-employments benefits increased by SEK 3.7 b. mainly due to decreased discount rates and normal service costs. The Swedish defined benefit obligation (DBO) has been calculated using a discount rate based on the yields of Swedish government bonds. If the discount rate had been based on Swedish covered mortgage bonds, the liability for post-employment benefits would have been approximately SEK 9.5 b. lower as of Dec 31, 2018.
The average maturity of long-term borrowings as of Dec 31, 2018, was 3.4 years, a decrease from 4.4 years 12 months earlier.
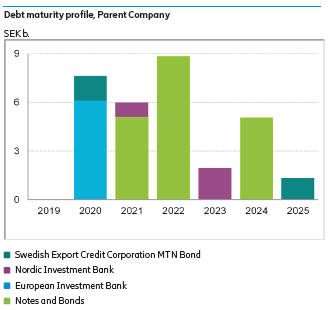
Ericsson has an unutilized Revolving Credit Facility of USD 2.0 b. The facility will expire in 2022.
In 2018, Ericsson signed a credit facility agreement of EUR 250 million with the European Investment Bank (EIB). The credit facility is undrawn and will mature five years after disbursement.
Moody’s changed their outlook on Ericsson’s long-term rating from negative to stable. The rating of Ba2 was unchanged.
The capital efficiency improved during the year and the capital turnover reached 1.4 (1.2) times.
| 15 Ericsson | Fourth Quarter and Full-Year Report 2018 | Financial position | |
Parent Company
Income after financial items was SEK 5.8(-2.0) b. Impairment of investments in subsidiaries has decreased to SEK 1.2 (9.0) b, which was the main contributor to the increase in Income after financial items.
At the end of the year, gross cash (cash, cash equivalents, short-term investments and interest-bearing securitiesnon-current) amounted to SEK 58.1 (50.3) b.
The Parent Company has during the quarter recognized dividends from subsidiaries of SEK 3.2 (5.2) b.
There has been a decrease of intercompany lending of SEK 10.4 b. and intercompany borrowing of SEK 1.9 b. during the fourth quarter.
In accordance with the conditions of the long-term variable compensation program (LTV) for Ericsson employees, 3,346,918 shares from treasury stock were sold or distributed to employees during the fourth quarter. The holding of treasury stock on December 31, 2018, was 37,057,039 Class B shares.
| 16 Ericsson | Fourth Quarter and Full-Year Report 2018 | Parent Company | |
Dividend, AGM and Annual Report
Dividend proposal
The Board of Directors will propose to the Annual General Meeting to resolve on a dividend of SEK 1.00 (1.00) per share, representing some SEK 3.3 (3.3) b., and March 29, 2019, as the record date for payment of dividend. The dividend reflects this year’s earnings and balance sheet structure, as well as coming years’ business plans and expected economic development.
Ericsson Annual General Meeting
The Annual General Meeting of shareholders will be held on March 27, 2019, 15.00 (CET) at Kistamässan, Kista/Stockholm, Sweden.
Annual Report
The annual report will be made available on the Ericsson website www.ericsson.com and at the Ericsson headquarters, Torshamnsgatan 21, Kista, Stockholm, Sweden, in the last week of February.
| 17 Ericsson | Fourth Quarter and Full-Year Report 2018 | Dividend, AGM and Annual Report | |
Other information
Ericsson Capital Markets Day 2018
On November 8, 2018, Ericsson held its Capital Markets Day giving an overview of its turnaround, strategy and plans for future growth as well as details about its business segments and the market trends. Further, the presentations included updated net sales ambitions for 2020 and financial targets for 2020 and 2022.
SEC and DOJ inquiries
As previously disclosed, Ericsson has been voluntarily cooperating since 2013 with an investigation by the United States Securities and Exchange Commission (SEC) and, since 2015, with an investigation by the United States Department of Justice (DOJ) into Ericsson’s compliance with the U.S. Foreign Corrupt Practices Act (FCPA). The discussions with these authorities continue. While the length of these discussions cannot be determined, the company’s previous assessment, that the resolution of these matters will likely result in monetary and other measures, the magnitude of which at this time cannot be reliably estimated but may be material, remains. Ericsson continues its efforts to improve on its compliance program.
POST-CLOSING EVENTS
Provisions in fourth quarter related to reshaping BSS business
On January 10, 2019, Ericsson announced that the focus on simplifying and stabilizing the business has resulted in stronger gross margins and a stabilizing topline. While there has been solid progress in most portfolio areas, the Business Support Systems area in segment Digital Services is not showing satisfactory progress, jeopardizing the segment Digital Services overall profitability target for 2020.
The company’s past strategy has not been successful. It included pursuing large transformation projects based onpre-integrated solutions and development of a next-generation BSS platform. Consequently, at the Capital Markets Day on Nov. 8, 2018, Ericsson presented a revised BSS strategy, with increased investments in the established platform and a refocus of the next-generation BSS platform to fulfilling existing customer commitments only.
The company has now decided to pursue additional measures to speed up the restructuring of the BSS business. Provisions for the cost of executing on these measures, together with necessary contract loss provisions, negatively impacted operating income by SEK 6.1 b. in Q4, 2018, mainly impacting gross margin. SEK 3.1 b. of this amount is treated as restructuring charges. Further restructuring charges, estimated to be SEK 1.5 b, are anticipated for 2019. The vast majority of the provision amount will impact cash flow, starting in 2019 and continuing over several years.
Ericsson announced changes to Executive Team
On January 16, 2019, Ericsson announced that Helena Norrman, Senior Vice President, Chief Marketing and Communications Officer and Head of Marketing and Corporate Relations, has decided to leave Ericsson to pursue opportunities outside the company. Helena Norrman has been with the company since 1998 and has served on Ericsson’s Executive Team since 2010. Helena will leave her position effective no later than June 30, 2019.
| 18 Ericsson | Fourth Quarter and Full-Year Report 2018 | Other information | |
Risk factors
Ericsson’s operational and financial risk factors and uncertainties are described in our Annual Report 2017. Risk factors and uncertainties in focus short term for the Parent Company and the Ericsson Group include, but are not limited to:
| • | Potential negative effects on operators’ willingness to invest in network development due to uncertainty in the financial markets and a weak economic business environment, or reduced consumer telecom spending, or increased pressure on Ericsson to provide financing, or delayed auctions of spectrum |
| • | Intense competition from existing competitors as well as new entrants, including IT companies entering the telecommunications market, which could have a material adverse effect on the results |
| • | Uncertainty regarding the financial stability of suppliers, for example due to lack of financing |
| • | Effects on gross margins and/or working capital of the business mix in the Networks segment between capacity sales and new coverage build-outs |
| • | Effects on gross margins of the business mix including new network build-outs and new managed services or digital transformation deals with initial transition costs |
| • | Effects of the ongoing industry consolidation among our customers as well as between our largest competitors, e.g. with postponed investments and intensified price competition as a consequence |
| • | New and ongoing partnerships which may not be successful and expose us to future costs |
| • | Changes in foreign exchange rates, in particular USD |
| • | Political unrest and uncertainty and geopolitical uncertainty in certain markets, including escalating trade disputes and sanctions and uncertainties relating to Brexit, with potential effects such as increased supply costs, limitations to the free movement of goods and services, professional staff and cross-border data |
| • | Effects on production and sales from restrictions with respect to timely and adequate supply of materials, components and production capacity and other vital services on competitive terms |
| • | No guarantees that strategy execution, specific restructuring or cost-savings initiatives, profitability restoring efforts and/or organizational changes will be sufficient, successful or executed in time to deliver any improvements in earnings |
| • | Cybersecurity incidents, which may have a material negative impact |
| • | Rapidly changing technologies and the ways these are brought to the market, which could be disruptive to the business |
| • | Ericsson is subject to risks associated with the development and implementation of new solutions or technologies under existing customer contracts. The Company may not be successful or incur delays in developing or implementing such solutions or technologies, which could result in damage claims and loss of customers which may have an adverse impact on liquidity and results of operations. |
Ericsson monitors the compliance with all relevant trade regulations and trade embargoes applicable to dealings with customers operating in countries where there are trade restrictions or trade restrictions are discussed.
Ericsson strives to operate globally in accordance with Group policies and directives for business ethics and conduct and has a dedicated ethics and compliance program. However, in some of the countries where the Company operates, corruption risks can be high and compliance failure could have a material adverse impact on our business, financial condition and brand.
Ericsson is voluntarily cooperating with investigations by the United States Securities and Exchange Commission and the United States Department of Justice regarding its compliance with the U.S. Foreign Corrupt Practices Act. The Company continues to cooperate with the SEC and DOJ and is engaged in discussions with them to find a resolution. While the length of these discussions cannot be determined, based on the facts that the Company has shared with the authorities, Ericsson believes that the resolution of these matters will likely result in monetary and other measures, the magnitude of which cannot be estimated currently but may be material. Potential future cash outflows are currently not capable of being reliably estimated. Accordingly, no provisions have been recorded for such potential exposure.
Stockholm, January 25, 2019
Telefonaktiebolaget LM Ericsson
Börje Ekholm, President and CEO Org.
no. 556016-0680
Date for next report: April 17, 2019
| 19 Ericsson | Fourth Quarter and Full-Year Report 2018 | Risk factors | |
Auditors’ Review Report
Introduction
We have reviewed the condensed interim financial information (interim report) of Telefonaktiebolaget LM Ericsson (publ.) as of December 31, 2018, and the twelve months period then ended. The board of directors and the CEO are responsible for the preparation and presentation of the interim financial report in accordance with IAS 34 and the Swedish Annual Accounts Act. Our responsibility is to express a conclusion on this interim report based on our review.
Scope of review
We conducted our review in accordance with the International Standard on Review Engagements ISRE 2410, Review of Interim Report Performed by the Independent Auditor of the Entity.
A review consists of making inquiries, primarily of persons responsible for financial and accounting matters, and applying analytical and other review procedures. A review is substantially less in scope than an audit conducted in accordance with International Standards on Auditing, ISA, and other generally accepted auditing standards in Sweden. The procedures performed in a review do not enable us to obtain assurance that we would become aware of all significant matters that might be identified in an audit. Accordingly, we do not express an audit opinion.
Conclusion
Based on our review, nothing has come to our attention that causes us to believe that the interim report is not prepared, in all material respects, in accordance with IAS 34 and the Swedish Annual Accounts Act, regarding the Group, and with the Swedish Annual Accounts Act, regarding the Parent Company.
Stockholm, January 25, 2019
PricewaterhouseCoopers AB
Bo Hjalmarsson
Authorized Public Accountant
Auditor in Charge
Johan Engstam
Authorized Public Accountant
| 20 Ericsson | Fourth Quarter and Full-Year Report 2018 | Auditors’ Review Report | |
Editor’s note
Press briefing and live webcast
Ericsson invites media, investors and analysts to conference calls on January 25, 2019; one starting at 09.00 (CET) and the other at 14.00 (CET).
Live audio webcasts of the conference calls as well as supporting slides will be available at:
www.ericsson.com/investors and
www.ericsson.com/press
Replay of the conference calls will be available approximately one hour after each call has ended and will remain available for seven days.
For further information, please contact:
Carl Mellander Senior Vice President, Chief Financial Officer
Phone: +46 10 713 89 70
E-mail: investor.relations@ericsson.com or
media.relations@ericsson.com
Helena Norrman, Senior Vice President, Chief Marketing and
Communications Officer
Phone: +46 10 719 34 72
E-mail: investor.relations@ericsson.com or
media.relations@ericsson.com
Telefonaktiebolaget LM Ericsson
Org. number: 556016-0680
Torshamnsgatan 21
SE-164 83 Stockholm
Phone: +46 10 719 00 00
www.ericsson.com
Investors
Peter Nyquist, Vice President,
Head of Investor Relations
Phone: +46 10 714 64 99, +46 70 575 29 06
E-mail: peter.nyquist@ericsson.com
Stefan Jelvin, Director,
Investor Relations
Phone: +46 10 714 20 39, +46 70 986 02 27
E-mail: stefan.jelvin@ericsson.com
Åsa Konnbjer, Director,
Investor Relations
Phone: +46 10 713 39 28, +46 73 082 59 28
E-mail: asa.konnbjer@ericsson.com
Rikard Tunedal, Director,
Investor Relations
Phone: +46 10 714 54 00, +46 761 005 400
E-mail: rikard.tunedal@ericsson.com
Media
Ola Rembe, Vice President,
Head of External Communications
Phone: +46 10 719 97 27, +46 73 024 48 73
E-mail: media.relations@ericsson.com
Corporate Communications
Phone: +46 10 719 69 92
E-mail: media.relations@ericsson.com
| 21 Ericsson | Fourth Quarter and Full-Year Report 2018 | Editor’s note | |
Forward-looking statements
This report includes forward-looking statements, including statements reflecting management’s current views relating to the growth of the market, future market conditions, future events, financial condition, and expected operational and financial performance, including, in particular the following:
| • | Our goals, strategies, planning assumptions and operational or financial performance expectations |
| • | Industry trends, future characteristics and development of the markets in which we operate |
| • | Our future liquidity, capital resources, capital expenditures, cost savings and profitability |
| • | The expected demand for our existing and new products and services as well as plans to launch new products and services including research and development expenditures |
| • | The ability to deliver on future plans and to realize potential for future growth |
| • | The expected operational or financial performance of strategic cooperation activities and joint ventures |
| • | The time until acquired entities and businesses will be integrated and accretive to income |
| • | Technology and industry trends including the regulatory and standardization environment in which we operate, competition and our customer structure. |
The words “believe,” “expect,” “foresee,” “anticipate,” “assume,” “intend,” “likely,” “projects,” “may,” “could,” “plan,” “estimate,” “forecast,” “will,” “should,” “would,” “predict,” “aim,” “ambition,” “seek,” “potential,” “target,” “might,” “continue,” or, in each case, their negative or variations, and similar words or expressions are used to identify forward-looking statements. Any statement that refers to expectations, projections or other characterizations of future events or circumstances, including any underlying assumptions, are forward-looking statements.
We caution investors that these statements are subject to risks and uncertainties many of which are difficult to predict and generally beyond our control that could cause actual results to differ materially from those expressed in, or implied or projected by, the forward-looking information and statements.
Important factors that could affect whether and to what extent any of our forward-looking statements materialize include, but are not limited to, the factors described in the section “Risk Factors”, and in “Risk Factors” in the Annual Report 2017.
These forward-looking statements also represent our estimates and assumptions only as of the date that they were made. We expressly disclaim a duty to provide updates to these forward-looking statements, and the estimates and assumptions associated with them, after the date of this report, to reflect events or changes in circumstances or changes in expectations or the occurrence of anticipated events, whether as a result of new information, future events or otherwise, except as required by applicable law or stock exchange regulation.
| 22 Ericsson | Fourth Quarter and Full-Year Report 2018 | Forward-looking statements | |
Financial statements
and other information
| 24 | ||
| 24 | ||
| 25 | ||
| 26 | ||
| 27 | ||
| 27 | ||
| 28 | ||
| 29 | ||
| 29 | ||
| 30 | ||
| 31 | ||
| 34 | ||
| 35 | ||
| 36 | ||
| 36 | ||
| 37 | Operating income (loss) and operating margin by segment by quarter | |
| 38 | ||
| 39 | ||
| 40 | ||
| 40 | ||
| 41 | ||
| 41 | ||
| 42 | ||
| 43 | ||
| 43 | ||
| 44 | ||
| 44 | ||
| 45 | Gross income (loss) and gross margin excluding restructuring charges by segment | |
| 46 | Operating income (loss) and operating margin excluding restructuring charges by segment | |
| 47 | ||
| 48 | ||
| 50 | ||
| 50 | ||
| 50 | ||
| 51 | ||
| 51 | ||
| 52 | ||
| 52 | ||
| 52 | ||
| 53 | ||
| 53 | ||
| 23 Ericsson | Fourth Quarter and Full-Year Report 2018 | Financial statements and other information | |
| Oct-Dec | Jan-Dec | |||||||||||||||||||||||
SEK million | 2018 | 2017 | Change | 2018 | 2017 | Change | ||||||||||||||||||
Net sales | 63,809 | 57,881 | 10 | % | 210,838 | 205,378 | 3 | % | ||||||||||||||||
Cost of sales | -47,430 | -45,365 | 5 | % | -142,638 | -157,451 | -9 | % | ||||||||||||||||
|
|
|
|
|
|
|
|
|
|
|
| |||||||||||||
Gross income | 16,379 | 12,516 | 31 | % | 68,200 | 47,927 | 42 | % | ||||||||||||||||
|
|
|
|
|
|
|
|
|
|
|
| |||||||||||||
Gross margin (%) | 25.7 | % | 21.6 | % | 32.3 | % | 23.3 | % | ||||||||||||||||
Research and development expenses | -10,665 | -9,938 | 7 | % | -38,909 | -37,887 | 3 | % | ||||||||||||||||
Selling and administrative expenses | -7,685 | -8,245 | -7 | % | -27,519 | -29,027 | -5 | % | ||||||||||||||||
Impairment losses on trade receivables1) | 386 | -680 | -157 | % | -420 | -3,649 | -88 | % | ||||||||||||||||
|
|
|
|
|
|
|
|
|
|
|
| |||||||||||||
Operating expenses | -17,964 | -18,863 | -5 | % | -66,848 | -70,563 | -5 | % | ||||||||||||||||
|
|
|
|
|
|
|
|
|
|
|
| |||||||||||||
Other operating income and expenses1) | -294 | -12,926 | -168 | -12,131 | ||||||||||||||||||||
Shares in earnings of JV and associated companies | 27 | -5 | 58 | 24 | ||||||||||||||||||||
|
|
|
|
|
|
|
|
|
|
|
| |||||||||||||
Operating income (loss) | -1,852 | -19,278 | -90 | % | 1,242 | -34,743 | -104 | % | ||||||||||||||||
|
|
|
|
|
|
|
|
|
|
|
| |||||||||||||
Financial income | -294 | -124 | -316 | -372 | ||||||||||||||||||||
Financial expenses | -421 | -394 | -2,389 | -843 | ||||||||||||||||||||
|
|
|
|
|
|
|
|
|
|
|
| |||||||||||||
Income after financial items | -2,567 | -19,796 | -87 | % | -1,463 | -35,958 | -96 | % | ||||||||||||||||
|
|
|
|
|
|
|
|
|
|
|
| |||||||||||||
Taxes | -3,930 | 1,303 | -402 | % | -4,813 | 3,525 | -237 | % | ||||||||||||||||
|
|
|
|
|
|
|
|
|
|
|
| |||||||||||||
Net income (loss) | -6,497 | -18,493 | -65 | % | -6,276 | -32,433 | -81 | % | ||||||||||||||||
|
|
|
|
|
|
|
|
|
|
|
| |||||||||||||
Net income (loss) attributable to: | ||||||||||||||||||||||||
Stockholders of the Parent Company | -6,553 | -18,476 | -6,530 | -32,576 | ||||||||||||||||||||
Non-controlling interests | 56 | -17 | 254 | 143 | ||||||||||||||||||||
Other information | ||||||||||||||||||||||||
Average number of shares, basic (million) | 3,296 | 3,283 | 3,291 | 3,277 | ||||||||||||||||||||
Earnings (loss) per share, basic (SEK)2) | -1.99 | -5.63 | -1.98 | -9.94 | ||||||||||||||||||||
Earnings (loss) per share, diluted (SEK)3) | -1.99 | -5.63 | -1.98 | -9.94 | ||||||||||||||||||||
| 1) | Impairment of trade receivables has been calculated according to IFRS 9 in 2018 and according to IAS 39 in 2017. Previously, these losses have been reported as selling and administrative expenses. |
| 2) | Based on net income (loss) attributable to stockholders of the Parent Company. |
| 3) | Potential ordinary shares are not considered when their conversion to ordinary shares would increase earnings per share. |
Statement of comprehensive income (loss)
| Oct-Dec | Jan-Dec | |||||||||||||||
SEK million | 2018 | 2017 | 2018 | 2017 | ||||||||||||
Net income (loss) | -6,497 | -18,493 | -6,276 | -32,433 | ||||||||||||
|
|
|
|
|
|
|
| |||||||||
Other comprehensive income (loss) | ||||||||||||||||
Items that will not be reclassified to profit or loss | ||||||||||||||||
Remeasurements of defined benefits pension plans incl. asset ceiling | -2,950 | 2,616 | -2,453 | 970 | ||||||||||||
Revaluation of borrowings due to change in credit risk | 433 | — | 207 | — | ||||||||||||
Tax on items that will not be reclassified to profit or loss | 555 | -764 | 285 | -547 | ||||||||||||
Items that may be reclassified to profit or loss | ||||||||||||||||
Available-for-sale financial assets | ||||||||||||||||
Gains/losses arising during the period | — | -10 | — | 68 | ||||||||||||
Reclassification adjustments on gains/losses included in profit or loss | — | — | — | 5 | ||||||||||||
Revaluation of other investments in shares and participations | ||||||||||||||||
Fair value remeasurement | — | 102 | — | 99 | ||||||||||||
Changes in cumulative translation adjustments | 243 | 1,145 | 2,047 | -3,378 | ||||||||||||
Share of other comprehensive income on JV and associated companies | -1 | 7 | 14 | — | ||||||||||||
Tax on items that may be reclassified to profit or loss | — | 1 | — | -16 | ||||||||||||
|
|
|
|
|
|
|
| |||||||||
Total other comprehensive income (loss), net of tax | -1,720 | 3,097 | 100 | -2,799 | ||||||||||||
|
|
|
|
|
|
|
| |||||||||
Total comprehensive income (loss) | -8,217 | -15,396 | -6,176 | -35,232 | ||||||||||||
|
|
|
|
|
|
|
| |||||||||
Total comprehensive income (loss) attributable to: | ||||||||||||||||
Stockholders of the Parent Company | -8,277 | -15,418 | -6,470 | -35,357 | ||||||||||||
Non-controlling interest | 60 | 22 | 294 | 125 | ||||||||||||
| 24 Ericsson | Fourth Quarter and Full-Year Report 2018 | Financial statements | |
SEK million | Dec 31 2018 | Sep 30 2018 | Dec 31 2017 | |||||||||
ASSETS | ||||||||||||
Non-current assets | ||||||||||||
Intangible assets | ||||||||||||
Capitalized development expenses | 4,237 | 4,918 | 4,593 | |||||||||
Goodwill | 30,035 | 30,514 | 27,815 | |||||||||
Intellectual property rights, brands and other intangible assets | 3,474 | 3,493 | 4,148 | |||||||||
Property, plant and equipment | 12,849 | 12,810 | 12,857 | |||||||||
Financial assets | ||||||||||||
Equity in JV and associated companies | 611 | 625 | 624 | |||||||||
Other investments in shares and participations | 1,515 | 1,572 | 1,279 | |||||||||
Customer finance,non-current | 1,180 | 780 | 2,178 | |||||||||
Interest-bearing securities,non-current | 23,982 | 23,014 | 25,105 | |||||||||
Other financial assets,non-current | 6,559 | 6,254 | 5,897 | |||||||||
Deferred tax assets | 23,152 | 24,648 | 21,963 | |||||||||
|
|
|
|
|
| |||||||
| 107,594 | 108,628 | 106,459 | ||||||||||
|
|
|
|
|
| |||||||
Current assets | ||||||||||||
Inventories | 29,255 | 30,635 | 25,547 | |||||||||
Contract assets | 13,178 | 14,794 | 13,120 | |||||||||
Trade receivables | 51,172 | 41,456 | 48,105 | |||||||||
Customer finance, current | 1,704 | 1,240 | 1,753 | |||||||||
Other current receivables | 20,844 | 25,446 | 22,301 | |||||||||
Interest-bearing securities, current | 6,625 | 6,591 | 6,713 | |||||||||
Cash and cash equivalents | 38,389 | 36,058 | 35,884 | |||||||||
|
|
|
|
|
| |||||||
| 161,167 | 156,220 | 153,423 | ||||||||||
|
|
|
|
|
| |||||||
Total assets | 268,761 | 264,848 | 259,882 | |||||||||
|
|
|
|
|
| |||||||
EQUITY AND LIABILITIES | ||||||||||||
Equity | ||||||||||||
Stockholders’ equity | 86,978 | 95,087 | 96,935 | |||||||||
Non-controlling interest in equity of subsidiaries | 792 | 866 | 636 | |||||||||
|
|
|
|
|
| |||||||
| 87,770 | 95,953 | 97,571 | ||||||||||
|
|
|
|
|
| |||||||
Non-current liabilities | ||||||||||||
Post-employment benefits | 28,720 | 25,475 | 25,009 | |||||||||
Provisions,non-current | 5,471 | 3,420 | 3,596 | |||||||||
Deferred tax liabilities | 670 | 1,274 | 901 | |||||||||
Borrowings,non-current | 30,870 | 31,187 | 30,500 | |||||||||
Othernon-current liabilities | 4,346 | 4,456 | 2,776 | |||||||||
|
|
|
|
|
| |||||||
| 70,077 | 65,812 | 62,782 | ||||||||||
|
|
|
|
|
| |||||||
Current liabilities | ||||||||||||
Provisions, current | 10,537 | 5,275 | 6,283 | |||||||||
Borrowings, current | 2,255 | 2,463 | 2,545 | |||||||||
Contract liabilities | 29,348 | 30,108 | 29,076 | |||||||||
Trade payables | 29,883 | 28,914 | 26,320 | |||||||||
Other current liabilities | 38,891 | 36,323 | 35,305 | |||||||||
|
|
|
|
|
| |||||||
| 110,914 | 103,083 | 99,529 | ||||||||||
|
|
|
|
|
| |||||||
Total equity and liabilities | 268,761 | 264,848 | 259,882 | |||||||||
|
|
|
|
|
| |||||||
Of which interest-bearing liabilities | 33,125 | 33,650 | 33,045 | |||||||||
Assets pledged as collateral | 5,681 | 5,768 | 5,215 | |||||||||
Contingent liabilities1) | 1,638 | 1,490 | 1,561 | |||||||||
| 1) | Contingent liabilities does not include any amounts related to investigation by the SEC and the DOJ about Ericsson’s compliance with the U.S Foreign Corrupt Practices Act (FCPA). For information about the investigation by the SEC and the DOJ, please refer to “Other information” on page 18 of this report. |
| 25 Ericsson | Fourth Quarter and Full-Year Report 2018 | Financial statements | |
Consolidated statement of cash flows
| Oct-Dec | Jan-Dec | |||||||||||||||
SEK million | 2018 | 2017 | 2018 | 2017 | ||||||||||||
Operating activities | ||||||||||||||||
Net income (loss) | -6,497 | -18,493 | -6,276 | -32,433 | ||||||||||||
Adjustments to reconcile net income to cash | ||||||||||||||||
Taxes | 3,590 | -1,803 | -1,897 | -9,064 | ||||||||||||
Earnings/dividends in JV and associated companies | -36 | -2 | -23 | 56 | ||||||||||||
Depreciation, amortization and impairment losses | 2,469 | 16,118 | 8,318 | 27,892 | ||||||||||||
Other | 376 | 179 | 1,432 | 440 | ||||||||||||
|
|
|
|
|
|
|
| |||||||||
Net income reconciled to cash | -98 | -4,001 | 1,554 | -13,109 | ||||||||||||
|
|
|
|
|
|
|
| |||||||||
Changes in operating net assets | ||||||||||||||||
Inventories | 1,689 | 8,356 | -4,807 | 4,719 | ||||||||||||
Customer finance, current andnon-current | -863 | 36 | 1,085 | 798 | ||||||||||||
Trade receivables and contract assets | -7,521 | -2,246 | -2,047 | 1,379 | ||||||||||||
Trade payables | 829 | 2,565 | 2,436 | 1,886 | ||||||||||||
Provisions and post-employment benefits | 7,330 | 412 | 6,696 | 4,755 | ||||||||||||
Contract liabilities | -1,112 | 2,700 | -808 | 5,024 | ||||||||||||
Other operating assets and liabilities, net | 4,033 | 3,337 | 5,233 | 4,149 | ||||||||||||
|
|
|
|
|
|
|
| |||||||||
| 4,385 | 15,160 | 7,788 | 22,710 | |||||||||||||
|
|
|
|
|
|
|
| |||||||||
Cash flow from operating activities | 4,287 | 11,159 | 9,342 | 9,601 | ||||||||||||
Investing activities | ||||||||||||||||
Investments in property, plant and equipment | -1,080 | -1,105 | -3,975 | -3,877 | ||||||||||||
Sales of property, plant and equipment | 57 | 898 | 334 | 1,016 | ||||||||||||
Acquisitions/divestments of subsidiaries and other operations, net | 20 | -107 | -1,285 | 276 | ||||||||||||
Product development | -195 | -138 | -925 | -1,444 | ||||||||||||
Other investing activities | -96 | -573 | -523 | -463 | ||||||||||||
Interest-bearing securities | -910 | -2,772 | 2,242 | -11,578 | ||||||||||||
|
|
|
|
|
|
|
| |||||||||
Cash flow from investing activities | -2,204 | -3,797 | -4,132 | -16,070 | ||||||||||||
|
|
|
|
|
|
|
| |||||||||
Cash flow before financing activities | 2,083 | 7,362 | 5,210 | -6,469 | ||||||||||||
Financing activities | ||||||||||||||||
Dividends paid | -134 | -1 | -3,425 | -3,424 | ||||||||||||
Other financing activities | -429 | 2,073 | -652 | 8,902 | ||||||||||||
|
|
|
|
|
|
|
| |||||||||
Cash flow from financing activities | -563 | 2,072 | -4,077 | 5,478 | ||||||||||||
|
|
|
|
|
|
|
| |||||||||
Effect of exchange rate changes on cash | 811 | 240 | 1,372 | -91 | ||||||||||||
Net change in cash and cash equivalents | 2,331 | 9,674 | 2,505 | -1,082 | ||||||||||||
Cash and cash equivalents, beginning of period | 36,058 | 26,210 | 35,884 | 36,966 | ||||||||||||
|
|
|
|
|
|
|
| |||||||||
Cash and cash equivalents, end of period | 38,389 | 35,884 | 38,389 | 35,884 | ||||||||||||
|
|
|
|
|
|
|
| |||||||||
| 26 Ericsson | Fourth Quarter and Full-Year Report 2018 | Financial statements | |
Consolidated statement of changes in equity
| Jan-Dec | ||||||||
SEK million | 2018 | 2017 | ||||||
Opening balance1) | 97,571 | 135,257 | ||||||
Opening balance adjustment due to IFRS 9 | -983 | — | ||||||
|
|
|
| |||||
Adjusted opening balance | 96,588 | 135,257 | ||||||
|
|
|
| |||||
Total comprehensive income (loss) | -6,176 | -35,232 | ||||||
Sale/repurchase of own shares | 107 | -5 | ||||||
Stock issue (net) | — | 15 | ||||||
Long-term variable compensation plans | 677 | 885 | ||||||
Dividends paid | -3,425 | -3,424 | ||||||
Transactions withnon-controlling interests | -1 | 75 | ||||||
|
|
|
| |||||
Closing balance | 87,770 | 97,571 | ||||||
|
|
|
| |||||
| 1) | The opening balance adjustment for IFRS 15 on initial application date (January 1, 2016) was SEK -4,353 million. Opening balances of 2017 and 2018 have been restated for IFRS 15. |
Consolidated income statement - isolated quarters
| 2018 | 2017 | |||||||||||||||||||||||||||||||
Isolated quarters, SEK million | Q4 | Q3 | Q2 | Q1 | Q4 | Q3 | Q2 | Q1 | ||||||||||||||||||||||||
Net sales | 63,809 | 53,810 | 49,808 | 43,411 | 57,881 | 49,413 | 50,281 | 47,803 | ||||||||||||||||||||||||
Cost of sales | -47,430 | -34,180 | -32,475 | -28,553 | -45,365 | -36,132 | -35,652 | -40,302 | ||||||||||||||||||||||||
|
|
|
|
|
|
|
|
|
|
|
|
|
|
|
| |||||||||||||||||
Gross income | 16,379 | 19,630 | 17,333 | 14,858 | 12,516 | 13,281 | 14,629 | 7,501 | ||||||||||||||||||||||||
|
|
|
|
|
|
|
|
|
|
|
|
|
|
|
| |||||||||||||||||
Gross margin (%) | 25.7 | % | 36.5 | % | 34.8 | % | 34.2 | % | 21.6 | % | 26.9 | % | 29.1 | % | 15.7 | % | ||||||||||||||||
Research and development expenses | -10,665 | -9,388 | -9,783 | -9,073 | -9,938 | -10,519 | -8,364 | -9,066 | ||||||||||||||||||||||||
Selling and administrative expenses | -7,685 | -6,625 | -7,053 | -6,156 | -8,245 | -5,741 | -6,818 | -8,223 | ||||||||||||||||||||||||
Impairment losses on trade receivables1) | 386 | -409 | -369 | -28 | -680 | -1,094 | -235 | -1,640 | ||||||||||||||||||||||||
|
|
|
|
|
|
|
|
|
|
|
|
|
|
|
| |||||||||||||||||
Operating expenses | -17,964 | -16,422 | -17,205 | -15,257 | -18,863 | -17,354 | -15,417 | -18,929 | ||||||||||||||||||||||||
|
|
|
|
|
|
|
|
|
|
|
|
|
|
|
| |||||||||||||||||
Other operating income and expenses | -294 | 31 | 11 | 84 | -12,926 | 2) | 415 | 239 | 141 | |||||||||||||||||||||||
Shares in earnings of JV and associated companies | 27 | 2 | 26 | 3 | -5 | 6 | 12 | 11 | ||||||||||||||||||||||||
|
|
|
|
|
|
|
|
|
|
|
|
|
|
|
| |||||||||||||||||
Operating income (loss) | -1,852 | 3,241 | 165 | -312 | -19,278 | -3,652 | -537 | -11,276 | ||||||||||||||||||||||||
|
|
|
|
|
|
|
|
|
|
|
|
|
|
|
| |||||||||||||||||
Financial income | -294 | -225 | 275 | -72 | -124 | -139 | -27 | -82 | ||||||||||||||||||||||||
Financial expenses | -421 | -414 | -1,085 | -469 | -394 | -182 | 83 | -350 | ||||||||||||||||||||||||
|
|
|
|
|
|
|
|
|
|
|
|
|
|
|
| |||||||||||||||||
Income after financial items | -2,567 | 2,602 | -645 | -853 | -19,796 | -3,973 | -481 | -11,708 | ||||||||||||||||||||||||
|
|
|
|
|
|
|
|
|
|
|
|
|
|
|
| |||||||||||||||||
Taxes | -3,930 | 146 | -1,157 | 128 | 1,303 | 516 | 24 | 1,682 | ||||||||||||||||||||||||
|
|
|
|
|
|
|
|
|
|
|
|
|
|
|
| |||||||||||||||||
Net income (loss) | -6,497 | 2,748 | -1,802 | -725 | -18,493 | -3,457 | -457 | -10,026 | ||||||||||||||||||||||||
|
|
|
|
|
|
|
|
|
|
|
|
|
|
|
| |||||||||||||||||
Net income (loss) attributable to: | ||||||||||||||||||||||||||||||||
Stockholders of the Parent Company | -6,553 | 2,745 | -1,885 | -837 | -18,476 | -3,561 | -471 | -10,068 | ||||||||||||||||||||||||
Non-controlling interests | 56 | 3 | 83 | 112 | -17 | 104 | 14 | 42 | ||||||||||||||||||||||||
Other information | ||||||||||||||||||||||||||||||||
Average number of shares, basic (million) | 3,296 | 3,293 | 3,290 | 3,286 | 3,283 | 3,279 | 3,275 | 3,272 | ||||||||||||||||||||||||
Earnings (loss) per share, basic (SEK)3) | -1.99 | 0.84 | -0.58 | -0.25 | -5.63 | -1.09 | -0.14 | -3.08 | ||||||||||||||||||||||||
Earnings (loss) per share, diluted (SEK)4) | -1.99 | 0.83 | -0.58 | -0.25 | -5.63 | -1.09 | -0.14 | -3.08 | ||||||||||||||||||||||||
| 1) | Impairment of trade receivables has been calculated according to IFRS 9 in 2018 and according to IAS 39 in 2017. Previously, these losses have been reported as selling and administrative expenses. |
| 2) | Includes write-down of goodwill of SEK -13.0 billion. |
| 3) | Based on net income (loss) attributable to stockholders of the Parent Company. |
| 4) | Potential ordinary shares are not considered when their conversion to ordinary shares would increase earnings per share. |
| 27 Ericsson | Fourth Quarter and Full-Year Report 2018 | Financial statements | |
Consolidated statement of cash flows - isolated quarters
| 2018 | 2017 | |||||||||||||||||||||||||||||||
Isolated quarters, SEK million | Q4 | Q3 | Q2 | Q1 | Q4 | Q3 | Q2 | Q1 | ||||||||||||||||||||||||
Operating activities | ||||||||||||||||||||||||||||||||
Net income (loss) | -6,497 | 2,748 | -1,802 | -725 | -18,493 | -3,457 | -457 | -10,026 | ||||||||||||||||||||||||
Adjustments to reconcile net income to cash | ||||||||||||||||||||||||||||||||
Taxes | 3,590 | -2,101 | -1,071 | -2,315 | -1,803 | -1,323 | -1,826 | -4,112 | ||||||||||||||||||||||||
Earnings/dividends in JV and associated companies | -36 | 28 | -19 | 4 | -2 | 73 | -8 | -7 | ||||||||||||||||||||||||
Depreciation, amortization and impairment losses | 2,469 | 1,893 | 2,065 | 1,891 | 16,118 | 4,146 | 2,197 | 5,431 | ||||||||||||||||||||||||
Other | 376 | 348 | 568 | 140 | 179 | -218 | -48 | 527 | ||||||||||||||||||||||||
|
|
|
|
|
|
|
|
|
|
|
|
|
|
|
| |||||||||||||||||
Net income reconciled to cash | -98 | 2,916 | -259 | -1,005 | -4,001 | -779 | -142 | -8,187 | ||||||||||||||||||||||||
|
|
|
|
|
|
|
|
|
|
|
|
|
|
|
| |||||||||||||||||
Changes in operating net assets | ||||||||||||||||||||||||||||||||
Inventories | 1,689 | -1,773 | -1,910 | -2,813 | 8,356 | 1,061 | -1,492 | -3,206 | ||||||||||||||||||||||||
Customer finance, current andnon-current | -863 | 1,001 | 547 | 400 | 36 | 456 | 1,140 | -834 | ||||||||||||||||||||||||
Trade receivables and contract assets | -7,521 | -3,503 | 1,661 | 7,316 | -2,246 | 623 | 184 | 2,818 | ||||||||||||||||||||||||
Trade payables | 829 | 953 | 1,252 | -598 | 2,565 | -1,061 | 19 | 363 | ||||||||||||||||||||||||
Provisions and post-employment benefits | 7,330 | -265 | 478 | -847 | 412 | -608 | 315 | 4,636 | ||||||||||||||||||||||||
Contract liabilities | -1,112 | -220 | -233 | 757 | 2,700 | -1,910 | -573 | 4,807 | ||||||||||||||||||||||||
Other operating assets and liabilities, net | 4,033 | 2,931 | -94 | -1,637 | 3,337 | 2,200 | 550 | -1,938 | ||||||||||||||||||||||||
|
|
|
|
|
|
|
|
|
|
|
|
|
|
|
| |||||||||||||||||
| 4,385 | -876 | 1,701 | 2,578 | 15,160 | 761 | 143 | 6,646 | |||||||||||||||||||||||||
|
|
|
|
|
|
|
|
|
|
|
|
|
|
|
| |||||||||||||||||
Cash flow from operating activities | 4,287 | 2,040 | 1,442 | 1,573 | 11,159 | -18 | 1 | -1,541 | ||||||||||||||||||||||||
|
|
|
|
|
|
|
|
|
|
|
|
|
|
|
| |||||||||||||||||
Investing activities | ||||||||||||||||||||||||||||||||
Investments in property, plant and equipment | -1,080 | -1,088 | -951 | -856 | -1,105 | -739 | -1,018 | -1,015 | ||||||||||||||||||||||||
Sales of property, plant and equipment | 57 | 102 | 52 | 123 | 898 | 12 | 37 | 69 | ||||||||||||||||||||||||
Acquisitions/divestments of subsidiaries and other operations, net | 20 | -425 | -431 | -449 | -107 | 371 | 9 | 3 | ||||||||||||||||||||||||
Product development | -195 | -151 | -325 | -254 | -138 | -126 | -315 | -865 | ||||||||||||||||||||||||
Other investing activities | -96 | -190 | -398 | 161 | -573 | 42 | -42 | 110 | ||||||||||||||||||||||||
Interest-bearing securities | -910 | 30 | 3,656 | -534 | -2,772 | 3,756 | -676 | -11,886 | ||||||||||||||||||||||||
|
|
|
|
|
|
|
|
|
|
|
|
|
|
|
| |||||||||||||||||
Cash flow from investing activities | -2,204 | -1,722 | 1,603 | -1,809 | -3,797 | 3,316 | -2,005 | -13,584 | ||||||||||||||||||||||||
|
|
|
|
|
|
|
|
|
|
|
|
|
|
|
| |||||||||||||||||
Cash flow before financing activities | 2,083 | 318 | 3,045 | -236 | 7,362 | 3,298 | -2,004 | -15,125 | ||||||||||||||||||||||||
|
|
|
|
|
|
|
|
|
|
|
|
|
|
|
| |||||||||||||||||
Financing activities | ||||||||||||||||||||||||||||||||
Dividends paid | -134 | -2 | -3,289 | — | -1 | -145 | -3,274 | -4 | ||||||||||||||||||||||||
Other financing activities | -429 | 254 | -383 | -94 | 2,073 | 1,563 | -5,636 | 10,902 | ||||||||||||||||||||||||
|
|
|
|
|
|
|
|
|
|
|
|
|
|
|
| |||||||||||||||||
Cash flow from financing activities | -563 | 252 | -3,672 | -94 | 2,072 | 1,418 | -8,910 | 10,898 | ||||||||||||||||||||||||
|
|
|
|
|
|
|
|
|
|
|
|
|
|
|
| |||||||||||||||||
Effect of exchange rate changes on cash | 811 | -1,562 | 980 | 1,143 | 240 | 48 | -594 | 215 | ||||||||||||||||||||||||
Net change in cash and cash equivalents | 2,331 | -992 | 353 | 813 | 9,674 | 4,764 | -11,508 | -4,012 | ||||||||||||||||||||||||
|
|
|
|
|
|
|
|
|
|
|
|
|
|
|
| |||||||||||||||||
Cash and cash equivalents, beginning of period | 36,058 | 37,050 | 36,697 | 35,884 | 26,210 | 21,446 | 32,954 | 36,966 | ||||||||||||||||||||||||
|
|
|
|
|
|
|
|
|
|
|
|
|
|
|
| |||||||||||||||||
Cash and cash equivalents, end of period | 38,389 | 36,058 | 37,050 | 36,697 | 35,884 | 26,210 | 21,446 | 32,954 | ||||||||||||||||||||||||
|
|
|
|
|
|
|
|
|
|
|
|
|
|
|
| |||||||||||||||||
| 28 Ericsson | Fourth Quarter and Full-Year Report 2018 | Financial statements | |
Parent Company income statement
| Oct-Dec | Jan-Dec | |||||||||||||||
SEK million | 2018 | 2017 | 2018 | 2017 | ||||||||||||
Net sales | — | — | — | — | ||||||||||||
Cost of sales | — | — | — | — | ||||||||||||
Gross income | — | — | — | — | ||||||||||||
Operating expenses | -301 | -434 | -1,686 | -1,294 | ||||||||||||
Other operating income and expenses | 958 | -131 | 2,111 | 1,616 | ||||||||||||
|
|
|
|
|
|
|
| |||||||||
Operating income | 657 | -565 | 425 | 322 | ||||||||||||
|
|
|
|
|
|
|
| |||||||||
Financial net | 1,853 | -4,050 | 5,340 | -2,297 | ||||||||||||
|
|
|
|
|
|
|
| |||||||||
Income after financial items | 2,510 | -4,615 | 5,765 | -1,975 | ||||||||||||
|
|
|
|
|
|
|
| |||||||||
Transfers to (-) / from untaxed reserves | -1,535 | -120 | -1,535 | -120 | ||||||||||||
Taxes | 220 | 95 | -36 | -53 | ||||||||||||
|
|
|
|
|
|
|
| |||||||||
Net income (loss) | 1,195 | -4,640 | 4,194 | -2,148 | ||||||||||||
|
|
|
|
|
|
|
| |||||||||
Parent company statement of comprehensive income (loss)
| Oct-Dec | Jan-Dec | |||||||||||||||
SEK million | 2018 | 2017 | 2018 | 2017 | ||||||||||||
Net income (loss) | 1,195 | -4,640 | 4,194 | -2,148 | ||||||||||||
Revaluation of borrowings due to change in credit risk | -251 | — | 91 | — | ||||||||||||
Tax on items that will not be reclassified to profit or loss | 56 | — | -19 | — | ||||||||||||
Available-for-sale financial assets | ||||||||||||||||
Gains/losses arising during the period | — | -10 | — | 68 | ||||||||||||
Reclassification adjustments on gains/losses included in profit or loss | — | — | — | 5 | ||||||||||||
Revaluation of other investments in shares and participations | ||||||||||||||||
Fair value remeasurement | — | 102 | — | 102 | ||||||||||||
Tax on items that may be reclassified to profit or loss | — | 4 | — | -14 | ||||||||||||
|
|
|
|
|
|
|
| |||||||||
Total other comprehensive income, net of tax | -195 | 96 | 72 | 161 | ||||||||||||
|
|
|
|
|
|
|
| |||||||||
Total comprehensive income (loss) | 1,000 | -4,544 | 4,266 | -1,987 | ||||||||||||
|
|
|
|
|
|
|
| |||||||||
| 29 Ericsson | Fourth Quarter and Full-Year Report 2018 | Financial statements | |
| Dec 31 | Dec 31 | |||||||
SEK million | 2018 | 2017 | ||||||
ASSETS | ||||||||
Fixed assets | ||||||||
Intangible assets | 139 | 329 | ||||||
Tangible assets | 259 | 346 | ||||||
Financial assets1)2) | 109,177 | 119,896 | ||||||
|
|
|
| |||||
| 109,575 | 120,571 | |||||||
|
|
|
| |||||
Current assets | ||||||||
Inventories | — | 1 | ||||||
Receivables2) | 38,760 | 41,173 | ||||||
Short-term investments | 6,268 | 6,446 | ||||||
Cash and cash equivalents | 27,850 | 18,715 | ||||||
|
|
|
| |||||
| 72,878 | 66,335 | |||||||
|
|
|
| |||||
Total assets | 182,453 | 186,906 | ||||||
|
|
|
| |||||
STOCKHOLDERS’ EQUITY, PROVISIONS AND LIABILITIES | ||||||||
Equity | ||||||||
Restricted equity | 48,164 | 48,164 | ||||||
Non-restricted equity2) | 40,752 | 39,578 | ||||||
|
|
|
| |||||
| 88,916 | 87,742 | |||||||
|
|
|
| |||||
Provisions | 86 | 602 | ||||||
Non-current liabilities2) | 62,581 | 60,623 | ||||||
Current liabilities | 30,870 | 37,939 | ||||||
|
|
|
| |||||
Total stockholders’ equity, provisions and liabilities | 182,453 | 186,906 | ||||||
|
|
|
| |||||
1) Of which interest-bearing securities,non-current | 23,982 | 25,105 | ||||||
|
|
|
| |||||
2) The following 2018 opening balances have been adjusted due to IFRS 9: financial assets increased by SEK 8 million, receivables decreased by SEK -4 million,non-restricted equity decreased by SEK -28 million, andnon-current liabilities increased by SEK 31 million. |
| |||||||
| 30 Ericsson | Fourth Quarter and Full-Year Report 2018 | Financial statements | |
The group
This interim report is prepared in accordance with IAS 34. The term “IFRS” used in this document refers to the application of IAS and IFRS as well as interpretations of these standards as issued by IASB’s Standards Interpretation Committee (SIC) and IFRS Interpretations Committee (IFRIC). The accounting policies adopted are consistent with those of the annual report for the year ended December 31, 2017 and should be read in conjunction with that annual report, with exception for the accounting policies described below.
New standards as from January 1, 2018
Two new IFRS standards are effective as from January 1, 2018, IFRS 9 “Financial instruments” and IFRS 15 “Revenue from Customer Contracts”.
Presentation in the financial statements
For IFRS 15 the Company has adopted the full retrospective method for transition, which mean that prior year comparatives have been restated and equity has been adjusted at the initial application date (January 1, 2016). The Company has applied IFRS 9 retrospectively on the required effective date, January 1, 2018. The 2018 opening balances have been adjusted, but the previous periods have not been restated.
Based on the new requirements under IFRS 15, contract assets and contract liabilities have been added as new lines in the consolidated balance sheet and statement of cash flow. Previously, contract assets were reported as trade receivables and contract liabilities were reported as deferred revenue and as advances from customers within other current liabilities. Due to IFRS 9, impairment losses on trade receivables are reported on a separate line in the consolidated income statement. Previously, these losses have been reported as Selling and administrative expenses. In the statement of comprehensive income, a new line has been added for revaluation of borrowings due to changes in credit risk. A new line has been added to the consolidated statement of equity showing the adjustment to the opening balance.
The prior periods financial statements and key ratios presented in this quarterly report have been restated to reflect adoption of these new standards.
Accounting policy - IFRS 9 “Financial instruments”
Financial assets
The Company classifies its financial assets in the following categories: at amortized cost, at fair value through other comprehensive income (FVOCI), and at fair value through profit or loss (FVTPL). The classification depends on the characteristics of the asset and the business model in which it is held.
Financial assets at amortized cost
Financial assets are classified as amortized cost if the contractual terms give rise to payments that are solely payments of principal and interest on the principal amount outstanding and the financial asset is held in a business model whose objective is to hold financial assets in order to collect contractual cash flows. These assets are subsequently measured at amortized cost using the effective interest method, minus impairment allowances.
Financial assets at fair value through other comprehensive income (FVOCI)
Assets are classified as FVOCI if the contractual terms give rise to payments that are solely payments of principal and interest on the principal amount outstanding and the financial asset is held in a business model whose objective is achieved by both collecting contractual cash flows and selling financial assets. These assets are subsequently measured at fair value with changes in fair value recognized in other comprehensive income (OCI), except for effective interest, impairment gains and losses and foreign exchange gains and losses recognized in the income statement. Upon derecognition, the cumulative gain or loss in OCI is reclassified to the income statement.
Financial assets at fair value through profit or loss (FVTPL)
All financial assets that are not classified as either amortized cost or FVOCI are classified as FVTPL. A financial asset is classified as held for trading if it is acquired principally for the purpose of selling in the near term. Derivatives are classified as held for trading, unless they are designated as hedging instruments for the purpose of hedge accounting. Assets held for trading are classified as current assets. Debt instruments classified as FVTPL, but not held for trading, are classified on the balance sheet based on their maturity date (i.e. those with a maturity longer than one year are classified asnon-current). Investments in shares and participations are classified as FVTPL and classified asnon-current financial assets.
Gains or losses arising from changes in the fair values of the “Financial assets at fair value through profit or loss” category (excluding derivatives and customer financing) are presented in the income statement within Financial income in the period in which they arise. Gains and losses on derivatives are presented in the income statement either as Cost of sales, Other operating income, Financial income or Financial expense, depending on the intent with the transaction. Gains and losses on customer financing are presented in the income statement as Selling expenses.
Impairment in relation to financial assets
At each balance sheet date, financial assets classified as either amortized cost or FVOCI and contract assets are assessed for impairment based on Expected Credit Losses (ECL). Allowances for trade receivables and contract assets are always equal to lifetime ECL. The loss is recognized in the income statement. When there is no reasonable expectation of collection, the asset is written off.
Borrowings
Borrowings by the Parent Company are designated FVTPL because they are managed and evaluated on a fair value basis. Changes in fair value are recognized in the income statement, except for changes in fair value due to change in credit risk which are recognized in Other comprehensive income.
| 31 Ericsson | Fourth Quarter and Full-Year Report 2018 | Additional information | |
Summary of changes to classification of financial assets and financial liabilities
Type of asset | IAS 39 classification | IFRS 9 classification | Reason for IFRS 9 classification | |||
| Cash equivalents, interest-bearing securities, and derivatives (held for trading) | FVTPL | FVTPL | Held for trading portfolios are classified as FVTPL (no change). | |||
| Cash equivalents (not held for trading) | Loans and receivables | Amortized cost | These assets are held to collect contractual cash flows. | |||
| Interest-bearing securities (not held for trading) | Available-for-sale | FVTPL | These assets are not held for trading but are managed and evaluated on a fair value basis. | |||
| Trade receivables | Loans and receivables | FVOCI | Trade receivables are managed in a business model whose objective is achieved through both collection of contractual cash flows and selling of assets. | |||
| Customer financing | Loans and receivables | FVTPL | Customer finance assets are managed in a business model with the objective to realize cash flows through the sale of assets. | |||
| Investments in shares and participations (equity instruments) | Available-for-sale | FVTPL | This is an accounting policy choice under IFRS 9. | |||
| Borrowings by parent company | Amortized cost | Designated FVTPL | These borrowings are managed and evaluated on a fair value basis. | |||
Fair value hedging and fair value hedge accounting
Fair value hedge accounting is no longer applied as of January 1, 2018.
Financial guarantees
Financial guarantee contracts are initially recognized at fair value (i.e., usually the fee received). Subsequently, these contracts are measured at the higher of:
| • | The expected credit losses. |
| • | The recognized contractual fee less cumulative amortization when amortized over the guarantee period, using the straight-line-method. |
Accounting policy - IFRS 15 “Revenue from Contracts with Customers”
IFRS 15, “Revenue from Contracts with Customers” establishes a new principle-based model of recognizing revenue from customer contracts. It introduces a five-step model that requires revenue to be recognized when control over goods and services are transferred to the customer.
The following paragraphs describes the types of contracts, when performance obligations are satisfied, and the timing of revenue recognition. They also describe the normal payment terms associated with such contracts and the resulting impact on the balance sheet over the duration of the contracts. The vast majority of Ericsson’s business is for the sale of standard products and services.
Standard products and services
Products and services are classified as standard solutions if they do not require significant installation and integration services to be delivered. Installation and integration services are generally completed within a short period of time, from the delivery of the related products. These products and services are viewed as separate distinct performance obligations. This type of customer contract is usually signed as a frame agreement and the customer issues individual purchase orders to commit to purchases of products and services over the duration of the agreement.
Revenue for standard products shall be recognized when control over the equipment is transferred to the customer at a point in time. This assessment shall be viewed from a customer’s perspective considering indicators such as transfer of titles and risks, customer acceptance, physical possession, and billing rights. For hardware sales, transfer of control is usually deemed to occur when the equipment arrives at the customer site and for software sales, when the licenses are made available to the customer. Contractual terms may vary, therefore judgment will be applied when assessing the indicators of transfer of control. Revenue for installation and integration services is recognized upon completion of the service.
Transaction prices under these contracts are mostly billed upon delivery of the hardware or software, and completion of installation services, although a proportion may be billed upon formal acceptance of the related installation services. This will result in a contract asset for the proportion of the transaction price that is not yet billed.
Revenue for recurring services such as customer support and managed services is recognized as the services are delivered, generallypro-rata over time. Transaction prices under these contracts are billed over time, often on a quarterly basis. Contract liabilities or receivables may arise depending on whether the quarterly billing is in advance or in arrears.
Contract for standard products and services applies to business in all segments.
Customized solution
Some products and services are sold together as part of a customized solution to the customer. This type of contract requires significant installation and integration services to be delivered within the solution, normally over a period of more than 1 year. These products and services are viewed together as a combined performance obligation. This type of contract is usually sold as a firm contract in which the scope of the solution and obligations of both parties are clearly defined for the duration of the contract.
| 32 Ericsson | Fourth Quarter and Full-Year Report 2018 | Additional information | |
Revenue for the combined performance obligation shall be recognized over time if progress of completion can be reliably measured and enforceable right to payment exists over the duration of the contract. The progress of completion is estimated by reference to the output delivered such as achievement of contract milestones and customer acceptance. This method is considered appropriate as it reflects the nature of the customized solution and how integration service is delivered in these projects. Formal acceptance term is considered a key indicator of transfer of control for a customized solution and shall therefore be obtained prior to recognizing revenue. If the criteria above are not met, then all revenue shall be recognized upon the completion of the customized solution, when final acceptance is provided by the customer.
Transaction price under these contracts are represented by progress payments or billing milestones as defined in the contracts. In most cases, revenue recognized is limited to the progress payments or unconditional billing milestones over the duration of the contract, therefore no contract asset or contract liability arises on these contracts. In some contracts, revenue may be recognized in advance of billing milestones if enforceable payment rights exist at all times over the contract duration. This will result in a contract asset balance until billing milestones are reached.
Contract for customized solution applies to the Business Support Systems (BSS) business within the segment Digital Services and the Media Solutions business within the segment Emerging Business and Other.
Intellectual Property Rights (IPR)
This type of contract relates to the patent and licensing business. The Company has assessed that the nature of its IPR contracts is such that they provide customers a license with the right to access Ericsson intellectual properties over time, therefore revenue shall be recognized over the duration of the contract. Royalty revenue based on sales or usage is recognized when the sales and usage occurs.
The transaction price on these contracts is usually structured as a royalty fee based on sales or usage over the period, measured on a quarterly basis. This results in a receivable balance if the billing is performed the following quarter after measurement. Some contracts include lump sum amounts, payable either up front at commencement or on an annual basis. This results in a contract liability balance if payment is in advance of revenue, as revenue is recognized over time.
As described in Note C3 “Segment Information” of the Annual Report 2017, revenue from IPR licensing contracts are allocated to the segments Networks and Digital Services.
Impact of IFRS 9 and IFRS 15 on balance sheet items
| As reported at 31.12 2017 | IFRS 15 restatement | Restated balance at 31.12.2017 | IFRS 9 adjustment | Adjusted balance at 1.1.2018 | ||||||||||||||||
ASSETS | ||||||||||||||||||||
Non-current assets | ||||||||||||||||||||
Deferred tax assets | 21,228 | 735 | 21,963 | 288 | 22,251 | |||||||||||||||
Current assets | ||||||||||||||||||||
Inventories | 24,960 | 587 | 25,547 | — | 25,547 | |||||||||||||||
Contract assets | — | 13,120 | 13,120 | — | 13,120 | |||||||||||||||
Trade receivables | 63,210 | -15,105 | 48,105 | -1,240 | 46,865 | |||||||||||||||
EQUITY AND LIABILITIES | ||||||||||||||||||||
Equity | ||||||||||||||||||||
Stockholder’s equity | 99,540 | -2,605 | 96,935 | -983 | 95,952 | |||||||||||||||
Non-current liabilities | ||||||||||||||||||||
Borrowings,non-current | 30,500 | — | 30,500 | 31 | 30,531 | |||||||||||||||
Current liabilities | ||||||||||||||||||||
Provisions | 6,350 | -67 | 6,283 | — | 6,283 | |||||||||||||||
Contract liabilities | — | 29,076 | 29,076 | — | 29,076 | |||||||||||||||
Other current liabilities | 62,370 | -27,065 | 35,305 | — | 35,305 | |||||||||||||||
IFRS 16 - Leases
In January 2016, IASB issued a new lease standard, IFRS 16, that will replace IAS 17 Leases and the related interpretations IFRIC 4,SIC-15 andSIC-27. The definition of a lease is amended which impacts the accounting both from a lessee and lessor perspective. The new standard includes more specific guidance on if and when leasing is embedded in a service contract.
Accounting for lessees
The standard requires assets and liabilities arising from all leases, with some exceptions, to be recognized on the balance sheet. This model reflects that, at the start of a lease, the lessee always obtains the right to use an asset for a period of time and has an obligation to
pay for that right. The main types of assets leased by the Company are, in the order of materiality, real estate,IT-equipment and vehicles. Vehicles are mainly used under service contracts.
Accounting for lessors
The accounting for lessors will be based on the same classification as of an operating or finance lease under IAS 17. This means that if the Company, as a lessor, substantially retains the ownership rights and obligations of the asset, then the lease is classified as an operating lease. On the contrary, the lease is classified as a finance lease if the ownership rights and obligations of the asset are transferred to the lessee.
| 33 Ericsson | Fourth Quarter and Full-Year Report 2018 | Additional information | |
Impact at transition
The standard is effective for annual periods beginning on or after January 1, 2019. The Company will apply the new standard as from January 1, 2019. At transition, the Company will apply the practical expedient under IFRS 16 to not reassess whether a contract is, or contains, a lease. Therefore, the Company will apply the standard to contracts previously identified as leases, or as containing a lease under IAS 17 and IFRIC 4.
The Company will elect to implement the standard using the cumulativecatch-up method, with the cumulative effect being adjusted to the opening retained earnings balance at transition date. There will be no restated information presented for previous years.
At transition, the Company, as a lessee, will recognize lease liabilities for leases previously classified as operating leases. The weighted average incremental borrowing rate to be applied to lease liabilities recognized in the balance sheet at the transition date is estimated to 5.4%.Right-of-use assets will for most contracts be recognized based on the amount equal to the related lease liability. For some larger real estate contractsright-of-use assets are recognized as if IFRS 16 had been applied since the commencement date, however, using the incremental borrowing rate as per the effective date. The asset value for these contracts is estimated to be SEK 0.3 billion lower than the related liabilities. It is this difference that causes the reduction of equity as per transition date.
The Company will also apply the following practical expedients when applying IFRS 16 at transition date:
| • | The IAS 37 onerous lease contract measurement for the operating leases existing as per the effective date. This expedient will be applied as a substitute for the measurement of impairment for the relatedright-of-use as assets. Impairment testing will be applied going-forward. |
| • | Exclusion of initial direct costs from the measurement of theright-to-use asset at the date of initial recognition. |
The Company does not expect material impact on lessor accounting at transition.
A new classification in the income statement will be made. Under IFRS 16, as a lessee, the finance cost is reported under finance costs while under operating leases they were embedded in the lease expenses, either as costs of sales or operating expenses.
The timing of the cash flows will not be impacted. The reported amortization of lease liabilities will, however, be reported as from effective date as financing cash flows and not operating cash flows as prior to 2019. The impact of this reclassification is in 2019 estimated to be SEK 2.0 billion.
Estimated opening balance sheet impact of IFRS 16 (discounted)
SEK billion | IFRS 16 adjustment | |||
Right of use assets | 9.1 | |||
Impairment provision reclassification | 0.8 | |||
Lease liabilities current | -2.2 | |||
Lease liabilitiesnon-current | -8.3 | |||
Equity | 0.3 | |||
Other reclassification of balance sheet accounts due to IFRS 16 | 0.3 | |||
The estimated increase ofright-of-use assets is SEK 9.1 billion presented in PP&E. This will increase the total asset value by 3%.
The previous impairment provisions for real estate have been reclassified asright-of-use asset allowances. There is no impact on the income statement.
Changes applied in Q1 2018
As of Q1 2018, sales related to 3PP routing business are reported in Networks (earlier Digital Services). Comparative periods have been restated to reflect this change. In Q1 2018, these sales were SEK 151 (160) million.
Changes applied in Q2 2018
As of Q2 2018, sales related to Application Development and Maintenance (ADM) and certain sales related to Business Support Solution (BSS) was moved between segments Managed Services and Digital Services, with increased sales in Managed Services and a corresponding sales decrease in Digital Services (net effect of SEK 1.9 b in 2017). The corresponding impact on 2017 gross income was SEK 0.2 b (positive for Managed Services, negative for Digital Services). Historical data has been restated to reflect the organizational change.
| 34 Ericsson | Fourth Quarter and Full-Year Report 2018 | Additional information | |
Net sales by segment by quarter
| 2018 | 2017 | |||||||||||||||||||||||||||||||
Isolated quarters, SEK million | Q4 | Q3 | Q2 | Q1 | Q4 | Q3 | Q2 | Q1 | ||||||||||||||||||||||||
Networks | 41,641 | 35,934 | 32,393 | 28,602 | 37,077 | 31,871 | 31,699 | 31,638 | ||||||||||||||||||||||||
Of which Products | 29,803 | 25,336 | 22,319 | 19,473 | 25,404 | 21,734 | 21,281 | 21,858 | ||||||||||||||||||||||||
Of which Services | 11,838 | 10,598 | 10,074 | 9,129 | 11,673 | 10,137 | 10,418 | 9,780 | ||||||||||||||||||||||||
Digital Services | 13,007 | 8,987 | 8,833 | 7,262 | 11,820 | 8,930 | 9,901 | 8,101 | ||||||||||||||||||||||||
Of which Products | 7,462 | 4,582 | 4,467 | 3,947 | 6,452 | 4,859 | 5,370 | 4,327 | ||||||||||||||||||||||||
Of which Services | 5,545 | 4,405 | 4,366 | 3,315 | 5,368 | 4,071 | 4,531 | 3,774 | ||||||||||||||||||||||||
Managed Services | 6,881 | 6,465 | 6,528 | 5,896 | 6,898 | 6,618 | 6,673 | 6,283 | ||||||||||||||||||||||||
Emerging Business and Other | 2,280 | 2,424 | 2,054 | 1,651 | 2,086 | 1,994 | 2,008 | 1,781 | ||||||||||||||||||||||||
|
|
|
|
|
|
|
|
|
|
|
|
|
|
|
| |||||||||||||||||
Total | 63,809 | 53,810 | 49,808 | 43,411 | 57,881 | 49,413 | 50,281 | 47,803 | ||||||||||||||||||||||||
|
|
|
|
|
|
|
|
|
|
|
|
|
|
|
| |||||||||||||||||
| 2018 | 2017 | |||||||||||||||||||||||||||||||
Sequential change, percent | Q4 | Q3 | Q2 | Q1 | Q4 | Q3 | Q2 | Q1 | ||||||||||||||||||||||||
Networks | 16 | % | 11 | % | 13 | % | -23 | % | 16 | % | 1 | % | 0 | % | — | |||||||||||||||||
Of which Products | 18 | % | 14 | % | 15 | % | -23 | % | 17 | % | 2 | % | -3 | % | — | |||||||||||||||||
Of which Services | 12 | % | 5 | % | 10 | % | -22 | % | 15 | % | -3 | % | 7 | % | — | |||||||||||||||||
Digital Services | 45 | % | 2 | % | 22 | % | -39 | % | 32 | % | -10 | % | 22 | % | — | |||||||||||||||||
Of which Products | 63 | % | 3 | % | 13 | % | -39 | % | 33 | % | -10 | % | 24 | % | — | |||||||||||||||||
Of which Services | 26 | % | 1 | % | 32 | % | -38 | % | 32 | % | -10 | % | 20 | % | — | |||||||||||||||||
Managed Services | 6 | % | -1 | % | 11 | % | -15 | % | 4 | % | -1 | % | 6 | % | — | |||||||||||||||||
Emerging Business and Other | -6 | % | 18 | % | 24 | % | -21 | % | 5 | % | -1 | % | 13 | % | — | |||||||||||||||||
|
|
|
|
|
|
|
|
|
|
|
|
|
|
|
| |||||||||||||||||
Total | 19 | % | 8 | % | 15 | % | -25 | % | 17 | % | -2 | % | 5 | % | — | |||||||||||||||||
|
|
|
|
|
|
|
|
|
|
|
|
|
|
|
| |||||||||||||||||
| 2018 | 2017 | |||||||||||||||||||||||||||||||
Year over year change, percent | Q4 | Q3 | Q2 | Q1 | Q4 | Q3 | Q2 | Q1 | ||||||||||||||||||||||||
Networks | 12 | % | 13 | % | 2 | % | -10 | % | — | — | — | — | ||||||||||||||||||||
Of which Products | 17 | % | 17 | % | 5 | % | -11 | % | — | — | — | — | ||||||||||||||||||||
Of which Services | 1 | % | 5 | % | -3 | % | -7 | % | — | — | — | — | ||||||||||||||||||||
Digital Services | 10 | % | 1 | % | -11 | % | -10 | % | — | — | — | — | ||||||||||||||||||||
Of which Products | 16 | % | -6 | % | -17 | % | -9 | % | — | — | — | — | ||||||||||||||||||||
Of which Services | 3 | % | 8 | % | -4 | % | -12 | % | — | — | — | — | ||||||||||||||||||||
Managed Services | 0 | % | -2 | % | -2 | % | -6 | % | — | — | — | — | ||||||||||||||||||||
Emerging Business and Other | 9 | % | 22 | % | 2 | % | -7 | % | — | — | — | — | ||||||||||||||||||||
|
|
|
|
|
|
|
|
|
|
|
|
|
|
|
| |||||||||||||||||
Total | 10 | % | 9 | % | -1 | % | -9 | % | — | — | — | — | ||||||||||||||||||||
|
|
|
|
|
|
|
|
|
|
|
|
|
|
|
| |||||||||||||||||
| 2018 | 2017 | |||||||||||||||||||||||||||||||
Year to date, SEK million | Jan-Dec | Jan-Sep | Jan-Jun | Jan-Mar | Jan-Dec | Jan-Sep | Jan-Jun | Jan-Mar | ||||||||||||||||||||||||
Networks | 138,570 | 96,929 | 60,995 | 28,602 | 132,285 | 95,208 | 63,337 | 31,638 | ||||||||||||||||||||||||
Of which Products | 96,931 | 67,128 | 41,792 | 19,473 | 90,277 | 64,873 | 43,139 | 21,858 | ||||||||||||||||||||||||
Of which Services | 41,639 | 29,801 | 19,203 | 9,129 | 42,008 | 30,335 | 20,198 | 9,780 | ||||||||||||||||||||||||
Digital Services | 38,089 | 25,082 | 16,095 | 7,262 | 38,752 | 26,932 | 18,002 | 8,101 | ||||||||||||||||||||||||
Of which Products | 20,458 | 12,996 | 8,414 | 3,947 | 21,008 | 14,556 | 9,697 | 4,327 | ||||||||||||||||||||||||
Of which Services | 17,631 | 12,086 | 7,681 | 3,315 | 17,744 | 12,376 | 8,305 | 3,774 | ||||||||||||||||||||||||
Managed Services | 25,770 | 18,889 | 12,424 | 5,896 | 26,472 | 19,574 | 12,956 | 6,283 | ||||||||||||||||||||||||
Emerging Business and Other | 8,409 | 6,129 | 3,705 | 1,651 | 7,869 | 5,783 | 3,789 | 1,781 | ||||||||||||||||||||||||
|
|
|
|
|
|
|
|
|
|
|
|
|
|
|
| |||||||||||||||||
Total | 210,838 | 147,029 | 93,219 | 43,411 | 205,378 | 147,497 | 98,084 | 47,803 | ||||||||||||||||||||||||
|
|
|
|
|
|
|
|
|
|
|
|
|
|
|
| |||||||||||||||||
| 2018 | 2017 | |||||||||||||||||||||||||||||||
Year over year change, percent | Jan-Dec | Jan-Sep | Jan-Jun | Jan-Mar | Jan-Dec | Jan-Sep | Jan-Jun | Jan-Mar | ||||||||||||||||||||||||
Networks | 5 | % | 2 | % | -4 | % | -10 | % | -6 | % | — | — | — | |||||||||||||||||||
Of which Products | 7 | % | 3 | % | -3 | % | -11 | % | -4 | % | — | — | — | |||||||||||||||||||
Of which Services | -1 | % | -2 | % | -5 | % | -7 | % | -8 | % | — | — | — | |||||||||||||||||||
Digital Services | -2 | % | -7 | % | -11 | % | -10 | % | -9 | % | — | — | — | |||||||||||||||||||
Of which Products | -3 | % | -11 | % | -13 | % | -9 | % | -10 | % | — | — | — | |||||||||||||||||||
Of which Services | -1 | % | -2 | % | -8 | % | -12 | % | -8 | % | — | — | — | |||||||||||||||||||
Managed Services | -3 | % | -3 | % | -4 | % | -6 | % | -8 | % | — | — | — | |||||||||||||||||||
Emerging Business and Other | 7 | % | 6 | % | -2 | % | -7 | % | -9 | % | — | — | — | |||||||||||||||||||
|
|
|
|
|
|
|
|
|
|
|
|
|
|
|
| |||||||||||||||||
Total | 3 | % | 0 | % | -5 | % | -9 | % | -7 | % | — | — | — | |||||||||||||||||||
|
|
|
|
|
|
|
|
|
|
|
|
|
|
|
| |||||||||||||||||
| 35 Ericsson | Fourth Quarter and Full-Year Report 2018 | Additional information | |
Sales growth adjusted for comparable units and currency*
| 2018 | 2017 | |||||||||||||||||||||||||||||||
Sequential change, percent | Q4 | Q3 | Q2 | Q1 | Q4 | Q3 | Q2 | Q1 | ||||||||||||||||||||||||
Networks | 16 | % | 9 | % | 7 | % | -22 | % | — | — | — | — | ||||||||||||||||||||
Digital Services | 45 | % | 0 | % | 16 | % | -38 | % | — | — | — | — | ||||||||||||||||||||
Managed Services | 7 | % | -1 | % | 6 | % | -11 | % | — | — | — | — | ||||||||||||||||||||
Emerging Business and Other | -6 | % | 15 | % | 18 | % | -20 | % | — | — | — | — | ||||||||||||||||||||
|
|
|
|
|
|
|
|
|
|
|
|
|
|
|
| |||||||||||||||||
Total | 19 | % | 7 | % | 9 | % | -24 | % | — | — | — | — | ||||||||||||||||||||
|
|
|
|
|
|
|
|
|
|
|
|
|
|
|
| |||||||||||||||||
| 2018 | 2017 | |||||||||||||||||||||||||||||||
Isolated quarter, year over year change, percent | Q4 | Q3 | Q2 | Q1 | Q4 | Q3 | Q2 | Q1 | ||||||||||||||||||||||||
Networks | 6 | % | 5 | % | 2 | % | -2 | % | — | — | — | — | ||||||||||||||||||||
Digital Services | 5 | % | -6 | % | -12 | % | -3 | % | — | — | — | — | ||||||||||||||||||||
Managed Services | -5 | % | -8 | % | -3 | % | -4 | % | — | — | — | — | ||||||||||||||||||||
Emerging Business and Other | 1 | % | 11 | % | 1 | % | -2 | % | — | — | — | — | ||||||||||||||||||||
|
|
|
|
|
|
|
|
|
|
|
|
|
|
|
| |||||||||||||||||
Total | 4 | % | 1 | % | -1 | % | -2 | % | — | — | — | — | ||||||||||||||||||||
|
|
|
|
|
|
|
|
|
|
|
|
|
|
|
| |||||||||||||||||
| 2018 | 2017 | |||||||||||||||||||||||||||||||
Year to date, year over year change, percent | Jan-Dec | Jan-Sep | Jan-Jun | Jan-Mar | Jan-Dec | Jan-Sep | Jan-Jun | Jan-Mar | ||||||||||||||||||||||||
Networks | 3 | % | 2 | % | 0 | % | -2 | % | — | — | — | — | ||||||||||||||||||||
Digital Services | -4 | % | -7 | % | -8 | % | -3 | % | — | — | — | — | ||||||||||||||||||||
Managed Services | -5 | % | -5 | % | -3 | % | -4 | % | — | — | — | — | ||||||||||||||||||||
Emerging Business and Other | 3 | % | 3 | % | -1 | % | -2 | % | — | — | — | — | ||||||||||||||||||||
|
|
|
|
|
|
|
|
|
|
|
|
|
|
|
| |||||||||||||||||
Total | 1 | % | -1 | % | -2 | % | -2 | % | — | — | — | — | ||||||||||||||||||||
|
|
|
|
|
|
|
|
|
|
|
|
|
|
|
| |||||||||||||||||
| * | Sales growth adjusted for comparable units and currency has not been restated for 2017. |
Gross income (loss) and gross margin by segment by quarter
| 2018 | 2017 | |||||||||||||||||||||||||||||||
Isolated quarters, SEK million | Q4 | Q3 | Q2 | Q1 | Q4 | Q3 | Q2 | Q1 | ||||||||||||||||||||||||
Networks | 16,626 | 14,835 | 12,565 | 11,127 | 11,849 | 10,654 | 10,894 | 10,031 | ||||||||||||||||||||||||
Digital Services | -1,240 | 3,208 | 3,458 | 2,892 | 1,113 | 2,620 | 3,289 | -2,324 | ||||||||||||||||||||||||
Managed Services | 781 | 805 | 809 | 491 | -691 | -360 | 19 | -542 | ||||||||||||||||||||||||
Emerging Business and Other | 212 | 782 | 501 | 348 | 245 | 367 | 427 | 336 | ||||||||||||||||||||||||
|
|
|
|
|
|
|
|
|
|
|
|
|
|
|
| |||||||||||||||||
Total | 16,379 | 19,630 | 17,333 | 14,858 | 12,516 | 13,281 | 14,629 | 7,501 | ||||||||||||||||||||||||
|
|
|
|
|
|
|
|
|
|
|
|
|
|
|
| |||||||||||||||||
| 2018 | 2017 | |||||||||||||||||||||||||||||||
Isolated quarters, As percentage of net sales | Q4 | Q3 | Q2 | Q1 | Q4 | Q3 | Q2 | Q1 | ||||||||||||||||||||||||
Networks | 39.9 | % | 41.3 | % | 38.8 | % | 38.9 | % | 32.0 | % | 33.4 | % | 34.4 | % | 31.7 | % | ||||||||||||||||
Digital Services | -9.5 | % | 35.7 | % | 39.1 | % | 39.8 | % | 9.4 | % | 29.3 | % | 33.2 | % | -28.7 | % | ||||||||||||||||
Managed Services | 11.4 | % | 12.5 | % | 12.4 | % | 8.3 | % | -10.0 | % | -5.4 | % | 0.3 | % | -8.6 | % | ||||||||||||||||
Emerging Business and Other | 9.3 | % | 32.3 | % | 24.4 | % | 21.1 | % | 11.7 | % | 18.4 | % | 21.3 | % | 18.9 | % | ||||||||||||||||
|
|
|
|
|
|
|
|
|
|
|
|
|
|
|
| |||||||||||||||||
Total | 25.7 | % | 36.5 | % | 34.8 | % | 34.2 | % | 21.6 | % | 26.9 | % | 29.1 | % | 15.7 | % | ||||||||||||||||
|
|
|
|
|
|
|
|
|
|
|
|
|
|
|
| |||||||||||||||||
| 2018 | 2017 | |||||||||||||||||||||||||||||||
Year to date, SEK million | Jan-Dec | Jan-Sep | Jan-Jun | Jan-Mar | Jan-Dec | Jan-Sep | Jan-Jun | Jan-Mar | ||||||||||||||||||||||||
Networks | 55,153 | 38,527 | 23,692 | 11,127 | 43,428 | 31,579 | 20,925 | 10,031 | ||||||||||||||||||||||||
Digital Services | 8,318 | 9,558 | 6,350 | 2,892 | 4,698 | 3,585 | 965 | -2,324 | ||||||||||||||||||||||||
Managed Services | 2,886 | 2,105 | 1,300 | 491 | -1,574 | -883 | -523 | -542 | ||||||||||||||||||||||||
Emerging Business and Other | 1,843 | 1,631 | 849 | 348 | 1,375 | 1,130 | 763 | 336 | ||||||||||||||||||||||||
|
|
|
|
|
|
|
|
|
|
|
|
|
|
|
| |||||||||||||||||
Total | 68,200 | 51,821 | 32,191 | 14,858 | 47,927 | 35,411 | 22,130 | 7,501 | ||||||||||||||||||||||||
|
|
|
|
|
|
|
|
|
|
|
|
|
|
|
| |||||||||||||||||
| 2018 | 2017 | |||||||||||||||||||||||||||||||
Year to date, As percentage of net sales | Jan-Dec | Jan-Sep | Jan-Jun | Jan-Mar | Jan-Dec | Jan-Sep | Jan-Jun | Jan-Mar | ||||||||||||||||||||||||
Networks | 39.8 | % | 39.7 | % | 38.8 | % | 38.9 | % | 32.8 | % | 33.2 | % | 33.0 | % | 31.7 | % | ||||||||||||||||
Digital Services | 21.8 | % | 38.1 | % | 39.5 | % | 39.8 | % | 12.1 | % | 13.3 | % | 5.4 | % | -28.7 | % | ||||||||||||||||
Managed Services | 11.2 | % | 11.1 | % | 10.5 | % | 8.3 | % | -5.9 | % | -4.5 | % | -4.0 | % | -8.6 | % | ||||||||||||||||
Emerging Business and Other | 21.9 | % | 26.6 | % | 22.9 | % | 21.1 | % | 17.5 | % | 19.5 | % | 20.1 | % | 18.9 | % | ||||||||||||||||
|
|
|
|
|
|
|
|
|
|
|
|
|
|
|
| |||||||||||||||||
Total | 32.3 | % | 35.2 | % | 34.5 | % | 34.2 | % | 23.3 | % | 24.0 | % | 22.6 | % | 15.7 | % | ||||||||||||||||
|
|
|
|
|
|
|
|
|
|
|
|
|
|
|
| |||||||||||||||||
| 36 Ericsson | Fourth Quarter and Full-Year Report 2018 | Additional information | |
Operating income (loss) and operating margin by segment by quarter
| 2018 | 2017 | |||||||||||||||||||||||||||||||
Isolated quarters, SEK million | Q4 | Q3 | Q2 | Q1 | Q4 | Q3 | Q2 | Q1 | ||||||||||||||||||||||||
Networks | 6,850 | 5,656 | 3,544 | 3,371 | 1,945 | 2,375 | 3,424 | 2,711 | ||||||||||||||||||||||||
Digital Services | -7,087 | -1,784 | -2,374 | -2,607 | -12,271 | -3,770 | -2,237 | -9,004 | ||||||||||||||||||||||||
Managed Services | 285 | 409 | 299 | 100 | -1,275 | -727 | -258 | -1,829 | ||||||||||||||||||||||||
Emerging Business and Other | -1,900 | -1,040 | -1,304 | -1,176 | -7,677 | -1,530 | -1,466 | -3,154 | ||||||||||||||||||||||||
|
|
|
|
|
|
|
|
|
|
|
|
|
|
|
| |||||||||||||||||
Total | -1,852 | 3,241 | 165 | -312 | -19,278 | -3,652 | -537 | -11,276 | ||||||||||||||||||||||||
|
|
|
|
|
|
|
|
|
|
|
|
|
|
|
| |||||||||||||||||
| 2018 | 2017 | |||||||||||||||||||||||||||||||
Isolated quarters, As percentage of net sales | Q4 | Q3 | Q2 | Q1 | Q4 | Q3 | Q2 | Q1 | ||||||||||||||||||||||||
Networks | 16.5 | % | 15.7 | % | 10.9 | % | 11.8 | % | 5.2 | % | 7.5 | % | 10.8 | % | 8.6 | % | ||||||||||||||||
Digital Services | -54.5 | % | -19.9 | % | -26.9 | % | -35.9 | % | -103.8 | % | -42.2 | % | -22.6 | % | -111.1 | % | ||||||||||||||||
Managed Services | 4.1 | % | 6.3 | % | 4.6 | % | 1.7 | % | -18.5 | % | -11.0 | % | -3.9 | % | -29.1 | % | ||||||||||||||||
Emerging Business and Other | -83.3 | % | -42.9 | % | -63.5 | % | -71.2 | % | -368.0 | % | -76.7 | % | -73.0 | % | -177.1 | % | ||||||||||||||||
|
|
|
|
|
|
|
|
|
|
|
|
|
|
|
| |||||||||||||||||
Total | -2.9 | % | 6.0 | % | 0.3 | % | -0.7 | % | -33.3 | % | -7.4 | % | -1.1 | % | -23.6 | % | ||||||||||||||||
|
|
|
|
|
|
|
|
|
|
|
|
|
|
|
| |||||||||||||||||
| 2018 | 2017 | |||||||||||||||||||||||||||||||
Year to date, SEK million | Jan-Dec | Jan-Sep | Jan-Jun | Jan-Mar | Jan-Dec | Jan-Sep | Jan-Jun | Jan-Mar | ||||||||||||||||||||||||
Networks | 19,421 | 12,571 | 6,915 | 3,371 | 10,455 | 8,510 | 6,135 | 2,711 | ||||||||||||||||||||||||
Digital Services | -13,852 | -6,765 | -4,981 | -2,607 | -27,282 | -15,011 | -11,241 | -9,004 | ||||||||||||||||||||||||
Managed Services | 1,093 | 808 | 399 | 100 | -4,089 | -2,814 | -2,087 | -1,829 | ||||||||||||||||||||||||
Emerging Business and Other | -5,420 | -3,520 | -2,480 | -1,176 | -13,827 | -6,150 | -4,620 | -3,154 | ||||||||||||||||||||||||
|
|
|
|
|
|
|
|
|
|
|
|
|
|
|
| |||||||||||||||||
Total | 1,242 | 3,094 | -147 | -312 | -34,743 | -15,465 | -11,813 | -11,276 | ||||||||||||||||||||||||
|
|
|
|
|
|
|
|
|
|
|
|
|
|
|
| |||||||||||||||||
| 2018 | 2017 | |||||||||||||||||||||||||||||||
Year to date As percentage of net sales | Jan-Dec | Jan-Sep | Jan-Jun | Jan-Mar | Jan-Dec | Jan-Sep | Jan-Jun | Jan-Mar | ||||||||||||||||||||||||
Networks | 14.0 | % | 13.0 | % | 11.3 | % | 11.8 | % | 7.9 | % | 8.9 | % | 9.7 | % | 8.6 | % | ||||||||||||||||
Digital Services | -36.4 | % | -27.0 | % | -30.9 | % | -35.9 | % | -70.4 | % | -55.7 | % | -62.4 | % | -111.1 | % | ||||||||||||||||
Managed Services | 4.2 | % | 4.3 | % | 3.2 | % | 1.7 | % | -15.4 | % | -14.4 | % | -16.1 | % | -29.1 | % | ||||||||||||||||
Emerging Business and Other | -64.5 | % | -57.4 | % | -66.9 | % | -71.2 | % | -175.7 | % | -106.3 | % | -121.9 | % | -177.1 | % | ||||||||||||||||
|
|
|
|
|
|
|
|
|
|
|
|
|
|
|
| |||||||||||||||||
Total | 0.6 | % | 2.1 | % | -0.2 | % | -0.7 | % | -16.9 | % | -10.5 | % | -12.0 | % | -23.6 | % | ||||||||||||||||
|
|
|
|
|
|
|
|
|
|
|
|
|
|
|
| |||||||||||||||||
| 37 Ericsson | Fourth Quarter and Full-Year Report 2018 | Additional information | |
EBITA and EBITA margin by segment by quarter
| 2018 | 2017 | |||||||||||||||||||||||||||||||
Isolated quarters, SEK million | Q4 | Q3 | Q2 | Q1 | Q4 | Q3 | Q2 | Q1 | ||||||||||||||||||||||||
Networks | 6,916 | 5,722 | 3,618 | 3,461 | 2,032 | 2,460 | 3,509 | 2,892 | ||||||||||||||||||||||||
Digital Services | -6,911 | -1,608 | -2,204 | -2,443 | -4,890 | -3,577 | -2,034 | -8,246 | ||||||||||||||||||||||||
Managed Services | 288 | 411 | 303 | 105 | -1,268 | -726 | -259 | -1,825 | ||||||||||||||||||||||||
Emerging Business and Other | -1,524 | -940 | -1,202 | -1,088 | -1,199 | -1,430 | -1,308 | -2,222 | ||||||||||||||||||||||||
|
|
|
|
|
|
|
|
|
|
|
|
|
|
|
| |||||||||||||||||
Total | -1,231 | 3,585 | 515 | 35 | -5,325 | -3,273 | -92 | -9,401 | ||||||||||||||||||||||||
|
|
|
|
|
|
|
|
|
|
|
|
|
|
|
| |||||||||||||||||
| 2018 | 2017 | |||||||||||||||||||||||||||||||
Isolated quarters As percentage of net sales | Q4 | Q3 | Q2 | Q1 | Q4 | Q3 | Q2 | Q1 | ||||||||||||||||||||||||
Networks | 16.6 | % | 15.9 | % | 11.2 | % | 12.1 | % | 5.5 | % | 7.7 | % | 11.1 | % | 9.1 | % | ||||||||||||||||
Digital Services | -53.1 | % | -17.9 | % | -25.0 | % | -33.6 | % | -41.4 | % | -40.1 | % | -20.5 | % | -101.8 | % | ||||||||||||||||
Managed Services | 4.2 | % | 6.4 | % | 4.6 | % | 1.8 | % | -18.4 | % | -11.0 | % | -3.9 | % | -29.0 | % | ||||||||||||||||
Emerging Business and Other | -66.8 | % | -38.8 | % | -58.5 | % | -65.9 | % | -57.5 | % | -71.7 | % | -65.1 | % | -124.8 | % | ||||||||||||||||
|
|
|
|
|
|
|
|
|
|
|
|
|
|
|
| |||||||||||||||||
Total | -1.9 | % | 6.7 | % | 1.0 | % | 0.1 | % | -9.2 | % | -6.6 | % | -0.2 | % | -19.7 | % | ||||||||||||||||
|
|
|
|
|
|
|
|
|
|
|
|
|
|
|
| |||||||||||||||||
| 2018 | 2017 | |||||||||||||||||||||||||||||||
Year to date, SEK million | Jan-Dec | Jan-Sep | Jan-Jun | Jan-Mar | Jan-Dec | Jan-Sep | Jan-Jun | Jan-Mar | ||||||||||||||||||||||||
Networks | 19,717 | 12,801 | 7,079 | 3,461 | 10,893 | 8,861 | 6,401 | 2,892 | ||||||||||||||||||||||||
Digital Services | -13,166 | -6,255 | -4,647 | -2,443 | -18,747 | -13,857 | -10,280 | -8,246 | ||||||||||||||||||||||||
Managed Services | 1,107 | 819 | 408 | 105 | -4,078 | -2,810 | -2,084 | -1,825 | ||||||||||||||||||||||||
Emerging Business and Other | -4,754 | -3,230 | -2,290 | -1,088 | -6,159 | -4,960 | -3,530 | -2,222 | ||||||||||||||||||||||||
|
|
|
|
|
|
|
|
|
|
|
|
|
|
|
| |||||||||||||||||
Total | 2,904 | 4,135 | 550 | 35 | -18,091 | -12,766 | -9,493 | -9,401 | ||||||||||||||||||||||||
|
|
|
|
|
|
|
|
|
|
|
|
|
|
|
| |||||||||||||||||
| 2018 | 2017 | |||||||||||||||||||||||||||||||
Year to date As a percentage of net sales | Jan-Dec | Jan-Sep | Jan-Jun | Jan-Mar | Jan-Dec | Jan-Sep | Jan-Jun | Jan-Mar | ||||||||||||||||||||||||
Networks | 14.2 | % | 13.2 | % | 11.6 | % | 12.1 | % | 8.2 | % | 9.3 | % | 10.1 | % | 9.1 | % | ||||||||||||||||
Digital Services | -34.6 | % | -24.9 | % | -28.9 | % | -33.6 | % | -48.4 | % | -51.5 | % | -57.1 | % | -101.8 | % | ||||||||||||||||
Managed Services | 4.3 | % | 4.3 | % | 3.3 | % | 1.8 | % | -15.4 | % | -14.4 | % | -16.1 | % | -29.0 | % | ||||||||||||||||
Emerging Business and Other | -56.5 | % | -52.7 | % | -61.8 | % | -65.9 | % | -78.3 | % | -85.8 | % | -93.2 | % | -124.8 | % | ||||||||||||||||
|
|
|
|
|
|
|
|
|
|
|
|
|
|
|
| |||||||||||||||||
Total | 1.4 | % | 2.8 | % | 0.6 | % | 0.1 | % | -8.8 | % | -8.7 | % | -9.7 | % | -19.7 | % | ||||||||||||||||
|
|
|
|
|
|
|
|
|
|
|
|
|
|
|
| |||||||||||||||||
| 38 Ericsson | Fourth Quarter and Full-Year Report 2018 | Additional information | |
Net sales by market area by quarter
| 2018 | 2017 | |||||||||||||||||||||||||||||||
Isolated quarters, SEK million | Q4 | Q3 | Q2 | Q1 | Q4 | Q3 | Q2 | Q1 | ||||||||||||||||||||||||
South East Asia, Oceania and India | 8,244 | 7,985 | 6,981 | 6,379 | 7,844 | 7,858 | 7,234 | 8,410 | ||||||||||||||||||||||||
North East Asia | 8,387 | 5,773 | 4,764 | 3,385 | 6,465 | 5,653 | 5,901 | 5,564 | ||||||||||||||||||||||||
North America | 17,999 | 14,933 | 14,337 | 11,317 | 14,685 | 12,319 | 12,970 | 12,027 | ||||||||||||||||||||||||
Europe and Latin America1)2) | 18,221 | 14,816 | 14,174 | 13,061 | 16,939 | 13,430 | 14,231 | 12,201 | ||||||||||||||||||||||||
Middle East and Africa | 6,516 | 5,722 | 5,626 | 5,765 | 7,581 | 6,297 | 5,731 | 5,356 | ||||||||||||||||||||||||
Other1)2) | 4,442 | 4,581 | 3,926 | 3,504 | 4,367 | 3,856 | 4,214 | 4,245 | ||||||||||||||||||||||||
|
|
|
|
|
|
|
|
|
|
|
|
|
|
|
| |||||||||||||||||
Total | 63,809 | 53,810 | 49,808 | 43,411 | 57,881 | 49,413 | 50,281 | 47,803 | ||||||||||||||||||||||||
|
|
|
|
|
|
|
|
|
|
|
|
|
|
|
| |||||||||||||||||
1) Of which in Sweden | 375 | 429 | 596 | 915 | 872 | 660 | 785 | 1,017 | ||||||||||||||||||||||||
2) Of which in EU | 10,319 | 8,481 | 8,619 | 8,522 | 10,822 | 8,635 | 8,687 | 8,328 | ||||||||||||||||||||||||
| 2018 | 2017 | |||||||||||||||||||||||||||||||
Sequential change, percent | Q4 | Q3 | Q2 | Q1 | Q4 | Q3 | Q2 | Q1 | ||||||||||||||||||||||||
South East Asia, Oceania and India | 3 | % | 14 | % | 9 | % | -19 | % | 0 | % | 9 | % | -14 | % | — | |||||||||||||||||
North East Asia | 45 | % | 21 | % | 41 | % | -48 | % | 14 | % | -4 | % | 6 | % | — | |||||||||||||||||
North America | 21 | % | 4 | % | 27 | % | -23 | % | 19 | % | -5 | % | 8 | % | — | |||||||||||||||||
Europe and Latin America1)2) | 23 | % | 5 | % | 9 | % | -23 | % | 26 | % | -6 | % | 17 | % | — | |||||||||||||||||
Middle East and Africa | 14 | % | 2 | % | -2 | % | -24 | % | 20 | % | 10 | % | 7 | % | — | |||||||||||||||||
Other1)2) | -3 | % | 17 | % | 12 | % | -20 | % | 13 | % | -8 | % | -1 | % | — | |||||||||||||||||
|
|
|
|
|
|
|
|
|
|
|
|
|
|
|
| |||||||||||||||||
Total | 19 | % | 8 | % | 15 | % | -25 | % | 17 | % | -2 | % | 5 | % | — | |||||||||||||||||
|
|
|
|
|
|
|
|
|
|
|
|
|
|
|
| |||||||||||||||||
1) Of which in Sweden | -13 | % | -28 | % | -35 | % | 5 | % | 32 | % | -16 | % | -23 | % | — | |||||||||||||||||
2) Of which in EU | 22 | % | -2 | % | 1 | % | -21 | % | 25 | % | -1 | % | 4 | % | — | |||||||||||||||||
| 2018 | 2017 | |||||||||||||||||||||||||||||||
Year-over-year change, percent | Q4 | Q3 | Q2 | Q1 | Q4 | Q3 | Q2 | Q1 | ||||||||||||||||||||||||
South East Asia, Oceania and India | 5 | % | 2 | % | -3 | % | -24 | % | — | — | — | — | ||||||||||||||||||||
North East Asia | 30 | % | 2 | % | -19 | % | -39 | % | — | — | — | — | ||||||||||||||||||||
North America | 23 | % | 21 | % | 11 | % | -6 | % | — | — | — | — | ||||||||||||||||||||
Europe and Latin America1)2) | 8 | % | 10 | % | 0 | % | 7 | % | �� | — | — | — | ||||||||||||||||||||
Middle East and Africa | -14 | % | -9 | % | -2 | % | 8 | % | — | — | — | — | ||||||||||||||||||||
Other1)2) | 2 | % | 19 | % | -7 | % | -17 | % | — | — | — | — | ||||||||||||||||||||
|
|
|
|
|
|
|
|
|
|
|
|
|
|
|
| |||||||||||||||||
Total | 10 | % | 9 | % | -1 | % | -9 | % | — | — | — | — | ||||||||||||||||||||
|
|
|
|
|
|
|
|
|
|
|
|
|
|
|
| |||||||||||||||||
1) Of which in Sweden | -57 | % | -35 | % | -24 | % | -10 | % | — | — | — | — | ||||||||||||||||||||
2) Of which in EU | -5 | % | -2 | % | -1 | % | 2 | % | — | — | — | — | ||||||||||||||||||||
| 2018 | 2017 | |||||||||||||||||||||||||||||||
Year to date, SEK million | Jan-Dec | Jan-Sep | Jan-Jun | Jan-Mar | Jan-Dec | Jan-Sep | Jan-Jun | Jan-Mar | ||||||||||||||||||||||||
South East Asia, Oceania and India | 29,589 | 21,345 | 13,360 | 6,379 | 31,346 | 23,502 | 15,644 | 8,410 | ||||||||||||||||||||||||
North East Asia | 22,309 | 13,922 | 8,149 | 3,385 | 23,583 | 17,118 | 11,465 | 5,564 | ||||||||||||||||||||||||
North America | 58,586 | 40,587 | 25,654 | 11,317 | 52,001 | 37,316 | 24,997 | 12,027 | ||||||||||||||||||||||||
Europe and Latin America1)2) | 60,272 | 42,051 | 27,235 | 13,061 | 56,801 | 39,862 | 26,432 | 12,201 | ||||||||||||||||||||||||
Middle East and Africa | 23,629 | 17,113 | 11,391 | 5,765 | 24,965 | 17,384 | 11,087 | 5,356 | ||||||||||||||||||||||||
Other1)2) | 16,453 | 12,011 | 7,430 | 3,504 | 16,682 | 12,315 | 8,459 | 4,245 | ||||||||||||||||||||||||
|
|
|
|
|
|
|
|
|
|
|
|
|
|
|
| |||||||||||||||||
Total | 210,838 | 147,029 | 93,219 | 43,411 | 205,378 | 147,497 | 98,084 | 47,803 | ||||||||||||||||||||||||
|
|
|
|
|
|
|
|
|
|
|
|
|
|
|
| |||||||||||||||||
1) Of which in Sweden | 2,315 | 1,940 | 1,511 | 915 | 3,334 | 2,462 | 1,802 | 1,017 | ||||||||||||||||||||||||
2) Of which in EU | 35,941 | 25,622 | 17,141 | 8,522 | 36,472 | 25,650 | 17,015 | 8,328 | ||||||||||||||||||||||||
| 2018 | 2017 | |||||||||||||||||||||||||||||||
Year to date, year-over-year change, percent | Jan-Dec | Jan-Sep | Jan-Jun | Jan-Mar | Jan-Dec | Jan-Sep | Jan-Jun | Jan-Mar | ||||||||||||||||||||||||
South East Asia, Oceania and India | -6 | % | -9 | % | -15 | % | -24 | % | 0 | % | — | — | — | |||||||||||||||||||
North East Asia | -5 | % | -19 | % | -29 | % | -39 | % | -13 | % | — | — | — | |||||||||||||||||||
North America | 13 | % | 9 | % | 3 | % | -6 | % | 1 | % | — | — | — | |||||||||||||||||||
Europe and Latin America1)2) | 6 | % | 5 | % | 3 | % | 7 | % | -9 | % | — | — | — | |||||||||||||||||||
Middle East and Africa | -5 | % | -2 | % | 3 | % | 8 | % | -9 | % | — | — | — | |||||||||||||||||||
Other1)2) | -1 | % | -2 | % | -12 | % | -17 | % | -18 | % | — | — | — | |||||||||||||||||||
|
|
|
|
|
|
|
|
|
|
|
|
|
|
|
| |||||||||||||||||
Total | 3 | % | 0 | % | -5 | % | -9 | % | -7 | % | — | — | — | |||||||||||||||||||
|
|
|
|
|
|
|
|
|
|
|
|
|
|
|
| |||||||||||||||||
1) Of which in Sweden | -31 | % | -21 | % | -16 | % | -10 | % | -1 | % | — | — | — | |||||||||||||||||||
2) Of which in EU | -1 | % | 0 | % | 1 | % | 2 | % | -6 | % | — | — | — | |||||||||||||||||||
| 39 Ericsson | Fourth Quarter and Full-Year Report 2018 | Additional information | |
| Q4 | Jan-Dec | |||||||||||||||
Country Percentage of Net sales | 2018 | 2017 | 2018 | 2017 | ||||||||||||
United States | 30 | % | 26 | % | 29 | % | 27 | % | ||||||||
China | 9 | % | 7 | % | 7 | % | 7 | % | ||||||||
India | 3 | % | 4 | % | 4 | % | 5 | % | ||||||||
Australia | 3 | % | 3 | % | 4 | % | 3 | % | ||||||||
Japan | 4 | % | 4 | % | 3 | % | 4 | % | ||||||||
Net sales by market area by segment
| Q4 2018 | Jan-Dec 2018 | |||||||||||||||||||||||||||||||||||||||
SEK million | Networks | Digital Services | Managed Services | Emerging Business and Other | Total | Networks | Digital Services | Managed Services | Emerging Business and Other | Total | ||||||||||||||||||||||||||||||
South East Asia, Oceania and India | 6,097 | 1,250 | 870 | 27 | 8,244 | 21,337 | 4,824 | 3,388 | 40 | 29,589 | ||||||||||||||||||||||||||||||
North East Asia | 5,495 | 2,491 | 383 | 18 | 8,387 | 15,915 | 4,849 | 1,465 | 80 | 22,309 | ||||||||||||||||||||||||||||||
North America | 13,985 | 2,770 | 1,220 | 24 | 17,999 | 46,452 | 8,358 | 3,680 | 96 | 58,586 | ||||||||||||||||||||||||||||||
Europe and Latin America | 10,486 | 4,280 | 3,362 | 93 | 18,221 | 34,413 | 12,339 | 13,207 | 313 | 60,272 | ||||||||||||||||||||||||||||||
Middle East and Africa | 3,638 | 1,829 | 1,046 | 3 | 6,516 | 13,300 | 6,284 | 4,030 | 15 | 23,629 | ||||||||||||||||||||||||||||||
Other | 1,940 | 387 | — | 2,115 | 4,442 | 7,153 | 1,435 | — | 7,865 | 16,453 | ||||||||||||||||||||||||||||||
|
|
|
|
|
|
|
|
|
|
|
|
|
|
|
|
|
|
|
| |||||||||||||||||||||
Total | 41,641 | 13,007 | 6,881 | 2,280 | 63,809 | 138,570 | 38,089 | 25,770 | 8,409 | 210,838 | ||||||||||||||||||||||||||||||
|
|
|
|
|
|
|
|
|
|
|
|
|
|
|
|
|
|
|
| |||||||||||||||||||||
Share of total | 65 | % | 20 | % | 11 | % | 4 | % | 100 | % | 66 | % | 18 | % | 12 | % | 4 | % | 100 | % | ||||||||||||||||||||
| Q4 2018 | ||||||||||||||||||||
Sequential change, percent | Networks | Digital Services | Managed Services | Emerging Business and Other | Total | |||||||||||||||
South East Asia, Oceania and India | 5 | % | -2 | % | -1 | % | 800 | % | 3 | % | ||||||||||
North East Asia | 20 | % | 199 | % | 17 | % | -40 | % | 45 | % | ||||||||||
North America | 19 | % | 32 | % | 17 | % | 4 | % | 21 | % | ||||||||||
Europe and Latin America | 20 | % | 50 | % | 6 | % | 27 | % | 23 | % | ||||||||||
Middle East and Africa | 16 | % | 19 | % | 0 | % | — | 14 | % | |||||||||||
Other | 2 | % | 1 | % | — | -8 | % | -3 | % | |||||||||||
|
|
|
|
|
|
|
|
|
| |||||||||||
Total | 16 | % | 45 | % | 6 | % | -6 | % | 19 | % | ||||||||||
|
|
|
|
|
|
|
|
|
| |||||||||||
| Q4 2018 | Jan-Dec 2018 | |||||||||||||||||||||||||||||||||||||||
Year over year change, percent | Networks | Digital Services | Managed Services | Emerging Business and Other | Total | Networks | Digital Services | Managed Services | Emerging Business and Other | Total | ||||||||||||||||||||||||||||||
South East Asia, Oceania and India | 3 | % | -3 | % | 35 | % | 440 | % | 5 | % | -9 | % | 1 | % | 5 | % | 400 | % | -6 | % | ||||||||||||||||||||
North East Asia | 28 | % | 57 | % | -33 | % | 500 | % | 30 | % | -2 | % | -11 | % | -22 | % | 471 | % | -5 | % | ||||||||||||||||||||
North America | 18 | % | 33 | % | 85 | % | -35 | % | 23 | % | 14 | % | 4 | % | 15 | % | -16 | % | 13 | % | ||||||||||||||||||||
Europe and Latin America | 18 | % | 8 | % | -15 | % | 2 | % | 8 | % | 14 | % | 2 | % | -7 | % | 12 | % | 6 | % | ||||||||||||||||||||
Middle East and Africa | -13 | % | -22 | % | 0 | % | -86 | % | -14 | % | -6 | % | -8 | % | 0 | % | -67 | % | -5 | % | ||||||||||||||||||||
Other | 2 | % | -28 | % | — | 10 | % | 2 | % | -7 | % | -8 | % | — | 6 | % | -1 | % | ||||||||||||||||||||||
|
|
|
|
|
|
|
|
|
|
|
|
|
|
|
|
|
|
|
| |||||||||||||||||||||
Total | 12 | % | 10 | % | 0 | % | 9 | % | 10 | % | 5 | % | -2 | % | -3 | % | 7 | % | 3 | % | ||||||||||||||||||||
|
|
|
|
|
|
|
|
|
|
|
|
|
|
|
|
|
|
|
| |||||||||||||||||||||
| 40 Ericsson | Fourth Quarter and Full-Year Report 2018 | Additional information | |
IPR licensing revenues by segment by quarter
| 41 Ericsson | Fourth Quarter and Full-Year Report 2018 | Additional information | |
Investments in assets subject to depreciation, amortization, impairment and write-downs
| 2018 | 2017 | |||||||||||||||||||||||||||||||
Isolated quarters, SEK million | Q4 | Q3 | Q2 | Q1 | Q4 | Q3 | Q2 | Q1 | ||||||||||||||||||||||||
Additions | ||||||||||||||||||||||||||||||||
Property, plant and equipment | 1,080 | 1,088 | 951 | 856 | 1,105 | 739 | 1,018 | 1,015 | ||||||||||||||||||||||||
Capitalized development expenses | 195 | 151 | 325 | 254 | 138 | 126 | 315 | 865 | ||||||||||||||||||||||||
IPR, brands and other intangible assets | 27 | — | 1 | — | 315 | 1 | 19 | 1 | ||||||||||||||||||||||||
|
|
|
|
|
|
|
|
|
|
|
|
|
|
|
| |||||||||||||||||
Total | 1,302 | 1,239 | 1,277 | 1,100 | 1,558 | 866 | 1,352 | 1,881 | ||||||||||||||||||||||||
|
|
|
|
|
|
|
|
|
|
|
|
|
|
|
| |||||||||||||||||
Depreciation, amortization and impairment losses | ||||||||||||||||||||||||||||||||
Property, plant and equipment | 965 | 870 | 1,080 | 928 | 1,284 | 2,894 | 1,061 | 1,075 | ||||||||||||||||||||||||
Capitalized development expenses | 884 | 678 | 635 | 616 | 881 | 874 | 690 | 2,481 | ||||||||||||||||||||||||
Goodwill, IPR, brands and other intangible assets | 620 | 345 | 350 | 347 | 13,953 | 378 | 446 | 1,875 | ||||||||||||||||||||||||
|
|
|
|
|
|
|
|
|
|
|
|
|
|
|
| |||||||||||||||||
Total | 2,469 | 1,893 | 2,065 | 1,891 | 16,118 | 4,146 | 2,197 | 5,431 | ||||||||||||||||||||||||
|
|
|
|
|
|
|
|
|
|
|
|
|
|
|
| |||||||||||||||||
| 2018 | 2017 | |||||||||||||||||||||||||||||||
Year to date, SEK million | Jan-Dec | Jan-Sep | Jan-Jun | Jan-Mar | Jan-Dec | Jan-Sep | Jan-Jun | Jan-Mar | ||||||||||||||||||||||||
Additions | ||||||||||||||||||||||||||||||||
Property, plant and equipment | 3,975 | 2,895 | 1,807 | 856 | 3,877 | 2,772 | 2,033 | 1,015 | ||||||||||||||||||||||||
Capitalized development expenses | 925 | 730 | 579 | 254 | 1,444 | 1,306 | 1,180 | 865 | ||||||||||||||||||||||||
IPR, brands and other intangible assets | 28 | 1 | 1 | — | 336 | 21 | 20 | 1 | ||||||||||||||||||||||||
|
|
|
|
|
|
|
|
|
|
|
|
|
|
|
| |||||||||||||||||
Total | 4,928 | 3,626 | 2,387 | 1,110 | 5,657 | 4,099 | 3,233 | 1,881 | ||||||||||||||||||||||||
|
|
|
|
|
|
|
|
|
|
|
|
|
|
|
| |||||||||||||||||
Depreciation, amortization and impairment losses | ||||||||||||||||||||||||||||||||
Property, plant and equipment | 3,843 | 2,878 | 2,008 | 928 | 6,314 | 5,030 | 2,136 | 1,075 | ||||||||||||||||||||||||
Capitalized development expenses | 2,813 | 1,929 | 1,251 | 616 | 4,926 | 4,045 | 3,171 | 2,481 | ||||||||||||||||||||||||
Goodwill, IPR, brands and other intangible assets | 1,662 | 1,042 | 697 | 347 | 16,652 | 2,699 | 2,321 | 1,875 | ||||||||||||||||||||||||
|
|
|
|
|
|
|
|
|
|
|
|
|
|
|
| |||||||||||||||||
Total | 8,318 | 5,849 | 3,956 | 1,891 | 27,892 | 11,774 | 7,628 | 5,431 | ||||||||||||||||||||||||
|
|
|
|
|
|
|
|
|
|
|
|
|
|
|
| |||||||||||||||||
| 42 Ericsson | Fourth Quarter and Full-Year Report 2018 | Additional information | |
| Oct-Dec | Jan-Dec | |||||||||||||||
SEK million | 2018 | 2017 | 2018 | 2017 | ||||||||||||
Number of shares and earnings per share | ||||||||||||||||
Number of shares, end of period (million) | 3,334 | 3,334 | 3,334 | 3,334 | ||||||||||||
Of which classA-shares (million) | 262 | 262 | 262 | 262 | ||||||||||||
Of which classB-shares (million) | 3,072 | 3,072 | 3,072 | 3,072 | ||||||||||||
Number of treasury shares, end of period (million) | 37 | 50 | 37 | 50 | ||||||||||||
Number of shares outstanding, basic, end of period (million) | 3,297 | 3,284 | 3,297 | 3,284 | ||||||||||||
Numbers of shares outstanding, diluted, end of period (million) | 3,323 | 3,324 | 3,323 | 3,324 | ||||||||||||
Average number of treasury shares (million) | 38 | 52 | 43 | 56 | ||||||||||||
Average number of shares outstanding, basic (million) | 3,296 | 3,283 | 3,291 | 3,277 | ||||||||||||
Average number of shares outstanding, diluted (million)1) | 3,322 | 3,322 | 3,318 | 3,317 | ||||||||||||
Earnings (loss) per share, basic (SEK) | -1.99 | -5.63 | -1.98 | -9.94 | ||||||||||||
Earnings (loss) per share, diluted (SEK)1) | -1.99 | -5.63 | -1.98 | -9.94 | ||||||||||||
Earnings (loss) per share (Non-IFRS), diluted (SEK)2) | -0.77 | -1.09 | 0.27 | -3.24 | ||||||||||||
Ratios | ||||||||||||||||
Days sales outstanding | — | — | 91 | 96 | ||||||||||||
Inventory turnover days | 58 | 59 | 70 | 66 | ||||||||||||
Payable days | 57 | 50 | 72 | 60 | ||||||||||||
Alternative Performance Measures (APMs) | ||||||||||||||||
Equity ratio (%) | — | — | 32.7 | % | 37.5 | % | ||||||||||
Return on equity (%) | -28.8 | % | -70.7 | % | -7.1 | % | -28.1 | % | ||||||||
Return on capital employed (%) | -5.6 | % | -47.6 | % | 0.6 | % | -20.6 | % | ||||||||
Capital turnover (times) | 1.7 | 1.4 | 1.4 | 1.2 | ||||||||||||
Free cash flow | 2,993 | 10,134 | 2,968 | 5,109 | ||||||||||||
Cash conversion (%) | -4,374.5 | % | -278.9 | % | 601.2 | % | -73.2 | % | ||||||||
Exchange rates used in the consolidation | ||||||||||||||||
SEK/EUR- closing rate | — | — | 10.25 | 9.83 | ||||||||||||
SEK/USD- closing rate | — | — | 8.94 | 8.20 | ||||||||||||
|
|
|
|
|
|
|
| |||||||||
Other | ||||||||||||||||
Market area inventory, end of period | 16,505 | 14,480 | 16,505 | 14,480 | ||||||||||||
Export sales from Sweden | 38,974 | 24,166 | 109,969 | 87,463 | ||||||||||||
| 1) | Potential ordinary shares are not considered when their conversion to ordinary shares would increase earnings per share. |
| 2) | Excluding amortizations and write-downs of acquired intangibles and restructuring charges. |
| 2018 | 2017 | |||||||||||||||||||||||||||||||
End of period | Dec 31 | Sep 30 | Jun 30 | Mar 31 | Dec 31 | Sep 30 | Jun 30 | Mar 31 | ||||||||||||||||||||||||
South East Asia, Oceania and India | 23,959 | 23,607 | 23,516 | 23,623 | 24,495 | 26,396 | 26,748 | 27,221 | ||||||||||||||||||||||||
North East Asia | 12,788 | 12,495 | 12,303 | 12,321 | 12,456 | 12,945 | 12,972 | 12,962 | ||||||||||||||||||||||||
North America | 9,727 | 9,459 | 9,510 | 9,798 | 10,009 | 10,665 | 11,073 | 11,253 | ||||||||||||||||||||||||
Europe and Latin America1) | 44,621 | 44,695 | 45,743 | 47,528 | 49,231 | 50,832 | 53,173 | 54,194 | ||||||||||||||||||||||||
Middle East and Africa | 4,264 | 4,243 | 4,188 | 4,311 | 4,544 | 5,014 | 5,161 | 5,268 | ||||||||||||||||||||||||
|
|
|
|
|
|
|
|
|
|
|
|
|
|
|
| |||||||||||||||||
Total | 95,359 | 94,499 | 95,260 | 97,581 | 100,735 | 105,852 | 109,127 | 110,898 | ||||||||||||||||||||||||
|
|
|
|
|
|
|
|
|
|
|
|
|
|
|
| |||||||||||||||||
1) Of which in Sweden | 12,502 | 12,679 | 13,431 | 13,763 | 13,864 | 14,195 | 14,483 | 14,712 | ||||||||||||||||||||||||
| 43 Ericsson | Fourth Quarter and Full-Year Report 2018 | Additional information | |
Items excluding restructuring charges
Restructuring charges by function
| 2018 | 2017 | |||||||||||||||||||||||||||||||
Isolated quarters, SEK million | Q4 | Q3 | Q2 | Q1 | Q4 | Q3 | Q2 | Q1 | ||||||||||||||||||||||||
Cost of sales | -4,054 | -204 | -937 | -743 | -2,038 | -817 | -927 | -1,460 | ||||||||||||||||||||||||
Research and development expenses | -251 | -214 | -502 | -326 | 147 | -1,896 | -344 | -214 | ||||||||||||||||||||||||
Selling and administrative expenses | -106 | -134 | -441 | -103 | -534 | -106 | -243 | -69 | ||||||||||||||||||||||||
|
|
|
|
|
|
|
|
|
|
|
|
|
|
|
| |||||||||||||||||
Total | -4,411 | -552 | -1,880 | -1,172 | -2,425 | -2,819 | -1,514 | -1,743 | ||||||||||||||||||||||||
|
|
|
|
|
|
|
|
|
|
|
|
|
|
|
| |||||||||||||||||
| 2018 | 2017 | |||||||||||||||||||||||||||||||
Year to date, SEK million | Jan-Dec | Jan-Sep | Jan-Jun | Jan-Mar | Jan-Dec | Jan-Sep | Jan-Jun | Jan-Mar | ||||||||||||||||||||||||
Cost of sales | -5,938 | -1,884 | -1,680 | -743 | -5,242 | -3,204 | -2,387 | -1,460 | ||||||||||||||||||||||||
Research and development expenses | -1,293 | -1,042 | -828 | -326 | -2,307 | -2,454 | -558 | -214 | ||||||||||||||||||||||||
Selling and administrative expenses | -784 | -678 | -544 | -103 | -952 | -418 | -312 | -69 | ||||||||||||||||||||||||
|
|
|
|
|
|
|
|
|
|
|
|
|
|
|
| |||||||||||||||||
Total | -8,015 | -3,604 | -3,052 | -1,172 | -8,501 | -6,076 | -3,257 | -1,743 | ||||||||||||||||||||||||
|
|
|
|
|
|
|
|
|
|
|
|
|
|
|
| |||||||||||||||||
Restructuring charges by segment
| 2018 | 2017 | |||||||||||||||||||||||||||||||
Isolated quarters, SEK million | Q4 | Q3 | Q2 | Q1 | Q4 | Q3 | Q2 | Q1 | ||||||||||||||||||||||||
Networks | -425 | -128 | -749 | -479 | -1,260 | -1,409 | -816 | -1,343 | ||||||||||||||||||||||||
of which cost of sales | -439 | -63 | -469 | -415 | -1,052 | -430 | -512 | -1,153 | ||||||||||||||||||||||||
of which operating expenses | 14 | -65 | -280 | -64 | -208 | -979 | -304 | -190 | ||||||||||||||||||||||||
Digital Services | -3,545 | -358 | -882 | -581 | -686 | -1,103 | -454 | -270 | ||||||||||||||||||||||||
of which cost of sales | -3,369 | -111 | -303 | -226 | -609 | -241 | -242 | -195 | ||||||||||||||||||||||||
of which operating expenses | -176 | -247 | -579 | -355 | -77 | -862 | -212 | -75 | ||||||||||||||||||||||||
Managed Services | -70 | -32 | -123 | -51 | -376 | -99 | -115 | -85 | ||||||||||||||||||||||||
of which cost of sales | -69 | -28 | -103 | -48 | -326 | -94 | -113 | -83 | ||||||||||||||||||||||||
of which operating expenses | -1 | -4 | -20 | -3 | -50 | -5 | -2 | -2 | ||||||||||||||||||||||||
Emerging Business and Other | -371 | -34 | -126 | -61 | -103 | -208 | -129 | -45 | ||||||||||||||||||||||||
of which cost of sales | -177 | -2 | -62 | -54 | -51 | -52 | -60 | -29 | ||||||||||||||||||||||||
of which operating expenses | -194 | -32 | -64 | -7 | -52 | -156 | -69 | -16 | ||||||||||||||||||||||||
|
|
|
|
|
|
|
|
|
|
|
|
|
|
|
| |||||||||||||||||
Total | -4,411 | -552 | -1,880 | -1,172 | -2,425 | -2,819 | -1,514 | -1,743 | ||||||||||||||||||||||||
|
|
|
|
|
|
|
|
|
|
|
|
|
|
|
| |||||||||||||||||
| 2018 | 2017 | |||||||||||||||||||||||||||||||
Year to date, SEK million | Jan-Dec | Jan-Sep | Jan-Jun | Jan-Mar | Jan-Dec | Jan-Sep | Jan-Jun | Jan-Mar | ||||||||||||||||||||||||
Networks | -1,781 | -1,356 | -1,228 | -479 | -4,828 | -3,568 | -2,159 | -1,343 | ||||||||||||||||||||||||
of which cost of sales | -1,386 | -947 | -884 | -415 | -3,147 | -2,095 | -1,665 | -1,153 | ||||||||||||||||||||||||
of which operating expenses | -395 | -409 | -344 | -64 | -1,681 | -1,473 | -494 | -190 | ||||||||||||||||||||||||
Digital Services | -5,366 | -1,821 | -1,463 | -581 | -2,513 | -1,827 | -724 | -270 | ||||||||||||||||||||||||
of which cost of sales | -4,009 | -640 | -529 | -226 | -1,287 | -678 | -437 | -195 | ||||||||||||||||||||||||
of which operating expenses | -1,357 | -1,181 | -934 | -355 | -1,226 | -1,149 | -287 | -75 | ||||||||||||||||||||||||
Managed Services | -276 | -206 | -174 | -51 | -675 | -299 | -200 | -85 | ||||||||||||||||||||||||
of which cost of sales | -248 | -179 | -151 | -48 | -616 | -290 | -196 | -83 | ||||||||||||||||||||||||
of which operating expenses | -28 | -27 | -23 | -3 | -59 | -9 | -4 | -2 | ||||||||||||||||||||||||
Emerging Business and Other | -592 | -221 | -187 | -61 | -485 | -382 | -174 | -45 | ||||||||||||||||||||||||
of which cost of sales | -295 | -118 | -116 | -54 | -192 | -141 | -89 | -29 | ||||||||||||||||||||||||
of which operating expenses | -297 | -103 | -71 | -7 | -293 | -241 | -85 | -16 | ||||||||||||||||||||||||
|
|
|
|
|
|
|
|
|
|
|
|
|
|
|
| |||||||||||||||||
Total | -8,015 | -3,604 | -3,052 | -1,172 | -8,501 | -6,076 | -3,257 | -1,743 | ||||||||||||||||||||||||
|
|
|
|
|
|
|
|
|
|
|
|
|
|
|
| |||||||||||||||||
| 44 Ericsson | Fourth Quarter and Full-Year Report 2018 | Items excluding restructuring charges | |
Gross income (loss) and gross margin excluding restructuring charges by segment
| 2018 | 2017 | |||||||||||||||||||||||||||||||
Isolated quarters, SEK million | Q4 | Q3 | Q2 | Q1 | Q4 | Q3 | Q2 | Q1 | ||||||||||||||||||||||||
Networks | 17,065 | 14,898 | 13,034 | 11,542 | 12,901 | 11,084 | 11,406 | 11,184 | ||||||||||||||||||||||||
Digital Services | 2,129 | 3,319 | 3,761 | 3,118 | 1,723 | 2,860 | 3,531 | -2,129 | ||||||||||||||||||||||||
Managed Services | 850 | 833 | 912 | 539 | -365 | -266 | 132 | -459 | ||||||||||||||||||||||||
Emerging Business and Other | 389 | 784 | 563 | 402 | 295 | 420 | 488 | 364 | ||||||||||||||||||||||||
|
|
|
|
|
|
|
|
|
|
|
|
|
|
|
| |||||||||||||||||
Total | 20,433 | 19,834 | 18,270 | 15,601 | 14,554 | 14,098 | 15,557 | 8,960 | ||||||||||||||||||||||||
|
|
|
|
|
|
|
|
|
|
|
|
|
|
|
| |||||||||||||||||
| 2018 | 2017 | |||||||||||||||||||||||||||||||
Isolated quarters, As percentage of net sales | Q4 | Q3 | Q2 | Q1 | Q4 | Q3 | Q2 | Q1 | ||||||||||||||||||||||||
Networks | 41.0 | % | 41.5 | % | 40.2 | % | 40.4 | % | 34.8 | % | 34.8 | % | 36.0 | % | 35.3 | % | ||||||||||||||||
Digital Services | 16.4 | % | 36.9 | % | 42.6 | % | 42.9 | % | 14.6 | % | 32.0 | % | 35.7 | % | -26.3 | % | ||||||||||||||||
Managed Services | 12.4 | % | 12.9 | % | 14.0 | % | 9.1 | % | -5.3 | % | -4.0 | % | 2.0 | % | -7.3 | % | ||||||||||||||||
Emerging Business and Other | 17.1 | % | 32.3 | % | 27.4 | % | 24.3 | % | 14.1 | % | 21.1 | % | 24.3 | % | 20.4 | % | ||||||||||||||||
|
|
|
|
|
|
|
|
|
|
|
|
|
|
|
| |||||||||||||||||
Total | 32.0 | % | 36.9 | % | 36.7 | % | 35.9 | % | 25.1 | % | 28.5 | % | 30.9 | % | 18.7 | % | ||||||||||||||||
|
|
|
|
|
|
|
|
|
|
|
|
|
|
|
| |||||||||||||||||
| 2018 | 2017 | |||||||||||||||||||||||||||||||
Year to date, SEK million | Jan-Dec | Jan-Sep | Jan-Jun | Jan-Mar | Jan-Dec | Jan-Sep | Jan-Jun | Jan-Mar | ||||||||||||||||||||||||
Networks | 56,539 | 39,474 | 24,576 | 11,542 | 46,575 | 33,674 | 22,590 | 11,184 | ||||||||||||||||||||||||
Digital Services | 12,327 | 10,198 | 6,879 | 3,118 | 5,985 | 4,262 | 1,402 | -2,129 | ||||||||||||||||||||||||
Managed Services | 3,134 | 2,284 | 1,451 | 539 | -958 | -593 | -327 | -459 | ||||||||||||||||||||||||
Emerging Business and Other | 2,138 | 1,749 | 965 | 402 | 1,567 | 1,272 | 852 | 364 | ||||||||||||||||||||||||
|
|
|
|
|
|
|
|
|
|
|
|
|
|
|
| |||||||||||||||||
Total | 74,138 | 53,705 | 33,871 | 15,601 | 53,169 | 38,615 | 24,517 | 8,960 | ||||||||||||||||||||||||
|
|
|
|
|
|
|
|
|
|
|
|
|
|
|
| |||||||||||||||||
| 2018 | 2017 | |||||||||||||||||||||||||||||||
Year to date, As percentage of net sales | Jan-Dec | Jan-Sep | Jan-Jun | Jan-Mar | Jan-Dec | Jan-Sep | Jan-Jun | Jan-Mar | ||||||||||||||||||||||||
Networks | 40.8 | % | 40.7 | % | 40.3 | % | 40.4 | % | 35.2 | % | 35.4 | % | 35.7 | % | 35.3 | % | ||||||||||||||||
Digital Services | 32.4 | % | 40.7 | % | 42.7 | % | 42.9 | % | 15.4 | % | 15.8 | % | 7.8 | % | -26.3 | % | ||||||||||||||||
Managed Services | 12.2 | % | 12.1 | % | 11.7 | % | 9.1 | % | -3.6 | % | -3.0 | % | -2.5 | % | -7.3 | % | ||||||||||||||||
Emerging Business and Other | 25.4 | % | 28.5 | % | 26.0 | % | 24.3 | % | 19.9 | % | 22.0 | % | 22.5 | % | 20.4 | % | ||||||||||||||||
|
|
|
|
|
|
|
|
|
|
|
|
|
|
|
| |||||||||||||||||
Total | 35.2 | % | 36.5 | % | 36.3 | % | 35.9 | % | 25.9 | % | 26.2 | % | 25.0 | % | 18.7 | % | ||||||||||||||||
|
|
|
|
|
|
|
|
|
|
|
|
|
|
|
| |||||||||||||||||
| 45 Ericsson | Fourth Quarter and Full-Year Report 2018 | Items excluding restructuring charges | |
Operating income (loss) and operating margin excluding restructuring charges by segment
| 2018 | 2017 | |||||||||||||||||||||||||||||||
Isolated quarters, SEK million | Q4 | Q3 | Q2 | Q1 | Q4 | Q3 | Q2 | Q1 | ||||||||||||||||||||||||
Networks | 7,275 | 5,784 | 4,293 | 3,850 | 3,205 | 3,784 | 4,240 | 4,054 | ||||||||||||||||||||||||
Digital Services | -3,542 | -1,426 | -1,492 | -2,026 | -11,585 | -2,668 | -1,783 | -8,734 | ||||||||||||||||||||||||
Managed Services | 355 | 441 | 422 | 151 | -898 | -628 | -143 | -1,744 | ||||||||||||||||||||||||
Emerging Business and Other | -1,529 | -1,006 | -1,178 | -1,115 | -7,575 | -1,321 | -1,337 | -3,109 | ||||||||||||||||||||||||
|
|
|
|
|
|
|
|
|
|
|
|
|
|
|
| |||||||||||||||||
Total | 2,559 | 3,793 | 2,045 | 860 | -16,853 | -833 | 977 | -9,533 | ||||||||||||||||||||||||
|
|
|
|
|
|
|
|
|
|
|
|
|
|
|
| |||||||||||||||||
| 2018 | 2017 | |||||||||||||||||||||||||||||||
Isolated quarters, As percentage of net sales | Q4 | Q3 | Q2 | Q1 | Q4 | Q3 | Q2 | Q1 | ||||||||||||||||||||||||
Networks | 17.5 | % | 16.1 | % | 13.3 | % | 13.5 | % | 8.6 | % | 11.9 | % | 13.4 | % | 12.8 | % | ||||||||||||||||
Digital Services | -27.2 | % | -15.9 | % | -16.9 | % | -27.9 | % | -98.0 | % | -29.9 | % | -18.0 | % | -107.8 | % | ||||||||||||||||
Managed Services | 5.2 | % | 6.8 | % | 6.5 | % | 2.6 | % | -13.0 | % | -9.5 | % | -2.1 | % | -27.8 | % | ||||||||||||||||
Emerging Business and Other | -67.1 | % | -41.5 | % | -57.4 | % | -67.5 | % | -363.1 | % | -66.2 | % | -66.6 | % | -174.6 | % | ||||||||||||||||
|
|
|
|
|
|
|
|
|
|
|
|
|
|
|
| |||||||||||||||||
Total | 4.0 | % | 7.0 | % | 4.1 | % | 2.0 | % | -29.1 | % | -1.7 | % | 1.9 | % | -19.9 | % | ||||||||||||||||
|
|
|
|
|
|
|
|
|
|
|
|
|
|
|
| |||||||||||||||||
| 2018 | 2017 | |||||||||||||||||||||||||||||||
Year to date, SEK million | Jan-Dec | Jan-Sep | Jan-Jun | Jan-Mar | Jan-Dec | Jan-Sep | Jan-Jun | Jan-Mar | ||||||||||||||||||||||||
Networks | 21,202 | 13,927 | 8,143 | 3,850 | 15,283 | 12,078 | 8,294 | 4,054 | ||||||||||||||||||||||||
Digital Services | -8,486 | -4,944 | -3,518 | -2,026 | -24,770 | -13,185 | -10,517 | -8,734 | ||||||||||||||||||||||||
Managed Services | 1,369 | 1,014 | 573 | 151 | -3,413 | -2,515 | -1,887 | -1,744 | ||||||||||||||||||||||||
Emerging Business and Other | -4,828 | -3,299 | -2,293 | -1,115 | -13,342 | -5,767 | -4,446 | -3,109 | ||||||||||||||||||||||||
|
|
|
|
|
|
|
|
|
|
|
|
|
|
|
| |||||||||||||||||
Total | 9,257 | 6,698 | 2,905 | 860 | -26,242 | -9,389 | -8,556 | -9,533 | ||||||||||||||||||||||||
|
|
|
|
|
|
|
|
|
|
|
|
|
|
|
| |||||||||||||||||
| 2018 | 2017 | |||||||||||||||||||||||||||||||
Year to date, As percentage of net sales | Jan-Dec | Jan-Sep | Jan-Jun | Jan-Mar | Jan-Dec | Jan-Sep | Jan-Jun | Jan-Mar | ||||||||||||||||||||||||
Networks | 15.3 | % | 14.4 | % | 13.4 | % | 13.5 | % | 11.6 | % | 12.7 | % | 13.1 | % | 12.8 | % | ||||||||||||||||
Digital Services | -22.3 | % | -19.7 | % | -21.9 | % | -27.9 | % | -63.9 | % | -49.0 | % | -58.4 | % | -107.8 | % | ||||||||||||||||
Managed Services | 5.3 | % | 5.4 | % | 4.6 | % | 2.6 | % | -12.9 | % | -12.8 | % | -14.6 | % | -27.8 | % | ||||||||||||||||
Emerging Business and Other | -57.4 | % | -53.8 | % | -61.9 | % | -67.5 | % | -169.6 | % | -99.7 | % | -117.3 | % | -174.6 | % | ||||||||||||||||
|
|
|
|
|
|
|
|
|
|
|
|
|
|
|
| |||||||||||||||||
Total | 4.4 | % | 4.6 | % | 3.1 | % | 2.0 | % | -12.8 | % | -6.4 | % | -8.7 | % | -19.9 | % | ||||||||||||||||
|
|
|
|
|
|
|
|
|
|
|
|
|
|
|
| |||||||||||||||||
| 46 Ericsson | Fourth Quarter and Full-Year Report 2018 | Items excluding restructuring charges | |
Alternative performance measures
This section includes a reconciliation of certain Alternative Performance Measures (APMs) to the most directly reconcilable line items in the financial statements. The presentation of APMs has limitations as analytical tools and should not be considered in isolation or as a substitute for related financial measures prepared in accordance with IFRS.
APMs are presented to enhance an investor’s evaluation of ongoing operating results, to aid in forecasting future periods and to facilitate meaningful comparison of results between periods.
Management uses these APMs to, among other things, evaluate ongoing operations in relation to historical results, for internal planning and forecasting purposes and in the calculation of certain performance-based compensation.
The APMs presented in this report may differ from similarly titled measures used by other companies.
For additional information, see Alternative Performance Measures in the Ericsson Annual Report 2017.
Sales growth adjusted for comparable units and currency
Sales growth adjusted for the impact of acquisitions and divestments as well as the effects of foreign currency fluctuations.
| 2018 | 2017 | |||||||||||||||||||||||||||||||
Isolated quarter, sequential change | Q4 | Q3 | Q2 | Q1 | Q4 | Q3 | Q2 | Q1 | ||||||||||||||||||||||||
Reported net sales | 63,809 | 53,810 | 49,808 | 43,411 | — | — | — | — | ||||||||||||||||||||||||
Acquired/divested business | — | — | — | — | — | — | — | — | ||||||||||||||||||||||||
Net FX impact | 41 | -752 | -2,460 | 423 | — | — | — | — | ||||||||||||||||||||||||
Comparable net sales, excluding FX impact | 63,850 | 53,058 | 47,348 | 43,834 | — | — | — | — | ||||||||||||||||||||||||
Sales growth adjusted for comparable units and currency (%) | 19 | % | 7 | % | 9 | % | -24 | % | — | — | — | — | ||||||||||||||||||||
| 2018 | 2017 | |||||||||||||||||||||||||||||||
Isolated quarter, year over year change | Q4 | Q3 | Q2 | Q1 | Q4 | Q3 | Q2 | Q1 | ||||||||||||||||||||||||
Reported net sales | 63,809 | 53,810 | 49,808 | 43,411 | — | — | — | — | ||||||||||||||||||||||||
Acquired/divested business | — | — | — | — | — | — | — | — | ||||||||||||||||||||||||
Net FX impact | -3,549 | -3,748 | -263 | 3,328 | — | — | — | — | ||||||||||||||||||||||||
Comparable net sales, excluding FX impact | 60,260 | 50,062 | 49,545 | 46,739 | — | — | — | — | ||||||||||||||||||||||||
Sales growth adjusted for comparable units and currency (%) | 4 | % | 1 | % | -1 | % | -2 | % | — | — | — | — | ||||||||||||||||||||
| 2018 | 2017 | |||||||||||||||||||||||||||||||
Year to date, year over year change | Jan-Dec | Jan-Sep | Jan-Jun | Jan-Mar | Jan-Dec | Jan-Sep | Jan-Jun | Jan-Mar | ||||||||||||||||||||||||
Reported net sales | 210,838 | 147,029 | 93,219 | 43,411 | — | — | — | — | ||||||||||||||||||||||||
Acquired/divested business | — | — | — | — | — | — | — | — | ||||||||||||||||||||||||
Net FX impact | -4,232 | -683 | 3,065 | 3,328 | — | — | — | — | ||||||||||||||||||||||||
Comparable net sales, excluding FX impact | 206,606 | 146,346 | 96,284 | 46,739 | — | — | — | — | ||||||||||||||||||||||||
Sales growth adjusted for comparable units and currency (%) | 1 | % | -1 | % | -2 | % | -2 | % | — | — | — | — | ||||||||||||||||||||
| 47 Ericsson | Fourth Quarter and Full-Year Report 2018 | Alternative performance measures | |
Items excluding restructuring charges
Gross income, operating expenses, and operating income (loss) are presented excluding restructuring charges and, for certain measures, as a percentage of net sales.
| 2018 | 2017 | |||||||||||||||||||||||||||||||
Isolated quarters, SEK million | Q4 | Q3 | Q2 | Q1 | Q4 | Q3 | Q2 | Q1 | ||||||||||||||||||||||||
Gross income | 16,379 | 19,630 | 17,333 | 14,858 | 12,516 | 13,281 | 14,629 | 7,501 | ||||||||||||||||||||||||
Net sales | 63,809 | 53,810 | 49,808 | 43,411 | 57,881 | 49,413 | 50,281 | 47,803 | ||||||||||||||||||||||||
Gross margin (%) | 25.7 | % | 36.5 | % | 34.8 | % | 34.2 | % | 21.6 | % | 26.9 | % | 29.1 | % | 15.7 | % | ||||||||||||||||
Gross income | 16,379 | 19,630 | 17,333 | 14,858 | 12,516 | 13,281 | 14,629 | 7,501 | ||||||||||||||||||||||||
Restructuring charges included in cost of sales | 4,054 | 204 | 937 | 743 | 2,038 | 817 | 927 | 1,460 | ||||||||||||||||||||||||
Gross income, excluding restructuring charges | 20,433 | 19,834 | 18,270 | 15,601 | 14,554 | 14,098 | 15,556 | 8,961 | ||||||||||||||||||||||||
Net sales | 63,809 | 53,810 | 49,808 | 43,411 | 57,881 | 49,413 | 50,281 | 47,803 | ||||||||||||||||||||||||
Gross margin, excluding restructuring charges (%) | 32.0 | % | 36.9 | % | 36.7 | % | 35.9 | % | 25.1 | % | 28.5 | % | 30.9 | % | 18.7 | % | ||||||||||||||||
Operating expenses | -17,964 | -16,422 | -17,205 | -15,257 | -18,863 | -17,354 | -15,417 | -18,929 | ||||||||||||||||||||||||
Restructuring charges included in R&D expenses | 251 | 214 | 502 | 326 | -147 | 1,896 | 344 | 214 | ||||||||||||||||||||||||
Restructuring charges included in selling and administrative expenses | 106 | 134 | 441 | 103 | 534 | 106 | 243 | 69 | ||||||||||||||||||||||||
Operating expenses, excluding restructuring charges | -17,607 | -16,074 | -16,262 | -14,828 | -18,476 | -15,352 | -14,830 | -18,646 | ||||||||||||||||||||||||
Operating income (loss) | -1,852 | 3,241 | 165 | -312 | -19,278 | -3,652 | -537 | -11,276 | ||||||||||||||||||||||||
Net sales | 63,809 | 53,810 | 49,808 | 43,411 | 57,881 | 49,413 | 50,281 | 47,803 | ||||||||||||||||||||||||
Operating margin (%) | -2.9 | % | 6.0 | % | 0.3 | % | -0.7 | % | -33.3 | % | -7.4 | % | -1.1 | % | -23.6 | % | ||||||||||||||||
Operating income (loss) | -1,852 | 3,241 | 165 | -312 | -19,278 | -3,652 | -537 | -11,276 | ||||||||||||||||||||||||
Total restructuring charges | 4,411 | 552 | 1,880 | 1,172 | 2,425 | 2,819 | 1,514 | 1,743 | ||||||||||||||||||||||||
Operating income (loss), excluding restructuring charges | 2,559 | 3,793 | 2,045 | 860 | -16,853 | -833 | 977 | -9,533 | ||||||||||||||||||||||||
Net sales | 63,809 | 53,810 | 49,808 | 43,411 | 57,881 | 49,413 | 50,281 | 47,803 | ||||||||||||||||||||||||
Operating margin, excluding restructuring charges (%) | 4.0 | % | 7.0 | % | 4.1 | % | 2.0 | % | -29.1 | % | -1.7 | % | 1.9 | % | -19.9 | % | ||||||||||||||||
| 48 Ericsson | Fourth Quarter and Full-Year Report 2018 | Alternative performance measures | |
Items excluding restructuring charges (continued)
| 2018 | 2017 | |||||||||||||||||||||||||||||||
Year to date, SEK million | Jan-Dec | Jan-Sep | Jan-Jun | Jan-Mar | Jan-Dec | Jan-Sep | Jan-Jun | Jan-Mar | ||||||||||||||||||||||||
Gross income | �� | 68,200 | 51,821 | 32,191 | 14,858 | 47,927 | 35,411 | 22,130 | 7,501 | |||||||||||||||||||||||
Net sales | 210,838 | 147,029 | 93,219 | 43,411 | 205,378 | 147,497 | 98,084 | 47,803 | ||||||||||||||||||||||||
Gross margin (%) | 32.3 | % | 35.2 | % | 34.5 | % | 34.2 | % | 23.3 | % | 24.0 | % | 22.6 | % | 15.7 | % | ||||||||||||||||
Gross income | 68,200 | 51,821 | 32,191 | 14,858 | 47,927 | 35,411 | 22,130 | 7,501 | ||||||||||||||||||||||||
Restructuring charges included in cost of sales | 5,938 | 1,884 | 1,680 | 743 | 5,242 | 3,204 | 2,387 | 1,460 | ||||||||||||||||||||||||
Gross income, excluding restructuring charges | 74,138 | 53,705 | 33,871 | 15,601 | 53,169 | 38,615 | 24,517 | 8,961 | ||||||||||||||||||||||||
Net sales | 210,838 | 147,029 | 93,219 | 43,411 | 205,378 | 147,497 | 98,084 | 47,803 | ||||||||||||||||||||||||
Gross margin, excluding restructuring charges (%) | 35.2 | % | 36.5 | % | 36.3 | % | 35.9 | % | 25.9 | % | 26.2 | % | 25.0 | % | 18.7 | % | ||||||||||||||||
Operating expenses | -66,848 | -48,884 | -32,462 | -15,257 | -70,563 | -51,700 | -34,346 | -18,929 | ||||||||||||||||||||||||
Restructuring charges included in R&D expenses | 1,293 | 1,042 | 828 | 326 | 2,307 | 2,454 | 558 | 214 | ||||||||||||||||||||||||
Restructuring charges included in selling and administrative expenses | 784 | 678 | 544 | 103 | 952 | 418 | 312 | 69 | ||||||||||||||||||||||||
Operating expenses, excluding restructuring charges | -64,771 | -47,164 | -31,090 | -14,828 | -67,304 | -48,828 | -33,476 | -18,646 | ||||||||||||||||||||||||
Operating income (loss) | 1,242 | 3,094 | -147 | -312 | -34,743 | -15,465 | -11,813 | -11,276 | ||||||||||||||||||||||||
Net sales | 210,838 | 147,029 | 93,219 | 43,411 | 205,378 | 147,497 | 98,084 | 47,803 | ||||||||||||||||||||||||
Operating margin (%) | 0.6 | % | 2.1 | % | -0.2 | % | -0.7 | % | -16.9 | % | -10.5 | % | -12.0 | % | -23.6 | % | ||||||||||||||||
Operating income (loss) | 1,242 | 3,094 | -147 | -312 | -34,743 | -15,465 | -11,813 | -11,276 | ||||||||||||||||||||||||
Total restructuring charges | 8,015 | 3,604 | 3,052 | 1,172 | 8,501 | 6,076 | 3,257 | 1,743 | ||||||||||||||||||||||||
Operating income (loss), excluding restructuring charges | 9,257 | 6,698 | 2,905 | 860 | -26,242 | -9,389 | -8,556 | -9,533 | ||||||||||||||||||||||||
Net sales | 210,838 | 147,029 | 93,219 | 43,411 | 205,378 | 147,497 | 98,084 | 47,803 | ||||||||||||||||||||||||
Operating margin, excluding restructuring charges (%) | 4.4 | % | 4.6 | % | 3.1 | % | 2.0 | % | -12.8 | % | -6.4 | % | -8.7 | % | -19.9 | % | ||||||||||||||||
| 49 Ericsson | Fourth Quarter and Full-Year Report 2018 | Alternative performance measures | |
Earnings (loss) before interest, taxes, amortization and write-downs of acquired intangibles, also expressed as a percentage of net sales.
| 2018 | 2017 | |||||||||||||||||||||||||||||||
Isolated quarters, SEK million | Q4 | Q3 | Q2 | Q1 | Q4 | Q3 | Q2 | Q1 | ||||||||||||||||||||||||
Net income (loss) | -6,497 | 2,748 | -1,802 | -725 | -18,493 | -3,457 | -457 | -10,026 | ||||||||||||||||||||||||
Taxes | 3,930 | -146 | 1,157 | -128 | -1,303 | -516 | -24 | -1,682 | ||||||||||||||||||||||||
Financial income and expenses | 715 | 639 | 810 | 541 | 518 | 321 | -56 | 432 | ||||||||||||||||||||||||
Amortization and write-downs of acquired intangibles | 621 | 344 | 350 | 347 | 13,953 | 379 | 445 | 1,875 | ||||||||||||||||||||||||
EBITA | -1,231 | 3,585 | 515 | 35 | -5,325 | -3,273 | -92 | -9,401 | ||||||||||||||||||||||||
Net sales | 63,809 | 53,810 | 49,808 | 43,411 | 57,881 | 49,413 | 50,281 | 47,803 | ||||||||||||||||||||||||
EBITA margin (%) | -1.9 | % | 6.7 | % | 1.0 | % | 0.1 | % | -9.2 | % | -6.6 | % | -0.2 | % | -19.7 | % | ||||||||||||||||
| 2018 | 2017 | |||||||||||||||||||||||||||||||
Year to date, SEK million | Jan-Dec | Jan-Sep | Jan-Jun | Jan-Mar | Jan-Dec | Jan-Sep | Jan-Jun | Jan-Mar | ||||||||||||||||||||||||
Net income (loss) | -6,276 | 221 | -2,527 | -725 | -32,433 | -13,940 | -10,483 | -10,026 | ||||||||||||||||||||||||
Taxes | 4,813 | 883 | 1,029 | -128 | -3,525 | -2,222 | -1,706 | -1,682 | ||||||||||||||||||||||||
Financial income and expenses | 2,705 | 1,990 | 1,351 | 541 | 1,215 | 697 | 376 | 432 | ||||||||||||||||||||||||
Amortization and write-downs of acquired intangibles | 1,662 | 1,041 | 697 | 347 | 16,652 | 2,699 | 2,320 | 1,875 | ||||||||||||||||||||||||
EBITA | 2,904 | 4,135 | 550 | 35 | -18,091 | -12,766 | -9,493 | -9,401 | ||||||||||||||||||||||||
Net sales | 210,838 | 147,029 | 93,219 | 43,411 | 205,378 | 147,497 | 98,084 | 47,803 | ||||||||||||||||||||||||
EBITA margin (%) | 1.4 | % | 2.8 | % | 0.6 | % | 0.1 | % | -8.8 | % | -8.7 | % | -9.7 | % | -19.7 | % | ||||||||||||||||
Cash flow from operating activities divided by the sum of net income (loss) and adjustments to reconcile net income to cash, expressed as a percentage.
| 2018 | 2017 | |||||||||||||||||||||||||||||||
Isolated quarters, SEK million | Q4 | Q3 | Q2 | Q1 | Q4 | Q3 | Q2 | Q1 | ||||||||||||||||||||||||
Net income (loss) | -6,497 | 2,748 | -1,802 | -725 | -18,493 | -3,457 | -457 | -10,026 | ||||||||||||||||||||||||
Net income reconciled to cash | -98 | 2,916 | -259 | -1,005 | -4,001 | -779 | -142 | -8,187 | ||||||||||||||||||||||||
Cash flow from operating activities | 4,287 | 2,040 | 1,442 | 1,573 | 11,159 | -18 | 1 | -1,541 | ||||||||||||||||||||||||
Cash conversion (%) | -4374.5 | % | 70.0 | % | -556.8 | % | -156.5 | % | -278.9 | % | 2.3 | % | -0.7 | % | 18.8 | % | ||||||||||||||||
| 2018 | 2017 | |||||||||||||||||||||||||||||||
Year to date, SEK million | Jan-Dec | Jan-Sep | Jan-Jun | Jan-Mar | Jan-Dec | Jan-Sep | Jan-Jun | Jan-Mar | ||||||||||||||||||||||||
Net income (loss) | -6,276 | 221 | -2,527 | -725 | -32,433 | -13,940 | -10,483 | -10,026 | ||||||||||||||||||||||||
Net income reconciled to cash | 1,554 | 1,652 | -1,264 | -1,005 | -13,109 | -9,108 | -8,329 | -8,187 | ||||||||||||||||||||||||
Cash flow from operating activities | 9,342 | 5,055 | 3,015 | 1,573 | 9,601 | -1,558 | -1,540 | -1,541 | ||||||||||||||||||||||||
Cash conversion (%) | 601.2 | % | 306.0 | % | -238.5 | % | -156.5 | % | -73.2 | % | 17.1 | % | 18.5 | % | 18.8 | % | ||||||||||||||||
Gross cash and net cash, end of period
Gross cash: Cash and cash equivalents plus interest-bearing securities (current andnon-current).
Net cash: Cash and cash equivalents plus interest-bearing securities (current andnon-current) less interest-bearing liabilities (which include:non-current borrowings and current borrowings).
| 2018 | 2017 | |||||||||||||||||||||||||||||||
SEK million | Q4 | Q3 | Q2 | Q1 | Q4 | Q3 | Q2 | Q1 | ||||||||||||||||||||||||
Cash and cash equivalents | 38,389 | 36,058 | 37,049 | 36,697 | 35,884 | 26,210 | 21,446 | 32,954 | ||||||||||||||||||||||||
+ Interest-bearing securities, current | 6,625 | 6,591 | 8,304 | 5,453 | 6,713 | 6,526 | 10,754 | 13,548 | ||||||||||||||||||||||||
+ Interest-bearing securities,non-current | 23,982 | 23,014 | 21,501 | 27,104 | 25,105 | 22,405 | 22,122 | 19,124 | ||||||||||||||||||||||||
Gross cash, end of period | 68,996 | 65,663 | 66,854 | 69,254 | 67,702 | 55,141 | 54,322 | 65,626 | ||||||||||||||||||||||||
- Borrowings, current | 2,255 | 2,463 | 2,642 | 2,554 | 2,545 | 3,004 | 3,230 | 9,514 | ||||||||||||||||||||||||
- Borrowings,non-current | 30,870 | 31,187 | 31,131 | 31,134 | 30,500 | 28,039 | 27,100 | 27,823 | ||||||||||||||||||||||||
Net cash, end of period | 35,871 | 32,013 | 33,081 | 35,566 | 34,657 | 24,098 | 23,992 | 28,289 | ||||||||||||||||||||||||
| 50 Ericsson | Fourth Quarter and Full-Year Report 2018 | Alternative performance measures | |
Total assets lessnon-interest-bearing provisions and liabilities.
| 2018 | 2017 | |||||||||||||||||||||||||||||||
SEK million | Q4 | Q3 | Q2 | Q1 | Q4 | Q3 | Q2 | Q1 | ||||||||||||||||||||||||
Total assets | 268,761 | 264,848 | 265,322 | 260,681 | 259,882 | 267,239 | 275,160 | 291,976 | ||||||||||||||||||||||||
|
|
|
|
|
|
|
|
|
|
|
|
|
|
|
| |||||||||||||||||
Non-interest-bearing provisions and liabilities | ||||||||||||||||||||||||||||||||
Provisions,non-current | 5,471 | 3,420 | 2,819 | 2,597 | 3,596 | 3,930 | 4,794 | 4,867 | ||||||||||||||||||||||||
Deferred tax liabilities | 670 | 1,274 | 1,332 | 1,325 | 901 | 1,736 | 1,838 | 1,888 | ||||||||||||||||||||||||
Othernon-current liabilities | 4,346 | 4,456 | 4,549 | 2,792 | 2,776 | 2,563 | 2,602 | 2,699 | ||||||||||||||||||||||||
Provisions, current | 10,537 | 5,275 | 6,715 | 6,435 | 6,283 | 5,584 | 5,563 | 5,647 | ||||||||||||||||||||||||
Contract liabilities | 29,348 | 30,108 | 30,959 | 30,391 | 29,076 | 26,185 | 28,657 | 29,930 | ||||||||||||||||||||||||
Trade payables | 29,883 | 28,914 | 28,563 | 26,453 | 26,320 | 23,559 | 25,266 | 26,077 | ||||||||||||||||||||||||
Other current liabilities | 38,891 | 36,323 | 35,746 | 37,888 | 35,305 | 33,395 | 32,599 | 37,323 | ||||||||||||||||||||||||
Capital employed | 149,615 | 155,078 | 154,639 | 152,800 | 155,625 | 170,287 | 173,841 | 183,545 | ||||||||||||||||||||||||
Annualized net sales divided by average capital employed.
| 2018 | 2017 | |||||||||||||||||||||||||||||||
Isolated quarters, SEK million | Q4 | Q3 | Q2 | Q1 | Q4 | Q3 | Q2 | Q1 | ||||||||||||||||||||||||
Net sales | 63,809 | 53,810 | �� | 49,808 | 43,411 | 57,881 | 49,413 | 50,281 | 47,803 | |||||||||||||||||||||||
Annualized net sales | 255,236 | 215,240 | 199,232 | 173,644 | 231,524 | 197,652 | 201,124 | 191,212 | ||||||||||||||||||||||||
Average capital employed | ||||||||||||||||||||||||||||||||
Capital employed at beginning of period | 155,078 | 154,639 | 152,800 | 155,625 | 170,287 | 173,841 | 183,545 | 185,667 | ||||||||||||||||||||||||
Capital employed at end of period | 149,615 | 155,078 | 154,639 | 152,800 | 155,625 | 170,287 | 173,841 | 183,545 | ||||||||||||||||||||||||
Average capital employed | 152,347 | 154,859 | 153,720 | 154,213 | 162,956 | 172,064 | 178,693 | 184,606 | ||||||||||||||||||||||||
Capital turnover (times) | 1.7 | 1.4 | 1.3 | 1.1 | 1.4 | 1.1 | 1.1 | 1.0 | ||||||||||||||||||||||||
| 2018 | 2017 | |||||||||||||||||||||||||||||||
Year to date, SEK million | Jan-Dec | Jan-Sep | Jan-Jun | Jan-Mar | Jan-Dec | Jan-Sep | Jan-Jun | Jan-Mar | ||||||||||||||||||||||||
Net sales | 210,838 | 147,029 | 93,219 | 43,411 | 205,378 | 147,497 | 98,084 | 47,803 | ||||||||||||||||||||||||
Annualized net sales | 210,838 | 196,039 | 186,438 | 173,644 | 205,378 | 196,663 | 196,168 | 191,212 | ||||||||||||||||||||||||
Average capital employed | ||||||||||||||||||||||||||||||||
Capital employed at beginning of period | 155,625 | 155,625 | 155,625 | 155,625 | 185,667 | 185,667 | 185,667 | 185,667 | ||||||||||||||||||||||||
Capital employed at end of period | 149,615 | 155,078 | 154,639 | 152,800 | 155,625 | 170,287 | 173,841 | 183,545 | ||||||||||||||||||||||||
Average capital employed | 152,620 | 155,352 | 155,132 | 154,213 | 170,646 | 177,977 | 179,754 | 184,606 | ||||||||||||||||||||||||
Capital turnover (times) | 1.4 | 1.3 | 1.2 | 1.1 | 1.2 | 1.1 | 1.1 | 1.0 | ||||||||||||||||||||||||
| 51 Ericsson | Fourth Quarter and Full-Year Report 2018 | Alternative performance measures | |
The annualized total of operating income (loss) plus financial income as a percentage of average capital employed.
| 2018 | 2017 | |||||||||||||||||||||||||||||||
Isolated quarters, SEK million | Q4 | Q3 | Q2 | Q1 | Q4 | Q3 | Q2 | Q1 | ||||||||||||||||||||||||
Operating income (loss) | -1,852 | 3,241 | 165 | -312 | -19,278 | -3,652 | -537 | -11,276 | ||||||||||||||||||||||||
Financial income | -294 | -225 | 275 | -72 | -124 | -139 | -27 | -82 | ||||||||||||||||||||||||
Annualized operating income (loss) + financial income | -8,584 | 12,064 | 1,760 | -1,536 | -77,608 | -15,164 | -2,256 | -45,432 | ||||||||||||||||||||||||
Average capital employed | ||||||||||||||||||||||||||||||||
Capital employed at beginning of period | 155,078 | 154,639 | 152,800 | 155,625 | 170,287 | 173,841 | 183,545 | 185,667 | ||||||||||||||||||||||||
Capital employed at end of period | 149,615 | 155,078 | 154,639 | 152,800 | 155,625 | 170,287 | 173,841 | 183,545 | ||||||||||||||||||||||||
Average capital employed | 152,347 | 154,859 | 153,720 | 154,213 | 162,956 | 172,064 | 178,693 | 184,606 | ||||||||||||||||||||||||
Return on capital employed (%) | -5.6 | % | 7.8 | % | 1.1 | % | -1.0 | % | -47.6 | % | -8.8 | % | -1.3 | % | -24.6 | % | ||||||||||||||||
| 2018 | 2017 | |||||||||||||||||||||||||||||||
Year to date, SEK million | Jan-Dec | Jan-Sep | Jan-Jun | Jan-Mar | Jan-Dec | Jan-Sep | Jan-Jun | Jan-Mar | ||||||||||||||||||||||||
Operating income (loss) | 1,242 | 3,094 | -147 | -312 | -34,743 | -15,465 | -11,813 | -11,276 | ||||||||||||||||||||||||
Financial income | -316 | -22 | 203 | -72 | -372 | -248 | -109 | -82 | ||||||||||||||||||||||||
Annualized operating income (loss) + financial income | 926 | 4,096 | 112 | -1,536 | -35,115 | -20,951 | -23,844 | -45,432 | ||||||||||||||||||||||||
Average capital employed | ||||||||||||||||||||||||||||||||
Capital employed at beginning of period | 155,625 | 155,625 | 155,625 | 155,625 | 185,667 | 185,667 | 185,667 | 185,667 | ||||||||||||||||||||||||
Capital employed at end of period | 149,615 | 155,078 | 154,639 | 152,800 | 155,625 | 170,287 | 173,841 | 183,545 | ||||||||||||||||||||||||
Average capital employed | 152,620 | 155,352 | 155,132 | 154,213 | 170,646 | 177,977 | 179,754 | 184,606 | ||||||||||||||||||||||||
Return on capital employed (%) | 0.6 | % | 2.6 | % | 0.1 | % | -1.0 | % | -20.6 | % | -11.8 | % | -13.3 | % | -24.6 | % | ||||||||||||||||
Equity, expressed as a percentage of total assets.
| 2018 | 2017 | |||||||||||||||||||||||||||||||
SEK million | Q4 | Q3 | Q2 | Q1 | Q4 | Q3 | Q2 | Q1 | ||||||||||||||||||||||||
Total equity | 87,770 | 95,953 | 93,560 | 93,466 | 97,571 | 112,710 | 119,887 | 122,434 | ||||||||||||||||||||||||
Total assets | 268,761 | 264,848 | 265,322 | 260,681 | 259,882 | 267,239 | 275,160 | 291,976 | ||||||||||||||||||||||||
Equity ratio (%) | 32.7 | % | 36.2 | % | 35.3 | % | 35.9 | % | 37.5 | % | 42.2 | % | 43.6 | % | 41.9 | % | ||||||||||||||||
Annualized net income (loss) attributable to stockholders of the Parent Company as a percentage of average Stockholders’ equity.
| 2018 | 2017 | |||||||||||||||||||||||||||||||
Isolated quarters, SEK million | Q4 | Q3 | Q2 | Q1 | Q4 | Q3 | Q2 | Q1 | ||||||||||||||||||||||||
Net income (loss) attributable to stockholders of the parent company | -6,553 | 2,745 | -1,885 | -837 | -18,476 | -3,561 | -471 | -10,068 | ||||||||||||||||||||||||
Annualized | -26,212 | 10,980 | -7,540 | -3,348 | -73,904 | -14,244 | -1,884 | -40,272 | ||||||||||||||||||||||||
Average stockholders’ equity | ||||||||||||||||||||||||||||||||
Stockholders’ equity, beginning of period | 95,087 | 92,689 | 92,703 | 96,935 | 112,095 | 119,177 | 121,698 | 134,582 | ||||||||||||||||||||||||
Stockholders’ equity, end of period | 86,978 | 95,087 | 92,689 | 92,703 | 96,935 | 112,095 | 119,177 | 121,698 | ||||||||||||||||||||||||
Average stockholders’ equity | 91,033 | 93,888 | 92,696 | 94,819 | 104,515 | 115,636 | 120,438 | 128,140 | ||||||||||||||||||||||||
Return on equity (%) | -28.8 | % | 11.7 | % | -8.1 | % | -3.5 | % | -70.7 | % | -12.3 | % | -1.6 | % | -31.4 | % | ||||||||||||||||
| 2018 | 2017 | |||||||||||||||||||||||||||||||
Year to date, SEK million | Jan-Dec | Jan-Sep | Jan-Jun | Jan-Mar | Jan-Dec | Jan-Sep | Jan-Jun | Jan-Mar | ||||||||||||||||||||||||
Net income (loss) attributable to stockholders of the parent company | -6,530 | 23 | -2,722 | -837 | -32,576 | -14,100 | -10,539 | -10,068 | ||||||||||||||||||||||||
Annualized | -6,530 | 31 | -5,444 | -3,348 | -32,576 | -18,800 | -21,078 | -40,272 | ||||||||||||||||||||||||
Average stockholders’ equity | ||||||||||||||||||||||||||||||||
Stockholders’ equity, beginning of period | 96,935 | 96,935 | 96,935 | 96,935 | 134,582 | 134,582 | 134,582 | 134,582 | ||||||||||||||||||||||||
Stockholders’ equity, end of period | 86,978 | 95,087 | 92,689 | 92,703 | 96,935 | 112,095 | 119,177 | 121,698 | ||||||||||||||||||||||||
Average stockholders’ equity | 91,957 | 96,011 | 94,812 | 94,819 | 115,759 | 123,339 | 126,880 | 128,140 | ||||||||||||||||||||||||
Return on equity (%) | -7.1 | % | 0.0 | % | -5.7 | % | -3.5 | % | -28.1 | % | -15.2 | % | -16.6 | % | -31.4 | % | ||||||||||||||||
| 52 Ericsson | Fourth Quarter and Full-Year Report 2018 | Alternative performance measures | |
Earnings (loss) per share (non-IFRS)
Earnings (loss) per share, diluted, excluding amortizations and write-down of acquired intangible assets and excluding restructuring charges.
| 2018 | 2017 | |||||||||||||||||||||||||||||||
Isolated quarters, SEK | Q4 | Q3 | Q2 | Q1 | Q4 | Q3 | Q2 | Q1 | ||||||||||||||||||||||||
Earnings (loss) per share, diluted | -1.99 | 0.83 | -0.58 | -0.25 | -5.63 | -1.09 | -0.14 | -3.08 | ||||||||||||||||||||||||
Restructuring charges | 1.06 | 0.12 | 0.41 | 0.30 | 0.37 | 0.73 | 0.38 | 0.46 | ||||||||||||||||||||||||
Amortization and write-downs of acquired intangibles | 0.16 | 0.08 | 0.08 | 0.06 | 4.17 | 0.07 | 0.09 | 0.43 | ||||||||||||||||||||||||
Earnings (loss) per share (non-IFRS) | -0.77 | 1.03 | -0.09 | 0.11 | -1.09 | -0.29 | 0.33 | -2.19 | ||||||||||||||||||||||||
| 2018 | 2017 | |||||||||||||||||||||||||||||||
Year to date, SEK | Jan-Dec | Jan-Sep | Jan-Jun | Jan-Mar | Jan-Dec | Jan-Sep | Jan-Jun | Jan-Mar | ||||||||||||||||||||||||
Earnings (loss) per share, diluted | -1.98 | 0.01 | -0.83 | -0.25 | -9.94 | -4.31 | -3.22 | -3.08 | ||||||||||||||||||||||||
Restructuring charges | 1.88 | 0.82 | 0.71 | 0.30 | 1.93 | 1.57 | 0.84 | 0.46 | ||||||||||||||||||||||||
Amortization and write-downs of acquired intangibles | 0.37 | 0.21 | 0.14 | 0.06 | 4.77 | 0.59 | 0.52 | 0.43 | ||||||||||||||||||||||||
Earnings (loss) per share (non-IFRS) | 0.27 | 1.04 | 0.02 | 0.11 | -3.24 | -2.15 | -1.86 | -2.19 | ||||||||||||||||||||||||
Free cash flow and free cash flow excluding M&A
Free cash flow: Cash flow from operating activities less net capital expenditures and other investments.
Free cash flow excluding M&A: Cash flow from operating activities less net capital expenditures and other investments (excluding M&A).
| 2018 | 2017 | |||||||||||||||||||||||||||||||
Isolated quarters, SEK million | Q4 | Q3 | Q2 | Q1 | Q4 | Q3 | Q2 | Q1 | ||||||||||||||||||||||||
Cash flow from operating activities | 4,287 | 2,040 | 1,442 | 1,573 | 11,159 | -18 | 1 | -1,541 | ||||||||||||||||||||||||
Net capital expenditures and other investments (excluding M&A) | ||||||||||||||||||||||||||||||||
Investments in property, plant and equipment | -1,080 | -1,088 | -951 | -856 | -1,105 | -739 | -1,018 | -1,015 | ||||||||||||||||||||||||
Sales of property, plant and equipment | 57 | 102 | 52 | 123 | 898 | 12 | 37 | 69 | ||||||||||||||||||||||||
Product development | -195 | -151 | -325 | -254 | -138 | -126 | -315 | -865 | ||||||||||||||||||||||||
Other investing activities | -96 | -190 | -398 | 161 | -573 | 42 | -42 | 110 | ||||||||||||||||||||||||
Free cash flow excluding M&A | 2,973 | 713 | -180 | 747 | 10,241 | -829 | -1,337 | -3,242 | ||||||||||||||||||||||||
Acquisitions/divestments of subsidiaries and other operations, net | 20 | -425 | -431 | -449 | -107 | 371 | 9 | 3 | ||||||||||||||||||||||||
Free cash flow | 2,993 | 288 | -611 | 298 | 10,134 | -458 | -1,328 | -3,239 | ||||||||||||||||||||||||
| 2018 | 2017 | |||||||||||||||||||||||||||||||
Year to date, SEK million | Jan-Dec | Jan-Sep | Jan-Jun | Jan-Mar | Jan-Dec | Jan-Sep | Jan-Jun | Jan-Mar | ||||||||||||||||||||||||
Cash flow from operating activities | 9,342 | 5,055 | 3,015 | 1,573 | 9,601 | -1,558 | -1,540 | -1,541 | ||||||||||||||||||||||||
Net capital expenditures and other investments (excluding M&A) | ||||||||||||||||||||||||||||||||
Investments in property, plant and equipment | -3,975 | -2,895 | -1,807 | -856 | -3,877 | -2,772 | -2,033 | -1,015 | ||||||||||||||||||||||||
Sales of property, plant and equipment | 334 | 277 | 175 | 123 | 1,016 | 118 | 106 | 69 | ||||||||||||||||||||||||
Product development | -925 | -730 | -579 | -254 | -1,444 | -1,306 | -1,180 | -865 | ||||||||||||||||||||||||
Other investing activities | -523 | -427 | -237 | 161 | -463 | 110 | 68 | 110 | ||||||||||||||||||||||||
Free cash flow excluding M&A | 4,253 | 1,280 | 567 | 747 | 4,833 | -5,408 | -4,579 | -3,242 | ||||||||||||||||||||||||
Acquisitions/divestments of subsidiaries and other operations, net | -1,285 | -1,305 | -880 | -449 | 276 | 383 | 12 | 3 | ||||||||||||||||||||||||
Free cash flow | 2,968 | -25 | -313 | 298 | 5,109 | -5,025 | -4,567 | -3,239 | ||||||||||||||||||||||||
| 53 Ericsson | Fourth Quarter and Full-Year Report 2018 | Alternative performance measures | |