SECURITIES AND EXCHANGE COMMISSION
Washington, D.C. 20549
FORM6-K
REPORT OF FOREIGN ISSUER
Pursuant to Rule 13a-16 or 15d-16 of
the Securities Exchange Act of 1934
April 17, 2019
Commission File Number000-12033
LM ERICSSON TELEPHONE COMPANY
(Translation of registrant’s name into English)
Torshamnsgatan 21, Kista
SE-164 83,Stockholm, Sweden
(Address of principal executive offices)
Indicate by check mark whether the registrant files or will file annual reports under cover Form20-F or Form40-F. Form20-F ☒Form40-F ☐
Indicate by check mark if the registrant is submitting the Form6-K in paper as permitted by RegulationS-T Rule 101(b)(1): ☐
Indicate by check mark if the registrant is submitting the Form6-K in paper as permitted by RegulationS-T Rule 101(b)(7): ☐
Announcement of LM Ericsson Telephone Company, April 17, 2019 regarding “First quarter report 2019”.
SIGNATURES
Pursuant to the requirements of the Securities Exchange Act of 1934, the registrant has duly caused this report to be signed on its behalf by the undersigned, thereunto duly authorized.
| TELEFONAKTIEBOLAGET LM ERICSSON (publ) | ||
| By: | /s/ XAVIER DEDULLEN | |
| Xavier Dedullen | ||
| Senior Vice President, Chief Legal Officer | ||
| By: | /s/ CARL MELLANDER | |
| Carl Mellander | ||
| Senior Vice President, Chief Financial Officer | ||
Date:April 17, 2019

First quarter report 2019
Stockholm, April 17, 2019
First quarter highlights
| • | Sales were SEK 48.9 (43.4) b. Sales adjusted for comparable units and currency increased by 7% driven by strong growth in North America. Reported sales grew by 13%. |
| • | Gross margin was 38.4% (34.2%) driven by improvements in Networks and Managed Services. |
| • | Operating income was SEK 4.9(-0.3) b. and operating margin was 10.0%(-0.7%). Operating income, excluding restructuring charges of SEK-0.2 b. and certain positivenon-recurrent items1)of SEK 1.6 b. was SEK 3.5 b., which equals to an operating margin of 7.2%. |
| • | Net income improved to SEK 2.4(-0.7) b. |
| • | Free cash flow excluding M&A was SEK 4.1 (0.7) b. Net cash amounted to SEK 36.1 (35.6) b. |
| • | 51% of MediaKind was divested February 1, 2019. The acquisition of antenna and filter assets from Kathrein is expected to close Q3. |
SEK b. | Q1 2019 | Q1 2018 | YoY change | Q4 2018 | QoQ change | |||||||||||||||
Net sales | 48.9 | 43.4 | 13 | % | 63.8 | -23 | % | |||||||||||||
Sales growth adj. for comparable units and currency | — | — | 7 | % | — | — | ||||||||||||||
Gross margin | 38.4 | % | 34.2 | % | — | 25.7 | % | — | ||||||||||||
Operating income (loss) | 4.9 | -0.3 | — | -1.9 | — | |||||||||||||||
Operating margin | 10.0 | % | -0.7 | % | — | -2.9 | % | — | ||||||||||||
Net income (loss) | 2.4 | -0.7 | — | -6.5 | — | |||||||||||||||
EPS diluted SEK | 0.70 | -0.25 | — | -1.99 | — | |||||||||||||||
EPS(non-IFRS) SEK 2) | 0.80 | 0.11 | — | -0.77 | — | |||||||||||||||
Free cash flow excluding M&A | 4.1 | 0.7 | — | 3.0 | 37 | % | ||||||||||||||
Net cash. end of period | 36.1 | 35.6 | 2 | % | 35.9 | 1 | % | |||||||||||||
Gross margin excluding restructuring charges | 38.5 | % | 35.9 | % | — | 32.0 | % | — | ||||||||||||
Operating income (loss) excluding restructuring charges | 5.1 | 0.9 | — | 2.6 | 99 | % | ||||||||||||||
Operating margin excluding restructuring charges | 10.4 | % | 2.0 | % | — | 4.0 | % | — | ||||||||||||
| 1) | Certainnon-recurrent items are; a capital gain related to the divestment of 51% of MediaKind (SEK 0.7 b.), divestment of certain assets in Red Bee Media (SEK 0.1 b.) and a reversal of an earlier provision for impairment of trade receivables following customer payment (SEK 0.7 b.) |
| 2) | EPS diluted, excl. amortizations and write-downs of acquired intangible assets, and excluding restructuring charges. Potential ordinary shares are not considered when their conversion to ordinary shares would increase earnings per share. |
Non-IFRS financial measures are reconciled to the most directly reconcilable line items in the financial statements at the end of this report.
| 1 Ericsson | First Quarter Report 2019 | ||
CEO comments
For the third consecutive quarter we showed organic sales growth1), this quarter by 7%. Growth was mainly driven by North America. Our strategy, to work with lead customers in lead markets, is generating both 5G business andhands-on experience in 5G rollout and commercialization. To date we have publicly announced commercial 5G deals with 18 named operator customers, which, at the moment, is more than any other vendor.
5G services, including mobility, have been launched in South Korea and North America. While Switzerland has released spectrum allowing Swisscom to offer commercial 5G services, using our equipment, the development in other parts of Europe is considerably slower primarily due to lack of spectrum, poor investment climate and additional uncertainties related to future vendor market access.
Gross margin2) improved to 38.5% (35.9%) YoY, driven by improvements in segments Networks and Managed Services, and also by the recently signed patent license agreement with OPPO.
Segment Networks had a strong quarter with an organic sales growth1) of 10% YoY, driven by increased investments in North America. Networks gross margin2) improved to 43.2% (40.4%) YoY, mainly due to higher hardware capacity sales and IPR revenues. In the quarter we announced our intent to acquire the German company Kathrein’s antenna and filters business. This will further expand our capabilities in the advanced active and passive antenna domains, which are growing in importance as 5G evolves.
In Managed Services, sales fell organically1) by-5% due to headwind from contract exits. In the quarter, our Operations Engine was launched with good response from our customers. Gross margin2) improved to 17.7% (9.1%) YoY, supported by efficiency gains and customer contract reviews. Excluding anon-recurrent positive effectof SEK 0.7 b. from a customer settlement, the operating margin2) was 8.6%, exceeding the higher range of our financial target for 2020.
Organic sales1) in Digital Services were stable YoY. We continue to see a good business momentum for the new portfolio of5G-ready and cloud-native products, with many important contract wins in the quarter. Gross margin excluding restructuring charges and the BSS provision in Q4 20183) was stable QoQ and operating income2) improved YoY driven by reductions in operating expenses. Gross margin2) declined YoY as Q1 2018 was supported by a favorable business mix. We continue to execute on our plan to turn the Digital Services business around. Implementation of the revised BSS strategy, announced in January 2019, is progressing well.
Organic sales growth1) in segment Emerging Business and Other was 38% YoY driven by growth in iconectiv. Gross margin2) was stable YoY. In the quarter 51% of MediaKind was divested, generating a gain of SEK 0.7 b. In segment Emerging Business and Other we invest in initiatives that aim to scale and help create future business for Ericsson. With the exception of iconectiv, the portfolio is still in an early phase. We are also incurring extra costs as we restructure some of the older innovation investments.
Driven by improved earnings, free cash flow excluding M&A amounted to SEK 4.1 (0.7) b. in the quarter and with a strong cash position we are well positioned to grow the company in a profitable way.
As previously disclosed, we have been voluntarily cooperating since 2013 with an investigation by the United States Securities and Exchange Commission (SEC) and, since 2015, with an investigation by the United States Department of Justice (DOJ) into Ericsson’s compliance with the U.S. Foreign Corrupt Practices Act (FCPA). We continue to cooperate with the SEC and the DOJ, and have recently begun settlement discussions. These discussions are in a very early stage and therefore we are not able to estimate their length. Further, as this is an ongoing legal matter we cannot provide any detail. However, based on the current status of the discussions it is our assessment that the resolution of these matters will result in material financial and other measures, the magnitude and impact of which cannot be reliably estimated or ascertained at this time.
As previously communicated, we continue to take strategic contracts and incur costs for 5G field trials and, in addition, by end of 2019 we expect large-scale deployments of 5G to commence in parts of Asia. Combined, this will gradually impact short-term margins but strengthen our position in the long term. The impact of strategic contracts and 5G field trials was limited in Q1. The 5G market is gaining momentum and we are well positioned to capture opportunities. We will continue to make substantial investments in R&D, especially in 5G, automation and AI. This is a key part of our focused strategy to strengthen our long-term business and path to reaching our targets for 2020 and 2022.
Börje Ekholm
President and CEO
| 1) | Organic sales growth: Sales growth adjusted for comparable units and currency |
| 2) | Excluding restructuring charges |
| 3) | BSS (Business Support Systems) provision in Q4 2018 was SEK 5.9 b. |
Planning assumptions going forward
Market related
| • | The Radio Access Network (RAN) equipment market is estimated to increase by 3% for full-year 2019 with 2% CAGR for 2018-2023. (Source: Dell’Oro.) |
Ericsson related
Net sales
| • | Two-year average sales seasonality between Q1 and Q2 is 10%. However, the current sales level in North America is expected to remain, leading to lower effects from seasonality between quarters than normally throughout 2019. |
| • | The revenues for current IPR licensing contract portfolio is approximately SEK 9 b. on an annual basis. |
Gross margin
| • | Strategic contracts in Networks, with initially low margins, taken to strengthen the market position, will have a negative impact on gross margins without jeopardizing the 2020 target. The impact was limited in the quarter but is expected to start to impact gross margin in Q2. |
| • | Large 5G deployments in parts of Asia are expected to commence at the end of 2019 and will impact gross margin negatively in the short term. |
| • | The share of services sales in North America is expected to gradually increase, impacting gross margin negatively. |
Operating expenses
| • | Operating expenses typically increase between Q1 and Q2 due to seasonality. |
| • | Costs for 5G field trials will impact SG&A and will increase in the next few quarters. |
| • | Networks R&D expenses are expected to flatten out. |
Restructuring charges and Tax
| • | Restructuring charges for full-year 2019 are estimated to be SEK -3 to -5 b. |
| • | Tax rate in Q1 2019 was 44%. The rate is a result of forecasted geographical distribution of profits for full-year 2019. |
Currency exposure
| • | Rule of thumb: A change by 10% of USD to SEK would have an impact of approximately +/-5% on net sales and approximately +/-1 percentage point |
| 2 Ericsson | First Quarter Report 2019 | CEO comments | |
Financial highlights
SEK b. | Q1 2019 | Q1 2018 | YoY change | Q4 2018 | QoQ change | |||||||||||||||
Net sales | 48.9 | 43.4 | 13 | % | 63.8 | -23 | % | |||||||||||||
Sales growth adj. for comparable units and currency | — | — | 7 | % | — | — | ||||||||||||||
Gross income | 18.8 | 14.9 | 26 | % | 16.4 | 15 | % | |||||||||||||
Gross margin (%) | 38.4 | % | 34.2 | % | — | 25.7 | % | — | ||||||||||||
Research and development (R&D) expenses | -9.2 | -9.1 | 1 | % | -10.7 | — | ||||||||||||||
Selling and administrative expenses | -6.0 | -6.2 | — | -7.7 | — | |||||||||||||||
Impairment losses on trade receivables | 0.6 | 0.0 | — | 0.4 | 45 | % | ||||||||||||||
Other operating income and expenses | 0.8 | 0.1 | — | -0.3 | — | |||||||||||||||
Operating income (loss) | 4.9 | -0.3 | — | -1.9 | — | |||||||||||||||
Operating margin (%) | 10.0 | % | -0.7 | % | — | -2.9 | % | — | ||||||||||||
Financial net | -0.6 | -0.5 | 12 | % | -0.7 | -15 | % | |||||||||||||
Taxes | -1.9 | 0.1 | — | -3.9 | -52 | % | ||||||||||||||
Net income (loss) | 2.4 | -0.7 | — | -6.5 | — | |||||||||||||||
Restructuring charges | -0.2 | -1.2 | — | -4.4 | — | |||||||||||||||
Gross income excluding restructuring charges | 18.8 | 15.6 | 21 | % | 20.4 | -8 | % | |||||||||||||
Gross margin excluding restructuring charges | 38.5 | % | 35.9 | % | — | 32.0 | % | — | ||||||||||||
R&D expenses excluding restructuring charges | -9.0 | -8.7 | 3 | % | -10.4 | -13 | % | |||||||||||||
SG&A expenses excluding restructuring charges | -6.0 | -6.1 | — | -7.6 | — | |||||||||||||||
Operating income (loss) excl. restructuring charges | 5.1 | 0.9 | — | 2.6 | 99 | % | ||||||||||||||
Operating margin excluding restructuring charges | 10.4 | % | 2.0 | % | — | 4.0 | % | — | ||||||||||||
Net sales
Sales adjusted for comparable units and currency increased by 7% YoY, driven by growth in Networks. Networks sales adjusted for comparable units and currency increased by 10% YoY, with strong sales growth in North America and in North East Asia. Digital Services sales adjusted for comparable units and currency were flat YoY. Managed Services sales adjusted for comparable units and currency declined by-5% YoY, as a result of exited contracts. Sales adjusted for comparable units and currency in Emerging Business and Other increased by 38% YoY, driven by iconectiv.
Reported sales for the Group increased by 13% YoY.
Sequentially, sales as well as sales adjusted for comparable units and currency declined following a seasonally strong Q4.
IPR licensing revenues
IPR licensing revenues increased to SEK 2.5 (1.9) b. YoY and sequentially from SEK 2.1 b. The YoY increase was mainly due to new contracts signed and currency effects from a stronger USD versus SEK.
Gross margin
Gross margin increased to 38.4% (34.2%). Gross margin excluding restructuring charges increased to 38.5% (35.9%), driven mainly by improvements in Networks and Managed Services. Higher IPR licensing revenues and progress in customer contract reviews in Managed Services had a positive impact on gross margin YoY.
Sequentially, gross margin increased to 38.4% from 25.7%. Gross margin excluding restructuring charges increased to 38.5% from 32.0%, with improvements in all segments.
Operating expenses
R&D expenses increased to SEK-9.2(-9.1) b. mainly due to currency effects. R&D expenses increased in both Networks and Managed Services while it decreased in Digital Services as well as in Emerging Business and Other. The net impact from capitalized and amortized R&D expenses was SEK 0.0(-0.4) b.
Selling and administrative (SG&A) expenses decreased to SEK-6.0(-6.2) b. YoY despite a negative impact from currency effects.
Impairment losses on trade receivables were positive at SEK 0.6 (0.0) b., due to a reversal of a provision for impairment of trade receivables following customer payments of SEK 0.7 b.
Other operating income and expenses
Other operating income and expenses increased YoY to SEK 0.8 (0.1) b. and sequentially from SEK-0.3 b., mainly due to capital gains related to the divestment of 51% of MediaKind and the divestment of assets in Red Bee Media.
Restructuring charges
Restructuring charges decreased to SEK-0.2(-1.2) b. YoY.
Operating income and margin
Operating income and margin, excluding restructuring of SEK-0.2 b. and certainnon-recurrent items of SEK 1.6 b., improved YoY to SEK 3.5 (0.9) b. and 7.2% (2.0%) respectively. The abovenon-recurrent items are a capital gain related to the divestment of 51% of MediaKind (SEK 0.7 b.), divestment of certain assets in Red Bee Media (SEK 0.1 b.) and a reversal of a provision for impairment of trade receivables following customer payment (SEK 0.7 b.)
Reported operating income and margin improved to SEK 4.9(-0.3) b. and 10.0%(-0.7%) respectively. Implementation of IFRS 16 improved operating income by SEK 0.1 b.
Sequentially, operating income and margin improved to SEK 4.9 b. from SEK-1.9 b. and to 10.0% from-2.9% respectively. Operating income excluding restructuring charges improved to SEK 5.1 b. from SEK 2.6 b. supported by capital gains of SEK 0.8 b. and of the reversal of the provision in trade receivables of SEK 0.7 b.
In Q4 2018, operating income was significantly impacted by negative effects of costs related to the revised BSS strategy.
| 3 Ericsson | First Quarter Report 2019 | Financial highlights | |
Financial net
The negative financial net increased to SEK-0.6(-0.5) b. and improved sequentially from SEK-0.7 b. The currency hedge effects, which derive from the hedge loan balance in USD, impacted financial net by SEK-0.2(-0.1) b. The SEK weakened against the USD between December 31, 2018 (SEK/USD rate 8.94) and March 31, 2019 (SEK/USD rate 9.26). In the quarter, interest expenses on financial leases were SEK-0.1 (0.0) b. as an effect of IFRS 16 implementation.
Taxes
Taxes were SEK-1.9 (0.1) b., equal to a tax rate of 44%. The rate is a result of forecasted geographical distribution of profits for 2019.
Net income (loss) and EPS
Net income increased to SEK 2.4(-0.7) b. and EPS diluted increased to SEK 0.70(-0.25) YoY.
Employees
The number of employees on March 31, 2019, was 94,580, a net decrease of 779 employees in the quarter. The employee reduction is related to the 51% divestment of MediaKind.
| 4 Ericsson | First Quarter Report 2019 | Financial highlights | |
Market area sales
| First quarter 2019 | Change | |||||||||||||||||||||||||||
SEK b. | Networks | Digital Services | Managed Services | Emerging Business and Other | Total | YoY | QoQ | |||||||||||||||||||||
South East Asia, Oceania and India | 4.5 | 0.8 | 0.8 | 0.0 | 6.1 | -4 | % | -25 | % | |||||||||||||||||||
North East Asia | 2.8 | 0.7 | 0.3 | 0.0 | 3.8 | 13 | % | -54 | % | |||||||||||||||||||
North America | 13.3 | 1.8 | 1.1 | 0.0 | 16.2 | 43 | % | -10 | % | |||||||||||||||||||
Europe and Latin America | 7.6 | 2.6 | 2.9 | 0.1 | 13.1 | 1 | % | -27 | % | |||||||||||||||||||
Middle East and Africa | 3.1 | 1.4 | 0.9 | 0.0 | 5.4 | -8 | % | -21 | % | |||||||||||||||||||
Other1) | 2.2 | 0.5 | 0.0 | 1.6 | 4.2 | 21 | % | -5 | % | |||||||||||||||||||
|
|
|
|
|
|
|
|
|
|
|
|
|
| |||||||||||||||
Total | 33.5 | 7.8 | 5.9 | 1.8 | 48.9 | 13 | % | -23 | % | |||||||||||||||||||
|
|
|
|
|
|
|
|
|
|
|
|
|
| |||||||||||||||
| 1) | Market Area “Other” includes primarily licensing revenues and the major part of segment Emerging Business and Other |
South East Asia, Oceania and India
Sales decreased YoY, primarily in Digital Services, due to timing of project deliveries and milestones. Network sales increased slightly YoY, mainly in South East Asia. Managed Services sales increased YoY, mainly as a result of a new contract won in 2018.
North East Asia
Sales increased YoY, primarily driven by Networks sales with 5G deliveries in South Korea and continued 4G deployment in Mainland China. Digital Services sales declined slightly YoY due to timing of project deliveries. Trials for 5G continue in Mainland China and Japan.
North America
Sales increased, primarily driven by 4G and 5G investments by all major customers. Managed Services sales grew YoY, driven by strong variable sales in large customer contracts.
Europe and Latin America
Sales increased YoY driven by positive impact of earlier announced contract wins in Europe. Managed Services sales declined as a consequence of contract exits.
Middle East and Africa
Sales declined YoY. Networks sales declined due to timing of investments. There is however high interest in 5G in the Middle East and several new contracts have been signed. Digital Services sales grew following high project-milestone fulfillment. Managed Services sales declined due to exit of contracts.
Other
Sales increased YoY, mainly driven by growth in IPR licensing revenues and iconectiv (part of segment Emerging Business and Other) partly offset by divestment of MediaKind. IPR licensing revenues amounted to SEK 2.5 (1.9) b., supported by a new contract signed and currency effects of a stronger USD versus SEK.
| 5 Ericsson | First Quarter Report 2019 | Market area sales | |
Segment results
Networks
SEK b. | Q1 2019 | Q1 2018 | YoY change | Q4 2018 | QoQ change | |||||||||||||||
Net sales | 33.5 | 28.6 | 17 | % | 41.6 | -20 | % | |||||||||||||
Of which products | 23.8 | 19.5 | 22 | % | 29.8 | -20 | % | |||||||||||||
Of which IPR licensing revenues | 2.1 | 1.5 | 36 | % | 1.8 | 17 | % | |||||||||||||
Of which services | 9.7 | 9.1 | 6 | % | 11.8 | -18 | % | |||||||||||||
Sales growth adjusted for comparable units and currency | — | — | 10 | % | — | — | ||||||||||||||
Gross income | 14.5 | 11.1 | 30 | % | 16.6 | -13 | % | |||||||||||||
Gross margin | 43.2 | % | 38.9 | % | — | 39.9 | % | — | ||||||||||||
Operating income | 5.5 | 3.4 | 62 | % | 6.9 | -20 | % | |||||||||||||
Operating margin | 16.3 | % | 11.8 | % | — | 16.5 | % | — | ||||||||||||
Restructuring charges | 0.0 | -0.5 | — | -0.4 | — | |||||||||||||||
Gross income excl. restructuring charges | 14.5 | 11.5 | 25 | % | 17.1 | -15 | % | |||||||||||||
Gross margin excl. restructuring charges | 43.2 | % | 40.4 | % | — | 41.0 | % | — | ||||||||||||
Operating income excl. restructuring charges | 5.5 | 3.9 | 42 | % | 7.3 | -25 | % | |||||||||||||
Operating margin excl. restructuring charges | 16.4 | % | 13.5 | % | — | 17.5 | % | — | ||||||||||||
Net sales
Sales adjusted for comparable units and currency increased by 10% YoY. The increase is mainly due to strong growth in North America and North East Asia, driven by 4G and 5G investments.
Reported sales increased by 17% YoY.
Gross margin
Gross margin increased to 43.2% (38.9%) YoY. Gross margin excluding restructuring charges increased to 43.2% (40.4%) driven by higher sales of hardware capacity and higher IPR licensing revenues.
Gross margin increased to 43.2% from 39.9% QoQ. The increase was due to higher IPR licensing revenues, lower restructuring charges and lower negative impact from strategic contracts. The strategic contracts are taken to strengthen the market position and their negative impact on gross margin may vary between quarters.
Operating income and margin
Operating income increased to SEK 5.5 (3.4) b. YoY and operating margin improved to 16.3% (11.8%). The improvement was mainly driven by higher sales and higher gross margin. In addition, the total impact from amortization and capitalization of development expenses and from recognition and deferral of hardware costs contributed with SEK 0.3(-0.2) b. to operating income.
Strategy execution
As presented at the 2018 Capital Markets Day, the target for Networks is to generate an operating margin of15%-17% (excluding restructuring charges) by 2020. Four important ongoing strategic activities are to:
| • | Invest in R&D to safeguard a leading product portfolio and cost leadership |
| • | Fully transition the radio unit deliveries to Ericsson Radio System (ERS) for increased competitiveness |
| • | Increase investments in automation and serviceability driving down costs |
| • | Selectively gain market shares based on technology and cost competitiveness. |
At the close of the quarter Ericsson had announced commercial 5G deals with 18 named operators. The market share of Ericsson RAN equipment has improved to 29.2% in 2018 compared with 28.7% for 2017, according to Dell’Oro’s report from February 2019.
As antenna technology is growing in importance, Ericsson announced plans to expand its Ericsson Radio System portfolio with new products and to strengthen itsin-house competence and capabilities in antenna technology, through an acquisition of Kathrein’s antenna and filter business.
| 6 Ericsson | First Quarter Report 2019 | Segment results | Networks | |
Digital Services
SEK b. | Q1 2019 | Q1 2018 | YoY change | Q4 2018 | QoQ change | |||||||||||||||
Net sales | 7.8 | 7.3 | 8 | % | 13.0 | -40 | % | |||||||||||||
Of which products | 3.9 | 3.9 | 0 | % | 7.5 | -47 | % | |||||||||||||
Of which IPR licensing revenues | 0.5 | 0.3 | 36 | % | 0.4 | 17 | % | |||||||||||||
Of which services | 3.9 | 3.3 | 17 | % | 5.5 | -30 | % | |||||||||||||
Sales growth adjusted for comparable units and currency | — | — | 0 | % | — | — | ||||||||||||||
Gross income | 2.9 | 2.9 | 0 | % | -1.2 | — | ||||||||||||||
Gross margin | 36.8 | % | 39.8 | % | — | -9.5 | % | — | ||||||||||||
Operating income (loss) | -1.8 | -2.6 | — | -7.1 | — | |||||||||||||||
Operating margin | -23.0 | % | -35.9 | % | — | -54.5 | % | — | ||||||||||||
Restructuring charges | -0.2 | -0.6 | — | -3.5 | — | |||||||||||||||
Gross income excl. restructuring charges | 2.9 | 3.1 | -6 | % | 2.1 | 38 | % | |||||||||||||
Gross margin excl. restructuring charges | 37.6 | % | 42.9 | % | — | 16.4 | % | — | ||||||||||||
Operating income (loss) excl. restructuring charges | -1.6 | -2.0 | — | -3.5 | — | |||||||||||||||
Operating margin excl. restructuring charges | -20.6 | % | -27.9 | % | — | -27.2 | % | — | ||||||||||||
Net sales
Sales adjusted for comparable units and currency were stable YoY. Reported sales increased by 8% YoY with growth in North America, partly offset by lower sales in India. Sales in Operations Support Systems (OSS) and Cloud Core increased but were partly offset by lower sales in Business Support Systems (BSS).
Gross margin
Gross margin decreased to 36.8% (39.8%) YoY. Gross margin excluding restructuring charges declined to 37.6% (42.9%). Gross margin in Q1 2018 was strong, supported by a favorable business mix.
Gross margin increased to 36.8% from-9.5% QoQ. Provisions related to the revised BSS strategy had a significant negative impact on gross margin in Q4 2018. Gross margin excluding restructuring and these provisions was stable QoQ.
Operating income (loss)
Operating income was SEK-1.8(-2.6) b. Operating income excluding restructuring charges was SEK-1.6(-2.0) b., with a positive impact from reduced operating expenses. Operating expenses excluding restructuring charges decreased by SEK 0.6 b. YoY despite adverse currency effects.
Strategy execution
Top priority for Digital Services is to turn the segment into a profitable business, targeting low single-digit operating margin by 2020 (excluding restructuring charges). The positive business momentum for the new portfolio of5G-ready and cloud-native products continued, with several important contract wins in the quarter.
The implementation of the revised BSS strategy, announced in January 2019, is progressing according to plan. Measures across service delivery and R&D are being implemented with the target to have all activities concluded bymid-2019. The measures aim to materially contribute to reduced losses in BSS already in 2019, andde-risk the plan for Digital Services to reach the 2020 financial target.
New ways of working to further improve R&D efficiency as well as investments in the portfolio of5G-ready and cloud-native products will continue in order to defend the current market position and prepare Digital Services for future profitable growth.
A key activity for turnaround of the Digital Services business is to complete, renegotiate or exit 45 identified critical andnon-strategic customer contracts. Two contracts were addressed in the quarter, and a total of 25 contracts have been addressed to date. The plan is to have completed 75% of the 45 contracts by the end of 2019. The sales shift towards the new portfolio continues. The rolling 12 months sales of the new portfolio increased by 6%.
| 7 Ericsson | First Quarter Report 2019 | Segment results | Digital Services | |
Managed Services
SEK b. | Q1 2019 | Q1 2018 | YoY change | Q4 2018 | QoQ change | |||||||||||||||
Net sales | 5.9 | 5.9 | -1 | % | 6.9 | -15 | % | |||||||||||||
Sales growth adjusted for comparable units and currency | — | — | -5 | % | — | — | ||||||||||||||
Gross income | 1.0 | 0.5 | 111 | % | 0.8 | 33 | % | |||||||||||||
Gross margin | 17.7 | % | 8.3 | % | — | 11.4 | % | — | ||||||||||||
Operating income | 1.3 | 0.1 | — | 0.3 | 339 | % | ||||||||||||||
Operating margin | 21.4 | % | 1.7 | % | — | 4.1 | % | — | ||||||||||||
Restructuring charges | 0.0 | -0.1 | — | -0.1 | — | |||||||||||||||
Gross income excl. restructuring charges | 1.0 | 0.5 | 92 | % | 0.9 | 22 | % | |||||||||||||
Gross margin excl. restructuring charges | 17.7 | % | 9.1 | % | — | 12.4 | % | — | ||||||||||||
Operating income excl. restructuring charges | 1.3 | 1) | 0.2 | — | 0.4 | 253 | % | |||||||||||||
Operating margin excl. restructuring charges | 21.4 | % | 2.6 | % | — | 5.2 | % | — | ||||||||||||
| 1) | Q1 2019 Operating income was SEK 0.5 b., when excluding restructuring charges and reversal of a provision for impairment of trade receivables |
Net sales
Sales adjusted for comparable units and currency decreased by-5% YoY due to customer contract exits. Sales in Network Design & Optimization (project business) and in Managed Services IT & ADM showed growth. Variable sales in certain large Managed Services Networks contracts increased in the quarter.
Reported sales decreased by-1% YoY.
Gross margin
Gross margin increased to 17.7% (8.3%) YoY, mainly as a result of customer contract exits and efficiencies as well as lower restructuring charges.
Gross margin increased to 17.7% from 11.4% QoQ, driven by seasonally lower costs following high costs in Q4 2018, a shift of resources and costs to R&D and lower restructuring charges.
Operating income and margin
Operating income increased to SEK 1.3 (0.1) b. YoY. The improvement was partly driven by reversal of a provision for impairment of trade receivables of SEK 0.7 (0.0) b. A higher gross margin also contributed positively to the operating income increase YoY. Excluding the provision reversal (SEK 0.7 b.), operating margin was 8.6%.
Strategy execution
AI and automation are essential to managing the increasing complexity of current and future networks. These capabilities are evolving operations from being network centric, towards being userexperience centric. To address and lead this evolution, Ericsson has launched a new Artificial Intelligence (AI)-based managed services offering for operators – the Ericsson Operations Engine. ThisAI-based offering addresses this increasing network complexity, including operators’ need to handle growing volumes of devices, multiple technologies (4G, 5G, IoT), and more diverse service requirements.
Further investments will be made in automation, analytics andAI-driven offerings, to support 5G, IoT and cloud as well as to increase service delivery efficiency.
As presented at the 2018 Capital Markets Day, the ambition for Managed Services is to improve operating margin to5%-8% (excluding restructuring charges) in 2020.
| 8 Ericsson | First Quarter Report 2019 | Segment results | Managed Services | |
Emerging Business and Other (includes Emerging Business, iconectiv, Red Bee Media and Media Solutions)
SEK b. | Q1 2019 | Q1 2018 | YoY change | Q4 2018 | QoQ change | |||||||||||||||
Net sales | 1.8 | 1.7 | 6 | % | 2.3 | -23 | % | |||||||||||||
Of which Emerging Business and iconectiv | 1.0 | 0.6 | 67 | % | 1.0 | 1 | % | |||||||||||||
Of which Red Bee Media | 0.6 | 0.5 | 26 | % | 0.6 | 7 | % | |||||||||||||
Of which Media Solutions | 0.1 | 0.5 | -80 | % | 0.7 | -84 | % | |||||||||||||
Sales growth adjusted for comparable units and currency | — | — | 38 | % | — | — | ||||||||||||||
Gross income | 0,4 | 0.3 | 18 | % | 0.2 | 93 | % | |||||||||||||
Gross margin | 23.4 | % | 21.1 | % | — | 9.3 | % | — | ||||||||||||
Operating income (loss) | 0.0 | -1.2 | — | -1.9 | — | |||||||||||||||
Operating margin | -1.7 | % | -71.2 | % | — | -83.3 | % | — | ||||||||||||
Restructuring charges | 0.0 | -0.1 | — | -0.4 | — | |||||||||||||||
Gross income excl. restructuring charges | 0.4 | 0.4 | 2 | % | 0.4 | 6 | % | |||||||||||||
Gross margin excl. restructuring charges | 23.5 | % | 24.3 | % | — | 17.1 | % | — | ||||||||||||
Operating income (loss) excl. restructuring charges | 0.0 | 1) | -1.1 | — | -1.5 | — | ||||||||||||||
Of which Emerging Business, iconectiv and common costs | -0.5 | -0.6 | — | -0.9 | — | |||||||||||||||
Of which Red Bee Media | 0.0 | -0.1 | — | -0.1 | — | |||||||||||||||
Of which Media Solutions | 0.4 | -0.4 | — | -0.5 | — | |||||||||||||||
Operating margin excl. restructuring charges | -1.3 | % | -67.5 | % | — | -67.1 | % | — | ||||||||||||
| 1) | Q1 2019 Operating income was SEK-0.8 b., when excluding restructuring charges and capital gains of SEK 0.8 b. in Media Solutions and Red Bee Media |
Net sales
Sales adjusted for comparable units (adjusted for the divestment of MediaKind) and currency increased by 38% YoY. The increase was driven by iconectiv, mainly due to a number portability contract in United States for which deliveries started in May 2018.
Reported sales increased by 6% YoY.
Gross margin
Gross margin increased to 23.4% (21.1%) YoY. Gross margin excluding restructuring charges declined to 23.5% (24.3%) due to the divestment of 51% of MediaKind.
Gross margin increased QoQ to 23.4% from 9.3%. Gross margin excluding restructuring charges increased to 23.5% from 17.1% with improvements in Emerging Business, Red Bee Media and iconectiv.
Operating income (loss)
Operating income improved to SEK 0.0(-1.2) b. YoY. Operating income excluding restructuring charges improved to SEK 0.0(-1.1) b. A capital gain of SEK 0.8 b. impacted operating income positively. In addition, growth in iconectiv had a positive impact on income YoY.
Media Solutions (MediaKind and transaction-related costs etc.) operating income excluding restructuring was SEK 0.4 b., driven by a capital gain of SEK 0.7 b. from the MediaKind divestment. The operating income was also impacted by losses of SEK-0.3 b., including certainnon-recurrent costs.
A capital gain related to divestment of certain assets in Red Bee Media had a positive impact on income.
Strategy execution
Emerging Business
Selective investments, disciplined governance and a lean-startup approach have been implemented in Emerging Business to build a position and grow sales in new areas. The portfolio is still in an early phase, with focus on generating sales and scaling the business. The offering “Ericsson Industry Connect” was launched to strengthen Ericsson’s portfolio for private networks by making 4G and 5G technologies accessible to new industrial markets. The maingo-to-market model is via mobile operators, leveraging access to licensed spectrum.
Red Bee Media
The target to achieve a sustainable profitable business remains, by continuing to develop and manage the business as an independent and focused media services entity within Ericsson. Certain assets were divested in the quarter, supporting the Red Bee Media strategy of focusing on delivering market-leading managed services within broadcasting and media.
Media Solutions
51% of the MediaKind business was divested February 1, 2019. After the transaction, Ericsson carries 49% of the MediaKind results as “share in earnings of JV and associated companies”. Actions taken are expected to result in improved sales and cost structures in the second half of 2019.
| 9 Ericsson | First Quarter Report 2019 | Segment results | Emerging Business and Other | |
Cash flow
SEK b. | Q1 2019 | Q1 2018 | Q4 2018 | |||||||||
Net income reconciled to cash | 5.5 | -1.0 | -0.1 | |||||||||
Changes in operating net assets | 0.3 | 2.6 | 4.4 | |||||||||
Cash flow from operating activities | 5.8 | 1.6 | 4.3 | |||||||||
Cash flow from investing activities | 3.3 | -1.8 | -2.2 | |||||||||
Cash flow from financing activities | -2.6 | -0.1 | -0.6 | |||||||||
Effect of exchange rate changes on cash | 0.6 | 1.1 | 0.8 | |||||||||
Net change in cash and cash equivalents | 7.1 | 0.8 | 2.3 | |||||||||
Free cash flow excluding M&A | 4.1 | 0.7 | 3.0 | |||||||||
Free cash flow | 4.4 | 0.3 | 3.0 | |||||||||
Operating activities
Net income reconciled to cash was SEK 5.5(-1.0) b. mainly driven by improved profitability, and supported by a reversal of a provision for impairment of trade receivables of SEK 0.7 b. following customer payment. Cash flow from operating activities was SEK 5.8 (1.6) b. and includes SEK 0.3 b. in changes in operating net assets.
Inventory increased due to high business activity while trade receivables decreased on the back of the seasonally high sales in Q4. Provisions decreased in the quarter. Out of the SEK 6.1 b. provision related to reshaping the BSS business in Q4 2018, SEK 3.1 b. was reclassified as other current liabilities in the quarter, of which SEK 1.6 b. was paid out. Cash outlays related to other provisions were SEK 1.7 (2.2) b. of which SEK 0.6 (1.4) b. were restructuring charges. Total cash outlays for 2019, related to the balance for provisions as of December 31, 2018, are estimated to be SEK 10 b., of which cash outlays in the quarter were SEK 3.3 b.
Investing activities
Cash flow from investing activities was SEK 3.3(-1.8) b. supported by SEK 4.7 b. of sale of interest-bearing securities (i.e. government/ mortgage bonds). Cash flow related to M&A was SEK 0.3(-0.4) b., mainly as a result of the divestment of 51% of MediaKind. Cash flow from investments in property, plant and equipment was SEK-1.3(-0.9) b., following investments in test equipment. Cash flow from capitalized development expenses was SEK-0.5(-0.3) b. following increased 5G R&D activities.
Financing activities
Cash flow from financing activities was SEK-2.6(-0.1) b. of which the main part relates to payment of dividends of SEK-1.0 b. and repayment of loans of SEK-1.8 b. to a minority shareholder in one of the subsidiaries.
Free cash flow
Free cash flow excluding M&A was SEK 4.1 (0.7) b. and free cash flow including M&A was SEK 4.4 (0.3) b., supported by the divestment of 51% of MediaKind.
Effects from implementation of IFRS 16 “Leases”
Cash flow from operating activities was positively impacted by SEK
0.6 b. Financing activities were negatively impacted by amortization of the leasing liability of the same amount. These effects generated a free cash flow that was positively impacted by SEK 0.6 b. through the implementation of IFRS 16.
| 10 Ericsson | First Quarter Report 2019 | Cash flow | |
Financial position
SEK b. | Mar 31 2019 | Mar 31 2018 | Dec 31 2018 | |||||||||
+ Cash and cash equivalents | 45.5 | 36.7 | 38.4 | |||||||||
+ Interest-bearing securities, current | 3.2 | 5.5 | 6.6 | |||||||||
+ Interest-bearing securities,non-current | 23.0 | 27.1 | 24.0 | |||||||||
|
|
|
|
|
| |||||||
Gross cash | 71.7 | 69.3 | 69.0 | |||||||||
|
|
|
|
|
| |||||||
– Borrowings, current | 3.0 | 2.6 | 2.3 | |||||||||
– Borrowings,non-current | 32.5 | 31.1 | 30.9 | |||||||||
|
|
|
|
|
| |||||||
Net cash | 36.1 | 35.6 | 35.9 | |||||||||
|
|
|
|
|
| |||||||
Equity | 84.5 | 93.5 | 87.8 | |||||||||
Total assets | 284.0 | 260.7 | 268.8 | |||||||||
Capital turnover (times) | 1.3 | 1.1 | 1.4 | |||||||||
Return on capital employed (%) | 12.7 | % | -1.0 | % | 0.6 | % | ||||||
Equity ratio (%) | 29.8 | % | 35.9 | % | 32.7 | % | ||||||
Return on equity (%) | 10.8 | % | -3.5 | % | -7.1 | % | ||||||
Gross cash increased by SEK 2.7 b. as a result of the positive free cash flow. Net cash increased by SEK 0.2 b. in the quarter, impacted by revaluation of borrowings due to changes in foreign exchange rates and interest rates. Gross cash was SEK 71.7 b. and net cash was SEK 36.1 b. Net cash does not include lease liabilities.
Liability for post-employments benefits increased in the quarter, to SEK 30.7 b. from SEK 28.7 b., due to lower interest rates. The Swedish defined benefit obligation (DBO) was calculated using a discount rate based on the yields of Swedish government bonds. If the discount rate had been based on Swedish covered mortgage bonds, the liability for post-employment benefits would have been approximately SEK 10.2 b. lower as of March 31, 2019.
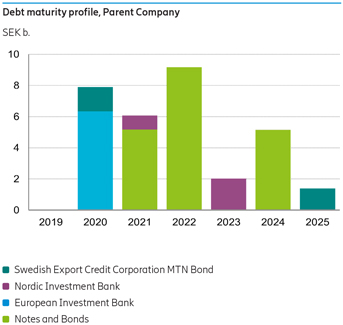
The average maturity of long-term borrowings as of March 31, 2019, was 3.1 years, a decrease from 4.1 years 12 months earlier.
| 11 Ericsson | First Quarter Report 2019 | Financial position | |
Parent Company
Income after financial items was SEK-0.12 (0.37) b.
At the end of the quarter, gross cash (cash, cash equivalents, short-term investments and interest-bearing securitiesnon-current) amounted to SEK 60.6 (52.3) b.
In the quarter, a dividend of SEK 3.3 b. was recognized, as anticipated, after decision by the Annual General Meeting on the 27th of March. The dividend was paid out in the first week of April.
There was a decrease in intercompany lending of SEK 10.7 b. and in intercompany borrowing of SEK 24.9 b. in the quarter.
In the quarter, there was an increase of SEK 1.2 b. in associated companies due to an acquisition of 49% of shares in company Leone Media Inc. (MediaKind).
In accordance with the conditions of the long-term variable compensation program (LTV) for Ericsson employees, 4,434,772 shares from treasury stock were sold or distributed to employees during the first quarter. The holding of treasury stock at March 31, 2019, was 32,622,267 Class B shares.
| 12 Ericsson | First Quarter Report 2019 | Parent Company | |
Other information
Ericsson completed divestment of majority stake in MediaKind
On February 1, 2019 Ericsson announced that it had closed the divestment of its MediaKind business to the private equity firm One Equity Partners. As previously announced, One Equity Partners is the majority owner, while Ericsson retains 49% of the shares after the transaction on January 31, 2019.
Ericsson to acquire Kathrein’s antenna and filters business
On February 25, 2019 Ericsson announced that it intends to acquire Kathrein’s antenna and filter business. The acquisition will include Kathrein’s antenna and filter business for mobile networks and will add around 4,000 professionals in R&D, production, and sales.
The acquisition is an asset deal where certain assets and liabilities are acquired by Ericsson at closing, which is expected in Q3 2019. The business will be added as a separate unit in Business Area Networks and will be reported in Segment Networks, with a positive contribution to 2020 profitability targets. Preliminary and unaudited revenues from the part of Kathrein to be acquired were approximately EUR 270 million in 2018, excluding sales to Ericsson. The parties have agreed to keep the purchase price undisclosed.
The closing of the acquisition is subject to customary conditions and approvals from relevant regulatory authorities.
Ericsson announced changes to Executive Team
On March 12, 2019, Ericsson announced that Rafiah Ibrahim would leave her position as Senior Vice President and Head of Market Area Middle East & Africa and take on a role as advisor to CEO Börje Ekholm. Rafiah Ibrahim, who has held her current position since April 1, 2017, will assume her new role effective August 31, 2019. She will leave the Ericsson Executive Team effective the same date.
Resolutions at the AGM
On March 27, 2019, Ericsson held its AGM in Kista, Stockholm. The proposed dividend of SEK 1.00 per share was approved by the AGM.
In accordance with the proposal of the Nomination Committee, Ronnie Leten wasre-elected as Chair of the Board and Jon Fredrik Baksaas, Jan Carlson, Nora Denzel, Börje Ekholm, Eric A. Elzvik, Kurt Jofs, Ronnie Leten, Kristin S. Rinne, Helena Stjernholm and Jacob Wallenberg werere-elected as Board members.
In accordance with the Board of Directors’ proposal, the AGM resolved to approve the Guidelines for remuneration to Group Management and the implementation of a Long-Term Variable Compensation Program 2019 for members of the Executive Team.
Ongoing litigation with Intellectual Ventures
The company Intellectual Ventures (IV) has previously filed a number of patent infringement lawsuits in the United States accusing Ericsson and some of Ericsson’s U.S. customers of patent infringement. In February 2019, in one of the lawsuits in the Eastern District of Texas, a jury awarded IV damages of USD 43 million in one of those lawsuits. Ericsson disagrees with the jury’s verdict and intends to appeal. Separately, the Patent Trial and Appeal Board has instituted a review of the patents that were the subject of the February 2019 trial, following its finding that there is a reasonable likelihood that those patents are unpatentable. The next case in the Eastern District of Texas is currently set to go to trial in May 2019. As a result of the lawsuits filed by IV, Ericsson may be required to indemnify its customers and/or pay IV damages.
POST-CLOSING EVENTS
Investigation into Ericsson’s patent licensing practices in China
On April 11, 2019, Ericsson was informed by the Chinese SAMR (State Administration for Market Regulation) Anti-Monopoly Bureau that they have initiated an investigation into Ericsson’s patent licensing practices in China. Ericsson is cooperating with the investigation.
Over the past decades, Ericsson has made substantial investments in technology research and standards development in the mobile industry. These consistent investments in R&D have made Ericsson a leading innovator and the driving force in the creation of each new generation of cellular technology.
In order to provide access to its patented technology to others, and also to get a fair return on its heavy investments, Ericsson has a patent licensing program that offers licenses to implementers of the cellular standards on FRAND (Fair, Reasonable andNon-Discriminatory) terms and conditions. Ericsson has always been committed to these FRAND principles, as they ensure a balance between contributors to the standards and implementers of the technology, thus accelerating the development and adoption of new technologies in our industry.
SEC and DOJ inquiries
As previously disclosed, Ericsson has been voluntarily cooperating since 2013 with an investigation by the United States Securities and Exchange Commission (SEC) and, since 2015, with an investigation by the United States Department of Justice (DOJ) into Ericsson’s compliance with the U.S. Foreign Corrupt Practices Act (FCPA). The Company continues to cooperate with the SEC and the DOJ, and has recently begun settlement discussions. These discussions are in a very early stage and therefore the Company is not able to estimate their length. Further, as this is an ongoing legal matter Ericsson cannot provide any detail. However, based on the current status of the discussions, it is the Company’s assessment that the resolution of these matters will result in material financial and other measures, the magnitude and impact of which cannot be reliably estimated or ascertained at this time. Potential future cash outflows are currently not capable of being reliably estimated. Accordingly, no provisions have been recorded for such potential exposure.
Ericsson continuously seeks to strengthen its ethics and compliance program with risk-relevant policies, processes and tools for preventing, detecting and remediatingnon-compliance. These efforts have been further reinforced in recent years. In addition, in 2016 the Board hired an independent compliance advisory firm to assist the Company and the Board on compliance related matters. Their recommendations are currently being implemented. Recent improvement efforts focused on the following areas: people and culture (including tone from the top, senior leadership vetting, disciplinary processes, and training), third party engagements (including resources, policies, controls and processes), compliance and investigation capabilities (including resources, policies, governance, processes and tools), and internal control capabilities (including resources, governance, processes and tools).
The Company is committed to having a robust andfit-for-purpose compliance program and is continuously looking to improve on ways to better manage its compliance risks throughout the Company with due effort and attention.
| 13 Ericsson | First Quarter Report 2019 | Other information | |
Risk factors
Ericsson is exposed to a number of risks in its activities. To stimulate identification and support cross-functional treatment within the Ericsson Group, risks are grouped in a number of categories, including for example risks relating to technology, IPR, compliance, project execution, operations, products and services, treasury and accounting, the geopolitical environment, M&A, cyber security and occupational health and safety. Ericsson’s risk management is embedded into strategy development and operational processes and is a part of the Ericsson Group Management System to ensure accountability, effectiveness, efficiency, business continuity and compliance. Risks are defined in both a short-term and long-term perspective and are related to long-term objectives as per the strategic direction as well as to short-term objectives. Risk factors and uncertainties of relevance to Ericsson are described in the Annual Report 2018. Updates to these risk factors and uncertainties observed by Ericsson that are deemed of short-term relevance include, but are not limited to, the following:
As previously disclosed, Ericsson is voluntarily cooperating with investigations by the United States Securities and Exchange Commission (SEC) and the United States Department of Justice (DOJ) into Ericsson’s compliance with the U.S. Foreign Corrupt Practices Act (FCPA). The Company continues to cooperate with the SEC and the DOJ, and has recently begun settlement discussions. These discussions are in a very early stage and therefore the Company is not able to estimate their length. Further, as this is an ongoing legal matter Ericsson cannot provide any detail. However, based on the current status of the discussions, it is the Company’s assessment that the resolution of these matters will result in material financial and other measures, the magnitude and impact of which cannot be reliably estimated or ascertained at this time. Potential future cash outflows are currently not capable of being reliably estimated. Accordingly, no provisions have been recorded for such potential exposure.
Stockholm, April 17, 2019
Telefonaktiebolaget LM Ericsson
Börje Ekholm, President and CEO
Org. no. 556016-0680
Date for next report: July 17, 2019
| 14 Ericsson | First Quarter Report 2019 | Risk factors | |
Editor’s note
Press briefing and live webcast
Ericsson invites media, investors and analysts to conference
calls on April 17, 2019; one starting at 09.00 (CET) and the
other at 13.00 (CET).
Live audio webcasts of the conference calls as well as supporting slides will be available at:
www.ericsson.com/investors and
www.ericsson.com/press
Replay of the conference calls will be available approximately
one hour after each call has ended and will remain available for seven days.
For further information, please contact:
Carl Mellander Senior Vice President, Chief Financial Officer
Phone: +46 10 713 89 70
E-mail: investor.relations@ericsson.com or
media.relations@ericsson.com
Helena Norrman, Senior Vice President, Chief Marketing and
Communications Officer
Phone: +46 10 719 34 72
E-mail: investor.relations@ericsson.com or
media.relations@ericsson.com
Telefonaktiebolaget LM Ericsson
Org. number: 556016-0680
Torshamnsgatan 21
SE-164 83 Stockholm
Phone: +46 10 719 00 00
www.ericsson.com
Investors
Peter Nyquist, Vice President,
Head of Investor Relations
Phone: +46 10 714 64 99, +46 70 575 29 06
E-mail: peter.nyquist@ericsson.com
Stefan Jelvin, Director,
Investor Relations
Phone: +46 10 714 20 39, +46 70 986 02 27
E-mail: stefan.jelvin@ericsson.com
Åsa Konnbjer, Director,
Investor Relations
Phone: +46 10 713 39 28, +46 73 082 59 28
E-mail: asa.konnbjer@ericsson.com
Rikard Tunedal, Director,
Investor Relations
Phone: +46 10 714 54 00, +46 761 005 400
E-mail: rikard.tunedal@ericsson.com
Media
Ola Rembe, Vice President,
Head of External Communications
Phone: +46 10 719 97 27, +46 73 024 48 73
E-mail: media.relations@ericsson.com
Corporate Communications
Phone: +46 10 719 69 92
E-mail: media.relations@ericsson.com
| 15 Ericsson | First Quarter Report 2019 | Editor’s note | |
Forward-looking statements
This report includes forward-looking statements, including statements reflecting management’s current views relating to the growth of the market, future market conditions, future events, financial condition, and expected operational and financial performance, including, in particular the following:
| • | Our goals, strategies, planning assumptions and operational or financial performance expectations |
| • | Industry trends, future characteristics and development of the markets in which we operate |
| • | Our future liquidity, capital resources, capital expenditures, cost savings and profitability |
| • | The expected demand for our existing and new products and services as well as plans to launch new products and services including research and development expenditures |
| • | The ability to deliver on future plans and to realize potential for future growth |
| • | The expected operational or financial performance of strategic cooperation activities and joint ventures |
| • | The time until acquired entities and businesses will be integrated and accretive to income |
| • | Technology and industry trends including the regulatory and standardization environment in which we operate, competition and our customer structure. |
The words “believe,” “expect,” “foresee,” “anticipate,” “assume,” “intend,” “likely,” “projects,” “may,” “could,” “plan,” “estimate,” “forecast,” “will,” “should,” “would,” “predict,” “aim,” “ambition,” “seek,” “potential,” “target,” “might,” “continue,” or, in each case, their negative or variations, and similar words or expressions are used to identify forward-looking statements. Any statement that refers to expectations, projections or other characterizations of future events or circumstances, including any underlying assumptions, are forward-looking statements.
We caution investors that these statements are subject to risks and uncertainties many of which are difficult to predict and generally beyond our control that could cause actual results to differ materially from those expressed in, or implied or projected by, the forward-looking information and statements.
Important factors that could affect whether and to what extent any of our forward-looking statements materialize include, but are not limited to, the factors described in the section “Risk Factors”, and in “Risk Factors” in the Annual Report 2018.
These forward-looking statements also represent our estimates and assumptions only as of the date that they were made. We expressly disclaim a duty to provide updates to these forward-looking statements, and the estimates and assumptions associated with them, after the date of this report, to reflect events or changes in circumstances or changes in expectations or the occurrence of anticipated events, whether as a result of new information, future events or otherwise, except as required by applicable law or stock exchange regulation.
| 16 Ericsson | First Quarter Report 2019 | Forward-looking statements | |
Financial statements
and other information
Contents | ||
| 18 | ||
| 18 | ||
| 19 | ||
| 20 | ||
| 21 | ||
| 21 | ||
| 22 | ||
| 23 | ||
| 23 | ||
| 24 | ||
| 25 | ||
| 26 | ||
| 27 | ||
| 28 | ||
| 28 | ||
| 29 | Operating income (loss) and operating margin by segment by quarter | |
| 30 | ||
| 31 | ||
| 32 | ||
| 32 | ||
| 33 | ||
| 33 | ||
| 34 | ||
| 35 | ||
| 35 | ||
| 36 | ||
| 36 | ||
| 37 | Gross income (loss) and gross margin excluding restructuring charges by segment | |
| 38 | Operating income (loss) and operating margin excluding restructuring charges by segment | |
| 39 | ||
| 40 | ||
| 41 | ||
| 41 | ||
| 42 | ||
| 42 | ||
| 42 | ||
| 43 | ||
| 43 | ||
| 43 | ||
| 44 | ||
| 44 | ||
| 17 Ericsson | First Quarter Report 2019 | Financial statements and other information | |
| Jan-Mar | Jan-Dec 2018 | |||||||||||||||
SEK million | 2019 | 2018 | Change | |||||||||||||
Net sales | 48,906 | 43,411 | 13 | % | 210,838 | |||||||||||
Cost of sales | -30,127 | -28,553 | 6 | % | -142,638 | |||||||||||
|
|
|
|
|
|
|
| |||||||||
Gross income | 18,779 | 14,858 | 26 | % | 68,200 | |||||||||||
|
|
|
|
|
|
|
| |||||||||
Gross margin (%) | 38.4 | % | 34.2 | % | 32.3 | % | ||||||||||
Research and development expenses | -9,167 | -9,073 | 1 | % | -38,909 | |||||||||||
Selling and administrative expenses | -6,031 | -6,156 | -2 | % | -27,519 | |||||||||||
Impairment losses on trade receivables1) | 559 | -28 | — | -420 | ||||||||||||
|
|
|
|
|
|
|
| |||||||||
Operating expenses | -14,639 | -15,257 | -4 | % | -66,848 | |||||||||||
|
|
|
|
|
|
|
| |||||||||
Other operating income and expenses | 773 | 84 | -168 | |||||||||||||
Shares in earnings of JV and associated companies | -17 | 3 | 58 | |||||||||||||
|
|
|
|
|
|
|
| |||||||||
Operating income (loss) | 4,896 | -312 | — | 1,242 | ||||||||||||
|
|
|
|
|
|
|
| |||||||||
Financial income | 38 | -72 | -316 | |||||||||||||
Financial expenses | -643 | -469 | -2,389 | |||||||||||||
|
|
|
|
|
|
|
| |||||||||
Income after financial items | 4,291 | -853 | — | -1,463 | ||||||||||||
|
|
|
|
|
|
|
| |||||||||
Taxes | -1,888 | 128 | — | -4,813 | ||||||||||||
|
|
|
|
|
|
|
| |||||||||
Net income (loss) | 2,403 | -725 | — | -6,276 | ||||||||||||
|
|
|
|
|
|
|
| |||||||||
Net income (loss) attributable to: | ||||||||||||||||
Stockholders of the Parent Company | 2,317 | -837 | -6,530 | |||||||||||||
Non-controlling interests | 86 | 112 | 254 | |||||||||||||
Other information | ||||||||||||||||
Average number of shares, basic (million) | 3,300 | 3,286 | 3,291 | |||||||||||||
Earnings (loss) per share, basic (SEK)2) | 0.70 | -0.25 | -1.98 | |||||||||||||
Earnings (loss) per share, diluted (SEK)3) | 0.70 | -0.25 | -1.98 | |||||||||||||
| 1) | Impairment of trade receivables has been calculated according to IFRS 9 in 2018. |
| 2) | Based on net income (loss) attributable to stockholders of the Parent Company. |
| 3) | Potential ordinary shares are not considered when their conversion to ordinary shares would increase earnings per share. |
Statement of comprehensive income (loss)
| Jan-Mar | Jan-Dec 2018 | |||||||||||
SEK million | 2019 | 2018 | ||||||||||
Net income (loss) | 2,403 | -725 | -6,276 | |||||||||
|
|
|
|
|
| |||||||
Other comprehensive income (loss) | ||||||||||||
Items that will not be reclassified to profit or loss | ||||||||||||
Remeasurements of defined benefits pension plans incl. asset ceiling | -2,826 | -849 | -2,453 | |||||||||
Revaluation of borrowings due to change in credit risk | -427 | 58 | 207 | |||||||||
Tax on items that will not be reclassified to profit or loss | 656 | 133 | 285 | |||||||||
Items that may be reclassified to profit or loss | ||||||||||||
Cash flow hedge reserve | ||||||||||||
Gains/losses arising during the period | -169 | — | — | |||||||||
Reclassification adjustments for gains/losses included in profit or loss | — | — | — | |||||||||
Adjustments for amounts transferred to initial carrying amount of hedged items | — | — | — | |||||||||
Revaluation of other investments in shares and participations | ||||||||||||
Fair value remeasurement | — | — | — | |||||||||
Changes in cumulative translation adjustments | 1,407 | 1,299 | 2,047 | |||||||||
Share of other comprehensive income on JV and associated companies | 38 | 11 | 14 | |||||||||
Tax on items that may be reclassified to profit or loss | 35 | — | — | |||||||||
|
|
|
|
|
| |||||||
Total other comprehensive income (loss), net of tax | -1,286 | 652 | 100 | |||||||||
|
|
|
|
|
| |||||||
Total comprehensive income (loss) | 1,117 | -73 | -6,176 | |||||||||
|
|
|
|
|
| |||||||
Total comprehensive income (loss) attributable to: | ||||||||||||
Stockholders of the Parent Company | 1,010 | -200 | -6,470 | |||||||||
Non-controlling interest | 107 | 127 | 294 | |||||||||
| 18 Ericsson | First Quarter Report 2019 | Financial statements | |
SEK million | Mar 31 2019 | Dec 31 2018 | ||||||
ASSETS | ||||||||
Non-current assets | ||||||||
Intangible assets | ||||||||
Capitalized development expenses | 3,971 | 4,237 | ||||||
Goodwill | 30,870 | 30,035 | ||||||
Intellectual property rights, brands and other intangible assets | 2,682 | 3,474 | ||||||
Property, plant and equipment | 13,188 | 12,849 | ||||||
Right-of-use assets | 8,440 | — | ||||||
Financial assets | ||||||||
Equity in JV and associated companies | 1,830 | 611 | ||||||
Other investments in shares and participations | 1,366 | 1,515 | ||||||
Customer finance,non-current | 1,932 | 1,180 | ||||||
Interest-bearing securities,non-current | 23,022 | 23,982 | ||||||
Other financial assets,non-current | 6,056 | 6,559 | ||||||
Deferred tax assets | 29,689 | 23,152 | ||||||
|
|
|
| |||||
| 123,046 | 107,594 | |||||||
|
|
|
| |||||
Current assets | ||||||||
Inventories | 33,024 | 29,255 | ||||||
Contract assets | 11,411 | 13,178 | ||||||
Trade receivables | 50,529 | 51,172 | ||||||
Customer finance, current | 1,955 | 1,704 | ||||||
Other current receivables | 15,357 | 20,844 | ||||||
Interest-bearing securities, current | 3,183 | 6,625 | ||||||
Cash and cash equivalents | 45,453 | 38,389 | ||||||
|
|
|
| |||||
| 160,912 | 161,167 | |||||||
|
|
|
| |||||
Total assets | 283,958 | 268,761 | ||||||
|
|
|
| |||||
EQUITY AND LIABILITIES | ||||||||
Equity | ||||||||
Stockholders’ equity | 84,619 | 86,978 | ||||||
Non-controlling interest in equity of subsidiaries | -87 | 792 | ||||||
|
|
|
| |||||
| 84,532 | 87,770 | |||||||
|
|
|
| |||||
Non-current liabilities | ||||||||
Post-employment benefits | 30,714 | 28,720 | ||||||
Provisions,non-current | 2,670 | 5,471 | ||||||
Deferred tax liabilities | 792 | 670 | ||||||
Borrowings,non-current | 32,533 | 30,870 | ||||||
Lease liabilities,non-current | 8,470 | — | ||||||
Othernon-current liabilities | 2,118 | 4,346 | ||||||
|
|
|
| |||||
| 77,297 | 70,077 | |||||||
|
|
|
| |||||
Current liabilities | ||||||||
Provisions, current | 9,363 | 10,537 | ||||||
Borrowings, current | 3,015 | 2,255 | ||||||
Lease liabilities, current | 1,776 | — | ||||||
Contract liabilities | 38,605 | 29,348 | ||||||
Trade payables | 30,842 | 29,883 | ||||||
Other current liabilities | 38,528 | 38,891 | ||||||
|
|
|
| |||||
| 122,129 | 110,914 | |||||||
|
|
|
| |||||
Total equity and liabilities | 283,958 | 268,761 | ||||||
|
|
|
| |||||
Assets pledged as collateral | 5,657 | 5,681 | ||||||
Contingent liabilities1) | 1,470 | 1,638 | ||||||
| 1) | Contingent liabilities does not include any amounts related to investigation by the SEC and the DOJ about Ericsson’s compliance with the U.S. Foreign Corrupt Practices Act (FCPA). For information about the investigation by the SEC and the DOJ, please refer to “Other information” on page 13 of this report. |
| 19 Ericsson | First Quarter Report 2019 | Financial statements | |
Consolidated statement of cash flows
| Jan-Mar | Jan-Dec 2018 | |||||||||||
SEK million | 2019 | 2018 | ||||||||||
Operating activities | ||||||||||||
Net income (loss) | 2,403 | -725 | -6,276 | |||||||||
Adjustments to reconcile net income to cash | ||||||||||||
Taxes | 804 | -2,315 | -1,897 | |||||||||
Earnings/dividends in JV and associated companies | 24 | 4 | -23 | |||||||||
Depreciation, amortization and impairment losses | 2,326 | 1,891 | 8,318 | |||||||||
Other | -76 | 140 | 1,432 | |||||||||
|
|
|
|
|
| |||||||
Net income reconciled to cash | 5,481 | -1,005 | 1,554 | |||||||||
|
|
|
|
|
| |||||||
Changes in operating net assets | ||||||||||||
Inventories | -2,951 | -2,813 | -4,807 | |||||||||
Customer finance, current andnon-current | -911 | 400 | 1,085 | |||||||||
Trade receivables and contract assets | 4,345 | 7,316 | -2,047 | |||||||||
Trade payables | 20 | -598 | 2,436 | |||||||||
Provisions and post-employment benefits | -3,459 | -847 | 6,696 | |||||||||
Contract liabilities | 8,463 | 757 | -808 | |||||||||
Other operating assets and liabilities, net | -5,223 | -1,637 | 5,233 | |||||||||
|
|
|
|
|
| |||||||
| 284 | 2,578 | 7,788 | ||||||||||
|
|
|
|
|
| |||||||
Cash flow from operating activities | 5,765 | 1,573 | 9,342 | |||||||||
Investing activities | ||||||||||||
Investments in property, plant and equipment | -1,314 | -856 | -3,975 | |||||||||
Sales of property, plant and equipment | 232 | 123 | 334 | |||||||||
Acquisitions/divestments of subsidiaries and other operations, net | 299 | -449 | -1,285 | |||||||||
Product development | -457 | -254 | -925 | |||||||||
Other investing activities | -165 | 161 | -523 | |||||||||
Interest-bearing securities | 4,673 | -534 | 2,242 | |||||||||
|
|
|
|
|
| |||||||
Cash flow from investing activities | 3,268 | -1,809 | -4,132 | |||||||||
|
|
|
|
|
| |||||||
Cash flow before financing activities | 9,033 | -236 | 5,210 | |||||||||
Financing activities | ||||||||||||
Dividends paid | -986 | — | -3,425 | |||||||||
Lease liabilities | -604 | — | — | |||||||||
Other financing activities | -1,010 | -94 | -652 | |||||||||
|
|
|
|
|
| |||||||
Cash flow from financing activities | -2,600 | -94 | -4,077 | |||||||||
|
|
|
|
|
| |||||||
Effect of exchange rate changes on cash | 631 | 1,143 | 1,372 | |||||||||
Net change in cash and cash equivalents | 7,064 | 813 | 2,505 | |||||||||
|
|
|
|
|
| |||||||
Cash and cash equivalents, beginning of period | 38,389 | 35,884 | 35,884 | |||||||||
|
|
|
|
|
| |||||||
Cash and cash equivalents, end of period | 45,453 | 36,697 | 38,389 | |||||||||
|
|
|
|
|
| |||||||
| 20 Ericsson | First Quarter Report 2019 | Financial statements | |
Consolidated statement of changes in equity
| Jan-Mar | Jan-Dec 2018 | |||||||||||
SEK million | 2019 | 2018 | ||||||||||
Opening balance1) | 87,770 | 97,571 | 97,571 | |||||||||
Adjustment due to new accounting standards2) | -249 | -983 | -983 | |||||||||
|
|
|
|
|
| |||||||
Adjusted opening balance | 87,521 | 96,588 | 96,588 | |||||||||
|
|
|
|
|
| |||||||
Total comprehensive income (loss) | 1,117 | -73 | -6,176 | |||||||||
Sale/repurchase of own shares | 43 | 21 | 107 | |||||||||
Stock issue (net) | — | — | — | |||||||||
Long-term variable compensation plans | 139 | 217 | 677 | |||||||||
Dividends paid | -4,288 | -3,287 | 3) | -3,425 | ||||||||
Transactions withnon-controlling interests | — | — | -1 | |||||||||
|
|
|
|
|
| |||||||
Closing balance | 84,532 | 93,466 | 87,770 | |||||||||
|
|
|
|
|
| |||||||
| 1) | Opening balance of 2018 has been restated for IFRS 15. |
| 2) | Opening balance adjustment in 2019 due to IFRS 16, and in 2018 due to IFRS 9. |
| 3) | Includes accrual of SEK 3,302 (3,287) million for the dividend approved by the Annual General Meeting on March 27, 2019 (March 28, 2018). |
Consolidated income statement - isolated quarters
| 2019 Q1 | 2018 | |||||||||||||||||||
Isolated quarters, SEK million | Q4 | Q3 | Q2 | Q1 | ||||||||||||||||
Net sales | 48,906 | 63,809 | 53,810 | 49,808 | 43,411 | |||||||||||||||
Cost of sales | -30,127 | -47,430 | -34,180 | -32,475 | -28,553 | |||||||||||||||
|
|
|
|
|
|
|
|
|
| |||||||||||
Gross income | 18,779 | 16,379 | 19,630 | 17,333 | 14,858 | |||||||||||||||
|
|
|
|
|
|
|
|
|
| |||||||||||
Gross margin (%) | 38.4 | % | 25.7 | % | 36.5 | % | 34.8 | % | 34.2 | % | ||||||||||
Research and development expenses | -9,167 | -10,665 | -9,388 | -9,783 | -9,073 | |||||||||||||||
Selling and administrative expenses | -6,031 | -7,685 | -6,625 | -7,053 | -6,156 | |||||||||||||||
Impairment losses on trade receivables1) | 559 | 386 | -409 | -369 | -28 | |||||||||||||||
|
|
|
|
|
|
|
|
|
| |||||||||||
Operating expenses | -14,639 | -17,964 | -16,422 | -17,205 | -15,257 | |||||||||||||||
|
|
|
|
|
|
|
|
|
| |||||||||||
Other operating income and expenses | 773 | -294 | 31 | 11 | 84 | |||||||||||||||
Shares in earnings of JV and associated companies | -17 | 27 | 2 | 26 | 3 | |||||||||||||||
|
|
|
|
|
|
|
|
|
| |||||||||||
Operating income (loss) | 4,896 | -1,852 | 3,241 | 165 | -312 | |||||||||||||||
|
|
|
|
|
|
|
|
|
| |||||||||||
Financial income | 38 | -294 | -225 | 275 | -72 | |||||||||||||||
Financial expenses | -643 | -421 | -414 | -1,085 | -469 | |||||||||||||||
|
|
|
|
|
|
|
|
|
| |||||||||||
Income after financial items | 4,291 | -2,567 | 2,602 | -645 | -853 | |||||||||||||||
|
|
|
|
|
|
|
|
|
| |||||||||||
Taxes | -1,888 | -3,930 | 146 | -1,157 | 128 | |||||||||||||||
|
|
|
|
|
|
|
|
|
| |||||||||||
Net income (loss) | 2,403 | -6,497 | 2,748 | -1,802 | -725 | |||||||||||||||
|
|
|
|
|
|
|
|
|
| |||||||||||
Net income (loss) attributable to: | ||||||||||||||||||||
Stockholders of the Parent Company | 2,317 | -6,553 | 2,745 | -1,885 | -837 | |||||||||||||||
Non-controlling interests | 86 | 56 | 3 | 83 | 112 | |||||||||||||||
Other information | ||||||||||||||||||||
Average number of shares, basic (million) | 3,300 | 3,296 | 3,293 | 3,290 | 3,286 | |||||||||||||||
Earnings (loss) per share, basic (SEK)2) | 0.70 | -1.99 | 0.84 | -0.58 | -0.25 | |||||||||||||||
Earnings (loss) per share, diluted (SEK)3) | 0.70 | -1.99 | 0.83 | -0.58 | -0.25 | |||||||||||||||
| 1) | Impairment of trade receivables has been calculated according to IFRS 9 in 2018. |
| 2) | Based on net income (loss) attributable to stockholders of the Parent Company. |
| 3) | Potential ordinary shares are not considered when their conversion to ordinary shares would increase earnings per share. |
| 21 Ericsson | First Quarter Report 2019 | Financial statements | |
Consolidated statement of cash flows - isolated quarters
| 2019 Q1 | 2018 | |||||||||||||||||||
Isolated quarters, SEK million | Q4 | Q3 | Q2 | Q1 | ||||||||||||||||
Operating activities | ||||||||||||||||||||
Net income (loss) | 2,403 | -6,497 | 2,748 | -1,802 | -725 | |||||||||||||||
Adjustments to reconcile net income to cash | ||||||||||||||||||||
Taxes | 804 | 3,590 | -2,101 | -1,071 | -2,315 | |||||||||||||||
Earnings/dividends in JV and associated companies | 24 | -36 | 28 | -19 | 4 | |||||||||||||||
Depreciation, amortization and impairment losses | 2,326 | 2,469 | 1,893 | 2,065 | 1,891 | |||||||||||||||
Other | -76 | 376 | 348 | 568 | 140 | |||||||||||||||
|
|
|
|
|
|
|
|
|
| |||||||||||
Net income reconciled to cash | 5,481 | -98 | 2,916 | -259 | -1,005 | |||||||||||||||
|
|
|
|
|
|
|
|
|
| |||||||||||
Changes in operating net assets | ||||||||||||||||||||
Inventories | -2,951 | 1,689 | -1,773 | -1,910 | -2,813 | |||||||||||||||
Customer finance, current andnon-current | -911 | -863 | 1,001 | 547 | 400 | |||||||||||||||
Trade receivables and contract assets | 4,345 | -7,521 | -3,503 | 1,661 | 7,316 | |||||||||||||||
Trade payables | 20 | 829 | 953 | 1,252 | -598 | |||||||||||||||
Provisions and post-employment benefits | -3,459 | 7,330 | -265 | 478 | -847 | |||||||||||||||
Contract liabilities | 8,463 | -1,112 | -220 | -233 | 757 | |||||||||||||||
Other operating assets and liabilities, net | -5,223 | 4,033 | 2,931 | -94 | -1,637 | |||||||||||||||
|
|
|
|
|
|
|
|
|
| |||||||||||
| 284 | 4,385 | -876 | 1,701 | 2,578 | ||||||||||||||||
|
|
|
|
|
|
|
|
|
| |||||||||||
Cash flow from operating activities | 5,765 | 4,287 | 2,040 | 1,442 | 1,573 | |||||||||||||||
|
|
|
|
|
|
|
|
|
| |||||||||||
Investing activities | ||||||||||||||||||||
Investments in property, plant and equipment | -1,314 | -1,080 | -1,088 | -951 | -856 | |||||||||||||||
Sales of property, plant and equipment | 232 | 57 | 102 | 52 | 123 | |||||||||||||||
Acquisitions/divestments of subsidiaries and other operations, net | 299 | 20 | -425 | -431 | -449 | |||||||||||||||
Product development | -457 | -195 | -151 | -325 | -254 | |||||||||||||||
Other investing activities | -165 | -96 | -190 | -398 | 161 | |||||||||||||||
Interest-bearing securities | 4,673 | -910 | 30 | 3,656 | -534 | |||||||||||||||
|
|
|
|
|
|
|
|
|
| |||||||||||
Cash flow from investing activities | 3,268 | -2,204 | -1,722 | 1,603 | -1,809 | |||||||||||||||
|
|
|
|
|
|
|
|
|
| |||||||||||
Cash flow before financing activities | 9,033 | 2,083 | 318 | 3,045 | -236 | |||||||||||||||
|
|
|
|
|
|
|
|
|
| |||||||||||
Financing activities | ||||||||||||||||||||
Dividends paid | -986 | -134 | -2 | -3,289 | — | |||||||||||||||
Lease liabilities | -604 | — | — | — | — | |||||||||||||||
Other financing activities | -1,010 | -429 | 254 | -383 | -94 | |||||||||||||||
|
|
|
|
|
|
|
|
|
| |||||||||||
Cash flow from financing activities | -2,600 | -563 | 252 | -3,672 | -94 | |||||||||||||||
|
|
|
|
|
|
|
|
|
| |||||||||||
Effect of exchange rate changes on cash | 631 | 811 | -1,562 | 980 | 1,143 | |||||||||||||||
Net change in cash and cash equivalents | 7,064 | 2,331 | -992 | 353 | 813 | |||||||||||||||
|
|
|
|
|
|
|
|
|
| |||||||||||
Cash and cash equivalents, beginning of period | 38,389 | 36,058 | 37,050 | 36,697 | 35,884 | |||||||||||||||
|
|
|
|
|
|
|
|
|
| |||||||||||
Cash and cash equivalents, end of period | 45,453 | 38,389 | 36,058 | 37,050 | 36,697 | |||||||||||||||
|
|
|
|
|
|
|
|
|
| |||||||||||
| 22 Ericsson | First Quarter Report 2019 | Financial statements | |
Parent Company income statement
| Jan-Mar | Jan-Dec | |||||||||||
SEK million | 2019 | 2018 | 2018 | |||||||||
Net sales | — | — | — | |||||||||
Cost of sales | — | — | — | |||||||||
Gross income | — | — | — | |||||||||
Operating expenses | -521 | -154 | -1,686 | |||||||||
Other operating income and expenses | 451 | 343 | 2,111 | |||||||||
|
|
|
|
|
| |||||||
Operating income | -70 | 189 | 425 | |||||||||
|
|
|
|
|
| |||||||
Financial net | -53 | 177 | 5,340 | |||||||||
|
|
|
|
|
| |||||||
Income after financial items | -123 | 366 | 5,765 | |||||||||
|
|
|
|
|
| |||||||
Transfers to (–) / from untaxed reserves | — | — | -1,535 | |||||||||
Taxes | -31 | -83 | -36 | |||||||||
|
|
|
|
|
| |||||||
Net income (loss) | -154 | 283 | 4,194 | |||||||||
|
|
|
|
|
| |||||||
Parent Company statement of comprehensive income (loss)
| Jan-Mar | Jan-Dec | |||||||||||
SEK million | 2019 | 2018 | 2018 | |||||||||
Net income (loss) | -154 | 283 | 4,194 | |||||||||
Revaluation of borrowings due to change in credit risk | -336 | 58 | 91 | |||||||||
Tax on items that will not be reclassified to profit or loss | 69 | -13 | -19 | |||||||||
Available-for-sale financial assets | ||||||||||||
Gains/losses arising during the period | — | — | — | |||||||||
Reclassification adjustments on gains/losses included in profit or loss | — | — | — | |||||||||
Revaluation of other investments in shares and participations | ||||||||||||
Fair value remeasurement | — | — | — | |||||||||
Tax on items that may be reclassified to profit or loss | — | — | — | |||||||||
|
|
|
|
|
| |||||||
Total other comprehensive income, net of tax | -267 | 45 | 72 | |||||||||
|
|
|
|
|
| |||||||
Total comprehensive income (loss) | -421 | 328 | 4,266 | |||||||||
|
|
|
|
|
| |||||||
| 23 Ericsson | First Quarter Report 2019 | Financial statements | |
| Mar 31 | Dec 31 | |||||||
SEK million | 2019 | 2018 | ||||||
ASSETS | ||||||||
Fixed assets | ||||||||
Intangible assets | 83 | 139 | ||||||
Tangible assets | 264 | 259 | ||||||
Financial assets1)2) | 110,377 | 109,177 | ||||||
|
|
|
| |||||
| 110,724 | 109,575 | |||||||
|
|
|
| |||||
Current assets | ||||||||
Inventories | — | — | ||||||
Receivables2) | 27,425 | 38,760 | ||||||
Short-term investments | 2,707 | 6,268 | ||||||
Cash and cash equivalents | 34,851 | 27,850 | ||||||
|
|
|
| |||||
| 64,983 | 72,878 | |||||||
|
|
|
| |||||
Total assets | 175,707 | 182,453 | ||||||
|
|
|
| |||||
STOCKHOLDERS’ EQUITY, PROVISIONS AND LIABILITIES | ||||||||
Equity | ||||||||
Restricted equity | 48,164 | 48,164 | ||||||
Non-restricted equity2) | 37,016 | 40,752 | ||||||
|
|
|
| |||||
| 85,180 | 88,916 | |||||||
|
|
|
| |||||
Provisions | 61 | 86 | ||||||
Non-current liabilities2) | 40,051 | 62,581 | ||||||
Current liabilities | 50,415 | 30,870 | ||||||
|
|
|
| |||||
Total stockholders’ equity, provisions and liabilities | 175,707 | 182,453 | ||||||
|
|
|
| |||||
1) Of which interest-bearing securities,non-current | 23,022 | 23,982 | ||||||
|
|
|
| |||||
2) The following 2018 opening balances have been adjusted due to IFRS 9: financial assets increased by SEK 8 million, receivables decreased by SEK -4 million,non-restricted equity decreased by SEK -28 million, andnon-current liabilities increased by SEK 31 million. |
| |||||||
| 24 Ericsson | First Quarter Report 2019 | Financial statements | |
The group
This interim report is prepared in accordance with IAS 34. The term “IFRS” used in this document refers to the application of IAS and IFRS as well as interpretations of these standards as issued by IASB’s Standards Interpretation Committee (SIC) and IFRS Interpretations Committee (IFRIC). The accounting policies adopted are consistent with those of the annual report for the year ended December 31, 2018 and should be read in conjunction with that annual report, with exception for the accounting policies described below.
New standards as from January 1, 2019
One new IFRS standard IFRS 16 “Leases” and one new interpretation IFRIC 23 “Uncertainty over income tax treatments” are effective as from January 1, 2019. IFRIC 23, has not had a material impact on the Company’s financial statements.
IFRS 16 – Leases
Presentation in the financial statements
The Company has implemented this standard using the cumulativecatch-up method, which means that the prior periods financial statements and key ratios presented in this quarterly report have not been restated to reflect adoption of this new standard.
Based on the new requirements under IFRS 16,right-of-use assets and lease liabilities have been added as new lines in the consolidated balance sheet and lease liabilities as a new line in the statement of cash flows. Theright-of-use assets and liabilities were previously reported asoff-balance and repayment to lessors was reported as a part of cash flow from operating activities. Now the amortization of lease liabilities is reported as cash flow from financing activities.
Transition
The standard is effective for annual periods beginning on or after January 1, 2019. The Company has applied the new standard as from January 1, 2019. At transition, the Company has applied the practical expedient under IFRS 16 to not reassess whether a contract is, or contains, a lease. Therefore, the Company has applied the standard to contracts previously identified as leases, or as containing a lease under IAS 17 and IFRIC 4. The Company has also applied the following practical expedients when applying IFRS 16 at transition date:
| • | The IAS 37 onerous lease contract measurement for the operating leases existing as per the transition date. This expedient has been applied as a substitute for the measurement of impairment for the relatedright-of-use assets. Impairment testing will be applied going-forward. |
| • | Exclusion of initial direct costs from the measurement of theright-to-use asset at the date of initial recognition. |
The Company has implemented the standard using the cumulativecatch-up method, with the cumulative effect being adjusted to the opening retained earnings balance in equity at transition date. No restated information has been presented for previous years.
The Company has, as a lessee, recognized lease liabilities for leases previously classified as operating leases. The weighted average incremental borrowing rate applied to lease liabilities recognized in the balance sheet at the transition date was 5.4%.Right-of-use assets have for most contracts been recognized based on the amount equal to the related lease liability. For some larger real estate contractsright-of-use assets have been recognized as if IFRS 16 had been applied since the commencement date, however, using the incremental borrowing rate as per the effective date. The asset value for these contracts is SEK 249 million lower than the related liabilities. This difference causes the reduction of equity as per transition date.
Under IAS 17 operating leases were not recognized in the balance sheet of a lessee. Future undiscounted minimum lease payments obligations were however disclosed in a note, see note C3 Leasing in the annual report of 2018, amounting to SEK 13.4 billion. The lease liabilities were as per January 1st, 2019 recognized in the balance sheet with SEK 10.4 billion. The difference is mainly related to the discounting effect of the liability. The liability is calculated as the net present value of the future payments, while the numbers disclosed according to IAS 17 was not discounted – as prescribed in IAS 17. And also, the exclusion of lease payments related tolow-value assets from the balance sheet, they are instead expensed straight-line in the income statement.
Opening balance sheet impact of IFRS 16
SEK million | IFRS 16 adjustment | |||
Right-of-use assets | 8,651 | |||
Lease liabilities, current | 2,195 | |||
Lease liabilities,non-current | 8,203 | |||
Equity | 249 | |||
In the transition the following items have been considered: Onerous contracts with SEK 767 million, straight-lining, periodization of lease costs, with SEK 721 million and other net adjustments with SEK 10 million. The tax effect on the equity posting is deemed to be immaterial. There is no impact on the income statement.
The impact ofright-of-use assets increased the total asset value by approximately 3%.
Accounting policy—IFRS 16 Leases
Leasing when the Company is the lessee
The main types of assets leased by the Company are, in the order of materiality, real estate,IT-equipment and vehicles. Vehicles are mainly used under service contracts.
The Company recognizesright-of-use assets and lease liabilities arising from all leases in the balance sheet, with some exceptions. This model reflects that, at the start of a lease, the lessee always obtains the right to use an asset for a period of time and has an obligation to pay for that right.
| 25 Ericsson | First Quarter Report 2019 | Additional information | |
In the assessment of a lease contract the lease components are separated fromnon-lease components and the lease term is defined considering any extension or termination options.
The lease liability is initially measured at the present value of the lease payments that are not paid at the commencement date, discounted normally using the Company’s incremental borrowing rate. Lease payments included in the liability are fixed payments, variable payments depending on an index or rate, residual values and penalties for termination of contracts.
Theright-of-use asset is initially measured at cost, which equals the amount of the initial measurement of lease liability adjusted for any lease payments made at or before the commencement date less any lease incentives received plus any initial direct costs, and restoration costs.
The Company applies the recognition exemption for short-term leases and leases for which the underlying asset is oflow-value recognizing the lease payments for those leases as an expense on a straight-line basis over the lease term.
Leasing when the Company is the lessor
Leasing contracts with the Company as lessor are classified as finance leases when the majority of risks and rewards are transferred to the lessee, and otherwise as operating leases. Under a finance lease, a receivable is recognized at an amount equal to the net investment in the lease and revenue is recognized in accordance with the revenue recognition principles. Under operating leases the equipment is recorded as property, plant and equipment and revenue as well as depreciation is recognized on a straight-line basis over the lease term.
APM impact in Q1 2019
Lease interest expense is reported under finance costs according to IFRS 16, which is different from prior to 2019, when it was embedded in the lease expense for operating leases, either as costs of sales or operating expenses. This has had a positive impact on the APM operating margin of approximately 0.3 percentage points, because lease interest expense is no longer a part of this measurement. The EBITA has increased with SEK 138 million for the same reason.
The reported amortization of lease liabilities is reported as financing cash flows under IFRS 16 and not as operating cash flows as prior to 2019. The impact of this reclassification is in Q1 2019 is SEK 604 million and impacts the APM Free cash flow. The APM Cash conversion has also improved for the same reason. The timing of the cash flows is not impacted.
Becauseright-of-use assets under IFRS 16 are included in total assets the APM capital employed has increased by approximately 5%. The APM equity ratio has decreased for the same reason.
Cash flow hedge accounting
The company has identified certain customer contracts where a fluctuation in the USD/SEK foreign exchange rate would significantly impact net sales and operating income recorded from the contracts. These contracts are multi-year contracts denominated in USD with highly probable payments at fixed points in time. From Q1 2019, the Company has entered into FX forward contracts that match the terms of the foreign exchange exposure as closely as possible and designated these as hedging instruments.
When applying hedge accounting, the effective portion of changes in the fair value of derivatives that are designated and qualify as cash flow hedges is recognized in OCI. The gain or loss relating to an ineffective portion is recognized immediately in the Income Statement within Financial income or expense. Upon recognition of the hedged net sales, the cumulative amount in cash flow hedge reserve is released from OCI as a reclassification adjustment and recognized in net sales.
Changes applied in Q1 2019
As of Q1 2019, sales reported on Morocco is reported on market area Middle East and Africa (earlier Europe and Latin America). Comparative periods have been restated to reflect this change. In Q1 2019, these sales were SEK 151 (103) million. Also “Number of employees” by market area has been updated to reflect this change.
| 26 Ericsson | First Quarter Report 2019 | Additional information | |
Net sales by segment by quarter
| 2019 | 2018 | |||||||||||||||||||
Isolated quarters, SEK million | Q1 | Q4 | Q3 | Q2 | Q1 | |||||||||||||||
Networks | 33,481 | 41,641 | 35,934 | 32,393 | 28,602 | |||||||||||||||
Of which Products | 23,765 | 29,803 | 25,336 | 22,319 | 19,473 | |||||||||||||||
Of which Services | 9,716 | 11,838 | 10,598 | 10,074 | 9,129 | |||||||||||||||
Digital Services | 7,817 | 13,007 | 8,987 | 8,833 | 7,262 | |||||||||||||||
Of which Products | 3,937 | 7,462 | 4,582 | 4,467 | 3,947 | |||||||||||||||
Of which Services | 3,880 | 5,545 | 4,405 | 4,366 | 3,315 | |||||||||||||||
Managed Services | 5,856 | 6,881 | 6,465 | 6,528 | 5,896 | |||||||||||||||
Emerging Business and Other | 1,752 | 2,280 | 2,424 | 2,054 | 1,651 | |||||||||||||||
|
|
|
|
|
|
|
|
|
| |||||||||||
Total | 48,906 | 63,809 | 53,810 | 49,808 | 43,411 | |||||||||||||||
|
|
|
|
|
|
|
|
|
| |||||||||||
| 2019 | 2018 | |||||||||||||||||||
Sequential change, percent | Q1 | Q4 | Q3 | Q2 | Q1 | |||||||||||||||
Networks | -20 | % | 16 | % | 11 | % | 13 | % | -23 | % | ||||||||||
Of which Products | -20 | % | 18 | % | 14 | % | 15 | % | -23 | % | ||||||||||
Of which Services | -18 | % | 12 | % | 5 | % | 10 | % | -22 | % | ||||||||||
Digital Services | -40 | % | 45 | % | 2 | % | 22 | % | -39 | % | ||||||||||
Of which Products | -47 | % | 63 | % | 3 | % | 13 | % | -39 | % | ||||||||||
Of which Services | -30 | % | 26 | % | 1 | % | 32 | % | -38 | % | ||||||||||
Managed Services | -15 | % | 6 | % | -1 | % | 11 | % | -15 | % | ||||||||||
Emerging Business and Other | -23 | % | -6 | % | 18 | % | 24 | % | -21 | % | ||||||||||
|
|
|
|
|
|
|
|
|
| |||||||||||
Total | -23 | % | 19 | % | 8 | % | 15 | % | -25 | % | ||||||||||
|
|
|
|
|
|
|
|
|
| |||||||||||
| 2019 | 2018 | |||||||||||||||||||
Year over year change, percent | Q1 | Q4 | Q3 | Q2 | Q1 | |||||||||||||||
Networks | 17 | % | 12 | % | 13 | % | 2 | % | -10 | % | ||||||||||
Of which Products | 22 | % | 17 | % | 17 | % | 5 | % | -11 | % | ||||||||||
Of which Services | 6 | % | 1 | % | 5 | % | -3 | % | -7 | % | ||||||||||
Digital Services | 8 | % | 10 | % | 1 | % | -11 | % | -10 | % | ||||||||||
Of which Products | 0 | % | 16 | % | -6 | % | -17 | % | -9 | % | ||||||||||
Of which Services | 17 | % | 3 | % | 8 | % | -4 | % | -12 | % | ||||||||||
Managed Services | -1 | % | 0 | % | -2 | % | -2 | % | -6 | % | ||||||||||
Emerging Business and Other | 6 | % | 9 | % | 22 | % | 2 | % | -7 | % | ||||||||||
|
|
|
|
|
|
|
|
|
| |||||||||||
Total | 13 | % | 10 | % | 9 | % | -1 | % | -9 | % | ||||||||||
|
|
|
|
|
|
|
|
|
| |||||||||||
| 2019 | 2018 | |||||||||||||||||||
Year to date, SEK million | Jan-Mar | Jan-Dec | Jan-Sep | Jan-Jun | Jan-Mar | |||||||||||||||
Networks | 33,481 | 138,570 | 96,929 | 60,995 | 28,602 | |||||||||||||||
Of which Products | 23,765 | 96,931 | 67,128 | 41,792 | 19,473 | |||||||||||||||
Of which Services | 9,716 | 41,639 | 29,801 | 19,203 | 9,129 | |||||||||||||||
Digital Services | 7,817 | 38,089 | 25,082 | 16,095 | 7,262 | |||||||||||||||
Of which Products | 3,937 | 20,458 | 12,996 | 8,414 | 3,947 | |||||||||||||||
Of which Services | 3,880 | 17,631 | 12,086 | 7,681 | 3,315 | |||||||||||||||
Managed Services | 5,856 | 25,770 | 18,889 | 12,424 | 5,896 | |||||||||||||||
Emerging Business and Other | 1,752 | 8,409 | 6,129 | 3,705 | 1,651 | |||||||||||||||
|
|
|
|
|
|
|
|
|
| |||||||||||
Total | 48,906 | 210,838 | 147,029 | 93,219 | 43,411 | |||||||||||||||
|
|
|
|
|
|
|
|
|
| |||||||||||
| 2019 | 2018 | |||||||||||||||||||
Year over year change, percent | Jan-Mar | Jan-Dec | Jan-Sep | Jan-Jun | Jan-Mar | |||||||||||||||
Networks | 17 | % | 5 | % | 2 | % | -4 | % | -10 | % | ||||||||||
Of which Products | 22 | % | 7 | % | 3 | % | -3 | % | -11 | % | ||||||||||
Of which Services | 6 | % | -1 | % | -2 | % | -5 | % | -7 | % | ||||||||||
Digital Services | 8 | % | -2 | % | -7 | % | -11 | % | -10 | % | ||||||||||
Of which Products | 0 | % | -3 | % | -11 | % | -13 | % | -9 | % | ||||||||||
Of which Services | 17 | % | -1 | % | -2 | % | -8 | % | -12 | % | ||||||||||
Managed Services | -1 | % | -3 | % | -3 | % | -4 | % | -6 | % | ||||||||||
Emerging Business and Other | 6 | % | 7 | % | 6 | % | -2 | % | -7 | % | ||||||||||
|
|
|
|
|
|
|
|
|
| |||||||||||
Total | 13 | % | 3 | % | 0 | % | -5 | % | -9 | % | ||||||||||
|
|
|
|
|
|
|
|
|
| |||||||||||
| 27 Ericsson | First Quarter Report 2019 | Additional information | |
Sales growth adjusted for comparable units and currency
| 28 Ericsson | First Quarter Report 2019 | Additional information | |
Operating income (loss) and operating margin by segment by quarter
| 2019 | 2018 | |||||||||||||||||||
Isolated quarters, SEK million | Q1 | Q4 | Q3 | Q2 | Q1 | |||||||||||||||
Networks | 5,472 | 6,850 | 5,656 | 3,544 | 3,371 | |||||||||||||||
Digital Services | -1,798 | -7,087 | -1,784 | -2,374 | -2,607 | |||||||||||||||
Managed Services | 1,252 | 285 | 409 | 299 | 100 | |||||||||||||||
Emerging Business and Other | -30 | -1,900 | -1,040 | -1,304 | -1,176 | |||||||||||||||
|
|
|
|
|
|
|
|
|
| |||||||||||
Total | 4,896 | -1,852 | 3,241 | 165 | -312 | |||||||||||||||
|
|
|
|
|
|
|
|
|
| |||||||||||
| 2019 | 2018 | |||||||||||||||||||
Isolated quarters, As percentage of net sales | Q1 | Q4 | Q3 | Q2 | Q1 | |||||||||||||||
Networks | 16.3 | % | 16.5 | % | 15.7 | % | 10.9 | % | 11.8 | % | ||||||||||
Digital Services | -23.0 | % | -54.5 | % | -19.9 | % | -26.9 | % | -35.9 | % | ||||||||||
Managed Services | 21.4 | % | 4.1 | % | 6.3 | % | 4.6 | % | 1.7 | % | ||||||||||
Emerging Business and Other | -1.7 | % | -83.3 | % | -42.9 | % | -63.5 | % | -71.2 | % | ||||||||||
|
|
|
|
|
|
|
|
|
| |||||||||||
Total | 10.0 | % | -2.9 | % | 6.0 | % | 0.3 | % | -0.7 | % | ||||||||||
|
|
|
|
|
|
|
|
|
| |||||||||||
| 2019 | 2018 | |||||||||||||||||||
Year to date, SEK million | Jan-Mar | Jan-Dec | Jan-Sep | Jan-Jun | Jan-Mar | |||||||||||||||
Networks | 5,472 | 19,421 | 12,571 | 6,915 | 3,371 | |||||||||||||||
Digital Services | -1,798 | -13,852 | -6,765 | -4,981 | -2,607 | |||||||||||||||
Managed Services | 1,252 | 1,093 | 808 | 399 | 100 | |||||||||||||||
Emerging Business and Other | -30 | -5,420 | -3,520 | -2,480 | -1,176 | |||||||||||||||
|
|
|
|
|
|
|
|
|
| |||||||||||
Total | 4,896 | 1,242 | 3,094 | -147 | -312 | |||||||||||||||
|
|
|
|
|
|
|
|
|
| |||||||||||
| 2019 | 2018 | |||||||||||||||||||
Year to date As percentage of net sales | Jan-Mar | Jan-Dec | Jan-Sep | Jan-Jun | Jan-Mar | |||||||||||||||
Networks | 16.3 | % | 14.0 | % | 13.0 | % | 11.3 | % | 11.8 | % | ||||||||||
Digital Services | -23.0 | % | -36.4 | % | -27.0 | % | -30.9 | % | -35.9 | % | ||||||||||
Managed Services | 21.4 | % | 4.2 | % | 4.3 | % | 3.2 | % | 1.7 | % | ||||||||||
Emerging Business and Other | -1.7 | % | -64.5 | % | -57.4 | % | -66.9 | % | -71.2 | % | ||||||||||
|
|
|
|
|
|
|
|
|
| |||||||||||
Total | 10.0 | % | 0.6 | % | 2.1 | % | -0.2 | % | -0.7 | % | ||||||||||
|
|
|
|
|
|
|
|
|
| |||||||||||
| 29 Ericsson | First Quarter Report 2019 | Additional information | |
EBITA and EBITA margin by segment by quarter
| 2019 | 2018 | |||||||||||||||||||
Isolated quarters, SEK million | Q1 | Q4 | Q3 | Q2 | Q1 | |||||||||||||||
Networks | 5,552 | 6,916 | 5,722 | 3,618 | 3,461 | |||||||||||||||
Digital Services | -1,638 | -6,911 | -1,608 | -2,204 | -2,443 | |||||||||||||||
Managed Services | 1,253 | 288 | 411 | 303 | 105 | |||||||||||||||
Emerging Business and Other | 43 | -1,524 | -940 | -1,202 | -1,088 | |||||||||||||||
|
|
|
|
|
|
|
|
|
| |||||||||||
Total | 5,210 | -1,231 | 3,585 | 515 | 35 | |||||||||||||||
|
|
|
|
|
|
|
|
|
| |||||||||||
| 2019 | 2018 | |||||||||||||||||||
Isolated quarters As percentage of net sales | Q1 | Q4 | Q3 | Q2 | Q1 | |||||||||||||||
Networks | 16.6 | % | 16.6 | % | 15.9 | % | 11.2 | % | 12.1 | % | ||||||||||
Digital Services | -21.0 | % | -53.1 | % | -17.9 | % | -25.0 | % | -33.6 | % | ||||||||||
Managed Services | 21.4 | % | 4.2 | % | 6.4 | % | 4.6 | % | 1.8 | % | ||||||||||
Emerging Business and Other | 2.5 | % | -66.8 | % | -38.8 | % | -58.5 | % | -65.9 | % | ||||||||||
|
|
|
|
|
|
|
|
|
| |||||||||||
Total | 10.7 | % | -1.9 | % | 6.7 | % | 1.0 | % | 0.1 | % | ||||||||||
|
|
|
|
|
|
|
|
|
| |||||||||||
| 2019 | 2018 | |||||||||||||||||||
Year to date, SEK million | Jan-Mar | Jan-Dec | Jan-Sep | Jan-Jun | Jan-Mar | |||||||||||||||
Networks | 5,552 | 19,717 | 12,801 | 7,079 | 3,461 | |||||||||||||||
Digital Services | -1,638 | -13,166 | -6,255 | -4,647 | -2,443 | |||||||||||||||
Managed Services | 1,253 | 1,107 | 819 | 408 | 105 | |||||||||||||||
Emerging Business and Other | 43 | -4,754 | -3,230 | -2,290 | -1,088 | |||||||||||||||
|
|
|
|
|
|
|
|
|
| |||||||||||
Total | 5,210 | 2,904 | 4,135 | 550 | 35 | |||||||||||||||
|
|
|
|
|
|
|
|
|
| |||||||||||
| 2019 | 2018 | |||||||||||||||||||
Year to date As a percentage of net sales | Jan-Mar | Jan-Dec | Jan-Sep | Jan-Jun | Jan-Mar | |||||||||||||||
Networks | 16.6 | % | 14.2 | % | 13.2 | % | 11.6 | % | 12.1 | % | ||||||||||
Digital Services | -21.0 | % | -34.6 | % | -24.9 | % | -28.9 | % | -33.6 | % | ||||||||||
Managed Services | 21.4 | % | 4.3 | % | 4.3 | % | 3.3 | % | 1.8 | % | ||||||||||
Emerging Business and Other | 2.5 | % | -56.5 | % | -52.7 | % | -61.8 | % | -65.9 | % | ||||||||||
|
|
|
|
|
|
|
|
|
| |||||||||||
Total | 10.7 | % | 1.4 | % | 2.8 | % | 0.6 | % | 0.1 | % | ||||||||||
|
|
|
|
|
|
|
|
|
| |||||||||||
| 30 Ericsson | First Quarter Report 2019 | Additional information | |
Net sales by market area by quarter
| 2019 | 20183) | |||||||||||||||||||
Isolated quarters, SEK million | Q1 | Q4 | Q3 | Q2 | Q1 | |||||||||||||||
South East Asia, Oceania and India | 6,148 | 8,244 | 7,985 | 6,981 | 6,379 | |||||||||||||||
North East Asia | 3,824 | 8,387 | 5,773 | 4,764 | 3,385 | |||||||||||||||
North America | 16,171 | 17,999 | 14,933 | 14,337 | 11,317 | |||||||||||||||
Europe and Latin America1)2) | 13,124 | 17,909 | 14,697 | 13,999 | 12,958 | |||||||||||||||
Middle East and Africa | 5,412 | 6,828 | 5,841 | 5,801 | 5,868 | |||||||||||||||
Other1)2) | 4,227 | 4,442 | 4,581 | 3,926 | 3,504 | |||||||||||||||
|
|
|
|
|
|
|
|
|
| |||||||||||
Total | 48,906 | 63,809 | 53,810 | 49,808 | 43,411 | |||||||||||||||
|
|
|
|
|
|
|
|
|
| |||||||||||
1) Of which in Sweden | 192 | 375 | 429 | 596 | 915 | |||||||||||||||
2) Of which in EU | 7,957 | 10,319 | 8,481 | 8,619 | 8,522 | |||||||||||||||
| 2019 | 2018 | |||||||||||||||||||
Sequential change, percent | Q1 | Q4 | Q3 | Q2 | Q1 | |||||||||||||||
South East Asia, Oceania and India | -25 | % | 3 | % | 14 | % | 9 | % | -19 | % | ||||||||||
North East Asia | -54 | % | 45 | % | 21 | % | 41 | % | -48 | % | ||||||||||
North America | -10 | % | 21 | % | 4 | % | 27 | % | -23 | % | ||||||||||
Europe and Latin America1)2) | -27 | % | 22 | % | 5 | % | 8 | % | -22 | % | ||||||||||
Middle East and Africa | -21 | % | 17 | % | 1 | % | -1 | % | -25 | % | ||||||||||
Other1)2) | -5 | % | -3 | % | 17 | % | 12 | % | -20 | % | ||||||||||
|
|
|
|
|
|
|
|
|
| |||||||||||
Total | -23 | % | 19 | % | 8 | % | 15 | % | -25 | % | ||||||||||
|
|
|
|
|
|
|
|
|
| |||||||||||
1) Of which in Sweden | -49 | % | -13 | % | -28 | % | -35 | % | 5 | % | ||||||||||
2) Of which in EU | -23 | % | 22 | % | -2 | % | 1 | % | -21 | % | ||||||||||
| 2019 | 20183) | |||||||||||||||||||
Year-over-year change, percent | Q1 | Q4 | Q3 | Q2 | Q1 | |||||||||||||||
South East Asia, Oceania and India | -4 | % | 5 | % | 2 | % | -3 | % | -24 | % | ||||||||||
North East Asia | 13 | % | 30 | % | 2 | % | -19 | % | -39 | % | ||||||||||
North America | 43 | % | 23 | % | 21 | % | 11 | % | -6 | % | ||||||||||
Europe and Latin America1)2) | 1 | % | 7 | % | 11 | % | 1 | % | 8 | % | ||||||||||
Middle East and Africa | -8 | % | -13 | % | -9 | % | -5 | % | 6 | % | ||||||||||
Other1)2) | 21 | % | 2 | % | 19 | % | -7 | % | -17 | % | ||||||||||
|
|
|
|
|
|
|
|
|
| |||||||||||
Total | 13 | % | 10 | % | 9 | % | -1 | % | -9 | % | ||||||||||
|
|
|
|
|
|
|
|
|
| |||||||||||
1) Of which in Sweden | -79 | % | -57 | % | -35 | % | -24 | % | -10 | % | ||||||||||
2) Of which in EU | -7 | % | -5 | % | -2 | % | -1 | % | 2 | % | ||||||||||
| 2019 | 2018 | |||||||||||||||||||
Year to date, SEK million | Jan-Mar | Jan-Dec | Jan-Sep | Jan-Jun | Jan-Mar | |||||||||||||||
South East Asia, Oceania and India | 6,148 | 29,589 | 21,345 | 13,360 | 6,379 | |||||||||||||||
North East Asia | 3,824 | 22,309 | 13,922 | 8,149 | 3,385 | |||||||||||||||
North America | 16,171 | 58,586 | 40,587 | 25,654 | 11,317 | |||||||||||||||
Europe and Latin America1)2) | 13,124 | 59,563 | 41,654 | 26,957 | 12,958 | |||||||||||||||
Middle East and Africa | 5,412 | 24,338 | 17,510 | 11,669 | 5,868 | |||||||||||||||
Other1)2) | 4,227 | 16,453 | 12,011 | 7,430 | 3,504 | |||||||||||||||
|
|
|
|
|
|
|
|
|
| |||||||||||
Total | 48,906 | 210,838 | 147,029 | 93,219 | 43,411 | |||||||||||||||
|
|
|
|
|
|
|
|
|
| |||||||||||
1) Of which in Sweden | 192 | 2,315 | 1,940 | 1,511 | 915 | |||||||||||||||
2) Of which in EU | 7,957 | 35,941 | 25,622 | 17,141 | 8,522 | |||||||||||||||
| 2019 | 2018 | |||||||||||||||||||
Year to date, year-over-year change, percent | Jan-Mar | Jan-Dec | Jan-Sep | Jan-Jun | Jan-Mar | |||||||||||||||
South East Asia, Oceania and India | -4 | % | -6 | % | -9 | % | -15 | % | -24 | % | ||||||||||
North East Asia | 13 | % | -5 | % | -19 | % | -29 | % | -39 | % | ||||||||||
North America | 43 | % | 13 | % | 9 | % | 3 | % | -6 | % | ||||||||||
Europe and Latin America1)2) | 1 | % | 7 | % | 6 | % | 4 | % | 8 | % | ||||||||||
Middle East and Africa | -8 | % | -6 | % | -3 | % | 0 | % | 6 | % | ||||||||||
Other1)2) | 21 | % | -1 | % | -2 | % | -12 | % | -17 | % | ||||||||||
|
|
|
|
|
|
|
|
|
| |||||||||||
Total | 13 | % | 3 | % | 0 | % | -5 | % | -9 | % | ||||||||||
|
|
|
|
|
|
|
|
|
| |||||||||||
1) Of which in Sweden | -79 | % | -31 | % | -21 | % | -16 | % | -10 | % | ||||||||||
2) Of which in EU | -7 | % | -1 | % | 0 | % | 1 | % | 2 | % | ||||||||||
| 3) | 2018 has been restated to reflect the move of Morocco from market area Europe and Latin America to Middle East and Africa. Please refer to “Market area reporting”. |
| 31 Ericsson | First Quarter Report 2019 | Additional information | |
| Q1 | Jan-Dec | |||||||||||
Country Percentage of Net sales | 2019 | 2018 | 2018 | |||||||||
United States | 35 | % | 27 | % | 29 | % | ||||||
China | 5 | % | 4 | % | 7 | % | ||||||
India | 4 | % | 6 | % | 4 | % | ||||||
Australia | 3 | % | 3 | % | 4 | % | ||||||
Brazil | 3 | % | 3 | % | 3 | % | ||||||
Net sales by market area by segment
| Q1 2019 | ||||||||||||||||||||
SEK million | Networks | Digital Services | Managed Services | Emerging Business and Other | Total | |||||||||||||||
South East Asia, Oceania and India | 4,535 | 819 | 782 | 12 | 6,148 | |||||||||||||||
North East Asia | 2,819 | 700 | 265 | 40 | 3,824 | |||||||||||||||
North America | 13,270 | 1,809 | 1,070 | 22 | 16,171 | |||||||||||||||
Europe and Latin America | 7,562 | 2,593 | 2,876 | 93 | 13,124 | |||||||||||||||
Middle East and Africa | 3,105 | 1,442 | 863 | 2 | 5,412 | |||||||||||||||
Other | 2,190 | 454 | — | 1,583 | 4,227 | |||||||||||||||
|
|
|
|
|
|
|
|
|
| |||||||||||
Total | 33,481 | 7,817 | 5,856 | 1,752 | 48,906 | |||||||||||||||
|
|
|
|
|
|
|
|
|
| |||||||||||
Share of total | 68 | % | 16 | % | 12 | % | 4 | % | 100 | % | ||||||||||
| Q1 2019 | ||||||||||||||||||||
Sequential change, percent | Networks | Digital Services | Managed Services | Emerging Business and Other | Total | |||||||||||||||
South East Asia, Oceania and India | -26 | % | -34 | % | -10 | % | -56 | % | -25 | % | ||||||||||
North East Asia | -49 | % | -72 | % | -31 | % | 122 | % | -54 | % | ||||||||||
North America | -5 | % | -35 | % | -12 | % | -8 | % | -10 | % | ||||||||||
Europe and Latin America | -26 | % | -38 | % | -14 | % | 0 | % | -27 | % | ||||||||||
Middle East and Africa | -20 | % | -24 | % | -18 | % | -33 | % | -21 | % | ||||||||||
Other | 13 | % | 17 | % | — | -25 | % | -5 | % | |||||||||||
|
|
|
|
|
|
|
|
|
| |||||||||||
Total | -20 | % | -40 | % | -15 | % | -23 | % | -23 | % | ||||||||||
|
|
|
|
|
|
|
|
|
| |||||||||||
| Q1 2019 | ||||||||||||||||||||
Year over year change, percent | Networks | Digital Services | Managed Services | Emerging Business and Other | Total | |||||||||||||||
South East Asia, Oceania and India | 3 | % | -33 | % | 8 | % | 50 | % | -4 | % | ||||||||||
North East Asia | 26 | % | -4 | % | -31 | % | 67 | % | 13 | % | ||||||||||
North America | 42 | % | 34 | % | 80 | % | -21 | % | 43 | % | ||||||||||
Europe and Latin America | 3 | % | 14 | % | -11 | % | 37 | % | 1 | % | ||||||||||
Middle East and Africa | -13 | % | 7 | % | -9 | % | -50 | % | -8 | % | ||||||||||
Other | 33 | % | 35 | % | -100 | % | 4 | % | 21 | % | ||||||||||
|
|
|
|
|
|
|
|
|
| |||||||||||
Total | 17 | % | 8 | % | -1 | % | 6 | % | 13 | % | ||||||||||
|
|
|
|
|
|
|
|
|
| |||||||||||
| 32 Ericsson | First Quarter Report 2019 | Additional information | |
IPR licensing revenues by segment by quarter
| 33 Ericsson | First Quarter Report 2019 | Additional information | |
Investments in assets subject to depreciation, amortization, impairment and write-downs
| 2019 | 2018 | |||||||||||||||||||
Isolated quarters, SEK million | Q1 | Q4 | Q3 | Q2 | Q1 | |||||||||||||||
Additions | ||||||||||||||||||||
Property, plant and equipment | 1,314 | 1,080 | 1,088 | 951 | 856 | |||||||||||||||
Capitalized development expenses | 457 | 195 | 151 | 325 | 254 | |||||||||||||||
IPR, brands and other intangible assets | 1 | 27 | — | 1 | — | |||||||||||||||
|
|
|
|
|
|
|
|
|
| |||||||||||
Total | 1,772 | 1,302 | 1,239 | 1,277 | 1,100 | |||||||||||||||
|
|
|
|
|
|
|
|
|
| |||||||||||
Depreciation, amortization and impairment losses | ||||||||||||||||||||
Property, plant and equipment | 880 | 965 | 870 | 1,080 | 928 | |||||||||||||||
Capitalized development expenses | 520 | 884 | 678 | 635 | 616 | |||||||||||||||
Goodwill, IPR, brands and other intangible assets | 314 | 620 | 345 | 350 | 347 | |||||||||||||||
|
|
|
|
|
|
|
|
|
| |||||||||||
Total | 1,714 | 2,469 | 1,893 | 2,065 | 1,891 | |||||||||||||||
|
|
|
|
|
|
|
|
|
| |||||||||||
| 2019 | 2018 | |||||||||||||||||||
Year to date, SEK million | Jan-Mar | Jan-Dec | Jan-Sep | Jan-Jun | Jan-Mar | |||||||||||||||
Additions | ||||||||||||||||||||
Property, plant and equipment | 1,314 | 3,975 | 2,895 | 1,807 | 856 | |||||||||||||||
Capitalized development expenses | 457 | 925 | 730 | 579 | 254 | |||||||||||||||
IPR, brands and other intangible assets | 1 | 28 | 1 | 1 | — | |||||||||||||||
|
|
|
|
|
|
|
|
|
| |||||||||||
Total | 1,772 | 4,928 | 3,626 | 2,387 | 1,110 | |||||||||||||||
|
|
|
|
|
|
|
|
|
| |||||||||||
Depreciation, amortization and impairment losses | ||||||||||||||||||||
Property, plant and equipment | 880 | 3,843 | 2,878 | 2,008 | 928 | |||||||||||||||
Capitalized development expenses | 520 | 2,813 | 1,929 | 1,251 | 616 | |||||||||||||||
Goodwill, IPR, brands and other intangible assets | 314 | 1,662 | 1,042 | 697 | 347 | |||||||||||||||
|
|
|
|
|
|
|
|
|
| |||||||||||
Total | 1,714 | 8,318 | 5,849 | 3,956 | 1,891 | |||||||||||||||
|
|
|
|
|
|
|
|
|
| |||||||||||
| 34 Ericsson | First Quarter Report 2019 | Additional information | |
| Jan-Mar | Jan-Dec | |||||||||||
SEK million | 2019 | 2018 | 2018 | |||||||||
Number of shares and earnings per share | ||||||||||||
Number of shares, end of period (million) | 3,334 | 3,334 | 3,334 | |||||||||
Of which classA-shares (million) | 262 | 262 | 262 | |||||||||
Of which classB-shares (million) | 3,072 | 3,072 | 3,072 | |||||||||
Number of treasury shares, end of period (million) | 33 | 47 | 37 | |||||||||
Number of shares outstanding, basic, end of period (million) | 3,302 | 3,287 | 3,297 | |||||||||
Numbers of shares outstanding, diluted, end of period (million) | 3,326 | 3,323 | 3,323 | |||||||||
Average number of treasury shares (million) | 34 | 48 | 43 | |||||||||
Average number of shares outstanding, basic (million) | 3,300 | 3,286 | 3,291 | |||||||||
Average number of shares outstanding, diluted (million)1) | 3,325 | 3,322 | 3,318 | |||||||||
Earnings (loss) per share, basic (SEK) | 0.70 | -0.25 | -1.98 | |||||||||
Earnings (loss) per share, diluted (SEK)1) | 0.70 | -0.25 | -1.98 | |||||||||
Earnings (loss) per share(Non-IFRS), diluted (SEK)2) | 0.80 | 0.11 | 0.27 | |||||||||
Ratios | ||||||||||||
Days sales outstanding | 108 | 107 | 91 | |||||||||
Inventory turnover days | 94 | 87 | 70 | |||||||||
Payable days | 92 | 84 | 72 | |||||||||
Alternative Performance Measures (APMs) | ||||||||||||
Equity ratio (%) | 29.8 | % | 35.9 | % | 32.7 | % | ||||||
Return on equity (%) | 10.8 | % | -3.5 | % | -7.1 | % | ||||||
Return on capital employed (%) | 12.7 | % | -1.0 | % | 0.6 | % | ||||||
Capital turnover (times) | 1.3 | 1.1 | 1.4 | |||||||||
Free cash flow | 4,360 | 298 | 2,968 | |||||||||
Cash conversion (%) | 105.2 | % | -156.5 | % | 601.2 | % | ||||||
Exchange rates used in the consolidation | ||||||||||||
SEK/EUR- closing rate | 10.40 | 10.28 | 10.25 | |||||||||
SEK/USD- closing rate | 9.26 | 8.34 | 8.94 | |||||||||
|
|
|
|
|
| |||||||
Other | ||||||||||||
Market area inventory, end of period | 19,346 | 17,364 | 16,505 | |||||||||
Export sales from Sweden | 22,486 | 20,679 | 109,969 | |||||||||
| 1) | Potential ordinary shares are not considered when their conversion to ordinary shares would increase earnings per share. |
| 2) | Excluding amortizations and write-downs of acquired intangibles and restructuring charges. |
| 2019 | 20182) | |||||||||||||||||||
End of period | Mar 31 | Dec 31 | Sep 30 | Jun 30 | Mar 31 | |||||||||||||||
South East Asia, Oceania and India | 24,051 | 23,959 | 23,607 | 23,516 | 23,623 | |||||||||||||||
North East Asia | 13,169 | 12,788 | 12,495 | 12,303 | 12,321 | |||||||||||||||
North America | 9,246 | 9,727 | 9,459 | 9,510 | 9,798 | |||||||||||||||
Europe and Latin America1) | 43,833 | 44,522 | 44,594 | 45,643 | 47,437 | |||||||||||||||
Middle East and Africa | 4,281 | 4,363 | 4,344 | 4,288 | 4,402 | |||||||||||||||
|
|
|
|
|
|
|
|
|
| |||||||||||
Total | 94,580 | 95,359 | 94,499 | 95,260 | 97,581 | |||||||||||||||
|
|
|
|
|
|
|
|
|
| |||||||||||
1) Of which in Sweden | 12,455 | 12,502 | 12,679 | 13,431 | 13,763 | |||||||||||||||
| 2) | 2018 has been restated to reflect the move of Morocco from market area Europe and Latin America to Middle East and Africa. Please refer to “Market area reporting”. |
| 35 Ericsson | First Quarter Report 2019 | Additional information | |
Items excluding restructuring charges
Restructuring charges by function
| 2019 | 2018 | |||||||||||||||||||
Isolated quarters, SEK million | Q1 | Q4 | Q3 | Q2 | Q1 | |||||||||||||||
Cost of sales | -65 | -4,054 | -204 | -937 | -743 | |||||||||||||||
Research and development expenses | -118 | -251 | -214 | -502 | -326 | |||||||||||||||
Selling and administrative expenses | -23 | -106 | -134 | -441 | -103 | |||||||||||||||
|
|
|
|
|
|
|
|
|
| |||||||||||
Total | -206 | -4,411 | -552 | -1,880 | -1,172 | |||||||||||||||
|
|
|
|
|
|
|
|
|
| |||||||||||
| 2019 | 2018 | |||||||||||||||||||
Year to date, SEK million | Jan-Mar | Jan-Dec | Jan-Sep | Jan-Jun | Jan-Mar | |||||||||||||||
Cost of sales | -65 | -5,938 | -1,884 | -1,680 | -743 | |||||||||||||||
Research and development expenses | -118 | -1,293 | -1,042 | -828 | -326 | |||||||||||||||
Selling and administrative expenses | -23 | -784 | -678 | -544 | -103 | |||||||||||||||
|
|
|
|
|
|
|
|
|
| |||||||||||
Total | -206 | -8,015 | -3,604 | -3,052 | -1,172 | |||||||||||||||
|
|
|
|
|
|
|
|
|
| |||||||||||
Restructuring charges by segment
| 2019 | 2018 | |||||||||||||||||||
Isolated quarters, SEK million | Q1 | Q4 | Q3 | Q2 | Q1 | |||||||||||||||
Networks | -10 | -425 | -128 | -749 | -479 | |||||||||||||||
of which cost of sales | -3 | -439 | -63 | -469 | -415 | |||||||||||||||
of which operating expenses | -7 | 14 | -65 | -280 | -64 | |||||||||||||||
Digital Services | -187 | -3,545 | -358 | -882 | -581 | |||||||||||||||
of which cost of sales | -60 | -3,369 | -111 | -303 | -226 | |||||||||||||||
of which operating expenses | -127 | -176 | -247 | -579 | -355 | |||||||||||||||
Managed Services | -2 | -70 | -32 | -123 | -51 | |||||||||||||||
of which cost of sales | -1 | -69 | -28 | -103 | -48 | |||||||||||||||
of which operating expenses | -1 | -1 | -4 | -20 | -3 | |||||||||||||||
Emerging Business and Other | -7 | -371 | -34 | -126 | -61 | |||||||||||||||
of which cost of sales | -1 | -177 | -2 | -62 | -54 | |||||||||||||||
of which operating expenses | -6 | -194 | -32 | -64 | -7 | |||||||||||||||
|
|
|
|
|
|
|
|
|
| |||||||||||
Total | -206 | -4,411 | -552 | -1,880 | -1,172 | |||||||||||||||
|
|
|
|
|
|
|
|
|
| |||||||||||
| 2019 | 2018 | |||||||||||||||||||
Year to date, SEK million | Jan-Mar | Jan-Dec | Jan-Sep | Jan-Jun | Jan-Mar | |||||||||||||||
Networks | -10 | -1,781 | -1,356 | -1,228 | -479 | |||||||||||||||
of which cost of sales | -3 | -1,386 | -947 | -884 | -415 | |||||||||||||||
of which operating expenses | -7 | -395 | -409 | -344 | -64 | |||||||||||||||
Digital Services | -187 | -5,366 | -1,821 | -1,463 | -581 | |||||||||||||||
of which cost of sales | -60 | -4,009 | -640 | -529 | -226 | |||||||||||||||
of which operating expenses | -127 | -1,357 | -1,181 | -934 | -355 | |||||||||||||||
Managed Services | -2 | -276 | -206 | -174 | -51 | |||||||||||||||
of which cost of sales | -1 | -248 | -179 | -151 | -48 | |||||||||||||||
of which operating expenses | -1 | -28 | -27 | -23 | -3 | |||||||||||||||
Emerging Business and Other | -7 | -592 | -221 | -187 | -61 | |||||||||||||||
of which cost of sales | -1 | -295 | -118 | -116 | -54 | |||||||||||||||
of which operating expenses | -6 | -297 | -103 | -71 | -7 | |||||||||||||||
|
|
|
|
|
|
|
|
|
| |||||||||||
Total | -206 | -8,015 | -3,604 | -3,052 | -1,172 | |||||||||||||||
|
|
|
|
|
|
|
|
|
| |||||||||||
| 36 Ericsson | First Quarter Report 2019 | Items excluding restructuring charges | |
Gross income (loss) and gross margin excluding restructuring charges by segment
| 2019 | 2018 | |||||||||||||||||||
Isolated quarters, SEK million | Q1 | Q4 | Q3 | Q2 | Q1 | |||||||||||||||
Networks | 14,458 | 17,065 | 14,898 | 13,034 | 11,542 | |||||||||||||||
Digital Services | 2,938 | 2,129 | 3,319 | 3,761 | 3,118 | |||||||||||||||
Managed Services | 1,037 | 850 | 833 | 912 | 539 | |||||||||||||||
Emerging Business and Other | 411 | 389 | 784 | 563 | 402 | |||||||||||||||
|
|
|
|
|
|
|
|
|
| |||||||||||
Total | 18,844 | 20,433 | 19,834 | 18,270 | 15,601 | |||||||||||||||
|
|
|
|
|
|
|
|
|
| |||||||||||
| 2019 | 2018 | |||||||||||||||||||
Isolated quarters, As percentage of net sales | Q1 | Q4 | Q3 | Q2 | Q1 | |||||||||||||||
Networks | 43.2 | % | 41.0 | % | 41.5 | % | 40.2 | % | 40.4 | % | ||||||||||
Digital Services | 37.6 | % | 16.4 | % | 36.9 | % | 42.6 | % | 42.9 | % | ||||||||||
Managed Services | 17.7 | % | 12.4 | % | 12.9 | % | 14.0 | % | 9.1 | % | ||||||||||
Emerging Business and Other | 23.5 | % | 17.1 | % | 32.3 | % | 27.4 | % | 24.3 | % | ||||||||||
|
|
|
|
|
|
|
|
|
| |||||||||||
Total | 38.5 | % | 32.0 | % | 36.9 | % | 36.7 | % | 35.9 | % | ||||||||||
|
|
|
|
|
|
|
|
|
| |||||||||||
| 2019 | 2018 | |||||||||||||||||||
Year to date, SEK million | Jan-Mar | Jan-Dec | Jan-Sep | Jan-Jun | Jan-Mar | |||||||||||||||
Networks | 14,458 | 56,539 | 39,474 | 24,576 | 11,542 | |||||||||||||||
Digital Services | 2,938 | 12,327 | 10,198 | 6,879 | 3,118 | |||||||||||||||
Managed Services | 1,037 | 3,134 | 2,284 | 1,451 | 539 | |||||||||||||||
Emerging Business and Other | 411 | 2,138 | 1,749 | 965 | 402 | |||||||||||||||
|
|
|
|
|
|
|
|
|
| |||||||||||
Total | 18,844 | 74,138 | 53,705 | 33,871 | 15,601 | |||||||||||||||
|
|
|
|
|
|
|
|
|
| |||||||||||
| 2019 | 2018 | |||||||||||||||||||
Year to date, As percentage of net sales | Jan-Mar | Jan-Dec | Jan-Sep | Jan-Jun | Jan-Mar | |||||||||||||||
Networks | 43.2 | % | 40.8 | % | 40.7 | % | 40.3 | % | 40.4 | % | ||||||||||
Digital Services | 37.6 | % | 32.4 | % | 40.7 | % | 42.7 | % | 42.9 | % | ||||||||||
Managed Services | 17.7 | % | 12.2 | % | 12.1 | % | 11.7 | % | 9.1 | % | ||||||||||
Emerging Business and Other | 23.5 | % | 25.4 | % | 28.5 | % | 26.0 | % | 24.3 | % | ||||||||||
|
|
|
|
|
|
|
|
|
| |||||||||||
Total | 38.5 | % | 35.2 | % | 36.5 | % | 36.3 | % | 35.9 | % | ||||||||||
|
|
|
|
|
|
|
|
|
| |||||||||||
| 37 Ericsson | First Quarter Report 2019 | Items excluding restructuring charges | |
Operating income (loss) and operating margin excluding restructuring charges by segment
| 2019 | 2018 | |||||||||||||||||||
Isolated quarters, SEK million | Q1 | Q4 | Q3 | Q2 | Q1 | |||||||||||||||
Networks | 5,482 | 7,275 | 5,784 | 4,293 | 3,850 | |||||||||||||||
Digital Services | -1,611 | -3,542 | -1,426 | -1,492 | -2,026 | |||||||||||||||
Managed Services | 1,254 | 355 | 441 | 422 | 151 | |||||||||||||||
Emerging Business and Other | -23 | -1,529 | -1,006 | -1,178 | -1,115 | |||||||||||||||
|
|
|
|
|
|
|
|
|
| |||||||||||
Total | 5,102 | 2,559 | 3,793 | 2,045 | 860 | |||||||||||||||
|
|
|
|
|
|
|
|
|
| |||||||||||
| 2019 | 2018 | |||||||||||||||||||
Isolated quarters, As percentage of net sales | Q1 | Q4 | Q3 | Q2 | Q1 | |||||||||||||||
Networks | 16.4 | % | 17.5 | % | 16.1 | % | 13.3 | % | 13.5 | % | ||||||||||
Digital Services | -20.6 | % | -27.2 | % | -15.9 | % | -16.9 | % | -27.9 | % | ||||||||||
Managed Services | 21.4 | % | 5.2 | % | 6.8 | % | 6.5 | % | 2.6 | % | ||||||||||
Emerging Business and Other | -1.3 | % | -67.1 | % | -41.5 | % | -57.4 | % | -67.5 | % | ||||||||||
|
|
|
|
|
|
|
|
|
| |||||||||||
Total | 10.4 | % | 4.0 | % | 7.0 | % | 4.1 | % | 2.0 | % | ||||||||||
|
|
|
|
|
|
|
|
|
| |||||||||||
| 2019 | 2018 | |||||||||||||||||||
Year to date, SEK million | Jan-Mar | Jan-Dec | Jan-Sep | Jan-Jun | Jan-Mar | |||||||||||||||
Networks | 5,482 | 21,202 | 13,927 | 8,143 | 3,850 | |||||||||||||||
Digital Services | -1,611 | -8,486 | -4,944 | -3,518 | -2,026 | |||||||||||||||
Managed Services | 1,254 | 1,369 | 1,014 | 573 | 151 | |||||||||||||||
Emerging Business and Other | -23 | -4,828 | -3,299 | -2,293 | -1,115 | |||||||||||||||
|
|
|
|
|
|
|
|
|
| |||||||||||
Total | 5,102 | 9,257 | 6,698 | 2,905 | 860 | |||||||||||||||
|
|
|
|
|
|
|
|
|
| |||||||||||
| 2019 | 2018 | |||||||||||||||||||
Year to date, As percentage of net sales | Jan-Mar | Jan-Dec | Jan-Sep | Jan-Jun | Jan-Mar | |||||||||||||||
Networks | 16.4 | % | 15.3 | % | 14.4 | % | 13.4 | % | 13.5 | % | ||||||||||
Digital Services | -20.6 | % | -22.3 | % | -19.7 | % | -21.9 | % | -27.9 | % | ||||||||||
Managed Services | 21.4 | % | 5.3 | % | 5.4 | % | 4.6 | % | 2.6 | % | ||||||||||
Emerging Business and Other | -1.3 | % | -57.4 | % | -53.8 | % | -61.9 | % | -67.5 | % | ||||||||||
|
|
|
|
|
|
|
|
|
| |||||||||||
Total | 10.4 | % | 4.4 | % | 4.6 | % | 3.1 | % | 2.0 | % | ||||||||||
|
|
|
|
|
|
|
|
|
| |||||||||||
| 38 Ericsson | First Quarter Report 2019 | Items excluding restructuring charges | |
Alternative performance measures
This section includes a reconciliation of certain Alternative Performance Measures (APMs) to the most directly reconcilable line items in the financial statements. The presentation of APMs has limitations as analytical tools and should not be considered in isolation or as a substitute for related financial measures prepared in accordance with IFRS.
APMs are presented to enhance an investor’s evaluation of ongoing operating results, to aid in forecasting future periods and to facilitate meaningful comparison of results between periods.
Management uses these APMs to, among other things, evaluate ongoing operations in relation to historical results, for
internal planning and forecasting purposes and in the calculation of certain performance-based compensation.
The APMs presented in this report may differ from similarly titled measures used by other companies.
The implementation of IFRS 16 “Leasing” as of January 1, 2019, has had an impact on many of the APMs for 2019. For more information, see “Accounting polices” in this report. The APMs for 2018 has not changed. The definition of the APM Net cash has been clarified.
For additional information, see Alternative Performance Measures in the Ericsson Annual Report 2018.
Sales growth adjusted for comparable units and currency
Sales growth adjusted for the impact of acquisitions and divestments as well as the effects of foreign currency fluctuations.
| 2019 | 2018 | |||||||||||||||||||
Isolated quarter, year over year change | Q1 | Q4 | Q3 | Q2 | Q1 | |||||||||||||||
Reported net sales | 48,906 | 63,809 | 53,810 | 49,808 | 43,411 | |||||||||||||||
Acquired business | — | — | — | — | — | |||||||||||||||
Net FX impact | -2,932 | -3,549 | -3,748 | -263 | 3,328 | |||||||||||||||
Comparable net sales, excluding FX impact | 45,974 | 60,260 | 50,062 | 49,545 | 46,739 | |||||||||||||||
Comparable quarter net sales adjusted for divested business1) | 42,961 | — | — | — | — | |||||||||||||||
Sales growth adjusted for comparable units and currency (%) | 7 | % | 4 | % | 1 | % | -1 | % | -2 | % | ||||||||||
| 2019 | 2018 | |||||||||||||||||||
Year to date, year over year change | Jan-Mar | Jan-Dec | Jan-Sep | Jan-Jun | Jan-Mar | |||||||||||||||
Reported net sales | 48,906 | 210,838 | 147,029 | 93,219 | 43,411 | |||||||||||||||
Acquired business | — | — | — | — | — | |||||||||||||||
Net FX impact | -2,932 | -4,232 | -683 | 3,065 | 3,328 | |||||||||||||||
Comparable net sales, excluding FX impact | 45,974 | 206,606 | 146,346 | 96,284 | 46,739 | |||||||||||||||
Comparable quarter net sales adjusted for divested business1) | 42,961 | — | — | — | — | |||||||||||||||
Sales growth adjusted for comparable units and currency (%) | 7 | % | 1 | % | -1 | % | -2 | % | -2 | % | ||||||||||
| 1) | Adjusted for MediaKind divestment. |
| 39 Ericsson | First Quarter Report 2019 | Alternative performance measures | |
Items excluding restructuring charges
Gross income, operating expenses, and operating income (loss) are presented excluding restructuring charges and, for certain measures, as a percentage of net sales.
| 2019 | 2018 | |||||||||||||||||||
Isolated quarters, SEK million | Q1 | Q4 | Q3 | Q2 | Q1 | |||||||||||||||
Gross income | 18,779 | 16,379 | 19,630 | 17,333 | 14,858 | |||||||||||||||
Net sales | 48,906 | 63,809 | 53,810 | 49,808 | 43,411 | |||||||||||||||
Gross margin (%) | 38.4 | % | 25.7 | % | 36.5 | % | 34.8 | % | 34.2 | % | ||||||||||
Gross income | 18,779 | 16,379 | 19,630 | 17,333 | 14,858 | |||||||||||||||
Restructuring charges included in cost of sales | 65 | 4,054 | 204 | 937 | 743 | |||||||||||||||
Gross income, excluding restructuring charges | 18,844 | 20,433 | 19,834 | 18,270 | 15,601 | |||||||||||||||
Net sales | 48,906 | 63,809 | 53,810 | 49,808 | 43,411 | |||||||||||||||
Gross margin, excluding restructuring charges (%) | 38.5 | % | 32.0 | % | 36.9 | % | 36.7 | % | 35.9 | % | ||||||||||
Operating expenses | -14,639 | -17,964 | -16,422 | -17,205 | -15,257 | |||||||||||||||
Restructuring charges included in R&D expenses | 118 | 251 | 214 | 502 | 326 | |||||||||||||||
Restructuring charges included in selling and administrative expenses | 23 | 106 | 134 | 441 | 103 | |||||||||||||||
Operating expenses, excluding restructuring charges | -14,498 | -17,607 | -16,074 | -16,262 | -14,828 | |||||||||||||||
Operating income (loss) | 4,896 | -1,852 | 3,241 | 165 | -312 | |||||||||||||||
Net sales | 48,906 | 63,809 | 53,810 | 49,808 | 43,411 | |||||||||||||||
Operating margin (%) | 10.0 | % | -2.9 | % | 6.0 | % | 0.3 | % | -0.7 | % | ||||||||||
Operating income (loss) | 4,896 | -1,852 | 3,241 | 165 | -312 | |||||||||||||||
Total restructuring charges | 206 | 4,411 | 552 | 1,880 | 1,172 | |||||||||||||||
Operating income (loss), excluding restructuring charges | 5,102 | 2,559 | 3,793 | 2,045 | 860 | |||||||||||||||
Net sales | 48,906 | 63,809 | 53,810 | 49,808 | 43,411 | |||||||||||||||
Operating margin, excluding restructuring charges (%) | 10.4 | % | 4.0 | % | 7.0 | % | 4.1 | % | 2.0 | % | ||||||||||
| 2019 | 2018 | |||||||||||||||||||
Year to date, SEK million | Jan-Mar | Jan-Dec | Jan-Sep | Jan-Jun | Jan-Mar | |||||||||||||||
Gross income | 18,779 | 68,200 | 51,821 | 32,191 | 14,858 | |||||||||||||||
Net sales | 48,906 | 210,838 | 147,029 | 93,219 | 43,411 | |||||||||||||||
Gross margin (%) | 38.4 | % | 32.3 | % | 35.2 | % | 34.5 | % | 34.2 | % | ||||||||||
Gross income | 18,779 | 68,200 | 51,821 | 32,191 | 14,858 | |||||||||||||||
Restructuring charges included in cost of sales | 65 | 5,938 | 1,884 | 1,680 | 743 | |||||||||||||||
Gross income, excluding restructuring charges | 18,844 | 74,138 | 53,705 | 33,871 | 15,601 | |||||||||||||||
Net sales | 48,906 | 210,838 | 147,029 | 93,219 | 43,411 | |||||||||||||||
Gross margin, excluding restructuring charges (%) | 38.5 | % | 35.2 | % | 36.5 | % | 36.3 | % | 35.9 | % | ||||||||||
Operating expenses | -14,639 | -66,848 | -48,884 | -32,462 | -15,257 | |||||||||||||||
Restructuring charges included in R&D expenses | 118 | 1,293 | 1,042 | 828 | 326 | |||||||||||||||
Restructuring charges included in selling and administrative expenses | 23 | 784 | 678 | 544 | 103 | |||||||||||||||
Operating expenses, excluding restructuring charges | -14,498 | -64,771 | -47,164 | -31,090 | -14,828 | |||||||||||||||
Operating income (loss) | 4,896 | 1,242 | 3,094 | -147 | -312 | |||||||||||||||
Net sales | 48,906 | 210,838 | 147,029 | 93,219 | 43,411 | |||||||||||||||
Operating margin (%) | 10.0 | % | 0.6 | % | 2.1 | % | -0.2 | % | -0.7 | % | ||||||||||
Operating income (loss) | 4,896 | 1,242 | 3,094 | -147 | -312 | |||||||||||||||
Total restructuring charges | 206 | 8,015 | 3,604 | 3,052 | 1,172 | |||||||||||||||
Operating income (loss), excluding restructuring charges | 5,102 | 9,257 | 6,698 | 2,905 | 860 | |||||||||||||||
Net sales | 48,906 | 210,838 | 147,029 | 93,219 | 43,411 | |||||||||||||||
Operating margin, excluding restructuring charges (%) | 10.4 | % | 4.4 | % | 4.6 | % | 3.1 | % | 2.0 | % | ||||||||||
| 40 Ericsson | First Quarter Report 2019 | Alternative performance measures | |
Earnings (loss) before interest, taxes, amortization and write-downs of acquired intangibles, also expressed as a percentage of net sales.
| 2019 | 2018 | |||||||||||||||||||
Isolated quarters, SEK million | Q1 | Q4 | Q3 | Q2 | Q1 | |||||||||||||||
Net income (loss) | 2,403 | -6,497 | 2,748 | -1,802 | -725 | |||||||||||||||
Taxes | 1,888 | 3,930 | -146 | 1,157 | -128 | |||||||||||||||
Financial income and expenses | 605 | 715 | 639 | 810 | 541 | |||||||||||||||
Amortization and write-downs of acquired intangibles | 314 | 621 | 344 | 350 | 347 | |||||||||||||||
EBITA | 5,210 | -1,231 | 3,585 | 515 | 35 | |||||||||||||||
Net sales | 48,906 | 63,809 | 53,810 | 49,808 | 43,411 | |||||||||||||||
EBITA margin (%) | 10.7 | % | -1.9 | % | 6.7 | % | 1.0 | % | 0.1 | % | ||||||||||
| 2019 | 2018 | |||||||||||||||||||
Year to date, SEK million | Jan-Mar | Jan-Dec | Jan-Sep | Jan-Jun | Jan-Mar | |||||||||||||||
Net income (loss) | 2,403 | -6,276 | 221 | -2,527 | -725 | |||||||||||||||
Taxes | 1,888 | 4,813 | 883 | 1,029 | -128 | |||||||||||||||
Financial income and expenses | 605 | 2,705 | 1,990 | 1,351 | 541 | |||||||||||||||
Amortization and write-downs of acquired intangibles | 314 | 1,662 | 1,041 | 697 | 347 | |||||||||||||||
EBITA | 5,210 | 2,904 | 4,135 | 550 | 35 | |||||||||||||||
Net sales | 48,906 | 210,838 | 147,029 | 93,219 | 43,411 | |||||||||||||||
EBITA margin (%) | 10.7 | % | 1.4 | % | 2.8 | % | 0.6 | % | 0.1 | % | ||||||||||
Cash flow from operating activities divided by the sum of net income (loss) and adjustments to reconcile net income to cash, expressed as a percentage.
| 2019 | 2018 | |||||||||||||||||||
Isolated quarters, SEK million | Q1 | Q4 | Q3 | Q2 | Q1 | |||||||||||||||
Net income (loss) | 2,403 | -6,497 | 2,748 | -1,802 | -725 | |||||||||||||||
Net income reconciled to cash | 5,481 | -98 | 2,916 | -259 | -1,005 | |||||||||||||||
Cash flow from operating activities | 5,765 | 4,287 | 2,040 | 1,442 | 1,573 | |||||||||||||||
Cash conversion (%) | 105.2 | % | -4374.5 | % | 70.0 | % | -556.8 | % | -156.5 | % | ||||||||||
| 2019 | 2018 | |||||||||||||||||||
Year to date, SEK million | Jan-Mar | Jan-Dec | Jan-Sep | Jan-Jun | Jan-Mar | |||||||||||||||
Net income (loss) | 2,403 | -6,276 | 221 | -2,527 | -725 | |||||||||||||||
Net income reconciled to cash | 5,481 | 1,554 | 1,652 | -1,264 | -1,005 | |||||||||||||||
Cash flow from operating activities | 5,765 | 9,342 | 5,055 | 3,015 | 1,573 | |||||||||||||||
Cash conversion (%) | 105.2 | % | 601.2 | % | 306.0 | % | -238.5 | % | -156.5 | % | ||||||||||
| 41 Ericsson | First Quarter Report 2019 | Alternative performance measures | |
Gross cash and net cash, end of period
Gross cash: Cash and cash equivalents plus interest-bearing securities (current andnon-current).
Net cash: Cash and cash equivalents plus interest-bearing securities (current andnon-current) less borrowings (current andnon-current).
| 2019 | 2018 | |||||||||||||||||||
SEK million | Q1 | Q4 | Q3 | Q2 | Q1 | |||||||||||||||
Cash and cash equivalents | 45,453 | 38,389 | 36,058 | 37,049 | 36,697 | |||||||||||||||
+ Interest-bearing securities, current | 3,183 | 6,625 | 6,591 | 8,304 | 5,453 | |||||||||||||||
+ Interest-bearing securities,non-current | 23,022 | 23,982 | 23,014 | 21,501 | 27,104 | |||||||||||||||
Gross cash, end of period | 71,658 | 68,996 | 65,663 | 66,854 | 69,254 | |||||||||||||||
- Borrowings, current | 3,015 | 2,255 | 2,463 | 2,642 | 2,554 | |||||||||||||||
- Borrowings,non-current | 32,533 | 30,870 | 31,187 | 31,131 | 31,134 | |||||||||||||||
Net cash, end of period | 36,110 | 35,871 | 32,013 | 33,081 | 35,566 | |||||||||||||||
Total assets lessnon-interest-bearing provisions and liabilities.
| 2019 | 2018 | |||||||||||||||||||
SEK million | Q1 | Q4 | Q3 | Q2 | Q1 | |||||||||||||||
Total assets | 283,958 | 268,761 | 264,848 | 265,322 | 260,681 | |||||||||||||||
|
|
|
|
|
|
|
|
|
| |||||||||||
Non-interest-bearing provisions and liabilities | ||||||||||||||||||||
Provisions,non-current | 2,670 | 5,471 | 3,420 | 2,819 | 2,597 | |||||||||||||||
Deferred tax liabilities | 792 | 670 | 1,274 | 1,332 | 1,325 | |||||||||||||||
Othernon-current liabilities | 2,118 | 4,346 | 4,456 | 4,549 | 2,792 | |||||||||||||||
Provisions, current | 9,363 | 10,537 | 5,275 | 6,715 | 6,435 | |||||||||||||||
Contract liabilities | 38,605 | 29,348 | 30,108 | 30,959 | 30,391 | |||||||||||||||
Trade payables | 30,842 | 29,883 | 28,914 | 28,563 | 26,453 | |||||||||||||||
Other current liabilities | 38,528 | 38,891 | 36,323 | 35,746 | 37,888 | |||||||||||||||
Capital employed | 161,040 | 149,615 | 155,078 | 154,639 | 152,800 | |||||||||||||||
Annualized net sales divided by average capital employed.
| 2019 | 2018 | |||||||||||||||||||
Isolated quarters, SEK million | Q1 | Q4 | Q3 | Q2 | Q1 | |||||||||||||||
Net sales | 48,906 | 63,809 | 53,810 | 49,808 | 43,411 | |||||||||||||||
Annualized net sales | 195,624 | 255,236 | 215,240 | 199,232 | 173,644 | |||||||||||||||
Average capital employed | ||||||||||||||||||||
Capital employed at beginning of period | 149,615 | 155,078 | 154,639 | 152,800 | 155,625 | |||||||||||||||
Capital employed at end of period | 161,040 | 149,615 | 155,078 | 154,639 | 152,800 | |||||||||||||||
Average capital employed | 155,328 | 152,347 | 154,859 | 153,720 | 154,213 | |||||||||||||||
Capital turnover (times) | 1.3 | 1.7 | 1.4 | 1.3 | 1.1 | |||||||||||||||
| 2019 | 2018 | |||||||||||||||||||
Year to date, SEK million | Jan-Mar | Jan-Dec | Jan-Sep | Jan-Jun | Jan-Mar | |||||||||||||||
Net sales | 48,906 | 210,838 | 147,029 | 93,219 | 43,411 | |||||||||||||||
Annualized net sales | 195,624 | 210,838 | 196,039 | 186,438 | 173,644 | |||||||||||||||
Average capital employed | ||||||||||||||||||||
Capital employed at beginning of period | 149,615 | 155,625 | 155,625 | 155,625 | 155,625 | |||||||||||||||
Capital employed at end of period | 161,040 | 149,615 | 155,078 | 154,639 | 152,800 | |||||||||||||||
Average capital employed | 155,328 | 152,620 | 155,352 | 155,132 | 154,213 | |||||||||||||||
Capital turnover (times) | 1.3 | 1.4 | 1.3 | 1.2 | 1.1 | |||||||||||||||
| 42 Ericsson | First Quarter Report 2019 | Alternative performance measures | |
The annualized total of operating income (loss) plus financial income as a percentage of average capital employed.
| 2019 | 2018 | |||||||||||||||||||
Isolated quarters, SEK million | Q1 | Q4 | Q3 | Q2 | Q1 | |||||||||||||||
Operating income (loss) | 4,896 | -1,852 | 3,241 | 165 | -312 | |||||||||||||||
Financial income | 38 | -294 | -225 | 275 | -72 | |||||||||||||||
Annualized operating income (loss) + financial income | 19,736 | -8,584 | 12,064 | 1,760 | -1,536 | |||||||||||||||
Average capital employed | ||||||||||||||||||||
Capital employed at beginning of period | 149,615 | 155,078 | 154,639 | 152,800 | 155,625 | |||||||||||||||
Capital employed at end of period | 161,040 | 149,615 | 155,078 | 154,639 | 152,800 | |||||||||||||||
Average capital employed | 155,328 | 152,347 | 154,859 | 153,720 | 154,213 | |||||||||||||||
Return on capital employed (%) | 12.7 | % | -5.6 | % | 7.8 | % | 1.1 | % | -1.0 | % | ||||||||||
| 2019 | 2018 | |||||||||||||||||||
Year to date, SEK million | Jan-Mar | Jan-Dec | Jan-Sep | Jan-Jun | Jan-Mar | |||||||||||||||
Operating income (loss) | 4,896 | 1,242 | 3,094 | -147 | -312 | |||||||||||||||
Financial income | 38 | -316 | -22 | 203 | -72 | |||||||||||||||
Annualized operating income (loss) + financial income | 19,736 | 926 | 4,096 | 112 | -1,536 | |||||||||||||||
Average capital employed | ||||||||||||||||||||
Capital employed at beginning of period | 149,615 | 155,625 | 155,625 | 155,625 | 155,625 | |||||||||||||||
Capital employed at end of period | 161,040 | 149,615 | 155,078 | 154,639 | 152,800 | |||||||||||||||
Average capital employed | 155,328 | 152,620 | 155,352 | 155,132 | 154,213 | |||||||||||||||
Return on capital employed (%) | 12.7 | % | 0.6 | % | 2.6 | % | 0.1 | % | -1.0 | % | ||||||||||
Equity, expressed as a percentage of total assets.
| 2019 | 2018 | |||||||||||||||||||
SEK million | Q1 | Q4 | Q3 | Q2 | Q1 | |||||||||||||||
Total equity | 84,532 | 87,770 | 95,953 | 93,560 | 93,466 | |||||||||||||||
Total assets | 283,958 | 268,761 | 264,848 | 265,322 | 260,681 | |||||||||||||||
Equity ratio (%) | 29.8 | % | 32.7 | % | 36.2 | % | 35.3 | % | 35.9 | % | ||||||||||
Annualized net income (loss) attributable to stockholders of the Parent Company as a percentage of average Stockholders’ equity.
| 2019 | 2018 | |||||||||||||||||||
Isolated quarters, SEK million | Q1 | Q4 | Q3 | Q2 | Q1 | |||||||||||||||
Net income (loss) attributable to stockholders of the parent company | 2,317 | -6,553 | 2,745 | -1,885 | -837 | |||||||||||||||
Annualized | 9,268 | -26,212 | 10,980 | -7,540 | -3,348 | |||||||||||||||
Average stockholders’ equity | ||||||||||||||||||||
Stockholders’ equity, beginning of period | 86,978 | 95,087 | 92,689 | 92,703 | 96,935 | |||||||||||||||
Stockholders’ equity, end of period | 84,619 | 86,978 | 95,087 | 92,689 | 92,703 | |||||||||||||||
Average stockholders’ equity | 85,799 | 91,033 | 93,888 | 92,696 | 94,819 | |||||||||||||||
Return on equity (%) | 10.8 | % | -28.8 | % | 11.7 | % | -8.1 | % | -3.5 | % | ||||||||||
| 2019 | 2018 | |||||||||||||||||||
Year to date, SEK million | Jan-Mar | Jan-Dec | Jan-Sep | Jan-Jun | Jan-Mar | |||||||||||||||
Net income (loss) attributable to stockholders of the parent company | 2,317 | -6,530 | 23 | -2,722 | -837 | |||||||||||||||
Annualized | 9,268 | -6,530 | 31 | -5,444 | -3,348 | |||||||||||||||
Average stockholders’ equity | ||||||||||||||||||||
Stockholders’ equity, beginning of period | 86,978 | 96,935 | 96,935 | 96,935 | 96,935 | |||||||||||||||
Stockholders’ equity, end of period | 84,619 | 86,978 | 95,087 | 92,689 | 92,703 | |||||||||||||||
Average stockholders’ equity | 85,799 | 91,957 | 96,011 | 94,812 | 94,819 | |||||||||||||||
Return on equity (%) | 10.8 | % | -7.1 | % | 0.0 | % | -5.7 | % | -3.5 | % | ||||||||||
| 43 Ericsson | First Quarter Report 2019 | Alternative performance measures | |
Earnings (loss) per share(non-IFRS)
Earnings (loss) per share, diluted, excluding amortizations and write-down of acquired intangible assets and excluding restructuring charges.
| 2019 | 2018 | |||||||||||||||||||
Isolated quarters, SEK | Q1 | Q4 | Q3 | Q2 | Q1 | |||||||||||||||
Earnings (loss) per share, diluted | 0.70 | -1.99 | 0.83 | -0.58 | -0.25 | |||||||||||||||
Restructuring charges | 0.05 | 1.06 | 0.12 | 0.41 | 0.30 | |||||||||||||||
Amortization and write-downs of acquired intangibles | 0.05 | 0.16 | 0.08 | 0.08 | 0.06 | |||||||||||||||
Earnings (loss) per share(non-IFRS) | 0.80 | -0.77 | 1.03 | -0.09 | 0.11 | |||||||||||||||
| 2019 | 2018 | |||||||||||||||||||
Year to date, SEK | Jan-Mar | Jan-Dec | Jan-Sep | Jan-Jun | Jan-Mar | |||||||||||||||
Earnings (loss) per share, diluted | 0.70 | -1.98 | 0.01 | -0.83 | -0.25 | |||||||||||||||
Restructuring charges | 0.05 | 1.88 | 0.82 | 0.71 | 0.30 | |||||||||||||||
Amortization and write-downs of acquired intangibles | 0.05 | 0.37 | 0.21 | 0.14 | 0.06 | |||||||||||||||
Earnings (loss) per share(non-IFRS) | 0.80 | 0.27 | 1.04 | 0.02 | 0.11 | |||||||||||||||
Free cash flow and free cash flow excluding M&A
Free cash flow: Cash flow from operating activities less net capital expenditures and other investments.
Free cash flow excluding M&A: Cash flow from operating activities less net capital expenditures and other investments (excluding M&A).
| 2019 | 2018 | |||||||||||||||||||
Isolated quarters, SEK million | Q1 | Q4 | Q3 | Q2 | Q1 | |||||||||||||||
Cash flow from operating activities | 5,765 | 4,287 | 2,040 | 1,442 | 1,573 | |||||||||||||||
Net capital expenditures and other investments (excluding M&A) | ||||||||||||||||||||
Investments in property, plant and equipment | -1,314 | -1,080 | -1,088 | -951 | -856 | |||||||||||||||
Sales of property, plant and equipment | 232 | 57 | 102 | 52 | 123 | |||||||||||||||
Product development | -457 | -195 | -151 | -325 | -254 | |||||||||||||||
Other investing activities | -165 | -96 | -190 | -398 | 161 | |||||||||||||||
Free cash flow excluding M&A | 4,061 | 2,973 | 713 | -180 | 747 | |||||||||||||||
Acquisitions/divestments of subsidiaries and other operations, net | 299 | 20 | -425 | -431 | -449 | |||||||||||||||
Free cash flow | 4,360 | 2,993 | 288 | -611 | 298 | |||||||||||||||
| 2019 | 2018 | |||||||||||||||||||
Year to date, SEK million | Jan-Mar | Jan-Dec | Jan-Sep | Jan-Jun | Jan-Mar | |||||||||||||||
Cash flow from operating activities | 5,765 | 9,342 | 5,055 | 3,015 | 1,573 | |||||||||||||||
Net capital expenditures and other investments (excluding M&A) | ||||||||||||||||||||
Investments in property, plant and equipment | -1,314 | -3,975 | -2,895 | -1,807 | -856 | |||||||||||||||
Sales of property, plant and equipment | 232 | 334 | 277 | 175 | 123 | |||||||||||||||
Product development | -457 | -925 | -730 | -579 | -254 | |||||||||||||||
Other investing activities | -165 | -523 | -427 | -237 | 161 | |||||||||||||||
Free cash flow excluding M&A | 4,061 | 4,253 | 1,280 | 567 | 747 | |||||||||||||||
Acquisitions/divestments of subsidiaries and other operations, net | 299 | -1,285 | -1,305 | -880 | -449 | |||||||||||||||
Free cash flow | 4,360 | 2,968 | -25 | -313 | 298 | |||||||||||||||
| 44 Ericsson | First Quarter Report 2019 | Alternative performance measures | |