SECURITIES AND EXCHANGE COMMISSION
Washington, D.C. 20549
ANNUAL REPORT
ON FORM 10-K
Annual Report Pursuant to Section 13 or 15(d) of the Securities Exchange Act of 1934
For the fiscal year ended February 28, 2007 | Commission file number 1-8798 |
Nu Horizons Electronics Corp.
| (Exact name of registrant as specified in its charter) | |||
Delaware | 11-2621097 | ||
(State of other jurisdiction of incorporation or organization | (I.R.S. Employer Identification No.) | ||
70 Maxess Road, Melville, New York | 11747 | ||
| (Address of principal executive offices) | (Zip Code) | ||
(631) 396-5000
| (Registrant’s telephone number, including area code) |
| Securities registered pursuant to Section 12(g) of the Act: |
Common Stock Par Value $.0066 Per Share | NASDAQ National Market System |
(Title of class)
Indicate by check mark if the registrant is a well-known seasoned issuer, as defined in Rule 405 of the Securities Act. Yes o No x
Indicate by check mark if the registrant is not required to file reports pursuant to Section 13 or Section 15(d) of the Act. Yes x No o
Indicate by check mark whether the registrant: (1) has filed all reports required to be filed by Section 13 or 15(d) of the Securities Exchange Act of 1934 during the preceding 12 months (or for such shorter period that the registrant was required to file such reports), and (2) has been subject to such filing requirements for the past 90 days. Yes x No o
Indicate by check mark if disclosure of delinquent filers pursuant to Item 405 of Regulation S-K is not contained herein, and will not be contained, to the best of registrant’s knowledge, in definitive proxy or information statements incorporated by reference in Part III of this Form 10-K or any amendment to this Form 10-K x
Indicate by check mark whether the registrant is a large accelerated filer, an accelerated filer, or a non-accelerated filer. See definition of “accelerated filer and large accelerated filer” in Rule 12b-2 of the Exchange Act). (Check one)
Large accelerated filer o Accelerated filer x Non-accelerated filer o
Indicate by check mark whether the registrant is a shell company (as defined in Rule 12b-2 of the Exchange Act). Yes o No x
Aggregate Market Value of Non-Affiliate Stock at August 31, 2006 - approximately $231,000,000
Indicate the number of shares outstanding of each of the registrant's classes of common stock, as of May 1, 2007.
Common Stock - Par Value $.0066 | 18,158,034 |
| Class | Outstanding Shares |
Documents Incorporated by Reference: Part III of this annual report on Form 10-K incorporates information by reference from the registrant's definitive proxy statement.
NU HORIZONS ELECTRONICS CORP. AND SUBSIDIARIES
TABLE OF CONTENTS
| Forward Looking Statements | Page | 3 | ||||
| PART I: | ||||||
| ITEM 1 | Business | Pages | 3 - 7 | |||
| ITEM 1A | Risk Factors | Pages | 7 - 10 | |||
| ITEM 1B | Unresolved Staff Comments | Page | 11 | |||
| ITEM 2 | Properties | Page | 11 | |||
| ITEM 3 | Legal Proceedings | Page | 11 | |||
| ITEM 4 | Submission of Matters to a Vote of Security Holders | Page | 11 | |||
| PART II: | ||||||
| ITEM 5 | Market for the Registrant’s Common Equity, Related Stockholder Matters and Issuer Purchases of Equity Securities | Page | 12 -13 | |||
| ITEM 6 | Selected Financial Data | Page | 14 | |||
| ITEM 7 | Management’s Discussion and Analysis of Financial Condition and Results of Operation | Pages | 15 - 20 | |||
| ITEM 7A | Quantitative and Qualitative Disclosures About Market Risk | Page | 20 | |||
| ITEM 8 | Financial Statements and Supplementary Data | Pages | F1 - F21 | |||
| ITEM 9 | Changes in and Disagreements with Accountants on Accounting and Financial Disclosure | Page | 21 | |||
| ITEM 9A | Controls and Procedures | Pages | 21 - 23 | |||
| ITEM 9B | Other Information | Page | 23 | |||
| PART III: | ||||||
| ITEM 10 | Directors and Executive Officers of the Registrant | Page | 23 | |||
| ITEM 11 | Executive Compensation | Page | 24 | |||
| ITEM 12 | Security Ownership of Certain Beneficial Owners and Management and Related Stockholder Matters | Page | 24 | |||
| ITEM 13 | Certain Relationships and Related Transactions | Page | 24 | |||
| ITEM 14 | Principal Accounting Fees and Services | Page | 24 | |||
| PART IV: | ||||||
| ITEM 15 | Exhibits and Financial Statement Schedules | Pages | 25 - 28 | |||
| Signatures | Page | 29 | ||||
| Accountant’s Consent | Page | |||||
| Schedule II | Page | 30 | ||||
| Exhibit Index | Page | 31 | ||||
2
FORWARD LOOKING STATEMENTS:
Statements in this Form 10-K annual report may be “forward-looking statements” within the meaning of the Private Securities Litigation Reform Act of 1995. Forward-looking statements include, but are not limited to, statements that express our intentions, beliefs, expectations, strategies, predictions or any other statements relating to our future activities or other future events or conditions. These statements are based on current expectations, estimates and projections about our business based, in part, on assumptions made by management. These statements are not guarantees of future performance and involve risks, uncertainties and assumptions that are difficult to predict. Therefore, actual outcomes and results may differ materially from what is expressed or forecasted in the forward-looking statements due to numerous factors, including those risks discussed from time to time in this Form 10-K annual report for the year ended February 28, 2007, and in other documents which we file with the Securities and Exchange Commission. In addition, such statements could be affected by risks and uncertainties related to product demand, market and customer acceptance, competition, government regulations and requirements, pricing and development difficulties, as well as general industry and market conditions and growth rates, and general economic conditions. Any forward-looking statements speak only as of the date on which they are made, and we do not undertake any obligation to update any forward-looking statement to reflect events or circumstances after the date of this Form 10-K.
PART I.
| ITEM 1. | BUSINESS: |
GENERAL:
Nu Horizons Electronics Corp. a Delaware corporation incorporated in 1987, (the “Company”) and its wholly owned subsidiaries, NIC Components Corp. (“NIC”), Nu Horizons International Corp. (“International”), NUHC Inc. (“NUC”), Nu Horizons Asia PTE LTD (“NUA”), Nu Horizons Electronics Pte Ltd (“NUZ”), Nu Horizons Electronics Asia Pte Ltd., Korea Branch (“NUK”), Nu Horizons Electronics Hong Kong Ltd. (“NUHK”), Nu Horizons Electronics (Shanghai) Co. Ltd. (“NUS”), Nu Horizons Europe Limited (“NUE”), DT Electronics Limited (“DT”), Titan Supply Chain Services Corp. (“Titan”), Titan Supply Chain Services PTE LTD (“TSC”), Titan Supply Chain Services Limited (“TSE”), Razor Electronics (“RAZ”), Nu Exchange (“NUX”) and its majority owned subsidiaries, NIC Components Europe Limited (“NIE”), and NIC Components Asia PTE LTD. (“NIA”) are engaged in the distribution of, and supply chain services for, high technology active and passive electronic components.
All references in this report to “the Company,” “we,” “our” and “us” are to Nu Horizons Electronics Corp. and its subsidiaries unless the context indicates otherwise.
Active components distributed by the Company, principally to original equipment manufacturers ("OEMs") in the United States, include mainly commercial semiconductor products such as memory chips, microprocessors, digital and linear circuits, microwave, RF and fiber-optic components, transistors and diodes. Passive components distributed by NIC, principally to OEMs and other distributors nationally, consist of a high technology line of chip and leaded components, including capacitors, resistors and related networks.
The active and passive components distributed by the Company are utilized by the electronics industry and other industries in the manufacture of sophisticated electronic products including: industrial instrumentation, computers and peripheral equipment, consumer electronics, telephone and telecommunications equipment, satellite communications equipment, cellular communications equipment, medical equipment, automotive electronics, and audio and video electronic equipment.
Manufacturers of electronic components augment their marketing programs through the use of independent distributors and supply chain service providers such as the Company, upon which the Company believes they rely to a considerable extent to market and deliver their products. The Company offers its customers the convenience of diverse inventories, rapid delivery, design and technical assistance, inventory management, forecasting and logistical services and the availability of product in smaller quantities than generally available directly from manufacturers. Generally, companies engaged in the distribution of active and passive electronic components, such as the Company, are required to maintain a relatively significant investment in inventories and accounts receivable. To meet these requirements, the Company, like other companies in the industry, typically depends on internally generated funds as well as external borrowings.
3
| ITEM 1. | BUSINESS (Continued): |
Management’s policy is to manage, maintain and control the bulk of its inventories from its principal headquarters and stocking facilities in Melville (Long Island), New York, Southaven, Mississippi, San Jose, California, Singapore, Coventry, England, and Buckingham, England. As additional franchise line opportunities become available to the Company, the need for branch level inventories may be necessary and desirable in order to better serve the specific needs of local markets.
Semiconductor Products (Active Components):
The Company is a distributor of a broad range of semiconductor products to commercial and military OEM’s, principally in the United States. The Company is a franchised distributor of active components for approximately 35 product lines. Significant franchised product lines include Allegro, Exar, IDT, Linear Technologies, Marvel, Pericom, Renesas, Sharp Microelectronics, ST Microelectronics, Sun Microsystems, TDK Semiconductor, Toshiba, Vitesse Semiconductor, Oki Semiconductor, ON Semiconductor and Xilinx, among others.
The Company’s franchise agreements authorize it to sell all or part of the product line of a manufacturer on a non-exclusive basis. Under these agreements, each manufacturer will generally grant credits for any subsequent price reduction by such manufacturer and inventory return privileges whereby the Company can return to each such manufacturer for credit or exchange a percentage, generally ranging from 5% to 20%, of the inventory purchased from said manufacturer during a semi-annual period. The franchise agreements generally may be cancelled by either party upon written notice. The Company anticipates, in the future, entering into additional franchise agreements and increasing its inventory levels in accordance with business demands.
Financial information regarding the Company’s reportable segments and foreign and domestic operations can be found in Note 14 of the Notes to the Company’s financial statements.
Passive Components and Relationship with Nippon:
NIC has been the exclusive outlet in North America for Nippon Industries Co. Ltd.’s (Japan) (“Nippon”) brand of passive components, with a license for the use of the Nippon brand. The Company has a License Agreement with Nippon dated as of September 1, 2000 under which the Company has been granted an exclusive license to use the Nippon brand in the United States, Mexico, Central and South America and the Caribbean. The License Agreement has an initial term of ten years and automatically renews for successive one-year periods unless the Company or Nippon terminates the License Agreement 90 days prior to the end of the initial or any renewal term.
Due to certain market situations, NIC, with Nippon’s consent, has also established several manufacturing associations with U.S. and Taiwan based manufacturers to supply NIC with a portion of its product requirements under the NIC brand. NIC intends to continue to give Nippon priority, however, in acquiring Nippon’s products whenever Nippon’s technology and pricing are commensurate with market requirements.
Sales and Marketing:
Management’s strategy for long-term success has been to focus the Company’s sales and marketing efforts towards the following industry segments, both domestically and abroad: industrial, telecom/datacom, medical instrumentation, microwave and RF, fiber-optic, consumer electronics, security and protection devices, office equipment, computers and computer peripherals, factory automation and robotics. In order to help achieve its goals, the Company may enter into new franchise agreements for a broad base of commodity semiconductor products, including those used in the key niche industries referred to above.
All sales are made through customers’ purchase orders. Semiconductors are sold primarily via telephone by the Company’s in-house staff of approximately 125 salespersons, and by a combined field sales force of approximately 279 salespersons and field application engineers. The Company maintains branch sales facilities located as follows:
4
ITEM 1. BUSINESS (Continued):
Sales and Marketing (continued):
UNITED STATES: EAST COAST Massachusetts - Boston New York - Melville (Long Island) and Rochester New Jersey - Mt. Laurel (Philadelphia) and Pine Brook Ohio - Cleveland Maryland - Columbia North Carolina - Raleigh Georgia - Atlanta Alabama - Huntsville Florida - Ft. Lauderdale and Orlando MIDWEST Arizona - Phoenix Colorado - Denver Illinois - Chicago Minnesota - Minneapolis Texas - Austin, Dallas WEST COAST California - Irvine, Los Angeles, San Diego and San Jose Oregon - Portland Washington State - Bellevue | FOREIGN: CANADA Toronto ASIA Singapore Hong Kong, Beijing Wuhan, China - Chendu, Nanjing, Shanghai and Shenzhen Seoul, S. Korea India - Bangalore, Pune, New Delhi and Hyderabad Penang, Malaysia Taipei, Taiwan Bangkok, Thailand AUSTRALIA Melbourne Sydney EUROPE Buckingham, England Coventry, England Munich, Germany (April 2007) MEXICO Jalisco Chihuahua |
NIC’s passive components are marketed through the services of a national network of approximately 20 independent sales representative organizations, employing over 200 salespersons, as well as through NIC’s in-house sales and engineering personnel. The independent representative organizations do not represent competing product lines but sell other related products. Commissions to such organizations generally range from 2% to 3% of all sales in a representative’s exclusive territory.
NIC has developed a national network of 3 global distributors and approximately 25 regional distributor locations which market passive components on a non-exclusive basis. These distributors have entered into agreements with NIC whereby they are required to purchase from NIC a prescribed initial inventory. These distributors are protected by NIC against price reductions and are granted certain inventory return and other privileges, which to date have not been material. Due to the efforts of NIC and its distributors, NIC’s passive components have been tested and “designed in” as a prime source of qualified product by over 7,000 OEMs in the United States.
Customer Concentration:
No single customer accounted for more than 10% of the Company’s consolidated sales for the year ended February 28, 2007. The Company’s sales practice is to require payment within thirty days of delivery.
Source of Supply:
The Company inventories an extensive stock of active and passive components; however, if the Company’s customers order products for which the Company does not maintain inventory, the Company’s marketing strategy is to obtain such products from its franchise manufacturers, or, if a product is unobtainable, to identify and recommend satisfactory interchangeable alternative components. For this purpose, the Company devotes considerable efforts to familiarizing itself with component product movement throughout the industry, as well as to constant monitoring of its own inventories.
5
| ITEM 1. | BUSINESS (Continued): |
Source of Supply (continued):
As of February 28, 2007, there were three manufacturers that each represented more than 10% of the Company’s inventory on a consolidated basis. Those suppliers accounted for an aggregate of approximately $66,996,000 of total inventory. Electronic components distributed by the Company generally are presently readily available; however, from time to time the electronics industry has experienced a shortage or surplus of certain electronic products.
For the year ended February 28, 2007, the Company purchased inventory from each of three suppliers that was in excess of 10% of the Company’s total purchases. Purchases from these suppliers were approximately $121,160,000, $111,522,000 and $62,745,000 for the fiscal year.
Competition and Regulation:
The Company competes with many companies that distribute semiconductor and passive electronic components and, to a lesser extent, companies that manufacture such products and sell them directly to OEMs and other distributors. The Company also competes for customers with some of its own suppliers. Many of these companies have substantially greater assets and possess greater financial and personnel resources than those of the Company. In addition, certain of these companies possess independent franchise agreements to carry semiconductor product lines which the Company does not carry, but which it may desire to have. Competition is based primarily upon inventory availability, quality of service, knowledge of product and price. The Company believes that the distribution of passive electronic components under its own label is a competitive advantage.
The Company’s competitive ability to price its imported active and passive components could be adversely affected by increases in tariffs, duties, changes in the United States’ trade treaties with Japan, Taiwan or other foreign countries, transportation strikes and the adoption of Federal laws containing import restrictions. In addition, the cost of the Company’s imports could be subject to governmental controls and international currency fluctuations. Because imports are paid for with U.S. dollars, the decline in value of United States currency as against foreign currencies would cause increases in the dollar prices of the Company’s imports from Japan and other foreign countries. Although the Company has not experienced any material adverse effect to date in its ability to compete or maintain its profit margins as a result of any of the foregoing factors, no assurance can be given that such factors will not have a material adverse effect in the future.
The Sarbanes-Oxley Act of 2002 and rules promulgated thereunder by the SEC and the Nasdaq Stock Market have imposed substantial new or enhanced regulations and disclosure requirements in the areas of corporate governance (including director independence, director selection and audit, corporate governance and compensation committee responsibilities), equity compensation plans, auditor independence, pre-approval of auditor fees and services and disclosure and internal control procedures. We are committed to industry best practices in these areas and believe we are in compliance with the relevant rules and regulations.
Backlog:
The Company defines backlog as orders, believed to be firm, received from customers and scheduled for shipment, no later than 60 days for active components and no later than 90 days for passive components, from the date of the order. As of May 1, 2007, the Company’s backlog was approximately $116,000,000 as compared to a backlog of approximately $75,000,000 at May 1, 2006.
Employees:
As of February 28, 2007, the Company employed approximately 748 persons: 67 in management, 413 in sales and sales support, 66 in product and purchasing, 58 in finance, accounting and human resources, 21 in management information systems, 19 in operations and 104 in quality control, shipping, receiving and warehousing. The Company believes that its employee relations are satisfactory.
Available Information:
We file reports with the SEC. The public may read and copy any materials filed by us with the SEC at the SEC’s public reference room at 100 F Street, N.E., Washington D.C., 20549. The public may obtain information about the operation of the SEC’s public reference room by calling the SEC at 1-800-SEC-0330. The SEC also maintains a website at http://www.sec.gov that contains reports, proxy and information statements and other information about issuers such as us that file electronically with the SEC.
6
| ITEM 1. | BUSINESS (Continued): |
In addition, we make available free of charge on our website at http://www.nuhorizons.com our annual report on Form 10-K, quarterly reports on Form 10-Q, current reports on Form 8-K and amendments to those reports filed or furnished pursuant to Section 13(a) or 15(d) under the Exchange Act as soon as reasonably practical after we electronically file such material with, or furnish it to, the SEC.
Our Board of Directors has adopted a Code of Business Conduct applicable to the Company’s officers and employees, and has also adopted a Code of Ethics for its senior financial officers. These codes of conduct and ethics are posted on the Company’s website at www.nuhorizons.com in the Investor Relations section. Any amendment of the codes of conduct and ethics or waiver thereof applicable to any director or executive officer of the Company, including the Chief Executive Officer or any senior financial officer, will be disclosed on the Company’s website within four business days of the date of such amendment or waiver. In the case of a waiver, the nature of the waiver, the name of the person to whom the waiver was granted and the date of the waiver will also be disclosed.
The Board of Directors has also adopted, and we have posted in the Investor Relations section of our website, written Charters for each of the Board’s standing committees. We will provide without charge, upon a stockholder’s request to 70 Maxess Rd., Melville, NY 11747, Attention: Secretary, a copy of the Company's codes of ethics or the Charter of any standing committee of the Board.
| ITEM 1A. | RISK FACTORS: |
Risk Factors:
A large portion of the Company’s revenues come from sales of semiconductors, which is a highly cyclical industry, and an industry down-cycle could adversely affect its operating results.
The semiconductor industry historically has experienced periodic fluctuations in product supply and demand, often associated with changes in technology and manufacturing capacity, and is generally considered to be highly cyclical. The Company’s revenue closely follows the strength or weakness of the semiconductor market. The Company’s total sales of electronic components in the last five fiscal years have increased from approximately $302,000,000 in fiscal year 2003 to $737,463,000 in fiscal year 2007. Although the Company’s and the industry’s sales have been on an upward trend, a technology industry downcycle, particularly in the semiconductor sector, could adversely affect the Company’s operating results in the future.
If the Company is unable to maintain its relationships with key suppliers, the Company’s sales could be adversely affected.
In fiscal 2007, purchases of products and services from each of three suppliers exceeded 10% of the Company’s purchases on a consolidated basis. As a result, in the event that one or more of those suppliers experience financial difficulties or are not willing to do business with the Company in the future on terms acceptable to management, there could be a material adverse affect on the Company’s business, results of operations, financial condition or liquidity. Additionally, the Company’s relationships with its customers could be materially adversely affected because the Company’s customers depend on the Company’s distribution of electronic components and computer products from the industry’s leading suppliers.
Declines in the value of the Company’s inventory could materially adversely affect the Company’s business, results of operations, financial condition or liquidity.
The electronic components and computer products industry is subject to rapid technological change, new and enhanced products and evolving industry standards, which can contribute to decline in value or obsolescence of inventory. During an economic downturn it is possible that prices will decline due to an oversupply of product and, therefore, there may be greater risk of declines in inventory value. Although it is the policy of many of the Company’s suppliers to offer certain protections from the loss in value of inventory (such as price protection, limited rights of return, and rebates), the Company cannot assure you that that the vendors will choose to, or be able to, honor such agreements or that such return policies and rebates will fully compensate it for the loss in value. The Company cannot assure you that unforeseen new product developments or declines in the value of its inventory will not materially adversely affect the Company’s business, results of operations, financial condition or liquidity, or that the Company will successfully manage its existing and future inventories.
7
| ITEM 1A. | RISK FACTORS (continued): |
The volume and timing of customer sales may vary and could materially affect the Company’s results of operations, financial condition or liquidity.
The volume and timing of purchase orders placed by the Company’s customers are affected by a number of factors, including variation in demand for customers’ products, customer attempts to manage inventory, changes in product design or specifications and changes in the customers’ manufacturing strategies. The Company often does not obtain long-term purchase orders or commitments but instead works with its customers to develop nonbinding forecasts of future requirements. Based on such nonbinding forecasts, the Company makes commitments regarding the level of business that it will seek and accept, the timing of production schedules and the levels and utilization of personnel and other resources. A variety of conditions, both specific to each individual customer and generally affecting each customer’s industry, may cause customers to cancel, reduce or delay orders that were either previously made or anticipated. Generally, customers may cancel, reduce or delay purchase orders and commitments without penalty, except for payment for services rendered or products completed and, in certain circumstances, payment for materials purchased and charges associated with such cancellation, reduction or delay. Significant or numerous cancellations, reductions or delays in orders by customers, or any inability by customers to pay for services provided by the Company or to pay for components and materials purchased by it on such customers’ behalf, could have a material adverse effect on the Company’s results of operations, financial condition or liquidity.
Substantial defaults by the Company’s customers on the Company’s accounts receivable could have a significant negative impact on the Company’s business, results of operations, financial condition or liquidity.
A significant portion of the Company’s working capital consists of accounts receivable from customers. If customers responsible for a significant amount of accounts receivable were to become insolvent or otherwise unable to pay for products and services, or were to become unwilling or unable to make payments in a timely manner, the Company’s business, results of operations, financial condition or liquidity could be adversely affected.
The electronics component and computer industries are highly competitive and if the Company cannot effectively compete, its revenue may decline.
The market for the Company’s products and services is very competitive and subject to rapid technological advances. Not only does the Company compete with other distributors, it also competes for customers with some of its own suppliers. The Company’s failure to maintain and enhance its competitive position could adversely affect its business and prospects.
Some of the Company’s competitors may have greater financial, personnel, capacity and other resources than it has. As a result, the Company’s competitors may be in a stronger position to respond quickly to potential acquisitions and other market opportunities, new or emerging technologies and changes in customer requirements. Additional competition has emerged from third party logistics providers, fulfillment companies, catalogue distributors and on-line distributors and brokers.
Additionally, prices for the Company’s products tend to decrease over their life cycle. Such decreases often result in decreased gross profit margins for the Company. There is also substantial and continuing pressure from customers to reduce their total cost for products. Suppliers may also seek to reduce the Company’s margins on the sale of their products in order to increase their own profitability. The Company expends substantial amounts on the value creation services required to remain competitive, retain existing business and gain new customers, and the Company must evaluate the expense of those efforts against the impact of price and margin reductions.
Further, the manufacturing of electronic components and computer products is increasingly shifting to lower-cost production facilities in Asia, most notably China. Suppliers in Asia have traditionally had lower gross profit margins than those in the United States and Europe, and typically charge lower prices in the Asian markets for their products, which places pressure on the Company to lower its prices to meet competition.
Thus, the Company’s consolidated gross profit margins have declined over time, from 18.3% in fiscal 2003, to 15.3% in fiscal 2007. If the Company is unable to effectively compete in its industry or is unable to maintain acceptable gross profit margins, its business could be materially adversely affected.
8
| ITEM1A. | RISK FACTORS (continued): |
The Company may not have adequate or cost-effective liquidity or capital resources.
The Company needs cash to make interest payments on and to refinance indebtedness, and for general corporate purposes, such as funding its ongoing working capital and capital expenditure needs. At February 28, 2007, the Company had cash, cash equivalents, and short-term investments of approximately $5,000,000. In addition, the Company currently has access to credit lines of $180,000,000, of which $30,000,000 is currently being borrowed. The Company’s ability to satisfy its cash needs depends on its ability to generate cash from operations and to access the financial markets, both of which are subject to general economic, financial, competitive, legislative, regulatory and other factors that are beyond its control.
The Company may in the future need to access the financial markets to satisfy its cash needs. Under the terms of any external financing, the Company may incur higher than expected financing expenses and become subject to additional restrictions and covenants. For example, the Company’s existing debt agreements contain restrictive covenants, including covenants requiring compliance with specified financial ratios and a failure to comply with these or any other covenants may result in an event of default. An increase in the Company’s financing costs or a breach of debt instrument covenants could have a material adverse effect on the Company.
The agreements governing the Company’s financings contain various covenants and restrictions that, in certain circumstances, could limit its ability to:
| · | grant liens on assets; |
| · | make restricted payments (including paying dividends on capital stock or redeeming or repurchasing capital stock); |
| · | make investments; |
| · | merge, consolidate or transfer all or substantially all of its assets; |
| · | incur additional debt; or |
| · | engage in certain transactions with affiliates. |
As a result of these covenants and restrictions, the Company may be limited in how it conducts its business and may be unable to raise additional debt, compete effectively, make investments, or engage in other activities that may be beneficial to its business.
Products sold by the Company may be found to be defective and, as a result, warranty and/or product liability claims may be asserted against the Company which may have a material adverse effect on the Company.
Products sold by the Company are at prices that are significantly lower than the cost of the equipment or other goods in which they are incorporated. Since a defect or failure in a product could give rise to failures in the end products that incorporate them (and claims for consequential damages against the Company from its customers), the Company may face claims for damages that are disproportionate to the sales and profits it receives from the products involved. While the Company and its suppliers specifically exclude consequential damages in their standard terms and conditions, the Company’s ability to avoid such liabilities may be limited by the laws of some of the countries where it does business. The Company’s business could be materially adversely affected as a result of a significant quality or performance issue in the products sold by the Company, if it is required to pay for the damages that result. Although the Company currently has product liability insurance, such insurance is limited in coverage and amount.
The Company’s non-U.S. locations represent a significant portion of the Company’s revenue, and consequently, we are increasingly exposed to risks associated with operating internationally.
The Company's operations outside the United States generated approximately 25% of sales in fiscal years 2007, 2006, and 2005. As a result of the Company’s foreign sales and locations, the Company’s operations are subject to a variety of risks that are specific to international operations, including the following:
| · | potential restrictions on transfers of funds; |
| · | foreign currency fluctuations; |
| · | import and export duties and value added taxes; |
| · | import and export regulation changes that could erode profit margins or restrict exports; |
| · | changing foreign tax laws and regulations; |
| · | potential military conflicts; |
| · | inflexible employee contracts in the event of business downturns; and |
| · | the burden and cost of compliance with foreign laws. |
9
| ITEM 1A. | RISK FACTORS (continued): |
Manufacturing of electronic component and computer products is increasingly shifting to lower-cost production facilities in Asia, and most notably the People’s Republic of China. The Company’s business and prospects have been and could continue to be adversely affected by the shift to the Asian marketplace. In addition, we have operations in several locations in emerging or developing economies that have a potential for higher risk.
The Company may not adequately manage its international operations.
The Company anticipates that its foreign subsidiaries will engage in substantial regional operations. The Company currently manages its Asian and European subsidiaries, and plans to continue to manage future foreign subsidiaries, on a decentralized basis, with local and regional management retaining responsibility for day-to-day operations, profitability and the growth of these subsidiaries. If the Company fails to maintain or implement effective controls, it may experience inconsistencies in the operating and financial practices among its subsidiaries, which may harm its business, results of operations and liquidity.
If the Company is unable to recruit and retain key personnel necessary to operate its businesses, its ability to compete successfully will be adversely affected.
The Company is heavily dependent on its current executive officers, management and technical personnel. The loss of any key employee or the inability to attract and retain qualified personnel could adversely affect the Company’s ability to execute its current business plans. Competition for qualified personnel is intense, and the Company might not be able to retain its existing key employees or attract and retain any additional personnel.
If the Company fails to maintain an effective system of internal controls or discovers material weaknesses in its internal controls over financial reporting, it may not be able to report its financial results accurately or timely or detect fraud, which could have a material adverse effect on its business.
An effective internal control environment is necessary for the Company to produce reliable financial reports and is important in its efforts to prevent financial fraud. The Company is required to periodically evaluate the effectiveness of the design and operation of its internal controls over financial reporting. These evaluations may result in the conclusion that enhancements, modifications or changes to internal controls are necessary or desirable. While management evaluates the effectiveness of the Company’s internal controls on a regular basis, these controls may not always be effective. There are inherent limitations on the effectiveness of internal controls including collusion, management override, and failure of human judgment. In addition, control procedures are designed to reduce rather than eliminate business risks. If the Company fails to maintain an effective system of internal controls or if management or the Company’s independent registered public accounting firm was to discover material weaknesses in the Company’s internal controls, it may be unable to produce reliable financial reports or prevent fraud and it could have a material adverse effect on the Company’s business. In addition, the Company may be subject to sanctions or investigation by regulatory authorities, such as the Securities and Exchange Commission or NASDAQ. Any such actions could result in an adverse reaction in the financial markets due to a loss of confidence in the reliability of the Company’s financial statements, which could cause the market price of its common stock to decline or limit the Company’s access to other forms of capital.
The Company relies heavily on its internal information systems which, if not properly functioning, could materially adversely affect the Company’s business.
The Company’s current global operations reside on the Company’s technology platforms. Any of these systems are subject to electrical or telecommunications outages, computer hacking or other general system failure. Failure of its internal information systems or material difficulties in upgrading its global financial system could have material adverse effects on the Company’s business.
The Company’s response to the subpoenas received from the Securities Exchange Commission may require a significant amount of management time and attention and significant expenditure of funds, which may disrupt or have a negative impact on our business and adversely affect our results of operations.
Both the Company and its wholly-owned subsidiary Titan Supply Chain Services received subpoenas from the SEC on April 13, 2007 in an action captioned “In the Matter of Vitesse Semiconductor Corp.” requiring them to produce documents related to their business relationship with Vitesse Semiconductor Corp. The Company and Titan are cooperating fully with the SEC which may require a significant amount of management time and attention, which could disrupt or have a negative impact on our business. In addition, the response to the subpoenas may require the Company to expend significant amounts for professional fees and related expenses, which expenditures may have an adverse effect on our results of operations, financial condition or liquidity. Further, the review of information by the SEC may result in additional inquiries.
10
| ITEM 1B. | UNRESOLVED STAFF COMMENTS: |
None.
| ITEM 2. | PROPERTIES: |
The Company leases an approximately 80,000 square foot facility in Melville, Long Island, New York to serve as its executive offices and main distribution center. The lease term is from December 17, 1996 to December 31, 2008 at an annual base rental of $601,290 and provides for a 4% annual escalation in each of the last ten years of the term. The lease is renewable for an additional six years with the same 4% annual escalation clause, at the option of the Company
The Company leases approximately 10,000 square feet of office space in Melville, Long Island, New York to serve as the executive offices of its NIC Components subsidiary. The lease term is from April 1, 2001 to December 31, 2008 at an annual base rental of $286,000 and provides for a 4% annual escalation in each subsequent year of the lease.
On November 1, 2006, the Company entered into a new warehouse lease in Southaven, Mississippi for approximately 48,000 square feet. The lease term is from November 1, 2006 to January 31, 2012 at an annual base rent of $205,000.
The Company also leases space for twenty-seven (27) branch sales offices in the United States, one (1) in Canada, seventeen (17) in Asia Pacific, two (2) in Australia and two (2) in England, which range in size from 1,000 square feet to 14,000 square feet, with lease terms that expire between April 30, 2007 and January 31, 2012. Annual base rentals range from $9,000 to $877,000 with aggregate base rentals approximating $2,500,000. The Company believes it can obtain extensions of the leases scheduled to expire in fiscal 2007 on substantially similar terms to those currently in effect.
| ITEM 3. | LEGAL PROCEEDINGS: |
No material legal proceeding is pending to which the Company is a party or to which any of its property is or may be subject.
| ITEM 4. | SUBMISSION OF MATTERS TO A VOTE OF SECURITY HOLDERS: |
During the fourth quarter of the fiscal year ended February 28, 2007, no matters were submitted to a vote of security holders through the solicitation of proxies or otherwise.
11
PART II.
| ITEM 5. | MARKET FOR REGISTRANT’S COMMON EQUITY, RELATED STOCKHOLDER MATTERS AND ISSUER PURCHASES OF EQUITY SECURITIES: |
| a) | The Company’s common stock is traded on the NASDAQ National Market System under the symbol “NUHC”. The following table sets forth, for the periods indicated, the high and low trading prices for the Company’s common stock as reported by the NASDAQ National Market System. |
| FISCAL YEAR 2006: | High | Low | |||||
First Quarter | $ | 7.36 | $ | 5.79 | |||
Second Quarter | 7.00 | 5.73 | |||||
Third Quarter | 10.80 | 5.89 | |||||
Fourth Quarter | 10.97 | 8.47 | |||||
| FISCAL YEAR 2007: | |||||||
First Quarter | $ | 9.75 | $ | 7.95 | |||
Second Quarter | 14.84 | 7.18 | |||||
Third Quarter | 14.26 | 10.33 | |||||
Fourth Quarter | 12.09 | 8.61 | |||||
| FISCAL YEAR 2008: | |||||||
First Quarter (Through May 1, 2007) | $ | 11.80 | $ | 9.03 | |||
| b) | As of May 1, 2007, the Company’s common stock was owned by approximately 600 holders of record and 6,750 beneficial holders. |
| c) | The Company does not anticipate that it will pay any dividends in the foreseeable future. The Company currently intends to retain future earnings for use in the operation and development of its business and for potential acquisitions. In addition, the terms of the Company’s loan agreement limits the payment of dividends to no more than 25% of the Company’s consolidated net income. |
The information required by Item 201(d) of Regulation S-K will be contained in the Registrant's definitive proxy statement to be filed with the Securities and Exchange Commission within 120 days after the end of the Registrant's fiscal year.
12
| ITEM 5. | MARKET FOR REGISTRANT’S COMMON EQUITY, RELATED STOCKHOLDER MATTERS AND ISSUER PURCHASES OF EQUITY SECURITIES (Continued): |
Performance Graph:
The following graph compares the performance of the Company’s common stock for the periods indicated with the performance of the NASDAQ Composite Index and the average performance of a group consisting of the Company’s peer companies. The Peer Group includes Arrow Electronics, Inc., Avnet, Inc., Agilysys, Inc., All American Semiconductor, Inc., Bell Microproducts, Inc., and Jaco Electronics, Inc. The graph assumes $100 invested on February 28, 2002 in the Company, the NASDAQ Composite Index, and the Peer Group. Total return indices reflect reinvestment dividends and are weighted on the basis of market capitalization at the time of each reported data point.
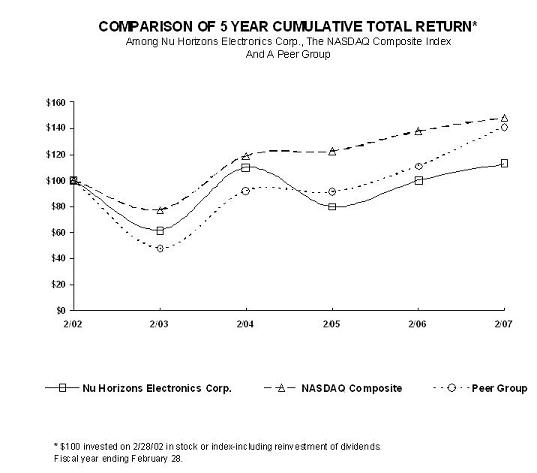
2/02 | 2/03 | 2/04 | 2/05 | 2/06 | 2/07 | ||||||||||||||
Nu Horizons Electronics Corp. | 100.00 | 61.67 | 109.95 | 79.75 | 99.89 | 113.04 | |||||||||||||
NASDAQ Composite | 100.00 | 77.36 | 118.86 | 122.40 | 137.91 | 148.37 | |||||||||||||
Peer Group | 100.00 | 47.75 | 92.13 | 90.94 | 111.07 | 141.38 | |||||||||||||
13
| ITEM 6. | SELECTED FINANCIAL DATA: |
| For the Years Ended | ||||||||||||||||
| February 28, 2007 | February 28, 2006 | February 28, 2005 | February 29, 2004 | February 28, 2003 | ||||||||||||
INCOME STATEMENT DATA: | ||||||||||||||||
Continuing Operations: | ||||||||||||||||
| Net sales | $ | 737,463,000 | $ | 561,291,000 | $ | 467,849,000 | $ | 345,864,000 | $ | 302,081,000 | ||||||
| Gross profit on sales | 112,945,000 | 88,749,000 | 77,581,000 | 60,961,000 | 55,228,000 | |||||||||||
| Gross profit percentage | 15.3 | % | 15.8 | % | 16.6 | % | 17.6 | % | 18.3 | % | ||||||
Operating Income (loss) | 19,434,000 | 10,658,000 | 7,443,000 | (1,475,000 | ) | (2,212,000 | ) | |||||||||
Net income (loss) | $ | 9,913,000 | $ | 4,884,000 | $ | 3,073,000 | $ | (848,000 | ) | $ | (2,512,000 | ) | ||||
| Earnings (loss) per common share: | ||||||||||||||||
| Basic | $ | .55 | $ | .29 | $ | .18 | $ | (1)(.05 | ) | (1)$(.15 | ) | |||||
| Diluted | $ | .53 | $ | .28 | $ | .17 | $ | (1)(.05 | ) | (1)$(.15 | ) | |||||
(1) Due to the loss, the inclusion of common stock equivalents in diluted earnings per share would be antidilutive
| As of February 28, 2007 | As of February 28, 2006 | As of February 28, 2005 | As of February 29, 2004 | As of February 28, 2003 | ||||||||||||
BALANCE SHEET DATA: | ||||||||||||||||
| Working capital | $ | 171,215,000 | $ | 181,823,000 | $ | 145,485,000 | $ | 123,494,000 | $ | 116,792,000 | ||||||
| Total assets | 264,226,000 | 243,474,000 | 177,799,000 | 158,178,000 | 148,099,000 | |||||||||||
| Long-term liabilities | 35,747,000 | 51,939,000 | 23,969,000 | 5,580,000 | 253,000 | |||||||||||
| Shareholders’ equity | 149,324,000 | 135,656,000 | 127,932,000 | 124,403,000 | 123,992,000 | |||||||||||
14
| ITEM 7. | MANAGEMENT’S DISCUSSION AND ANALYSIS OF FINANCIAL CONDITION AND RESULTS OF OPERATIONS |
For an understanding of the Company and the significant factors that influenced the Company's performance during the past three fiscal years, the following discussion should be read in conjunction with the description of the business appearing in Item 1 of this Report and the consolidated financial statements, including the related notes, and other information appearing in Item 15 of this Report. The Company operates on a fiscal year ending February 28.
Overview:
Nu Horizons Electronics Corp. and its wholly-owned subsidiaries are engaged in the distribution of high technology active and passive electronic components to a wide variety of original equipment manufacturers (“OEMs”) of electronic products. Active components distributed by the Company include semiconductor products such as memory chips, microprocessors, digital and linear circuits, microwave/RF and fiberoptic components, transistors and diodes. Passive components distributed by NIC, NIA and NIE, principally to OEMs and other distributors nationally, consist of a high technology line of chip and leaded components including capacitors, resistors and related networks.
The electronics manufacturing and the electronics distribution industries in which the Company operates has experienced double digit increases in sales dollar volume for several years. Additionally, there have been recent consolidations in the electronics distribution industry, resulting in greater market share for certain of the remaining companies. The increase in sales volume has been accompanied by continued downward margin pressures, primarily due to the industry shift to production in Asia.
The Company recognized the industry shift to overseas production and the need to serve its suppliers on a global basis. As a result, the Company adopted a strategy of expanding its Asian and European operations by investing in human resources and expanding its sales force and engineering personnel. In prior years, we invested in Asia and currently we are staffed with 144 employees in 19 offices, with a warehouse in Singapore. In fiscal 2007, we continued our growth strategy of expanding our European presence by acquiring DT Electronics Limited on August 29, 2006 (see footnote 3 to the consolidated financial statements) with 37 employees and a warehouse in Coventry, England. Most recently, we opened our first office in Munich, Germany.
The Company also took advantage of the recent industry consolidation by hiring a significant number of additional sales and engineering personnel domestically in 2006 and adding to its line card (franchise suppliers). This strategy has yielded positive results to date. Sales in Asia increased 18.2% for the fiscal year 2007 over 2006, while sales in the U.S. increased by 32.5%. Additionally, the Company’s book to bill ratio, company wide, remains positive. Our sales in Europe have increased 98.5% over the prior year due to the acquisition of DT Electronics. The Company has increased market share with all of its major suppliers for both the semiconductor and passive component businesses in 2007.
It is difficult for the Company, as a distributor, to forecast the material trends of the electronic component and computer products industry, aside from some of the normal seasonality discussed herein, because the Company does not typically have material forward-looking information available from its customers and suppliers beyond approximately three to four months. As such, management relies on the publicly available information published by certain industry groups and other related analyses to evaluate its longer term prospects.
The table below provides a year-over-year summary of sales for the Company:
Three-Year Analysis of Sales: By Geography
| Years Ended February 28 | Percentage Change | ||||||||||||||||||||||||
| 2007 | % of Total | 2006 | % of Total | 2005 | % of Total | 2007 to 2006 | 2006 to 2005 | ||||||||||||||||||
| (Dollars in thousands) | |||||||||||||||||||||||||
Sales by Geographic Area: | |||||||||||||||||||||||||
| North America | $ | 554,794 | 75.2 | % | $ | 418,578 | 74.6 | % | $ | 352,778 | 75.4 | % | 32.5 | % | 18.7 | % | |||||||||
| Asia | 148,137 | 20.1 | 125,313 | 22.3 | 100,912 | 21.6 | 18.2 | 24.2 | |||||||||||||||||
| Europe | 34,532 | 4.7 | 17,400 | 3.1 | 14,159 | 3.0 | 98.5 | 22.9 | |||||||||||||||||
| $ | 737,463 | 100.0 | % | $ | 561,291 | 100.0 | % | $ | 467,849 | 100.0 | % | 31.4 | % | 20.0 | % | ||||||||||
15
| ITEM 7. | MANAGEMENT’S DISCUSSION AND ANALYSIS OF FINANCIAL CONDITION AND RESULTS OF OPERATIONS (Continued): |
Overview (continued):
For the year ended February 28, 2007, net sales increased to $737,463,000 from $561,291,000 for the prior year with net income of $9,913,000 or $.55 per basic share and $.53 per diluted share as compared to a net income of $4,884,000 or $.29 per basic and $.28 per diluted share in the prior fiscal year.
The following table sets forth for the years ended February 2007, 2006 and 2005, certain items in the Company’s consolidated statements of operations expressed as a percentage of net sales.
| Years Ended February 28 | ||||||||||
| 2007 | 2006 | 2005 | ||||||||
| Net sales | 100.0 | % | 100.0 | % | 100.0 | % | ||||
| Cost of sales | 84.7 | 84.2 | 83.4 | |||||||
| Gross profit | 15.3 | 15.8 | 16.6 | |||||||
| Operating expenses | 12.7 | 13.9 | 15.0 | |||||||
| Interest expense | 0.5 | 0.6 | 0.4 | |||||||
| Interest (income) | (0.1 | ) | (0.1 | ) | 0.0 | |||||
| Income before taxes | 2.2 | 1.4 | 1.2 | |||||||
| Income tax provision | 0.8 | 0.5 | 0.4 | |||||||
| Income after taxes, before minority interests | 1.4 | 0.9 | 0.8 | |||||||
| Minority interests | 0.1 | 0.0 | 0.1 | |||||||
| Net income | 1.3 | 0.9 | 0.7 | |||||||
The Company’s business, financial condition, operating results and cash flows can be impacted by a number of factors, including but not limited to those set forth below in “Management’s Discussion and Analysis of Financial Condition and Results of Operations,” any one of which could cause our actual results to vary materially from recent results or from our anticipated future results. For a discussion identifying additional risk factors and important factors that could cause actual results to differ materially from those anticipated, also see the discussions in “Forward-Looking Statements,” “Risk Factors” and “Notes to Consolidated Financial Statements” in this Form 10-K.
Fiscal Year 2007 versus 2006
Results of Operations:
Net sales for the year ended February 28, 2007 aggregated $737,463,000 as compared to $561,291,000 for the year ended February 28, 2006, an increase of $176,172,000 or 31.4%. Management believes that this sales increase is due to increased market share resulting from the industry consolidation, its increased sales personnel, the expansion of its line card (franchised suppliers) and its global customer base, and its purchase of DT Electronics, a distributor in England.
Gross profit margin as a percentage of net sales was 15.3% for the year ended February 28, 2007 as compared to 15.8% for the year ended February 28, 2006. The decreased margin is due to product mix, and increased order size coupled with increased sales in the Asian market, which requires lower selling prices due to volume demand from large Asian contract manufacturers. Management believes that margin pressures should stabilize in fiscal 2008, however, no assurances can be given in this regard.
As a percentage of sales, operating expenses decreased to 12.7% as compared to 13.9% in the prior year. Operating expenses increased to $93,511,000 for the year ended February 28, 2007 from $78,091,000 for the year ended February 28, 2006, an increase of $15,420,000 or 19.9%. The dollar increase in operating expenses was primarily due to increases in the following expense categories: Approximately $12,800,000 or 83.0% of the increase was for personnel related costs resulting from increased staffing levels and related commissions to support increased sales. Approximately $2,500,000 or 16.0% of the increase was a result of net increases in various other expenses and fees such as rent, utilities, telephone, insurance, and computer expenses, among others, which represent an aggregate 2.9% of the Company’s total overhead.
16
| ITEM 7. | MANAGEMENT’S DISCUSSION AND ANALYSIS OF FINANCIAL CONDITION AND RESULTS OF OPERATIONS (Continued): |
Fiscal Year 2007 versus 2006 (Continued):
Results of Operations (Continued):
Interest expense increased to $3,850,000 for the year ended February 28, 2007 as compared to $3,298,000 for the year ended February 28, 2006. This increase in interest expense resulted from higher levels of bank borrowings during the fiscal year to support the increase in accounts receivable and inventory levels, as well as the effect of increased interest rates on those borrowings during the fiscal year.
Net income for the year ended February 28, 2007 was $9,913,000 or $.55 per basic share and $.53 per diluted share as compared to $4,884,000 or $.29 per basic and $.28 per diluted share for the year ended February 28, 2006.
Management attributes the increase in earnings in fiscal 2007 to the increase in sales providing increased gross margin dollars exceeding the increase in operating and interest expense.
Fiscal Year 2006 versus 2005
Results of Operations:
Net sales for the year ended February 28, 2006 aggregated $561,291,000 as compared to $467,849,000 for the year ended February 28, 2005, an increase of $93,442,000 or 20.0%. Management believes that this sales increase is primarily due to increased market share resulting from the industry consolidation, its increased sales personnel and the expansion of its line card and customer base, both domestically and in Asia.
Gross profit margin as a percentage of net sales was 15.8% for the year ended February 28, 2006 as compared to 16.6% for the year ended February 28, 2005. Management believes that this continuing gross margin pressure results from a change in the Company’s product mix and increased order size, coupled with increased sales in the Asian market, which requires lower selling prices due to volume demand from large Asian contract manufacturers.
As a percentage of sales, operating expenses decreased to 13.9% as compared to 15.0% in the prior year. Operating expenses increased to $78,091,000 for the year ended February 28, 2006 from $70,138,000 for the year ended February 28, 2005, an increase of $7,953,000 or 11.3%. The dollar increase in operating expenses was due to increases in the following expense categories: Approximately $6,996,000 or 88.0% of the increase was for personnel related costs resulting from increased staffing levels in connection with the expansion of the Company’s Asian and U.S. operational capability during the fiscal year. Management made a strategic decision to invest in expanding the Company’s personnel during the phase of market consolidation, which resulted in increased personnel related operating expenses. Approximately $957,000 or 12.0% of the increase was a result of net increases in various other expenses and fees such as rent, utilities, telephone, insurance, and computer expenses, among others, which represent an aggregate 1.2% of the Company’s total overhead.
Interest expense increased to $3,298,000 for the year ended February 28, 2006 as compared to $1,920,000 for the year ended February 28, 2005. This increase in interest expense resulted from greater bank borrowings incurred to support the increase in accounts receivable and inventory levels, as well as the effect of increased interest rates on those borrowings during the fiscal year.
Net income for the year ended February 28, 2006 was $4,884,000 or $.29 per basic share and $.28 per diluted share as compared to $3,073,000 or $.18 per basic and $.17 per diluted share for the year ended February 28, 2005. Management attributes the increase in earnings in fiscal 2006 to the increase in sales providing increased gross margin dollars exceeding the increase in operating and interest expense.
Critical Accounting Policies and Estimates:
The Company’s financial statements have been prepared in accordance with accounting principles generally accepted in the United States of America. The preparation of these financial statements requires the Company to make significant estimates and judgments that affect the reported amounts of assets, liabilities, revenues and expenses and related disclosure of contingent assets and liabilities. The Company evaluates its estimates, including those related to bad debts, inventories, intangible assets, income taxes and contingencies and litigation, on an ongoing basis. The Company bases its estimates on historical experience and on various other assumptions that are believed to be reasonable under the circumstances, the results of which form the basis for making judgments about the carrying values of assets and liabilities that are not readily apparent from other sources. Actual results may differ from these estimates under different assumptions or conditions.
17
| ITEM 7. | MANAGEMENT’S DISCUSSION AND ANALYSIS OF FINANCIAL CONDITION AND RESULTS OF OPERATIONS (Continued): |
Critical Accounting Policies and Estimates (Continued):
The Company believes the following critical accounting policies, among others, involve the more significant judgments and estimates used in the preparation of its consolidated financial statements:
Revenue Recognition - The Company recognizes revenue in accordance with SEC Staff Accounting Bulletin No. 104, “Revenue Recognition in Financial Statements” (“SAB 104”). Under SAB 104, revenue is recognized when the title and risk of loss have passed to the customer, there is persuasive evidence of an arrangement, delivery has occurred or services have been rendered, the sales price is determinable and collectibility is reasonably assured. The Company recognizes revenues at time of shipment of its products and sales are recorded net of discounts and returns.
Allowance for Doubtful Accounts - The Company maintains allowances for doubtful accounts for estimated bad debts. Our estimate of the allowances needed is based on our past history of collections of accounts receivable from our customers. This history has shown that we have always provided sufficient allowances in prior periods. If the financial condition of the Company’s customers were to deteriorate, resulting in an impairment of their ability to make payments, additional allowances might be required thereby reducing our operating income. For example, at fiscal year end, each additional 1% accounts receivable allowance would reduce operating income by approximately $1,250,000 for the year ended February 28, 2007.
Inventory Valuation - Inventories are recorded at the lower of cost or market. Write-downs of inventories to market value are based upon product franchise agreements governing price protection, stock rotation and obsolescence, as well as assumptions about future demand market conditions and the ability to return inventory pursuant to our distributor franchise agreements. In prior periods, reserves required for obsolescence were not material to our financial statements. If assumptions about future demand or actual market conditions are less favorable than those projected by management, additional write-downs of inventories could be required. For example, at fiscal year end, each additional 1% of obsolete inventory or inventory that the Company was unable to return pursuant to its distributor agreements, would reduce operating income by approximately $1,250,000 for the year ended February 28, 2007.
Accounting for Income Taxes - Management's judgment is required in determining the provision for income taxes, deferred tax assets and liabilities and the valuation allowance recorded against net deferred tax assets. The carrying value of the Company's net operating loss carry-forwards is dependent upon its ability to generate sufficient, if any, future taxable income in certain tax jurisdictions. In addition, the Company considers historic levels of income expectations and risk associated with estimates of future taxable income and ongoing prudent and feasible tax planning strategies in assessing a tax valuation allowance. Should the Company determine that it is not able to realize all or part of its deferred tax assets in the future, a valuation allowance may be recorded against the deferred tax assets with a corresponding charge to income in the period such determination is made.
Goodwill and Other Indefinite-Lived Intangibles - The Company will perform an annual impairment test on or near the acquisition date, or earlier, if indicators of potential impairment exist, to evaluate goodwill and other indefinite-lived intangibles. Such intangible assets are considered impaired if the carrying amount of the reporting unit exceeds its estimated fair value. In assessing the recoverability of such intangible assets, the Company reviews both quantitative and qualitative factors to support its assumptions with regard to fair value. In determining the fair value, the Company will make certain judgments, including the identification of reporting units and the selection of comparable companies. If these estimates or their related assumptions change in the future as a result of changes in strategy and/or market conditions, the Company may be required to record an impairment charge.
The Company establishes reserves for potentially unfavorable outcomes for positions taken on certain tax matters. These reserves are based on management's judgments and estimates of probable future tax liabilities. As these estimates are highly judgmental, there may be differences between the anticipated and actual outcomes of these matters that may result in reversals of reserves or additional tax liabilities in excess of the reserved amounts. To the extent such adjustments are warranted, the Company's effective tax rate may potentially fluctuate as a result.
18
| ITEM 7. | MANAGEMENT’S DISCUSSION AND ANALYSIS OF FINANCIAL CONDITION AND RESULTS OF OPERATIONS (Continued): |
Liquidity and Capital Resources:
Fiscal Year 2007 versus 2006
The Company ended its 2007 fiscal year with working capital and cash aggregating approximately $171,215,000 and $4,747,000, respectively, as compared to approximately $181,823,000 and $10,873,000, respectively, at February 28, 2006. The Company’s current ratio at February 28, 2007, was 3.2:1 as compared to 4.3:1 at February 28, 2006. The Company utilized excess cash at February 28, 2007 to pay down its Revolving Credit line which was $30,000,000 at February 28, 2007 and $50,600,000 at February 28, 2006.
In fiscal 2007, approximately $18,000,000 of cash flow was provided by operations. Cash generated from operations together with existing cash in banks was primarily used to purchase DT Electronics ($6,100,000), capital expenditures ($1,100,000) and pay down debt ($21,000,000).
On January 31, 2007, the Company entered into an amended and restated secured revolving line of credit agreement, as amended, with eight banks, which currently provides for maximum borrowings of $150,000,000 (the "Revolving Credit Line"). The Revolving Credit Line provides for borrowings utilizing an asset based formula predicated on a certain percentage of outstanding domestic accounts receivable and inventory levels at any given month end. Based on the asset based formula, the Company may not be able to borrow the maximum amount available under its Revolving Credit Line at all times. Borrowings under the Revolving Credit Line bear interest at either (i) the lead bank’s prime rate or (ii) LIBOR plus 150 basis points, at the option of the Company, through September 30, 2011, the due date of the loan. Direct borrowings under the Revolving Credit Line were $30,000,000 at February 28, 2007 and $50,600,000 at February 28, 2006. As of the end of each of the fiscal periods, the Company was in compliance with all of the required bank covenants.
On August 29, 2006, the Company acquired DT Electronics, a company engaged in the electronics components business in the United Kingdom. The initial purchase price for DT Electronics as of the acquisition date was $5,731,000. The transaction also provides for potential additional payments to the seller in three installments through 2009 from a guaranteed minimum of approximately $1,611,000 to a maximum of approximately $4,989,000, which amounts are calculated using current exchange rates. Payments of any amounts above the minimum are contingent upon the attainment of certain earnings milestones by DT Electronics during the three year period. The Company has accrued the maximum estimated payment currently since DT Electronics is expected to achieve the earnings milestones established by the agreement. The DT Electronics acquisition was funded from existing cash on hand.
The Company also has a receivable financing agreement (the "Bank Credit Line") with a bank in England which provides for maximum borrowings of £2.5 million (approximately $4.6 million) which bear interest at the bank's base rate plus 1.75%. The interest rate at February 28, 2007 was 7%.
On November 20, 2006, the Company entered a revolving credit agreement with a Singapore bank to provide a $30,000,000 secured line of credit to the Company’s Asian subsidiaries and thereby finance the Company’s Asian operations. Borrowings under the agreement utilize an asset based formula based on a certain percentage of outstanding accounts receivables and inventory levels at any given month end. Borrowings under the Singapore credit line bear interest at SIBOR plus 1.5 percent. At February 28, 2007, there were no borrowings under this credit line.
The Company anticipates that its resources provided by its cash flow from operations and its current borrowing agreement, will be sufficient to meet its financing requirements for the next twelve-month period.
Off-Balance Sheet Arrangements:
As of February 28, 2007, the Company had no off-balance sheet arrangements.
19
| ITEM 7. | MANAGEMENT’S DISCUSSION AND ANALYSIS OF FINANCIAL CONDITION AND RESULTS OF OPERATIONS (Continued): |
Contractual Obligations:
Contractual Obligations | Total | Less than 1 year | 1-3 years | 3-5 Years | More than 5 years | |||||||||||
| Revolving Credit Line | $ | 30,000,000 | $ | - | $ | - | $ | 30,000,000 | $ | - | ||||||
| Equipment Leases | 926,000 | 327,000 | 599,000 | - | - | |||||||||||
| Operating Leases | 9,107,000 | 3,794,000 | 3,986,000 | 1,306,000 | 21,000 | |||||||||||
Employment Agreements (i) | 7,839,000 | 2,180,000 | 4,519,000 | 1,140,000 | - | |||||||||||
| Minority Interest | 1,912,000 | - | - | - | 1,912,000 | |||||||||||
Total | $ | 49,784,000 | $ | 6,301,000 | $ | 9,104,000 | $ | 32,446,000 | $ | 1,933,000 | ||||||
(i) Base salary excluding potential bonuses
Inflationary Impact:
Since the inception of operations, inflation has not significantly affected the Company’s operating results. However, inflation and changing interest rates have had a significant effect on the economy in general and therefore could affect the operating results of the Company in the future.
| ITEM 7A. | QUANTITATIVE AND QUALITATIVE DISCLOSURES ABOUT MARKET RISK: |
Interest Rate Risk:
All of the Company’s bank debt and the associated interest expense are sensitive to changes in the level of interest rates. The Company’s credit facilities bear interest based on fluctuating interest rates. The interest rate under its U.S. credit agreement is tied to the prime or LIBOR rate, the interest rate under its U.K. receivable financing is tied to the bank's base rate, and the interest rate under the Singapore credit agreement is tied to SIBOR; all of these interest rates may fluctuate over time based on economic conditions. A hypothetical 100 basis point (one percentage point) increase in interest rates would have resulted in incremental interest expense of approximately $601,000 for the year ended February 28, 2007 and $400,000 for the year ended February 28, 2006. As a result, the Company is subject to market risk for changes in interest rates and could be subjected to increased or decreased interest payments if market rates fluctuate and the Company is in a borrowing mode. The Company has not entered into any instruments in an effort to manage its interest rate risk.
Foreign Exchange Rate Risk:
The Company has several foreign subsidiaries in Asia, the United Kingdom and Canada. The Company does business in more than one dozen countries and currently generates approximately 25% of its revenues from outside North America. The Company’s ability to sell its products in foreign markets may be affected by changes in economic, political or market conditions in the foreign markets in which the Company does business.
The Company’s total assets in its foreign subsidiaries was $80,200,000 and $76,100,000 at February 28, 2007 and 2006 respectively, translated into US dollars at the closing exchange rates. The Company also acquires certain inventory from foreign suppliers and, as such, faces risk due to adverse movements in foreign currency exchange rates. These risks could have a material impact on the Company’s results in future periods. The potential loss based on end of period balances and prevailing exchange rates resulting from a hypothetical 10% strengthening of the dollar against foreign currencies was not material in the quarter or year ended February 28, 2007. The Company does not currently employ any currency derivative instruments, futures contracts or other currency hedging techniques to mitigate its risks in this regard.
Industry Risk:
The electronic component industry is cyclical which can cause significant fluctuations in sales, gross profit margins and profits, from year to year. For example, during calendar 2001, the industry experienced a severe decline in the demand for electronic components, which caused sales to decrease by 56%. The prior year reflected a 74% increase in net sales. It is difficult to predict the timing of the changing cycles in the electronic component industry.
20
NU HORIZONS ELECTRONICS CORP. AND SUBSIDIARIES
CONSOLIDATED STATEMENTS OF OPERATIONS
| For The Years Ended | ||||||||||
| February 28, 2007 | February 28, 2006 | February 28, 2005 | ||||||||
NET SALES | $ | 737,463,000 | $ | 561,291,000 | $ | 467,849,000 | ||||
COSTS AND EXPENSES: | ||||||||||
| Cost of sales | 624,518,000 | 472,542,000 | 390,268,000 | |||||||
| Operating expenses | 93,511,000 | 78,091,000 | 70,138,000 | |||||||
| 718,029,000 | 550,633,000 | 460,406,000 | ||||||||
INCOME FROM OPERATIONS | 19,434,000 | 10,658,000 | 7,443,000 | |||||||
OTHER (INCOME) EXPENSE: | ||||||||||
| Interest expense | 3,850,000 | 3,298,000 | 1,920,000 | |||||||
| Interest income | (580,000 | ) | (371,000 | ) | (57,000 | ) | ||||
| 3,270,000 | 2,927,000 | 1,863,000 | ||||||||
INCOME BEFORE PROVISION FOR INCOME TAXES AND MINORITY INTERESTS | 16,164,000 | 7,731,000 | 5,580,000 | |||||||
| Provision for income taxes | 5,826,000 | 2,560,000 | 2,023,000 | |||||||
INCOME BEFORE MINORITY INTERESTS | 10,338,000 | 5,171,000 | 3,557,000 | |||||||
| Minority interest in earnings of subsidiaries | 425,000 | 287,000 | 484,000 | |||||||
NET INCOME | $ | 9,913,000 | $ | 4,884,000 | $ | 3,073,000 | ||||
NET INCOME PER COMMON SHARE | ||||||||||
| Basic | $ | .55 | $ | .29 | $ | .18 | ||||
| Diluted | $ | .53 | $ | .28 | $ | .17 | ||||
WEIGHTED AVERAGE COMMON SHARES OUTSTANDING | ||||||||||
| Basic | 17,871,671 | 17,111,102 | 16,877,147 | |||||||
| Diluted | 18,641,475 | 17,704,373 | 17,768,649 | |||||||
See accompanying notes
F-1
NU HORIZONS ELECTRONICS CORP. AND SUBSIDIARIES
CONSOLIDATED BALANCE SHEETS
| February 28, 2007 | February 28, 2006 | ||||||
-ASSETS- | |||||||
CURRENT ASSETS: | |||||||
| Cash | $ | 4,747,000 | $ | 10,873,000 | |||
| Accounts receivable - less allowances of $4,985,000 and $4,702,000, respectively | 119,946,000 | 98,418,000 | |||||
| Inventories | 119,311,000 | 125,178,000 | |||||
| Prepaid expenses and other current assets | 4,454,000 | 1,746,000 | |||||
TOTAL CURRENT ASSETS | 248,458,000 | 236,215,000 | |||||
PROPERTY, PLANT AND EQUIPMENT - NET | 3,381,000 | 3,614,000 | |||||
OTHER ASSETS: | |||||||
| Cost in excess of net assets acquired | 8,332,000 | - | |||||
| Subordinated note receivable | - | 2,000,000 | |||||
| Other assets | 4,055,000 | 1,645,000 | |||||
TOTAL ASSETS | $ | 264,226,000 | $ | 243,474,000 | |||
-LIABILITIES AND SHAREHOLDERS' EQUITY- | |||||||
CURRENT LIABILITIES: | |||||||
| Accounts payable | $ | 62,410,000 | $ | 48,352,000 | |||
| Accrued expenses | 8,579,000 | 4,515,000 | |||||
| Bank credit line - accounts receivable financing | 2,327,000 | - | |||||
| Income taxes payable | 3,927,000 | 1,525,000 | |||||
TOTAL CURRENT LIABILITIES | 77,243,000 | 54,392,000 | |||||
LONG-TERM LIABILITIES: | |||||||
| Revolving credit line | 30,000,000 | 50,600,000 | |||||
| Due to seller | 3,378,000 | - | |||||
| Deferred income taxes | 2,369,000 | 1,339,000 | |||||
TOTAL LONG-TERM LIABILITIES | 35,747,000 | 51,939,000 | |||||
MINORITY INTERESTS IN SUBSIDIARIES | 1,912,000 | 1,487,000 | |||||
COMMITMENTS AND CONTINGENCIES | |||||||
SHAREHOLDERS’ EQUITY: | |||||||
| Preferred stock, $1 par value, 1,000,000 shares authorized; none issued or outstanding | - | - | |||||
Common stock, $.0066 par value, 50,000,000 shares authorized; 18,158,034 and 17,431,482 shares issued and outstanding for 2007 and 2006, respectively | 120,000 | 115,000 | |||||
| Additional paid-in capital | 50,670,000 | 46,924,000 | |||||
| Retained earnings | 98,521,000 | 88,608,000 | |||||
| Other accumulated comprehensive income (foreign currency translation) | 13,000 | 9,000 | |||||
TOTAL SHAREHOLDERS’ EQUITY | 149,324,000 | 135,656,000 | |||||
TOTAL LIABILITIES AND SHAREHOLDERS' EQUITY | $ | 264,226,000 | $ | 243,474,000 | |||
See accompanying notes
F-2
NU HORIZONS ELECTRONICS CORP. AND SUBSIDIARIES
CONSOLIDATED STATEMENTS OF CHANGES IN SHAREHOLDERS’ EQUITY
| Shares | Common Stock | Additional Paid-in Capital | Retained Earnings | Accumulated Other Comprehensive Income (Loss) | Total Shareholders’ Equity | ||||||||||||||
| Balance at February 28, 2004 | 16,859,766 | $ | 111,000 | $ | 43,935,000 | $ | 80,651,000 | $ | (295,000 | ) | $ | 124,402,000 | |||||||
| Exercise of stock options | 31,881 | - | 155,000 | - | - | 155,000 | |||||||||||||
| Foreign currency translation | - | - | - | - | 302,000 | 302,000 | |||||||||||||
| Net income | - | - | - | 3,073,000 | - | 3,073,000 | |||||||||||||
| Balance at February 28, 2005 | 16,891,647 | 111,000 | 44,090,000 | 83,724,000 | 7,000 | 127,932,000 | |||||||||||||
| Exercise of stock options | 539,835 | 4,000 | 2,632,000 | - | - | 2,636,000 | |||||||||||||
| Income tax benefit from stock options exercised | - | - | 202,000 | - | - | 202,000 | |||||||||||||
| Foreign currency translation | - | - | - | - | 2,000 | 2,000 | |||||||||||||
| Net income | - | - | - | 4,884,000 | - | 4,884,000 | |||||||||||||
| Balance at February 28, 2006 | 17,431,482 | 115,000 | 46,924,000 | 88,608,000 | 9,000 | 135,656,000 | |||||||||||||
| Exercise of stock options | 463,552 | 3,000 | 2,723,000 | - | - | 2,726,000 | |||||||||||||
| Income tax benefit from stock options exercised | - | - | 276,000 | - | - | 276,000 | |||||||||||||
| Stock option expense | - | - | 443,000 | - | - | 443,000 | |||||||||||||
| Issuance of restricted stock | 263,000 | 2,000 | 304,000 | - | - | 306,000 | |||||||||||||
| Foreign currency translation | - | - | - | - | 4,000 | 4,000 | |||||||||||||
| Net income | - | - | - | 9,913,000 | - | 9,913,000 | |||||||||||||
| Balance at February 28, 2007 | 18,158,034 | $ | 120,000 | $ | 50,670,000 | $ | 98,521,000 | $ | 13,000 | $ | 149,324,000 | ||||||||
See accompanying notes
F-3
NU HORIZONS ELECTRONICS CORP. AND SUBSIDIARIES
CONSOLIDATED STATEMENTS OF CASH FLOWS
Page 1 of 2
| For The Years Ended | ||||||||||
| February 28, 2007 | February 28, 2006 | February 28, 2005 | ||||||||
INCREASE (DECREASE) IN CASH AND CASH EQUIVALENTS: | ||||||||||
Cash flows from operating activities: | ||||||||||
| Cash received from customers | $ | 722,922,000 | $ | 542,550,000 | $ | 456,115,000 | ||||
| Cash paid to suppliers and employees | (700,393,000 | ) | (564,692,000 | ) | (476,629,000 | ) | ||||
| Interest paid | (4,129,000 | ) | (3,299,000 | ) | (1,920,000 | ) | ||||
| Interest received | 580,000 | 371,000 | 57,000 | |||||||
| Income taxes paid | (1,564,000 | ) | (464,000 | ) | (192,000 | ) | ||||
Net cash provided by (used in) operating activities | 17,416,000 | (25,534,000 | ) | (22,569,000 | ) | |||||
Cash flows from investing activities: | ||||||||||
| Capital expenditures | (1,069,000 | ) | (1,055,000 | ) | (834,000 | ) | ||||
| Acquisition of DT Electronics | (6,098,000 | ) | - | - | ||||||
Net cash (used in) investing activities | (7,167,000 | ) | (1,055,000 | ) | (834,000 | ) | ||||
Cash flows from financing activities: | ||||||||||
| Borrowings under revolving credit line | 214,933,000 | 218,645,000 | 142,000,000 | |||||||
| (Repayments) under revolving credit line | (236,305,000 | ) | (190,845,000 | ) | (124,500,000 | ) | ||||
| Proceeds from exercise of stock options | 2,726,000 | 2,636,000 | 155,000 | |||||||
| Realized tax benefit of compensation expense | 276,000 | - | - | |||||||
| Proceeds from settlement of subordinated note | 2,000,000 | - | - | |||||||
Net cash (used in) provided by financing activities | (16,370,000 | ) | 30,436,000 | 17,655,000 | ||||||
Effect of exchange rate changes | (5,000 | ) | 2,000 | 302,000 | ||||||
Net (decrease) increase in cash and cash equivalents | (6,126,000 | ) | 3,849,000 | (5,446,000 | ) | |||||
| Cash and cash equivalents, beginning of year | 10,873,000 | 7,024,000 | 12,470,000 | |||||||
Cash and cash equivalents, end of year | $ | 4,747,000 | $ | 10,873,000 | $ | 7,024,000 | ||||
See accompanying notes
F-4
NU HORIZONS ELECTRONICS CORP. AND SUBSIDIARIES
CONSOLIDATED STATEMENTS OF CASH FLOWS (CONTINUED)
Page 2 of 2
| For The Years Ended | ||||||||||
| February 28, 2007 | February 28, 2006 | February 28, 2005 | ||||||||
RECONCILIATION OF NET INCOME TO NET CASH FROM OPERATING ACTIVITIES | ||||||||||
NET INCOME | $ | 9,913,000 | $ | 4,884,000 | $ | 3,073,000 | ||||
| Adjustments: | ||||||||||
| Depreciation and amortization | 1,392,000 | 1,369,000 | 1,308,000 | |||||||
| Bad debt reserve | 447,000 | - | 285,000 | |||||||
| Deferred income tax | 1,030,000 | 372,000 | 1,888,000 | |||||||
| Minority interest | 425,000 | 287,000 | (266,000 | ) | ||||||
| Stock based compensation | 749,000 | - | - | |||||||
| Changes in assets and liabilities - net of effect of acquisition: | ||||||||||
| Accounts receivable | (14,541,000 | ) | (18,738,000 | ) | (11,735,000 | ) | ||||
| Inventories | 9,009,000 | (43,482,000 | ) | (12,967,000 | ) | |||||
| Prepaid expenses and other current assets | (2,697,000 | ) | 37,000 | (989,000 | ) | |||||
| Other assets | (2,410,000 | ) | 43,000 | (135,000 | ) | |||||
| Accounts payable and accrued expenses | 12,022,000 | 28,169,000 | (3,031,000 | ) | ||||||
| Income taxes | 2,077,000 | 1,525,000 | - | |||||||
Net cash provided by (used in) operating activities | $ | 17,416,000 | $ | (25,534,000 | ) | $ | (22,569,000 | ) | ||
Supplemental Disclosures of Cash Flow Information: | ||||||||||
| Non-cash transactions: | ||||||||||
| Issuance of restricted stock | $ | 306,000 | $ | - | $ | - | ||||
See accompanying notes
F-5
NU HORIZONS ELECTRONICS CORP. AND SUBSIDIARIES
NOTES TO CONSOLIDATED FINANCIAL STATEMENTS
| 1. | ORGANIZATION: |
Nu Horizons Electronics Corp. and its subsidiaries (collectively, the "Company"), (both wholly and majority owned) are wholesale and export distributors of semiconductor and passive electronic components throughout the United States, Asia and Europe.
| 2. | SUMMARY OF SIGNIFICANT ACCOUNTING POLICIES: |
| a. | Principles of Consolidation: |
The consolidated financial statements include the accounts of Nu Horizons Electronics Corp. and its wholly-owned subsidiaries, NIC Components Corp. (“NIC”), Nu Horizons International Corp. (“International”), NUHC Inc. (“NUC”), Nu Horizons Asia PTE LTD (“NUA”), Nu Horizons Electronics Pty Ltd (“NUZ”), Nu Horizons Electronics Asia Pte Ltd, Korea Branch (“NUK”), Nu Horizons Electronics Hong Kong Ltd (“NUHK”), Nu Horizons Electronics (Shanghai) Co Ltd. (“NUS”), Nu Horizons Europe Limited (“NUE”), DT Electronics Limited (“DT”), Titan Supply Chain Services Corp. (“Titan”), Titan Supply Chain Services PTE LTD (“TSC”), Titan Supply Chain Services Limited (“TSE”), Razor Electronics (“RAZ”), Nu Exchange (“NUX”) and its majority owned subsidiaries, NIC Components Europe Limited (“NIE”), and NIC Components Asia PTE LTD (“NIA”). All material intercompany balances and transactions have been eliminated.
| b. | Use of Estimates: |
In preparing financial statements in accordance with accounting principles generally accepted in the United States of America, management makes certain estimates and assumptions, where applicable, that affect the reported amounts of assets, liabilities and disclosures of contingent assets and liabilities at the date of the financial statements, as well as reported amounts of revenues and expenses during the reporting period. While actual results could differ from those estimates, management does not expect such variances, if any, to have a material effect on the financial statements.
| c. | Concentration of Credit Risk/Fair Value: |
Financial instruments that potentially subject the Company to concentrations of credit risk consist principally of cash and accounts receivable.
The Company maintains, at times, deposits in federally insured financial institutions in excess of federally insured limits. Management attempts to monitor the soundness of the financial institutions and believes the Company’s risk is negligible. Concentrations with regard to accounts receivable are limited due to the Company’s large customer base.
The carrying amounts of cash, accounts receivable, accounts payable and accrued expenses approximate fair value due to the short-term nature of these items. The carrying amount of long-term debt also approximates fair value since the interest rates on these instruments approximate market interest rates.
| d. | Cash and Cash Equivalents: |
For purposes of the statements of cash flows, the Company considers all highly liquid investments purchased with a remaining maturity of three months or less to be cash equivalents.
| e. | Allowance for Doubtful Accounts: |
The Company maintains allowances for doubtful accounts for estimated losses resulting from the inability of its customers to make required payments. The allowances for doubtful accounts are determined using a combination of factors, including the length of time the receivables are outstanding, the current business environment, and historical experience.
F-6
NU HORIZONS ELECTRONICS CORP. AND SUBSIDIARIES
NOTES TO CONSOLIDATED FINANCIAL STATEMENTS
(CONTINUED)
| 2. | SUMMARY OF SIGNIFICANT ACCOUNTING POLICIES (Continued): |
| f. | Inventories: |
Inventories, which consist primarily of goods held for resale, are stated at the lower of cost (first-in, first-out method) or market. In excess of 90% of our total inventories are covered by product line distributor agreements whereby the Company has the right to return slow-moving and obsolete inventory to our suppliers. Obsolescence charges for inventory not covered by such agreements have not been material to date.
| g. | Depreciation: |
Depreciation is provided using the straight-line method as follows:
| Office equipment | 5 years | |||
| Furniture and fixtures | 5 - 12 years | |||
| Computer equipment | 5 years |
Leasehold improvements are amortized over the term of the lease. Maintenance and repairs are charged to operations and major improvements are capitalized. Upon retirement, sale or other disposition, the associated cost and accumulated depreciation are eliminated from the accounts and any resulting gain or loss is included in operations.
| h. | Income Taxes: |
The Company has elected to file a consolidated federal income tax return with its domestic subsidiaries. The Company utilizes SFAS 109 “Accounting for Income Taxes”, which requires use of the asset and liability approach of providing for income taxes. Deferred income taxes are provided for on the timing differences for certain items which are treated differently for tax and financial reporting purposes. These items include depreciation of fixed assets, inventory capitalization valuations and the recognition of bad debt expense.
International has elected under Section 995 of the Internal Revenue Code to be taxed as an “Interest Charge Disc”. Based upon these rules, income taxes are paid when International distributes its income to the parent company. Until distributions are made, the parent company pays interest only on the deferred tax liabilities. International’s untaxed income at February 28, 2007 approximates $2,224,000.
| i. | Revenue Recognition/Shipping and Handling Costs: |
The Company recognizes revenue in accordance with the Securities and Exchange Commission Staff Accounting Bulletin No. 104, "Revenue Recognition" ("SAB 104"). Under SAB 104, revenue is recognized when there is persuasive evidence of an arrangement, delivery has occurred or services have been rendered, the sales price is determinable, and collectibility is reasonably assured. Revenue typically is recognized at time of shipment. Sales are recorded net of discounts, rebates, and returns in accordance with EITF 01-09.
Amounts related to shipping and handling that are billed to customers as part of sales transactions are reflected as a reduction of operating expenses and aggregated $1,709,000, $1,235,000 and $1,285,000 for the fiscal years ended 2007, 2006 and 2005, respectively. Shipping and handling costs incurred by the Company are included in costs of sales and aggregated $932,000, $926,000 and $1,314,000 for the fiscal years ended 2007, 2006 and 2005, respectively.
| j. | Advertising and Promotion Costs: |
Advertising and promotion costs, which are included in general and administrative expenses, are expensed as incurred. For the fiscal years ended 2007, 2006 and 2005, such costs aggregated $385,000, $203,000 and $189,000, respectively.
F-7
NU HORIZONS ELECTRONICS CORP. AND SUBSIDIARIES
NOTES TO CONSOLIDATED FINANCIAL STATEMENTS
(CONTINUED)
| 2. | SUMMARY OF SIGNIFICANT ACCOUNTING POLICIES (Continued): |
| k. | Earnings Per Common Share: |
The Company utilizes Statement of Financial Accounting Standards No. 128, "Earnings Per Share". Basic earnings per share is calculated on the weighted effect of all common shares issued and outstanding, and is calculated by dividing net income available to common stockholders by the weighted average shares outstanding during the period. Diluted earnings per share, which is calculated by dividing net income available to common stockholders by the weighted average number of common shares used in the basic earnings per share calculation, plus the number of common shares that would be issued assuming conversion of all potentially dilutive securities outstanding. Such securities, shown below, presented on a common share equivalent basis and outstanding as of February 28, 2007, 2006 and 2005 have been included in the per share computations:
| Years Ended February 28 | ||||||||||
| 2007 | 2006 | 2005 | ||||||||
| Weighted average number of shares outstanding | 17,871,671 | 17,111,102 | 16,877,147 | |||||||
| Assumed conversion of stock options | 769,804 | 593,271 | 891,502 | |||||||
| 18,641,475 | 17,704,373 | 17,768,649 | ||||||||
| l. | Stock-Based Compensation: |
Effective March 1, 2006, the Company adopted the provisions of FASB Statement No. 123 (revised 2004), "Share-Based Payment" and the Securities and Exchange Commission Staff Accounting Bulletin No. 107 (collectively "Statement No. 123R"), which requires share-based payment ("SBP") awards exchanged for employee services to be measured at fair value and expensed in the consolidated statements of operations over the requisite employee service period.
Prior to March 1, 2006, the Company accounted for SBP awards under Accounting Principles Board Opinion No. 25, "Accounting for Stock Issued to Employees", which utilized the intrinsic value method and did not require any expense to be recorded in the consolidated financial statements if the exercise price of the award was not less than the market price of the underlying stock on the date of grant. The Company elected to adopt, for periods prior to March 1, 2006, the disclosure requirements of FASB Statement No. 123, "Accounting for Stock-Based Compensation", as amended by FASB Statement No. 148, "Accounting for Stock-Based Compensation - Transition and Disclosure" (collectively, "Statement No. 123") which used a fair value based method of accounting for SBP awards.
Statement No. 123(R) requires companies to record compensation expense for stock options measured at fair value, on the date of grant, using an option-pricing model. The fair value of the Company's stock options is determined using the Black-Scholes valuation model, which is consistent with the Company's valuation techniques previously utilized under Statement No. 123.
The Company adopted the modified prospective transition method provided for under Statement No. 123(R) and, accordingly, did not restate prior period amounts. Under this transition method, compensation expense for the year ended February 28, 2007 includes compensation expense for all SBP awards granted prior to, but not yet vested as of, March 1, 2006 based on the grant date fair value estimated in accordance with the original provisions of Statement No. 123. Stock-based compensation expense for all SBP awards granted after March 1, 2006 is based on the grant date fair value estimated in accordance with the provisions of Statement No. 123(R). Stock-based compensation expense includes an estimate for forfeitures and is recognized over the expected term of the award on a straight-line basis upon adoption of Statement No. 123(R). Upon adoption of Statement No. 123(R), the Company evaluated the need to record a cumulative effect adjustment relating to estimated forfeitures for unvested previously issued awards and concluded the impact was not material.
F-8
NU HORIZONS ELECTRONICS CORP. AND SUBSIDIARIES
NOTES TO CONSOLIDATED FINANCIAL STATEMENTS
(CONTINUED)
| 2. | SUMMARY OF SIGNIFICANT ACCOUNTING POLICIES (Continued): |
| l. | Stock-Based Compensation (Continued): |
As a result of adopting Statement No. 123(R), the Company recorded, as a component of selling, general and administrative expenses, a charge of $749,000 ($473,000 net of related taxes or $.03 per share on a basic and diluted basis) for the year ended February 28, 2007, relating to the expensing of stock options and restricted stock.
Statement No. 123(R) requires that the realized tax benefit related to the excess of the deductible amount over the compensation expense recognized be reported as a financing cash flow rather than as an operating cash flow, as required under previous accounting guidance. As a result, the related excess tax benefits for the year ended February 28, 2007 of $276,000 is classified as a reduction in cash flows from operating activities and as a cash inflow from financing activities.
If compensation cost for the Company’s stock-based compensation plans had been determined in a manner consistent with the fair value approach described in SFAS No. 123R, the Company’s net income and net income per share as reported would have been reduced to the pro forma amounts indicated below.
| 2006 | 2005 | ||||||
| Net income: | |||||||
As reported | $ | 4,884,000 | $ | 3,073,000 | |||
Stock-based compensation cost - net of tax | 188,000 | 520,000 | |||||
Pro forma | $ | 4,696,000 | $ | 2,553,000 | |||
| Basic earnings per share: | |||||||
As reported | $ | .29 | $ | .18 | |||
Pro forma | $ | .27 | $ | .15 | |||
| Diluted earnings per share: | |||||||
As reported | $ | .28 | $ | .17 | |||
Pro forma | $ | .27 | $ | .14 | |||
Options vest over several years and new options are generally granted each year. Because of these factors, the pro forma effect shown above may not be representative of the effect of SFAS No. 123R in future years.
In November 2005, the FASB issued FASB Staff Position FAS123R-3, Transition Election Related to Accounting for the Tax Effects of Share-Based Payment Awards ("FSP"). We have elected to follow the alternative transition method as described in the FSP for computing our additional paid-in capital pool. In addition, we treat the tax deductions from stock options as being realized when they reduce taxes payable in accordance with the principles and timing under the relevant tax law. Under this transition method, compensation cost is recognized on or after the required effective date for the portion of outstanding awards for which the requisite service has not yet been rendered, based on the grant-date fair value of those awards previously calculated under SFAS No. 123 for pro forma disclosure purposes. The financial statements for periods prior to the date of adoption have not been restated in accordance with the modified prospective application.
F-9
NU HORIZONS ELECTRONICS CORP. AND SUBSIDIARIES
NOTES TO CONSOLIDATED FINANCIAL STATEMENTS
(CONTINUED)
| 2. | SUMMARY OF SIGNIFICANT ACCOUNTING POLICIES (Continued): |
| l. | Stock-Based Compensation (Continued): |
The fair value of each option was estimated on the date of grant using the Black-Scholes method with the following weighted average assumptions.
| 2007 | 2006 | 2005 | ||||||||
Option Plans: | ||||||||||
| Dividends | - | - | - | |||||||
| Expected term | 2 - 7 years | 2 - 7 years | 2 -7 years | |||||||
| Risk free interest rate | 4.0 | % | 4.0 | % | 2.7 | % | ||||
| Volatility rate | 55.6 | % | 52.3 | % | 37.5 | % | ||||
The following table shows the weighted average fair value of options using the fair value approach under SFAS 123:
| 2007 | 2006 | 2005 | ||||||||
| Weighted average fair value of options granted during the period | $ | 7.11 | $ | 3.89 | $ | 3.72 | ||||
| m. | Cost in Excess of Net Assets Acquired ("Goodwill") and Other Indefinite-Lived Intangibles: |
All intangible assets resulted from the acquisition of DT Electronics on August 29, 2006 as discussed in Note 3. The Company will perform an annual impairment test each year on or near the acquisition date for DT Electronics, or earlier if indicators of potential impairment exist, to evaluate such intangibles. Such intangibles are considered impaired if the carrying amount of the reporting unit exceeds its estimated fair value. In assessing the recoverability of such intangibles, the Company will review both quantitative and qualitative factors to support its assumptions with regard to fair value. The fair value of a reporting unit is estimated using a weighted average multiple of earnings before interest and taxes from comparable companies. In determining the fair value, the Company will make certain judgments, including the identification of reporting units and the selection of comparable companies. If these estimates or their related assumptions change in the future as a result of changes in strategy and/or market conditions, the Company may be required to record an impairment charge. Management does not believe that there is any impairment at February 28, 2007.
| n. | Foreign Currency Translation/Other Comprehensive Income: |
Assets and liabilities of the Company’s foreign subsidiaries are translated at the balance sheet exchange rates, while income and expenses are translated at average rates for the period. Translation gains and losses are reported as a component of accumulated other comprehensive income on the statement of shareholders’ equity in accordance with SFAS No. 130, “Reporting Comprehensive Income”.
| o. | Reclassifications: |
Certain prior years’ information has been reclassified to conform to the current year’s reporting presentation.
| p. | Recent Accounting Pronouncements Affecting the Company: |
In June 2006, the FASB issued interpretation No. 48, "Accounting for Uncertainty in Income Taxes - an Interpretation of FASB Statement No. 109" ("FIN 48") which prescribes a recognition threshold and measurement attribute, as well as criteria for subsequently recognizing, derecognizing, and measuring uncertain tax positions for financial statement purposes. FIN 48 also requires expanded disclosure with respect to the uncertainty in income tax assets and liabilities. FIN 48 is effective for fiscal years beginning after December 15, 2006 and is required to be recognized as a change in accounting principle through a cumulative-effect adjustment to retained earnings as of the beginning of the year of adoption. The adoption of the provisions of FIN 48 is not anticipated to have a material impact on the company's consolidated financial position and results of operations.
F-10
NU HORIZONS ELECTRONICS CORP. AND SUBSIDIARIES
NOTES TO CONSOLIDATED FINANCIAL STATEMENTS
(CONTINUED)
| 2. | SUMMARY OF SIGNIFICANT ACCOUNTING POLICIES (Continued): |
| p. | Recent Accounting Pronouncements Affecting the Company (Continued): |
In September 2006, the FASB issued SFAS No. 157, "Fair Value Measurements" (SFAS No. 157). SFAS No. 157 defines fair value, establishes a framework for measuring fair value in generally accepted accounting principles and expands disclosures about fair value measurements. Specifically, this Statement sets forth a definition of fair value, and establishes a hierarchy prioritizing the inputs to valuation techniques, giving the highest priority to quoted prices in active markets for identical assets and liabilities and the lowest priority to unobservable inputs. The provisions of SFAS No. 157 are generally required to be applied on a prospective basis, except to certain financial instruments accounted for under SFAS No. 133, "Accounting for Derivative Instruments and Hedging Activities", for which the provisions of SFAS No. 157 should be applied retrospectively. The Statement is effective for financial statement issued for fiscal years beginning after November 15, 2007 and interim periods within those fiscal years. The Company will adopt SFAS No. 157 in the first quarter of fiscal 2009 and is still evaluating the effect, if any, on its financial position or results or operations.
In September 2006, the FASB issued SFAS No. 158, "Employers' Accounting for Defined Benefit Pension and Other Postretirement Plans, an amendment of FASB Statements No. 87, 88, 106 and 132(R)" (SFAS No. 158). SFAS No. 158 requires an employer to recognize the funded status of its defined benefit pension and postretirement plans as an asset or liability in its statement of financial position and to recognize changes in that funded status in the year in which the changes occur through comprehensive income. In addition, SFAS No. 158 requires an employer to measure the funded status of a plan as of the date of the employer's fiscal year-end statement of financial position, which is consistent with the measurement date for the Company's defined benefit plans. SFAS No. 158 is effective as of the end of the fiscal year ending after December 15, 2006. The Company has adopted this standard for the fiscal year ending February 28, 2007.
In February 2007, the FASB issued SFAS No. 159, "The Fair Value Option for Financial Assets and Financial Liabilities" (SFAS No. 159). SFAS No. 159 permits entities to choose to measure, on an item-by-item basis, specified financial instruments and certain other items at fair value. Unrealized gains and losses on items for which the fair value option has been elected are required to be reported in earnings at each reporting date. SFAS No. 159 is effective for fiscal years beginning after November 15, 2007, the provisions of which are required to be applied prospectively. The Company expects to adopt SFAS No. 159 in the first quarter of fiscal 2009.
In September 2006, the SEC staff issued Accounting Bulletin No. 108, "Considering the Effects of Prior Year Misstatements when Quantifying Misstatements in Current Year Financial Statements" (SAB No. 108). SAB No. 108 was issued in order to eliminate the diversity in practice surrounding how public companies quantify financial statement misstatements. SAB No. 108 requires that registrants quantify errors using both a balance sheet and income statement approach and evaluate whether either approach results in a misstated amount that, when all relevant quantitative factors are considered, is material.
| 3. | ACQUISITION: |
On August 29, 2006, the Company acquired the outstanding shares of DT Electronics, an entity engaged in the electronic components distribution business in the United Kingdom. The operating results of DT are reflected in the accompanying financial statements since the date of acquisition.
The initial purchase price for DT as of the acquisition date was $5,731,000. The transaction also provides for potential additional payments to the sellers in three installments through 2009 from a guaranteed minimum of £850,000 (approximately $1,611,000) to a maximum of £2,549,000 (approximately $5,000,000), which amounts are calculated using current exchange rates. Payments of any amounts above the minimum are contingent upon the attainment of certain earnings milestones by DT during the three year period. The Company has accrued the maximum estimated payment since DT is expected to achieve the earnings milestones established by the agreement. During the fourth quarter of fiscal 2007, an additional $75,000 of transaction costs (related to legal and accounting services) were recorded, thus increasing the value of Goodwill.
F-11
NU HORIZONS ELECTRONICS CORP. AND SUBSIDIARIES
NOTES TO CONSOLIDATED FINANCIAL STATEMENTS
(CONTINUED)
| 3. | ACQUISITION (Continued): |
The acquisition has been accounted for using the purchase method of accounting in accordance with SFAS No. 141, "Business Combinations." The purchase price was first allocated to tangible and any material identifiable intangible assets. The excess purchase price was allocated to goodwill.
The following table summarizes the estimated fair values of assets acquired and liabilities assumed at the date of acquisition:
| Purchase price (including guaranteed future payments of approximately $4,989,000) | $ | 10,720,000 | ||
| Direct acquisition costs | 367,000 | |||
| Total purchase price | $ | 11,087,000 | ||
| Allocation of purchase price: | ||||
| Accounts receivable | $ | 7,434,000 | ||
| Inventory | 3,142,000 | |||
| Other current assets | 11,000 | |||
| Fixed assets | 91,000 | |||
| Accounts payable/accrued expenses | (4,490,000 | ) | ||
| Bank credit line | (3,099,000 | ) | ||
| Taxes payable | (325,000 | ) | ||
| Comprehensive income | (9,000 | ) | ||
| Cost in excess of net assets acquired (Goodwill and other Indefinite-Lived Intangibles) | 8,332,000 | |||
| Total purchase price | $ | 11,087,000 |
The following unaudited pro forma information of the Company is provided to give effect to the DT acquisition assuming it occurred as of March 1, 2004, the beginning of the earliest period presented:
| Years Ended | ||||||||||
| February 28, 2007 | February 28, 2006 | February 28, 2005 | ||||||||
| Net sales | $ | 755,279,000 | $ | 584,315,000 | $ | 486,736,000 | ||||
| Net income | $ | 10,712,000 | $ | 5,590,000 | $ | 3,385,000 | ||||
| Net income per share: | ||||||||||
| Basic | $ | .60 | $ | .33 | $ | .20 | ||||
| Diluted | $ | .57 | $ | .32 | $ | .19 | ||||
The pro forma amounts above reflect interest on the purchase price assuming the acquisition occurred as of March 1, 2004, with interest calculated at the Company's borrowing rate under its credit facility for the respective period. The pro forma net earnings above assumes an income tax provision at the Company's consolidated tax rate for the respective year. The information presented above is for illustrative purposes only and is not indicative of results that may have been achieved if the acquisition had occurred as of the beginning of the Company's 2005 fiscal year or of future operating performance.
F-12
NU HORIZONS ELECTRONICS CORP. AND SUBSIDIARIES
NOTES TO CONSOLIDATED FINANCIAL STATEMENTS
(CONTINUED)
| 4. | PROPERTY, PLANT AND EQUIPMENT: |
Property, plant and equipment, which is recorded at cost, consists of the following:
| February 28 | |||||||
| 2007 | 2006 | ||||||
| Furniture, fixtures and equipment | $ | 8,895,000 | $ | 8,652,000 | |||
| Computer equipment | 8,204,000 | 7,321,000 | |||||
| Leasehold improvements | 1,255,000 | 1,255,000 | |||||
| 18,354,000 | 17,228,000 | ||||||
| Less: accumulated depreciation and amortization | 14,973,000 | 13,614,000 | |||||
| $ | 3,381,000 | $ | 3,614,000 | ||||
Depreciation expense for the 2007, 2006 and 2005 years aggregated $1,392,000, $1,369,000 and $1,308,000, respectively.
| 5. | SUBORDINATED NOTE RECEIVABLE: |
On August 23, 2001, the Company completed the sale of the assets of its contract-manufacturing subsidiary, Nu Visions Manufacturing, Inc. (“Nu Visions”). The selling price of $31,563,000 consisted of $2,000,000 in a subordinated note and $29,563,000 in cash. Pursuant to the sale of this subsidiary, the Company received a $2,000,000 Junior Subordinated Note, dated August 23, 2001 issued by the buyer as part of the purchase price. The note had a maturity date of May 14, 2007 and was subordinate in right of payment to all existing and future indebtedness of the issuer with interest on the principal amount from the issue date to and including the maturity date, at a rate of 8% per annum. On August 29, 2006, this note was fully paid, including accrued interest of $350,000.
| 6. | ACCRUED EXPENSES: |
Accrued expenses consist of the following:
| February 28 | |||||||
| 2007 | 2006 | ||||||
| Commissions | $ | 1,662,000 | $ | - | |||
| Due to seller - current (see Note 3) | 1,611,000 | 1,629,000 | |||||
| Executive bonuses | 1,246,000 | 538,000 | |||||
| Retirement plan (see Note 12) | 1,200,000 | 600,000 | |||||
| Payroll and related benefits | 864,000 | 274,000 | |||||
| Other miscellaneous expenses | 1,996,000 | 1,474,000 | |||||
| Total | $ | 8,579,000 | $ | 4,515,000 | |||
| 7. | DEBT: |
On January 31, 2007, the Company entered into an amended and restated secured revolving line of credit agreement with eight banks, which currently provides for maximum borrowings of $150,000,000 (the "Revolving Credit Line"). The Credit Agreement provides for borrowings utilizing an asset based formula predicated on a certain percentage of outstanding domestic accounts receivable and inventory levels at any given month end. Borrowings under the Credit Agreement bear interest at either (i) the lead bank’s prime rate or (ii) LIBOR plus 150 basis points, at the option of the Company, through September 30, 2011, the due date of the loan. Direct borrowings under the Credit Agreement were $30,000,000 at February 28, 2007 and $50,600,000 at February 28, 2006. LIBOR rates ranged from 6.49% to 6.90% at February 28, 2007. There were no notes outstanding bearing interest at the prime rate at February 28, 2007. As of the end of each of the fiscal periods, the Company was in compliance with all of the required bank covenants under the Credit Agreement.
F-13
NU HORIZONS ELECTRONICS CORP. AND SUBSIDIARIES
NOTES TO CONSOLIDATED FINANCIAL STATEMENTS
(CONTINUED)
| 7. | DEBT (Continued): |
The Company also has a receivables financing agreement with a bank in England (the "Bank Credit Line"), which provides for maximum borrowings of £2.5 million (approximately $4.6 million) with interest at the bank's base rate plus 1.75% (7% at February 28, 2007). Borrowings under the Bank Credit Line were £1,181,000 ($2,327,000) at February 28, 2007.
On November 20, 2006, the Company entered a revolving credit agreement with a Singapore bank to provide a $30,000,000 secured line of credit to the Company’s Asian subsidiaries and thereby finance the Company’s Asian operations. Borrowings under the agreement utilize an asset based formula based on a certain percentage of outstanding accounts receivables and inventory levels at any given month end. Borrowings under the Singapore credit line bear interest at SIBOR plus 1.5%. As part of this agreement, the Company must maintain a compensating balance of $2,250,000, which amount is included in other assets. At February 28, 2007, there were no borrowings under this credit line.
| 8. | STOCK-BASED COMPENSATION PLANS: |
| a. | Stock Options: |
Stock options granted to date under each of the Company’s 1998 and 2000 Stock Option Plans and 2000 and 2002 Key Employee Stock Option Plans generally expire ten years after the date of grant and become exercisable in two equal annual installments commencing one year from date of grant. Stock options granted under the Company’s Outside Director Stock Option Plan and 2000 and 2002 Outside Directors’ Stock Option Plans expire ten years after the date of grant and become exercisable in three equal annual installments on the date of grant and the succeeding two anniversaries thereof.
A summary of options granted and related information for the three years ended February 28, 2007 is as follows:
| Options | Weighted Average Exercise Price | ||||||
| Outstanding February 29, 2004 | 3,341,262 | ||||||
Granted | 121,000 | $ | 7.83 | ||||
Exercised | (31,981 | ) | 4.85 | ||||
Cancelled | (56,788 | ) | 9.39 | ||||
| Outstanding February 28, 2005 | 3,373,493 | 6.69 | |||||
Granted | 135,500 | $ | 8.55 | ||||
Exercised | (539,835 | ) | 4.88 | ||||
Cancelled | (405,750 | ) | 10.57 | ||||
| Outstanding February 28, 2006 | 2,563,408 | 6.56 | |||||
Granted | 60,000 | $ | 12.46 | ||||
Exercised | (463,552 | ) | 5.86 | ||||
Cancelled | (33,038 | ) | 7.92 | ||||
| Outstanding February 28, 2007 | 2,126,818 | 6.85 | |||||
| Aggregate intrinsic value of outstanding options at February 28, 2007 | $ | 7,007,000 | |||||
| Options exercisable at the end of each fiscal year: | |||||||
February 29, 2005 | 3,230,243 | $ | 6.65 | ||||
February 28, 2006 | 2,414,908 | 6.35 | |||||
February 28, 2007 | 2,045,693 | 6.70 | |||||
| Aggregate intrinsic value of options exercisable at February 28, 2007 | $ | 6,963,000 |
F-14
NU HORIZONS ELECTRONICS CORP. AND SUBSIDIARIES
NOTES TO CONSOLIDATED FINANCIAL STATEMENTS
(CONTINUED)
| 8. | STOCK-BASED COMPENSATION PLANS (Continued): |
| a. | Stock Options (continued): |
The following table summarizes information about stock options outstanding as of February 28, 2007:
| Outstanding | Exercisable | |||||||||||||||
| Range of exercise prices | Number of shares | Weighted average remaining contractual life | Weighted average exercise price | Number exercisable | Weighted average exercise price | |||||||||||
| $2.93 to $6.44 | 1,315,818 | 3.75 years | $ | 4.93 | 1,308,818 | $ | 4.92 | |||||||||
| $7.31 to $14.62 | 799,000 | 5.79 years | $ | 9.86 | 724,875 | $ | 9.73 | |||||||||
| $18.33 | 12,000 | 3.53 years | $ | 18.33 | 12,000 | $ | 18.33 | |||||||||
| 2,126,818 | 2,045,693 | |||||||||||||||
The aggregate intrinsic value above of $6,963,000 represents the total pre-tax intrinsic value (the difference between the Company’s closing stock price on the last trading day of fiscal 2007 and the exercise price, multiplied by the number of in-the-money options) that would have been received by the option holders had all option holders exercised their options on February 28, 2007. This amount changes based on the fair market value of the Company’s common stock. The total intrinsic value of options exercised for fiscal 2007 was $1,861,000.
Cash received from option exercises during the 2007, 2006 and 2005 fiscal years was $2,726,000, $2,636,000 and $155,000, respectively and is included within the financing activities section in the accompanying consolidated statements of cash flows.
| b. | Restricted Common Stock: |
Subject to the terms and conditions of the 2002 Key Employee Stock Incentive Plan, as amended, the compensation committee may grant shares of restricted common stock. Shares of restricted stock awarded may not be sold, transferred, pledged, assigned, or otherwise alienated or hypothecated until the end of the applicable period of restriction established by the compensation committee and specified in the award agreement. Compensation expense is recognized on a straight-line basis as shares become free of forfeiture restrictions (i.e., vest), which is a five or seven year period from the date of grant. For fiscal 2007, the Company recorded compensation expense aggregating $306,000 relating to the issuance of restricted stock.
Summary of Non-Vested Shares:
The following information summarizes the changes in non-vested restricted stock for the year ended February 28, 2007:
Shares | Weighted Average Grant Date Fair Value | ||||||
| Non-vested shares at March 1, 2006 | - | $ | - | ||||
| Granted | 263,000 | 9.98 | |||||
| Vested | - | - | |||||
| Non-vested shares at February 28, 2007 | 263,000 | $ | 9.98 | ||||
| 9. | MINORITY INTERESTS IN SUBSIDIARIES: |
Minority interests at February 28, 2007 and 2006 represents the liability related to a 15% minority interest in NIC Components Asia PTE. LTD, (NIA) and a 20% minority interest in NIC Components Europe Limited (NIE).
F-15
NU HORIZONS ELECTRONICS CORP. AND SUBSIDIARIES
NOTES TO CONSOLIDATED FINANCIAL STATEMENTS
(CONTINUED)
| 10. | INCOME TAXES: |
Components of income (loss) before income taxes is as follows:
| 2007 | 2006 | 2005 | ||||||||
| Domestic | $ | 8,811,000 | $ | 584,000 | $ | (2,793,000 | ) | |||
| Foreign | 7,353,000 | 7,147,000 | 8,373,000 | |||||||
| $ | 16,164,000 | $ | 7,731,000 | $ | 5,580,000 | |||||
The tax benefits associated with the disqualifying disposition of stock acquired with incentive stock options reduced taxes currently payable as shown below by $276,000 for 2007. Such benefits are credited to additional paid-in capital. The provision for income taxes is comprised of the following:
| 2007 | 2006 | 2005 | ||||||||
Current: | ||||||||||
Federal | $ | 2,747,000 | $ | 728,000 | $ | 242,000 | ||||
State and local | 617,000 | 172,000 | 50,000 | |||||||
Foreign | 1,432,000 | 1,490,000 | 843,000 | |||||||
Deferred: | ||||||||||
Federal | 820,000 | 138,000 | 740,000 | |||||||
State | 210,000 | 32,000 | 148,000 | |||||||
| $ | 5,826,000 | $ | 2,560,000 | $ | 2,023,000 | |||||
The following is a reconciliation of the maximum statutory federal tax rate to the Company’s effective tax rate:
| 2007 | 2006 | 2005 | ||||||||
| Statutory rate | 34.0 | % | 34.0 | % | 34.0 | % | ||||
| State and local taxes | 6.4 | % | 6.3 | % | 6.7 | % | ||||
| Foreign - Asia subsidiaries | 6.2 | % | 19.3 | % | 15.1 | % | ||||
| Foreign - Canada and U. K. | 5.8 | % | (2.4 | )% | 3.5 | % | ||||
| Extraterritorial income exclusion | (0.0 | )% | (16.6 | )% | (38.2 | )% | ||||
| Disqualifying dispositions | (16.4 | )% | (7.5 | )% | 0.0 | % | ||||
Repatriation of qualifying foreign dividends | 0.0 | % | 0.0 | % | 17.2 | % | ||||
| Other | 0.0 | % | 0.0 | % | (2.1 | )% | ||||
| Effective tax rate | 36.0 | % | 33.1 | % | 36.2 | % | ||||
The components of the net deferred income tax liability, pursuant to SFAS 109, are as follows:
| 2007 | 2006 | ||||||
Deferred tax assets: | |||||||
Accounts receivable | $ | 1,501,000 | $ | 1,576,000 | |||
Inventory | 1,152,000 | 713,000 | |||||
Other | 125,000 | 97,000 | |||||
Net operating losses | 2,840,000 | 3,251,000 | |||||
Total deferred tax assets | 5,618,000 | 5,637,000 | |||||
Deferred tax liabilities: | |||||||
Fixed assets | 247,000 | 416,000 | |||||
Income of Interest Charge DISC | 860,000 | 840,000 | |||||
Income of foreign subsidiaries | 6,880,000 | 5,720,000 | |||||
Total deferred tax liabilities | 7,987,000 | 6,976,000 | |||||
Net deferred tax liabilities | $ | (2,369,000 | ) | $ | (1,339,000 | ) | |
F-16
NU HORIZONS ELECTRONICS CORP. AND SUBSIDIARIES
NOTES TO CONSOLIDATED FINANCIAL STATEMENTS
(CONTINUED)
| 10. | INCOME TAXES (Continued): |
As of February 28, 2007, the Company had $7,000,000 in net operating losses available. Such losses expire in the years beginning fiscal 2016.
| 11. | EMPLOYEE BENEFIT PLANS: |
On January 13, 1987, the Company’s Board of Directors approved the adoption of an employee stock ownership plan (ESOP). The ESOP covers all eligible employees and contributions are determined by the Board of Directors. The ESOP purchases shares of the Company’s common stock using loan proceeds. As the loan is repaid, a pro rata amount of common stock is released for allocation to eligible employees. The Company makes cash contributions to the ESOP to meet its obligations. No contributions have been made to the ESOP for the three years ended February 28, 2007. At February 28, 2007, the ESOP owned 439,418 shares of the Company’s common stock at an average price of approximately $3.45 per share.
In January 1991, the Company also established a 401(k) profit sharing plan to cover all eligible employees. The Company’s contributions to the plan are discretionary, but may not exceed 1% of compensation. Contributions to the plan for the three years ended February 28, 2007 were $307,000, $262,000 and $284,000, respectively.
| 12. | COMMITMENTS AND CONTINGENCIES: |
Employment Contracts:
On September 13, 1996, the Company signed employment contracts (the “Contracts”), as amended, with two of its senior executives for a continually renewing five-year term. The Contracts specified a base salary of $226,545 for each officer, which shall be increased each year by the change in the consumer price index, and also entitle those officers to an annual bonus equal to 3.33% (6.7% in the aggregate) of the Company’s consolidated earnings before income taxes. On the termination of his employment agreement, each executive is entitled to certain payments, as follows:
· | Due to death or Disability (as defined in the employment agreement), salary and benefits for a five (5) year period. |
· | For Cause (as defined in the employment agreement), solely base salary through the date of termination. |
· | Termination other than for death, disability or cause, shall be deemed to be a "Retirement" under the Retirement Plan discussed below. |
· | Following a Change in Control (as defined in the employment agreement), a lump sum equal to three times the average total compensation paid to the applicable employee with respect to the five fiscal years of the Company prior to the Change of Control, minus $100. |
Executive Retirement Plan:
On December 1, 2004, the Board of Directors approved the adoption of the Nu Horizons Executive Retirement Plan (the "Retirement Plan"). Pursuant to the terms of the Retirement Plan, the Company will provide an unfunded retirement benefit to certain executive employees of the Company and its subsidiaries upon such executive's retirement (as defined in the Retirement Plan). At the time the Board of Directors approved the Retirement Plan, they determined that the participation of Mr. Nadata, Chairman of the Board and Chief Executive Officer, and Mr. Schuster, President, each a Founder (as defined in the Retirement Plan), would be contingent upon the execution and delivery by each of them of an amendment to their respective employment agreements, which amendment would provide that a termination of employment other than for death, disability or cause would be a "Retirement" under the Retirement Plan. As a result the "Effective Date” of the Retirement Plan is March 28, 2005, the date of such execution and delivery. Upon his Retirement, each executive will be entitled to receive an annual benefit in an amount determined by the number of years of service the executive has provided to the Company, ranging from a minimum of $310,000 for 20 years of service to a maximum of $393,000 for 25 years of service. The Company has accrued $1,200,000 at fiscal year end February 28, 2007.
F-17
NU HORIZONS ELECTRONICS CORP. AND SUBSIDIARIES
NOTES TO CONSOLIDATED FINANCIAL STATEMENTS
(CONTINUED)
| 12. | COMMITMENTS AND CONTINGENCIES (Continued): |
Leases:
In December 1996, the Company leased an approximately 80,000 square foot facility in Melville, Long Island, New York to serve as its executive offices and main distribution center. In mid- 1997, the Company moved its executive offices and distribution operation to the facility. The lease term is from December 17, 1996 to December 31, 2008 at an annual base rental of $601,290 and provides for a 4% annual escalation in each of the last ten years of the term. On November 1, 2006, the Company entered into a new warehouse lease in Southaven, Mississippi for approximately 48,000 square feet. The lease term is from November 1, 2006 to January 31, 2012 at an annual base rent of $205,000. The Company also leases certain other sales offices, warehouses and other properties which leases include various escalation clauses, renewal options, and other provisions. Aggregate minimum rental commitments under non-cancelable operating leases are as follows:
| Fiscal 2008 | $ | 3,794,000 | ||
| Fiscal 2009 | 2,806,000 | |||
| Fiscal 2010 | 1,180,000 | |||
| Fiscal 2011 | 735,000 | |||
| Fiscal 2012 | 571,000 | |||
| Thereafter | 21,000 |
Rent and real estate tax expense was $3,559,000, $3,429,000 and $3,539,000, for the years ended February 28, 2007, 2006, and 2005, respectively.
Litigation:
At times the Company is involved in various lawsuits incidental to its business. At February 28, 2007, management does not believe that any litigation matter is material to its financial statements.
| 13. | MAJOR SUPPLIERS/CUSTOMERS: |
Suppliers:
For the year ended February 28, 2007, the Company purchased inventory from three suppliers that was in excess of 10% of the Company’s total purchases. Purchases from these suppliers were approximately $121,160,000, $111,522,000 and $62,745,000 for the fiscal year. 53% of total accounts payable as of February 28, 2007 related to these suppliers.
For the year ended February 28, 2006, the Company purchased inventory from three suppliers that was in excess of 10% of the Company’s total purchases. Purchases from these suppliers were approximately $104,644,000, $78,586,000 and $75,522,000 for the fiscal year. 63% of total accounts payable as of February 28, 2006 related to these suppliers.
For the year ended February 28, 2005, the Company purchased inventory from three suppliers that was in excess of 10% of the Company’s total purchases. Purchases from these suppliers were approximately $97,360,000, $60,197,000 and $48,334,000 for the fiscal year. 56% of total accounts payable as of February 28, 2005 related to these suppliers.
Customers:
For the years ended February 28, 2007, 2006 and 2005, no one customer accounted for more than 10% of the Company's total sales.
F-18
NU HORIZONS ELECTRONICS CORP. AND SUBSIDIARIES
NOTES TO CONSOLIDATED FINANCIAL STATEMENTS
(CONTINUED)
| 14. | BUSINESS SEGMENT AND GEOGRAPHIC INFORMATION: |
The Company is operating in a single business segment, distribution of electronic components, in accordance with the rules of SFAS No. 131 (“Disclosure About Segments of an Enterprise and Related Information”).
Although the Company’s business is primarily conducted in the United States, operations are also carried out overseas through our foreign subsidiaries in different geographic areas.
The net book value of long-lived assets by geographic area, as at the end of the fiscal years are as follows:
| 2007 | 2006 | 2005 | ||||||||
| Americas | $ | 2,721,000 | $ | 3,038,000 | $ | 3,590,000 | ||||
| Europe | 161,000 | 25,000 | 33,000 | |||||||
| Asia/Pacific | 499,000 | 551,000 | 305,000 | |||||||
| $ | 3,381,000 | $ | 3,614,000 | $ | 3,928,000 | |||||
Revenues, by geographic area, for the fiscal years are as follows:
| 2007 | 2006 | 2005 | ||||||||
| Americas | $ | 554,794,000 | $ | 418,578,000 | $ | 352,778,000 | ||||
| Europe | 34,532,000 | 17,400,000 | 14,159,000 | |||||||
| Asia/Pacific | 148,137,000 | 125,313,000 | 100,912,000 | |||||||
| $ | 737,463,000 | $ | 561,291,000 | $ | 467,849,000 | |||||
Total assets, by geographic area, at the end of the fiscal years are as follows:
| 2007 | 2006 | 2005 | ||||||||
| Americas | $ | 184,056,000 | $ | 167,330,000 | $ | 95,934,000 | ||||
| Europe | 18,973,000 | 7,932,000 | 13,920,000 | |||||||
| Asia/Pacific | 61,197,000 | 68,212,000 | 67,945,000 | |||||||
| $ | 264,226,000 | $ | 243,474,000 | $ | 177,799,000 | |||||
F-19
NU HORIZONS ELECTRONICS CORP. AND SUBSIDIARIES
NOTES TO CONSOLIDATED FINANCIAL STATEMENTS
(CONTINUED)
| 15. | SELECTED QUARTERLY FINANCIAL DATA (Unaudited): |
| Three Month Period Ended | |||||||||||||
February 28, 2007 | November 30, 2006 | August 31, 2006 | May 31, 2006 | ||||||||||
| Net sales | $ | 170,101,000 | $ | 186,080,000 | $ | 193,522,000 | $ | 187,760,000 | |||||
| Cost of sales | 143,605,000 | 157,025,000 | 164,418,000 | 159,470,000 | |||||||||
| Operating expenses | 24,524,000 | 23,994,000 | 22,870,000 | 22,123,000 | |||||||||
| Interest expense, net | 876,000 | 1,012,000 | 481,000 | 901,000 | |||||||||
| Provision for income taxes | 77,000 | 1,565,000 | 2,228,000 | 1,956,000 | |||||||||
| Minority interest | 157,000 | 93,000 | 40,000 | 135,000 | |||||||||
Net income | $ | 862,000 | $ | 2,391,000 | $ | 3,485,000 | $ | 3,175,000 | |||||
Net Income per Common Share | |||||||||||||
| Basic | $ | .05 | $ | .13 | $ | .20 | $ | .18 | |||||
| Diluted | $ | .05 | $ | .13 | $ | .19 | $ | .17 | |||||
Weighted Average per Common Shares Outstanding | |||||||||||||
| Basic | 18,158,034 | 18,059,849 | 17,697,958 | 17,596,232 | |||||||||
| Diluted | 18,926,647 | 19,018,687 | 18,655,852 | 18,293,721 | |||||||||
| Three Month Period Ended | |||||||||||||
February 28, 2006 | November 30, 2005 | August 31, 2005 | May 31, 2005 | ||||||||||
| Net sales | $ | 164,091,000 | $ | 147,515,000 | $ | 128,265,000 | $ | 121,420,000 | |||||
| Cost of sales | 138,700,000 | 124,271,000 | 107,564,000 | 102,007,000 | |||||||||
| Operating expenses | 21,483,000 | 20,054,000 | 18,600,000 | 17,954,000 | |||||||||
| Interest expense, net | 1,067,000 | 642,000 | 618,000 | 600,000 | |||||||||
| Provision for income taxes | 735,000 | 992,000 | 503,000 | 330,000 | |||||||||
| Minority interest | 18,000 | 55,000 | 160,000 | 54,000 | |||||||||
Net income | $ | 2,088,000 | $ | 1,501,000 | $ | 820,000 | $ | 475,000 | |||||
Net Income per Common Share | |||||||||||||
| Basic | $ | .12 | $ | .09 | $ | .05 | $ | .03 | |||||
| Diluted | $ | .11 | $ | .08 | $ | .05 | $ | .03 | |||||
Weighted Average per Common Shares Outstanding | |||||||||||||
| Basic | 17,431,482 | 17,198,133 | 16,907,397 | 16,907,397 | |||||||||
| Diluted | 18,276,162 | 17,760,196 | 17,367,115 | 17,449,570 | |||||||||
F-20
Report of Independent Registered Public Accounting Firm
The Board of Directors and Stockholders
Nu Horizons Electronics Corp.
Melville, New York
We have audited the accompanying consolidated balance sheets of Nu Horizons Electronics Corp. and subsidiaries (the Company) as of February 28, 2007 and 2006, and the related consolidated statements of operations, shareholders’ equity and cash flows for each of the years in the three-year period ended February 28, 2007. Our audits also included the financial statement schedule listed in the Index at Item 15(a). These consolidated financial statements are the responsibility of the Company’s management. Our responsibility is to express an opinion on these consolidated financial statements based on our audits.
We conducted our audits in accordance with the standards of the Public Company Accounting Oversight Board (United States). Those standards require that we plan and perform the audits to obtain reasonable assurance about whether the financial statements are free of material misstatement. An audit includes examining, on a test basis, evidence supporting the amounts and disclosures in the financial statements. An audit also includes assessing the accounting principles used and significant estimates made by management, as well as evaluating the overall financial statement presentation. We believe that our audits provide a reasonable basis for our opinion.
In our opinion, the consolidated financial statements referred to above present fairly, in all material respects, the financial position of Nu Horizons Electronics Corp. and subsidiaries as of February 28, 2007 and 2006, and the results of their operations and their cash flows for each of the years in the three-year period ended February 28, 2007 in conformity with accounting principles generally accepted in the United States of America. Also in our opinion, the related financial statement schedule, when considered in relation to the basic financial statements taken as a whole, presents fairly, in all material respects the information set forth therein.
As discussed in Note 2 to the Consolidated Financial Statements, the Company adopted Statement of Financial Accounting
Standards No. 123(R) - "Share-Based Payments", as revised, effective March 1, 2006.
We have also audited, in accordance with the standards of the Public Company Accounting Oversight Board (United States), the effectiveness of the internal control over financial reporting of Nu Horizons Electronics Corp. and subsidiaries as of February 28, 2007, based on criteria established in Internal Control — Integrated Framework issued by the Committee of Sponsoring Organizations of the Treadway Commission (COSO), and our report dated May 7, 2007 expressed an unqualified opinion on management’s assessment of, and the effective operation of, internal control over financial reporting.
| /s/ Lazar Levine & Felix LLP | ||
Lazar Levine & Felix LLP | ||
New York, New York
May 7, 2007
F-21
| ITEM 9. | CHANGES IN AND DISAGREEMENTS WITH ACCOUNTANTS ON ACCOUNTING AND FINANCIAL DISCLOSURE |
The Company had no disagreements on accounting or financial disclosure matters with its accountants, nor did it change accountants, during the three-year period ended February 28, 2007.
| ITEM 9A | CONTROLS AND PROCEDURES |
Evaluation of Disclosure Controls and Procedures
As of the end of the period covered by this report, we carried out an evaluation, under the supervision and with the participation of our management, including our Chief Executive Officer and Chief Financial Officer, of the effectiveness of the design and operation of our disclosure controls and procedures (as defined in Exchange Act Rule 13a-15(e) and 15d-15(e)). Our disclosure controls and procedures are designed to ensure that information required to be disclosed by us in the reports that we file or submit to the Securities and Exchange Commission under the Securities Exchange Act of 1934, as amended, is recorded, processed, summarized and reported within the time periods specified by the Commission’s rules and forms, and that information is accumulated and communicated to our management, including our Chief Executive Officer and our Chief Financial Officer, as appropriate to allow timely decisions regarding required disclosure. Based upon the evaluation that was conducted, the Chief Executive Officer and Chief Financial Officer have concluded that as of the end of the period covered by this Annual Report on Form 10-K our disclosure controls and procedures were effective.
Changes in Internal Controls
There were no changes made in our internal controls over financial reporting that occurred during our most recently completed fiscal quarter that have materially affected, or are reasonably likely to materially affect our internal controls over financial reporting.
As a result of the DT acquisition, the Company is currently evaluating the internal controls for DT's operations. The Company is in the process of integrating DT's operations, including its inventory management systems, sales order system and other controls.
Management’s Annual Report on Internal Control Over Financial Reporting
Our management is responsible for establishing and maintaining an adequate system of internal control over financial reporting. Our internal control over financial reporting includes those policies and procedures that:
| · | pertain to the maintenance of records that, in reasonable detail, accurately and fairly reflect the transactions and dispositions of our assets; |
| · | provide reasonable assurance that transactions are recorded as necessary to permit preparation of our financial statements in accordance with generally accepted accounting principles in the United States, and that our receipts and expenditures are being made only in accordance with authorizations of our management and directors; and |
| · | provide reasonable assurance regarding prevention or timely detection of unauthorized acquisition, use or disposition of our assets that could have a material effect on the financial statements. |
Our management assessed the effectiveness of our system of internal control over financial reporting as of February 28, 2007. In making this assessment, management used the framework in Internal Control — Integrated Framework issued by the Committee of Sponsoring Organizations of the Treadway Commission (“COSO”). Based on our assessment and the criteria set forth by COSO, management believes that Nu Horizons maintained effective internal control over financial reporting as of February 28, 2007. Our assessment of the effectiveness of our internal control over financial reporting has been audited by Lazar Levine & Felix LLP, an independent registered public accounting firm, as stated in their report which is included herein.
21
Inherent Limitations on Effectiveness of Controls
Our system of internal control over financial reporting was designed to provide reasonable assurance regarding the reliability of financial reporting and the preparation of financial statements for external purposes in accordance with accounting principles generally accepted in the United States.
All internal control systems, no matter how well designed and operated, can provide only reasonable assurance with respect to financial statement preparation and presentation. Our management does not expect that our disclosure controls and procedures will prevent all errors and fraud. Further, the design of a control system must reflect the fact that there are resource constraints, and the benefits of controls must be considered relative to their costs. Because of the inherent limitations in all control systems, no evaluation of controls can provide absolute assurance that all control issues within the company have been detected, even with respect to those systems of internal control that are determined to be effective. These inherent limitations include the realities that judgments in decision-making can be faulty, and that breakdowns can occur because of simple errors or mistakes. The design of any system of controls also is based in part upon certain assumptions about the likelihood of future events, and there can be no assurance that any design will succeed in achieving its stated goals under all potential future conditions. Over time, controls may become inadequate because of changes in conditions, or the degree of compliance with the policies or procedures may deteriorate. Because of these inherent limitations in a cost-effective control system, misstatements due to error or fraud may occur and not be detected. Our system contains self monitoring mechanisms, and actions are taken to correct deficiencies as they are identified.
Audit Committee Oversight
The Audit Committee of the Board of Directors, which is comprised solely of independent directors, has oversight responsibility for our financial reporting process and the audits of our consolidated financial statements and internal control over financial reporting. The Audit Committee meets regularly with management and the independent registered public accounting firm ( the “accountants”) to review matters related to the quality and integrity of our financial reporting, internal control over financial reporting (including compliance matters related to our Code of Business Conduct), and the nature, extent, and results of internal and external audits. Our accountants have full and free access and report directly to the Audit Committee. The Audit Committee recommended, and the Board of Directors approved, that the audited consolidated financial statements be included in this Annual Report on Form 10-K.
The Board of Directors and Stockholders of
Nu Horizons Electronics Corp.
Melville, New York
We have audited management’s assessment, included in the accompanying Management’s Annual Report on Internal Control Over Financial Reporting, that Nu Horizons Electronics Corp. (“Nu Horizons”), maintained effective internal control over financial reporting as of February 28, 2007, based on criteria established in Internal Control - Integrated Framework issued by the Committee of Sponsoring Organizations of the Treadway Commission (COSO). Nu Horizons’s management is responsible for maintaining effective internal control over financial reporting and for its assessment of the effectiveness of internal control over financial reporting. Our responsibility is to express an opinion on management’s assessment and an opinion on the effectiveness of Nu Horizons’s internal control over financial reporting based on our audit.
We conducted our audit in accordance with the standards of the Public Company Accounting Oversight Board (United States). Those standards require that we plan and perform the audit to obtain reasonable assurance about whether effective internal control over financial reporting was maintained in all material respects. Our audit included obtaining an understanding of internal control over financial reporting, evaluating management’s assessment, testing and evaluating the design and operating effectiveness of internal control, and performing such other procedures as we considered necessary in the circumstances. We believe that our audit provides a reasonable basis for our opinion.
A company’s internal control over financial reporting is a process designed to provide reasonable assurance regarding the reliability of financial reporting and the preparation of financial statements for external purposes in accordance with generally accepted accounting principles. A company’s internal control over financial reporting includes those policies and procedures that (1) pertain to the maintenance of records that, in reasonable detail, accurately and fairly reflect the transactions and dispositions of the assets of the company; (2) provide reasonable assurance that transactions are recorded as necessary to permit preparation of financial statements in accordance with generally accepted accounting principles, and that receipts and expenditures of the company are being made only in accordance with authorizations of management and directors of the company; and (3) provide reasonable assurance regarding prevention or timely detection of unauthorized acquisition, use, or disposition of the company’s assets that could have a material effect on the financial statements.
22
Attestation Report of Independent Registered Public Accounting Firm On Internal Control Over Financial Reporting (continued)
Because of its inherent limitations, internal control over financial reporting may not prevent or detect misstatements. Also, projections of any evaluation of effectiveness to future periods are subject to the risk that controls may become inadequate because of changes in conditions or that the degree of compliance with the policies or procedures may deteriorate.
In our opinion, management’s assessment that Nu Horizons Electronics Corp. maintained effective internal control over financial reporting as of February 28, 2007 is fairly stated, in all material respects, based on the COSO criteria. Also, in our opinion, Nu Horizons Electronics Corp. maintained, in all material respects, effective internal control over financial reporting as of February 28, 2007, based on the COSO criteria.
We have also audited, in accordance with the standards of the Public Company Accounting Oversight Board (United States), the consolidated balance sheets of Nu Horizons Electronics Corp. and subsidiaries as of February 28, 2007 and 2006 and the related consolidated statements of operations, shareholders’ equity and cash flows for each of the years in the three-year period ended February 28, 2007, and our report dated May 7, 2007 expressed an unqualified opinion on those consolidated financial statements.
/s/ Lazar Levine & Felix LLP | ||
Lazar Levine & Felix LLP | ||
New York, New York
May 7, 2007
ITEM 9B. OTHER INFORMATION:
None
PART III
ITEM 10. DIRECTORS AND EXECUTIVE OFFICERS OF THE REGISTRANT:
Reference is made to the Registrant's definitive proxy statement to be filed with the Securities and Exchange Commission within 120 days after the end of the Registrant's fiscal year for information concerning directors and executive officers of the Registrant.
Code of Conduct
The Board of Directors has adopted a code of conduct that applies to all of our employees, officers and directors and a code of ethics that applies to our Chief Executive Officer and senior financial officers. You can find links to these materials in the Investor Relations section of our website at: www.nuhorizons.com and we will provide copies of these materials, free of charge, if a request is sent to: Nu Horizons Electronics Corp., 70 Maxess Road, Melville, New York 11747, attention: Secretary. The Company intends to satisfy the disclosure requirement under Item 10 of Form 8-K regarding an amendment to, or a waiver from, a provision of its code of ethics that applies to the registrant’s principal executive officer, principal financial officer, principal accounting officer or controller, or persons performing similar functions and that relates to any element of its codes of ethics by posting such information on its website.
23
ITEM 11. EXECUTIVE COMPENSATION:
Reference is made to the Registrant's definitive proxy statement to be filed with the Securities and Exchange Commission within 120 days after the end of the Registrant's fiscal year for information concerning executive compensation.
ITEM 12. SECURITY OWNERSHIP OF CERTAIN BENEFICIAL OWNERS AND MANAGEMENT AND RELATED STOCKHOLDER MATTERS:
Reference is made to the Registrant's definitive proxy statement to be filed with the Securities and Exchange Commission within 120 days after the end of the Registrant's fiscal year for information concerning security ownership of each person known by the Company to own beneficially more than 5% of the outstanding shares of common stock, of each director of the Company and all executive officers and directors as a group.
ITEM 13. CERTAIN RELATIONSHIPS AND RELATED TRANSACTIONS, AND DIRECTOR INDEPENDENCE:
Reference is made to the Registrant's definitive proxy statement to be filed with the Securities and Exchange Commission within 120 days after the end of the Registrant's fiscal year for information concerning relationships and related transactions.
Reference is made to the Registrant's definitive proxy statement to be filed with the Securities and Exchange Commission within 120 days after the end of the Registrant's fiscal year for information concerning principal accounting fees and services.
24
PART IV.
ITEM 15. EXHIBITS AND FINANCIAL STATEMENT SCHEDULES:
| (a) (1) | The following consolidated financial statements of the registrant and its subsidiaries are filed as a part of this report: |
| Page | |
| Report of Independent Registered Public Accounting Firm | F-21 |
| Consolidated Statements of Operations for the three years in the period ended February 28, 2007 | F-1 |
| Consolidated Balance Sheets as of February 28, 2007 and February 28, 2006 | F-2 |
| Consolidated Statements of Changes in Shareholders’ Equity for the three years in the period ended February 28, 2007 | F-3 |
| Consolidated Statements of Cash Flows for the three years in the period ended February 28, 2007 | F4 - F-5 |
| Notes to Consolidated Financial Statements | F-6 - F20 |
| (a) (2) Schedule II - Valuation and Qualifying Accounts and Reserves | 30 |
| (a) (3) See exhibits required - Item (c) below | |
(b) Exhibits |
25
| (c) | ITEM 15. EXHIBITS AND FINANCIAL STATEMENT SCHEDULES: |
EXHIBIT NUMBER | DESCRIPTION | ||
| 3.1 | Certificate of Incorporation, as amended (Incorporated by Reference to Exhibit 3.1 to the Company’s Quarterly Report on Form 10-Q for the Quarter ended November 30, 2000). | ||
| 3.2 | By-laws, as amended (Incorporated by Reference to Exhibit 3.2 to the Company’s Annual Report on Form 10-K for the year ended February 29, 1988) | ||
| 4.1 | Specimen Common Stock Certificate (Incorporated by Reference as Exhibit 4.1 to the Company’s Registration Statement on Form S-1, Registration No. 2-89176). | ||
| 10.1 | Agreement between the Company and Trustees relating to the Company’s Employee Stock Ownership Plan (Incorporated by Reference to Exhibit 10.5 to the Company’s Annual Report on Form 10-K for the year ended February 28, 1987). | ||
| 10.2 | 1994 Stock Option Plan (Incorporated by Reference to Exhibit 10.3 to the Company’s Quarterly Report on Form 10-Q for the quarter ended August 31, 1994). | |||
| 10.3 | Outside Director Stock Option Plan (Incorporated by Reference to Exhibit 10.4 to the Company’s Quarterly Report on Form 10-Q for the quarter ended August 31, 1994). | |||
| 10.4 | Employment and Change of Control Agreements dated September 13, 1996, between Company and Arthur Nadata (Incorporated by Reference to Exhibit 10.16 to the Company’s Quarterly Report on Form 10-Q for the quarter ended August 31, 1996). | |||
| 10.5 | Employment and Change of Control Agreements dated September 13, 1996, between Company and Richard Schuster (Incorporated by Reference to Exhibit 10.17 to the Company’s Quarterly Report on Form 10-Q for the quarter ended August 31, 1996). | |||
| 10.6 | Form of Indemnity Agreements between the Company and Messrs. Gardner, Nadata, Polimeni, Schuster, Siegel, Novick and Freudenberg (Incorporated by Reference to Exhibit 10.19 to Form 10-Q for the quarter ended May 31, 1997). | |||
| 10.7 | 1998 Stock Option Plan, as amended (Incorporated by Reference to Exhibit 4.1 to the Company’s Registration Statement on Form S-8, No.333-82805). | |||
| 10.8 | 2000 Stock Option Plan (Incorporated by Reference to Exhibit 4.1 to the Company’s Registration Statement on Form S-8, No.333-51188). | |||
26
ITEM 15. EXHIBITS, FINANCIAL STATEMENTS AND SCHEDULES
| (c) | Exhibits (continued): |
EXHIBIT NUMBER | DESCRIPTION | |
| 10.9 | 2000 Key Employee Stock Option Plan (Incorporated by reference to Exhibit 4.1 to the Company’s Registration Statement on Form S-8 No. 333-51192). | |
| 10.10 | 2000 Outside Directors’ Stock Option Plan (Incorporated by reference to Exhibit 4.1 to the Company’s Registration Statement on Form S-8 No.333-51190). | |
| 10.11 | Amended and Restated Credit Agreement dated as of January 31, 2007 between the Company and eight banks (Incorporated by Reference to Exhibit 10.1 to Form 8-K dated January 31, 2007). | |
| 10.12 | 2002 Key Employee Stock Incentive Plan (Incorporated by Reference to Exhibit A to the Company’s Proxy Statement filed on September 27, 2005). | |
| 10.13 | 2002 Outside Directors Stock Option Plan (Incorporated by Reference to Exhibit 4.1 to the Company’s Registration Statement on Form S-8 No. 333-103626). | |
| 10.14 | Nu Horizons Executive Retirement Plan (Incorporated by Reference to Exhibit 10.1 to Form 8K dated March 28, 2005). | |
| 10.15 | Amendment to Employment between the Company and Arthur Nadata dated as of March 28, 2005. (Incorporated by Reference to Exhibit 10.2 to Form 8-K dated March 28, 2005). | |
| 10.16 | Amendment to Employment between the Company and Richard Schuster dated as of March 28, 2005. (Incorporated by Reference to Exhibit 10.3 to Form 8-K dated March 28, 2005). | |
| 10.17 | Employment Agreement between the Company and Kurt Freudenberg dated as of May 25, 2006 (Incorporated by Reference to Exhibit 10.2 to Form 8-K dated May 24, 2006). | |
| 10.18 | Share Purchase Agreement dated as of August 29, 2006 by and among Nu Horizons Electronics Europe, Anthony Frere, Geoffrey Rose, David Zelkha and others (Incorporated by Reference to Exhibit 10.1 to Form 8-K dated August 29, 2006). | |
| 10.19 | Guaranty dated as of November 20, 2006 by the Company in favor of The Hong Kong and Shanghai Banking Corporation Limited (Incorporated by Reference to Exhibit 10.1 to Form 8-K dated November 20, 2006). |
27
ITEM 15. EXHIBITS, FINANCIAL STATEMENTS AND SCHEDULES
| 13. | Annual Report to Security holders. |
| 21. | Nu Horizons Electronics Corp. & Subsidiaries Organizational (Legal Entity) Structure as of February 28, 2007 |
| 23. | Accountants’ Consent |
| 31.1 | Certification of Chief Financial Officer Pursuant to Section 302 of the Sarbanes-Oxley Act of 2002 |
| 31.2 | Certification of Chief Executive Officer Pursuant to Section 302 of the Sarbanes-Oxley Act of 2002 |
| 32.1 | Certification of Chief Financial Officer Pursuant to Section 906 of the Sarbanes-Oxley Act of 2002 |
| 32.2 | Certification of the Chief Executive Officer Pursuant to Section 906 of the Sarbanes-Oxley Act of 2002 |
28
SIGNATURES
Pursuant to the requirements of Section 13 or 15(d) of the Securities Exchange Act of 1934, the Company has duly caused this report to be signed on its behalf by the undersigned, thereunto duly authorized.
NU HORIZONS ELECTRONICS CORP. (Registrant) | ||
| | | |
| By: | /s/ ARTHUR NADATA | |
Arthur Nadata, CEO (Principal Operating Officer) | ||
| By: | /s/ KURT FREUDENBERG | |
Kurt Freudenberg Vice President, Treasurer and Chief Financial Officer (Principal Financial and Accounting Officer) | ||
Pursuant to the requirements of the Securities Exchange Act of 1934, this report has been signed below by the following persons on behalf of the Registrant and in the capacities and on the date indicated:
| SIGNATURE | CAPACITY | DATE | |||
| By: | /s/ ARTHUR NADATA | Chairman of The Board, | May 10, 2007 | ||
| Arthur Nadata | Chief Executive Officer | ||||
| By: | /s/ RICHARD SCHUSTER | President, Chief Operating | May 10, 2007 | ||
| Richard Schuster | Officer, Secretary and Director | ||||
| By: | /s/ KURT FREUDENBERG | Vice President, Treasurer, | May 10, 2007 | ||
| Kurt Freudenberg | Chief Financial Officer and Director | ||||
| By: | /s/ HERBERT M. GARDNER | Director | May 10, 2007 | ||
| Herbert M. Gardner | |||||
| By: | /s/ MARTIN NOVICK | Director | May 10, 2007 | ||
| Martin Novick | |||||
| By: | /s/ DOMINIC A. POLIMENI | Director | May 10, 2007 | ||
| Dominic A. Polimeni | |||||
| By: | /s/ DAVID SIEGEL | Director | May 10, 2007 | ||
| David Siegel |
29
SCHEDULE II
NU HORIZONS ELECTRONICS CORP. AND SUBSIDIARIES
SCHEDULE II—VALUATION AND QUALIFYING
ACCOUNTS AND RESERVES
Three Years Ended February 28, 2007
Description | Balance at Beginning of period | Additions charged to costs and expenses | Deductions (A) | Balance at end of period | |||||||||
| Valuation account | |||||||||||||
| deducted in the | |||||||||||||
| balance sheet from | |||||||||||||
| the asset to which | |||||||||||||
| it applies: | |||||||||||||
| Allowance for | |||||||||||||
| doubtful accounts- | |||||||||||||
| accounts receivable | |||||||||||||
| 2007 | $ | 4,702,000 | $ | 447,000 | $ | 164,000 | $ | 4,985,000 | |||||
| 2006 | $ | 4,582,000 | - | $ | (120,000 | ) | $ | 4,702,000 | |||||
| 2005 | $ | 4,090,000 | $ | 285,000 | $ | (207,000 | ) | $ | 4,582,000 | ||||
| (A) | Accounts written off. |
30
SECURITIES AND EXCHANGE COMMISSION
Washington, D.C. 20549
EXHIBIT INDEX
to
FORM 10-K
FOR THE FISCAL YEAR ENDED FEBRUARY 28, 2007
ANNUAL REPORT PURSUANT TO SECTION 13 OR 15 (d)
OF THE SECURITIES EXCHANGE ACT OF 1934
NU HORIZONS ELECTONICS CORP.
(Exact Name of Registrant as Specified in Its Charter)
EXHIBIT NUMBER | DESCRIPTION | |
| 21 | Organizational (Legal Entity) Structure As of February 28, 2007 | |
| 23 | Consent of Independent Registered Public Accounting Firms | |
| 31.1 | Certification of Chief Financial Officer Pursuant to Section 302 of the Sarbanes-Oxley Act of 2002 | |
| 31.2 | Certification of Chief Executive Officer Pursuant to Section 302 of the Sarbanes-Oxley Act of 2002 | |
| 32.1 | Certification of Chief Financial Officer Pursuant to Section 906 of the Sarbanes-Oxley Act of 2002 | |
| 32.2 | Certification of the Chief Executive Officer Pursuant to Section 906 of the Sarbanes-Oxley Act of 2002 |
31