UNITED STATES
SECURITIES AND EXCHANGE COMMISSION
Washington, D.C. 20549
FORM N-CSR
CERTIFIED SHAREHOLDER REPORT OF REGISTERED
MANAGEMENT INVESTMENT COMPANIES
Investment Company Act file number 811-3723
Fidelity New York Municipal Trust
(Exact name of registrant as specified in charter)
82 Devonshire St., Boston, Massachusetts 02109
(Address of principal executive offices) (Zip code)
Scott C. Goebel, Secretary
82 Devonshire St.
Boston, Massachusetts 02109
(Name and address of agent for service)
Registrant's telephone number, including area code: 617-563-7000
Date of fiscal year end: | January 31 |
|
|
Date of reporting period: | January 31, 2011 |
Item 1. Reports to Stockholders
Fidelity®
New York Municipal Income
Fund
Annual Report
January 31, 2011
(2_fidelity_logos) (Registered_Trademark)
Contents
Chairman's Message | The Chairman's message to shareholders. | |
Performance | How the fund has done over time. | |
Management's Discussion of Fund Performance | The Portfolio Manager's review of fund performance and strategy. | |
Shareholder Expense Example | An example of shareholder expenses. | |
Investment Changes | A summary of major shifts in the fund's investments over the past six months. | |
Investments | A complete list of the fund's investments with their market values. | |
Financial Statements | Statements of assets and liabilities, operations, and changes in net assets, as well as financial highlights. | |
Notes | Notes to the financial statements. | |
Report of Independent Registered Public Accounting Firm |
| |
Trustees and Officers |
| |
Distributions |
| |
Board Approval of Investment Advisory Contracts and Management Fees |
|
To view a fund's proxy voting guidelines and proxy voting record for the 12-month period ended June 30, visit http://www.fidelity.com/proxyvotingresults or visit the Securities and Exchange Commission's (SEC) web site at http://www.sec.gov. You may also call 1-800-544-8544 to request a free copy of the proxy voting guidelines.
Standard & Poor's, S&P and S&P 500 are registered service marks of The McGraw-Hill Companies, Inc. and have been licensed for use by Fidelity Distributors Corporation.
Other third party marks appearing herein are the property of their respective owners.
All other marks appearing herein are registered or unregistered trademarks or service marks of FMR LLC or an affiliated company.
Annual Report
This report and the financial statements contained herein are submitted for the general information of the shareholders of the fund. This report is not authorized for distribution to prospective investors in the fund unless preceded or accompanied by an effective prospectus.
A fund files its complete schedule of portfolio holdings with the SEC for the first and third quarters of each fiscal year on Form N-Q. Forms N-Q are available on the SEC's web site at http://www.sec.gov. A fund's Forms N-Q may be reviewed and copied at the SEC's Public Reference Room in Washington, DC. Information regarding the operation of the SEC's Public Reference Room may be obtained by calling 1-800-SEC-0330. For a complete list of a fund's portfolio holdings, view the most recent holdings listing, semiannual report, or annual report on Fidelity's web site at http://www.fidelity.com, http://www.advisor.fidelity.com, or http://www.401k.com, as applicable.
NOT FDIC INSURED • MAY LOSE VALUE • NO BANK GUARANTEE
Neither the fund nor Fidelity Distributors Corporation is a bank.
Annual Report
Chairman's Message
(photo_of_Abigail_P_Johnson)
Dear Shareholder:
Following a year in which the investment environment was volatile but generally supportive of most major asset classes, 2011 began on a positive note. U.S. equities gained ground in January, reaching their highest point since August 2008, amid indications the U.S. economy had turned a corner. Still, questions remained about the longer-term outlook, most notably persistently high unemployment. Financial markets are always unpredictable, of course, but there also are several time-tested investment principles that can help put the odds in your favor.
One of the basic tenets is to invest for the long term. Over time, riding out the markets' inevitable ups and downs has proven much more effective than selling into panic or chasing the hottest trend. Even missing only a few of the markets' best days can significantly diminish investor returns. Patience also affords the benefits of compounding - of earning interest on additional income or reinvested dividends and capital gains. There can be tax advantages and cost benefits to consider as well. While staying the course doesn't eliminate risk, it can considerably lessen the effect of short-term declines.
You can further manage your investing risk through diversification. And today, more than ever, geographic diversification should be taken into account. Studies indicate that asset allocation is the single most important determinant of a portfolio's long-term success. The right mix of stocks, bonds and cash - aligned to your particular risk tolerance and investment objective - is very important. Age-appropriate rebalancing is also an essential aspect of asset allocation. For younger investors, an emphasis on equities - which historically have been the best-performing asset class over time - is encouraged. As investors near their specific goal, such as retirement or sending a child to college, consideration may be given to replacing volatile assets (e.g. common stocks) with more-stable fixed investments (bonds or savings plans).
A third principle - investing regularly - can help lower the average cost of your purchases. Investing a certain amount of money each month or quarter helps ensure you won't pay for all your shares at market highs. This strategy - known as dollar cost averaging - also reduces "emotion" from investing, helping shareholders avoid selling weak performers just prior to an upswing, or chasing a hot performer just before a correction.
We invite you to contact us via the Internet, through our Investor Centers or by phone. It is our privilege to provide you the information you need to make the investments that are right for you.
Sincerely,
(The chairman's signature appears here.)
Abigail P. Johnson
Annual Report
Performance: The Bottom Line
Average annual total return reflects the change in the value of an investment, assuming reinvestment of the class's distributions from dividend income and capital gains (the profits earned upon the sale of securities that have grown in value, if any) and assuming a constant rate of performance each year. The $10,000 table and the fund's returns do not reflect the deduction of taxes that a shareholder would pay on fund distributions or the redemption of fund shares. During periods of reimbursement by Fidelity, a fund's total return will be greater than it would be had the reimbursement not occurred. How a fund did yesterday is no guarantee of how it will do tomorrow.
Average Annual Total Returns
Periods ended January 31, 2011 | Past 1 | Past 5 | Past 10 |
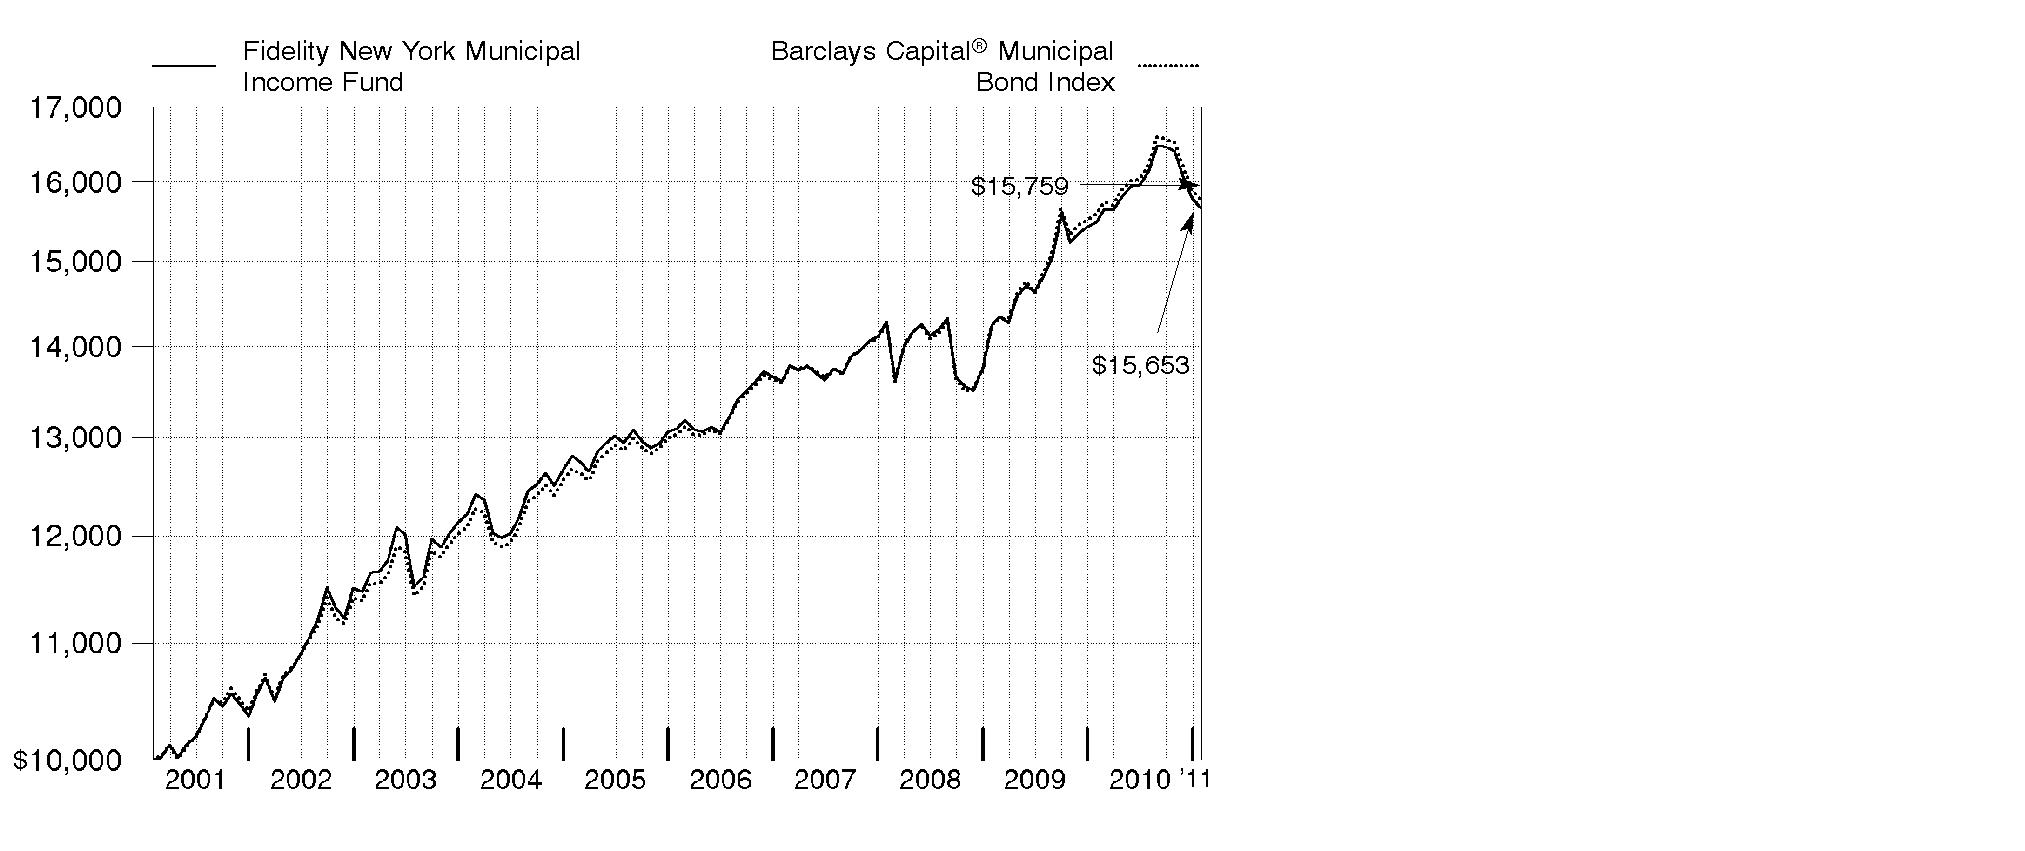
Fidelity® New York Municipal Income Fund | 1.16% | 3.64% | 4.58% |
$10,000 Over 10 Years
Let's say hypothetically that $10,000 was invested in Fidelity® New York Municipal Income Fund, a class of the fund, on January 31, 2001. The chart shows how the value of your investment would have changed, and also shows how the Barclays Capital® Municipal Bond Index performed over the same period.
Annual Report
Management's Discussion of Fund Performance
Market Recap: Tax-exempt municipal bonds posted disappointing results for the 12 months ending January 31, 2011, primarily due to a significant late-period sell-off. For the full 12 months, the Barclays Capital® Municipal Bond Index - a measure of more than 46,000 fixed-rate tax-exempt investment-grade bonds - returned 1.10%, while the taxable investment-grade debt market, as measured by the Barclays Capital® U.S. Aggregate Bond Index, rose 5.06%. From February through August 2010, munis were on track for a solid year, bolstered by low, steady interest rates and generally favorable supply/demand dynamics. Supply was muted due to the popularity of "Build America Bonds" (BABs) - taxable securities that allowed municipal issuers to borrow more cheaply in the taxable market. Meanwhile, the possibility of higher tax rates in 2011 heightened investor demand for tax-advantaged investments. From September through November, however, munis came under pressure amid the prospect of rising interest rates, heavy new supply and the growing likelihood that Bush-era tax policies would be extended beyond 2010. In December and January, munis' woes were compounded by headlines suggesting an unprecedented wave of defaults among issuers.
Comments from Mark Sommer, Portfolio Manager of Fidelity® New York Municipal Income Fund: For the 12-month period ending January 31, 2011, the fund's Retail Class shares returned 1.16%, while the Barclays Capital New York 4+ Year Enhanced Municipal Bond Index also posted a 1.16% gain. The fund's larger-than-index exposure to high-coupon callable bonds and underweighting in tobacco securities offset losses from out-of-benchmark exposure to long-maturity zero-coupon bonds issued in Puerto Rico. High-coupon callable bonds generally outpaced the benchmark during the year, thanks largely to their outperformance during a market sell-off later in the period. Tobacco securities initially lagged, due to concerns that declining cigarette consumption could lead to lower payments and, more recently, in response to investors avoiding riskier segments of the market. Investments in long-maturity zero-coupon bonds issued in Puerto Rico hurt, because these securities faltered on three fronts late in the period, when investor demand for lower-quality, long-maturity or uniquely structured securities was weak.
The views expressed above reflect those of the portfolio manager(s) only through the end of the period as stated on the cover of this report and do not necessarily represent the views of Fidelity or any other person in the Fidelity organization. Any such views are subject to change at any time based upon market or other conditions and Fidelity disclaims any responsibility to update such views. These views may not be relied on as investment advice and, because investment decisions for a Fidelity fund are based on numerous factors, may not be relied on as an indication of trading intent on behalf of any Fidelity fund.
Annual Report
Shareholder Expense Example
As a shareholder of the Fund, you incur two types of costs: (1) transaction costs, including sales charges (loads) on purchase payments or redemption proceeds, redemption fees, and (2) ongoing costs, including management fees, distribution and/or service (12b-1) fees and other Fund expenses. This Example is intended to help you understand your ongoing costs (in dollars) of investing in the Fund and to compare these costs with the ongoing costs of investing in other mutual funds.
The Example is based on an investment of $1,000 invested at the beginning of the period and held for the entire period (August 1, 2010 to January 31, 2011).
Actual Expenses
The first line of the accompanying table for each class of the Fund provides information about actual account values and actual expenses. You may use the information in this line, together with the amount you invested, to estimate the expenses that you paid over the period. Simply divide your account value by $1,000.00 (for example, an $8,600 account value divided by $1,000.00 = 8.6), then multiply the result by the number in the first line for a class of the Fund under the heading entitled "Expenses Paid During Period" to estimate the expenses you paid on your account during this period. A small balance maintenance fee of $12.00 that is charged once a year may apply for certain accounts with a value of less than $2,000. This fee is not included in the table below. If it was, the estimate of expenses you paid during the period would be higher, and your ending account value lower, by this amount.
Hypothetical Example for Comparison Purposes
The second line of the accompanying table for each class of the Fund provides information about hypothetical account values and hypothetical expenses based on a Class' actual expense ratio and an assumed rate of return of 5% per year before expenses, which is not the Class' actual return. The hypothetical account values and expenses may not be used to estimate the actual ending account balance or expenses you paid for the period. You may use this information to compare the ongoing costs of investing in the Fund and other funds. To do so, compare this 5% hypothetical example with the 5% hypothetical examples that appear in the shareholder reports of the other funds. A small balance maintenance fee of $12.00 that is charged once a year may apply for certain accounts with a value of less than $2,000. This fee is not included in the table below. If it was, the estimate of expenses you paid during the period would be higher, and your ending account value lower, by this amount.
Please note that the expenses shown in the table are meant to highlight your ongoing costs only and do not reflect any transaction costs. Therefore, the second line of the table is useful in comparing ongoing costs only, and will not help you determine the relative total costs of owning different funds. In addition, if these transactional costs were included, your costs would have been higher.
Annual Report
| Annualized Expense Ratio | Beginning | Ending | Expenses Paid |
Class A | .74% |
|
|
|
Actual |
| $ 1,000.00 | $ 968.50 | $ 3.67 |
HypotheticalA |
| $ 1,000.00 | $ 1,021.48 | $ 3.77 |
Class T | .73% |
|
|
|
Actual |
| $ 1,000.00 | $ 968.60 | $ 3.62 |
HypotheticalA |
| $ 1,000.00 | $ 1,021.53 | $ 3.72 |
Class B | 1.38% |
|
|
|
Actual |
| $ 1,000.00 | $ 966.20 | $ 6.84 |
HypotheticalA |
| $ 1,000.00 | $ 1,018.25 | $ 7.02 |
Class C | 1.52% |
|
|
|
Actual |
| $ 1,000.00 | $ 964.70 | $ 7.53 |
HypotheticalA |
| $ 1,000.00 | $ 1,017.54 | $ 7.73 |
New York Municipal Income | .46% |
|
|
|
Actual |
| $ 1,000.00 | $ 970.70 | $ 2.28 |
HypotheticalA |
| $ 1,000.00 | $ 1,022.89 | $ 2.35 |
Institutional Class | .54% |
|
|
|
Actual |
| $ 1,000.00 | $ 969.50 | $ 2.68 |
HypotheticalA |
| $ 1,000.00 | $ 1,022.48 | $ 2.75 |
A 5% return per year before expenses
* Expenses are equal to each Class' annualized expense ratio, multiplied by the average account value over the period, multiplied by 184/365 (to reflect the one-half year period).
Annual Report
Investment Changes (Unaudited)
Top Five Sectors as of January 31, 2011 | ||
| % of fund's | % of fund's net assets |
General Obligations | 29.6 | 31.1 |
Special Tax | 20.6 | 21.0 |
Transportation | 13.7 | 13.8 |
Education | 12.4 | 11.1 |
Water & Sewer | 10.1 | 10.2 |
Weighted Average Maturity as of January 31, 2011 | ||
|
| 6 months ago |
Years | 11.7 | 6.1 |
This is a weighted average of all the maturities of the securities held in a fund. Weighted Average Maturity (WAM) can be used as a measure of sensitivity to interest rate changes and markets changes. Generally, the longer the maturity, the greater the sensitivity to such changes. WAM is based on the dollar-weighted average length of time until principal payments must be paid. Depending on the types of securities held in a fund, certain maturity shortening devices (e.g., demand features, interest rate resets, and call options) may be taken into account when calculating the WAM. |
Duration as of January 31, 2011 | ||
|
| 6 months ago |
Years | 8.5 | 7.9 |
Duration shows how much a bond fund's price fluctuates with changes in comparable interest rates. If rates rise 1%, for example, a fund with a five-year duration is likely to lose about 5% of its value. Other factors also can influence a bond fund's performance and share price. Accordingly, a bond fund's actual performance may differ from this example. |
Quality Diversification (% of fund's net assets) | |||||||
As of January 31, 2011 | As of July 31, 2010 | ||||||
 | AAA 14.4% |
| | AAA 13.1% |
| ||
 | AA,A 78.1% |
| | AA,A 78.1% |
| ||
 | BBB 5.3% |
| | BBB 5.6% |
| ||
 | BB and Below 0.2% |
| | BB and Below 0.2% |
| ||
 | Not Rated 0.8% |
| | Not Rated 1.8% |
| ||
 | Short-Term |
| | Short-Term |
| ||

We have used ratings from Moody's Investors Service, Inc. Where Moody's® ratings are not available, we have used S&P® ratings. All ratings are as of the report date and do not reflect subsequent changes. |
Annual Report
Investments January 31, 2011
Showing Percentage of Net Assets
Municipal Bonds - 98.8% | ||||
| Principal Amount (000s) | Value (000s) | ||
New York - 92.5% | ||||
Albany Indl. Dev. Agcy. Civic Facility Rev. (St. Peters Hosp. Proj.) Series 2008 A, 5.75% 11/15/22 | $ 3,000 | $ 3,028 | ||
Dutchess County Indl. Dev. Agcy. Civic Facility Rev. (Bard College Proj.): | ||||
Series 2007 A1, 5% 8/1/12 | 500 | 519 | ||
Series 2007 A2, 5% 8/1/11 | 750 | 760 | ||
Erie County Indl. Dev. Agcy. School Facilities Rev. (Buffalo City School District Proj.): | ||||
Series 2003: | ||||
5.75% 5/1/17 (FSA Insured) | 8,940 | 9,370 | ||
5.75% 5/1/20 (FSA Insured) | 1,400 | 1,455 | ||
5.75% 5/1/21 | 1,755 | 1,821 | ||
5.75% 5/1/22 | 4,900 | 5,067 | ||
5.75% 5/1/23 | 1,000 | 1,031 | ||
Series 2004: | ||||
5.75% 5/1/17 | 5,950 | 6,516 | ||
5.75% 5/1/19 (FSA Insured) | 5,000 | 5,380 | ||
5.75% 5/1/23 (FSA Insured) | 9,620 | 10,032 | ||
5.75% 5/1/25 (FSA Insured) | 2,000 | 2,075 | ||
5.75% 5/1/26 | 8,985 | 9,309 | ||
Series 2007 A, 5.75% 5/1/27 | 5,000 | 5,323 | ||
Series 2008 A, 5.75% 5/1/29 (FSA Insured) | 3,535 | 3,785 | ||
Geneva Indl. Dev. Auth. Civic Facilities Rev. (Hobart & William Smith Proj.) Series 2003 A, 5.375% 2/1/23 (Nat'l. Pub. Fin. Guarantee Corp. Insured) | 3,485 | 3,515 | ||
Grand Central District Mgmt. Assoc., Inc. Series 2004, 5% 1/1/14 | 1,000 | 1,094 | ||
Great Neck North Wtr. Auth. Wtr. Sys. Rev. Series 2008, 5% 1/1/38 | 1,660 | 1,589 | ||
Hempstead Local Dev. Corp. Rev.: | ||||
(Adelphi Univ. Proj.): | ||||
Series 2009 A: | ||||
5% 2/1/12 | 1,000 | 1,024 | ||
5% 2/1/14 | 1,035 | 1,085 | ||
Series 2009 B, 5.25% 2/1/39 | 1,200 | 1,128 | ||
(Molloy College Proj.) Series 2009: | ||||
5% 7/1/17 | 1,035 | 1,092 | ||
5.25% 7/1/18 | 1,090 | 1,161 | ||
5.25% 7/1/19 | 1,100 | 1,160 | ||
5.75% 7/1/39 | 6,500 | 6,313 | ||
Long Island Pwr. Auth. Elec. Sys. Rev.: | ||||
Series 2000 A, 0% 6/1/19 (FSA Insured) | 1,935 | 1,438 | ||
Municipal Bonds - continued | ||||
| Principal Amount (000s) | Value (000s) | ||
New York - continued | ||||
Long Island Pwr. Auth. Elec. Sys. Rev.: - continued | ||||
Series 2006 A, 5.25% 12/1/20 (FGIC Insured) | $ 17,780 | $ 18,775 | ||
Series 2006 E, 5% 12/1/17 | 10,000 | 11,000 | ||
Series 2009 A: | ||||
5.75% 4/1/39 | 6,500 | 6,571 | ||
6.25% 4/1/33 | 1,655 | 1,781 | ||
Madison County Cap. Resource Corp. Rev. (Colgate Univ. Proj.) Series 2010 A: | ||||
5% 7/1/24 | 1,405 | 1,492 | ||
5% 7/1/25 | 1,000 | 1,047 | ||
5% 7/1/26 | 1,150 | 1,192 | ||
5% 7/1/27 | 1,630 | 1,678 | ||
5% 7/1/28 | 1,015 | 1,045 | ||
Metropolitan Trans. Auth. Svc. Contract Rev.: | ||||
Series 2002 A: | ||||
5.5% 7/1/20 | 3,000 | 3,079 | ||
5.75% 7/1/31 | 3,025 | 3,050 | ||
Series 2002 B: | ||||
5.5% 7/1/19 (Nat'l. Pub. Fin. Guarantee Corp. Insured) | 3,000 | 3,090 | ||
5.5% 7/1/23 | 5,000 | 5,095 | ||
Series 7, 5.625% 7/1/16 (Escrowed to Maturity) (c) | 3,000 | 3,161 | ||
Monroe County Arpt. Auth. Arpt. Rev. Series 2004, 5.25% 1/1/13 (Nat'l. Pub. Fin. Guarantee Corp. Insured) (b) | 1,000 | 1,025 | ||
Monroe County Indl. Dev. Agcy. Civic Facility Rev.: | ||||
(Highland Hosp. Proj.) Series 2005: | ||||
5% 8/1/11 | 1,510 | 1,527 | ||
5% 8/1/13 | 1,650 | 1,739 | ||
(Nazareth College Rochester Proj.) Series 2001, 5.25% 10/1/21 (Nat'l. Pub. Fin. Guarantee Corp. Insured) | 1,000 | 1,015 | ||
Nassau County Indl. Dev. Agcy. Civic Facility Rev. (North Shore Health Sys. Proj.): | ||||
Series 2001 A, 5.875% 11/1/11 | 30 | 31 | ||
Series 2001 B, 5.875% 11/1/11 | 190 | 195 | ||
New York City Gen. Oblig.: | ||||
Series 1997 B, 6.5% 8/15/11 | 1,000 | 1,032 | ||
Series 2000 A, 6.5% 5/15/11 | 195 | 198 | ||
Series 2001 G, 5.25% 8/1/14 (AMBAC Insured) | 1,635 | 1,656 | ||
Series 2003 A: | ||||
5.5% 8/1/20 (Nat'l. Pub. Fin. Guarantee Corp. Insured) | 6,110 | 6,543 | ||
Municipal Bonds - continued | ||||
| Principal Amount (000s) | Value (000s) | ||
New York - continued | ||||
New York City Gen. Oblig.: - continued | ||||
Series 2003 A: | ||||
5.5% 8/1/20 (Pre-Refunded to 8/1/13 @ 100) (c) | $ 45 | $ 50 | ||
Series 2005 F, 5.25% 8/1/12 | 2,000 | 2,027 | ||
Series 2005 O, 5% 6/1/22 | 5,000 | 5,213 | ||
Series 2006 A, 5% 8/1/19 | 3,000 | 3,217 | ||
Series 2006 I1, 5% 4/1/23 (Nat'l. Pub. Fin. Guarantee Corp. Insured) | 2,395 | 2,486 | ||
Series 2008 A1, 5.25% 8/15/27 | 15,000 | 15,327 | ||
Series 2008 D1, 5.125% 12/1/23 | 5,000 | 5,345 | ||
New York City Health & Hosp. Corp. Rev. Series 2008 A, 5.5% 2/15/21 | 5,000 | 5,358 | ||
New York City Indl. Dev. Agcy. Civic Facility Rev. (Spence School, Inc. Proj.) Series 2002, 5% 7/1/27 | 3,255 | 3,269 | ||
New York City Muni. Wtr. Fin. Auth. Wtr. & Swr. Sys. Rev.: | ||||
Series 2001 C, 5.125% 6/15/33 | 3,960 | 3,961 | ||
Series 2002 A: | ||||
5% 6/15/32 | 5,000 | 5,001 | ||
5.125% 6/15/34 | 16,500 | 16,537 | ||
Series 2002 G: | ||||
5.125% 6/15/32 | 3,000 | 3,000 | ||
5.125% 6/15/32 (FGIC Insured) | 4,750 | 4,751 | ||
Series 2003 A, 5.125% 6/15/34 | 4,200 | 4,209 | ||
Series 2003 E: | ||||
5% 6/15/34 | 2,000 | 1,967 | ||
5% 6/15/38 | 2,975 | 2,859 | ||
Series 2005 D: | ||||
5% 6/15/37 | 16,090 | 15,608 | ||
5% 6/15/38 | 20,050 | 19,410 | ||
5% 6/15/39 | 3,755 | 3,628 | ||
5% 6/15/39 | 2,800 | 2,705 | ||
Series 2007 DD: | ||||
4.75% 6/15/35 | 3,000 | 2,777 | ||
4.75% 6/15/36 | 1,000 | 923 | ||
Series 2008 AA, 5% 6/15/27 | 10,000 | 10,207 | ||
Series 2009 A, 5.75% 6/15/40 | 10,025 | 10,464 | ||
Series 2009 DD, 6% 6/15/40 | 1,115 | 1,184 | ||
Series 2009 EE, 5.25% 6/15/40 | 6,500 | 6,526 | ||
Series 2009 GG1, 5.25% 6/15/32 | 5,000 | 5,088 | ||
Series FF 2, 5.5% 6/15/40 | 9,295 | 9,494 | ||
Series GG, 5.25% 6/15/40 | 10,000 | 9,955 | ||
Municipal Bonds - continued | ||||
| Principal Amount (000s) | Value (000s) | ||
New York - continued | ||||
New York City Transitional Fin. Auth. Bldg. Aid Rev.: | ||||
Series 2007 S1, 5% 7/15/36 | $ 3,000 | $ 2,895 | ||
Series 2008 S1, 5% 1/15/34 | 10,000 | 9,707 | ||
Series 2009 S1: | ||||
5.5% 7/15/31 | 5,000 | 5,132 | ||
5.5% 7/15/38 | 2,900 | 2,958 | ||
5.625% 7/15/38 | 2,900 | 2,981 | ||
Series 2009 S2, 6% 7/15/38 | 7,500 | 7,881 | ||
Series 2009 S3: | ||||
5.25% 1/15/26 | 1,000 | 1,023 | ||
5.25% 1/15/39 | 3,400 | 3,385 | ||
5.375% 1/15/34 | 13,435 | 13,577 | ||
Series 2009 S4: | ||||
5.5% 1/15/34 | 1,000 | 1,025 | ||
5.5% 1/15/39 | 6,700 | 6,838 | ||
5.75% 1/15/39 | 2,900 | 3,007 | ||
Series 2009 S5, 5.25% 1/15/39 | 10,180 | 10,135 | ||
New York City Transitional Fin. Auth. Rev.: | ||||
Series 2002 A, 5.375% 11/15/21 | 1,100 | 1,162 | ||
Series 2003 D: | ||||
5% 2/1/31 | 20,025 | 20,051 | ||
5.25% 2/1/17 (Nat'l. Pub. Fin. Guarantee Corp. Insured) | 9,385 | 10,089 | ||
Series 2004 B: | ||||
5% 8/1/32 | 5,000 | 5,000 | ||
5.25% 8/1/19 | 2,810 | 3,056 | ||
Series 2004 C: | ||||
5% 2/1/28 | 15,000 | 15,124 | ||
5% 2/1/33 (FGIC Insured) | 7,350 | 7,292 | ||
Series A, 5.5% 11/15/17 (FGIC Insured) | 6,725 | 7,188 | ||
Series D: | ||||
5.25% 2/1/19 | 7,050 | 7,501 | ||
5.25% 2/1/20 (Nat'l. Pub. Fin. Guarantee Corp. Insured) | 4,185 | 4,445 | ||
New York City Trust Cultural Resources Rev.: | ||||
(Carnegie Hall Proj.) Series 2009 A, 5% 12/1/39 | 23,090 | 21,907 | ||
(Museum of Modern Art Proj.) Series 2001 D, 5.125% 7/1/31 | 3,200 | 3,204 | ||
Bonds (The Juilliard School Proj.) Series 2009 B, 2.75%, tender 7/1/12 (a) | 4,000 | 4,080 | ||
New York Convention Ctr. Dev. Corp. Rev. Series 2005, 5% 11/15/44 | 30,000 | 27,083 | ||
Municipal Bonds - continued | ||||
| Principal Amount (000s) | Value (000s) | ||
New York - continued | ||||
New York Dorm. Auth. Personal Income Tax Rev.: | ||||
(Ed. Proj.): | ||||
Series 2006 D: | ||||
5% 3/15/20 | $ 3,500 | $ 3,753 | ||
5% 3/15/36 | 3,320 | 3,250 | ||
Series 2007 A, 5% 3/15/37 | 1,700 | 1,661 | ||
Series 2008 B: | ||||
5.25% 3/15/38 | 1,500 | 1,513 | ||
5.75% 3/15/36 | 10,500 | 11,055 | ||
Series 2006 C: | ||||
5% 12/15/22 | 4,305 | 4,535 | ||
5% 12/15/31 | 10,000 | 10,015 | ||
Series 2007 A, 5% 3/15/32 | 3,700 | 3,681 | ||
Series 2008 A, 5% 3/15/24 | 5,000 | 5,212 | ||
Series 2009 A: | ||||
5% 2/15/34 | 15,500 | 15,250 | ||
5.25% 2/15/23 | 7,940 | 8,588 | ||
Series A, 5% 2/15/39 | 20,355 | 19,816 | ||
New York Dorm. Auth. Revs.: | ||||
(City Univ. Sys. Consolidation Proj.) Series A: | ||||
5.75% 7/1/13 | 4,800 | 5,058 | ||
5.75% 7/1/13 (AMBAC Insured) | 2,390 | 2,519 | ||
(Colgate Univ. Proj.) Series 1996: | ||||
6% 7/1/16 (Nat'l. Pub. Fin. Guarantee Corp. Insured) | 1,900 | 2,123 | ||
6% 7/1/21 (Nat'l. Pub. Fin. Guarantee Corp. Insured) | 2,500 | 2,875 | ||
(Cornell Univ. Proj.): | ||||
Series 2008 C: | ||||
5% 7/1/29 | 2,015 | 2,054 | ||
5% 7/1/37 | 6,000 | 5,948 | ||
Series 2009 A: | ||||
5% 7/1/22 | 445 | 482 | ||
5% 7/1/23 | 1,315 | 1,406 | ||
(Marymount Manhattan College Proj.) Series 2009: | ||||
5% 7/1/15 | 1,350 | 1,437 | ||
5% 7/1/17 | 2,080 | 2,193 | ||
(Mental Health Svcs. Proj.) Series 2005 E, 5% 2/15/22 (Nat'l. Pub. Fin. Guarantee Corp. Insured) | 5,115 | 5,267 | ||
(Montefiore Med. Ctr. Proj.) Series 2000: | ||||
5.8% 8/1/30 | 2,035 | 2,045 | ||
5.85% 8/1/40 | 9,500 | 9,555 | ||
Municipal Bonds - continued | ||||
| Principal Amount (000s) | Value (000s) | ||
New York - continued | ||||
New York Dorm. Auth. Revs.: - continued | ||||
(New York City Court Facilities Lease Proj.) Series 2005 A: | ||||
5.5% 5/15/20 | $ 13,000 | $ 14,277 | ||
5.5% 5/15/21 (AMBAC Insured) | 10,000 | 10,953 | ||
5.5% 5/15/28 | 2,700 | 2,739 | ||
(New York City Gen. Oblig. Proj.) Series B, 6% 7/1/14 | 1,820 | 1,974 | ||
(New York Univ. Hosp. Ctr. Proj.): | ||||
Series 2006 A: | ||||
5% 7/1/13 | 1,930 | 2,057 | ||
5% 7/1/14 | 2,510 | 2,695 | ||
5% 7/1/16 | 1,130 | 1,210 | ||
5% 7/1/20 | 2,000 | 2,011 | ||
Series 2007 A: | ||||
5% 7/1/11 | 1,365 | 1,385 | ||
5% 7/1/12 | 1,530 | 1,599 | ||
Series 2007 B, 5.25% 7/1/24 | 100 | 97 | ||
Series 2011 A: | ||||
5.75% 7/1/31 | 4,000 | 3,815 | ||
6% 7/1/40 | 4,000 | 3,840 | ||
(New York Univ. Proj.): | ||||
Series 2001 1, 5.5% 7/1/40 (AMBAC Insured) | 3,000 | 3,101 | ||
Series 2001 2: | ||||
5.5% 7/1/17 (AMBAC Insured) | 755 | 764 | ||
5.5% 7/1/19 (AMBAC Insured) | 1,705 | 1,724 | ||
5.5% 7/1/20 (AMBAC Insured) | 860 | 869 | ||
Series 2008 A, 5.25% 7/1/48 | 11,930 | 11,756 | ||
Series 2008 B, 5.25% 7/1/48 | 8,000 | 7,884 | ||
(North Shore - Long Island Jewish Obligated Group Proj.) Series 2009 A, 5.5% 5/1/37 | 8,085 | 7,666 | ||
(North Shore Univ. Hosp. Proj.): | ||||
Series 2007 A: | ||||
5% 5/1/19 | 2,000 | 2,035 | ||
5% 5/1/21 | 1,315 | 1,318 | ||
Series 1998, 5.5% 11/1/14 (Nat'l. Pub. Fin. Guarantee Corp. Insured) | 1,500 | 1,635 | ||
(Orange Reg'l. Med. Ctr. Proj.) Series 2008: | ||||
5.5% 12/1/12 | 3,125 | 3,192 | ||
6.125% 12/1/29 | 1,000 | 961 | ||
(Rochester Institute of Technology Proj.) Series 2010: | ||||
5% 7/1/20 | 1,000 | 1,073 | ||
Municipal Bonds - continued | ||||
| Principal Amount (000s) | Value (000s) | ||
New York - continued | ||||
New York Dorm. Auth. Revs.: - continued | ||||
(Rochester Institute of Technology Proj.) Series 2010: | ||||
5% 7/1/21 | $ 1,500 | $ 1,590 | ||
(Rockefeller Univ. Proj.) Series 2009 C, 5% 7/1/40 | 15,000 | 14,840 | ||
(School District Fing. Prog.): | ||||
Series 2002 D, 5.5% 10/1/17 (Nat'l. Pub. Fin. Guarantee Corp. Insured) | 10,825 | 11,413 | ||
Series 2002 E, 5.75% 10/1/22 (Nat'l. Pub. Fin. Guarantee Corp. Insured) | 1,485 | 1,545 | ||
Series 2002 H, 5.5% 10/1/17 (Nat'l. Pub. Fin. Guarantee Corp. Insured) | 2,600 | 2,741 | ||
Series 2002 I, 5.75% 10/1/18 (Nat'l. Pub. Fin. Guarantee Corp. Insured) | 500 | 529 | ||
(St. John's Univ. Proj.) Series 2007 A, 5.25% 7/1/37 (Nat'l. Pub. Fin. Guarantee Corp. Insured) | 18,915 | 18,107 | ||
(St. Lawrence Univ.) Series 2008, 5% 7/1/14 | 7,000 | 7,605 | ||
(State Univ. Edl. Facilities Proj.) Series A, 5.25% 5/15/15 (Nat'l. Pub. Fin. Guarantee Corp. Insured) | 8,855 | 9,832 | ||
(Teachers College Proj.) Series 2009: | ||||
5.375% 3/1/29 | 2,000 | 2,018 | ||
5.5% 3/1/39 | 2,500 | 2,482 | ||
(Univ. of Rochester Proj.) Series 2007 A1: | ||||
5% 7/1/18 | 3,000 | 3,233 | ||
5% 7/1/39 | 19,005 | 17,854 | ||
(Vassar College Proj.) Series 2010, 5% 7/1/49 | 9,000 | 8,310 | ||
(Winthrop-South Nassau Univ. Health Sys. Oblig. Group Proj.) Series 2003 A: | ||||
6% 7/1/14 | 1,095 | 1,148 | ||
6% 7/1/15 | 1,160 | 1,212 | ||
6% 7/1/16 | 1,230 | 1,280 | ||
(Yeshiva Univ. Proj.) Series 2001: | ||||
5.375% 7/1/16 (AMBAC Insured) | 670 | 678 | ||
5.375% 7/1/17 (AMBAC Insured) | 370 | 374 | ||
Bonds Series 2002 B: | ||||
5.25%, tender 5/15/12 (a) | 10,415 | 10,933 | ||
6%, tender 5/15/12 (a) | 11,000 | 11,651 | ||
Series 2002 A, 5.75% 10/1/17 (Nat'l. Pub. Fin. Guarantee Corp. Insured) | 30,260 | 32,071 | ||
Series 2002 B: | ||||
6% 10/1/22 (Nat'l. Pub. Fin. Guarantee Corp. Insured) | 2,775 | 2,879 | ||
6% 10/1/29 (Nat'l. Pub. Fin. Guarantee Corp. Insured) | 5,600 | 5,760 | ||
Municipal Bonds - continued | ||||
| Principal Amount (000s) | Value (000s) | ||
New York - continued | ||||
New York Dorm. Auth. Revs.: - continued | ||||
Series 2005 B: | ||||
5.25% 7/1/20 (Nat'l. Pub. Fin. Guarantee Corp. Insured) | $ 3,345 | $ 3,518 | ||
5.25% 7/1/21 (Nat'l. Pub. Fin. Guarantee Corp. Insured) | 1,745 | 1,824 | ||
5.25% 7/1/22 (Nat'l. Pub. Fin. Guarantee Corp. Insured) | 1,835 | 1,912 | ||
Series 2005 F, 5% 3/15/35 (FSA Insured) | 5,000 | 5,020 | ||
Series 2010 A: | ||||
5% 7/1/19 | 1,500 | 1,586 | ||
5% 7/1/21 | 7,000 | 7,196 | ||
5% 7/1/22 | 6,000 | 6,076 | ||
Series 2010, 5% 7/1/41 | 12,000 | 11,833 | ||
New York Envir. Facilities Corp. Clean Wtr. & Drinking Wtr.: | ||||
(New York City Muni. Wtr. Fin. Auth. Proj.): | ||||
Series 2002 B, 5.25% 6/15/16 | 500 | 529 | ||
Series 2002 D, 5.125% 6/15/31 | 6,900 | 6,940 | ||
Series 2002 G, 5.25% 10/15/20 | 1,255 | 1,272 | ||
Series 2004 F, 5% 6/15/34 | 4,825 | 4,847 | ||
Series 2003 I, 5% 6/15/24 | 2,000 | 2,088 | ||
Series 2004 D, 5% 2/15/34 | 12,150 | 12,208 | ||
New York Envir. Facilities Corp. Poll. Cont. Rev.: | ||||
(New York City Muni. Wtr. Fin. Auth. Proj.): | ||||
Series 1996 C, 5.85% 7/15/15 | 30 | 30 | ||
Series A, 7% 6/15/12 | 190 | 191 | ||
Series E, 6.5% 6/15/14 | 130 | 131 | ||
(Pooled Ln. Prog.) Series 1993 B, 5.2% 5/15/14 | 1,115 | 1,181 | ||
New York Hsg. Fin. Agcy. Personal Income Tax Rev. (Econ. Dev. & Hsg. Proj.) Series 2008 A, 5% 3/15/34 | 10,000 | 9,838 | ||
New York Metropolitan Trans. Auth. Dedicated Tax Fund Rev.: | ||||
Series 2002 A, 5.5% 11/15/26 | 13,575 | 13,737 | ||
Series 2009 A: | ||||
5.5% 11/15/39 | 10,400 | 10,544 | ||
5.625% 11/15/39 | 6,000 | 6,130 | ||
Series B, 5% 11/15/34 | 19,560 | 18,847 | ||
New York Metropolitan Trans. Auth. Rev.: | ||||
Series 2002 A, 5.75% 11/15/32 | 10,000 | 10,060 | ||
Series 2003 A, 5.5% 11/15/19 (FGIC Insured) | 5,000 | 5,610 | ||
Municipal Bonds - continued | ||||
| Principal Amount (000s) | Value (000s) | ||
New York - continued | ||||
New York Metropolitan Trans. Auth. Rev.: - continued | ||||
Series 2003 B, 5.25% 11/15/18 (Nat'l. Pub. Fin. Guarantee Corp. Insured) | $ 4,000 | $ 4,167 | ||
Series 2005 A, 5.5% 11/15/18 (AMBAC Insured) | 2,000 | 2,254 | ||
Series 2005 B, 5% 11/15/35 (Nat'l. Pub. Fin. Guarantee Corp. Insured) | 3,300 | 3,038 | ||
Series 2007 B: | ||||
5% 11/15/26 | 8,185 | 7,932 | ||
5% 11/15/28 | 2,235 | 2,090 | ||
Series 2008 A, 5.25% 11/15/36 | 15,000 | 14,485 | ||
Series 2008 C, 6.5% 11/15/28 | 9,445 | 10,190 | ||
New York Pwr. Auth.: | ||||
Series 2000 A, 5.25% 11/15/40 | 25,860 | 25,742 | ||
Series 2007 A, 5% 11/15/47 (Nat'l. Pub. Fin. Guarantee Corp. Insured) | 20,000 | 18,756 | ||
New York Sales Tax Asset Receivables Corp. Series 2005 A, 5.25% 10/15/27 (AMBAC Insured) | 4,355 | 4,472 | ||
New York State Dorm. Auth. Lease Rev. Bonds Series 2003 B, 5.25%, tender 7/1/13 (XL Cap. Assurance, Inc. Insured) (a) | 10,000 | 10,791 | ||
New York State Energy Research & Dev. Auth. Facilities Rev. Bonds (Consolidated Edison Co. of New York, Inc. Proj.) Series 2010 A, 1.45%, tender 11/1/12 (a)(b) | 11,800 | 11,771 | ||
New York State Gen. Oblig. Series 2009 A, 0% 2/15/19 | 2,835 | 2,142 | ||
New York Thruway Auth. Gen. Rev.: | ||||
Series 2005 G: | ||||
5% 1/1/32 (FSA Insured) | 2,800 | 2,664 | ||
5.25% 1/1/27 | 6,570 | 6,621 | ||
Series 2007 H: | ||||
5% 1/1/21 | 5,755 | 5,986 | ||
5% 1/1/25 | 13,000 | 13,037 | ||
5% 1/1/26 | 4,000 | 3,983 | ||
New York Thruway Auth. Hwy. & Bridge Trust Fund: | ||||
Series 2005 B: | ||||
5% 4/1/17 (Nat'l. Pub. Fin. Guarantee Corp. Insured) | 9,660 | 10,596 | ||
5.5% 4/1/20 (AMBAC Insured) | 27,375 | 31,150 | ||
Series 2007 B, 5% 4/1/27 | 6,750 | 6,799 | ||
New York Thruway Auth. Personal Income Tax Rev. Series 2007 A: | ||||
5.25% 3/15/24 | 4,180 | 4,431 | ||
5.25% 3/15/25 | 8,000 | 8,363 | ||
Municipal Bonds - continued | ||||
| Principal Amount (000s) | Value (000s) | ||
New York - continued | ||||
New York Thruway Auth. Personal Income Tax Rev. Series 2007 A: - continued | ||||
5.25% 3/15/26 | $ 12,080 | $ 12,565 | ||
New York Urban Dev. Corp. Rev.: | ||||
(Econ. Dev. and Hsg. Proj.) Series 2008 A1, 5% 12/15/26 | 10,000 | 10,239 | ||
(State Facilities and Equip. Proj.) Series 2004 A2, 5.5% 3/15/22 (Nat'l. Pub. Fin. Guarantee Corp. Insured) | 4,000 | 4,546 | ||
Series 2007 A: | ||||
5% 1/1/23 (FSA Insured) | 6,165 | 6,477 | ||
5% 1/1/24 (FSA Insured) | 5,975 | 6,223 | ||
Niagara Falls City Niagara County Pub. Impt. Series 1994: | ||||
7.5% 3/1/11 (Escrowed to Maturity) (c) | 105 | 106 | ||
7.5% 3/1/16 (Escrowed to Maturity) (c) | 90 | 115 | ||
7.5% 3/1/16 (Nat'l. Pub. Fin. Guarantee Corp. Insured) | 970 | 1,149 | ||
7.5% 3/1/17 (Escrowed to Maturity) (c) | 100 | 130 | ||
7.5% 3/1/17 (Nat'l. Pub. Fin. Guarantee Corp. Insured) | 1,100 | 1,314 | ||
Niagara Falls Pub. Wtr. Auth. Series 2005, 5.5% 7/15/34 (XL Cap. Assurance, Inc. Insured) | 1,000 | 934 | ||
Oneida County Indl. Dev. Agcy. (Hamilton College Proj.) Series 2002, 5% 9/15/32 | 5,000 | 4,903 | ||
Saratoga County Indl. Dev. Agcy. (The Saratoga Hosp. Proj.) Series 2007 B, 5.25% 12/1/32 | 680 | 605 | ||
Schenectady Indl. Dev. Agcy. Civic Facility Rev. (Union College Proj.) Series 2006, 5% 7/1/15 | 1,005 | 1,109 | ||
Suffolk County Indl. Dev. Agcy. Civic Facility Rev. (Huntington Hosp. Proj.) Series 2002 B, 6% 11/1/22 | 4,305 | 4,371 | ||
Taconic Hills Central School District at Craryville Series 2002, 5% 6/15/16 (FGIC Insured) | 1,130 | 1,166 | ||
Tobacco Settlement Fing. Corp.: | ||||
Series 2003 A1: | ||||
5.25% 6/1/21 (AMBAC Insured) | 3,255 | 3,358 | ||
5.25% 6/1/22 (AMBAC Insured) | 8,070 | 8,270 | ||
5.5% 6/1/14 | 3,330 | 3,342 | ||
5.5% 6/1/15 | 2,980 | 2,991 | ||
5.5% 6/1/16 | 17,500 | 17,558 | ||
5.5% 6/1/17 | 7,000 | 7,064 | ||
5.5% 6/1/18 (Nat'l. Pub. Fin. Guarantee Corp. Insured) | 3,000 | 3,096 | ||
Municipal Bonds - continued | ||||
| Principal Amount (000s) | Value (000s) | ||
New York - continued | ||||
Tobacco Settlement Fing. Corp.: - continued | ||||
Series 2003 A1: | ||||
5.5% 6/1/19 | $ 4,600 | $ 4,825 | ||
Series 2003B 1C: | ||||
5.5% 6/1/14 | 4,495 | 4,512 | ||
5.5% 6/1/15 | 11,800 | 11,842 | ||
5.5% 6/1/16 | 10,040 | 10,172 | ||
5.5% 6/1/17 | 5,700 | 5,752 | ||
5.5% 6/1/18 | 3,800 | 3,922 | ||
5.5% 6/1/19 | 13,620 | 14,285 | ||
5.5% 6/1/20 | 16,000 | 16,720 | ||
5.5% 6/1/21 | 12,070 | 12,572 | ||
5.5% 6/1/22 | 9,700 | 10,037 | ||
Triborough Bridge & Tunnel Auth. Revs.: | ||||
(MTA Bridges and Tunnels Proj.): | ||||
Series 2006 A, 5% 11/15/31 | 4,375 | 4,363 | ||
Series 2007 A, 5% 11/15/27 | 6,410 | 6,539 | ||
Series 2008 A: | ||||
5% 11/15/37 | 17,500 | 16,849 | ||
5.25% 11/15/38 | 14,500 | 14,525 | ||
Series 2001 A: | ||||
5% 1/1/32 | 3,010 | 2,956 | ||
5% 1/1/32 (Nat'l. Pub. Fin. Guarantee Corp. Insured) | 1,455 | 1,429 | ||
Series 2002 A, 5.25% 1/1/19 | 1,100 | 1,124 | ||
Troy Cap. Resource Corp. Rev. (Rensselaer Polytechnic Institute Proj.) Series 2010 A: | ||||
5% 9/1/30 | 5,000 | 4,685 | ||
5.125% 9/1/40 | 8,055 | 7,344 | ||
Yonkers Gen. Oblig. Series 2005 A, 5% 8/1/15 (Nat'l. Pub. Fin. Guarantee Corp. Insured) | 4,000 | 4,310 | ||
Yonkers Indl. Dev. Agcy. Civic Facility Rev. (Sarah Lawrence College Proj.) Series A: | ||||
6% 6/1/29 | 1,130 | 1,162 | ||
6% 6/1/41 | 5,000 | 4,972 | ||
| 1,568,501 | |||
New York & New Jersey - 4.4% | ||||
Port Auth. of New York & New Jersey: | ||||
124th Series, 5% 8/1/13 (FGIC Insured) (b) | 3,000 | 3,006 | ||
126th Series, 5.25% 5/15/37 (FGIC Insured) (b) | 4,175 | 4,053 | ||
134th Series, 5% 1/15/39 | 10,000 | 9,735 | ||
136th Series, 5.25% 11/1/16 (b) | 4,510 | 4,948 | ||
Municipal Bonds - continued | ||||
| Principal Amount (000s) | Value (000s) | ||
New York & New Jersey - continued | ||||
Port Auth. of New York & New Jersey: - continued | ||||
141st Series: | ||||
5% 9/1/18 (b) | $ 6,045 | $ 6,420 | ||
5% 9/1/21 (CIFG North America Insured) (b) | 4,600 | 4,818 | ||
147th Series, 5% 10/15/17 (b) | 5,000 | 5,441 | ||
163rd Series, 5% 7/15/35 | 25,000 | 24,584 | ||
85th Series, 5.375% 3/1/28 | 6,280 | 6,630 | ||
Port Auth. of New York & New Jersey Spl. Oblig. Rev. (JFK Int'l. Air Term. Spl. Proj.) Series 6, 6.25% 12/1/15 (Nat'l. Pub. Fin. Guarantee Corp. Insured) (b) | 5,000 | 5,234 | ||
| 74,869 | |||
Puerto Rico - 1.5% | ||||
Puerto Rico Commonwealth Hwy. & Trans. Auth. Trans. Rev. Series 1998, 5.75% 7/1/22 (CIFG North America Insured) | 3,000 | 2,975 | ||
Puerto Rico Commonwealth Infrastructure Fing. Auth. Series 2005 C, 5.5% 7/1/27 | 1,000 | 942 | ||
Puerto Rico Commonwealth Pub. Impt. Gen. Oblig.: | ||||
(Pub. Impt. Proj.) Series 2002 A, 5.5% 7/1/20 (Nat'l. Pub. Fin. Guarantee Corp. Insured) | 4,150 | 4,217 | ||
Series 2007 A, 5.5% 7/1/19 (Nat'l. Pub. Fin. Guarantee Corp. Insured) | 5,000 | 5,149 | ||
Puerto Rico Elec. Pwr. Auth. Pwr. Rev. Series QQ: | ||||
5.25% 7/1/13 (XL Cap. Assurance, Inc. Insured) | 1,500 | 1,608 | ||
5.5% 7/1/16 (XL Cap. Assurance, Inc. Insured) | 1,000 | 1,098 | ||
Puerto Rico Muni. Fin. Agcy. Series 2005 C, 5.25% 8/1/17 (FSA Insured) | 1,000 | 1,073 | ||
Puerto Rico Sales Tax Fing. Corp. Sales Tax Rev.: | ||||
Series 2007 A: | ||||
0% 8/1/41 (FGIC Insured) | 33,500 | 4,147 | ||
0% 8/1/45 (Nat'l. Pub. Fin. Guarantee Corp. Insured) | 1,650 | 154 | ||
0% 8/1/47 (AMBAC Insured) | 2,400 | 194 | ||
Series 2009 A, 6% 8/1/42 | 2,900 | 2,888 | ||
| 24,445 | |||
Municipal Bonds - continued | ||||
| Principal Amount (000s) | Value (000s) | ||
Virgin Islands - 0.4% | ||||
Virgin Islands Pub. Fin. Auth. Series 2009 B: | ||||
5% 10/1/16 | $ 4,000 | $ 4,242 | ||
5% 10/1/17 | 2,750 | 2,894 | ||
| 7,136 | |||
TOTAL INVESTMENT PORTFOLIO - 98.8% (Cost $1,697,611) | 1,674,951 | ||
NET OTHER ASSETS (LIABILITIES) - 1.2% | 20,490 | ||
NET ASSETS - 100% | $ 1,695,441 | ||
Legend |
(a) Coupon rates for floating and adjustable rate securities reflect the rates in effect at period end. |
(b) Private activity obligations whose interest is subject to the federal alternative minimum tax for individuals. |
(c) Security collateralized by an amount sufficient to pay interest and principal. |
Other Information |
All investments are categorized as Level 2 under the Fair Value Hierarchy. The inputs or methodology used for valuing securities may not be an indication of the risk associated with investing in those securities. For more information on valuation inputs, please refer to the Security Valuation section in the accompanying Notes to Financial Statements. |
The distribution of municipal securities by revenue source, as a percentage of total net assets, is as follows (Unaudited): |
General Obligations | 29.6% |
Special Tax | 20.6% |
Transportation | 13.7% |
Education | 12.4% |
Water & Sewer | 10.1% |
Electric Utilities | 5.8% |
Others* (Individually Less Than 5%) | 7.8% |
| 100.0% |
*Includes net other assets |
See accompanying notes which are an integral part of the financial statements.
Annual Report
Financial Statements
Statement of Assets and Liabilities
Amounts in thousands (except per-share amounts) | January 31, 2011 | |
|
|
|
Assets | ||
Investment in securities, at value - See accompanying schedule: Unaffiliated issuers (cost $1,697,611) |
| $ 1,674,951 |
Cash | 3,577 | |
Receivable for fund shares sold | 3,500 | |
Interest receivable | 18,861 | |
Prepaid expenses | 4 | |
Other receivables | 3 | |
Total assets | 1,700,896 | |
|
|
|
Liabilities | ||
Payable for fund shares redeemed | $ 3,020 | |
Distributions payable | 1,530 | |
Accrued management fee | 528 | |
Distribution and service plan fees payable | 39 | |
Other affiliated payables | 288 | |
Other payables and accrued expenses | 50 | |
Total liabilities | 5,455 | |
|
|
|
Net Assets | $ 1,695,441 | |
Net Assets consist of: |
| |
Paid in capital | $ 1,714,053 | |
Undistributed net investment income | 84 | |
Accumulated undistributed net realized gain (loss) on investments | 3,964 | |
Net unrealized appreciation (depreciation) on investments | (22,660) | |
Net Assets | $ 1,695,441 | |
See accompanying notes which are an integral part of the financial statements.
Annual Report
Statement of Assets and Liabilities - continued
Amounts in thousands (except per-share amounts) | January 31, 2011 | |
|
|
|
Calculation of Maximum Offering Price | $ 12.48 | |
|
|
|
Maximum offering price per share (100/96.00 of $12.48) | $ 13.00 | |
Class T: | $ 12.49 | |
|
|
|
Maximum offering price per share (100/96.00 of $12.49) | $ 13.01 | |
Class B: | $ 12.48 | |
|
|
|
Class C: | $ 12.48 | |
|
|
|
|
|
|
New York Municipal Income: | $ 12.49 | |
|
|
|
Institutional Class: | $ 12.47 | |
A Redemption price per share is equal to net asset value less any applicable contingent deferred sales charge.
See accompanying notes which are an integral part of the financial statements.
Annual Report
Financial Statements - continued
Statement of Operations
Amounts in thousands | Year ended January 31, 2011 | |
|
|
|
Investment Income |
|
|
Interest |
| $ 81,775 |
|
|
|
Expenses | ||
Management fee | $ 6,984 | |
Transfer agent fees | 1,408 | |
Distribution and service plan fees | 487 | |
Accounting fees and expenses | 349 | |
Custodian fees and expenses | 27 | |
Independent trustees' compensation | 7 | |
Registration fees | 88 | |
Audit | 58 | |
Legal | 11 | |
Miscellaneous | 22 | |
Total expenses before reductions | 9,441 | |
Expense reductions | (24) | 9,417 |
Net investment income | 72,358 | |
Realized and Unrealized Gain (Loss) Net realized gain (loss) on: | ||
Investment securities: |
|
|
Unaffiliated issuers |
| 6,167 |
Change in net unrealized appreciation (depreciation) on investment securities | (58,519) | |
Net gain (loss) | (52,352) | |
Net increase (decrease) in net assets resulting from operations | $ 20,006 | |
See accompanying notes which are an integral part of the financial statements.
Annual Report
Statement of Changes in Net Assets
Amounts in thousands | Year ended | Year ended |
Increase (Decrease) in Net Assets |
|
|
Operations |
|
|
Net investment income | $ 72,358 | $ 65,029 |
Net realized gain (loss) | 6,167 | (912) |
Change in net unrealized appreciation (depreciation) | (58,519) | 74,634 |
Net increase (decrease) in net assets resulting | 20,006 | 138,751 |
Distributions to shareholders from net investment income | (72,377) | (65,025) |
Distributions to shareholders from net realized gain | (296) | - |
Total distributions | (72,673) | (65,025) |
Share transactions - net increase (decrease) | (81,293) | 268,343 |
Redemption fees | 32 | 40 |
Total increase (decrease) in net assets | (133,928) | 342,109 |
|
|
|
Net Assets | ||
Beginning of period | 1,829,369 | 1,487,260 |
End of period (including undistributed net investment income of $84 and undistributed net investment income of $103, respectively) | $ 1,695,441 | $ 1,829,369 |
See accompanying notes which are an integral part of the financial statements.
Annual Report
Financial Highlights - Class A
Years ended January 31, | 2011 | 2010 | 2009 | 2008 | 2007 |
Selected Per-Share Data |
|
|
|
|
|
Net asset value, beginning of period | $ 12.83 | $ 12.27 | $ 12.80 | $ 12.70 | $ 12.81 |
Income from Investment Operations |
|
|
|
|
|
Net investment income C | .459 | .454 | .449 | .446 | .464 |
Net realized and unrealized gain (loss) | (.347) | .560 | (.521) | .134 | .002 |
Total from investment operations | .112 | 1.014 | (.072) | .580 | .466 |
Distributions from net investment income | (.460) | (.454) | (.451) | (.446) | (.464) |
Distributions from net realized gain | (.002) | - | (.007) | (.034) | (.112) |
Total distributions | (.462) | (.454) | (.458) | (.480) | (.576) |
Redemption fees added to paid in capital C, E | - | - | - | - | - |
Net asset value, end of period | $ 12.48 | $ 12.83 | $ 12.27 | $ 12.80 | $ 12.70 |
Total Return A, B | .79% | 8.39% | (.49)% | 4.67% | 3.72% |
Ratios to Average Net Assets D |
|
|
|
|
|
Expenses before reductions | .75% | .77% | .75% | .73% | .66% |
Expenses net of fee waivers, if any | .75% | .77% | .75% | .73% | .66% |
Expenses net of all reductions | .75% | .77% | .74% | .70% | .63% |
Net investment income | 3.54% | 3.60% | 3.67% | 3.52% | 3.65% |
Supplemental Data |
|
|
|
|
|
Net assets, end of period (in millions) | $ 33 | $ 35 | $ 21 | $ 13 | $ 11 |
Portfolio turnover rate | 10% | 4% | 17% | 13% | 23% |
A Total returns would have been lower had certain expenses not been reduced during the periods shown.
B Total returns do not include the effect of the sales charges.
C Calculated based on average shares outstanding during the period.
D Expense ratios reflect operating expenses of the class. Expenses before reductions do not reflect amounts reimbursed by the investment adviser or reductions from brokerage service arrangements or reductions from other expense offset arrangements and do not represent the amount paid by the class during periods when reimbursements or reductions occur. Expenses net of fee waivers reflect expenses after reimbursement by the investment adviser but prior to reductions from brokerage service arrangements or other expense offset arrangements. Expenses net of all reductions represent the net expenses paid by the class.
E Amount represents less than $.001 per share.
See accompanying notes which are an integral part of the financial statements.
Annual Report
Financial Highlights - Class T
Years ended January 31, | 2011 | 2010 | 2009 | 2008 | 2007 |
Selected Per-Share Data |
|
|
|
|
|
Net asset value, beginning of period | $ 12.84 | $ 12.28 | $ 12.81 | $ 12.71 | $ 12.82 |
Income from Investment Operations |
|
|
|
|
|
Net investment income C | .463 | .459 | .452 | .446 | .455 |
Net realized and unrealized gain (loss) | (.348) | .561 | (.520) | .134 | .001 |
Total from investment operations | .115 | 1.020 | (.068) | .580 | .456 |
Distributions from net investment income | (.463) | (.460) | (.455) | (.446) | (.454) |
Distributions from net realized gain | (.002) | - | (.007) | (.034) | (.112) |
Total distributions | (.465) | (.460) | (.462) | (.480) | (.566) |
Redemption fees added to paid in capital C, E | - | - | - | - | - |
Net asset value, end of period | $ 12.49 | $ 12.84 | $ 12.28 | $ 12.81 | $ 12.71 |
Total Return A, B | .81% | 8.43% | (.46)% | 4.67% | 3.64% |
Ratios to Average Net Assets D |
|
|
|
|
|
Expenses before reductions | .73% | .73% | .72% | .72% | .74% |
Expenses net of fee waivers, if any | .73% | .73% | .72% | .72% | .74% |
Expenses net of all reductions | .73% | .73% | 71% | .70% | .71% |
Net investment income | 3.56% | 3.64% | 3.70% | 3.53% | 3.57% |
Supplemental Data |
|
|
|
|
|
Net assets, end of period (in millions) | $ 8 | $ 9 | $ 8 | $ 5 | $ 4 |
Portfolio turnover rate | 10% | 4% | 17% | 13% | 23% |
A Total returns would have been lower had certain expenses not been reduced during the periods shown.
B Total returns do not include the effect of the sales charges.
C Calculated based on average shares outstanding during the period.
D Expense ratios reflect operating expenses of the class. Expenses before reductions do not reflect amounts reimbursed by the investment adviser or reductions from brokerage service arrangements or reductions from other expense offset arrangements and do not represent the amount paid by the class during periods when reimbursements or reductions occur. Expenses net of fee waivers reflect expenses after reimbursement by the investment adviser but prior to reductions from brokerage service arrangements or other expense offset arrangements. Expenses net of all reductions represent the net expenses paid by the class.
E Amount represents less than $.001 per share.
See accompanying notes which are an integral part of the financial statements.
Annual Report
Financial Highlights - Class B
Years ended January 31, | 2011 | 2010 | 2009 | 2008 | 2007 |
Selected Per-Share Data |
|
|
|
|
|
Net asset value, beginning of period | $ 12.83 | $ 12.26 | $ 12.80 | $ 12.70 | $ 12.81 |
Income from Investment Operations |
|
|
|
|
|
Net investment income C | .376 | .372 | .370 | .358 | .366 |
Net realized and unrealized gain (loss) | (.347) | .571 | (.533) | .134 | .002 |
Total from investment operations | .029 | .943 | (.163) | .492 | .368 |
Distributions from net investment income | (.377) | (.373) | (.370) | (.358) | (.366) |
Distributions from net realized gain | (.002) | - | (.007) | (.034) | (.112) |
Total distributions | (.379) | (.373) | (.377) | (.392) | (.478) |
Redemption fees added to paid in capital C, E | - | - | - | - | - |
Net asset value, end of period | $ 12.48 | $ 12.83 | $ 12.26 | $ 12.80 | $ 12.70 |
Total Return A, B | .15% | 7.79% | (1.23)% | 3.95% | 2.93% |
Ratios to Average Net Assets D |
|
|
|
|
|
Expenses before reductions | 1.40% | 1.42% | 1.41% | 1.42% | 1.43% |
Expenses net of fee waivers, if any | 1.40% | 1.42% | 1.41% | 1.42% | 1.43% |
Expenses net of all reductions | 1.40% | 1.41% | 1.40% | 1.40% | 1.40% |
Net investment income | 2.89% | 2.95% | 3.01% | 2.83% | 2.88% |
Supplemental Data |
|
|
|
|
|
Net assets, end of period (in millions) | $ 4 | $ 6 | $ 7 | $ 8 | $ 9 |
Portfolio turnover rate | 10% | 4% | 17% | 13% | 23% |
A Total returns would have been lower had certain expenses not been reduced during the periods shown.
B Total returns do not include the effect of the contingent deferred sales charge.
C Calculated based on average shares outstanding during the period.
D Expense ratios reflect operating expenses of the class. Expenses before reductions do not reflect amounts reimbursed by the investment adviser or reductions from brokerage service arrangements or reductions from other expense offset arrangements and do not represent the amount paid by the class during periods when reimbursements or reductions occur. Expenses net of fee waivers reflect expenses after reimbursement by the investment adviser but prior to reductions from brokerage service arrangements or other expense offset arrangements. Expenses net of all reductions represent the net expenses paid by the class.
E Amount represents less than $.001 per share.
See accompanying notes which are an integral part of the financial statements.
Annual Report
Financial Highlights - Class C
Years ended January 31, | 2011 | 2010 | 2009 | 2008 | 2007 |
Selected Per-Share Data |
|
|
|
|
|
Net asset value, beginning of period | $ 12.83 | $ 12.27 | $ 12.80 | $ 12.70 | $ 12.81 |
Income from Investment Operations |
|
|
|
|
|
Net investment income C | .358 | .357 | .357 | .347 | .355 |
Net realized and unrealized gain (loss) | (.347) | .560 | (.522) | .134 | .002 |
Total from investment operations | .011 | .917 | (.165) | .481 | .357 |
Distributions from net investment income | (.359) | (.357) | (.358) | (.347) | (.355) |
Distributions from net realized gain | (.002) | - | (.007) | (.034) | (.112) |
Total distributions | (.361) | (.357) | (.365) | (.381) | (.467) |
Redemption fees added to paid in capital C, E | - | - | - | - | - |
Net asset value, end of period | $ 12.48 | $ 12.83 | $ 12.27 | $ 12.80 | $ 12.70 |
Total Return A, B | .01% | 7.57% | (1.24)% | 3.86% | 2.84% |
Ratios to Average Net Assets D |
|
|
|
|
|
Expenses before reductions | 1.53% | 1.54% | 1.51% | 1.51% | 1.52% |
Expenses net of fee waivers, if any | 1.53% | 1.54% | 1.51% | 1.51% | 1.52% |
Expenses net of all reductions | 1.53% | 1.53% | 1.50% | 1.48% | 1.49% |
Net investment income | 2.76% | 2.83% | 2.91% | 2.74% | 2.79% |
Supplemental Data |
|
|
|
|
|
Net assets, end of period (in millions) | $ 32 | $ 29 | $ 19 | $ 16 | $ 16 |
Portfolio turnover rate | 10% | 4% | 17% | 13% | 23% |
A Total returns would have been lower had certain expenses not been reduced during the periods shown.
B Total returns do not include the effect of the contingent deferred sales charge.
C Calculated based on average shares outstanding during the period.
D Expense ratios reflect operating expenses of the class. Expenses before reductions do not reflect amounts reimbursed by the investment adviser or reductions from brokerage service arrangements or reductions from other expense offset arrangements and do not represent the amount paid by the class during periods when reimbursements or reductions occur. Expenses net of fee waivers reflect expenses after reimbursement by the investment adviser but prior to reductions from brokerage service arrangements or other expense offset arrangements. Expenses net of all reductions represent the net expenses paid by the class.
E Amount represents less than $.001 per share.
See accompanying notes which are an integral part of the financial statements.
Annual Report
Financial Highlights - New York Municipal Income
Years ended January 31, | 2011 | 2010 | 2009 | 2008 | 2007 |
Selected Per-Share Data |
|
|
|
|
|
Net asset value, beginning of period | $ 12.83 | $ 12.27 | $ 12.81 | $ 12.71 | $ 12.82 |
Income from Investment Operations |
|
|
|
|
|
Net investment income B | .497 | .491 | .486 | .479 | .488 |
Net realized and unrealized gain (loss) | (.338) | .560 | (.533) | .134 | .001 |
Total from investment operations | .159 | 1.051 | (.047) | .613 | .489 |
Distributions from net investment income | (.497) | (.491) | (.486) | (.479) | (.487) |
Distributions from net realized gain | (.002) | - | (.007) | (.034) | (.112) |
Total distributions | (.499) | (.491) | (.493) | (.513) | (.599) |
Redemption fees added to paid in capital B, D | - | - | - | - | - |
Net asset value, end of period | $ 12.49 | $ 12.83 | $ 12.27 | $ 12.81 | $ 12.71 |
Total Return A | 1.16% | 8.71% | (.29)% | 4.94% | 3.91% |
Ratios to Average Net Assets C |
|
|
|
|
|
Expenses before reductions | .47% | .48% | .47% | .47% | .48% |
Expenses net of fee waivers, if any | .47% | .48% | .47% | .47% | .48% |
Expenses net of all reductions | .47% | .47% | .46% | .44% | .45% |
Net investment income | 3.82% | 3.89% | 3.95% | 3.78% | 3.83% |
Supplemental Data |
|
|
|
|
|
Net assets, end of period (in millions) | $ 1,604 | $ 1,740 | $ 1,428 | $ 1,480 | $ 1,407 |
Portfolio turnover rate | 10% | 4% | 17% | 13% | 23% |
A Total returns would have been lower had certain expenses not been reduced during the periods shown.
B Calculated based on average shares outstanding during the period.
C Expense ratios reflect operating expenses of the class. Expenses before reductions do not reflect amounts reimbursed by the investment adviser or reductions from brokerage service arrangements or reductions from other expense offset arrangements and do not represent the amount paid by the class during periods when reimbursements or reductions occur. Expenses net of fee waivers reflect expenses after reimbursement by the investment adviser but prior to reductions from brokerage service arrangements or other expense offset arrangements. Expenses net of all reductions represent the net expenses paid by the class.
D Amount represents less than $.001 per share.
See accompanying notes which are an integral part of the financial statements.
Annual Report
Financial Highlights - Institutional Class
Years ended January 31, | 2011 | 2010 | 2009 | 2008 | 2007 |
Selected Per-Share Data |
|
|
|
|
|
Net asset value, beginning of period | $ 12.82 | $ 12.26 | $ 12.80 | $ 12.70 | $ 12.81 |
Income from Investment Operations |
|
|
|
|
|
Net investment income B | .487 | .485 | .479 | .479 | .487 |
Net realized and unrealized gain (loss) | (.347) | .561 | (.527) | .133 | .002 |
Total from investment operations | .140 | 1.046 | (.048) | .612 | .489 |
Distributions from net investment income | (.488) | (.486) | (.485) | (.478) | (.487) |
Distributions from net realized gain | (.002) | - | (.007) | (.034) | (.112) |
Total distributions | (.490) | (.486) | (.492) | (.512) | (.599) |
Redemption fees added to paid in capital B, D | - | - | - | - | - |
Net asset value, end of period | $ 12.47 | $ 12.82 | $ 12.26 | $ 12.80 | $ 12.70 |
Total Return A | 1.01% | 8.67% | (.29)% | 4.94% | 3.91% |
Ratios to Average Net Assets C |
|
|
|
|
|
Expenses before reductions | .53% | .52% | .48% | .47% | .48% |
Expenses net of fee waivers, if any | .53% | .52% | .48% | .47% | .48% |
Expenses net of all reductions | .53% | .52% | .47% | .44% | .45% |
Net investment income | 3.76% | 3.85% | 3.94% | 3.78% | 3.83% |
Supplemental Data |
|
|
|
|
|
Net assets, end of period (in millions) | $ 14 | $ 10 | $ 5 | $ 2 | $ 1 |
Portfolio turnover rate | 10% | 4% | 17% | 13% | 23% |
A Total returns would have been lower had certain expenses not been reduced during the periods shown.
B Calculated based on average shares outstanding during the period.
C Expense ratios reflect operating expenses of the class. Expenses before reductions do not reflect amounts reimbursed by the investment adviser or reductions from brokerage service arrangements or reductions from other expense offset arrangements and do not represent the amount paid by the class during periods when reimbursements or reductions occur. Expenses net of fee waivers reflect expenses after reimbursement by the investment adviser but prior to reductions from brokerage service arrangements or other expense offset arrangements. Expenses net of all reductions represent the net expenses paid by the class.
D Amount represents less than $.001 per share.
See accompanying notes which are an integral part of the financial statements.
Annual Report
Notes to Financial Statements
For the period ended January 31, 2011
(Amounts in thousands except ratios)
1. Organization.
Fidelity New York Municipal Income Fund (the Fund) is a non-diversified fund of Fidelity New York Municipal Trust (the Trust) and is authorized to issue an unlimited number of shares. The Trust is registered under the Investment Company Act of 1940, as amended (the 1940 Act), as an open-end management investment company organized as a Massachusetts business trust. The Fund offers Class A, Class T, Class C, New York Municipal Income, and Institutional Class shares, along with Class B shares, each of which has equal rights as to assets and voting privileges. Effective after the close of business on September 1, 2010, Class B shares were closed to new accounts and additional purchases by existing shareholders. Each class has exclusive voting rights with respect to matters that affect that class. Class B shares will automatically convert to Class A shares after a holding period of seven years from the initial date of purchase. Investment income, realized and unrealized capital gains and losses, the common expenses of the Fund, and certain fund-level expense reductions, if any, are allocated on a pro-rata basis to each class based on the relative net assets of each class to the total net assets of the Fund. Each class differs with respect to transfer agent and distribution and service plan fees incurred. Certain expense reductions may also differ by class. The Fund may be affected by economic and political developments in the state of New York.
2. Significant Accounting Policies.
The financial statements have been prepared in conformity with accounting principles generally accepted in the United States of America (GAAP), which require management to make certain estimates and assumptions at the date of the financial statements. Actual results could differ from those estimates. Subsequent events, if any, through the date that the financial statements were issued have been evaluated in the preparation of the financial statements. The following summarizes the significant accounting policies of the Fund:
Security Valuation. Investments are valued as of 4:00 p.m. Eastern time on the last calendar day of the period. The Fund uses independent pricing services approved by the Board of Trustees to value its investments. When current market prices or quotations are not readily available or reliable, valuations may be determined in good faith in accordance with procedures adopted by the Board of Trustees. Factors used in determining value may include market or security specific events, changes in interest rates and credit quality. The frequency with which these procedures are used cannot be predicted and they may be utilized to a significant extent. The value used for net asset value (NAV) calculation under these procedures may differ from published prices for the same securities.
Annual Report
Notes to Financial Statements - continued
(Amounts in thousands except ratios)
2. Significant Accounting Policies - continued
Security Valuation - continued
The Fund categorizes the inputs to valuation techniques used to value its investments into a disclosure hierarchy consisting of three levels as shown below.
Level 1 - quoted prices in active markets for identical investments
Level 2 - other significant observable inputs (including quoted prices for similar investments, interest rates, prepayment speeds, etc.)
Level 3 - unobservable inputs (including the Fund's own assumptions based on the best information available)
Changes in valuation techniques may result in transfers in or out of an assigned level within the disclosure hierarchy. Valuation techniques used to value the Fund's investments by major category are as follows.
Debt securities, including restricted securities, are valued based on evaluated prices received from independent pricing services or from dealers who make markets in such securities. For municipal securities, pricing services utilize matrix pricing which considers yield or price of bonds of comparable quality, coupon, maturity and type as well as dealer supplied prices and are generally categorized as Level 2 in the hierarchy.
When independent prices are unavailable or unreliable, debt securities may be valued utilizing pricing matrices which consider similar factors that would be used by independent pricing services. These are generally categorized as Level 2 in the hierarchy but may be Level 3 depending on the circumstances.
Investment Transactions and Income. For financial reporting purposes, the Fund's investment holdings and NAV include trades executed through the end of the last business day of the period. The NAV per share for processing shareholder transactions is calculated as of the close of business of the New York Stock Exchange (NYSE), normally 4:00 p.m. Eastern time and includes trades executed through the end of the prior business day. Gains and losses on securities sold are determined on the basis of identified cost. Interest income is accrued as earned. Interest income includes coupon interest and amortization of premium and accretion of discount on debt securities.
Annual Report
2. Significant Accounting Policies - continued
Expenses. Expenses directly attributable to a fund are charged to that fund. Expenses attributable to more than one fund are allocated among the respective funds on the basis of relative net assets or other appropriate methods. Expense estimates are accrued in the period to which they relate and adjustments are made when actual amounts are known.
Income Tax Information and Distributions to Shareholders. Each year the Fund intends to qualify as a regulated investment company, including distributing substantially all of its taxable income and realized gains under Subchapter M of the Internal Revenue Code and filing its U.S. federal tax return. As a result, no provision for income taxes is required. As of January 31, 2011, the Fund did not have any unrecognized tax benefits in the accompanying financial statements. A fund's federal tax return is subject to examination by the Internal Revenue Service (IRS) for a period of three years.
Dividends are declared and recorded daily and paid monthly from net investment income. Distributions from realized gains, if any, are declared and recorded on the ex-dividend date. Income dividends and capital gain distributions are declared separately for each class. Income and capital gain distributions are determined in accordance with income tax regulations, which may differ from GAAP. In addition, the Fund claimed a portion of the payment made to redeeming shareholders as a distribution for income tax purposes.
Capital accounts within the financial statements are adjusted for permanent book-tax differences. These adjustments have no impact on net assets or the results of operations. Temporary book-tax differences will reverse in a subsequent period.
Book-tax differences are primarily due to market discount, deferred trustees compensation, capital loss carryforwards and losses deferred due to futures transactions.
The Fund purchases municipal securities whose interest, in the opinion of the issuer, is free from federal income tax. There is no assurance that the IRS will agree with this opinion. In the event the IRS determines that the issuer does not comply with relevant tax requirements, interest payments from a security could become federally taxable, possibly retroactively to the date the security was issued.
The federal tax cost of investment securities and unrealized appreciation (depreciation) as of period end were as follows:
Gross unrealized appreciation | $ 18,410 |
Gross unrealized depreciation | (40,988) |
Net unrealized appreciation (depreciation) on securities and other investments | $ (22,578) |
|
|
Tax Cost | $ 1,697,529 |
Annual Report
Notes to Financial Statements - continued
(Amounts in thousands except ratios)
2. Significant Accounting Policies - continued
Income Tax Information and Distributions to Shareholders - continued
The tax-based components of distributable earnings as of period end were as follows:
Undistributed tax-exempt income | $ 4 |
Undistributed long-term capital gain | $ 3,965 |
Net unrealized appreciation (depreciation) | $ (22,578) |
The tax character of distributions paid was as follows:
| January 31, 2011 | January 31, 2010 |
Tax-exempt Income | $ 72,377 | $ 65,025 |
Long-term Capital Gains | 296 | - |
Total | $ 72,673 | $ 65,025 |
Short-Term Trading (Redemption) Fees. Shares held by investors in the Fund less than 30 days are subject to a redemption fee equal to .50% of the net asset value of shares redeemed. All redemption fees, which reduce the proceeds of the shareholder redemption, are retained by the Fund and accounted for as an addition to paid in capital.
3. Purchases and Sales of Investments.
Purchases and sales of securities, other than short-term securities, aggregated $193,270 and $258,656, respectively.
4. Fees and Other Transactions with Affiliates.
Management Fee. Fidelity Management & Research Company (FMR) and its affiliates provide the Fund with investment management related services for which the Fund pays a monthly management fee. The management fee is the sum of an individual fund fee rate that is based on an annual rate of .25% of the Fund's average net assets and a group fee rate that averaged .12% during the period. The group fee rate is based upon the average net assets of all the mutual funds advised by FMR. The group fee rate decreases as assets under management increase and increases as assets under management decrease. For the period, the total annual management fee rate was .37% of the Fund's average net assets.
Annual Report
4. Fees and Other Transactions with Affiliates - continued
Distribution and Service Plan Fees. In accordance with Rule 12b-1 of the 1940 Act, the Fund has adopted separate Distribution and Service Plans for each class of shares. Certain classes pay Fidelity Distributors Corporation (FDC), an affiliate of FMR, separate Distribution and Service Fees, each of which is based on an annual percentage of each class' average net assets. In addition, FDC may pay financial intermediaries for selling shares of the Fund and providing shareholder support services. For the period, the Distribution and Service Fee rates, total fees and amounts retained by FDC were as follows:
| Distribution | Service | Total Fees | Retained |
Class A | -% | .25% | $ 91 | $ 5 |
Class T | -% | .25% | 23 | - |
Class B | .65% | .25% | 45 | 33 |
Class C | .75% | .25% | 328 | 103 |
|
|
| $ 487 | $ 141 |
Sales Load. FDC receives a front-end sales charge of up to 4.00% for selling Class A shares and Class T shares, some of which is paid to financial intermediaries for selling shares of the Fund. FDC receives the proceeds of contingent deferred sales charges levied on Class A, Class T, Class B, and Class C redemptions. These charges depend on the holding period. The deferred sales charges range from 5% to 1% for Class B, 1% for Class C, ..75% for certain purchases of Class A shares (.75% to .50% prior to July 12, 2010) and .25% for certain purchases of Class T shares.
For the period, sales charge amounts retained by FDC were as follows:
| Retained |
Class A | $ 13 |
Class T | 4 |
Class B* | 10 |
Class C* | 4 |
| $ 31 |
* When Class B and Class C shares are initially sold, FDC pays commissions from its own resources to financial intermediaries through which the sales are made.
Transfer Agent and Accounting Fees. Citibank, N.A. (Citibank) is the custodian, transfer agent, and servicing agent for the Fund's Class A, Class T, Class B, Class C, New York Municipal Income and Institutional Class shares. Citibank has entered into a sub-arrangement with Fidelity Investments Institutional Operations Company, Inc. (FIIOC), an affiliate of FMR, with respect to all classes of the Fund, to perform the
Annual Report
Notes to Financial Statements - continued
(Amounts in thousands except ratios)
4. Fees and Other Transactions with Affiliates - continued
Transfer Agent and Accounting Fees - continued
transfer agency, dividend disbursing, and shareholder servicing functions. FIIOC receives account fees and asset-based fees that vary according to the account size and type of account of the shareholders of the respective classes of the Fund. All fees are paid to FIIOC by Citibank, which is reimbursed by each class for such payments. FIIOC pays for typesetting, printing and mailing of shareholder reports, except proxy statements. For the period, transfer agent fees for each class were as follows:
| Amount | % of |
Class A | $ 40 | .11 |
Class T | 8 | .08 |
Class B | 5 | .10 |
Class C | 45 | .14 |
New York Municipal Income | 1,290 | .07 |
Institutional Class | 20 | .14 |
| $ 1,408 |
|
Citibank also has a sub-arrangement with Fidelity Service Company, Inc. (FSC), an affiliate of FMR, under which FSC maintains the Fund's accounting records. The fee is based on the level of average net assets for the month.
5. Committed Line of Credit.
The Fund participates with other funds managed by FMR or an affiliate in a $3.75 billion credit facility (the "line of credit") to be utilized for temporary or emergency purposes to fund shareholder redemptions or for other short-term liquidity purposes. The Fund has agreed to pay commitment fees on its pro-rata portion of the line of credit, which amounted to $7 and is reflected in Miscellaneous expenses on the Statement of Operations. During the period, there were no borrowings on this line of credit.
6. Expense Reductions.
Through arrangements with the Fund's custodian, credits realized as a result of uninvested cash balances were used to reduce the Fund's expenses. During the period, these credits reduced the Fund's custody and accounting expenses by $20 and $4, respectively.
Annual Report
7. Distributions to Shareholders.
Distributions to shareholders of each class were as follows:
Years ended January 31, | 2011 | 2010 |
From net investment income |
|
|
Class A | $ 1,295 | $ 1,021 |
Class T | 328 | 306 |
Class B | 145 | 198 |
Class C | 903 | 700 |
New York Municipal Income | 69,168 | 62,528 |
Institutional Class | 538 | 272 |
Total | $ 72,377 | $ 65,025 |
From net realized gain |
|
|
Class A | $ 6 | $ - |
Class T | 1 | - |
Class B | 1 | - |
Class C | 5 | - |
New York Municipal Income | 280 | - |
Institutional Class | 3 | - |
Total | $ 296 | $ - |
8. Share Transactions.
Transactions for each class of shares were as follows:
| Shares | Dollars | ||
Years ended January 31, | 2011 | 2010 | 2011 | 2010 |
Class A |
|
|
|
|
Shares sold | 843 | 1,547 | $ 10,950 | $ 19,503 |
Reinvestment of distributions | 67 | 58 | 864 | 737 |
Shares redeemed | (987) | (518) | (12,753) | (6,546) |
Net increase (decrease) | (77) | 1,087 | $ (939) | $ 13,694 |
Class T |
|
|
|
|
Shares sold | 170 | 181 | $ 2,210 | $ 2,264 |
Reinvestment of distributions | 20 | 19 | 257 | 245 |
Shares redeemed | (199) | (170) | (2,571) | (2,151) |
Net increase (decrease) | (9) | 30 | $ (104) | $ 358 |
Class B |
|
|
|
|
Shares sold | 40 | 143 | $ 515 | $ 1,808 |
Reinvestment of distributions | 7 | 10 | 90 | 123 |
Shares redeemed | (194) | (209) | (2,513) | (2,660) |
Net increase (decrease) | (147) | (56) | $ (1,908) | $ (729) |
Annual Report
Notes to Financial Statements - continued
(Amounts in thousands except ratios)
8. Share Transactions - continued
| Shares | Dollars | ||
Years ended January 31, | 2011 | 2010 | 2011 | 2010 |
Class C |
|
|
|
|
Shares sold | 721 | 965 | $ 9,405 | $ 12,161 |
Reinvestment of distributions | 39 | 29 | 501 | 363 |
Shares redeemed | (487) | (297) | (6,281) | (3,759) |
Net increase (decrease) | 273 | 697 | $ 3,625 | $ 8,765 |
New York Municipal Income |
|
|
|
|
Shares sold | 27,629 | 36,790 | $ 358,403 | $ 463,771 |
Reinvestment of distributions | 4,003 | 3,726 | 52,003 | 47,044 |
Shares redeemed | (38,771) | (21,286) | (496,938) | (269,003) |
Net increase (decrease) | (7,139) | 19,230 | $ (86,532) | $ 241,812 |
Institutional Class |
|
|
|
|
Shares sold | 713 | 452 | $ 9,276 | $ 5,689 |
Reinvestment of distributions | 20 | 9 | 258 | 110 |
Shares redeemed | (392) | (109) | (4,969) | (1,356) |
Net increase (decrease) | 341 | 352 | $ 4,565 | $ 4,443 |
9. Other.
The Fund's organizational documents provide former and current trustees and officers with a limited indemnification against liabilities arising in connection with the performance of their duties to the Fund. In the normal course of business, the Fund may also enter into contracts that provide general indemnifications. The Fund's maximum exposure under these arrangements is unknown as this would be dependent on future claims that may be made against the Fund. The risk of material loss from such claims is considered remote.
Annual Report
Report of Independent Registered Public Accounting Firm
To the Trustees of Fidelity New York Municipal Trust and Shareholders of Fidelity New York Municipal Income Fund:
We have audited the accompanying statement of assets and liabilities of Fidelity New York Municipal Income Fund (the Fund), a fund of Fidelity New York Municipal Trust, including the schedule of investments, as of January 31, 2011, and the related statement of operations for the year then ended, the statement of changes in net assets for each of the two years in the period then ended, and the financial highlights for each of the five years in the period then ended. These financial statements and financial highlights are the responsibility of the Fund's management. Our responsibility is to express an opinion on these financial statements and financial highlights based on our audits.
We conducted our audits in accordance with the standards of the Public Company Accounting Oversight Board (United States). Those standards require that we plan and perform the audit to obtain reasonable assurance about whether the financial statements and financial highlights are free of material misstatement. The Fund is not required to have, nor were we engaged to perform, an audit of its internal control over financial reporting. Our audits included consideration of internal control over financial reporting as a basis for designing audit procedures that are appropriate in the circumstances, but not for the purpose of expressing an opinion on the effectiveness of the Fund's internal control over financial reporting. Accordingly, we express no such opinion. An audit also includes examining, on a test basis, evidence supporting the amounts and disclosures in the financial statements, assessing the accounting principles used and significant estimates made by management, as well as evaluating the overall financial statement presentation. Our procedures included confirmation of securities owned as of January 31, 2011, by correspondence with the custodian. We believe that our audits provide a reasonable basis for our opinion.
In our opinion, the financial statements and financial highlights referred to above present fairly, in all material respects, the financial position of Fidelity New York Municipal Income Fund as of January 31, 2011, the results of its operations for the year then ended, the changes in its net assets for each of the two years in the period then ended, and its financial highlights for each of the five years in the period then ended, in conformity with accounting principles generally accepted in the United States of America.
/s/ Deloitte & Touche LLP
DELOITTE & TOUCHE LLP
Boston, Massachusetts
March 16, 2011
Annual Report
Trustees and Officers
The Trustees and executive officers of the trust and fund, as applicable, are listed below. The Board of Trustees governs the fund and is responsible for protecting the interests of shareholders. The Trustees are experienced executives who meet periodically throughout the year to oversee the fund's activities, review contractual arrangements with companies that provide services to the fund, oversee management of the risks associated with such activities and contractual arrangements, and review the fund's performance. Except for James C. Curvey, each of the Trustees oversees 190 funds advised by FMR or an affiliate. Mr. Curvey oversees 409 funds advised by FMR or an affiliate.
The Trustees hold office without limit in time except that (a) any Trustee may resign; (b) any Trustee may be removed by written instrument, signed by at least two-thirds of the number of Trustees prior to such removal; (c) any Trustee who requests to be retired or who has become incapacitated by illness or injury may be retired by written instrument signed by a majority of the other Trustees; and (d) any Trustee may be removed at any special meeting of shareholders by a two-thirds vote of the outstanding voting securities of the trust. Each Trustee who is not an interested person (as defined in the 1940 Act) (Independent Trustee), shall retire not later than the last day of the calendar year in which his or her 75th birthday occurs. The Independent Trustees may waive this mandatory retirement age policy with respect to individual Trustees. The executive officers hold office without limit in time, except that any officer may resign or may be removed by a vote of a majority of the Trustees at any regular meeting or any special meeting of the Trustees. Except as indicated, each individual has held the office shown or other offices in the same company for the past five years.
Experience, Skills, Attributes, and Qualifications of the Fund's Trustees. The Governance and Nominating Committee has adopted a statement of policy that describes the experience, qualifications, attributes, and skills that are necessary and desirable for potential Independent Trustee candidates (Statement of Policy). The Board believes that each Trustee satisfied at the time he or she was initially elected or appointed a Trustee, and continues to satisfy, the standards contemplated by the Statement of Policy. The Governance and Nominating Committee also engages professional search firms to help identify potential Independent Trustee candidates who have the experience, qualifications, attributes, and skills consistent with the Statement of Policy. From time to time, additional criteria based on the composition and skills of the current Independent Trustees, as well as experience or skills that may be appropriate in light of future changes to board composition, business conditions, and regulatory or other developments, have also been considered by the professional search firms and the Governance and Nominating Committee. In addition, the Board takes into account the Trustees' commitment and participation in Board and committee meetings, as well as their leadership of standing and ad hoc committees throughout their tenure.
In determining that a particular Trustee was and continues to be qualified to serve as a Trustee, the Board has considered a variety of criteria, none of which, in isolation, was controlling. The Board believes that, collectively, the Trustees have balanced and diverse experience, qualifications, attributes, and skills, which allow the Board to operate effectively in governing the fund and protecting the interests of shareholders. Information about the specific experience, skills, attributes, and qualifications of each Trustee, which in each case led to the Board's conclusion that the Trustee should serve (or continue to serve) as a trustee of the fund, is provided below.
Annual Report
Board Structure and Oversight Function. Abigail P. Johnson is an interested person (as defined in the 1940 Act) and currently serves as Chairman. The Trustees have determined that an interested Chairman is appropriate and benefits shareholders because an interested Chairman has a personal and professional stake in the quality and continuity of services provided to the fund. Independent Trustees exercise their informed business judgment to appoint an individual of their choosing to serve as Chairman, regardless of whether the Trustee happens to be independent or a member of management. The Independent Trustees have determined that they can act independently and effectively without having an Independent Trustee serve as Chairman and that a key structural component for assuring that they are in a position to do so is for the Independent Trustees to constitute a substantial majority for the Board. The Independent Trustees also regularly meet in executive session. Kenneth L. Wolfe serves as Chairman of the Independent Trustees and as such (i) acts as a liaison between the Independent Trustees and management with respect to matters important to the Independent Trustees and (ii) with management prepares agendas for Board meetings.
Fidelity funds are overseen by different Boards of Trustees. The fund's Board oversees Fidelity's investment-grade bond, money market, and asset allocation funds and another Board oversees Fidelity's equity and high income funds. The asset allocation funds may invest in Fidelity funds that are overseen by such other Board. The use of separate Boards, each with its own committee structure, allows the Trustees of each group of Fidelity funds to focus on the unique issues of the funds they oversee, including common research, investment, and operational issues. On occasion, the separate Boards establish joint committees to address issues of overlapping consequences for the Fidelity funds overseen by each Board.
The Trustees operate using a system of committees to facilitate the timely and efficient consideration of all matters of importance to the Trustees, the fund, and fund shareholders and to facilitate compliance with legal and regulatory requirements and oversight of the fund's activities and associated risks. The Board, acting through its committees, has charged FMR and its affiliates with (i) identifying events or circumstances the occurrence of which could have demonstrably adverse effects on the fund's business and/or reputation; (ii) implementing processes and controls to lessen the possibility that such events or circumstances occur or to mitigate the effects of such events or circumstances if they do occur; and (iii) creating and maintaining a system designed to evaluate continuously business and market conditions in order to facilitate the identification and implementation processes described in (i) and (ii) above. Because the day-to-day operations and activities of the fund are carried out by or through FMR, its affiliates and other service providers, the fund's exposure to risks is mitigated but not eliminated by the processes overseen by the Trustees. While each of the Board's committees has responsibility for overseeing different aspects of the fund's activities, oversight is exercised primarily through the Operations and Audit Committees. Appropriate personnel, including but not limited to the fund's Chief Compliance Officer (CCO), FMR's internal auditor, the independent accountants, the fund's Treasurer and portfolio management personnel, make periodic reports to the Board's committees, as appropriate. The responsibilities of each committee, including their oversight responsibilities, are described further under "Standing Committees of the Fund's Trustees."
Annual Report
Trustees and Officers - continued
The fund's Statement of Additional Information (SAI) includes more information about the Trustees. To request a free copy, call Fidelity at 1-800-544-8544.
Interested Trustees*:
Correspondence intended for each Trustee who is an interested person may be sent to Fidelity Investments, 82 Devonshire Street, Boston, Massachusetts 02109.
Name, Age; Principal Occupations and Other Relevant Experience+ | |
Abigail P. Johnson (49) | |
| Year of Election or Appointment: 2009 Ms. Johnson is Trustee and Chairman of the Board of Trustees of certain Trusts. Ms. Johnson serves as President of Personal, Workplace and Institutional Services (2005-present). Ms. Johnson is the Vice Chairman and Director (2007-present) of FMR LLC. Previously, Ms. Johnson served as President and a Director of FMR (2001-2005), a Trustee of other investment companies advised by FMR, Fidelity Investments Money Management, Inc., and FMR Co., Inc. (2001-2005), Senior Vice President of the Fidelity funds (2001-2005), and managed a number of Fidelity funds. Ms. Abigail P. Johnson and Mr. Arthur E. Johnson are not related. |
James C. Curvey (75) | |
| Year of Election or Appointment: 2007 Mr. Curvey also serves as Trustee (2007-present) of other investment companies advised by FMR. Mr. Curvey is a Director of Fidelity Investments Money Management, Inc. (2009-present), Director of Fidelity Research & Analysis Co. (2009-present) and Director of FMR and FMR Co., Inc. (2007-present). Mr. Curvey is also Vice Chairman (2007-present) and Director of FMR LLC. In addition, Mr. Curvey serves as an Overseer for the Boston Symphony Orchestra and a member of the Trustees of Villanova University. Previously, Mr. Curvey was the Vice Chairman (2006-2007) and Director (2000-2007) of FMR Corp. |
* Trustees have been determined to be "Interested Trustees" by virtue of, among other things, their affiliation with the trust or various entities under common control with FMR.
Annual Report
+ The information above includes each Trustee's principal occupation during the last five years and other information relating to the experience, attributes, and skills relevant to each Trustee's qualifications to serve as a Trustee, which led to the conclusion that each Trustee should serve as a Trustee for the fund.
Independent Trustees:
Correspondence intended for each Independent Trustee (that is, the Trustees other than the Interested Trustees) may be sent to Fidelity Investments, P.O. Box 55235, Boston, Massachusetts 02205-5235.
Name, Age; Principal Occupations and Other Relevant Experience+ | |
Albert R. Gamper, Jr. (68) | |
| Year of Election or Appointment: 2006 Prior to his retirement in December 2004, Mr. Gamper served as Chairman of the Board of CIT Group Inc. (commercial finance). During his tenure with CIT Group Inc. Mr. Gamper served in numerous senior management positions, including Chairman (1987-1989; 1999-2001; 2002-2004), Chief Executive Officer (1987-2004), and President (2002-2003). He also served as President and Chief Executive Officer of Tyco Capital Corporation (2001-2002). Mr. Gamper currently serves as a member of the Board of Directors of Public Service Enterprise Group (utilities, 2000-present), a member of the Board of Trustees, Rutgers University (2004-present), and Chairman of the Board of Saint Barnabas Health Care System. Previously, Mr. Gamper served as Chairman of the Board of Governors, Rutgers University (2004-2007). |
Robert F. Gartland (59) | |
| Year of Election or Appointment: 2010 Mr. Gartland is a partner and investor of Vietnam Partners LLC (investments and consulting, 2008-present) and is Chairman and an investor in Gartland and Mellina Group Corp. (consulting, 2009-present). Prior to his retirement, Mr. Gartland held a variety of positions at Morgan Stanley (financial services, 1979-2007) including Managing Director (1987-2007). |
Arthur E. Johnson (64) | |
| Year of Election or Appointment: 2008 Mr. Johnson serves as a member of the Board of Directors of Eaton Corporation (diversified power management, 2009-present) and AGL Resources, Inc. (holding company). Prior to his retirement, Mr. Johnson served as Senior Vice President of Corporate Strategic Development of Lockheed Martin Corporation (defense contractor, 1999-2009). He previously served on the Board of Directors of IKON Office Solutions, Inc. (1999-2008) and Delta Airlines (2005-2007). Mr. Arthur E. Johnson and Ms. Abigail P. Johnson are not related. |
Michael E. Kenneally (56) | |
| Year of Election or Appointment: 2009 Previously, Mr. Kenneally served as a Member of the Advisory Board for certain Fidelity Fixed Income and Asset Allocation Funds (2008-2009). Prior to his retirement, Mr. Kenneally served as Chairman and Global Chief Executive Officer of Credit Suisse Asset Management (2003-2005). Mr. Kenneally was a Director of the Credit Suisse Funds (U.S. mutual funds, 2004-2008) and certain other closed-end funds (2004-2005) and was awarded the Chartered Financial Analyst (CFA) designation in 1991. |
James H. Keyes (70) | |
| Year of Election or Appointment: 2007 Mr. Keyes serves as a member of the Boards of Navistar International Corporation (manufacture and sale of trucks, buses, and diesel engines, since 2002) and Pitney Bowes, Inc. (integrated mail, messaging, and document management solutions, since 1998). Prior to his retirement, Mr. Keyes served as Chairman and Chief Executive Officer of Johnson Controls (automotive, building, and energy, 1998-2002) and as a member of the Board of LSI Logic Corporation (semiconductor technologies, 1984-2008). |
Marie L. Knowles (64) | |
| Year of Election or Appointment: 2001 Prior to Ms. Knowles' retirement in June 2000, she served as Executive Vice President and Chief Financial Officer of Atlantic Richfield Company (ARCO) (diversified energy, 1996-2000). From 1993 to 1996, she was a Senior Vice President of ARCO and President of ARCO Transportation Company. She served as a Director of ARCO from 1996 to 1998. Ms. Knowles currently serves as a Director and Chairman of the Audit Committee of McKesson Corporation (healthcare service, since 2002). Ms. Knowles is an Honorary Trustee of the Brookings Institution and a member of the Board of the Catalina Island Conservancy and of the Santa Catalina Island Company (2009-present). She also serves as a member of the Advisory Board for the School of Engineering of the University of Southern California and the Foundation Board of the School of Architecture at the University of Virginia (2007-present). Previously, Ms. Knowles served as a Director of Phelps Dodge Corporation (copper mining and manufacturing, 1994-2007). |
Kenneth L. Wolfe (71) | |
| Year of Election or Appointment: 2005 Mr. Wolfe is Chairman of the Independent Trustees of the Fixed Income and Asset Allocation Funds (2008-present). Prior to his retirement, Mr. Wolfe served as Chairman and a Director (2007-2009) and Chairman and Chief Executive Officer (1994-2001) of Hershey Foods Corporation. He also served as a member of the Boards of Adelphia Communications Corporation (telecommunications, 2003-2006), Bausch & Lomb, Inc. (medical/pharmaceutical, 1993-2007), and Revlon, Inc. (personal care products, 2004-2009). |
+ The information above includes each Trustee's principal occupation during the last five years and other information relating to the experience, attributes, and skills relevant to each Trustee's qualifications to serve as a Trustee, which led to the conclusion that each Trustee should serve as a Trustee for the fund.
Executive Officers:
Correspondence intended for each executive officer may be sent to Fidelity Investments, 82 Devonshire Street, Boston, Massachusetts 02109.
Name, Age; Principal Occupation | |
John R. Hebble (52) | |
| Year of Election or Appointment: 2008 President and Treasurer of Fidelity's Fixed Income and Asset Allocation Funds. Mr. Hebble also serves as Treasurer and Chief Financial Officer of The North Carolina Capital Management Trust: Cash and Term Portfolio (2008-present), Assistant Treasurer of other Fidelity funds (2009-present) and is an employee of Fidelity Investments. |
Boyce I. Greer (54) | |
| Year of Election or Appointment: 2005 Vice President of Fidelity's Fixed Income Funds and Asset Allocation Funds (2005). Mr. Greer is also a Trustee of other investment companies advised by FMR. Mr. Greer is President of The North Carolina Capital Management Trust: Cash and Term Portfolio (2003-present), the Asset Allocation Division (2008-present), President and a Director of Strategic Advisers, Inc. (2008-present), President of FIMM 130/30 LLC (2008-present), Director of Ballyrock Investment Advisors LLC (2006-present), and an Executive Vice President of FMR (2005-present). Previously, Mr. Greer served as Executive Vice President of FMR Co., Inc. (2005-2009), President and Director of Fidelity Investments Money Management, Inc. (2007-2009) and as a Director and Managing Director of Strategic Advisers, Inc. (2002-2005). |
Christopher P. Sullivan (56) | |
| Year of Election or Appointment: 2009 Vice President of Fidelity's Bond Funds. Mr. Sullivan also serves as President of Fidelity's Bond Division (2009-present). Mr. Sullivan is Executive Vice President of Fidelity Investments Money Management, Inc. (2009-present), and a Director of Fidelity Management & Research (U.K.) Inc. (2010-present). Previously, Mr. Sullivan served as Managing Director, Co-Head of U.S. Fixed Income at Goldman Sachs Asset Management (2001-2009). |
Christine J. Thompson (52) | |
| Year of Election or Appointment: 2010 Vice President of Fidelity's Bond Funds. Ms. Thompson also serves as Chief Investment Officer of FMR's Bond Group (2010-present) and is an employee of Fidelity Investments. Previously, Ms. Thompson served as Director of Municipal Bond Portfolio Managers (2002-2010). |
Scott C. Goebel (43) | |
| Year of Election or Appointment: 2008 Secretary and Chief Legal Officer (CLO) of the Fidelity funds. Mr. Goebel also serves as Secretary and CLO of The North Carolina Capital Management Trust: Cash and Term Portfolio (2008-present); General Counsel, Secretary, and Senior Vice President of FMR (2008-present) and FMR Co., Inc. (2008-present); Deputy General Counsel of FMR LLC; Chief Legal Officer of Fidelity Management & Research (Hong Kong) Limited (2008-present) and Assistant Secretary of Fidelity Management & Research (Japan) Inc. (2008-present), Fidelity Investments Money Management, Inc. (2008-present), Fidelity Management & Research (U.K.) Inc. (2008-present), and Fidelity Research and Analysis Company (2008-present). Previously, Mr. Goebel served as Assistant Secretary of the Funds (2007-2008) and as Vice President and Secretary of Fidelity Distributors Corporation (FDC) (2005-2007). |
David J. Carter (37) | |
| Year of Election or Appointment: 2010 Assistant Secretary of Fidelity's Fixed Income and Asset Allocation Funds. Mr. Carter also serves as Vice President, Associate General Counsel (2010-present) and is an employee of Fidelity Investments (2005-present). |
Holly C. Laurent (56) | |
| Year of Election or Appointment: 2008 Anti-Money Laundering (AML) Officer of the Fidelity funds. Ms. Laurent also serves as AML Officer of The North Carolina Capital Management Trust: Cash and Term Portfolio (2008-present) and is an employee of Fidelity Investments. Previously, Ms. Laurent was Senior Vice President and Head of Legal for Fidelity Business Services India Pvt. Ltd. (2006-2008), and Senior Vice President, Deputy General Counsel and Group Head for FMR LLC (2005-2006). |
Christine Reynolds (52) | |
| Year of Election or Appointment: 2008 Chief Financial Officer of the Fidelity funds. Ms. Reynolds became President of Fidelity Pricing and Cash Management Services (FPCMS) in August 2008. Ms. Reynolds served as Chief Operating Officer of FPCMS (2007-2008). Previously, Ms. Reynolds served as President, Treasurer, and Anti-Money Laundering officer of the Fidelity funds (2004-2007). |
Michael H. Whitaker (43) | |
| Year of Election or Appointment: 2008 Chief Compliance Officer of Fidelity's Fixed Income and Asset Allocation Funds. Mr. Whitaker also serves as Chief Compliance Officer of The North Carolina Capital Management Trust: Cash and Term Portfolio (2008-present). Mr. Whitaker is an employee of Fidelity Investments (2007-present). Prior to joining Fidelity Investments, Mr. Whitaker worked at MFS Investment Management where he served as Senior Vice President and Chief Compliance Officer (2004-2006), and Assistant General Counsel. |
Jeffrey S. Christian (49) | |
| Year of Election or Appointment: 2009 Deputy Treasurer of the Fidelity funds. Mr. Christian is an employee of Fidelity Investments. Previously, Mr. Christian served as Chief Financial Officer (2008-2009) of certain Fidelity funds and Senior Vice President of Fidelity Pricing and Cash Management Services (FPCMS) (2004-2009). |
Bryan A. Mehrmann (49) | |
| Year of Election or Appointment: 2005 Deputy Treasurer of the Fidelity funds. Mr. Mehrmann is an employee of Fidelity Investments. |
Stephanie J. Dorsey (41) | |
| Year of Election or Appointment: 2008 Deputy Treasurer of Fidelity's Fixed Income and Asset Allocation Funds. Ms. Dorsey also serves as Assistant Treasurer of other Fidelity funds (2010-present) and is an employee of Fidelity Investments (2008-present). Previously, Ms. Dorsey served as Treasurer (2004-2008) of the JPMorgan Mutual Funds and Vice President (2004-2008) of JPMorgan Chase Bank. |
Adrien E. Deberghes (43) | |
| Year of Election or Appointment: 2010 Assistant Treasurer of Fidelity's Fixed Income and Asset Allocation Funds. Mr. Deberghes also serves as Deputy Treasurer of other Fidelity funds (2008-present) and is an employee of Fidelity Investments (2008-present). Previously, Mr. Deberghes served as Senior Vice President of Mutual Fund Administration at State Street Corporation (2007-2008), Senior Director of Mutual Fund Administration at Investors Bank & Trust (2005-2007), and Director of Finance for Dunkin' Brands (2000-2005). |
Kenneth B. Robins (41) | |
| Year of Election or Appointment: 2009 Assistant Treasurer of the Fidelity Fixed Income and Asset Allocation Funds. Mr. Robins also serves as President and Treasurer of other Fidelity funds (2008-present; 2010-present) and is an employee of Fidelity Investments (2004-present). Previously, Mr. Robins served as Deputy Treasurer of the Fidelity funds (2005-2008) and Treasurer and Chief Financial Officer of The North Carolina Capital Management Trust: Cash and Term Portfolios (2006-2008). |
Gary W. Ryan (52) | |
| Year of Election or Appointment: 2005 Assistant Treasurer of the Fidelity funds. Mr. Ryan is an employee of Fidelity Investments. Previously, Mr. Ryan served as Vice President of Fund Reporting in Fidelity Pricing and Cash Management Services (FPCMS) (1999-2005). |
Jonathan Davis (42) | |
| Year of Election or Appointment: 2010 Assistant Treasurer of the Fidelity funds. Mr. Davis is an employee of Fidelity Investments. Previously, Mr. Davis served as Vice President and Associate General Counsel of FMR LLC (2003-2010). |
Annual Report
Distributions (Unaudited)
The Board of Trustees of Fidelity New York Municipal Income Fund voted to pay to shareholders of record at the opening of business on record date, the following distribution per share derived from capital gains realized from sales of portfolio securities:
| Pay Date | Record Date | Capital Gains |
Fidelity New York Municipal Income Fund | 03/07/2011 | 03/04/2011 | $0.03 |
During fiscal year ended 2011, 100% of the fund's income dividends was free from federal income tax, and 14.53% of the fund's income dividends was subject to the federal alternative minimum tax.
The fund hereby designates as a capital gain dividend with the respect to the taxable year end January 31, 2011, $4,801,494 or if subsequently determined to be different, the net capital gain of such year.
The fund will notify shareholders in January 2012 of amounts for use in preparing 2011 income tax returns.
Annual Report
Board Approval of Investment Advisory Contracts and Management Fees
Fidelity New York Municipal Income Fund
Each year, the Board of Trustees, including the Independent Trustees (together, the Board), votes on the renewal of the management contract and sub-advisory agreements (together, the Advisory Contracts) for the fund. The Board, assisted by the advice of fund counsel and Independent Trustees' counsel, requests and considers a broad range of information relevant to the renewal of the Advisory Contracts throughout the year.
The Board meets regularly and considers at each of its meetings factors that are relevant to its annual consideration of the renewal of the fund's Advisory Contracts, including the services and support provided to the fund and its shareholders. The Board has established three standing committees, each composed of Independent Trustees with varying backgrounds, to which the Board has assigned specific subject matter responsibilities in order to enhance effective decision-making by the Board. The Operations Committee, of which all of the Independent Trustees are members, meets regularly throughout the year and, among other matters, considers matters specifically related to the annual consideration of the renewal of the fund's Advisory Contracts. The Board, acting directly and through its Committees, requests and receives information concerning the annual consideration of the renewal of the fund's Advisory Contracts. The Board also meets as needed to consider matters specifically related to the Board's annual consideration of the renewal of Advisory Contracts. Members of the Board may also meet with trustees of other Fidelity funds through ad hoc joint committees to discuss certain matters relevant to the Fidelity funds.
At its September 2010 meeting, the Board of Trustees, including the Independent Trustees, unanimously determined to renew the fund's Advisory Contracts. In reaching its determination, the Board considered all factors it believed relevant, including (i) the nature, extent, and quality of the services to be provided to the fund and its shareholders (including the investment performance of the fund); (ii) the competitiveness of the fund's management fee and total expenses; (iii) the total costs of the services to be provided by and the profits to be realized by Fidelity from its relationship with the fund; (iv) the extent to which economies of scale would be realized as the fund grows; and (v) whether fee levels reflect these economies of scale, if any, for the benefit of fund shareholders.
In considering whether to renew the Advisory Contracts for the fund, the Board reached a determination, with the assistance of fund counsel and Independent Trustees' counsel and through the exercise of its business judgment, that the renewal of the Advisory Contracts is in the best interests of the fund and its shareholders and that the compensation to be received by Fidelity under the management contract is fair and reasonable. The Board's decision to renew the Advisory Contracts was not based on any single factor, but rather was based on a comprehensive consideration of all the information provided to the Board at its meetings throughout the year. The Board, in reaching its determination to renew the Advisory Contracts, is aware that shareholders in the fund have a broad range of investment choices available to them, including a wide choice among mutual funds offered by Fidelity's competitors, and that the fund's shareholders, with the opportunity to review and weigh the disclosure provided by the fund in its prospectus and other public disclosures, have chosen to invest in this fund, managed by Fidelity.
Annual Report
Board Approval of Investment Advisory Contracts and
Management Fees - continued
Nature, Extent, and Quality of Services Provided. The Board considered the staffing within the investment adviser, FMR, and the sub-advisers (together, the Investment Advisers), including the backgrounds of the fund's investment personnel and the fund's investment objective and discipline. The Independent Trustees also had discussions with senior management of Fidelity's investment operations and investment groups. The Board considered the structure of the portfolio manager compensation program and whether this structure provides appropriate incentives to act in the best interest of the fund.
Resources Dedicated to Investment Management and Support Services. The Board reviewed the size, education, and experience of the Investment Advisers' investment staff, their use of technology, and the Investment Advisers' approach to recruiting, training, and retaining portfolio managers and other research, advisory, and management personnel. The Board noted that Fidelity's analysts have access to a variety of technological tools and market and securities data that enable them to perform both fundamental and quantitative analysis and to specialize in various disciplines. The Board considered Fidelity's extensive global research capabilities that enable the Investment Advisers to aggregate data from various sources in an effort to produce positive investment results. The Board also considered that Fidelity's portfolio managers and analysts have access to daily portfolio attribution that allows for monitoring of a fund's portfolio, as well as an electronic communication system that provides immediate real-time access to research concerning issuers and credit enhancers. In addition, the Board considered the trading resources that are an integral part of the fixed-income portfolio management investment process.
Shareholder and Administrative Services. The Board considered (i) the nature, extent, quality, and cost of advisory, administrative, and shareholder services performed by the Investment Advisers and their affiliates under the Advisory Contracts and under separate agreements covering transfer agency and pricing and bookkeeping services for the fund; (ii) the nature and extent of the investment adviser's supervision of third party service providers, principally custodians and subcustodians; and (iii) the resources devoted to, and the record of compliance with, the fund's compliance policies and procedures.
The Board noted that the growth of fund assets over time across the complex allows Fidelity to reinvest in the development of services designed to enhance the value or convenience of the Fidelity funds as investment vehicles. These services include 24-hour access to account information and market information through telephone representatives and over the Internet, and investor education materials and asset allocation tools.
Annual Report
Investment in a Large Fund Family. The Board considered the benefits to shareholders of investing in a Fidelity fund, including the benefits of investing in a fund that is part of a large family of funds offering a variety of investment disciplines and providing a large variety of mutual fund investor services. The Board noted that Fidelity had taken, or had made recommendations that resulted in the Fidelity funds taking, a number of actions over the previous year that benefited particular funds, including (i) dedicating additional resources to investment research and restructuring and broadening the focus of the investment research teams; (ii) bolstering the senior management team that oversees asset management; (iii) launching Class F of certain funds as a lower-fee class available to Freedom K and Freedom Index Funds; (iv) lowering the initial investment minimums and ongoing balance requirements for Real Estate High Income Fund; (v) eliminating subsequent purchase minimums for all funds and adding a waiver of the investment minimum requirement for new accounts opened with the proceeds of a systematic withdrawal plan; (vi) eliminating the withdrawal minimum and maximum limits for systematic withdrawals from Advisor funds; (vii) expanding sales load waivers on Class A shares for Destiny Planholders and expanding Institutional Class eligibility for Class O Destiny Planholders; and (viii) changing certain Class A and Class T sales charge structures to further align them with industry practices.
Investment Performance. The Board considered whether the fund has operated in accordance with its investment objective, as well as its record of compliance with its investment restrictions. It also reviewed the fund's absolute investment performance for each class, as well as the fund's relative investment performance for each class measured over multiple periods against (i) a broad-based securities market index, and (ii) a peer group of mutual funds deemed appropriate by Fidelity and reviewed by the Board. The following charts considered by the Board show, over the one-, three-, and five-year periods ended December 31, 2009, the cumulative total returns of the retail class and Class C of the fund, the cumulative total returns of a broad-based securities market index ("benchmark"), and a range of cumulative total returns of a peer group of mutual funds identified by Lipper Inc. as having an investment objective similar to that of the fund. The returns of the retail class and Class C show the performance of the highest and lowest performing classes, respectively (based on five-year performance). The box within each chart shows the 25th percentile return (bottom of box) and the 75th percentile return (top of box) of the peer group. Returns shown above the box are in the first quartile and returns shown below the box are in the fourth quartile. The percentage beaten numbers noted below each chart correspond to the percentile box and represent the percentage of funds in the peer group whose performance was equal to or lower than that of the class indicated.
Annual Report
Board Approval of Investment Advisory Contracts and
Management Fees - continued
Fidelity New York Municipal Income Fund
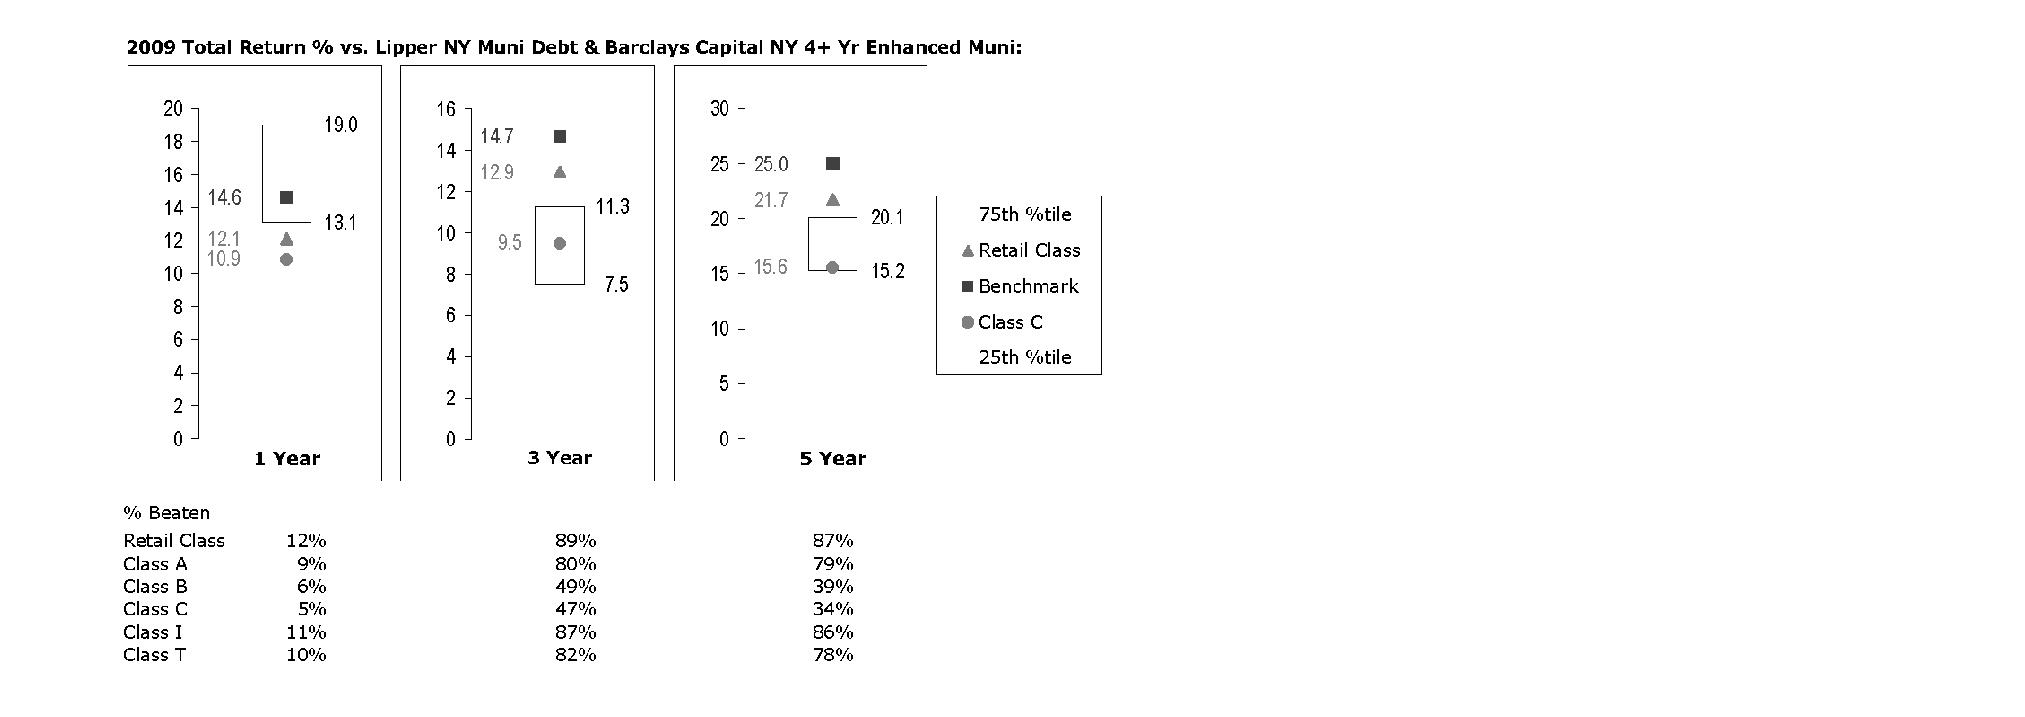
The Board reviewed the fund's relative investment performance against its peer group and noted that the performance of the retail class of the fund was in the fourth quartile for the one-year period and the first quartile for the three- and five-year periods. The Board also noted that the investment performance of the fund was lower than its benchmark for all the periods shown. The Board considered that the variations in performance among the fund's classes reflect the variations in class expenses, which result in lower performance for higher expense classes. The Board discussed with FMR actions that have been taken by FMR to improve the fund's below-benchmark performance. The Board also reviewed the fund's performance since inception as well as performance in the current year.
Based on its review, and giving particular weight to the nature and quality of the resources dedicated by the Investment Advisers to maintain and improve relative performance and factoring in the unprecedented market events in recent years, the Board concluded that the nature, extent, and quality of investment management and support services and of shareholder and administrative services provided to the fund will benefit the fund's shareholders, particularly in light of the Board's view that the fund's shareholders benefit from investing in a fund that is part of a large family of funds offering a variety of investment disciplines and services.
Competitiveness of Management Fee and Total Fund Expenses. The Board considered the fund's management fee and total expenses compared to "mapped groups" of competitive funds and classes. Fidelity creates "mapped groups" by combining similar
Annual Report
Lipper investment objective categories that have comparable management fee characteristics. Combining Lipper investment objective categories aids the Board's management fee and total expense comparisons by broadening the competitive group used for comparison and by reducing the number of universes to which various Fidelity funds are compared.
Management Fee. The Board considered two proprietary management fee comparisons for the 12-month periods shown in the chart below. The group of Lipper funds used by the Board for management fee comparisons is referred to below as the "Total Mapped Group" and, for the reasons explained above, is broader than the Lipper peer group used by the Board for performance comparisons. The Total Mapped Group comparison focuses on a fund's standing relative to the total universe of comparable funds available to investors, in terms of gross management fees before expense reimbursements or caps. "TMG%" represents the percentage of funds in the Total Mapped Group that had management fees that were lower than the fund's. For example, a TMG% of 7% means that 93% of the funds in the Total Mapped Group had higher management fees than the fund. The "Asset-Size Peer Group" (ASPG) comparison focuses on a fund's standing relative to non-Fidelity funds similar in size to the fund within the Total Mapped Group. The ASPG represents at least 15% of the funds in the Total Mapped Group with comparable asset size and management fee characteristics, subject to a minimum of 50 funds (or all funds in the Total Mapped Group if fewer than 50). Additional information, such as the ASPG quartile in which the fund's management fee ranked, is also included in the chart and considered by the Board.
Fidelity New York Municipal Income Fund
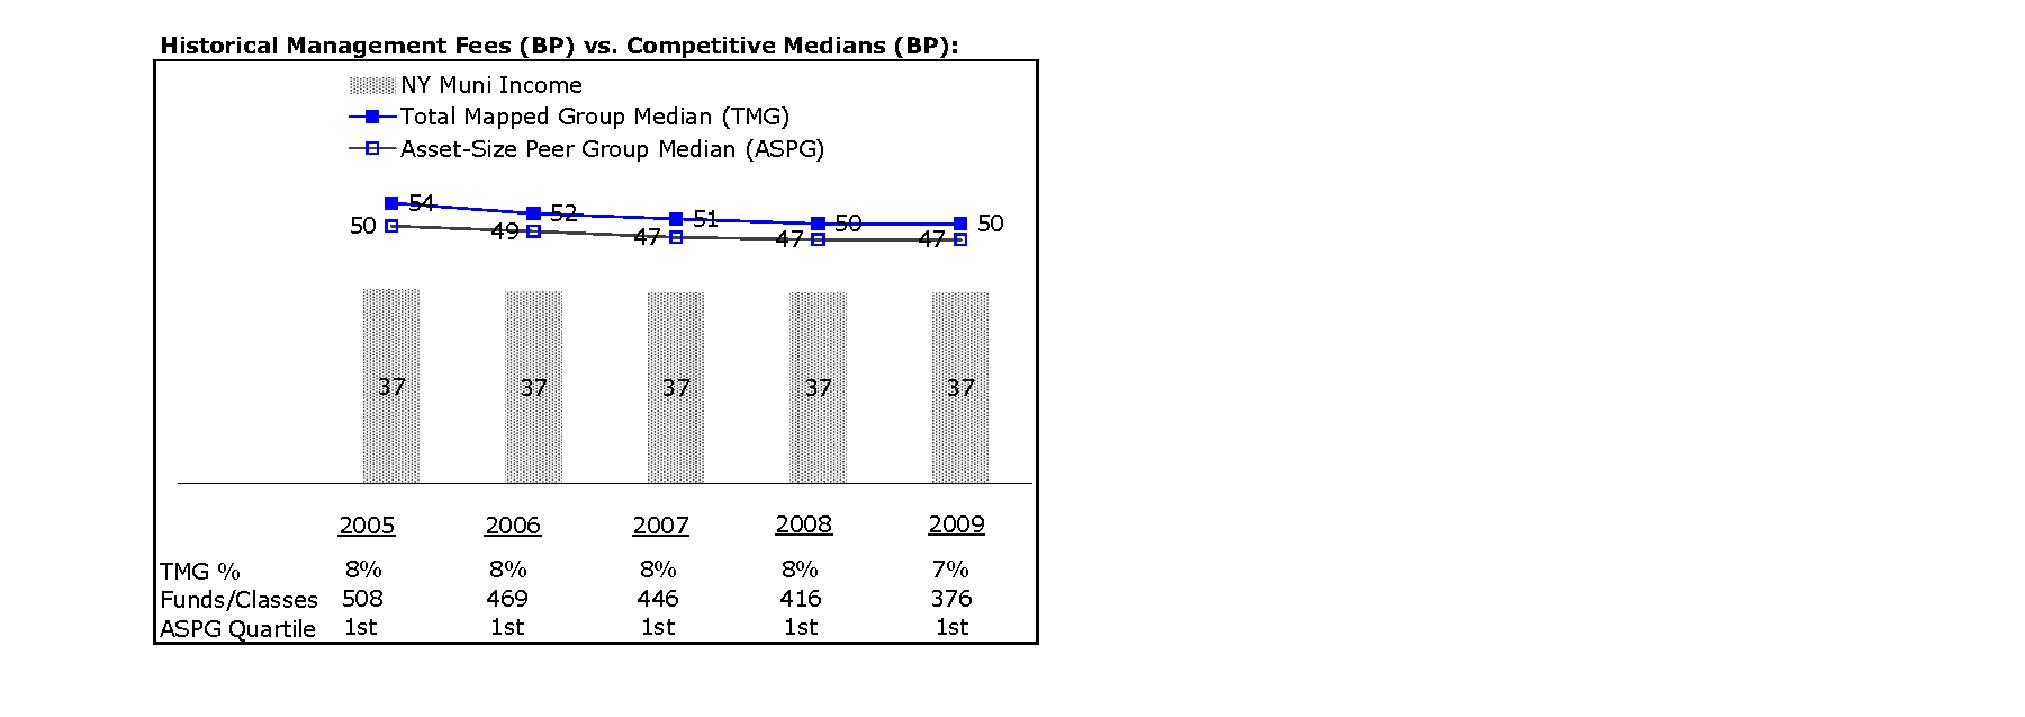
Annual Report
Board Approval of Investment Advisory Contracts and
Management Fees - continued
The Board noted that the fund's management fee ranked below the median of its Total Mapped Group and below the median of its ASPG for 2009.
Based on its review, the Board concluded that the fund's management fee is fair and reasonable in light of the services that the fund receives and the other factors considered.
Total Expenses. In its review of each class's total expenses, the Board considered the fund's management fee as well as other fund or class expenses, as applicable, such as transfer agent fees, pricing and bookkeeping fees, fund-paid 12b-1 fees, and custodial, legal, and audit fees. The Board also noted the effects of any waivers and reimbursements on fees and expenses. As part of its review, the Board also considered current and historical total expenses of each class of the fund compared to competitive fund median expenses. Each class of the fund is compared to those funds and classes in the Total Mapped Group (used by the Board for management fee comparisons) that have a similar sales load structure.
The Board noted that the total expenses of each of Class A, Class T, Class B, Institutional Class, and the retail class ranked below its competitive median for 2009 and the total expenses of Class C ranked above its competitive median for 2009. The Board noted that the funds and classes in the Total Mapped Group that have a similar sales load structure have a range of 12b-1 fees, and, when compared to a subset of funds with the same 12b-1 fee, Class C ranked below the median for 2009. The Board noted that the fund offers multiple classes, each of which has a different sales load and 12b-1 fee structure, and that the multiple structures are intended to offer a range of pricing options for the intermediary market. The Board also noted that the total expenses of the classes vary primarily by the level of their 12b-1 fees, although differences in transfer agent fees may also cause expenses to vary from class to class.
Fees Charged to Other Fidelity Clients. The Board also considered Fidelity fee structures and other information with respect to clients of FMR and its affiliates, such as other mutual funds advised or subadvised by FMR or its affiliates, pension plan clients, and other institutional clients. In March 2010, the Board created an ad hoc joint committee with the board of other Fidelity funds (the Committee) to review and compare Fidelity's institutional investment advisory business with its business of providing services to the Fidelity funds, including the differences in services provided, fees charged, and costs incurred, as well as competition in their respective marketplaces.
Based on its review of total expenses and fees charged to other Fidelity clients, the Board concluded that the total expenses of each class of the fund were reasonable, although in one case above the median of the universe presented for comparison, in light of the services that the fund and its shareholders receive and the other factors considered, including the findings of the Committee.
Annual Report
Costs of the Services and Profitability. The Board considered the revenues earned and the expenses incurred by Fidelity in conducting the business of developing, marketing, distributing, managing, administering and servicing the fund and its shareholders. The Board also considered the level of Fidelity's profits in respect of all the Fidelity funds.
On an annual basis, FMR presents to the Board Fidelity's profitability for the fund. Fidelity calculates the profitability for each fund, as well as aggregate profitability for groups of Fidelity funds and all Fidelity funds, using a series of detailed revenue and cost allocation methodologies which originate with the audited books and records of Fidelity. The Audit Committee of the Board reviews any significant changes from the prior year's methodologies.
PricewaterhouseCoopers LLP (PwC), independent registered public accounting firm and auditor to Fidelity and certain Fidelity funds, has been engaged annually by the Board as part of the Board's assessment of Fidelity's profitability analysis. PwC's engagement includes the review and assessment of Fidelity's methodologies used in determining the revenues and expenses attributable to Fidelity's mutual fund business, and completion of agreed-upon procedures surrounding the mathematical accuracy of fund profitability and its conformity to allocation methodologies. After considering PwC's reports issued under the engagement and information provided by Fidelity, the Board believes that while other allocation methods may also be reasonable, Fidelity's profitability methodologies are reasonable in all material respects.
The Board has also reviewed Fidelity's non-fund businesses and fall-out benefits related to the mutual fund business as well as cases where Fidelity's affiliates may benefit from or be related to the fund's business.
The Board considered the costs of the services provided by and the profits realized by Fidelity in connection with the operation of the fund and were satisfied that the profitability was not excessive in the circumstances.
Economies of Scale. The Board considered whether there have been economies of scale in respect of the management of the Fidelity funds, whether the Fidelity funds (including the fund) have appropriately benefited from any such economies of scale, and whether there is potential for realization of any further economies of scale. The Board considered the extent to which the fund will benefit from economies of scale through increased services to the fund, through waivers or reimbursements, or through fee or expense reductions.
In February 2009, the Board and the board of other Fidelity funds created an ad hoc committee (the Economies of Scale Committee) to analyze whether FMR attains economies of scale in respect of the management and servicing of the Fidelity funds, whether the Fidelity funds have appropriately benefited from such economies of scale, and whether there is potential for realization of any further economies of scale.
Annual Report
Board Approval of Investment Advisory Contracts and
Management Fees - continued
The Board recognized that the fund's management contract incorporates a "group fee" structure, which provides for lower group fee rates as total fund assets under FMR's management increase, and for higher group fee rates as total fund assets under FMR's management decrease. FMR calculates the group fee rates based on a tiered asset "breakpoint" schedule that varies based on asset class. The Board considered that the group fee is designed to deliver the benefits of economies of scale to fund shareholders when total Fidelity fund assets increase, even if assets of any particular fund are unchanged or have declined, because some portion of Fidelity's costs are attributable to services provided to all Fidelity funds, and all funds benefit if those costs can be allocated among more assets. The Board concluded that, given the group fee structure, fund shareholders will benefit from lower management fees as assets under FMR's management increase at the fund complex level, regardless of whether Fidelity achieves any such economies of scale.
The Board concluded, considering the findings of the Economies of Scale Committee, that any potential economies of scale are being appropriately shared between fund shareholders and Fidelity.
Additional Information Requested by the Board. In order to develop fully the factual basis for consideration of the Fidelity funds' Advisory Contracts, the Board requested and received additional information on certain topics, including (i) fund performance trends, actions to be taken by FMR to improve certain funds' overall performance, and Fidelity's long-term strategies for certain funds; (ii) Fidelity's fund profitability methodology and profitability trends for certain funds; (iii) portfolio manager changes that have occurred during the past year and the amount of the investment that each portfolio manager has made in the Fidelity fund(s) that he or she manages; (iv) Fidelity's compensation structure for portfolio managers, research analysts, and other key personnel, including its effects on fund profitability, the rationale for the compensation structure, and the extent to which current market conditions have affected retention and recruitment; (v) the compensation paid by FMR to fund sub-advisers on behalf of the Fidelity funds; (vi) Fidelity's fee structures and rationale for recommending different fees among different categories of funds and classes, as well as Fidelity's voluntary waiver of fees to maintain minimum yields for certain funds and classes; (vii) the rationale for any differences between fund fee structures and fee structures in place for other Fidelity clients; and (viii) explanations regarding the relative total expenses borne by certain funds and classes, total expense competitive trends, and actions that might be taken by FMR to reduce total expenses for certain funds and classes or to achieve further economies of scale.
Based on its evaluation of all of the conclusions noted above, and after considering all factors it believed relevant, the Board ultimately concluded that the advisory fee structures are fair and reasonable, and that the fund's Advisory Contracts should be renewed.
Annual Report
Managing Your Investments
Fidelity offers several ways to conveniently manage your personal investments via your telephone or PC. You can access your account information, conduct trades and research your investments 24 hours a day.
By Phone
Fidelity Automated Service Telephone provides a single toll-free number to access account balances, positions, quotes and trading. It's easy to navigate the service, and on your first call, the system will help you create a personal identification number (PIN) for security.
(phone_graphic)
Fidelity Automated
Service Telephone (FAST®)
1-800-544-5555
Press
 For mutual fund and brokerage trading.
 For quotes.*
 For account balances and holdings.
 To review orders and mutual
fund activity.
 To change your PIN.

 To speak to a Fidelity representative.
By PC
Fidelity's web site on the Internet provides a wide range of information, including daily financial news, fund performance, interactive planning tools and news about Fidelity products and services.
(computer_graphic)
Fidelity's Web Site
www.fidelity.com
* When you call the quotes line, please remember that a fund's yield and return will vary and, except for money market funds, share price will also vary. This means that you may have a gain or loss when you sell your shares. There is no assurance that money market funds will be able to maintain a stable $1 share price; an investment in a money market fund is not insured or guaranteed by the U.S. government. Total returns are historical and include changes in share price, reinvestment of dividends and capital gains distributions, and the effects of any sales charges.
Annual Report
To Write Fidelity
We'll give your correspondence immediate attention and send you written confirmation upon completion of your request.
(letter_graphic)
Making Changes
To Your Account
(such as changing name, address, bank, etc.)
Fidelity Investments
P.O. Box 770001
Cincinnati, OH 45277-0002
(letter_graphic)
For Non-Retirement
Accounts
Buying shares
Fidelity Investments
P.O. Box 770001
Cincinnati, OH 45277-0003
Overnight Express
Fidelity Investments
Attn: Distribution Services
100 Crosby Parkway - KC1H
Covington, KY 41015
Selling shares
Fidelity Investments
P.O. Box 770001
Cincinnati, OH 45277-0035
Overnight Express
Fidelity Investments
Attn: Distribution Services
100 Crosby Parkway - KC1H
Covington, KY 41015
General Correspondence
Fidelity Investments
P.O. Box 500
Merrimack, NH 03054-0500
(letter_graphic)
For Retirement
Accounts
Buying shares
Fidelity Investments
P.O. Box 770001
Cincinnati, OH 45277-0003
Selling shares
Fidelity Investments
P.O. Box 770001
Cincinnati, OH 45277-0035
Overnight Express
Fidelity Investments
Attn: Distribution Services
100 Crosby Parkway - KC1H
Covington, KY 41015
General Correspondence
Fidelity Investments
P.O. Box 500
Merrimack, NH 03054-0500
Annual Report
Investment Adviser
Fidelity Management & Research
Company
Boston, MA
Investment Sub-Advisers
Fidelity Investments
Money Management, Inc.
Fidelity Management & Research
(U.K.) Inc.
Fidelity Management & Research
(Hong Kong) Limited
Fidelity Management & Research
(Japan) Inc.
General Distributor
Fidelity Distributors Corporation
Boston, MA
Transfer and Service Agents
Citibank, N.A.
New York, NY
Fidelity Investments Institutional
Operations Company, Inc.
Boston, MA
Fidelity Service Company, Inc.
Boston, MA
Custodian
Citibank, N.A.
New York, NY
The Fidelity Telephone Connection
Mutual Fund 24-Hour Service
Exchanges/Redemptions
and Account Assistance 1-800-544-6666
Product Information 1-800-544-6666
Retirement Accounts 1-800-544-4774 (8 a.m. - 9 p.m.)
TDD Service 1-800-544-0118
for the deaf and hearing impaired
(9 a.m. - 9 p.m. Eastern time)
Fidelity Automated Service
Telephone (FAST)
1-800-544-5555
Automated line for quickest service
NFY-UANN-0311
1.789711.108

(Fidelity Investment logo)(registered trademark)
Fidelity Advisor®
New York Municipal Income
Fund - Class A, Class T, Class B
and Class C
Annual Report
January 31, 2011
Class A, Class T, Class B, and Class C are classes of Fidelity® New York Municipal Income Fund
(2_fidelity_logos) (Registered_Trademark)
Contents
Chairman's Message | The Chairman's message to shareholders. | |
Performance | How the fund has done over time. | |
Management's Discussion of Fund Performance | The Portfolio Manager's review of fund performance and strategy. | |
Shareholder Expense Example | An example of shareholder expenses. | |
Investment Changes | A summary of major shifts in the fund's investments over the past six months. | |
Investments | A complete list of the fund's investments with their market values. | |
Financial Statements | Statements of assets and liabilities, operations, and changes in net assets, as well as financial highlights. | |
Notes | Notes to the financial statements. | |
Report of Independent Registered Public Accounting Firm |
| |
Trustees and Officers |
| |
Distributions |
| |
Board Approval of Investment Advisory Contracts and Management Fees |
|
To view a fund's proxy voting guidelines and proxy voting record for the 12-month period ended June 30, visit http://www.fidelity.com/proxyvotingresults or visit the Securities and Exchange Commission's (SEC) web site at http://www.sec.gov. You may also call 1-877-208-0098 to request a free copy of the proxy voting guidelines.
Standard & Poor's, S&P and S&P 500 are registered service marks of The McGraw-Hill Companies, Inc. and have been licensed for use by Fidelity Distributors Corporation.
Other third party marks appearing herein are the property of their respective owners.
All other marks appearing herein are registered or unregistered trademarks or service marks of FMR LLC or an affiliated company.
Annual Report
This report and the financial statements contained herein are submitted for the general information of the shareholders of the fund. This report is not authorized for distribution to prospective investors in the fund unless preceded or accompanied by an effective prospectus.
A fund files its complete schedule of portfolio holdings with the SEC for the first and third quarters of each fiscal year on Form N-Q. Forms N-Q are available on the SEC's web site at http://www.sec.gov. A fund's Forms N-Q may be reviewed and copied at the SEC's Public Reference Room in Washington, DC. Information regarding the operation of the SEC's Public Reference Room may be obtained by calling 1-800-SEC-0330. For a complete list of a fund's portfolio holdings, view the most recent holdings listing, semiannual report, or annual report on Fidelity's web site at http://www.fidelity.com, http://www.advisor.fidelity.com, or http://www.401k.com, as applicable.
NOT FDIC INSURED • MAY LOSE VALUE • NO BANK GUARANTEE
Neither the fund nor Fidelity Distributors Corporation is a bank.
Annual Report
Chairman's Message
(photo_of_Abigail_P_Johnson)
Dear Shareholder:
Following a year in which the investment environment was volatile but generally supportive of most major asset classes, 2011 began on a positive note. U.S. equities gained ground in January, reaching their highest point since August 2008, amid indications the U.S. economy had turned a corner. Still, questions remained about the longer-term outlook, most notably persistently high unemployment. Financial markets are always unpredictable, of course, but there also are several time-tested investment principles that can help put the odds in your favor.
One of the basic tenets is to invest for the long term. Over time, riding out the markets' inevitable ups and downs has proven much more effective than selling into panic or chasing the hottest trend. Even missing only a few of the markets' best days can significantly diminish investor returns. Patience also affords the benefits of compounding - of earning interest on additional income or reinvested dividends and capital gains. There can be tax advantages and cost benefits to consider as well. While staying the course doesn't eliminate risk, it can considerably lessen the effect of short-term declines.
You can further manage your investing risk through diversification. And today, more than ever, geographic diversification should be taken into account. Studies indicate that asset allocation is the single most important determinant of a portfolio's long-term success. The right mix of stocks, bonds and cash - aligned to your particular risk tolerance and investment objective - is very important. Age-appropriate rebalancing is also an essential aspect of asset allocation. For younger investors, an emphasis on equities - which historically have been the best-performing asset class over time - is encouraged. As investors near their specific goal, such as retirement or sending a child to college, consideration may be given to replacing volatile assets (e.g. common stocks) with more-stable fixed investments (bonds or savings plans).
A third principle - investing regularly - can help lower the average cost of your purchases. Investing a certain amount of money each month or quarter helps ensure you won't pay for all your shares at market highs. This strategy - known as dollar cost averaging - also reduces "emotion" from investing, helping shareholders avoid selling weak performers just prior to an upswing, or chasing a hot performer just before a correction.
We invite you to contact us via the Internet, through our Investor Centers or by phone. It is our privilege to provide you the information you need to make the investments that are right for you.
Sincerely,
(The chairman's signature appears here.)
Abigail P. Johnson
Annual Report
Performance: The Bottom Line
Average annual total return reflects the change in the value of an investment, assuming reinvestment of the class' distributions from dividend income and capital gains (the profits earned upon the sale of securities that have grown in value, if any) and assuming a constant rate of performance each year. The $10,000 table and the fund's returns do not reflect the deduction of taxes that a shareholder would pay on fund distributions or the redemption of fund shares. During periods of reimbursement by Fidelity, a fund's total return will be greater than it would be had the reimbursement not occurred. How a fund did yesterday is no guarantee of how it will do tomorrow. Returns reflect the conversion of Class B shares to Class A shares after a maximum of seven years.
Average Annual Total Returns
Periods ended January 31, 2011 | Past 1 | Past 5 | Past 10 |
Class A (incl. 4.00% sales charge) A | -3.24% | 2.53% | 3.95% |
Class T (incl. 4.00% sales charge) B | -3.22% | 2.53% | 3.92% |
Class B (incl. contingent deferred sales charge) C | -4.72% | 2.32% | 3.84% |
Class C (incl. contingent deferred sales charge) D | -0.96% | 2.56% | 3.65% |
A As of April 1, 2007, Class A shares bear a 0.25% 12b-1 fee. The initial offering of Class A shares took place on August 1, 2002. Returns between August 1, 2002 and March 31, 2007 reflect a 0.15% 12b-1 fee. Returns prior to August 1, 2002 are those of Fidelity® New York Municipal Income Fund, the original retail class of the fund, which does not bear a 12b-1 fee. Had Class A shares' current 12b-1 fee been reflected, returns prior to April 1, 2007 would have been lower.
B As of August 1, 2002, Class T shares bear a 0.25% 12b-1 fee. The initial offering of Class T shares took place on August 1, 2002. Returns prior to August 1, 2002 are those of Fidelity New York Municipal Income Fund, the original retail class of the fund, which does not bear a 12b-1 fee. Had Class T shares' 12b-1 fee been reflected, returns prior to August 1, 2002 would have been lower.
C As of August 1, 2002, Class B shares bear a 0.90% 12b-1 fee. The initial offering of Class B shares took place on August 1, 2002. Returns prior to August 1, 2002 are those of Fidelity New York Municipal Income Fund, the original retail class of the fund, which does not bear a 12b-1 fee. Had Class B shares' 12b-1 fee been reflected, returns prior to August 1, 2002 would have been lower. Class B shares' contingent deferred sales charges included in the past one year, past five years, and past 10 years total return figures are 5%, 2%, and 0%, respectively.
D As of August 1, 2002, Class C shares bear a 1.00% 12b-1 fee. The initial offering of Class C shares took place on August 1, 2002. Returns prior to August 1, 2002 are those of Fidelity New York Municipal Income Fund, the original retail class of the fund, which does not bear a 12b-1 fee. Had Class C shares' 12b-1 fee been reflected, returns prior to August 1, 2002 would have been lower. Class C shares' contingent deferred sales charges included in the past one year, past five years, and past 10 years total return figures are 1%, 0%, and 0%, respectively.
Annual Report
$10,000 Over 10 Years
Let's say hypothetically that $10,000 was invested in Fidelity Advisor® New York Municipal Income Fund - Class A on January 31, 2001, and the current 4.00% sales charge was paid. The chart shows how the value of your investment would have changed, and also shows how the Barclays Capital® Municipal Bond Index performed over the same period. The initial offering of Class A took place on August 1, 2002. See the previous page for additional information regarding the performance of Class A.
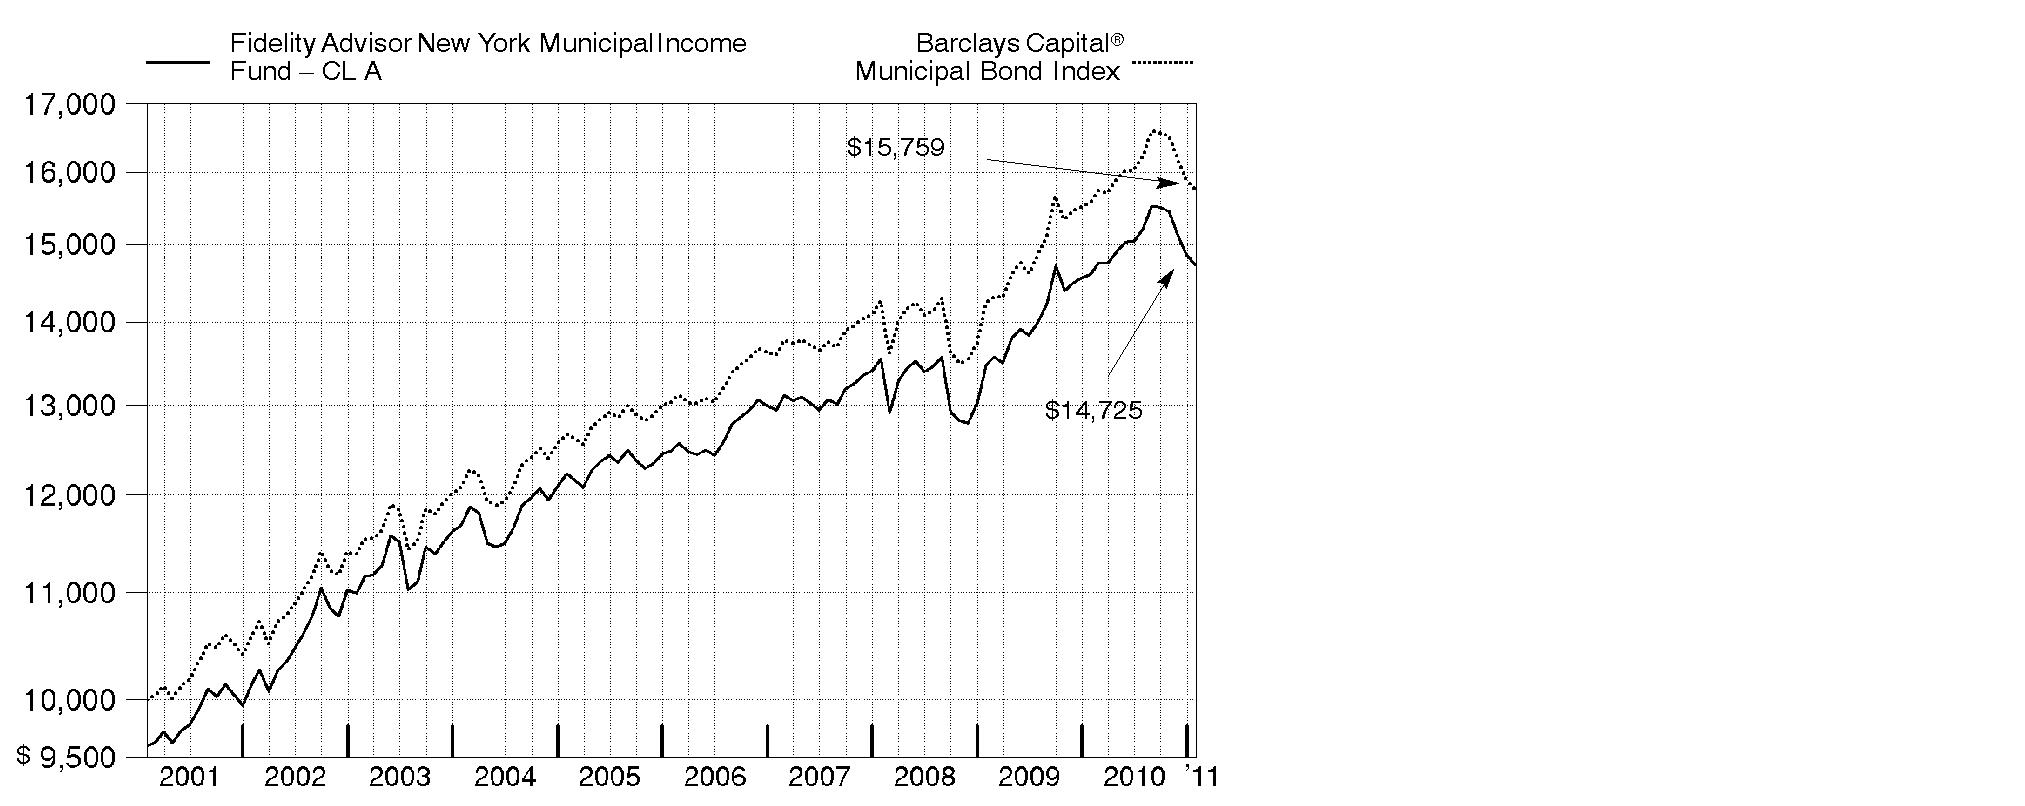
Annual Report
Management's Discussion of Fund Performance
Market Recap: Tax-exempt municipal bonds posted disappointing results for the 12 months ending January 31, 2011, primarily due to a significant late-period sell-off. For the full 12 months, the Barclays Capital® Municipal Bond Index - a measure of more than 46,000 fixed-rate tax-exempt investment-grade bonds - returned 1.10%, while the taxable investment-grade debt market, as measured by the Barclays Capital® U.S. Aggregate Bond Index, rose 5.06%. From February through August 2010, munis were on track for a solid year, bolstered by low, steady interest rates and generally favorable supply/demand dynamics. Supply was muted due to the popularity of "Build America Bonds" (BABs) - taxable securities that allowed municipal issuers to borrow more cheaply in the taxable market. Meanwhile, the possibility of higher tax rates in 2011 heightened investor demand for tax-advantaged investments. From September through November, however, munis came under pressure amid the prospect of rising interest rates, heavy new supply and the growing likelihood that Bush-era tax policies would be extended beyond 2010. In December and January, munis' woes were compounded by headlines suggesting an unprecedented wave of defaults among issuers.
Comments from Mark Sommer, Portfolio Manager of Fidelity Advisor® New York Municipal Income Fund: For the 12-month period ending January 31, 2011, the fund's Class A, Class T, Class B and Class C shares returned 0.79%, 0.81%, 0.15% and 0.01%, respectively (excluding sales charges). Meanwhile, the Barclays Capital New York 4+ Year Enhanced Municipal Bond Index posted a 1.16% gain. The fund's larger-than-index exposure to high-coupon callable bonds and underweighting in tobacco securities offset losses from out-of-benchmark exposure to long-maturity zero-coupon bonds issued in Puerto Rico. High-coupon callable bonds generally outpaced the benchmark during the year, thanks largely to their outperformance during a market sell-off later in the period. Tobacco securities initially lagged, due to concerns that declining cigarette consumption could lead to lower payments and, more recently, in response to investors avoiding riskier segments of the market. Investments in long-maturity zero-coupon bonds issued in Puerto Rico hurt, because these securities faltered on three fronts late in the period, when investor demand for lower-quality, long-maturity or uniquely structured securities was weak.
Comments from Mark Sommer, Portfolio Manager of Fidelity Advisor® New York Municipal Income Fund: For the 12-month period ending January 31, 2011, the fund's Institutional Class shares returned 1.01%, while the Barclays Capital New York 4+ Year Enhanced Municipal Bond Index posted a 1.16% gain. The fund's larger-than-index exposure to high-coupon callable bonds and underweighting in tobacco securities offset losses from out-of-benchmark exposure to long-maturity zero-coupon bonds issued in Puerto Rico. High-coupon callable bonds generally outpaced the benchmark during the year, thanks largely to their outperformance during a market sell-off later in the period. Tobacco securities initially lagged, due to concerns that declining cigarette consumption could lead to lower payments and, more recently, in response to investors avoiding riskier segments of the market. Investments in long-maturity zero-coupon bonds issued in Puerto Rico hurt, because these securities faltered on three fronts late in the period, when investor demand for lower-quality, long-maturity or uniquely structured securities was weak.
Annual Report
The views expressed above reflect those of the portfolio manager(s) only through the end of the period as stated on the cover of this report and do not necessarily represent the views of Fidelity or any other person in the Fidelity organization. Any such views are subject to change at any time based upon market or other conditions and Fidelity disclaims any responsibility to update such views. These views may not be relied on as investment advice and, because investment decisions for a Fidelity fund are based on numerous factors, may not be relied on as an indication of trading intent on behalf of any Fidelity fund.
Annual Report
Shareholder Expense Example
As a shareholder of the Fund, you incur two types of costs: (1) transaction costs, including sales charges (loads) on purchase payments or redemption proceeds, redemption fees, and (2) ongoing costs, including management fees, distribution and/or service (12b-1) fees and other Fund expenses. This Example is intended to help you understand your ongoing costs (in dollars) of investing in the Fund and to compare these costs with the ongoing costs of investing in other mutual funds.
The Example is based on an investment of $1,000 invested at the beginning of the period and held for the entire period (August 1, 2010 to January 31, 2011).
Actual Expenses
The first line of the accompanying table for each class of the Fund provides information about actual account values and actual expenses. You may use the information in this line, together with the amount you invested, to estimate the expenses that you paid over the period. Simply divide your account value by $1,000.00 (for example, an $8,600 account value divided by $1,000.00 = 8.6), then multiply the result by the number in the first line for a class of the Fund under the heading entitled "Expenses Paid During Period" to estimate the expenses you paid on your account during this period. A small balance maintenance fee of $12.00 that is charged once a year may apply for certain accounts with a value of less than $2,000. This fee is not included in the table below. If it was, the estimate of expenses you paid during the period would be higher, and your ending account value lower, by this amount.
Hypothetical Example for Comparison Purposes
The second line of the accompanying table for each class of the Fund provides information about hypothetical account values and hypothetical expenses based on a Class' actual expense ratio and an assumed rate of return of 5% per year before expenses, which is not the Class' actual return. The hypothetical account values and expenses may not be used to estimate the actual ending account balance or expenses you paid for the period. You may use this information to compare the ongoing costs of investing in the Fund and other funds. To do so, compare this 5% hypothetical example with the 5% hypothetical examples that appear in the shareholder reports of the other funds. A small balance maintenance fee of $12.00 that is charged once a year may apply for certain accounts with a value of less than $2,000. This fee is not included in the table below. If it was, the estimate of expenses you paid during the period would be higher, and your ending account value lower, by this amount.
Please note that the expenses shown in the table are meant to highlight your ongoing costs only and do not reflect any transaction costs. Therefore, the second line of the table is useful in comparing ongoing costs only, and will not help you determine the relative total costs of owning different funds. In addition, if these transactional costs were included, your costs would have been higher.
Annual Report
| Annualized Expense Ratio | Beginning | Ending | Expenses Paid |
Class A | .74% |
|
|
|
Actual |
| $ 1,000.00 | $ 968.50 | $ 3.67 |
HypotheticalA |
| $ 1,000.00 | $ 1,021.48 | $ 3.77 |
Class T | .73% |
|
|
|
Actual |
| $ 1,000.00 | $ 968.60 | $ 3.62 |
HypotheticalA |
| $ 1,000.00 | $ 1,021.53 | $ 3.72 |
Class B | 1.38% |
|
|
|
Actual |
| $ 1,000.00 | $ 966.20 | $ 6.84 |
HypotheticalA |
| $ 1,000.00 | $ 1,018.25 | $ 7.02 |
Class C | 1.52% |
|
|
|
Actual |
| $ 1,000.00 | $ 964.70 | $ 7.53 |
HypotheticalA |
| $ 1,000.00 | $ 1,017.54 | $ 7.73 |
New York Municipal Income | .46% |
|
|
|
Actual |
| $ 1,000.00 | $ 970.70 | $ 2.28 |
HypotheticalA |
| $ 1,000.00 | $ 1,022.89 | $ 2.35 |
Institutional Class | .54% |
|
|
|
Actual |
| $ 1,000.00 | $ 969.50 | $ 2.68 |
HypotheticalA |
| $ 1,000.00 | $ 1,022.48 | $ 2.75 |
A 5% return per year before expenses
* Expenses are equal to each Class' annualized expense ratio, multiplied by the average account value over the period, multiplied by 184/365 (to reflect the one-half year period).
Annual Report
Investment Changes (Unaudited)
Top Five Sectors as of January 31, 2011 | ||
| % of fund's | % of fund's net assets |
General Obligations | 29.6 | 31.1 |
Special Tax | 20.6 | 21.0 |
Transportation | 13.7 | 13.8 |
Education | 12.4 | 11.1 |
Water & Sewer | 10.1 | 10.2 |
Weighted Average Maturity as of January 31, 2011 | ||
|
| 6 months ago |
Years | 11.7 | 6.1 |
This is a weighted average of all the maturities of the securities held in a fund. Weighted Average Maturity (WAM) can be used as a measure of sensitivity to interest rate changes and markets changes. Generally, the longer the maturity, the greater the sensitivity to such changes. WAM is based on the dollar-weighted average length of time until principal payments must be paid. Depending on the types of securities held in a fund, certain maturity shortening devices (e.g., demand features, interest rate resets, and call options) may be taken into account when calculating the WAM. |
Duration as of January 31, 2011 | ||
|
| 6 months ago |
Years | 8.5 | 7.9 |
Duration shows how much a bond fund's price fluctuates with changes in comparable interest rates. If rates rise 1%, for example, a fund with a five-year duration is likely to lose about 5% of its value. Other factors also can influence a bond fund's performance and share price. Accordingly, a bond fund's actual performance may differ from this example. |
Quality Diversification (% of fund's net assets) | |||||||
As of January 31, 2011 | As of July 31, 2010 | ||||||
| AAA 14.4% |
| | AAA 13.1% |
| ||
| AA,A 78.1% |
| | AA,A 78.1% |
| ||
| BBB 5.3% |
| | BBB 5.6% |
| ||
| BB and Below 0.2% |
| | BB and Below 0.2% |
| ||
| Not Rated 0.8% |
| | Not Rated 1.8% |
| ||
| Short-Term |
| | Short-Term |
| ||

We have used ratings from Moody's Investors Service, Inc. Where Moody's® ratings are not available, we have used S&P® ratings. All ratings are as of the report date and do not reflect subsequent changes. |
Annual Report
Investments January 31, 2011
Showing Percentage of Net Assets
Municipal Bonds - 98.8% | ||||
| Principal Amount (000s) | Value (000s) | ||
New York - 92.5% | ||||
Albany Indl. Dev. Agcy. Civic Facility Rev. (St. Peters Hosp. Proj.) Series 2008 A, 5.75% 11/15/22 | $ 3,000 | $ 3,028 | ||
Dutchess County Indl. Dev. Agcy. Civic Facility Rev. (Bard College Proj.): | ||||
Series 2007 A1, 5% 8/1/12 | 500 | 519 | ||
Series 2007 A2, 5% 8/1/11 | 750 | 760 | ||
Erie County Indl. Dev. Agcy. School Facilities Rev. (Buffalo City School District Proj.): | ||||
Series 2003: | ||||
5.75% 5/1/17 (FSA Insured) | 8,940 | 9,370 | ||
5.75% 5/1/20 (FSA Insured) | 1,400 | 1,455 | ||
5.75% 5/1/21 | 1,755 | 1,821 | ||
5.75% 5/1/22 | 4,900 | 5,067 | ||
5.75% 5/1/23 | 1,000 | 1,031 | ||
Series 2004: | ||||
5.75% 5/1/17 | 5,950 | 6,516 | ||
5.75% 5/1/19 (FSA Insured) | 5,000 | 5,380 | ||
5.75% 5/1/23 (FSA Insured) | 9,620 | 10,032 | ||
5.75% 5/1/25 (FSA Insured) | 2,000 | 2,075 | ||
5.75% 5/1/26 | 8,985 | 9,309 | ||
Series 2007 A, 5.75% 5/1/27 | 5,000 | 5,323 | ||
Series 2008 A, 5.75% 5/1/29 (FSA Insured) | 3,535 | 3,785 | ||
Geneva Indl. Dev. Auth. Civic Facilities Rev. (Hobart & William Smith Proj.) Series 2003 A, 5.375% 2/1/23 (Nat'l. Pub. Fin. Guarantee Corp. Insured) | 3,485 | 3,515 | ||
Grand Central District Mgmt. Assoc., Inc. Series 2004, 5% 1/1/14 | 1,000 | 1,094 | ||
Great Neck North Wtr. Auth. Wtr. Sys. Rev. Series 2008, 5% 1/1/38 | 1,660 | 1,589 | ||
Hempstead Local Dev. Corp. Rev.: | ||||
(Adelphi Univ. Proj.): | ||||
Series 2009 A: | ||||
5% 2/1/12 | 1,000 | 1,024 | ||
5% 2/1/14 | 1,035 | 1,085 | ||
Series 2009 B, 5.25% 2/1/39 | 1,200 | 1,128 | ||
(Molloy College Proj.) Series 2009: | ||||
5% 7/1/17 | 1,035 | 1,092 | ||
5.25% 7/1/18 | 1,090 | 1,161 | ||
5.25% 7/1/19 | 1,100 | 1,160 | ||
5.75% 7/1/39 | 6,500 | 6,313 | ||
Long Island Pwr. Auth. Elec. Sys. Rev.: | ||||
Series 2000 A, 0% 6/1/19 (FSA Insured) | 1,935 | 1,438 | ||
Municipal Bonds - continued | ||||
| Principal Amount (000s) | Value (000s) | ||
New York - continued | ||||
Long Island Pwr. Auth. Elec. Sys. Rev.: - continued | ||||
Series 2006 A, 5.25% 12/1/20 (FGIC Insured) | $ 17,780 | $ 18,775 | ||
Series 2006 E, 5% 12/1/17 | 10,000 | 11,000 | ||
Series 2009 A: | ||||
5.75% 4/1/39 | 6,500 | 6,571 | ||
6.25% 4/1/33 | 1,655 | 1,781 | ||
Madison County Cap. Resource Corp. Rev. (Colgate Univ. Proj.) Series 2010 A: | ||||
5% 7/1/24 | 1,405 | 1,492 | ||
5% 7/1/25 | 1,000 | 1,047 | ||
5% 7/1/26 | 1,150 | 1,192 | ||
5% 7/1/27 | 1,630 | 1,678 | ||
5% 7/1/28 | 1,015 | 1,045 | ||
Metropolitan Trans. Auth. Svc. Contract Rev.: | ||||
Series 2002 A: | ||||
5.5% 7/1/20 | 3,000 | 3,079 | ||
5.75% 7/1/31 | 3,025 | 3,050 | ||
Series 2002 B: | ||||
5.5% 7/1/19 (Nat'l. Pub. Fin. Guarantee Corp. Insured) | 3,000 | 3,090 | ||
5.5% 7/1/23 | 5,000 | 5,095 | ||
Series 7, 5.625% 7/1/16 (Escrowed to Maturity) (c) | 3,000 | 3,161 | ||
Monroe County Arpt. Auth. Arpt. Rev. Series 2004, 5.25% 1/1/13 (Nat'l. Pub. Fin. Guarantee Corp. Insured) (b) | 1,000 | 1,025 | ||
Monroe County Indl. Dev. Agcy. Civic Facility Rev.: | ||||
(Highland Hosp. Proj.) Series 2005: | ||||
5% 8/1/11 | 1,510 | 1,527 | ||
5% 8/1/13 | 1,650 | 1,739 | ||
(Nazareth College Rochester Proj.) Series 2001, 5.25% 10/1/21 (Nat'l. Pub. Fin. Guarantee Corp. Insured) | 1,000 | 1,015 | ||
Nassau County Indl. Dev. Agcy. Civic Facility Rev. (North Shore Health Sys. Proj.): | ||||
Series 2001 A, 5.875% 11/1/11 | 30 | 31 | ||
Series 2001 B, 5.875% 11/1/11 | 190 | 195 | ||
New York City Gen. Oblig.: | ||||
Series 1997 B, 6.5% 8/15/11 | 1,000 | 1,032 | ||
Series 2000 A, 6.5% 5/15/11 | 195 | 198 | ||
Series 2001 G, 5.25% 8/1/14 (AMBAC Insured) | 1,635 | 1,656 | ||
Series 2003 A: | ||||
5.5% 8/1/20 (Nat'l. Pub. Fin. Guarantee Corp. Insured) | 6,110 | 6,543 | ||
Municipal Bonds - continued | ||||
| Principal Amount (000s) | Value (000s) | ||
New York - continued | ||||
New York City Gen. Oblig.: - continued | ||||
Series 2003 A: | ||||
5.5% 8/1/20 (Pre-Refunded to 8/1/13 @ 100) (c) | $ 45 | $ 50 | ||
Series 2005 F, 5.25% 8/1/12 | 2,000 | 2,027 | ||
Series 2005 O, 5% 6/1/22 | 5,000 | 5,213 | ||
Series 2006 A, 5% 8/1/19 | 3,000 | 3,217 | ||
Series 2006 I1, 5% 4/1/23 (Nat'l. Pub. Fin. Guarantee Corp. Insured) | 2,395 | 2,486 | ||
Series 2008 A1, 5.25% 8/15/27 | 15,000 | 15,327 | ||
Series 2008 D1, 5.125% 12/1/23 | 5,000 | 5,345 | ||
New York City Health & Hosp. Corp. Rev. Series 2008 A, 5.5% 2/15/21 | 5,000 | 5,358 | ||
New York City Indl. Dev. Agcy. Civic Facility Rev. (Spence School, Inc. Proj.) Series 2002, 5% 7/1/27 | 3,255 | 3,269 | ||
New York City Muni. Wtr. Fin. Auth. Wtr. & Swr. Sys. Rev.: | ||||
Series 2001 C, 5.125% 6/15/33 | 3,960 | 3,961 | ||
Series 2002 A: | ||||
5% 6/15/32 | 5,000 | 5,001 | ||
5.125% 6/15/34 | 16,500 | 16,537 | ||
Series 2002 G: | ||||
5.125% 6/15/32 | 3,000 | 3,000 | ||
5.125% 6/15/32 (FGIC Insured) | 4,750 | 4,751 | ||
Series 2003 A, 5.125% 6/15/34 | 4,200 | 4,209 | ||
Series 2003 E: | ||||
5% 6/15/34 | 2,000 | 1,967 | ||
5% 6/15/38 | 2,975 | 2,859 | ||
Series 2005 D: | ||||
5% 6/15/37 | 16,090 | 15,608 | ||
5% 6/15/38 | 20,050 | 19,410 | ||
5% 6/15/39 | 3,755 | 3,628 | ||
5% 6/15/39 | 2,800 | 2,705 | ||
Series 2007 DD: | ||||
4.75% 6/15/35 | 3,000 | 2,777 | ||
4.75% 6/15/36 | 1,000 | 923 | ||
Series 2008 AA, 5% 6/15/27 | 10,000 | 10,207 | ||
Series 2009 A, 5.75% 6/15/40 | 10,025 | 10,464 | ||
Series 2009 DD, 6% 6/15/40 | 1,115 | 1,184 | ||
Series 2009 EE, 5.25% 6/15/40 | 6,500 | 6,526 | ||
Series 2009 GG1, 5.25% 6/15/32 | 5,000 | 5,088 | ||
Series FF 2, 5.5% 6/15/40 | 9,295 | 9,494 | ||
Series GG, 5.25% 6/15/40 | 10,000 | 9,955 | ||
Municipal Bonds - continued | ||||
| Principal Amount (000s) | Value (000s) | ||
New York - continued | ||||
New York City Transitional Fin. Auth. Bldg. Aid Rev.: | ||||
Series 2007 S1, 5% 7/15/36 | $ 3,000 | $ 2,895 | ||
Series 2008 S1, 5% 1/15/34 | 10,000 | 9,707 | ||
Series 2009 S1: | ||||
5.5% 7/15/31 | 5,000 | 5,132 | ||
5.5% 7/15/38 | 2,900 | 2,958 | ||
5.625% 7/15/38 | 2,900 | 2,981 | ||
Series 2009 S2, 6% 7/15/38 | 7,500 | 7,881 | ||
Series 2009 S3: | ||||
5.25% 1/15/26 | 1,000 | 1,023 | ||
5.25% 1/15/39 | 3,400 | 3,385 | ||
5.375% 1/15/34 | 13,435 | 13,577 | ||
Series 2009 S4: | ||||
5.5% 1/15/34 | 1,000 | 1,025 | ||
5.5% 1/15/39 | 6,700 | 6,838 | ||
5.75% 1/15/39 | 2,900 | 3,007 | ||
Series 2009 S5, 5.25% 1/15/39 | 10,180 | 10,135 | ||
New York City Transitional Fin. Auth. Rev.: | ||||
Series 2002 A, 5.375% 11/15/21 | 1,100 | 1,162 | ||
Series 2003 D: | ||||
5% 2/1/31 | 20,025 | 20,051 | ||
5.25% 2/1/17 (Nat'l. Pub. Fin. Guarantee Corp. Insured) | 9,385 | 10,089 | ||
Series 2004 B: | ||||
5% 8/1/32 | 5,000 | 5,000 | ||
5.25% 8/1/19 | 2,810 | 3,056 | ||
Series 2004 C: | ||||
5% 2/1/28 | 15,000 | 15,124 | ||
5% 2/1/33 (FGIC Insured) | 7,350 | 7,292 | ||
Series A, 5.5% 11/15/17 (FGIC Insured) | 6,725 | 7,188 | ||
Series D: | ||||
5.25% 2/1/19 | 7,050 | 7,501 | ||
5.25% 2/1/20 (Nat'l. Pub. Fin. Guarantee Corp. Insured) | 4,185 | 4,445 | ||
New York City Trust Cultural Resources Rev.: | ||||
(Carnegie Hall Proj.) Series 2009 A, 5% 12/1/39 | 23,090 | 21,907 | ||
(Museum of Modern Art Proj.) Series 2001 D, 5.125% 7/1/31 | 3,200 | 3,204 | ||
Bonds (The Juilliard School Proj.) Series 2009 B, 2.75%, tender 7/1/12 (a) | 4,000 | 4,080 | ||
New York Convention Ctr. Dev. Corp. Rev. Series 2005, 5% 11/15/44 | 30,000 | 27,083 | ||
Municipal Bonds - continued | ||||
| Principal Amount (000s) | Value (000s) | ||
New York - continued | ||||
New York Dorm. Auth. Personal Income Tax Rev.: | ||||
(Ed. Proj.): | ||||
Series 2006 D: | ||||
5% 3/15/20 | $ 3,500 | $ 3,753 | ||
5% 3/15/36 | 3,320 | 3,250 | ||
Series 2007 A, 5% 3/15/37 | 1,700 | 1,661 | ||
Series 2008 B: | ||||
5.25% 3/15/38 | 1,500 | 1,513 | ||
5.75% 3/15/36 | 10,500 | 11,055 | ||
Series 2006 C: | ||||
5% 12/15/22 | 4,305 | 4,535 | ||
5% 12/15/31 | 10,000 | 10,015 | ||
Series 2007 A, 5% 3/15/32 | 3,700 | 3,681 | ||
Series 2008 A, 5% 3/15/24 | 5,000 | 5,212 | ||
Series 2009 A: | ||||
5% 2/15/34 | 15,500 | 15,250 | ||
5.25% 2/15/23 | 7,940 | 8,588 | ||
Series A, 5% 2/15/39 | 20,355 | 19,816 | ||
New York Dorm. Auth. Revs.: | ||||
(City Univ. Sys. Consolidation Proj.) Series A: | ||||
5.75% 7/1/13 | 4,800 | 5,058 | ||
5.75% 7/1/13 (AMBAC Insured) | 2,390 | 2,519 | ||
(Colgate Univ. Proj.) Series 1996: | ||||
6% 7/1/16 (Nat'l. Pub. Fin. Guarantee Corp. Insured) | 1,900 | 2,123 | ||
6% 7/1/21 (Nat'l. Pub. Fin. Guarantee Corp. Insured) | 2,500 | 2,875 | ||
(Cornell Univ. Proj.): | ||||
Series 2008 C: | ||||
5% 7/1/29 | 2,015 | 2,054 | ||
5% 7/1/37 | 6,000 | 5,948 | ||
Series 2009 A: | ||||
5% 7/1/22 | 445 | 482 | ||
5% 7/1/23 | 1,315 | 1,406 | ||
(Marymount Manhattan College Proj.) Series 2009: | ||||
5% 7/1/15 | 1,350 | 1,437 | ||
5% 7/1/17 | 2,080 | 2,193 | ||
(Mental Health Svcs. Proj.) Series 2005 E, 5% 2/15/22 (Nat'l. Pub. Fin. Guarantee Corp. Insured) | 5,115 | 5,267 | ||
(Montefiore Med. Ctr. Proj.) Series 2000: | ||||
5.8% 8/1/30 | 2,035 | 2,045 | ||
5.85% 8/1/40 | 9,500 | 9,555 | ||
Municipal Bonds - continued | ||||
| Principal Amount (000s) | Value (000s) | ||
New York - continued | ||||
New York Dorm. Auth. Revs.: - continued | ||||
(New York City Court Facilities Lease Proj.) Series 2005 A: | ||||
5.5% 5/15/20 | $ 13,000 | $ 14,277 | ||
5.5% 5/15/21 (AMBAC Insured) | 10,000 | 10,953 | ||
5.5% 5/15/28 | 2,700 | 2,739 | ||
(New York City Gen. Oblig. Proj.) Series B, 6% 7/1/14 | 1,820 | 1,974 | ||
(New York Univ. Hosp. Ctr. Proj.): | ||||
Series 2006 A: | ||||
5% 7/1/13 | 1,930 | 2,057 | ||
5% 7/1/14 | 2,510 | 2,695 | ||
5% 7/1/16 | 1,130 | 1,210 | ||
5% 7/1/20 | 2,000 | 2,011 | ||
Series 2007 A: | ||||
5% 7/1/11 | 1,365 | 1,385 | ||
5% 7/1/12 | 1,530 | 1,599 | ||
Series 2007 B, 5.25% 7/1/24 | 100 | 97 | ||
Series 2011 A: | ||||
5.75% 7/1/31 | 4,000 | 3,815 | ||
6% 7/1/40 | 4,000 | 3,840 | ||
(New York Univ. Proj.): | ||||
Series 2001 1, 5.5% 7/1/40 (AMBAC Insured) | 3,000 | 3,101 | ||
Series 2001 2: | ||||
5.5% 7/1/17 (AMBAC Insured) | 755 | 764 | ||
5.5% 7/1/19 (AMBAC Insured) | 1,705 | 1,724 | ||
5.5% 7/1/20 (AMBAC Insured) | 860 | 869 | ||
Series 2008 A, 5.25% 7/1/48 | 11,930 | 11,756 | ||
Series 2008 B, 5.25% 7/1/48 | 8,000 | 7,884 | ||
(North Shore - Long Island Jewish Obligated Group Proj.) Series 2009 A, 5.5% 5/1/37 | 8,085 | 7,666 | ||
(North Shore Univ. Hosp. Proj.): | ||||
Series 2007 A: | ||||
5% 5/1/19 | 2,000 | 2,035 | ||
5% 5/1/21 | 1,315 | 1,318 | ||
Series 1998, 5.5% 11/1/14 (Nat'l. Pub. Fin. Guarantee Corp. Insured) | 1,500 | 1,635 | ||
(Orange Reg'l. Med. Ctr. Proj.) Series 2008: | ||||
5.5% 12/1/12 | 3,125 | 3,192 | ||
6.125% 12/1/29 | 1,000 | 961 | ||
(Rochester Institute of Technology Proj.) Series 2010: | ||||
5% 7/1/20 | 1,000 | 1,073 | ||
Municipal Bonds - continued | ||||
| Principal Amount (000s) | Value (000s) | ||
New York - continued | ||||
New York Dorm. Auth. Revs.: - continued | ||||
(Rochester Institute of Technology Proj.) Series 2010: | ||||
5% 7/1/21 | $ 1,500 | $ 1,590 | ||
(Rockefeller Univ. Proj.) Series 2009 C, 5% 7/1/40 | 15,000 | 14,840 | ||
(School District Fing. Prog.): | ||||
Series 2002 D, 5.5% 10/1/17 (Nat'l. Pub. Fin. Guarantee Corp. Insured) | 10,825 | 11,413 | ||
Series 2002 E, 5.75% 10/1/22 (Nat'l. Pub. Fin. Guarantee Corp. Insured) | 1,485 | 1,545 | ||
Series 2002 H, 5.5% 10/1/17 (Nat'l. Pub. Fin. Guarantee Corp. Insured) | 2,600 | 2,741 | ||
Series 2002 I, 5.75% 10/1/18 (Nat'l. Pub. Fin. Guarantee Corp. Insured) | 500 | 529 | ||
(St. John's Univ. Proj.) Series 2007 A, 5.25% 7/1/37 (Nat'l. Pub. Fin. Guarantee Corp. Insured) | 18,915 | 18,107 | ||
(St. Lawrence Univ.) Series 2008, 5% 7/1/14 | 7,000 | 7,605 | ||
(State Univ. Edl. Facilities Proj.) Series A, 5.25% 5/15/15 (Nat'l. Pub. Fin. Guarantee Corp. Insured) | 8,855 | 9,832 | ||
(Teachers College Proj.) Series 2009: | ||||
5.375% 3/1/29 | 2,000 | 2,018 | ||
5.5% 3/1/39 | 2,500 | 2,482 | ||
(Univ. of Rochester Proj.) Series 2007 A1: | ||||
5% 7/1/18 | 3,000 | 3,233 | ||
5% 7/1/39 | 19,005 | 17,854 | ||
(Vassar College Proj.) Series 2010, 5% 7/1/49 | 9,000 | 8,310 | ||
(Winthrop-South Nassau Univ. Health Sys. Oblig. Group Proj.) Series 2003 A: | ||||
6% 7/1/14 | 1,095 | 1,148 | ||
6% 7/1/15 | 1,160 | 1,212 | ||
6% 7/1/16 | 1,230 | 1,280 | ||
(Yeshiva Univ. Proj.) Series 2001: | ||||
5.375% 7/1/16 (AMBAC Insured) | 670 | 678 | ||
5.375% 7/1/17 (AMBAC Insured) | 370 | 374 | ||
Bonds Series 2002 B: | ||||
5.25%, tender 5/15/12 (a) | 10,415 | 10,933 | ||
6%, tender 5/15/12 (a) | 11,000 | 11,651 | ||
Series 2002 A, 5.75% 10/1/17 (Nat'l. Pub. Fin. Guarantee Corp. Insured) | 30,260 | 32,071 | ||
Series 2002 B: | ||||
6% 10/1/22 (Nat'l. Pub. Fin. Guarantee Corp. Insured) | 2,775 | 2,879 | ||
6% 10/1/29 (Nat'l. Pub. Fin. Guarantee Corp. Insured) | 5,600 | 5,760 | ||
Municipal Bonds - continued | ||||
| Principal Amount (000s) | Value (000s) | ||
New York - continued | ||||
New York Dorm. Auth. Revs.: - continued | ||||
Series 2005 B: | ||||
5.25% 7/1/20 (Nat'l. Pub. Fin. Guarantee Corp. Insured) | $ 3,345 | $ 3,518 | ||
5.25% 7/1/21 (Nat'l. Pub. Fin. Guarantee Corp. Insured) | 1,745 | 1,824 | ||
5.25% 7/1/22 (Nat'l. Pub. Fin. Guarantee Corp. Insured) | 1,835 | 1,912 | ||
Series 2005 F, 5% 3/15/35 (FSA Insured) | 5,000 | 5,020 | ||
Series 2010 A: | ||||
5% 7/1/19 | 1,500 | 1,586 | ||
5% 7/1/21 | 7,000 | 7,196 | ||
5% 7/1/22 | 6,000 | 6,076 | ||
Series 2010, 5% 7/1/41 | 12,000 | 11,833 | ||
New York Envir. Facilities Corp. Clean Wtr. & Drinking Wtr.: | ||||
(New York City Muni. Wtr. Fin. Auth. Proj.): | ||||
Series 2002 B, 5.25% 6/15/16 | 500 | 529 | ||
Series 2002 D, 5.125% 6/15/31 | 6,900 | 6,940 | ||
Series 2002 G, 5.25% 10/15/20 | 1,255 | 1,272 | ||
Series 2004 F, 5% 6/15/34 | 4,825 | 4,847 | ||
Series 2003 I, 5% 6/15/24 | 2,000 | 2,088 | ||
Series 2004 D, 5% 2/15/34 | 12,150 | 12,208 | ||
New York Envir. Facilities Corp. Poll. Cont. Rev.: | ||||
(New York City Muni. Wtr. Fin. Auth. Proj.): | ||||
Series 1996 C, 5.85% 7/15/15 | 30 | 30 | ||
Series A, 7% 6/15/12 | 190 | 191 | ||
Series E, 6.5% 6/15/14 | 130 | 131 | ||
(Pooled Ln. Prog.) Series 1993 B, 5.2% 5/15/14 | 1,115 | 1,181 | ||
New York Hsg. Fin. Agcy. Personal Income Tax Rev. (Econ. Dev. & Hsg. Proj.) Series 2008 A, 5% 3/15/34 | 10,000 | 9,838 | ||
New York Metropolitan Trans. Auth. Dedicated Tax Fund Rev.: | ||||
Series 2002 A, 5.5% 11/15/26 | 13,575 | 13,737 | ||
Series 2009 A: | ||||
5.5% 11/15/39 | 10,400 | 10,544 | ||
5.625% 11/15/39 | 6,000 | 6,130 | ||
Series B, 5% 11/15/34 | 19,560 | 18,847 | ||
New York Metropolitan Trans. Auth. Rev.: | ||||
Series 2002 A, 5.75% 11/15/32 | 10,000 | 10,060 | ||
Series 2003 A, 5.5% 11/15/19 (FGIC Insured) | 5,000 | 5,610 | ||
Municipal Bonds - continued | ||||
| Principal Amount (000s) | Value (000s) | ||
New York - continued | ||||
New York Metropolitan Trans. Auth. Rev.: - continued | ||||
Series 2003 B, 5.25% 11/15/18 (Nat'l. Pub. Fin. Guarantee Corp. Insured) | $ 4,000 | $ 4,167 | ||
Series 2005 A, 5.5% 11/15/18 (AMBAC Insured) | 2,000 | 2,254 | ||
Series 2005 B, 5% 11/15/35 (Nat'l. Pub. Fin. Guarantee Corp. Insured) | 3,300 | 3,038 | ||
Series 2007 B: | ||||
5% 11/15/26 | 8,185 | 7,932 | ||
5% 11/15/28 | 2,235 | 2,090 | ||
Series 2008 A, 5.25% 11/15/36 | 15,000 | 14,485 | ||
Series 2008 C, 6.5% 11/15/28 | 9,445 | 10,190 | ||
New York Pwr. Auth.: | ||||
Series 2000 A, 5.25% 11/15/40 | 25,860 | 25,742 | ||
Series 2007 A, 5% 11/15/47 (Nat'l. Pub. Fin. Guarantee Corp. Insured) | 20,000 | 18,756 | ||
New York Sales Tax Asset Receivables Corp. Series 2005 A, 5.25% 10/15/27 (AMBAC Insured) | 4,355 | 4,472 | ||
New York State Dorm. Auth. Lease Rev. Bonds Series 2003 B, 5.25%, tender 7/1/13 (XL Cap. Assurance, Inc. Insured) (a) | 10,000 | 10,791 | ||
New York State Energy Research & Dev. Auth. Facilities Rev. Bonds (Consolidated Edison Co. of New York, Inc. Proj.) Series 2010 A, 1.45%, tender 11/1/12 (a)(b) | 11,800 | 11,771 | ||
New York State Gen. Oblig. Series 2009 A, 0% 2/15/19 | 2,835 | 2,142 | ||
New York Thruway Auth. Gen. Rev.: | ||||
Series 2005 G: | ||||
5% 1/1/32 (FSA Insured) | 2,800 | 2,664 | ||
5.25% 1/1/27 | 6,570 | 6,621 | ||
Series 2007 H: | ||||
5% 1/1/21 | 5,755 | 5,986 | ||
5% 1/1/25 | 13,000 | 13,037 | ||
5% 1/1/26 | 4,000 | 3,983 | ||
New York Thruway Auth. Hwy. & Bridge Trust Fund: | ||||
Series 2005 B: | ||||
5% 4/1/17 (Nat'l. Pub. Fin. Guarantee Corp. Insured) | 9,660 | 10,596 | ||
5.5% 4/1/20 (AMBAC Insured) | 27,375 | 31,150 | ||
Series 2007 B, 5% 4/1/27 | 6,750 | 6,799 | ||
New York Thruway Auth. Personal Income Tax Rev. Series 2007 A: | ||||
5.25% 3/15/24 | 4,180 | 4,431 | ||
5.25% 3/15/25 | 8,000 | 8,363 | ||
Municipal Bonds - continued | ||||
| Principal Amount (000s) | Value (000s) | ||
New York - continued | ||||
New York Thruway Auth. Personal Income Tax Rev. Series 2007 A: - continued | ||||
5.25% 3/15/26 | $ 12,080 | $ 12,565 | ||
New York Urban Dev. Corp. Rev.: | ||||
(Econ. Dev. and Hsg. Proj.) Series 2008 A1, 5% 12/15/26 | 10,000 | 10,239 | ||
(State Facilities and Equip. Proj.) Series 2004 A2, 5.5% 3/15/22 (Nat'l. Pub. Fin. Guarantee Corp. Insured) | 4,000 | 4,546 | ||
Series 2007 A: | ||||
5% 1/1/23 (FSA Insured) | 6,165 | 6,477 | ||
5% 1/1/24 (FSA Insured) | 5,975 | 6,223 | ||
Niagara Falls City Niagara County Pub. Impt. Series 1994: | ||||
7.5% 3/1/11 (Escrowed to Maturity) (c) | 105 | 106 | ||
7.5% 3/1/16 (Escrowed to Maturity) (c) | 90 | 115 | ||
7.5% 3/1/16 (Nat'l. Pub. Fin. Guarantee Corp. Insured) | 970 | 1,149 | ||
7.5% 3/1/17 (Escrowed to Maturity) (c) | 100 | 130 | ||
7.5% 3/1/17 (Nat'l. Pub. Fin. Guarantee Corp. Insured) | 1,100 | 1,314 | ||
Niagara Falls Pub. Wtr. Auth. Series 2005, 5.5% 7/15/34 (XL Cap. Assurance, Inc. Insured) | 1,000 | 934 | ||
Oneida County Indl. Dev. Agcy. (Hamilton College Proj.) Series 2002, 5% 9/15/32 | 5,000 | 4,903 | ||
Saratoga County Indl. Dev. Agcy. (The Saratoga Hosp. Proj.) Series 2007 B, 5.25% 12/1/32 | 680 | 605 | ||
Schenectady Indl. Dev. Agcy. Civic Facility Rev. (Union College Proj.) Series 2006, 5% 7/1/15 | 1,005 | 1,109 | ||
Suffolk County Indl. Dev. Agcy. Civic Facility Rev. (Huntington Hosp. Proj.) Series 2002 B, 6% 11/1/22 | 4,305 | 4,371 | ||
Taconic Hills Central School District at Craryville Series 2002, 5% 6/15/16 (FGIC Insured) | 1,130 | 1,166 | ||
Tobacco Settlement Fing. Corp.: | ||||
Series 2003 A1: | ||||
5.25% 6/1/21 (AMBAC Insured) | 3,255 | 3,358 | ||
5.25% 6/1/22 (AMBAC Insured) | 8,070 | 8,270 | ||
5.5% 6/1/14 | 3,330 | 3,342 | ||
5.5% 6/1/15 | 2,980 | 2,991 | ||
5.5% 6/1/16 | 17,500 | 17,558 | ||
5.5% 6/1/17 | 7,000 | 7,064 | ||
5.5% 6/1/18 (Nat'l. Pub. Fin. Guarantee Corp. Insured) | 3,000 | 3,096 | ||
Municipal Bonds - continued | ||||
| Principal Amount (000s) | Value (000s) | ||
New York - continued | ||||
Tobacco Settlement Fing. Corp.: - continued | ||||
Series 2003 A1: | ||||
5.5% 6/1/19 | $ 4,600 | $ 4,825 | ||
Series 2003B 1C: | ||||
5.5% 6/1/14 | 4,495 | 4,512 | ||
5.5% 6/1/15 | 11,800 | 11,842 | ||
5.5% 6/1/16 | 10,040 | 10,172 | ||
5.5% 6/1/17 | 5,700 | 5,752 | ||
5.5% 6/1/18 | 3,800 | 3,922 | ||
5.5% 6/1/19 | 13,620 | 14,285 | ||
5.5% 6/1/20 | 16,000 | 16,720 | ||
5.5% 6/1/21 | 12,070 | 12,572 | ||
5.5% 6/1/22 | 9,700 | 10,037 | ||
Triborough Bridge & Tunnel Auth. Revs.: | ||||
(MTA Bridges and Tunnels Proj.): | ||||
Series 2006 A, 5% 11/15/31 | 4,375 | 4,363 | ||
Series 2007 A, 5% 11/15/27 | 6,410 | 6,539 | ||
Series 2008 A: | ||||
5% 11/15/37 | 17,500 | 16,849 | ||
5.25% 11/15/38 | 14,500 | 14,525 | ||
Series 2001 A: | ||||
5% 1/1/32 | 3,010 | 2,956 | ||
5% 1/1/32 (Nat'l. Pub. Fin. Guarantee Corp. Insured) | 1,455 | 1,429 | ||
Series 2002 A, 5.25% 1/1/19 | 1,100 | 1,124 | ||
Troy Cap. Resource Corp. Rev. (Rensselaer Polytechnic Institute Proj.) Series 2010 A: | ||||
5% 9/1/30 | 5,000 | 4,685 | ||
5.125% 9/1/40 | 8,055 | 7,344 | ||
Yonkers Gen. Oblig. Series 2005 A, 5% 8/1/15 (Nat'l. Pub. Fin. Guarantee Corp. Insured) | 4,000 | 4,310 | ||
Yonkers Indl. Dev. Agcy. Civic Facility Rev. (Sarah Lawrence College Proj.) Series A: | ||||
6% 6/1/29 | 1,130 | 1,162 | ||
6% 6/1/41 | 5,000 | 4,972 | ||
| 1,568,501 | |||
New York & New Jersey - 4.4% | ||||
Port Auth. of New York & New Jersey: | ||||
124th Series, 5% 8/1/13 (FGIC Insured) (b) | 3,000 | 3,006 | ||
126th Series, 5.25% 5/15/37 (FGIC Insured) (b) | 4,175 | 4,053 | ||
134th Series, 5% 1/15/39 | 10,000 | 9,735 | ||
136th Series, 5.25% 11/1/16 (b) | 4,510 | 4,948 | ||
Municipal Bonds - continued | ||||
| Principal Amount (000s) | Value (000s) | ||
New York & New Jersey - continued | ||||
Port Auth. of New York & New Jersey: - continued | ||||
141st Series: | ||||
5% 9/1/18 (b) | $ 6,045 | $ 6,420 | ||
5% 9/1/21 (CIFG North America Insured) (b) | 4,600 | 4,818 | ||
147th Series, 5% 10/15/17 (b) | 5,000 | 5,441 | ||
163rd Series, 5% 7/15/35 | 25,000 | 24,584 | ||
85th Series, 5.375% 3/1/28 | 6,280 | 6,630 | ||
Port Auth. of New York & New Jersey Spl. Oblig. Rev. (JFK Int'l. Air Term. Spl. Proj.) Series 6, 6.25% 12/1/15 (Nat'l. Pub. Fin. Guarantee Corp. Insured) (b) | 5,000 | 5,234 | ||
| 74,869 | |||
Puerto Rico - 1.5% | ||||
Puerto Rico Commonwealth Hwy. & Trans. Auth. Trans. Rev. Series 1998, 5.75% 7/1/22 (CIFG North America Insured) | 3,000 | 2,975 | ||
Puerto Rico Commonwealth Infrastructure Fing. Auth. Series 2005 C, 5.5% 7/1/27 | 1,000 | 942 | ||
Puerto Rico Commonwealth Pub. Impt. Gen. Oblig.: | ||||
(Pub. Impt. Proj.) Series 2002 A, 5.5% 7/1/20 (Nat'l. Pub. Fin. Guarantee Corp. Insured) | 4,150 | 4,217 | ||
Series 2007 A, 5.5% 7/1/19 (Nat'l. Pub. Fin. Guarantee Corp. Insured) | 5,000 | 5,149 | ||
Puerto Rico Elec. Pwr. Auth. Pwr. Rev. Series QQ: | ||||
5.25% 7/1/13 (XL Cap. Assurance, Inc. Insured) | 1,500 | 1,608 | ||
5.5% 7/1/16 (XL Cap. Assurance, Inc. Insured) | 1,000 | 1,098 | ||
Puerto Rico Muni. Fin. Agcy. Series 2005 C, 5.25% 8/1/17 (FSA Insured) | 1,000 | 1,073 | ||
Puerto Rico Sales Tax Fing. Corp. Sales Tax Rev.: | ||||
Series 2007 A: | ||||
0% 8/1/41 (FGIC Insured) | 33,500 | 4,147 | ||
0% 8/1/45 (Nat'l. Pub. Fin. Guarantee Corp. Insured) | 1,650 | 154 | ||
0% 8/1/47 (AMBAC Insured) | 2,400 | 194 | ||
Series 2009 A, 6% 8/1/42 | 2,900 | 2,888 | ||
| 24,445 | |||
Municipal Bonds - continued | ||||
| Principal Amount (000s) | Value (000s) | ||
Virgin Islands - 0.4% | ||||
Virgin Islands Pub. Fin. Auth. Series 2009 B: | ||||
5% 10/1/16 | $ 4,000 | $ 4,242 | ||
5% 10/1/17 | 2,750 | 2,894 | ||
| 7,136 | |||
TOTAL INVESTMENT PORTFOLIO - 98.8% (Cost $1,697,611) | 1,674,951 | ||
NET OTHER ASSETS (LIABILITIES) - 1.2% | 20,490 | ||
NET ASSETS - 100% | $ 1,695,441 | ||
Legend |
(a) Coupon rates for floating and adjustable rate securities reflect the rates in effect at period end. |
(b) Private activity obligations whose interest is subject to the federal alternative minimum tax for individuals. |
(c) Security collateralized by an amount sufficient to pay interest and principal. |
Other Information |
All investments are categorized as Level 2 under the Fair Value Hierarchy. The inputs or methodology used for valuing securities may not be an indication of the risk associated with investing in those securities. For more information on valuation inputs, please refer to the Security Valuation section in the accompanying Notes to Financial Statements. |
The distribution of municipal securities by revenue source, as a percentage of total net assets, is as follows (Unaudited): |
General Obligations | 29.6% |
Special Tax | 20.6% |
Transportation | 13.7% |
Education | 12.4% |
Water & Sewer | 10.1% |
Electric Utilities | 5.8% |
Others* (Individually Less Than 5%) | 7.8% |
| 100.0% |
*Includes net other assets |
See accompanying notes which are an integral part of the financial statements.
Annual Report
Financial Statements
Statement of Assets and Liabilities
Amounts in thousands (except per-share amounts) | January 31, 2011 | |
|
|
|
Assets | ||
Investment in securities, at value - See accompanying schedule: Unaffiliated issuers (cost $1,697,611) |
| $ 1,674,951 |
Cash | 3,577 | |
Receivable for fund shares sold | 3,500 | |
Interest receivable | 18,861 | |
Prepaid expenses | 4 | |
Other receivables | 3 | |
Total assets | 1,700,896 | |
|
|
|
Liabilities | ||
Payable for fund shares redeemed | $ 3,020 | |
Distributions payable | 1,530 | |
Accrued management fee | 528 | |
Distribution and service plan fees payable | 39 | |
Other affiliated payables | 288 | |
Other payables and accrued expenses | 50 | |
Total liabilities | 5,455 | |
|
|
|
Net Assets | $ 1,695,441 | |
Net Assets consist of: |
| |
Paid in capital | $ 1,714,053 | |
Undistributed net investment income | 84 | |
Accumulated undistributed net realized gain (loss) on investments | 3,964 | |
Net unrealized appreciation (depreciation) on investments | (22,660) | |
Net Assets | $ 1,695,441 | |
See accompanying notes which are an integral part of the financial statements.
Annual Report
Statement of Assets and Liabilities - continued
Amounts in thousands (except per-share amounts) | January 31, 2011 | |
|
|
|
Calculation of Maximum Offering Price | $ 12.48 | |
|
|
|
Maximum offering price per share (100/96.00 of $12.48) | $ 13.00 | |
Class T: | $ 12.49 | |
|
|
|
Maximum offering price per share (100/96.00 of $12.49) | $ 13.01 | |
Class B: | $ 12.48 | |
|
|
|
Class C: | $ 12.48 | |
|
|
|
|
|
|
New York Municipal Income: | $ 12.49 | |
|
|
|
Institutional Class: | $ 12.47 | |
A Redemption price per share is equal to net asset value less any applicable contingent deferred sales charge.
See accompanying notes which are an integral part of the financial statements.
Annual Report
Financial Statements - continued
Statement of Operations
Amounts in thousands | Year ended January 31, 2011 | |
|
|
|
Investment Income |
|
|
Interest |
| $ 81,775 |
|
|
|
Expenses | ||
Management fee | $ 6,984 | |
Transfer agent fees | 1,408 | |
Distribution and service plan fees | 487 | |
Accounting fees and expenses | 349 | |
Custodian fees and expenses | 27 | |
Independent trustees' compensation | 7 | |
Registration fees | 88 | |
Audit | 58 | |
Legal | 11 | |
Miscellaneous | 22 | |
Total expenses before reductions | 9,441 | |
Expense reductions | (24) | 9,417 |
Net investment income | 72,358 | |
Realized and Unrealized Gain (Loss) Net realized gain (loss) on: | ||
Investment securities: |
|
|
Unaffiliated issuers |
| 6,167 |
Change in net unrealized appreciation (depreciation) on investment securities | (58,519) | |
Net gain (loss) | (52,352) | |
Net increase (decrease) in net assets resulting from operations | $ 20,006 | |
See accompanying notes which are an integral part of the financial statements.
Annual Report
Statement of Changes in Net Assets
Amounts in thousands | Year ended | Year ended |
Increase (Decrease) in Net Assets |
|
|
Operations |
|
|
Net investment income | $ 72,358 | $ 65,029 |
Net realized gain (loss) | 6,167 | (912) |
Change in net unrealized appreciation (depreciation) | (58,519) | 74,634 |
Net increase (decrease) in net assets resulting | 20,006 | 138,751 |
Distributions to shareholders from net investment income | (72,377) | (65,025) |
Distributions to shareholders from net realized gain | (296) | - |
Total distributions | (72,673) | (65,025) |
Share transactions - net increase (decrease) | (81,293) | 268,343 |
Redemption fees | 32 | 40 |
Total increase (decrease) in net assets | (133,928) | 342,109 |
|
|
|
Net Assets | ||
Beginning of period | 1,829,369 | 1,487,260 |
End of period (including undistributed net investment income of $84 and undistributed net investment income of $103, respectively) | $ 1,695,441 | $ 1,829,369 |
See accompanying notes which are an integral part of the financial statements.
Annual Report
Financial Highlights - Class A
Years ended January 31, | 2011 | 2010 | 2009 | 2008 | 2007 |
Selected Per-Share Data |
|
|
|
|
|
Net asset value, beginning of period | $ 12.83 | $ 12.27 | $ 12.80 | $ 12.70 | $ 12.81 |
Income from Investment Operations |
|
|
|
|
|
Net investment income C | .459 | .454 | .449 | .446 | .464 |
Net realized and unrealized gain (loss) | (.347) | .560 | (.521) | .134 | .002 |
Total from investment operations | .112 | 1.014 | (.072) | .580 | .466 |
Distributions from net investment income | (.460) | (.454) | (.451) | (.446) | (.464) |
Distributions from net realized gain | (.002) | - | (.007) | (.034) | (.112) |
Total distributions | (.462) | (.454) | (.458) | (.480) | (.576) |
Redemption fees added to paid in capital C, E | - | - | - | - | - |
Net asset value, end of period | $ 12.48 | $ 12.83 | $ 12.27 | $ 12.80 | $ 12.70 |
Total Return A, B | .79% | 8.39% | (.49)% | 4.67% | 3.72% |
Ratios to Average Net Assets D |
|
|
|
|
|
Expenses before reductions | .75% | .77% | .75% | .73% | .66% |
Expenses net of fee waivers, if any | .75% | .77% | .75% | .73% | .66% |
Expenses net of all reductions | .75% | .77% | .74% | .70% | .63% |
Net investment income | 3.54% | 3.60% | 3.67% | 3.52% | 3.65% |
Supplemental Data |
|
|
|
|
|
Net assets, end of period (in millions) | $ 33 | $ 35 | $ 21 | $ 13 | $ 11 |
Portfolio turnover rate | 10% | 4% | 17% | 13% | 23% |
A Total returns would have been lower had certain expenses not been reduced during the periods shown.
B Total returns do not include the effect of the sales charges.
C Calculated based on average shares outstanding during the period.
D Expense ratios reflect operating expenses of the class. Expenses before reductions do not reflect amounts reimbursed by the investment adviser or reductions from brokerage service arrangements or reductions from other expense offset arrangements and do not represent the amount paid by the class during periods when reimbursements or reductions occur. Expenses net of fee waivers reflect expenses after reimbursement by the investment adviser but prior to reductions from brokerage service arrangements or other expense offset arrangements. Expenses net of all reductions represent the net expenses paid by the class.
E Amount represents less than $.001 per share.
See accompanying notes which are an integral part of the financial statements.
Annual Report
Financial Highlights - Class T
Years ended January 31, | 2011 | 2010 | 2009 | 2008 | 2007 |
Selected Per-Share Data |
|
|
|
|
|
Net asset value, beginning of period | $ 12.84 | $ 12.28 | $ 12.81 | $ 12.71 | $ 12.82 |
Income from Investment Operations |
|
|
|
|
|
Net investment income C | .463 | .459 | .452 | .446 | .455 |
Net realized and unrealized gain (loss) | (.348) | .561 | (.520) | .134 | .001 |
Total from investment operations | .115 | 1.020 | (.068) | .580 | .456 |
Distributions from net investment income | (.463) | (.460) | (.455) | (.446) | (.454) |
Distributions from net realized gain | (.002) | - | (.007) | (.034) | (.112) |
Total distributions | (.465) | (.460) | (.462) | (.480) | (.566) |
Redemption fees added to paid in capital C, E | - | - | - | - | - |
Net asset value, end of period | $ 12.49 | $ 12.84 | $ 12.28 | $ 12.81 | $ 12.71 |
Total Return A, B | .81% | 8.43% | (.46)% | 4.67% | 3.64% |
Ratios to Average Net Assets D |
|
|
|
|
|
Expenses before reductions | .73% | .73% | .72% | .72% | .74% |
Expenses net of fee waivers, if any | .73% | .73% | .72% | .72% | .74% |
Expenses net of all reductions | .73% | .73% | 71% | .70% | .71% |
Net investment income | 3.56% | 3.64% | 3.70% | 3.53% | 3.57% |
Supplemental Data |
|
|
|
|
|
Net assets, end of period (in millions) | $ 8 | $ 9 | $ 8 | $ 5 | $ 4 |
Portfolio turnover rate | 10% | 4% | 17% | 13% | 23% |
A Total returns would have been lower had certain expenses not been reduced during the periods shown.
B Total returns do not include the effect of the sales charges.
C Calculated based on average shares outstanding during the period.
D Expense ratios reflect operating expenses of the class. Expenses before reductions do not reflect amounts reimbursed by the investment adviser or reductions from brokerage service arrangements or reductions from other expense offset arrangements and do not represent the amount paid by the class during periods when reimbursements or reductions occur. Expenses net of fee waivers reflect expenses after reimbursement by the investment adviser but prior to reductions from brokerage service arrangements or other expense offset arrangements. Expenses net of all reductions represent the net expenses paid by the class.
E Amount represents less than $.001 per share.
See accompanying notes which are an integral part of the financial statements.
Annual Report
Financial Highlights - Class B
Years ended January 31, | 2011 | 2010 | 2009 | 2008 | 2007 |
Selected Per-Share Data |
|
|
|
|
|
Net asset value, beginning of period | $ 12.83 | $ 12.26 | $ 12.80 | $ 12.70 | $ 12.81 |
Income from Investment Operations |
|
|
|
|
|
Net investment income C | .376 | .372 | .370 | .358 | .366 |
Net realized and unrealized gain (loss) | (.347) | .571 | (.533) | .134 | .002 |
Total from investment operations | .029 | .943 | (.163) | .492 | .368 |
Distributions from net investment income | (.377) | (.373) | (.370) | (.358) | (.366) |
Distributions from net realized gain | (.002) | - | (.007) | (.034) | (.112) |
Total distributions | (.379) | (.373) | (.377) | (.392) | (.478) |
Redemption fees added to paid in capital C, E | - | - | - | - | - |
Net asset value, end of period | $ 12.48 | $ 12.83 | $ 12.26 | $ 12.80 | $ 12.70 |
Total Return A, B | .15% | 7.79% | (1.23)% | 3.95% | 2.93% |
Ratios to Average Net Assets D |
|
|
|
|
|
Expenses before reductions | 1.40% | 1.42% | 1.41% | 1.42% | 1.43% |
Expenses net of fee waivers, if any | 1.40% | 1.42% | 1.41% | 1.42% | 1.43% |
Expenses net of all reductions | 1.40% | 1.41% | 1.40% | 1.40% | 1.40% |
Net investment income | 2.89% | 2.95% | 3.01% | 2.83% | 2.88% |
Supplemental Data |
|
|
|
|
|
Net assets, end of period (in millions) | $ 4 | $ 6 | $ 7 | $ 8 | $ 9 |
Portfolio turnover rate | 10% | 4% | 17% | 13% | 23% |
A Total returns would have been lower had certain expenses not been reduced during the periods shown.
B Total returns do not include the effect of the contingent deferred sales charge.
C Calculated based on average shares outstanding during the period.
D Expense ratios reflect operating expenses of the class. Expenses before reductions do not reflect amounts reimbursed by the investment adviser or reductions from brokerage service arrangements or reductions from other expense offset arrangements and do not represent the amount paid by the class during periods when reimbursements or reductions occur. Expenses net of fee waivers reflect expenses after reimbursement by the investment adviser but prior to reductions from brokerage service arrangements or other expense offset arrangements. Expenses net of all reductions represent the net expenses paid by the class.
E Amount represents less than $.001 per share.
See accompanying notes which are an integral part of the financial statements.
Annual Report
Financial Highlights - Class C
Years ended January 31, | 2011 | 2010 | 2009 | 2008 | 2007 |
Selected Per-Share Data |
|
|
|
|
|
Net asset value, beginning of period | $ 12.83 | $ 12.27 | $ 12.80 | $ 12.70 | $ 12.81 |
Income from Investment Operations |
|
|
|
|
|
Net investment income C | .358 | .357 | .357 | .347 | .355 |
Net realized and unrealized gain (loss) | (.347) | .560 | (.522) | .134 | .002 |
Total from investment operations | .011 | .917 | (.165) | .481 | .357 |
Distributions from net investment income | (.359) | (.357) | (.358) | (.347) | (.355) |
Distributions from net realized gain | (.002) | - | (.007) | (.034) | (.112) |
Total distributions | (.361) | (.357) | (.365) | (.381) | (.467) |
Redemption fees added to paid in capital C, E | - | - | - | - | - |
Net asset value, end of period | $ 12.48 | $ 12.83 | $ 12.27 | $ 12.80 | $ 12.70 |
Total Return A, B | .01% | 7.57% | (1.24)% | 3.86% | 2.84% |
Ratios to Average Net Assets D |
|
|
|
|
|
Expenses before reductions | 1.53% | 1.54% | 1.51% | 1.51% | 1.52% |
Expenses net of fee waivers, if any | 1.53% | 1.54% | 1.51% | 1.51% | 1.52% |
Expenses net of all reductions | 1.53% | 1.53% | 1.50% | 1.48% | 1.49% |
Net investment income | 2.76% | 2.83% | 2.91% | 2.74% | 2.79% |
Supplemental Data |
|
|
|
|
|
Net assets, end of period (in millions) | $ 32 | $ 29 | $ 19 | $ 16 | $ 16 |
Portfolio turnover rate | 10% | 4% | 17% | 13% | 23% |
A Total returns would have been lower had certain expenses not been reduced during the periods shown.
B Total returns do not include the effect of the contingent deferred sales charge.
C Calculated based on average shares outstanding during the period.
D Expense ratios reflect operating expenses of the class. Expenses before reductions do not reflect amounts reimbursed by the investment adviser or reductions from brokerage service arrangements or reductions from other expense offset arrangements and do not represent the amount paid by the class during periods when reimbursements or reductions occur. Expenses net of fee waivers reflect expenses after reimbursement by the investment adviser but prior to reductions from brokerage service arrangements or other expense offset arrangements. Expenses net of all reductions represent the net expenses paid by the class.
E Amount represents less than $.001 per share.
See accompanying notes which are an integral part of the financial statements.
Annual Report
Financial Highlights - New York Municipal Income
Years ended January 31, | 2011 | 2010 | 2009 | 2008 | 2007 |
Selected Per-Share Data |
|
|
|
|
|
Net asset value, beginning of period | $ 12.83 | $ 12.27 | $ 12.81 | $ 12.71 | $ 12.82 |
Income from Investment Operations |
|
|
|
|
|
Net investment income B | .497 | .491 | .486 | .479 | .488 |
Net realized and unrealized gain (loss) | (.338) | .560 | (.533) | .134 | .001 |
Total from investment operations | .159 | 1.051 | (.047) | .613 | .489 |
Distributions from net investment income | (.497) | (.491) | (.486) | (.479) | (.487) |
Distributions from net realized gain | (.002) | - | (.007) | (.034) | (.112) |
Total distributions | (.499) | (.491) | (.493) | (.513) | (.599) |
Redemption fees added to paid in capital B, D | - | - | - | - | - |
Net asset value, end of period | $ 12.49 | $ 12.83 | $ 12.27 | $ 12.81 | $ 12.71 |
Total Return A | 1.16% | 8.71% | (.29)% | 4.94% | 3.91% |
Ratios to Average Net Assets C |
|
|
|
|
|
Expenses before reductions | .47% | .48% | .47% | .47% | .48% |
Expenses net of fee waivers, if any | .47% | .48% | .47% | .47% | .48% |
Expenses net of all reductions | .47% | .47% | .46% | .44% | .45% |
Net investment income | 3.82% | 3.89% | 3.95% | 3.78% | 3.83% |
Supplemental Data |
|
|
|
|
|
Net assets, end of period (in millions) | $ 1,604 | $ 1,740 | $ 1,428 | $ 1,480 | $ 1,407 |
Portfolio turnover rate | 10% | 4% | 17% | 13% | 23% |
A Total returns would have been lower had certain expenses not been reduced during the periods shown.
B Calculated based on average shares outstanding during the period.
C Expense ratios reflect operating expenses of the class. Expenses before reductions do not reflect amounts reimbursed by the investment adviser or reductions from brokerage service arrangements or reductions from other expense offset arrangements and do not represent the amount paid by the class during periods when reimbursements or reductions occur. Expenses net of fee waivers reflect expenses after reimbursement by the investment adviser but prior to reductions from brokerage service arrangements or other expense offset arrangements. Expenses net of all reductions represent the net expenses paid by the class.
D Amount represents less than $.001 per share.
See accompanying notes which are an integral part of the financial statements.
Annual Report
Financial Highlights - Institutional Class
Years ended January 31, | 2011 | 2010 | 2009 | 2008 | 2007 |
Selected Per-Share Data |
|
|
|
|
|
Net asset value, beginning of period | $ 12.82 | $ 12.26 | $ 12.80 | $ 12.70 | $ 12.81 |
Income from Investment Operations |
|
|
|
|
|
Net investment income B | .487 | .485 | .479 | .479 | .487 |
Net realized and unrealized gain (loss) | (.347) | .561 | (.527) | .133 | .002 |
Total from investment operations | .140 | 1.046 | (.048) | .612 | .489 |
Distributions from net investment income | (.488) | (.486) | (.485) | (.478) | (.487) |
Distributions from net realized gain | (.002) | - | (.007) | (.034) | (.112) |
Total distributions | (.490) | (.486) | (.492) | (.512) | (.599) |
Redemption fees added to paid in capital B, D | - | - | - | - | - |
Net asset value, end of period | $ 12.47 | $ 12.82 | $ 12.26 | $ 12.80 | $ 12.70 |
Total Return A | 1.01% | 8.67% | (.29)% | 4.94% | 3.91% |
Ratios to Average Net Assets C |
|
|
|
|
|
Expenses before reductions | .53% | .52% | .48% | .47% | .48% |
Expenses net of fee waivers, if any | .53% | .52% | .48% | .47% | .48% |
Expenses net of all reductions | .53% | .52% | .47% | .44% | .45% |
Net investment income | 3.76% | 3.85% | 3.94% | 3.78% | 3.83% |
Supplemental Data |
|
|
|
|
|
Net assets, end of period (in millions) | $ 14 | $ 10 | $ 5 | $ 2 | $ 1 |
Portfolio turnover rate | 10% | 4% | 17% | 13% | 23% |
A Total returns would have been lower had certain expenses not been reduced during the periods shown.
B Calculated based on average shares outstanding during the period.
C Expense ratios reflect operating expenses of the class. Expenses before reductions do not reflect amounts reimbursed by the investment adviser or reductions from brokerage service arrangements or reductions from other expense offset arrangements and do not represent the amount paid by the class during periods when reimbursements or reductions occur. Expenses net of fee waivers reflect expenses after reimbursement by the investment adviser but prior to reductions from brokerage service arrangements or other expense offset arrangements. Expenses net of all reductions represent the net expenses paid by the class.
D Amount represents less than $.001 per share.
See accompanying notes which are an integral part of the financial statements.
Annual Report
Notes to Financial Statements
For the period ended January 31, 2011
(Amounts in thousands except ratios)
1. Organization.
Fidelity New York Municipal Income Fund (the Fund) is a non-diversified fund of Fidelity New York Municipal Trust (the Trust) and is authorized to issue an unlimited number of shares. The Trust is registered under the Investment Company Act of 1940, as amended (the 1940 Act), as an open-end management investment company organized as a Massachusetts business trust. The Fund offers Class A, Class T, Class C, New York Municipal Income, and Institutional Class shares, along with Class B shares, each of which has equal rights as to assets and voting privileges. Effective after the close of business on September 1, 2010, Class B shares were closed to new accounts and additional purchases by existing shareholders. Each class has exclusive voting rights with respect to matters that affect that class. Class B shares will automatically convert to Class A shares after a holding period of seven years from the initial date of purchase. Investment income, realized and unrealized capital gains and losses, the common expenses of the Fund, and certain fund-level expense reductions, if any, are allocated on a pro-rata basis to each class based on the relative net assets of each class to the total net assets of the Fund. Each class differs with respect to transfer agent and distribution and service plan fees incurred. Certain expense reductions may also differ by class. The Fund may be affected by economic and political developments in the state of New York.
2. Significant Accounting Policies.
The financial statements have been prepared in conformity with accounting principles generally accepted in the United States of America (GAAP), which require management to make certain estimates and assumptions at the date of the financial statements. Actual results could differ from those estimates. Subsequent events, if any, through the date that the financial statements were issued have been evaluated in the preparation of the financial statements. The following summarizes the significant accounting policies of the Fund:
Security Valuation. Investments are valued as of 4:00 p.m. Eastern time on the last calendar day of the period. The Fund uses independent pricing services approved by the Board of Trustees to value its investments. When current market prices or quotations are not readily available or reliable, valuations may be determined in good faith in accordance with procedures adopted by the Board of Trustees. Factors used in determining value may include market or security specific events, changes in interest rates and credit quality. The frequency with which these procedures are used cannot be predicted and they may be utilized to a significant extent. The value used for net asset value (NAV) calculation under these procedures may differ from published prices for the same securities.
Annual Report
Notes to Financial Statements - continued
(Amounts in thousands except ratios)
2. Significant Accounting Policies - continued
Security Valuation - continued
The Fund categorizes the inputs to valuation techniques used to value its investments into a disclosure hierarchy consisting of three levels as shown below.
Level 1 - quoted prices in active markets for identical investments
Level 2 - other significant observable inputs (including quoted prices for similar investments, interest rates, prepayment speeds, etc.)
Level 3 - unobservable inputs (including the Fund's own assumptions based on the best information available)
Changes in valuation techniques may result in transfers in or out of an assigned level within the disclosure hierarchy. Valuation techniques used to value the Fund's investments by major category are as follows.
Debt securities, including restricted securities, are valued based on evaluated prices received from independent pricing services or from dealers who make markets in such securities. For municipal securities, pricing services utilize matrix pricing which considers yield or price of bonds of comparable quality, coupon, maturity and type as well as dealer supplied prices and are generally categorized as Level 2 in the hierarchy.
When independent prices are unavailable or unreliable, debt securities may be valued utilizing pricing matrices which consider similar factors that would be used by independent pricing services. These are generally categorized as Level 2 in the hierarchy but may be Level 3 depending on the circumstances.
Investment Transactions and Income. For financial reporting purposes, the Fund's investment holdings and NAV include trades executed through the end of the last business day of the period. The NAV per share for processing shareholder transactions is calculated as of the close of business of the New York Stock Exchange (NYSE), normally 4:00 p.m. Eastern time and includes trades executed through the end of the prior business day. Gains and losses on securities sold are determined on the basis of identified cost. Interest income is accrued as earned. Interest income includes coupon interest and amortization of premium and accretion of discount on debt securities.
Annual Report
2. Significant Accounting Policies - continued
Expenses. Expenses directly attributable to a fund are charged to that fund. Expenses attributable to more than one fund are allocated among the respective funds on the basis of relative net assets or other appropriate methods. Expense estimates are accrued in the period to which they relate and adjustments are made when actual amounts are known.
Income Tax Information and Distributions to Shareholders. Each year the Fund intends to qualify as a regulated investment company, including distributing substantially all of its taxable income and realized gains under Subchapter M of the Internal Revenue Code and filing its U.S. federal tax return. As a result, no provision for income taxes is required. As of January 31, 2011, the Fund did not have any unrecognized tax benefits in the accompanying financial statements. A fund's federal tax return is subject to examination by the Internal Revenue Service (IRS) for a period of three years.
Dividends are declared and recorded daily and paid monthly from net investment income. Distributions from realized gains, if any, are declared and recorded on the ex-dividend date. Income dividends and capital gain distributions are declared separately for each class. Income and capital gain distributions are determined in accordance with income tax regulations, which may differ from GAAP. In addition, the Fund claimed a portion of the payment made to redeeming shareholders as a distribution for income tax purposes.
Capital accounts within the financial statements are adjusted for permanent book-tax differences. These adjustments have no impact on net assets or the results of operations. Temporary book-tax differences will reverse in a subsequent period.
Book-tax differences are primarily due to market discount, deferred trustees compensation, capital loss carryforwards and losses deferred due to futures transactions.
The Fund purchases municipal securities whose interest, in the opinion of the issuer, is free from federal income tax. There is no assurance that the IRS will agree with this opinion. In the event the IRS determines that the issuer does not comply with relevant tax requirements, interest payments from a security could become federally taxable, possibly retroactively to the date the security was issued.
The federal tax cost of investment securities and unrealized appreciation (depreciation) as of period end were as follows:
Gross unrealized appreciation | $ 18,410 |
Gross unrealized depreciation | (40,988) |
Net unrealized appreciation (depreciation) on securities and other investments | $ (22,578) |
|
|
Tax Cost | $ 1,697,529 |
Annual Report
Notes to Financial Statements - continued
(Amounts in thousands except ratios)
2. Significant Accounting Policies - continued
Income Tax Information and Distributions to Shareholders - continued
The tax-based components of distributable earnings as of period end were as follows:
Undistributed tax-exempt income | $ 4 |
Undistributed long-term capital gain | $ 3,965 |
Net unrealized appreciation (depreciation) | $ (22,578) |
The tax character of distributions paid was as follows:
| January 31, 2011 | January 31, 2010 |
Tax-exempt Income | $ 72,377 | $ 65,025 |
Long-term Capital Gains | 296 | - |
Total | $ 72,673 | $ 65,025 |
Short-Term Trading (Redemption) Fees. Shares held by investors in the Fund less than 30 days are subject to a redemption fee equal to .50% of the net asset value of shares redeemed. All redemption fees, which reduce the proceeds of the shareholder redemption, are retained by the Fund and accounted for as an addition to paid in capital.
3. Purchases and Sales of Investments.
Purchases and sales of securities, other than short-term securities, aggregated $193,270 and $258,656, respectively.
4. Fees and Other Transactions with Affiliates.
Management Fee. Fidelity Management & Research Company (FMR) and its affiliates provide the Fund with investment management related services for which the Fund pays a monthly management fee. The management fee is the sum of an individual fund fee rate that is based on an annual rate of .25% of the Fund's average net assets and a group fee rate that averaged .12% during the period. The group fee rate is based upon the average net assets of all the mutual funds advised by FMR. The group fee rate decreases as assets under management increase and increases as assets under management decrease. For the period, the total annual management fee rate was .37% of the Fund's average net assets.
Annual Report
4. Fees and Other Transactions with Affiliates - continued
Distribution and Service Plan Fees. In accordance with Rule 12b-1 of the 1940 Act, the Fund has adopted separate Distribution and Service Plans for each class of shares. Certain classes pay Fidelity Distributors Corporation (FDC), an affiliate of FMR, separate Distribution and Service Fees, each of which is based on an annual percentage of each class' average net assets. In addition, FDC may pay financial intermediaries for selling shares of the Fund and providing shareholder support services. For the period, the Distribution and Service Fee rates, total fees and amounts retained by FDC were as follows:
| Distribution | Service | Total Fees | Retained |
Class A | -% | .25% | $ 91 | $ 5 |
Class T | -% | .25% | 23 | - |
Class B | .65% | .25% | 45 | 33 |
Class C | .75% | .25% | 328 | 103 |
|
|
| $ 487 | $ 141 |
Sales Load. FDC receives a front-end sales charge of up to 4.00% for selling Class A shares and Class T shares, some of which is paid to financial intermediaries for selling shares of the Fund. FDC receives the proceeds of contingent deferred sales charges levied on Class A, Class T, Class B, and Class C redemptions. These charges depend on the holding period. The deferred sales charges range from 5% to 1% for Class B, 1% for Class C, ..75% for certain purchases of Class A shares (.75% to .50% prior to July 12, 2010) and .25% for certain purchases of Class T shares.
For the period, sales charge amounts retained by FDC were as follows:
| Retained |
Class A | $ 13 |
Class T | 4 |
Class B* | 10 |
Class C* | 4 |
| $ 31 |
* When Class B and Class C shares are initially sold, FDC pays commissions from its own resources to financial intermediaries through which the sales are made.
Transfer Agent and Accounting Fees. Citibank, N.A. (Citibank) is the custodian, transfer agent, and servicing agent for the Fund's Class A, Class T, Class B, Class C, New York Municipal Income and Institutional Class shares. Citibank has entered into a sub-arrangement with Fidelity Investments Institutional Operations Company, Inc. (FIIOC), an affiliate of FMR, with respect to all classes of the Fund, to perform the
Annual Report
Notes to Financial Statements - continued
(Amounts in thousands except ratios)
4. Fees and Other Transactions with Affiliates - continued
Transfer Agent and Accounting Fees - continued
transfer agency, dividend disbursing, and shareholder servicing functions. FIIOC receives account fees and asset-based fees that vary according to the account size and type of account of the shareholders of the respective classes of the Fund. All fees are paid to FIIOC by Citibank, which is reimbursed by each class for such payments. FIIOC pays for typesetting, printing and mailing of shareholder reports, except proxy statements. For the period, transfer agent fees for each class were as follows:
| Amount | % of |
Class A | $ 40 | .11 |
Class T | 8 | .08 |
Class B | 5 | .10 |
Class C | 45 | .14 |
New York Municipal Income | 1,290 | .07 |
Institutional Class | 20 | .14 |
| $ 1,408 |
|
Citibank also has a sub-arrangement with Fidelity Service Company, Inc. (FSC), an affiliate of FMR, under which FSC maintains the Fund's accounting records. The fee is based on the level of average net assets for the month.
5. Committed Line of Credit.
The Fund participates with other funds managed by FMR or an affiliate in a $3.75 billion credit facility (the "line of credit") to be utilized for temporary or emergency purposes to fund shareholder redemptions or for other short-term liquidity purposes. The Fund has agreed to pay commitment fees on its pro-rata portion of the line of credit, which amounted to $7 and is reflected in Miscellaneous expenses on the Statement of Operations. During the period, there were no borrowings on this line of credit.
6. Expense Reductions.
Through arrangements with the Fund's custodian, credits realized as a result of uninvested cash balances were used to reduce the Fund's expenses. During the period, these credits reduced the Fund's custody and accounting expenses by $20 and $4, respectively.
Annual Report
7. Distributions to Shareholders.
Distributions to shareholders of each class were as follows:
Years ended January 31, | 2011 | 2010 |
From net investment income |
|
|
Class A | $ 1,295 | $ 1,021 |
Class T | 328 | 306 |
Class B | 145 | 198 |
Class C | 903 | 700 |
New York Municipal Income | 69,168 | 62,528 |
Institutional Class | 538 | 272 |
Total | $ 72,377 | $ 65,025 |
From net realized gain |
|
|
Class A | $ 6 | $ - |
Class T | 1 | - |
Class B | 1 | - |
Class C | 5 | - |
New York Municipal Income | 280 | - |
Institutional Class | 3 | - |
Total | $ 296 | $ - |
8. Share Transactions.
Transactions for each class of shares were as follows:
| Shares | Dollars | ||
Years ended January 31, | 2011 | 2010 | 2011 | 2010 |
Class A |
|
|
|
|
Shares sold | 843 | 1,547 | $ 10,950 | $ 19,503 |
Reinvestment of distributions | 67 | 58 | 864 | 737 |
Shares redeemed | (987) | (518) | (12,753) | (6,546) |
Net increase (decrease) | (77) | 1,087 | $ (939) | $ 13,694 |
Class T |
|
|
|
|
Shares sold | 170 | 181 | $ 2,210 | $ 2,264 |
Reinvestment of distributions | 20 | 19 | 257 | 245 |
Shares redeemed | (199) | (170) | (2,571) | (2,151) |
Net increase (decrease) | (9) | 30 | $ (104) | $ 358 |
Class B |
|
|
|
|
Shares sold | 40 | 143 | $ 515 | $ 1,808 |
Reinvestment of distributions | 7 | 10 | 90 | 123 |
Shares redeemed | (194) | (209) | (2,513) | (2,660) |
Net increase (decrease) | (147) | (56) | $ (1,908) | $ (729) |
Annual Report
Notes to Financial Statements - continued
(Amounts in thousands except ratios)
8. Share Transactions - continued
| Shares | Dollars | ||
Years ended January 31, | 2011 | 2010 | 2011 | 2010 |
Class C |
|
|
|
|
Shares sold | 721 | 965 | $ 9,405 | $ 12,161 |
Reinvestment of distributions | 39 | 29 | 501 | 363 |
Shares redeemed | (487) | (297) | (6,281) | (3,759) |
Net increase (decrease) | 273 | 697 | $ 3,625 | $ 8,765 |
New York Municipal Income |
|
|
|
|
Shares sold | 27,629 | 36,790 | $ 358,403 | $ 463,771 |
Reinvestment of distributions | 4,003 | 3,726 | 52,003 | 47,044 |
Shares redeemed | (38,771) | (21,286) | (496,938) | (269,003) |
Net increase (decrease) | (7,139) | 19,230 | $ (86,532) | $ 241,812 |
Institutional Class |
|
|
|
|
Shares sold | 713 | 452 | $ 9,276 | $ 5,689 |
Reinvestment of distributions | 20 | 9 | 258 | 110 |
Shares redeemed | (392) | (109) | (4,969) | (1,356) |
Net increase (decrease) | 341 | 352 | $ 4,565 | $ 4,443 |
9. Other.
The Fund's organizational documents provide former and current trustees and officers with a limited indemnification against liabilities arising in connection with the performance of their duties to the Fund. In the normal course of business, the Fund may also enter into contracts that provide general indemnifications. The Fund's maximum exposure under these arrangements is unknown as this would be dependent on future claims that may be made against the Fund. The risk of material loss from such claims is considered remote.
Annual Report
Report of Independent Registered Public Accounting Firm
To the Trustees of Fidelity New York Municipal Trust and Shareholders of Fidelity New York Municipal Income Fund:
We have audited the accompanying statement of assets and liabilities of Fidelity New York Municipal Income Fund (the Fund), a fund of Fidelity New York Municipal Trust, including the schedule of investments, as of January 31, 2011, and the related statement of operations for the year then ended, the statement of changes in net assets for each of the two years in the period then ended, and the financial highlights for each of the five years in the period then ended. These financial statements and financial highlights are the responsibility of the Fund's management. Our responsibility is to express an opinion on these financial statements and financial highlights based on our audits.
We conducted our audits in accordance with the standards of the Public Company Accounting Oversight Board (United States). Those standards require that we plan and perform the audit to obtain reasonable assurance about whether the financial statements and financial highlights are free of material misstatement. The Fund is not required to have, nor were we engaged to perform, an audit of its internal control over financial reporting. Our audits included consideration of internal control over financial reporting as a basis for designing audit procedures that are appropriate in the circumstances, but not for the purpose of expressing an opinion on the effectiveness of the Fund's internal control over financial reporting. Accordingly, we express no such opinion. An audit also includes examining, on a test basis, evidence supporting the amounts and disclosures in the financial statements, assessing the accounting principles used and significant estimates made by management, as well as evaluating the overall financial statement presentation. Our procedures included confirmation of securities owned as of January 31, 2011, by correspondence with the custodian. We believe that our audits provide a reasonable basis for our opinion.
In our opinion, the financial statements and financial highlights referred to above present fairly, in all material respects, the financial position of Fidelity New York Municipal Income Fund as of January 31, 2011, the results of its operations for the year then ended, the changes in its net assets for each of the two years in the period then ended, and its financial highlights for each of the five years in the period then ended, in conformity with accounting principles generally accepted in the United States of America.
/s/ Deloitte & Touche LLP
DELOITTE & TOUCHE LLP
Boston, Massachusetts
March 16, 2011
Annual Report
Trustees and Officers
The Trustees and executive officers of the trust and fund, as applicable, are listed below. The Board of Trustees governs the fund and is responsible for protecting the interests of shareholders. The Trustees are experienced executives who meet periodically throughout the year to oversee the fund's activities, review contractual arrangements with companies that provide services to the fund, oversee management of the risks associated with such activities and contractual arrangements, and review the fund's performance. Except for James C. Curvey, each of the Trustees oversees 190 funds advised by FMR or an affiliate. Mr. Curvey oversees 409 funds advised by FMR or an affiliate.
The Trustees hold office without limit in time except that (a) any Trustee may resign; (b) any Trustee may be removed by written instrument, signed by at least two-thirds of the number of Trustees prior to such removal; (c) any Trustee who requests to be retired or who has become incapacitated by illness or injury may be retired by written instrument signed by a majority of the other Trustees; and (d) any Trustee may be removed at any special meeting of shareholders by a two-thirds vote of the outstanding voting securities of the trust. Each Trustee who is not an interested person (as defined in the 1940 Act) (Independent Trustee), shall retire not later than the last day of the calendar year in which his or her 75th birthday occurs. The Independent Trustees may waive this mandatory retirement age policy with respect to individual Trustees. The executive officers hold office without limit in time, except that any officer may resign or may be removed by a vote of a majority of the Trustees at any regular meeting or any special meeting of the Trustees. Except as indicated, each individual has held the office shown or other offices in the same company for the past five years.
Experience, Skills, Attributes, and Qualifications of the Fund's Trustees. The Governance and Nominating Committee has adopted a statement of policy that describes the experience, qualifications, attributes, and skills that are necessary and desirable for potential Independent Trustee candidates (Statement of Policy). The Board believes that each Trustee satisfied at the time he or she was initially elected or appointed a Trustee, and continues to satisfy, the standards contemplated by the Statement of Policy. The Governance and Nominating Committee also engages professional search firms to help identify potential Independent Trustee candidates who have the experience, qualifications, attributes, and skills consistent with the Statement of Policy. From time to time, additional criteria based on the composition and skills of the current Independent Trustees, as well as experience or skills that may be appropriate in light of future changes to board composition, business conditions, and regulatory or other developments, have also been considered by the professional search firms and the Governance and Nominating Committee. In addition, the Board takes into account the Trustees' commitment and participation in Board and committee meetings, as well as their leadership of standing and ad hoc committees throughout their tenure.
In determining that a particular Trustee was and continues to be qualified to serve as a Trustee, the Board has considered a variety of criteria, none of which, in isolation, was controlling. The Board believes that, collectively, the Trustees have balanced and diverse experience, qualifications, attributes, and skills, which allow the Board to operate effectively in governing the fund and protecting the interests of shareholders. Information about the specific experience, skills, attributes, and qualifications of each Trustee, which in each case led to the Board's conclusion that the Trustee should serve (or continue to serve) as a trustee of the fund, is provided below.
Annual Report
Board Structure and Oversight Function. Abigail P. Johnson is an interested person (as defined in the 1940 Act) and currently serves as Chairman. The Trustees have determined that an interested Chairman is appropriate and benefits shareholders because an interested Chairman has a personal and professional stake in the quality and continuity of services provided to the fund. Independent Trustees exercise their informed business judgment to appoint an individual of their choosing to serve as Chairman, regardless of whether the Trustee happens to be independent or a member of management. The Independent Trustees have determined that they can act independently and effectively without having an Independent Trustee serve as Chairman and that a key structural component for assuring that they are in a position to do so is for the Independent Trustees to constitute a substantial majority for the Board. The Independent Trustees also regularly meet in executive session. Kenneth L. Wolfe serves as Chairman of the Independent Trustees and as such (i) acts as a liaison between the Independent Trustees and management with respect to matters important to the Independent Trustees and (ii) with management prepares agendas for Board meetings.
Fidelity funds are overseen by different Boards of Trustees. The fund's Board oversees Fidelity's investment-grade bond, money market, and asset allocation funds and another Board oversees Fidelity's equity and high income funds. The asset allocation funds may invest in Fidelity funds that are overseen by such other Board. The use of separate Boards, each with its own committee structure, allows the Trustees of each group of Fidelity funds to focus on the unique issues of the funds they oversee, including common research, investment, and operational issues. On occasion, the separate Boards establish joint committees to address issues of overlapping consequences for the Fidelity funds overseen by each Board.
The Trustees operate using a system of committees to facilitate the timely and efficient consideration of all matters of importance to the Trustees, the fund, and fund shareholders and to facilitate compliance with legal and regulatory requirements and oversight of the fund's activities and associated risks. The Board, acting through its committees, has charged FMR and its affiliates with (i) identifying events or circumstances the occurrence of which could have demonstrably adverse effects on the fund's business and/or reputation; (ii) implementing processes and controls to lessen the possibility that such events or circumstances occur or to mitigate the effects of such events or circumstances if they do occur; and (iii) creating and maintaining a system designed to evaluate continuously business and market conditions in order to facilitate the identification and implementation processes described in (i) and (ii) above. Because the day-to-day operations and activities of the fund are carried out by or through FMR, its affiliates and other service providers, the fund's exposure to risks is mitigated but not eliminated by the processes overseen by the Trustees. While each of the Board's committees has responsibility for overseeing different aspects of the fund's activities, oversight is exercised primarily through the Operations and Audit Committees. Appropriate personnel, including but not limited to the fund's Chief Compliance Officer (CCO), FMR's internal auditor, the independent accountants, the fund's Treasurer and portfolio management personnel, make periodic reports to the Board's committees, as appropriate. The responsibilities of each committee, including their oversight responsibilities, are described further under "Standing Committees of the Fund's Trustees."
Annual Report
Trustees and Officers - continued
The fund's Statement of Additional Information (SAI) includes more information about the Trustees. To request a free copy, call Fidelity at 1-877-208-0098.
Interested Trustees*:
Correspondence intended for each Trustee who is an interested person may be sent to Fidelity Investments, 82 Devonshire Street, Boston, Massachusetts 02109.
Name, Age; Principal Occupations and Other Relevant Experience+ | |
Abigail P. Johnson (49) | |
| Year of Election or Appointment: 2009 Ms. Johnson is Trustee and Chairman of the Board of Trustees of certain Trusts. Ms. Johnson serves as President of Personal, Workplace and Institutional Services (2005-present). Ms. Johnson is the Vice Chairman and Director (2007-present) of FMR LLC. Previously, Ms. Johnson served as President and a Director of FMR (2001-2005), a Trustee of other investment companies advised by FMR, Fidelity Investments Money Management, Inc., and FMR Co., Inc. (2001-2005), Senior Vice President of the Fidelity funds (2001-2005), and managed a number of Fidelity funds. Ms. Abigail P. Johnson and Mr. Arthur E. Johnson are not related. |
James C. Curvey (75) | |
| Year of Election or Appointment: 2007 Mr. Curvey also serves as Trustee (2007-present) of other investment companies advised by FMR. Mr. Curvey is a Director of Fidelity Investments Money Management, Inc. (2009-present), Director of Fidelity Research & Analysis Co. (2009-present) and Director of FMR and FMR Co., Inc. (2007-present). Mr. Curvey is also Vice Chairman (2007-present) and Director of FMR LLC. In addition, Mr. Curvey serves as an Overseer for the Boston Symphony Orchestra and a member of the Trustees of Villanova University. Previously, Mr. Curvey was the Vice Chairman (2006-2007) and Director (2000-2007) of FMR Corp. |
* Trustees have been determined to be "Interested Trustees" by virtue of, among other things, their affiliation with the trust or various entities under common control with FMR.
+ The information above includes each Trustee's principal occupation during the last five years and other information relating to the experience, attributes, and skills relevant to each Trustee's qualifications to serve as a Trustee, which led to the conclusion that each Trustee should serve as a Trustee for the fund.
Annual Report
Independent Trustees:
Correspondence intended for each Independent Trustee (that is, the Trustees other than the Interested Trustees) may be sent to Fidelity Investments, P.O. Box 55235, Boston, Massachusetts 02205-5235.
Name, Age; Principal Occupations and Other Relevant Experience+ | |
Albert R. Gamper, Jr. (68) | |
| Year of Election or Appointment: 2006 Prior to his retirement in December 2004, Mr. Gamper served as Chairman of the Board of CIT Group Inc. (commercial finance). During his tenure with CIT Group Inc. Mr. Gamper served in numerous senior management positions, including Chairman (1987-1989; 1999-2001; 2002-2004), Chief Executive Officer (1987-2004), and President (2002-2003). He also served as President and Chief Executive Officer of Tyco Capital Corporation (2001-2002). Mr. Gamper currently serves as a member of the Board of Directors of Public Service Enterprise Group (utilities, 2000-present), a member of the Board of Trustees, Rutgers University (2004-present), and Chairman of the Board of Saint Barnabas Health Care System. Previously, Mr. Gamper served as Chairman of the Board of Governors, Rutgers University (2004-2007). |
Robert F. Gartland (59) | |
| Year of Election or Appointment: 2010 Mr. Gartland is a partner and investor of Vietnam Partners LLC (investments and consulting, 2008-present) and is Chairman and an investor in Gartland and Mellina Group Corp. (consulting, 2009-present). Prior to his retirement, Mr. Gartland held a variety of positions at Morgan Stanley (financial services, 1979-2007) including Managing Director (1987-2007). |
Arthur E. Johnson (64) | |
| Year of Election or Appointment: 2008 Mr. Johnson serves as a member of the Board of Directors of Eaton Corporation (diversified power management, 2009-present) and AGL Resources, Inc. (holding company). Prior to his retirement, Mr. Johnson served as Senior Vice President of Corporate Strategic Development of Lockheed Martin Corporation (defense contractor, 1999-2009). He previously served on the Board of Directors of IKON Office Solutions, Inc. (1999-2008) and Delta Airlines (2005-2007). Mr. Arthur E. Johnson and Ms. Abigail P. Johnson are not related. |
Michael E. Kenneally (56) | |
| Year of Election or Appointment: 2009 Previously, Mr. Kenneally served as a Member of the Advisory Board for certain Fidelity Fixed Income and Asset Allocation Funds (2008-2009). Prior to his retirement, Mr. Kenneally served as Chairman and Global Chief Executive Officer of Credit Suisse Asset Management (2003-2005). Mr. Kenneally was a Director of the Credit Suisse Funds (U.S. mutual funds, 2004-2008) and certain other closed-end funds (2004-2005) and was awarded the Chartered Financial Analyst (CFA) designation in 1991. |
James H. Keyes (70) | |
| Year of Election or Appointment: 2007 Mr. Keyes serves as a member of the Boards of Navistar International Corporation (manufacture and sale of trucks, buses, and diesel engines, since 2002) and Pitney Bowes, Inc. (integrated mail, messaging, and document management solutions, since 1998). Prior to his retirement, Mr. Keyes served as Chairman and Chief Executive Officer of Johnson Controls (automotive, building, and energy, 1998-2002) and as a member of the Board of LSI Logic Corporation (semiconductor technologies, 1984-2008). |
Marie L. Knowles (64) | |
| Year of Election or Appointment: 2001 Prior to Ms. Knowles' retirement in June 2000, she served as Executive Vice President and Chief Financial Officer of Atlantic Richfield Company (ARCO) (diversified energy, 1996-2000). From 1993 to 1996, she was a Senior Vice President of ARCO and President of ARCO Transportation Company. She served as a Director of ARCO from 1996 to 1998. Ms. Knowles currently serves as a Director and Chairman of the Audit Committee of McKesson Corporation (healthcare service, since 2002). Ms. Knowles is an Honorary Trustee of the Brookings Institution and a member of the Board of the Catalina Island Conservancy and of the Santa Catalina Island Company (2009-present). She also serves as a member of the Advisory Board for the School of Engineering of the University of Southern California and the Foundation Board of the School of Architecture at the University of Virginia (2007-present). Previously, Ms. Knowles served as a Director of Phelps Dodge Corporation (copper mining and manufacturing, 1994-2007). |
Kenneth L. Wolfe (71) | |
| Year of Election or Appointment: 2005 Mr. Wolfe is Chairman of the Independent Trustees of the Fixed Income and Asset Allocation Funds (2008-present). Prior to his retirement, Mr. Wolfe served as Chairman and a Director (2007-2009) and Chairman and Chief Executive Officer (1994-2001) of Hershey Foods Corporation. He also served as a member of the Boards of Adelphia Communications Corporation (telecommunications, 2003-2006), Bausch & Lomb, Inc. (medical/pharmaceutical, 1993-2007), and Revlon, Inc. (personal care products, 2004-2009). |
+ The information above includes each Trustee's principal occupation during the last five years and other information relating to the experience, attributes, and skills relevant to each Trustee's qualifications to serve as a Trustee, which led to the conclusion that each Trustee should serve as a Trustee for the fund.
Executive Officers:
Correspondence intended for each executive officer may be sent to Fidelity Investments, 82 Devonshire Street, Boston, Massachusetts 02109.
Name, Age; Principal Occupation | |
John R. Hebble (52) | |
| Year of Election or Appointment: 2008 President and Treasurer of Fidelity's Fixed Income and Asset Allocation Funds. Mr. Hebble also serves as Treasurer and Chief Financial Officer of The North Carolina Capital Management Trust: Cash and Term Portfolio (2008-present), Assistant Treasurer of other Fidelity funds (2009-present) and is an employee of Fidelity Investments. |
Boyce I. Greer (54) | |
| Year of Election or Appointment: 2005 Vice President of Fidelity's Fixed Income Funds and Asset Allocation Funds (2005). Mr. Greer is also a Trustee of other investment companies advised by FMR. Mr. Greer is President of The North Carolina Capital Management Trust: Cash and Term Portfolio (2003-present), the Asset Allocation Division (2008-present), President and a Director of Strategic Advisers, Inc. (2008-present), President of FIMM 130/30 LLC (2008-present), Director of Ballyrock Investment Advisors LLC (2006-present), and an Executive Vice President of FMR (2005-present). Previously, Mr. Greer served as Executive Vice President of FMR Co., Inc. (2005-2009), President and Director of Fidelity Investments Money Management, Inc. (2007-2009) and as a Director and Managing Director of Strategic Advisers, Inc. (2002-2005). |
Christopher P. Sullivan (56) | |
| Year of Election or Appointment: 2009 Vice President of Fidelity's Bond Funds. Mr. Sullivan also serves as President of Fidelity's Bond Division (2009-present). Mr. Sullivan is Executive Vice President of Fidelity Investments Money Management, Inc. (2009-present), and a Director of Fidelity Management & Research (U.K.) Inc. (2010-present). Previously, Mr. Sullivan served as Managing Director, Co-Head of U.S. Fixed Income at Goldman Sachs Asset Management (2001-2009). |
Christine J. Thompson (52) | |
| Year of Election or Appointment: 2010 Vice President of Fidelity's Bond Funds. Ms. Thompson also serves as Chief Investment Officer of FMR's Bond Group (2010-present) and is an employee of Fidelity Investments. Previously, Ms. Thompson served as Director of Municipal Bond Portfolio Managers (2002-2010). |
Scott C. Goebel (43) | |
| Year of Election or Appointment: 2008 Secretary and Chief Legal Officer (CLO) of the Fidelity funds. Mr. Goebel also serves as Secretary and CLO of The North Carolina Capital Management Trust: Cash and Term Portfolio (2008-present); General Counsel, Secretary, and Senior Vice President of FMR (2008-present) and FMR Co., Inc. (2008-present); Deputy General Counsel of FMR LLC; Chief Legal Officer of Fidelity Management & Research (Hong Kong) Limited (2008-present) and Assistant Secretary of Fidelity Management & Research (Japan) Inc. (2008-present), Fidelity Investments Money Management, Inc. (2008-present), Fidelity Management & Research (U.K.) Inc. (2008-present), and Fidelity Research and Analysis Company (2008-present). Previously, Mr. Goebel served as Assistant Secretary of the Funds (2007-2008) and as Vice President and Secretary of Fidelity Distributors Corporation (FDC) (2005-2007). |
David J. Carter (37) | |
| Year of Election or Appointment: 2010 Assistant Secretary of Fidelity's Fixed Income and Asset Allocation Funds. Mr. Carter also serves as Vice President, Associate General Counsel (2010-present) and is an employee of Fidelity Investments (2005-present). |
Holly C. Laurent (56) | |
| Year of Election or Appointment: 2008 Anti-Money Laundering (AML) Officer of the Fidelity funds. Ms. Laurent also serves as AML Officer of The North Carolina Capital Management Trust: Cash and Term Portfolio (2008-present) and is an employee of Fidelity Investments. Previously, Ms. Laurent was Senior Vice President and Head of Legal for Fidelity Business Services India Pvt. Ltd. (2006-2008), and Senior Vice President, Deputy General Counsel and Group Head for FMR LLC (2005-2006). |
Christine Reynolds (52) | |
| Year of Election or Appointment: 2008 Chief Financial Officer of the Fidelity funds. Ms. Reynolds became President of Fidelity Pricing and Cash Management Services (FPCMS) in August 2008. Ms. Reynolds served as Chief Operating Officer of FPCMS (2007-2008). Previously, Ms. Reynolds served as President, Treasurer, and Anti-Money Laundering officer of the Fidelity funds (2004-2007). |
Michael H. Whitaker (43) | |
| Year of Election or Appointment: 2008 Chief Compliance Officer of Fidelity's Fixed Income and Asset Allocation Funds. Mr. Whitaker also serves as Chief Compliance Officer of The North Carolina Capital Management Trust: Cash and Term Portfolio (2008-present). Mr. Whitaker is an employee of Fidelity Investments (2007-present). Prior to joining Fidelity Investments, Mr. Whitaker worked at MFS Investment Management where he served as Senior Vice President and Chief Compliance Officer (2004-2006), and Assistant General Counsel. |
Jeffrey S. Christian (49) | |
| Year of Election or Appointment: 2009 Deputy Treasurer of the Fidelity funds. Mr. Christian is an employee of Fidelity Investments. Previously, Mr. Christian served as Chief Financial Officer (2008-2009) of certain Fidelity funds and Senior Vice President of Fidelity Pricing and Cash Management Services (FPCMS) (2004-2009). |
Bryan A. Mehrmann (49) | |
| Year of Election or Appointment: 2005 Deputy Treasurer of the Fidelity funds. Mr. Mehrmann is an employee of Fidelity Investments. |
Stephanie J. Dorsey (41) | |
| Year of Election or Appointment: 2008 Deputy Treasurer of Fidelity's Fixed Income and Asset Allocation Funds. Ms. Dorsey also serves as Assistant Treasurer of other Fidelity funds (2010-present) and is an employee of Fidelity Investments (2008-present). Previously, Ms. Dorsey served as Treasurer (2004-2008) of the JPMorgan Mutual Funds and Vice President (2004-2008) of JPMorgan Chase Bank. |
Adrien E. Deberghes (43) | |
| Year of Election or Appointment: 2010 Assistant Treasurer of Fidelity's Fixed Income and Asset Allocation Funds. Mr. Deberghes also serves as Deputy Treasurer of other Fidelity funds (2008-present) and is an employee of Fidelity Investments (2008-present). Previously, Mr. Deberghes served as Senior Vice President of Mutual Fund Administration at State Street Corporation (2007-2008), Senior Director of Mutual Fund Administration at Investors Bank & Trust (2005-2007), and Director of Finance for Dunkin' Brands (2000-2005). |
Kenneth B. Robins (41) | |
| Year of Election or Appointment: 2009 Assistant Treasurer of the Fidelity Fixed Income and Asset Allocation Funds. Mr. Robins also serves as President and Treasurer of other Fidelity funds (2008-present; 2010-present) and is an employee of Fidelity Investments (2004-present). Previously, Mr. Robins served as Deputy Treasurer of the Fidelity funds (2005-2008) and Treasurer and Chief Financial Officer of The North Carolina Capital Management Trust: Cash and Term Portfolios (2006-2008). |
Gary W. Ryan (52) | |
| Year of Election or Appointment: 2005 Assistant Treasurer of the Fidelity funds. Mr. Ryan is an employee of Fidelity Investments. Previously, Mr. Ryan served as Vice President of Fund Reporting in Fidelity Pricing and Cash Management Services (FPCMS) (1999-2005). |
Jonathan Davis (42) | |
| Year of Election or Appointment: 2010 Assistant Treasurer of the Fidelity funds. Mr. Davis is an employee of Fidelity Investments. Previously, Mr. Davis served as Vice President and Associate General Counsel of FMR LLC (2003-2010). |
Annual Report
Distributions (Unaudited)
The Board of Trustees of Fidelity New York Municipal Income Fund voted to pay to shareholders of record at the opening of business on record date, the following distribution per share derived from capital gains realized from sales of portfolio securities:
| Pay Date | Record Date | Capital Gains |
Class A | 03/07/2011 | 03/04/2011 | $0.03 |
Class T | 03/07/2011 | 03/04/2011 | $0.03 |
Class B | 03/07/2011 | 03/04/2011 | $0.03 |
Class C | 03/07/2011 | 03/04/2011 | $0.03 |
During fiscal year ended 2011, 100% of the fund's income dividends was free from federal income tax, and 14.53% of the fund's income dividends was subject to the federal alternative minimum tax.
The fund hereby designates as a capital gain dividend with the respect to the taxable year end January 31, 2011, $4,801,494 or if subsequently determined to be different, the net capital gain of such year.
The fund will notify shareholders in January 2012 of amounts for use in preparing 2011 income tax returns.
Annual Report
Board Approval of Investment Advisory Contracts and Management Fees
Fidelity New York Municipal Income Fund
Each year, the Board of Trustees, including the Independent Trustees (together, the Board), votes on the renewal of the management contract and sub-advisory agreements (together, the Advisory Contracts) for the fund. The Board, assisted by the advice of fund counsel and Independent Trustees' counsel, requests and considers a broad range of information relevant to the renewal of the Advisory Contracts throughout the year.
The Board meets regularly and considers at each of its meetings factors that are relevant to its annual consideration of the renewal of the fund's Advisory Contracts, including the services and support provided to the fund and its shareholders. The Board has established three standing committees, each composed of Independent Trustees with varying backgrounds, to which the Board has assigned specific subject matter responsibilities in order to enhance effective decision-making by the Board. The Operations Committee, of which all of the Independent Trustees are members, meets regularly throughout the year and, among other matters, considers matters specifically related to the annual consideration of the renewal of the fund's Advisory Contracts. The Board, acting directly and through its Committees, requests and receives information concerning the annual consideration of the renewal of the fund's Advisory Contracts. The Board also meets as needed to consider matters specifically related to the Board's annual consideration of the renewal of Advisory Contracts. Members of the Board may also meet with trustees of other Fidelity funds through ad hoc joint committees to discuss certain matters relevant to the Fidelity funds.
At its September 2010 meeting, the Board of Trustees, including the Independent Trustees, unanimously determined to renew the fund's Advisory Contracts. In reaching its determination, the Board considered all factors it believed relevant, including (i) the nature, extent, and quality of the services to be provided to the fund and its shareholders (including the investment performance of the fund); (ii) the competitiveness of the fund's management fee and total expenses; (iii) the total costs of the services to be provided by and the profits to be realized by Fidelity from its relationship with the fund; (iv) the extent to which economies of scale would be realized as the fund grows; and (v) whether fee levels reflect these economies of scale, if any, for the benefit of fund shareholders.
In considering whether to renew the Advisory Contracts for the fund, the Board reached a determination, with the assistance of fund counsel and Independent Trustees' counsel and through the exercise of its business judgment, that the renewal of the Advisory Contracts is in the best interests of the fund and its shareholders and that the compensation to be received by Fidelity under the management contract is fair and reasonable. The Board's decision to renew the Advisory Contracts was not based on any single factor, but rather was based on a comprehensive consideration of all the information provided to the Board at its meetings throughout the year. The Board, in reaching its determination to renew the Advisory Contracts, is aware that shareholders in the fund have a broad range of investment choices available to them, including a wide choice among mutual funds offered by Fidelity's competitors, and that the fund's shareholders, with the opportunity to review and weigh the disclosure provided by the fund in its prospectus and other public disclosures, have chosen to invest in this fund, managed by Fidelity.
Annual Report
Board Approval of Investment Advisory Contracts and
Management Fees - continued
Nature, Extent, and Quality of Services Provided. The Board considered the staffing within the investment adviser, FMR, and the sub-advisers (together, the Investment Advisers), including the backgrounds of the fund's investment personnel and the fund's investment objective and discipline. The Independent Trustees also had discussions with senior management of Fidelity's investment operations and investment groups. The Board considered the structure of the portfolio manager compensation program and whether this structure provides appropriate incentives to act in the best interest of the fund.
Resources Dedicated to Investment Management and Support Services. The Board reviewed the size, education, and experience of the Investment Advisers' investment staff, their use of technology, and the Investment Advisers' approach to recruiting, training, and retaining portfolio managers and other research, advisory, and management personnel. The Board noted that Fidelity's analysts have access to a variety of technological tools and market and securities data that enable them to perform both fundamental and quantitative analysis and to specialize in various disciplines. The Board considered Fidelity's extensive global research capabilities that enable the Investment Advisers to aggregate data from various sources in an effort to produce positive investment results. The Board also considered that Fidelity's portfolio managers and analysts have access to daily portfolio attribution that allows for monitoring of a fund's portfolio, as well as an electronic communication system that provides immediate real-time access to research concerning issuers and credit enhancers. In addition, the Board considered the trading resources that are an integral part of the fixed-income portfolio management investment process.
Shareholder and Administrative Services. The Board considered (i) the nature, extent, quality, and cost of advisory, administrative, and shareholder services performed by the Investment Advisers and their affiliates under the Advisory Contracts and under separate agreements covering transfer agency and pricing and bookkeeping services for the fund; (ii) the nature and extent of the investment adviser's supervision of third party service providers, principally custodians and subcustodians; and (iii) the resources devoted to, and the record of compliance with, the fund's compliance policies and procedures.
The Board noted that the growth of fund assets over time across the complex allows Fidelity to reinvest in the development of services designed to enhance the value or convenience of the Fidelity funds as investment vehicles. These services include 24-hour access to account information and market information through telephone representatives and over the Internet, and investor education materials and asset allocation tools.
Annual Report
Investment in a Large Fund Family. The Board considered the benefits to shareholders of investing in a Fidelity fund, including the benefits of investing in a fund that is part of a large family of funds offering a variety of investment disciplines and providing a large variety of mutual fund investor services. The Board noted that Fidelity had taken, or had made recommendations that resulted in the Fidelity funds taking, a number of actions over the previous year that benefited particular funds, including (i) dedicating additional resources to investment research and restructuring and broadening the focus of the investment research teams; (ii) bolstering the senior management team that oversees asset management; (iii) launching Class F of certain funds as a lower-fee class available to Freedom K and Freedom Index Funds; (iv) lowering the initial investment minimums and ongoing balance requirements for Real Estate High Income Fund; (v) eliminating subsequent purchase minimums for all funds and adding a waiver of the investment minimum requirement for new accounts opened with the proceeds of a systematic withdrawal plan; (vi) eliminating the withdrawal minimum and maximum limits for systematic withdrawals from Advisor funds; (vii) expanding sales load waivers on Class A shares for Destiny Planholders and expanding Institutional Class eligibility for Class O Destiny Planholders; and (viii) changing certain Class A and Class T sales charge structures to further align them with industry practices.
Investment Performance. The Board considered whether the fund has operated in accordance with its investment objective, as well as its record of compliance with its investment restrictions. It also reviewed the fund's absolute investment performance for each class, as well as the fund's relative investment performance for each class measured over multiple periods against (i) a broad-based securities market index, and (ii) a peer group of mutual funds deemed appropriate by Fidelity and reviewed by the Board. The following charts considered by the Board show, over the one-, three-, and five-year periods ended December 31, 2009, the cumulative total returns of the retail class and Class C of the fund, the cumulative total returns of a broad-based securities market index ("benchmark"), and a range of cumulative total returns of a peer group of mutual funds identified by Lipper Inc. as having an investment objective similar to that of the fund. The returns of the retail class and Class C show the performance of the highest and lowest performing classes, respectively (based on five-year performance). The box within each chart shows the 25th percentile return (bottom of box) and the 75th percentile return (top of box) of the peer group. Returns shown above the box are in the first quartile and returns shown below the box are in the fourth quartile. The percentage beaten numbers noted below each chart correspond to the percentile box and represent the percentage of funds in the peer group whose performance was equal to or lower than that of the class indicated.
Annual Report
Board Approval of Investment Advisory Contracts and
Management Fees - continued
Fidelity New York Municipal Income Fund
The Board reviewed the fund's relative investment performance against its peer group and noted that the performance of the retail class of the fund was in the fourth quartile for the one-year period and the first quartile for the three- and five-year periods. The Board also noted that the investment performance of the fund was lower than its benchmark for all the periods shown. The Board considered that the variations in performance among the fund's classes reflect the variations in class expenses, which result in lower performance for higher expense classes. The Board discussed with FMR actions that have been taken by FMR to improve the fund's below-benchmark performance. The Board also reviewed the fund's performance since inception as well as performance in the current year.
Based on its review, and giving particular weight to the nature and quality of the resources dedicated by the Investment Advisers to maintain and improve relative performance and factoring in the unprecedented market events in recent years, the Board concluded that the nature, extent, and quality of investment management and support services and of shareholder and administrative services provided to the fund will benefit the fund's shareholders, particularly in light of the Board's view that the fund's shareholders benefit from investing in a fund that is part of a large family of funds offering a variety of investment disciplines and services.
Competitiveness of Management Fee and Total Fund Expenses. The Board considered the fund's management fee and total expenses compared to "mapped groups" of competitive funds and classes. Fidelity creates "mapped groups" by combining similar
Annual Report
Lipper investment objective categories that have comparable management fee characteristics. Combining Lipper investment objective categories aids the Board's management fee and total expense comparisons by broadening the competitive group used for comparison and by reducing the number of universes to which various Fidelity funds are compared.
Management Fee. The Board considered two proprietary management fee comparisons for the 12-month periods shown in the chart below. The group of Lipper funds used by the Board for management fee comparisons is referred to below as the "Total Mapped Group" and, for the reasons explained above, is broader than the Lipper peer group used by the Board for performance comparisons. The Total Mapped Group comparison focuses on a fund's standing relative to the total universe of comparable funds available to investors, in terms of gross management fees before expense reimbursements or caps. "TMG%" represents the percentage of funds in the Total Mapped Group that had management fees that were lower than the fund's. For example, a TMG% of 7% means that 93% of the funds in the Total Mapped Group had higher management fees than the fund. The "Asset-Size Peer Group" (ASPG) comparison focuses on a fund's standing relative to non-Fidelity funds similar in size to the fund within the Total Mapped Group. The ASPG represents at least 15% of the funds in the Total Mapped Group with comparable asset size and management fee characteristics, subject to a minimum of 50 funds (or all funds in the Total Mapped Group if fewer than 50). Additional information, such as the ASPG quartile in which the fund's management fee ranked, is also included in the chart and considered by the Board.
Fidelity New York Municipal Income Fund
Annual Report
Board Approval of Investment Advisory Contracts and
Management Fees - continued
The Board noted that the fund's management fee ranked below the median of its Total Mapped Group and below the median of its ASPG for 2009.
Based on its review, the Board concluded that the fund's management fee is fair and reasonable in light of the services that the fund receives and the other factors considered.
Total Expenses. In its review of each class's total expenses, the Board considered the fund's management fee as well as other fund or class expenses, as applicable, such as transfer agent fees, pricing and bookkeeping fees, fund-paid 12b-1 fees, and custodial, legal, and audit fees. The Board also noted the effects of any waivers and reimbursements on fees and expenses. As part of its review, the Board also considered current and historical total expenses of each class of the fund compared to competitive fund median expenses. Each class of the fund is compared to those funds and classes in the Total Mapped Group (used by the Board for management fee comparisons) that have a similar sales load structure.
The Board noted that the total expenses of each of Class A, Class T, Class B, Institutional Class, and the retail class ranked below its competitive median for 2009 and the total expenses of Class C ranked above its competitive median for 2009. The Board noted that the funds and classes in the Total Mapped Group that have a similar sales load structure have a range of 12b-1 fees, and, when compared to a subset of funds with the same 12b-1 fee, Class C ranked below the median for 2009. The Board noted that the fund offers multiple classes, each of which has a different sales load and 12b-1 fee structure, and that the multiple structures are intended to offer a range of pricing options for the intermediary market. The Board also noted that the total expenses of the classes vary primarily by the level of their 12b-1 fees, although differences in transfer agent fees may also cause expenses to vary from class to class.
Fees Charged to Other Fidelity Clients. The Board also considered Fidelity fee structures and other information with respect to clients of FMR and its affiliates, such as other mutual funds advised or subadvised by FMR or its affiliates, pension plan clients, and other institutional clients. In March 2010, the Board created an ad hoc joint committee with the board of other Fidelity funds (the Committee) to review and compare Fidelity's institutional investment advisory business with its business of providing services to the Fidelity funds, including the differences in services provided, fees charged, and costs incurred, as well as competition in their respective marketplaces.
Based on its review of total expenses and fees charged to other Fidelity clients, the Board concluded that the total expenses of each class of the fund were reasonable, although in one case above the median of the universe presented for comparison, in light of the services that the fund and its shareholders receive and the other factors considered, including the findings of the Committee.
Annual Report
Costs of the Services and Profitability. The Board considered the revenues earned and the expenses incurred by Fidelity in conducting the business of developing, marketing, distributing, managing, administering and servicing the fund and its shareholders. The Board also considered the level of Fidelity's profits in respect of all the Fidelity funds.
On an annual basis, FMR presents to the Board Fidelity's profitability for the fund. Fidelity calculates the profitability for each fund, as well as aggregate profitability for groups of Fidelity funds and all Fidelity funds, using a series of detailed revenue and cost allocation methodologies which originate with the audited books and records of Fidelity. The Audit Committee of the Board reviews any significant changes from the prior year's methodologies.
PricewaterhouseCoopers LLP (PwC), independent registered public accounting firm and auditor to Fidelity and certain Fidelity funds, has been engaged annually by the Board as part of the Board's assessment of Fidelity's profitability analysis. PwC's engagement includes the review and assessment of Fidelity's methodologies used in determining the revenues and expenses attributable to Fidelity's mutual fund business, and completion of agreed-upon procedures surrounding the mathematical accuracy of fund profitability and its conformity to allocation methodologies. After considering PwC's reports issued under the engagement and information provided by Fidelity, the Board believes that while other allocation methods may also be reasonable, Fidelity's profitability methodologies are reasonable in all material respects.
The Board has also reviewed Fidelity's non-fund businesses and fall-out benefits related to the mutual fund business as well as cases where Fidelity's affiliates may benefit from or be related to the fund's business.
The Board considered the costs of the services provided by and the profits realized by Fidelity in connection with the operation of the fund and were satisfied that the profitability was not excessive in the circumstances.
Economies of Scale. The Board considered whether there have been economies of scale in respect of the management of the Fidelity funds, whether the Fidelity funds (including the fund) have appropriately benefited from any such economies of scale, and whether there is potential for realization of any further economies of scale. The Board considered the extent to which the fund will benefit from economies of scale through increased services to the fund, through waivers or reimbursements, or through fee or expense reductions.
In February 2009, the Board and the board of other Fidelity funds created an ad hoc committee (the Economies of Scale Committee) to analyze whether FMR attains economies of scale in respect of the management and servicing of the Fidelity funds, whether the Fidelity funds have appropriately benefited from such economies of scale, and whether there is potential for realization of any further economies of scale.
Annual Report
Board Approval of Investment Advisory Contracts and
Management Fees - continued
The Board recognized that the fund's management contract incorporates a "group fee" structure, which provides for lower group fee rates as total fund assets under FMR's management increase, and for higher group fee rates as total fund assets under FMR's management decrease. FMR calculates the group fee rates based on a tiered asset "breakpoint" schedule that varies based on asset class. The Board considered that the group fee is designed to deliver the benefits of economies of scale to fund shareholders when total Fidelity fund assets increase, even if assets of any particular fund are unchanged or have declined, because some portion of Fidelity's costs are attributable to services provided to all Fidelity funds, and all funds benefit if those costs can be allocated among more assets. The Board concluded that, given the group fee structure, fund shareholders will benefit from lower management fees as assets under FMR's management increase at the fund complex level, regardless of whether Fidelity achieves any such economies of scale.
The Board concluded, considering the findings of the Economies of Scale Committee, that any potential economies of scale are being appropriately shared between fund shareholders and Fidelity.
Additional Information Requested by the Board. In order to develop fully the factual basis for consideration of the Fidelity funds' Advisory Contracts, the Board requested and received additional information on certain topics, including (i) fund performance trends, actions to be taken by FMR to improve certain funds' overall performance, and Fidelity's long-term strategies for certain funds; (ii) Fidelity's fund profitability methodology and profitability trends for certain funds; (iii) portfolio manager changes that have occurred during the past year and the amount of the investment that each portfolio manager has made in the Fidelity fund(s) that he or she manages; (iv) Fidelity's compensation structure for portfolio managers, research analysts, and other key personnel, including its effects on fund profitability, the rationale for the compensation structure, and the extent to which current market conditions have affected retention and recruitment; (v) the compensation paid by FMR to fund sub-advisers on behalf of the Fidelity funds; (vi) Fidelity's fee structures and rationale for recommending different fees among different categories of funds and classes, as well as Fidelity's voluntary waiver of fees to maintain minimum yields for certain funds and classes; (vii) the rationale for any differences between fund fee structures and fee structures in place for other Fidelity clients; and (viii) explanations regarding the relative total expenses borne by certain funds and classes, total expense competitive trends, and actions that might be taken by FMR to reduce total expenses for certain funds and classes or to achieve further economies of scale.
Based on its evaluation of all of the conclusions noted above, and after considering all factors it believed relevant, the Board ultimately concluded that the advisory fee structures are fair and reasonable, and that the fund's Advisory Contracts should be renewed.
Annual Report
Investment Adviser
Fidelity Management & Research Company
Boston, MA
Investment Sub-Advisers
Fidelity Investments
Money Management, Inc.
Fidelity Management & Research (U.K.) Inc.
Fidelity Management & Research
(Hong Kong) Limited
Fidelity Management & Research
(Japan) Inc.
General Distributor
Fidelity Distributors Corporation
Boston, MA
Transfer and Service Agents
Citibank, N.A.
New York, NY
Fidelity Investments Institutional Operations Company, Inc.
Boston, MA
Fidelity Service Company, Inc.
Boston, MA
Custodian
Citibank, N.A.
New York, NY
ASNM-UANN-0311
1.789705.108

(Fidelity Investment logo)(registered trademark)
Fidelity Advisor®
New York Municipal Income
Fund - Institutional Class
Annual Report
January 31, 2011
Institutional Class is a class of Fidelity® New York Municipal Income Fund
(2_fidelity_logos) (Registered_Trademark)
Contents
Chairman's Message | The Chairman's message to shareholders. | |
Performance | How the fund has done over time. | |
Management's Discussion of Fund Performance | The Portfolio Manager's review of fund performance and strategy. | |
Shareholder Expense Example | An example of shareholder expenses. | |
Investment Changes | A summary of major shifts in the fund's investments over the past six months. | |
Investments | A complete list of the fund's investments with their market values. | |
Financial Statements | Statements of assets and liabilities, operations, and changes in net assets, as well as financial highlights. | |
Notes | Notes to the financial statements. | |
Report of Independent Registered Public Accounting Firm |
| |
Trustees and Officers |
| |
Distributions |
| |
Board Approval of Investment Advisory Contracts and Management Fees |
|
To view a fund's proxy voting guidelines and proxy voting record for the 12-month period ended June 30, visit http://www.fidelity.com/proxyvotingresults or visit the Securities and Exchange Commission's (SEC) web site at http://www.sec.gov. You may also call 1-877-208-0098 to request a free copy of the proxy voting guidelines.
Standard & Poor's, S&P and S&P 500 are registered service marks of The McGraw-Hill Companies, Inc. and have been licensed for use by Fidelity Distributors Corporation.
Other third party marks appearing herein are the property of their respective owners.
All other marks appearing herein are registered or unregistered trademarks or service marks of FMR LLC or an affiliated company.
Annual Report
This report and the financial statements contained herein are submitted for the general information of the shareholders of the fund. This report is not authorized for distribution to prospective investors in the fund unless preceded or accompanied by an effective prospectus.
A fund files its complete schedule of portfolio holdings with the SEC for the first and third quarters of each fiscal year on Form N-Q. Forms N-Q are available on the SEC's web site at http://www.sec.gov. A fund's Forms N-Q may be reviewed and copied at the SEC's Public Reference Room in Washington, DC. Information regarding the operation of the SEC's Public Reference Room may be obtained by calling 1-800-SEC-0330. For a complete list of a fund's portfolio holdings, view the most recent holdings listing, semiannual report, or annual report on Fidelity's web site at http://www.fidelity.com, http://www.advisor.fidelity.com, or http://www.401k.com, as applicable.
NOT FDIC INSURED • MAY LOSE VALUE • NO BANK GUARANTEE
Neither the fund nor Fidelity Distributors Corporation is a bank.
Annual Report
Chairman's Message
(photo_of_Abigail_P_Johnson)
Dear Shareholder:
Following a year in which the investment environment was volatile but generally supportive of most major asset classes, 2011 began on a positive note. U.S. equities gained ground in January, reaching their highest point since August 2008, amid indications the U.S. economy had turned a corner. Still, questions remained about the longer-term outlook, most notably persistently high unemployment. Financial markets are always unpredictable, of course, but there also are several time-tested investment principles that can help put the odds in your favor.
One of the basic tenets is to invest for the long term. Over time, riding out the markets' inevitable ups and downs has proven much more effective than selling into panic or chasing the hottest trend. Even missing only a few of the markets' best days can significantly diminish investor returns. Patience also affords the benefits of compounding - of earning interest on additional income or reinvested dividends and capital gains. There can be tax advantages and cost benefits to consider as well. While staying the course doesn't eliminate risk, it can considerably lessen the effect of short-term declines.
You can further manage your investing risk through diversification. And today, more than ever, geographic diversification should be taken into account. Studies indicate that asset allocation is the single most important determinant of a portfolio's long-term success. The right mix of stocks, bonds and cash - aligned to your particular risk tolerance and investment objective - is very important. Age-appropriate rebalancing is also an essential aspect of asset allocation. For younger investors, an emphasis on equities - which historically have been the best-performing asset class over time - is encouraged. As investors near their specific goal, such as retirement or sending a child to college, consideration may be given to replacing volatile assets (e.g. common stocks) with more-stable fixed investments (bonds or savings plans).
A third principle - investing regularly - can help lower the average cost of your purchases. Investing a certain amount of money each month or quarter helps ensure you won't pay for all your shares at market highs. This strategy - known as dollar cost averaging - also reduces "emotion" from investing, helping shareholders avoid selling weak performers just prior to an upswing, or chasing a hot performer just before a correction.
We invite you to contact us via the Internet, through our Investor Centers or by phone. It is our privilege to provide you the information you need to make the investments that are right for you.
Sincerely,
(The chairman's signature appears here.)
Abigail P. Johnson
Annual Report
Performance: The Bottom Line
Average annual total return reflects the change in the value of an investment, assuming reinvestment of the class' distributions from dividend income and capital gains (the profits earned upon the sale of securities that have grown in value, if any) and assuming a constant rate of performance each year. The $10,000 table and the fund's returns do not reflect the deduction of taxes that a shareholder would pay on fund distributions or the redemption of fund shares. During periods of reimbursement by Fidelity, a fund's total return will be greater than it would be had the reimbursement not occurred. How a fund did yesterday is no guarantee of how it will do tomorrow.
Average Annual Total Returns
Periods ended January 31, 2011 | Past 1 | Past 5 | Past 10 |
Institutional Class A | 1.01% | 3.60% | 4.55% |
A The initial offering of Institutional Class shares took place on August 1, 2002. Returns prior to August 1, 2002 are those of Fidelity® New York Municipal Income Fund, the original retail class of the fund.
$10,000 Over 10 Years
Let's say hypothetically that $10,000 was invested in Fidelity Advisor® New York Municipal Income Fund - Institutional Class on January 31, 2001. The chart shows how the value of your investment would have changed, and also shows how the Barclays Capital® Municipal Bond Index performed over the same period. The initial offering of Institutional Class took place on August 1, 2002. See above for additional information regarding the performance of Institutional Class.
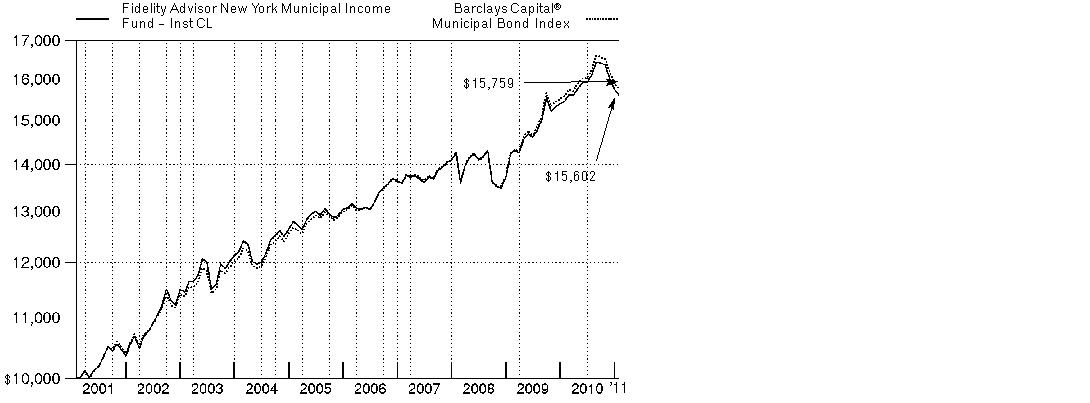
Annual Report
Management's Discussion of Fund Performance
Market Recap: Tax-exempt municipal bonds posted disappointing results for the 12 months ending January 31, 2011, primarily due to a significant late-period sell-off. For the full 12 months, the Barclays Capital® Municipal Bond Index - a measure of more than 46,000 fixed-rate tax-exempt investment-grade bonds - returned 1.10%, while the taxable investment-grade debt market, as measured by the Barclays Capital® U.S. Aggregate Bond Index, rose 5.06%. From February through August 2010, munis were on track for a solid year, bolstered by low, steady interest rates and generally favorable supply/demand dynamics. Supply was muted due to the popularity of "Build America Bonds" (BABs) - taxable securities that allowed municipal issuers to borrow more cheaply in the taxable market. Meanwhile, the possibility of higher tax rates in 2011 heightened investor demand for tax-advantaged investments. From September through November, however, munis came under pressure amid the prospect of rising interest rates, heavy new supply and the growing likelihood that Bush-era tax policies would be extended beyond 2010. In December and January, munis' woes were compounded by headlines suggesting an unprecedented wave of defaults among issuers.
Comments from Mark Sommer, Portfolio Manager of Fidelity Advisor® New York Municipal Income Fund: For the 12-month period ending January 31, 2011, the fund's Class A, Class T, Class B and Class C shares returned 0.79%, 0.81%, 0.15% and 0.01%, respectively (excluding sales charges). Meanwhile, the Barclays Capital New York 4+ Year Enhanced Municipal Bond Index posted a 1.16% gain. The fund's larger-than-index exposure to high-coupon callable bonds and underweighting in tobacco securities offset losses from out-of-benchmark exposure to long-maturity zero-coupon bonds issued in Puerto Rico. High-coupon callable bonds generally outpaced the benchmark during the year, thanks largely to their outperformance during a market sell-off later in the period. Tobacco securities initially lagged, due to concerns that declining cigarette consumption could lead to lower payments and, more recently, in response to investors avoiding riskier segments of the market. Investments in long-maturity zero-coupon bonds issued in Puerto Rico hurt, because these securities faltered on three fronts late in the period, when investor demand for lower-quality, long-maturity or uniquely structured securities was weak.
Comments from Mark Sommer, Portfolio Manager of Fidelity Advisor® New York Municipal Income Fund: For the 12-month period ending January 31, 2011, the fund's Institutional Class shares returned 1.01%, while the Barclays Capital New York 4+ Year Enhanced Municipal Bond Index posted a 1.16% gain. The fund's larger-than-index exposure to high-coupon callable bonds and underweighting in tobacco securities offset losses from out-of-benchmark exposure to long-maturity zero-coupon bonds issued in Puerto Rico. High-coupon callable bonds generally outpaced the benchmark during the year, thanks largely to their outperformance during a market sell-off later in the period. Tobacco securities initially lagged, due to concerns that declining cigarette consumption could lead to lower payments and, more recently, in response to investors avoiding riskier segments of the market. Investments in long-maturity zero-coupon bonds issued in Puerto Rico hurt, because these securities faltered on three fronts late in the period, when investor demand for lower-quality, long-maturity or uniquely structured securities was weak.
Annual Report
The views expressed above reflect those of the portfolio manager(s) only through the end of the period as stated on the cover of this report and do not necessarily represent the views of Fidelity or any other person in the Fidelity organization. Any such views are subject to change at any time based upon market or other conditions and Fidelity disclaims any responsibility to update such views. These views may not be relied on as investment advice and, because investment decisions for a Fidelity fund are based on numerous factors, may not be relied on as an indication of trading intent on behalf of any Fidelity fund.
Annual Report
Shareholder Expense Example
As a shareholder of the Fund, you incur two types of costs: (1) transaction costs, including sales charges (loads) on purchase payments or redemption proceeds, redemption fees, and (2) ongoing costs, including management fees, distribution and/or service (12b-1) fees and other Fund expenses. This Example is intended to help you understand your ongoing costs (in dollars) of investing in the Fund and to compare these costs with the ongoing costs of investing in other mutual funds.
The Example is based on an investment of $1,000 invested at the beginning of the period and held for the entire period (August 1, 2010 to January 31, 2011).
Actual Expenses
The first line of the accompanying table for each class of the Fund provides information about actual account values and actual expenses. You may use the information in this line, together with the amount you invested, to estimate the expenses that you paid over the period. Simply divide your account value by $1,000.00 (for example, an $8,600 account value divided by $1,000.00 = 8.6), then multiply the result by the number in the first line for a class of the Fund under the heading entitled "Expenses Paid During Period" to estimate the expenses you paid on your account during this period. A small balance maintenance fee of $12.00 that is charged once a year may apply for certain accounts with a value of less than $2,000. This fee is not included in the table below. If it was, the estimate of expenses you paid during the period would be higher, and your ending account value lower, by this amount.
Hypothetical Example for Comparison Purposes
The second line of the accompanying table for each class of the Fund provides information about hypothetical account values and hypothetical expenses based on a Class' actual expense ratio and an assumed rate of return of 5% per year before expenses, which is not the Class' actual return. The hypothetical account values and expenses may not be used to estimate the actual ending account balance or expenses you paid for the period. You may use this information to compare the ongoing costs of investing in the Fund and other funds. To do so, compare this 5% hypothetical example with the 5% hypothetical examples that appear in the shareholder reports of the other funds. A small balance maintenance fee of $12.00 that is charged once a year may apply for certain accounts with a value of less than $2,000. This fee is not included in the table below. If it was, the estimate of expenses you paid during the period would be higher, and your ending account value lower, by this amount.
Please note that the expenses shown in the table are meant to highlight your ongoing costs only and do not reflect any transaction costs. Therefore, the second line of the table is useful in comparing ongoing costs only, and will not help you determine the relative total costs of owning different funds. In addition, if these transactional costs were included, your costs would have been higher.
Annual Report
| Annualized Expense Ratio | Beginning | Ending | Expenses Paid |
Class A | .74% |
|
|
|
Actual |
| $ 1,000.00 | $ 968.50 | $ 3.67 |
HypotheticalA |
| $ 1,000.00 | $ 1,021.48 | $ 3.77 |
Class T | .73% |
|
|
|
Actual |
| $ 1,000.00 | $ 968.60 | $ 3.62 |
HypotheticalA |
| $ 1,000.00 | $ 1,021.53 | $ 3.72 |
Class B | 1.38% |
|
|
|
Actual |
| $ 1,000.00 | $ 966.20 | $ 6.84 |
HypotheticalA |
| $ 1,000.00 | $ 1,018.25 | $ 7.02 |
Class C | 1.52% |
|
|
|
Actual |
| $ 1,000.00 | $ 964.70 | $ 7.53 |
HypotheticalA |
| $ 1,000.00 | $ 1,017.54 | $ 7.73 |
New York Municipal Income | .46% |
|
|
|
Actual |
| $ 1,000.00 | $ 970.70 | $ 2.28 |
HypotheticalA |
| $ 1,000.00 | $ 1,022.89 | $ 2.35 |
Institutional Class | .54% |
|
|
|
Actual |
| $ 1,000.00 | $ 969.50 | $ 2.68 |
HypotheticalA |
| $ 1,000.00 | $ 1,022.48 | $ 2.75 |
A 5% return per year before expenses
* Expenses are equal to each Class' annualized expense ratio, multiplied by the average account value over the period, multiplied by 184/365 (to reflect the one-half year period).
Annual Report
Investment Changes (Unaudited)
Top Five Sectors as of January 31, 2011 | ||
| % of fund's | % of fund's net assets |
General Obligations | 29.6 | 31.1 |
Special Tax | 20.6 | 21.0 |
Transportation | 13.7 | 13.8 |
Education | 12.4 | 11.1 |
Water & Sewer | 10.1 | 10.2 |
Weighted Average Maturity as of January 31, 2011 | ||
|
| 6 months ago |
Years | 11.7 | 6.1 |
This is a weighted average of all the maturities of the securities held in a fund. Weighted Average Maturity (WAM) can be used as a measure of sensitivity to interest rate changes and markets changes. Generally, the longer the maturity, the greater the sensitivity to such changes. WAM is based on the dollar-weighted average length of time until principal payments must be paid. Depending on the types of securities held in a fund, certain maturity shortening devices (e.g., demand features, interest rate resets, and call options) may be taken into account when calculating the WAM. |
Duration as of January 31, 2011 | ||
|
| 6 months ago |
Years | 8.5 | 7.9 |
Duration shows how much a bond fund's price fluctuates with changes in comparable interest rates. If rates rise 1%, for example, a fund with a five-year duration is likely to lose about 5% of its value. Other factors also can influence a bond fund's performance and share price. Accordingly, a bond fund's actual performance may differ from this example. |
Quality Diversification (% of fund's net assets) | |||||||
As of January 31, 2011 | As of July 31, 2010 | ||||||
| AAA 14.4% |
| | AAA 13.1% |
| ||
| AA,A 78.1% |
| | AA,A 78.1% |
| ||
| BBB 5.3% |
| | BBB 5.6% |
| ||
| BB and Below 0.2% |
| | BB and Below 0.2% |
| ||
| Not Rated 0.8% |
| | Not Rated 1.8% |
| ||
| Short-Term |
| | Short-Term |
| ||

We have used ratings from Moody's Investors Service, Inc. Where Moody's® ratings are not available, we have used S&P® ratings. All ratings are as of the report date and do not reflect subsequent changes. |
Annual Report
Investments January 31, 2011
Showing Percentage of Net Assets
Municipal Bonds - 98.8% | ||||
| Principal Amount (000s) | Value (000s) | ||
New York - 92.5% | ||||
Albany Indl. Dev. Agcy. Civic Facility Rev. (St. Peters Hosp. Proj.) Series 2008 A, 5.75% 11/15/22 | $ 3,000 | $ 3,028 | ||
Dutchess County Indl. Dev. Agcy. Civic Facility Rev. (Bard College Proj.): | ||||
Series 2007 A1, 5% 8/1/12 | 500 | 519 | ||
Series 2007 A2, 5% 8/1/11 | 750 | 760 | ||
Erie County Indl. Dev. Agcy. School Facilities Rev. (Buffalo City School District Proj.): | ||||
Series 2003: | ||||
5.75% 5/1/17 (FSA Insured) | 8,940 | 9,370 | ||
5.75% 5/1/20 (FSA Insured) | 1,400 | 1,455 | ||
5.75% 5/1/21 | 1,755 | 1,821 | ||
5.75% 5/1/22 | 4,900 | 5,067 | ||
5.75% 5/1/23 | 1,000 | 1,031 | ||
Series 2004: | ||||
5.75% 5/1/17 | 5,950 | 6,516 | ||
5.75% 5/1/19 (FSA Insured) | 5,000 | 5,380 | ||
5.75% 5/1/23 (FSA Insured) | 9,620 | 10,032 | ||
5.75% 5/1/25 (FSA Insured) | 2,000 | 2,075 | ||
5.75% 5/1/26 | 8,985 | 9,309 | ||
Series 2007 A, 5.75% 5/1/27 | 5,000 | 5,323 | ||
Series 2008 A, 5.75% 5/1/29 (FSA Insured) | 3,535 | 3,785 | ||
Geneva Indl. Dev. Auth. Civic Facilities Rev. (Hobart & William Smith Proj.) Series 2003 A, 5.375% 2/1/23 (Nat'l. Pub. Fin. Guarantee Corp. Insured) | 3,485 | 3,515 | ||
Grand Central District Mgmt. Assoc., Inc. Series 2004, 5% 1/1/14 | 1,000 | 1,094 | ||
Great Neck North Wtr. Auth. Wtr. Sys. Rev. Series 2008, 5% 1/1/38 | 1,660 | 1,589 | ||
Hempstead Local Dev. Corp. Rev.: | ||||
(Adelphi Univ. Proj.): | ||||
Series 2009 A: | ||||
5% 2/1/12 | 1,000 | 1,024 | ||
5% 2/1/14 | 1,035 | 1,085 | ||
Series 2009 B, 5.25% 2/1/39 | 1,200 | 1,128 | ||
(Molloy College Proj.) Series 2009: | ||||
5% 7/1/17 | 1,035 | 1,092 | ||
5.25% 7/1/18 | 1,090 | 1,161 | ||
5.25% 7/1/19 | 1,100 | 1,160 | ||
5.75% 7/1/39 | 6,500 | 6,313 | ||
Long Island Pwr. Auth. Elec. Sys. Rev.: | ||||
Series 2000 A, 0% 6/1/19 (FSA Insured) | 1,935 | 1,438 | ||
Municipal Bonds - continued | ||||
| Principal Amount (000s) | Value (000s) | ||
New York - continued | ||||
Long Island Pwr. Auth. Elec. Sys. Rev.: - continued | ||||
Series 2006 A, 5.25% 12/1/20 (FGIC Insured) | $ 17,780 | $ 18,775 | ||
Series 2006 E, 5% 12/1/17 | 10,000 | 11,000 | ||
Series 2009 A: | ||||
5.75% 4/1/39 | 6,500 | 6,571 | ||
6.25% 4/1/33 | 1,655 | 1,781 | ||
Madison County Cap. Resource Corp. Rev. (Colgate Univ. Proj.) Series 2010 A: | ||||
5% 7/1/24 | 1,405 | 1,492 | ||
5% 7/1/25 | 1,000 | 1,047 | ||
5% 7/1/26 | 1,150 | 1,192 | ||
5% 7/1/27 | 1,630 | 1,678 | ||
5% 7/1/28 | 1,015 | 1,045 | ||
Metropolitan Trans. Auth. Svc. Contract Rev.: | ||||
Series 2002 A: | ||||
5.5% 7/1/20 | 3,000 | 3,079 | ||
5.75% 7/1/31 | 3,025 | 3,050 | ||
Series 2002 B: | ||||
5.5% 7/1/19 (Nat'l. Pub. Fin. Guarantee Corp. Insured) | 3,000 | 3,090 | ||
5.5% 7/1/23 | 5,000 | 5,095 | ||
Series 7, 5.625% 7/1/16 (Escrowed to Maturity) (c) | 3,000 | 3,161 | ||
Monroe County Arpt. Auth. Arpt. Rev. Series 2004, 5.25% 1/1/13 (Nat'l. Pub. Fin. Guarantee Corp. Insured) (b) | 1,000 | 1,025 | ||
Monroe County Indl. Dev. Agcy. Civic Facility Rev.: | ||||
(Highland Hosp. Proj.) Series 2005: | ||||
5% 8/1/11 | 1,510 | 1,527 | ||
5% 8/1/13 | 1,650 | 1,739 | ||
(Nazareth College Rochester Proj.) Series 2001, 5.25% 10/1/21 (Nat'l. Pub. Fin. Guarantee Corp. Insured) | 1,000 | 1,015 | ||
Nassau County Indl. Dev. Agcy. Civic Facility Rev. (North Shore Health Sys. Proj.): | ||||
Series 2001 A, 5.875% 11/1/11 | 30 | 31 | ||
Series 2001 B, 5.875% 11/1/11 | 190 | 195 | ||
New York City Gen. Oblig.: | ||||
Series 1997 B, 6.5% 8/15/11 | 1,000 | 1,032 | ||
Series 2000 A, 6.5% 5/15/11 | 195 | 198 | ||
Series 2001 G, 5.25% 8/1/14 (AMBAC Insured) | 1,635 | 1,656 | ||
Series 2003 A: | ||||
5.5% 8/1/20 (Nat'l. Pub. Fin. Guarantee Corp. Insured) | 6,110 | 6,543 | ||
Municipal Bonds - continued | ||||
| Principal Amount (000s) | Value (000s) | ||
New York - continued | ||||
New York City Gen. Oblig.: - continued | ||||
Series 2003 A: | ||||
5.5% 8/1/20 (Pre-Refunded to 8/1/13 @ 100) (c) | $ 45 | $ 50 | ||
Series 2005 F, 5.25% 8/1/12 | 2,000 | 2,027 | ||
Series 2005 O, 5% 6/1/22 | 5,000 | 5,213 | ||
Series 2006 A, 5% 8/1/19 | 3,000 | 3,217 | ||
Series 2006 I1, 5% 4/1/23 (Nat'l. Pub. Fin. Guarantee Corp. Insured) | 2,395 | 2,486 | ||
Series 2008 A1, 5.25% 8/15/27 | 15,000 | 15,327 | ||
Series 2008 D1, 5.125% 12/1/23 | 5,000 | 5,345 | ||
New York City Health & Hosp. Corp. Rev. Series 2008 A, 5.5% 2/15/21 | 5,000 | 5,358 | ||
New York City Indl. Dev. Agcy. Civic Facility Rev. (Spence School, Inc. Proj.) Series 2002, 5% 7/1/27 | 3,255 | 3,269 | ||
New York City Muni. Wtr. Fin. Auth. Wtr. & Swr. Sys. Rev.: | ||||
Series 2001 C, 5.125% 6/15/33 | 3,960 | 3,961 | ||
Series 2002 A: | ||||
5% 6/15/32 | 5,000 | 5,001 | ||
5.125% 6/15/34 | 16,500 | 16,537 | ||
Series 2002 G: | ||||
5.125% 6/15/32 | 3,000 | 3,000 | ||
5.125% 6/15/32 (FGIC Insured) | 4,750 | 4,751 | ||
Series 2003 A, 5.125% 6/15/34 | 4,200 | 4,209 | ||
Series 2003 E: | ||||
5% 6/15/34 | 2,000 | 1,967 | ||
5% 6/15/38 | 2,975 | 2,859 | ||
Series 2005 D: | ||||
5% 6/15/37 | 16,090 | 15,608 | ||
5% 6/15/38 | 20,050 | 19,410 | ||
5% 6/15/39 | 3,755 | 3,628 | ||
5% 6/15/39 | 2,800 | 2,705 | ||
Series 2007 DD: | ||||
4.75% 6/15/35 | 3,000 | 2,777 | ||
4.75% 6/15/36 | 1,000 | 923 | ||
Series 2008 AA, 5% 6/15/27 | 10,000 | 10,207 | ||
Series 2009 A, 5.75% 6/15/40 | 10,025 | 10,464 | ||
Series 2009 DD, 6% 6/15/40 | 1,115 | 1,184 | ||
Series 2009 EE, 5.25% 6/15/40 | 6,500 | 6,526 | ||
Series 2009 GG1, 5.25% 6/15/32 | 5,000 | 5,088 | ||
Series FF 2, 5.5% 6/15/40 | 9,295 | 9,494 | ||
Series GG, 5.25% 6/15/40 | 10,000 | 9,955 | ||
Municipal Bonds - continued | ||||
| Principal Amount (000s) | Value (000s) | ||
New York - continued | ||||
New York City Transitional Fin. Auth. Bldg. Aid Rev.: | ||||
Series 2007 S1, 5% 7/15/36 | $ 3,000 | $ 2,895 | ||
Series 2008 S1, 5% 1/15/34 | 10,000 | 9,707 | ||
Series 2009 S1: | ||||
5.5% 7/15/31 | 5,000 | 5,132 | ||
5.5% 7/15/38 | 2,900 | 2,958 | ||
5.625% 7/15/38 | 2,900 | 2,981 | ||
Series 2009 S2, 6% 7/15/38 | 7,500 | 7,881 | ||
Series 2009 S3: | ||||
5.25% 1/15/26 | 1,000 | 1,023 | ||
5.25% 1/15/39 | 3,400 | 3,385 | ||
5.375% 1/15/34 | 13,435 | 13,577 | ||
Series 2009 S4: | ||||
5.5% 1/15/34 | 1,000 | 1,025 | ||
5.5% 1/15/39 | 6,700 | 6,838 | ||
5.75% 1/15/39 | 2,900 | 3,007 | ||
Series 2009 S5, 5.25% 1/15/39 | 10,180 | 10,135 | ||
New York City Transitional Fin. Auth. Rev.: | ||||
Series 2002 A, 5.375% 11/15/21 | 1,100 | 1,162 | ||
Series 2003 D: | ||||
5% 2/1/31 | 20,025 | 20,051 | ||
5.25% 2/1/17 (Nat'l. Pub. Fin. Guarantee Corp. Insured) | 9,385 | 10,089 | ||
Series 2004 B: | ||||
5% 8/1/32 | 5,000 | 5,000 | ||
5.25% 8/1/19 | 2,810 | 3,056 | ||
Series 2004 C: | ||||
5% 2/1/28 | 15,000 | 15,124 | ||
5% 2/1/33 (FGIC Insured) | 7,350 | 7,292 | ||
Series A, 5.5% 11/15/17 (FGIC Insured) | 6,725 | 7,188 | ||
Series D: | ||||
5.25% 2/1/19 | 7,050 | 7,501 | ||
5.25% 2/1/20 (Nat'l. Pub. Fin. Guarantee Corp. Insured) | 4,185 | 4,445 | ||
New York City Trust Cultural Resources Rev.: | ||||
(Carnegie Hall Proj.) Series 2009 A, 5% 12/1/39 | 23,090 | 21,907 | ||
(Museum of Modern Art Proj.) Series 2001 D, 5.125% 7/1/31 | 3,200 | 3,204 | ||
Bonds (The Juilliard School Proj.) Series 2009 B, 2.75%, tender 7/1/12 (a) | 4,000 | 4,080 | ||
New York Convention Ctr. Dev. Corp. Rev. Series 2005, 5% 11/15/44 | 30,000 | 27,083 | ||
Municipal Bonds - continued | ||||
| Principal Amount (000s) | Value (000s) | ||
New York - continued | ||||
New York Dorm. Auth. Personal Income Tax Rev.: | ||||
(Ed. Proj.): | ||||
Series 2006 D: | ||||
5% 3/15/20 | $ 3,500 | $ 3,753 | ||
5% 3/15/36 | 3,320 | 3,250 | ||
Series 2007 A, 5% 3/15/37 | 1,700 | 1,661 | ||
Series 2008 B: | ||||
5.25% 3/15/38 | 1,500 | 1,513 | ||
5.75% 3/15/36 | 10,500 | 11,055 | ||
Series 2006 C: | ||||
5% 12/15/22 | 4,305 | 4,535 | ||
5% 12/15/31 | 10,000 | 10,015 | ||
Series 2007 A, 5% 3/15/32 | 3,700 | 3,681 | ||
Series 2008 A, 5% 3/15/24 | 5,000 | 5,212 | ||
Series 2009 A: | ||||
5% 2/15/34 | 15,500 | 15,250 | ||
5.25% 2/15/23 | 7,940 | 8,588 | ||
Series A, 5% 2/15/39 | 20,355 | 19,816 | ||
New York Dorm. Auth. Revs.: | ||||
(City Univ. Sys. Consolidation Proj.) Series A: | ||||
5.75% 7/1/13 | 4,800 | 5,058 | ||
5.75% 7/1/13 (AMBAC Insured) | 2,390 | 2,519 | ||
(Colgate Univ. Proj.) Series 1996: | ||||
6% 7/1/16 (Nat'l. Pub. Fin. Guarantee Corp. Insured) | 1,900 | 2,123 | ||
6% 7/1/21 (Nat'l. Pub. Fin. Guarantee Corp. Insured) | 2,500 | 2,875 | ||
(Cornell Univ. Proj.): | ||||
Series 2008 C: | ||||
5% 7/1/29 | 2,015 | 2,054 | ||
5% 7/1/37 | 6,000 | 5,948 | ||
Series 2009 A: | ||||
5% 7/1/22 | 445 | 482 | ||
5% 7/1/23 | 1,315 | 1,406 | ||
(Marymount Manhattan College Proj.) Series 2009: | ||||
5% 7/1/15 | 1,350 | 1,437 | ||
5% 7/1/17 | 2,080 | 2,193 | ||
(Mental Health Svcs. Proj.) Series 2005 E, 5% 2/15/22 (Nat'l. Pub. Fin. Guarantee Corp. Insured) | 5,115 | 5,267 | ||
(Montefiore Med. Ctr. Proj.) Series 2000: | ||||
5.8% 8/1/30 | 2,035 | 2,045 | ||
5.85% 8/1/40 | 9,500 | 9,555 | ||
Municipal Bonds - continued | ||||
| Principal Amount (000s) | Value (000s) | ||
New York - continued | ||||
New York Dorm. Auth. Revs.: - continued | ||||
(New York City Court Facilities Lease Proj.) Series 2005 A: | ||||
5.5% 5/15/20 | $ 13,000 | $ 14,277 | ||
5.5% 5/15/21 (AMBAC Insured) | 10,000 | 10,953 | ||
5.5% 5/15/28 | 2,700 | 2,739 | ||
(New York City Gen. Oblig. Proj.) Series B, 6% 7/1/14 | 1,820 | 1,974 | ||
(New York Univ. Hosp. Ctr. Proj.): | ||||
Series 2006 A: | ||||
5% 7/1/13 | 1,930 | 2,057 | ||
5% 7/1/14 | 2,510 | 2,695 | ||
5% 7/1/16 | 1,130 | 1,210 | ||
5% 7/1/20 | 2,000 | 2,011 | ||
Series 2007 A: | ||||
5% 7/1/11 | 1,365 | 1,385 | ||
5% 7/1/12 | 1,530 | 1,599 | ||
Series 2007 B, 5.25% 7/1/24 | 100 | 97 | ||
Series 2011 A: | ||||
5.75% 7/1/31 | 4,000 | 3,815 | ||
6% 7/1/40 | 4,000 | 3,840 | ||
(New York Univ. Proj.): | ||||
Series 2001 1, 5.5% 7/1/40 (AMBAC Insured) | 3,000 | 3,101 | ||
Series 2001 2: | ||||
5.5% 7/1/17 (AMBAC Insured) | 755 | 764 | ||
5.5% 7/1/19 (AMBAC Insured) | 1,705 | 1,724 | ||
5.5% 7/1/20 (AMBAC Insured) | 860 | 869 | ||
Series 2008 A, 5.25% 7/1/48 | 11,930 | 11,756 | ||
Series 2008 B, 5.25% 7/1/48 | 8,000 | 7,884 | ||
(North Shore - Long Island Jewish Obligated Group Proj.) Series 2009 A, 5.5% 5/1/37 | 8,085 | 7,666 | ||
(North Shore Univ. Hosp. Proj.): | ||||
Series 2007 A: | ||||
5% 5/1/19 | 2,000 | 2,035 | ||
5% 5/1/21 | 1,315 | 1,318 | ||
Series 1998, 5.5% 11/1/14 (Nat'l. Pub. Fin. Guarantee Corp. Insured) | 1,500 | 1,635 | ||
(Orange Reg'l. Med. Ctr. Proj.) Series 2008: | ||||
5.5% 12/1/12 | 3,125 | 3,192 | ||
6.125% 12/1/29 | 1,000 | 961 | ||
(Rochester Institute of Technology Proj.) Series 2010: | ||||
5% 7/1/20 | 1,000 | 1,073 | ||
Municipal Bonds - continued | ||||
| Principal Amount (000s) | Value (000s) | ||
New York - continued | ||||
New York Dorm. Auth. Revs.: - continued | ||||
(Rochester Institute of Technology Proj.) Series 2010: | ||||
5% 7/1/21 | $ 1,500 | $ 1,590 | ||
(Rockefeller Univ. Proj.) Series 2009 C, 5% 7/1/40 | 15,000 | 14,840 | ||
(School District Fing. Prog.): | ||||
Series 2002 D, 5.5% 10/1/17 (Nat'l. Pub. Fin. Guarantee Corp. Insured) | 10,825 | 11,413 | ||
Series 2002 E, 5.75% 10/1/22 (Nat'l. Pub. Fin. Guarantee Corp. Insured) | 1,485 | 1,545 | ||
Series 2002 H, 5.5% 10/1/17 (Nat'l. Pub. Fin. Guarantee Corp. Insured) | 2,600 | 2,741 | ||
Series 2002 I, 5.75% 10/1/18 (Nat'l. Pub. Fin. Guarantee Corp. Insured) | 500 | 529 | ||
(St. John's Univ. Proj.) Series 2007 A, 5.25% 7/1/37 (Nat'l. Pub. Fin. Guarantee Corp. Insured) | 18,915 | 18,107 | ||
(St. Lawrence Univ.) Series 2008, 5% 7/1/14 | 7,000 | 7,605 | ||
(State Univ. Edl. Facilities Proj.) Series A, 5.25% 5/15/15 (Nat'l. Pub. Fin. Guarantee Corp. Insured) | 8,855 | 9,832 | ||
(Teachers College Proj.) Series 2009: | ||||
5.375% 3/1/29 | 2,000 | 2,018 | ||
5.5% 3/1/39 | 2,500 | 2,482 | ||
(Univ. of Rochester Proj.) Series 2007 A1: | ||||
5% 7/1/18 | 3,000 | 3,233 | ||
5% 7/1/39 | 19,005 | 17,854 | ||
(Vassar College Proj.) Series 2010, 5% 7/1/49 | 9,000 | 8,310 | ||
(Winthrop-South Nassau Univ. Health Sys. Oblig. Group Proj.) Series 2003 A: | ||||
6% 7/1/14 | 1,095 | 1,148 | ||
6% 7/1/15 | 1,160 | 1,212 | ||
6% 7/1/16 | 1,230 | 1,280 | ||
(Yeshiva Univ. Proj.) Series 2001: | ||||
5.375% 7/1/16 (AMBAC Insured) | 670 | 678 | ||
5.375% 7/1/17 (AMBAC Insured) | 370 | 374 | ||
Bonds Series 2002 B: | ||||
5.25%, tender 5/15/12 (a) | 10,415 | 10,933 | ||
6%, tender 5/15/12 (a) | 11,000 | 11,651 | ||
Series 2002 A, 5.75% 10/1/17 (Nat'l. Pub. Fin. Guarantee Corp. Insured) | 30,260 | 32,071 | ||
Series 2002 B: | ||||
6% 10/1/22 (Nat'l. Pub. Fin. Guarantee Corp. Insured) | 2,775 | 2,879 | ||
6% 10/1/29 (Nat'l. Pub. Fin. Guarantee Corp. Insured) | 5,600 | 5,760 | ||
Municipal Bonds - continued | ||||
| Principal Amount (000s) | Value (000s) | ||
New York - continued | ||||
New York Dorm. Auth. Revs.: - continued | ||||
Series 2005 B: | ||||
5.25% 7/1/20 (Nat'l. Pub. Fin. Guarantee Corp. Insured) | $ 3,345 | $ 3,518 | ||
5.25% 7/1/21 (Nat'l. Pub. Fin. Guarantee Corp. Insured) | 1,745 | 1,824 | ||
5.25% 7/1/22 (Nat'l. Pub. Fin. Guarantee Corp. Insured) | 1,835 | 1,912 | ||
Series 2005 F, 5% 3/15/35 (FSA Insured) | 5,000 | 5,020 | ||
Series 2010 A: | ||||
5% 7/1/19 | 1,500 | 1,586 | ||
5% 7/1/21 | 7,000 | 7,196 | ||
5% 7/1/22 | 6,000 | 6,076 | ||
Series 2010, 5% 7/1/41 | 12,000 | 11,833 | ||
New York Envir. Facilities Corp. Clean Wtr. & Drinking Wtr.: | ||||
(New York City Muni. Wtr. Fin. Auth. Proj.): | ||||
Series 2002 B, 5.25% 6/15/16 | 500 | 529 | ||
Series 2002 D, 5.125% 6/15/31 | 6,900 | 6,940 | ||
Series 2002 G, 5.25% 10/15/20 | 1,255 | 1,272 | ||
Series 2004 F, 5% 6/15/34 | 4,825 | 4,847 | ||
Series 2003 I, 5% 6/15/24 | 2,000 | 2,088 | ||
Series 2004 D, 5% 2/15/34 | 12,150 | 12,208 | ||
New York Envir. Facilities Corp. Poll. Cont. Rev.: | ||||
(New York City Muni. Wtr. Fin. Auth. Proj.): | ||||
Series 1996 C, 5.85% 7/15/15 | 30 | 30 | ||
Series A, 7% 6/15/12 | 190 | 191 | ||
Series E, 6.5% 6/15/14 | 130 | 131 | ||
(Pooled Ln. Prog.) Series 1993 B, 5.2% 5/15/14 | 1,115 | 1,181 | ||
New York Hsg. Fin. Agcy. Personal Income Tax Rev. (Econ. Dev. & Hsg. Proj.) Series 2008 A, 5% 3/15/34 | 10,000 | 9,838 | ||
New York Metropolitan Trans. Auth. Dedicated Tax Fund Rev.: | ||||
Series 2002 A, 5.5% 11/15/26 | 13,575 | 13,737 | ||
Series 2009 A: | ||||
5.5% 11/15/39 | 10,400 | 10,544 | ||
5.625% 11/15/39 | 6,000 | 6,130 | ||
Series B, 5% 11/15/34 | 19,560 | 18,847 | ||
New York Metropolitan Trans. Auth. Rev.: | ||||
Series 2002 A, 5.75% 11/15/32 | 10,000 | 10,060 | ||
Series 2003 A, 5.5% 11/15/19 (FGIC Insured) | 5,000 | 5,610 | ||
Municipal Bonds - continued | ||||
| Principal Amount (000s) | Value (000s) | ||
New York - continued | ||||
New York Metropolitan Trans. Auth. Rev.: - continued | ||||
Series 2003 B, 5.25% 11/15/18 (Nat'l. Pub. Fin. Guarantee Corp. Insured) | $ 4,000 | $ 4,167 | ||
Series 2005 A, 5.5% 11/15/18 (AMBAC Insured) | 2,000 | 2,254 | ||
Series 2005 B, 5% 11/15/35 (Nat'l. Pub. Fin. Guarantee Corp. Insured) | 3,300 | 3,038 | ||
Series 2007 B: | ||||
5% 11/15/26 | 8,185 | 7,932 | ||
5% 11/15/28 | 2,235 | 2,090 | ||
Series 2008 A, 5.25% 11/15/36 | 15,000 | 14,485 | ||
Series 2008 C, 6.5% 11/15/28 | 9,445 | 10,190 | ||
New York Pwr. Auth.: | ||||
Series 2000 A, 5.25% 11/15/40 | 25,860 | 25,742 | ||
Series 2007 A, 5% 11/15/47 (Nat'l. Pub. Fin. Guarantee Corp. Insured) | 20,000 | 18,756 | ||
New York Sales Tax Asset Receivables Corp. Series 2005 A, 5.25% 10/15/27 (AMBAC Insured) | 4,355 | 4,472 | ||
New York State Dorm. Auth. Lease Rev. Bonds Series 2003 B, 5.25%, tender 7/1/13 (XL Cap. Assurance, Inc. Insured) (a) | 10,000 | 10,791 | ||
New York State Energy Research & Dev. Auth. Facilities Rev. Bonds (Consolidated Edison Co. of New York, Inc. Proj.) Series 2010 A, 1.45%, tender 11/1/12 (a)(b) | 11,800 | 11,771 | ||
New York State Gen. Oblig. Series 2009 A, 0% 2/15/19 | 2,835 | 2,142 | ||
New York Thruway Auth. Gen. Rev.: | ||||
Series 2005 G: | ||||
5% 1/1/32 (FSA Insured) | 2,800 | 2,664 | ||
5.25% 1/1/27 | 6,570 | 6,621 | ||
Series 2007 H: | ||||
5% 1/1/21 | 5,755 | 5,986 | ||
5% 1/1/25 | 13,000 | 13,037 | ||
5% 1/1/26 | 4,000 | 3,983 | ||
New York Thruway Auth. Hwy. & Bridge Trust Fund: | ||||
Series 2005 B: | ||||
5% 4/1/17 (Nat'l. Pub. Fin. Guarantee Corp. Insured) | 9,660 | 10,596 | ||
5.5% 4/1/20 (AMBAC Insured) | 27,375 | 31,150 | ||
Series 2007 B, 5% 4/1/27 | 6,750 | 6,799 | ||
New York Thruway Auth. Personal Income Tax Rev. Series 2007 A: | ||||
5.25% 3/15/24 | 4,180 | 4,431 | ||
5.25% 3/15/25 | 8,000 | 8,363 | ||
Municipal Bonds - continued | ||||
| Principal Amount (000s) | Value (000s) | ||
New York - continued | ||||
New York Thruway Auth. Personal Income Tax Rev. Series 2007 A: - continued | ||||
5.25% 3/15/26 | $ 12,080 | $ 12,565 | ||
New York Urban Dev. Corp. Rev.: | ||||
(Econ. Dev. and Hsg. Proj.) Series 2008 A1, 5% 12/15/26 | 10,000 | 10,239 | ||
(State Facilities and Equip. Proj.) Series 2004 A2, 5.5% 3/15/22 (Nat'l. Pub. Fin. Guarantee Corp. Insured) | 4,000 | 4,546 | ||
Series 2007 A: | ||||
5% 1/1/23 (FSA Insured) | 6,165 | 6,477 | ||
5% 1/1/24 (FSA Insured) | 5,975 | 6,223 | ||
Niagara Falls City Niagara County Pub. Impt. Series 1994: | ||||
7.5% 3/1/11 (Escrowed to Maturity) (c) | 105 | 106 | ||
7.5% 3/1/16 (Escrowed to Maturity) (c) | 90 | 115 | ||
7.5% 3/1/16 (Nat'l. Pub. Fin. Guarantee Corp. Insured) | 970 | 1,149 | ||
7.5% 3/1/17 (Escrowed to Maturity) (c) | 100 | 130 | ||
7.5% 3/1/17 (Nat'l. Pub. Fin. Guarantee Corp. Insured) | 1,100 | 1,314 | ||
Niagara Falls Pub. Wtr. Auth. Series 2005, 5.5% 7/15/34 (XL Cap. Assurance, Inc. Insured) | 1,000 | 934 | ||
Oneida County Indl. Dev. Agcy. (Hamilton College Proj.) Series 2002, 5% 9/15/32 | 5,000 | 4,903 | ||
Saratoga County Indl. Dev. Agcy. (The Saratoga Hosp. Proj.) Series 2007 B, 5.25% 12/1/32 | 680 | 605 | ||
Schenectady Indl. Dev. Agcy. Civic Facility Rev. (Union College Proj.) Series 2006, 5% 7/1/15 | 1,005 | 1,109 | ||
Suffolk County Indl. Dev. Agcy. Civic Facility Rev. (Huntington Hosp. Proj.) Series 2002 B, 6% 11/1/22 | 4,305 | 4,371 | ||
Taconic Hills Central School District at Craryville Series 2002, 5% 6/15/16 (FGIC Insured) | 1,130 | 1,166 | ||
Tobacco Settlement Fing. Corp.: | ||||
Series 2003 A1: | ||||
5.25% 6/1/21 (AMBAC Insured) | 3,255 | 3,358 | ||
5.25% 6/1/22 (AMBAC Insured) | 8,070 | 8,270 | ||
5.5% 6/1/14 | 3,330 | 3,342 | ||
5.5% 6/1/15 | 2,980 | 2,991 | ||
5.5% 6/1/16 | 17,500 | 17,558 | ||
5.5% 6/1/17 | 7,000 | 7,064 | ||
5.5% 6/1/18 (Nat'l. Pub. Fin. Guarantee Corp. Insured) | 3,000 | 3,096 | ||
Municipal Bonds - continued | ||||
| Principal Amount (000s) | Value (000s) | ||
New York - continued | ||||
Tobacco Settlement Fing. Corp.: - continued | ||||
Series 2003 A1: | ||||
5.5% 6/1/19 | $ 4,600 | $ 4,825 | ||
Series 2003B 1C: | ||||
5.5% 6/1/14 | 4,495 | 4,512 | ||
5.5% 6/1/15 | 11,800 | 11,842 | ||
5.5% 6/1/16 | 10,040 | 10,172 | ||
5.5% 6/1/17 | 5,700 | 5,752 | ||
5.5% 6/1/18 | 3,800 | 3,922 | ||
5.5% 6/1/19 | 13,620 | 14,285 | ||
5.5% 6/1/20 | 16,000 | 16,720 | ||
5.5% 6/1/21 | 12,070 | 12,572 | ||
5.5% 6/1/22 | 9,700 | 10,037 | ||
Triborough Bridge & Tunnel Auth. Revs.: | ||||
(MTA Bridges and Tunnels Proj.): | ||||
Series 2006 A, 5% 11/15/31 | 4,375 | 4,363 | ||
Series 2007 A, 5% 11/15/27 | 6,410 | 6,539 | ||
Series 2008 A: | ||||
5% 11/15/37 | 17,500 | 16,849 | ||
5.25% 11/15/38 | 14,500 | 14,525 | ||
Series 2001 A: | ||||
5% 1/1/32 | 3,010 | 2,956 | ||
5% 1/1/32 (Nat'l. Pub. Fin. Guarantee Corp. Insured) | 1,455 | 1,429 | ||
Series 2002 A, 5.25% 1/1/19 | 1,100 | 1,124 | ||
Troy Cap. Resource Corp. Rev. (Rensselaer Polytechnic Institute Proj.) Series 2010 A: | ||||
5% 9/1/30 | 5,000 | 4,685 | ||
5.125% 9/1/40 | 8,055 | 7,344 | ||
Yonkers Gen. Oblig. Series 2005 A, 5% 8/1/15 (Nat'l. Pub. Fin. Guarantee Corp. Insured) | 4,000 | 4,310 | ||
Yonkers Indl. Dev. Agcy. Civic Facility Rev. (Sarah Lawrence College Proj.) Series A: | ||||
6% 6/1/29 | 1,130 | 1,162 | ||
6% 6/1/41 | 5,000 | 4,972 | ||
| 1,568,501 | |||
New York & New Jersey - 4.4% | ||||
Port Auth. of New York & New Jersey: | ||||
124th Series, 5% 8/1/13 (FGIC Insured) (b) | 3,000 | 3,006 | ||
126th Series, 5.25% 5/15/37 (FGIC Insured) (b) | 4,175 | 4,053 | ||
134th Series, 5% 1/15/39 | 10,000 | 9,735 | ||
136th Series, 5.25% 11/1/16 (b) | 4,510 | 4,948 | ||
Municipal Bonds - continued | ||||
| Principal Amount (000s) | Value (000s) | ||
New York & New Jersey - continued | ||||
Port Auth. of New York & New Jersey: - continued | ||||
141st Series: | ||||
5% 9/1/18 (b) | $ 6,045 | $ 6,420 | ||
5% 9/1/21 (CIFG North America Insured) (b) | 4,600 | 4,818 | ||
147th Series, 5% 10/15/17 (b) | 5,000 | 5,441 | ||
163rd Series, 5% 7/15/35 | 25,000 | 24,584 | ||
85th Series, 5.375% 3/1/28 | 6,280 | 6,630 | ||
Port Auth. of New York & New Jersey Spl. Oblig. Rev. (JFK Int'l. Air Term. Spl. Proj.) Series 6, 6.25% 12/1/15 (Nat'l. Pub. Fin. Guarantee Corp. Insured) (b) | 5,000 | 5,234 | ||
| 74,869 | |||
Puerto Rico - 1.5% | ||||
Puerto Rico Commonwealth Hwy. & Trans. Auth. Trans. Rev. Series 1998, 5.75% 7/1/22 (CIFG North America Insured) | 3,000 | 2,975 | ||
Puerto Rico Commonwealth Infrastructure Fing. Auth. Series 2005 C, 5.5% 7/1/27 | 1,000 | 942 | ||
Puerto Rico Commonwealth Pub. Impt. Gen. Oblig.: | ||||
(Pub. Impt. Proj.) Series 2002 A, 5.5% 7/1/20 (Nat'l. Pub. Fin. Guarantee Corp. Insured) | 4,150 | 4,217 | ||
Series 2007 A, 5.5% 7/1/19 (Nat'l. Pub. Fin. Guarantee Corp. Insured) | 5,000 | 5,149 | ||
Puerto Rico Elec. Pwr. Auth. Pwr. Rev. Series QQ: | ||||
5.25% 7/1/13 (XL Cap. Assurance, Inc. Insured) | 1,500 | 1,608 | ||
5.5% 7/1/16 (XL Cap. Assurance, Inc. Insured) | 1,000 | 1,098 | ||
Puerto Rico Muni. Fin. Agcy. Series 2005 C, 5.25% 8/1/17 (FSA Insured) | 1,000 | 1,073 | ||
Puerto Rico Sales Tax Fing. Corp. Sales Tax Rev.: | ||||
Series 2007 A: | ||||
0% 8/1/41 (FGIC Insured) | 33,500 | 4,147 | ||
0% 8/1/45 (Nat'l. Pub. Fin. Guarantee Corp. Insured) | 1,650 | 154 | ||
0% 8/1/47 (AMBAC Insured) | 2,400 | 194 | ||
Series 2009 A, 6% 8/1/42 | 2,900 | 2,888 | ||
| 24,445 | |||
Municipal Bonds - continued | ||||
| Principal Amount (000s) | Value (000s) | ||
Virgin Islands - 0.4% | ||||
Virgin Islands Pub. Fin. Auth. Series 2009 B: | ||||
5% 10/1/16 | $ 4,000 | $ 4,242 | ||
5% 10/1/17 | 2,750 | 2,894 | ||
| 7,136 | |||
TOTAL INVESTMENT PORTFOLIO - 98.8% (Cost $1,697,611) | 1,674,951 | ||
NET OTHER ASSETS (LIABILITIES) - 1.2% | 20,490 | ||
NET ASSETS - 100% | $ 1,695,441 | ||
Legend |
(a) Coupon rates for floating and adjustable rate securities reflect the rates in effect at period end. |
(b) Private activity obligations whose interest is subject to the federal alternative minimum tax for individuals. |
(c) Security collateralized by an amount sufficient to pay interest and principal. |
Other Information |
All investments are categorized as Level 2 under the Fair Value Hierarchy. The inputs or methodology used for valuing securities may not be an indication of the risk associated with investing in those securities. For more information on valuation inputs, please refer to the Security Valuation section in the accompanying Notes to Financial Statements. |
The distribution of municipal securities by revenue source, as a percentage of total net assets, is as follows (Unaudited): |
General Obligations | 29.6% |
Special Tax | 20.6% |
Transportation | 13.7% |
Education | 12.4% |
Water & Sewer | 10.1% |
Electric Utilities | 5.8% |
Others* (Individually Less Than 5%) | 7.8% |
| 100.0% |
*Includes net other assets |
See accompanying notes which are an integral part of the financial statements.
Annual Report
Financial Statements
Statement of Assets and Liabilities
Amounts in thousands (except per-share amounts) | January 31, 2011 | |
|
|
|
Assets | ||
Investment in securities, at value - See accompanying schedule: Unaffiliated issuers (cost $1,697,611) |
| $ 1,674,951 |
Cash | 3,577 | |
Receivable for fund shares sold | 3,500 | |
Interest receivable | 18,861 | |
Prepaid expenses | 4 | |
Other receivables | 3 | |
Total assets | 1,700,896 | |
|
|
|
Liabilities | ||
Payable for fund shares redeemed | $ 3,020 | |
Distributions payable | 1,530 | |
Accrued management fee | 528 | |
Distribution and service plan fees payable | 39 | |
Other affiliated payables | 288 | |
Other payables and accrued expenses | 50 | |
Total liabilities | 5,455 | |
|
|
|
Net Assets | $ 1,695,441 | |
Net Assets consist of: |
| |
Paid in capital | $ 1,714,053 | |
Undistributed net investment income | 84 | |
Accumulated undistributed net realized gain (loss) on investments | 3,964 | |
Net unrealized appreciation (depreciation) on investments | (22,660) | |
Net Assets | $ 1,695,441 | |
See accompanying notes which are an integral part of the financial statements.
Annual Report
Statement of Assets and Liabilities - continued
Amounts in thousands (except per-share amounts) | January 31, 2011 | |
|
|
|
Calculation of Maximum Offering Price | $ 12.48 | |
|
|
|
Maximum offering price per share (100/96.00 of $12.48) | $ 13.00 | |
Class T: | $ 12.49 | |
|
|
|
Maximum offering price per share (100/96.00 of $12.49) | $ 13.01 | |
Class B: | $ 12.48 | |
|
|
|
Class C: | $ 12.48 | |
|
|
|
|
|
|
New York Municipal Income: | $ 12.49 | |
|
|
|
Institutional Class: | $ 12.47 | |
A Redemption price per share is equal to net asset value less any applicable contingent deferred sales charge.
See accompanying notes which are an integral part of the financial statements.
Annual Report
Financial Statements - continued
Statement of Operations
Amounts in thousands | Year ended January 31, 2011 | |
|
|
|
Investment Income |
|
|
Interest |
| $ 81,775 |
|
|
|
Expenses | ||
Management fee | $ 6,984 | |
Transfer agent fees | 1,408 | |
Distribution and service plan fees | 487 | |
Accounting fees and expenses | 349 | |
Custodian fees and expenses | 27 | |
Independent trustees' compensation | 7 | |
Registration fees | 88 | |
Audit | 58 | |
Legal | 11 | |
Miscellaneous | 22 | |
Total expenses before reductions | 9,441 | |
Expense reductions | (24) | 9,417 |
Net investment income | 72,358 | |
Realized and Unrealized Gain (Loss) Net realized gain (loss) on: | ||
Investment securities: |
|
|
Unaffiliated issuers |
| 6,167 |
Change in net unrealized appreciation (depreciation) on investment securities | (58,519) | |
Net gain (loss) | (52,352) | |
Net increase (decrease) in net assets resulting from operations | $ 20,006 | |
See accompanying notes which are an integral part of the financial statements.
Annual Report
Statement of Changes in Net Assets
Amounts in thousands | Year ended | Year ended |
Increase (Decrease) in Net Assets |
|
|
Operations |
|
|
Net investment income | $ 72,358 | $ 65,029 |
Net realized gain (loss) | 6,167 | (912) |
Change in net unrealized appreciation (depreciation) | (58,519) | 74,634 |
Net increase (decrease) in net assets resulting | 20,006 | 138,751 |
Distributions to shareholders from net investment income | (72,377) | (65,025) |
Distributions to shareholders from net realized gain | (296) | - |
Total distributions | (72,673) | (65,025) |
Share transactions - net increase (decrease) | (81,293) | 268,343 |
Redemption fees | 32 | 40 |
Total increase (decrease) in net assets | (133,928) | 342,109 |
|
|
|
Net Assets | ||
Beginning of period | 1,829,369 | 1,487,260 |
End of period (including undistributed net investment income of $84 and undistributed net investment income of $103, respectively) | $ 1,695,441 | $ 1,829,369 |
See accompanying notes which are an integral part of the financial statements.
Annual Report
Financial Highlights - Class A
Years ended January 31, | 2011 | 2010 | 2009 | 2008 | 2007 |
Selected Per-Share Data |
|
|
|
|
|
Net asset value, beginning of period | $ 12.83 | $ 12.27 | $ 12.80 | $ 12.70 | $ 12.81 |
Income from Investment Operations |
|
|
|
|
|
Net investment income C | .459 | .454 | .449 | .446 | .464 |
Net realized and unrealized gain (loss) | (.347) | .560 | (.521) | .134 | .002 |
Total from investment operations | .112 | 1.014 | (.072) | .580 | .466 |
Distributions from net investment income | (.460) | (.454) | (.451) | (.446) | (.464) |
Distributions from net realized gain | (.002) | - | (.007) | (.034) | (.112) |
Total distributions | (.462) | (.454) | (.458) | (.480) | (.576) |
Redemption fees added to paid in capital C, E | - | - | - | - | - |
Net asset value, end of period | $ 12.48 | $ 12.83 | $ 12.27 | $ 12.80 | $ 12.70 |
Total Return A, B | .79% | 8.39% | (.49)% | 4.67% | 3.72% |
Ratios to Average Net Assets D |
|
|
|
|
|
Expenses before reductions | .75% | .77% | .75% | .73% | .66% |
Expenses net of fee waivers, if any | .75% | .77% | .75% | .73% | .66% |
Expenses net of all reductions | .75% | .77% | .74% | .70% | .63% |
Net investment income | 3.54% | 3.60% | 3.67% | 3.52% | 3.65% |
Supplemental Data |
|
|
|
|
|
Net assets, end of period (in millions) | $ 33 | $ 35 | $ 21 | $ 13 | $ 11 |
Portfolio turnover rate | 10% | 4% | 17% | 13% | 23% |
A Total returns would have been lower had certain expenses not been reduced during the periods shown.
B Total returns do not include the effect of the sales charges.
C Calculated based on average shares outstanding during the period.
D Expense ratios reflect operating expenses of the class. Expenses before reductions do not reflect amounts reimbursed by the investment adviser or reductions from brokerage service arrangements or reductions from other expense offset arrangements and do not represent the amount paid by the class during periods when reimbursements or reductions occur. Expenses net of fee waivers reflect expenses after reimbursement by the investment adviser but prior to reductions from brokerage service arrangements or other expense offset arrangements. Expenses net of all reductions represent the net expenses paid by the class.
E Amount represents less than $.001 per share.
See accompanying notes which are an integral part of the financial statements.
Annual Report
Financial Highlights - Class T
Years ended January 31, | 2011 | 2010 | 2009 | 2008 | 2007 |
Selected Per-Share Data |
|
|
|
|
|
Net asset value, beginning of period | $ 12.84 | $ 12.28 | $ 12.81 | $ 12.71 | $ 12.82 |
Income from Investment Operations |
|
|
|
|
|
Net investment income C | .463 | .459 | .452 | .446 | .455 |
Net realized and unrealized gain (loss) | (.348) | .561 | (.520) | .134 | .001 |
Total from investment operations | .115 | 1.020 | (.068) | .580 | .456 |
Distributions from net investment income | (.463) | (.460) | (.455) | (.446) | (.454) |
Distributions from net realized gain | (.002) | - | (.007) | (.034) | (.112) |
Total distributions | (.465) | (.460) | (.462) | (.480) | (.566) |
Redemption fees added to paid in capital C, E | - | - | - | - | - |
Net asset value, end of period | $ 12.49 | $ 12.84 | $ 12.28 | $ 12.81 | $ 12.71 |
Total Return A, B | .81% | 8.43% | (.46)% | 4.67% | 3.64% |
Ratios to Average Net Assets D |
|
|
|
|
|
Expenses before reductions | .73% | .73% | .72% | .72% | .74% |
Expenses net of fee waivers, if any | .73% | .73% | .72% | .72% | .74% |
Expenses net of all reductions | .73% | .73% | 71% | .70% | .71% |
Net investment income | 3.56% | 3.64% | 3.70% | 3.53% | 3.57% |
Supplemental Data |
|
|
|
|
|
Net assets, end of period (in millions) | $ 8 | $ 9 | $ 8 | $ 5 | $ 4 |
Portfolio turnover rate | 10% | 4% | 17% | 13% | 23% |
A Total returns would have been lower had certain expenses not been reduced during the periods shown.
B Total returns do not include the effect of the sales charges.
C Calculated based on average shares outstanding during the period.
D Expense ratios reflect operating expenses of the class. Expenses before reductions do not reflect amounts reimbursed by the investment adviser or reductions from brokerage service arrangements or reductions from other expense offset arrangements and do not represent the amount paid by the class during periods when reimbursements or reductions occur. Expenses net of fee waivers reflect expenses after reimbursement by the investment adviser but prior to reductions from brokerage service arrangements or other expense offset arrangements. Expenses net of all reductions represent the net expenses paid by the class.
E Amount represents less than $.001 per share.
See accompanying notes which are an integral part of the financial statements.
Annual Report
Financial Highlights - Class B
Years ended January 31, | 2011 | 2010 | 2009 | 2008 | 2007 |
Selected Per-Share Data |
|
|
|
|
|
Net asset value, beginning of period | $ 12.83 | $ 12.26 | $ 12.80 | $ 12.70 | $ 12.81 |
Income from Investment Operations |
|
|
|
|
|
Net investment income C | .376 | .372 | .370 | .358 | .366 |
Net realized and unrealized gain (loss) | (.347) | .571 | (.533) | .134 | .002 |
Total from investment operations | .029 | .943 | (.163) | .492 | .368 |
Distributions from net investment income | (.377) | (.373) | (.370) | (.358) | (.366) |
Distributions from net realized gain | (.002) | - | (.007) | (.034) | (.112) |
Total distributions | (.379) | (.373) | (.377) | (.392) | (.478) |
Redemption fees added to paid in capital C, E | - | - | - | - | - |
Net asset value, end of period | $ 12.48 | $ 12.83 | $ 12.26 | $ 12.80 | $ 12.70 |
Total Return A, B | .15% | 7.79% | (1.23)% | 3.95% | 2.93% |
Ratios to Average Net Assets D |
|
|
|
|
|
Expenses before reductions | 1.40% | 1.42% | 1.41% | 1.42% | 1.43% |
Expenses net of fee waivers, if any | 1.40% | 1.42% | 1.41% | 1.42% | 1.43% |
Expenses net of all reductions | 1.40% | 1.41% | 1.40% | 1.40% | 1.40% |
Net investment income | 2.89% | 2.95% | 3.01% | 2.83% | 2.88% |
Supplemental Data |
|
|
|
|
|
Net assets, end of period (in millions) | $ 4 | $ 6 | $ 7 | $ 8 | $ 9 |
Portfolio turnover rate | 10% | 4% | 17% | 13% | 23% |
A Total returns would have been lower had certain expenses not been reduced during the periods shown.
B Total returns do not include the effect of the contingent deferred sales charge.
C Calculated based on average shares outstanding during the period.
D Expense ratios reflect operating expenses of the class. Expenses before reductions do not reflect amounts reimbursed by the investment adviser or reductions from brokerage service arrangements or reductions from other expense offset arrangements and do not represent the amount paid by the class during periods when reimbursements or reductions occur. Expenses net of fee waivers reflect expenses after reimbursement by the investment adviser but prior to reductions from brokerage service arrangements or other expense offset arrangements. Expenses net of all reductions represent the net expenses paid by the class.
E Amount represents less than $.001 per share.
See accompanying notes which are an integral part of the financial statements.
Annual Report
Financial Highlights - Class C
Years ended January 31, | 2011 | 2010 | 2009 | 2008 | 2007 |
Selected Per-Share Data |
|
|
|
|
|
Net asset value, beginning of period | $ 12.83 | $ 12.27 | $ 12.80 | $ 12.70 | $ 12.81 |
Income from Investment Operations |
|
|
|
|
|
Net investment income C | .358 | .357 | .357 | .347 | .355 |
Net realized and unrealized gain (loss) | (.347) | .560 | (.522) | .134 | .002 |
Total from investment operations | .011 | .917 | (.165) | .481 | .357 |
Distributions from net investment income | (.359) | (.357) | (.358) | (.347) | (.355) |
Distributions from net realized gain | (.002) | - | (.007) | (.034) | (.112) |
Total distributions | (.361) | (.357) | (.365) | (.381) | (.467) |
Redemption fees added to paid in capital C, E | - | - | - | - | - |
Net asset value, end of period | $ 12.48 | $ 12.83 | $ 12.27 | $ 12.80 | $ 12.70 |
Total Return A, B | .01% | 7.57% | (1.24)% | 3.86% | 2.84% |
Ratios to Average Net Assets D |
|
|
|
|
|
Expenses before reductions | 1.53% | 1.54% | 1.51% | 1.51% | 1.52% |
Expenses net of fee waivers, if any | 1.53% | 1.54% | 1.51% | 1.51% | 1.52% |
Expenses net of all reductions | 1.53% | 1.53% | 1.50% | 1.48% | 1.49% |
Net investment income | 2.76% | 2.83% | 2.91% | 2.74% | 2.79% |
Supplemental Data |
|
|
|
|
|
Net assets, end of period (in millions) | $ 32 | $ 29 | $ 19 | $ 16 | $ 16 |
Portfolio turnover rate | 10% | 4% | 17% | 13% | 23% |
A Total returns would have been lower had certain expenses not been reduced during the periods shown.
B Total returns do not include the effect of the contingent deferred sales charge.
C Calculated based on average shares outstanding during the period.
D Expense ratios reflect operating expenses of the class. Expenses before reductions do not reflect amounts reimbursed by the investment adviser or reductions from brokerage service arrangements or reductions from other expense offset arrangements and do not represent the amount paid by the class during periods when reimbursements or reductions occur. Expenses net of fee waivers reflect expenses after reimbursement by the investment adviser but prior to reductions from brokerage service arrangements or other expense offset arrangements. Expenses net of all reductions represent the net expenses paid by the class.
E Amount represents less than $.001 per share.
See accompanying notes which are an integral part of the financial statements.
Annual Report
Financial Highlights - New York Municipal Income
Years ended January 31, | 2011 | 2010 | 2009 | 2008 | 2007 |
Selected Per-Share Data |
|
|
|
|
|
Net asset value, beginning of period | $ 12.83 | $ 12.27 | $ 12.81 | $ 12.71 | $ 12.82 |
Income from Investment Operations |
|
|
|
|
|
Net investment income B | .497 | .491 | .486 | .479 | .488 |
Net realized and unrealized gain (loss) | (.338) | .560 | (.533) | .134 | .001 |
Total from investment operations | .159 | 1.051 | (.047) | .613 | .489 |
Distributions from net investment income | (.497) | (.491) | (.486) | (.479) | (.487) |
Distributions from net realized gain | (.002) | - | (.007) | (.034) | (.112) |
Total distributions | (.499) | (.491) | (.493) | (.513) | (.599) |
Redemption fees added to paid in capital B, D | - | - | - | - | - |
Net asset value, end of period | $ 12.49 | $ 12.83 | $ 12.27 | $ 12.81 | $ 12.71 |
Total Return A | 1.16% | 8.71% | (.29)% | 4.94% | 3.91% |
Ratios to Average Net Assets C |
|
|
|
|
|
Expenses before reductions | .47% | .48% | .47% | .47% | .48% |
Expenses net of fee waivers, if any | .47% | .48% | .47% | .47% | .48% |
Expenses net of all reductions | .47% | .47% | .46% | .44% | .45% |
Net investment income | 3.82% | 3.89% | 3.95% | 3.78% | 3.83% |
Supplemental Data |
|
|
|
|
|
Net assets, end of period (in millions) | $ 1,604 | $ 1,740 | $ 1,428 | $ 1,480 | $ 1,407 |
Portfolio turnover rate | 10% | 4% | 17% | 13% | 23% |
A Total returns would have been lower had certain expenses not been reduced during the periods shown.
B Calculated based on average shares outstanding during the period.
C Expense ratios reflect operating expenses of the class. Expenses before reductions do not reflect amounts reimbursed by the investment adviser or reductions from brokerage service arrangements or reductions from other expense offset arrangements and do not represent the amount paid by the class during periods when reimbursements or reductions occur. Expenses net of fee waivers reflect expenses after reimbursement by the investment adviser but prior to reductions from brokerage service arrangements or other expense offset arrangements. Expenses net of all reductions represent the net expenses paid by the class.
D Amount represents less than $.001 per share.
See accompanying notes which are an integral part of the financial statements.
Annual Report
Financial Highlights - Institutional Class
Years ended January 31, | 2011 | 2010 | 2009 | 2008 | 2007 |
Selected Per-Share Data |
|
|
|
|
|
Net asset value, beginning of period | $ 12.82 | $ 12.26 | $ 12.80 | $ 12.70 | $ 12.81 |
Income from Investment Operations |
|
|
|
|
|
Net investment income B | .487 | .485 | .479 | .479 | .487 |
Net realized and unrealized gain (loss) | (.347) | .561 | (.527) | .133 | .002 |
Total from investment operations | .140 | 1.046 | (.048) | .612 | .489 |
Distributions from net investment income | (.488) | (.486) | (.485) | (.478) | (.487) |
Distributions from net realized gain | (.002) | - | (.007) | (.034) | (.112) |
Total distributions | (.490) | (.486) | (.492) | (.512) | (.599) |
Redemption fees added to paid in capital B, D | - | - | - | - | - |
Net asset value, end of period | $ 12.47 | $ 12.82 | $ 12.26 | $ 12.80 | $ 12.70 |
Total Return A | 1.01% | 8.67% | (.29)% | 4.94% | 3.91% |
Ratios to Average Net Assets C |
|
|
|
|
|
Expenses before reductions | .53% | .52% | .48% | .47% | .48% |
Expenses net of fee waivers, if any | .53% | .52% | .48% | .47% | .48% |
Expenses net of all reductions | .53% | .52% | .47% | .44% | .45% |
Net investment income | 3.76% | 3.85% | 3.94% | 3.78% | 3.83% |
Supplemental Data |
|
|
|
|
|
Net assets, end of period (in millions) | $ 14 | $ 10 | $ 5 | $ 2 | $ 1 |
Portfolio turnover rate | 10% | 4% | 17% | 13% | 23% |
A Total returns would have been lower had certain expenses not been reduced during the periods shown.
B Calculated based on average shares outstanding during the period.
C Expense ratios reflect operating expenses of the class. Expenses before reductions do not reflect amounts reimbursed by the investment adviser or reductions from brokerage service arrangements or reductions from other expense offset arrangements and do not represent the amount paid by the class during periods when reimbursements or reductions occur. Expenses net of fee waivers reflect expenses after reimbursement by the investment adviser but prior to reductions from brokerage service arrangements or other expense offset arrangements. Expenses net of all reductions represent the net expenses paid by the class.
D Amount represents less than $.001 per share.
See accompanying notes which are an integral part of the financial statements.
Annual Report
Notes to Financial Statements
For the period ended January 31, 2011
(Amounts in thousands except ratios)
1. Organization.
Fidelity New York Municipal Income Fund (the Fund) is a non-diversified fund of Fidelity New York Municipal Trust (the Trust) and is authorized to issue an unlimited number of shares. The Trust is registered under the Investment Company Act of 1940, as amended (the 1940 Act), as an open-end management investment company organized as a Massachusetts business trust. The Fund offers Class A, Class T, Class C, New York Municipal Income, and Institutional Class shares, along with Class B shares, each of which has equal rights as to assets and voting privileges. Effective after the close of business on September 1, 2010, Class B shares were closed to new accounts and additional purchases by existing shareholders. Each class has exclusive voting rights with respect to matters that affect that class. Class B shares will automatically convert to Class A shares after a holding period of seven years from the initial date of purchase. Investment income, realized and unrealized capital gains and losses, the common expenses of the Fund, and certain fund-level expense reductions, if any, are allocated on a pro-rata basis to each class based on the relative net assets of each class to the total net assets of the Fund. Each class differs with respect to transfer agent and distribution and service plan fees incurred. Certain expense reductions may also differ by class. The Fund may be affected by economic and political developments in the state of New York.
2. Significant Accounting Policies.
The financial statements have been prepared in conformity with accounting principles generally accepted in the United States of America (GAAP), which require management to make certain estimates and assumptions at the date of the financial statements. Actual results could differ from those estimates. Subsequent events, if any, through the date that the financial statements were issued have been evaluated in the preparation of the financial statements. The following summarizes the significant accounting policies of the Fund:
Security Valuation. Investments are valued as of 4:00 p.m. Eastern time on the last calendar day of the period. The Fund uses independent pricing services approved by the Board of Trustees to value its investments. When current market prices or quotations are not readily available or reliable, valuations may be determined in good faith in accordance with procedures adopted by the Board of Trustees. Factors used in determining value may include market or security specific events, changes in interest rates and credit quality. The frequency with which these procedures are used cannot be predicted and they may be utilized to a significant extent. The value used for net asset value (NAV) calculation under these procedures may differ from published prices for the same securities.
Annual Report
Notes to Financial Statements - continued
(Amounts in thousands except ratios)
2. Significant Accounting Policies - continued
Security Valuation - continued
The Fund categorizes the inputs to valuation techniques used to value its investments into a disclosure hierarchy consisting of three levels as shown below.
Level 1 - quoted prices in active markets for identical investments
Level 2 - other significant observable inputs (including quoted prices for similar investments, interest rates, prepayment speeds, etc.)
Level 3 - unobservable inputs (including the Fund's own assumptions based on the best information available)
Changes in valuation techniques may result in transfers in or out of an assigned level within the disclosure hierarchy. Valuation techniques used to value the Fund's investments by major category are as follows.
Debt securities, including restricted securities, are valued based on evaluated prices received from independent pricing services or from dealers who make markets in such securities. For municipal securities, pricing services utilize matrix pricing which considers yield or price of bonds of comparable quality, coupon, maturity and type as well as dealer supplied prices and are generally categorized as Level 2 in the hierarchy.
When independent prices are unavailable or unreliable, debt securities may be valued utilizing pricing matrices which consider similar factors that would be used by independent pricing services. These are generally categorized as Level 2 in the hierarchy but may be Level 3 depending on the circumstances.
Investment Transactions and Income. For financial reporting purposes, the Fund's investment holdings and NAV include trades executed through the end of the last business day of the period. The NAV per share for processing shareholder transactions is calculated as of the close of business of the New York Stock Exchange (NYSE), normally 4:00 p.m. Eastern time and includes trades executed through the end of the prior business day. Gains and losses on securities sold are determined on the basis of identified cost. Interest income is accrued as earned. Interest income includes coupon interest and amortization of premium and accretion of discount on debt securities.
Annual Report
2. Significant Accounting Policies - continued
Expenses. Expenses directly attributable to a fund are charged to that fund. Expenses attributable to more than one fund are allocated among the respective funds on the basis of relative net assets or other appropriate methods. Expense estimates are accrued in the period to which they relate and adjustments are made when actual amounts are known.
Income Tax Information and Distributions to Shareholders. Each year the Fund intends to qualify as a regulated investment company, including distributing substantially all of its taxable income and realized gains under Subchapter M of the Internal Revenue Code and filing its U.S. federal tax return. As a result, no provision for income taxes is required. As of January 31, 2011, the Fund did not have any unrecognized tax benefits in the accompanying financial statements. A fund's federal tax return is subject to examination by the Internal Revenue Service (IRS) for a period of three years.
Dividends are declared and recorded daily and paid monthly from net investment income. Distributions from realized gains, if any, are declared and recorded on the ex-dividend date. Income dividends and capital gain distributions are declared separately for each class. Income and capital gain distributions are determined in accordance with income tax regulations, which may differ from GAAP. In addition, the Fund claimed a portion of the payment made to redeeming shareholders as a distribution for income tax purposes.
Capital accounts within the financial statements are adjusted for permanent book-tax differences. These adjustments have no impact on net assets or the results of operations. Temporary book-tax differences will reverse in a subsequent period.
Book-tax differences are primarily due to market discount, deferred trustees compensation, capital loss carryforwards and losses deferred due to futures transactions.
The Fund purchases municipal securities whose interest, in the opinion of the issuer, is free from federal income tax. There is no assurance that the IRS will agree with this opinion. In the event the IRS determines that the issuer does not comply with relevant tax requirements, interest payments from a security could become federally taxable, possibly retroactively to the date the security was issued.
The federal tax cost of investment securities and unrealized appreciation (depreciation) as of period end were as follows:
Gross unrealized appreciation | $ 18,410 |
Gross unrealized depreciation | (40,988) |
Net unrealized appreciation (depreciation) on securities and other investments | $ (22,578) |
|
|
Tax Cost | $ 1,697,529 |
Annual Report
Notes to Financial Statements - continued
(Amounts in thousands except ratios)
2. Significant Accounting Policies - continued
Income Tax Information and Distributions to Shareholders - continued
The tax-based components of distributable earnings as of period end were as follows:
Undistributed tax-exempt income | $ 4 |
Undistributed long-term capital gain | $ 3,965 |
Net unrealized appreciation (depreciation) | $ (22,578) |
The tax character of distributions paid was as follows:
| January 31, 2011 | January 31, 2010 |
Tax-exempt Income | $ 72,377 | $ 65,025 |
Long-term Capital Gains | 296 | - |
Total | $ 72,673 | $ 65,025 |
Short-Term Trading (Redemption) Fees. Shares held by investors in the Fund less than 30 days are subject to a redemption fee equal to .50% of the net asset value of shares redeemed. All redemption fees, which reduce the proceeds of the shareholder redemption, are retained by the Fund and accounted for as an addition to paid in capital.
3. Purchases and Sales of Investments.
Purchases and sales of securities, other than short-term securities, aggregated $193,270 and $258,656, respectively.
4. Fees and Other Transactions with Affiliates.
Management Fee. Fidelity Management & Research Company (FMR) and its affiliates provide the Fund with investment management related services for which the Fund pays a monthly management fee. The management fee is the sum of an individual fund fee rate that is based on an annual rate of .25% of the Fund's average net assets and a group fee rate that averaged .12% during the period. The group fee rate is based upon the average net assets of all the mutual funds advised by FMR. The group fee rate decreases as assets under management increase and increases as assets under management decrease. For the period, the total annual management fee rate was .37% of the Fund's average net assets.
Annual Report
4. Fees and Other Transactions with Affiliates - continued
Distribution and Service Plan Fees. In accordance with Rule 12b-1 of the 1940 Act, the Fund has adopted separate Distribution and Service Plans for each class of shares. Certain classes pay Fidelity Distributors Corporation (FDC), an affiliate of FMR, separate Distribution and Service Fees, each of which is based on an annual percentage of each class' average net assets. In addition, FDC may pay financial intermediaries for selling shares of the Fund and providing shareholder support services. For the period, the Distribution and Service Fee rates, total fees and amounts retained by FDC were as follows:
| Distribution | Service | Total Fees | Retained |
Class A | -% | .25% | $ 91 | $ 5 |
Class T | -% | .25% | 23 | - |
Class B | .65% | .25% | 45 | 33 |
Class C | .75% | .25% | 328 | 103 |
|
|
| $ 487 | $ 141 |
Sales Load. FDC receives a front-end sales charge of up to 4.00% for selling Class A shares and Class T shares, some of which is paid to financial intermediaries for selling shares of the Fund. FDC receives the proceeds of contingent deferred sales charges levied on Class A, Class T, Class B, and Class C redemptions. These charges depend on the holding period. The deferred sales charges range from 5% to 1% for Class B, 1% for Class C, ..75% for certain purchases of Class A shares (.75% to .50% prior to July 12, 2010) and .25% for certain purchases of Class T shares.
For the period, sales charge amounts retained by FDC were as follows:
| Retained |
Class A | $ 13 |
Class T | 4 |
Class B* | 10 |
Class C* | 4 |
| $ 31 |
* When Class B and Class C shares are initially sold, FDC pays commissions from its own resources to financial intermediaries through which the sales are made.
Transfer Agent and Accounting Fees. Citibank, N.A. (Citibank) is the custodian, transfer agent, and servicing agent for the Fund's Class A, Class T, Class B, Class C, New York Municipal Income and Institutional Class shares. Citibank has entered into a sub-arrangement with Fidelity Investments Institutional Operations Company, Inc. (FIIOC), an affiliate of FMR, with respect to all classes of the Fund, to perform the
Annual Report
Notes to Financial Statements - continued
(Amounts in thousands except ratios)
4. Fees and Other Transactions with Affiliates - continued
Transfer Agent and Accounting Fees - continued
transfer agency, dividend disbursing, and shareholder servicing functions. FIIOC receives account fees and asset-based fees that vary according to the account size and type of account of the shareholders of the respective classes of the Fund. All fees are paid to FIIOC by Citibank, which is reimbursed by each class for such payments. FIIOC pays for typesetting, printing and mailing of shareholder reports, except proxy statements. For the period, transfer agent fees for each class were as follows:
| Amount | % of |
Class A | $ 40 | .11 |
Class T | 8 | .08 |
Class B | 5 | .10 |
Class C | 45 | .14 |
New York Municipal Income | 1,290 | .07 |
Institutional Class | 20 | .14 |
| $ 1,408 |
|
Citibank also has a sub-arrangement with Fidelity Service Company, Inc. (FSC), an affiliate of FMR, under which FSC maintains the Fund's accounting records. The fee is based on the level of average net assets for the month.
5. Committed Line of Credit.
The Fund participates with other funds managed by FMR or an affiliate in a $3.75 billion credit facility (the "line of credit") to be utilized for temporary or emergency purposes to fund shareholder redemptions or for other short-term liquidity purposes. The Fund has agreed to pay commitment fees on its pro-rata portion of the line of credit, which amounted to $7 and is reflected in Miscellaneous expenses on the Statement of Operations. During the period, there were no borrowings on this line of credit.
6. Expense Reductions.
Through arrangements with the Fund's custodian, credits realized as a result of uninvested cash balances were used to reduce the Fund's expenses. During the period, these credits reduced the Fund's custody and accounting expenses by $20 and $4, respectively.
Annual Report
7. Distributions to Shareholders.
Distributions to shareholders of each class were as follows:
Years ended January 31, | 2011 | 2010 |
From net investment income |
|
|
Class A | $ 1,295 | $ 1,021 |
Class T | 328 | 306 |
Class B | 145 | 198 |
Class C | 903 | 700 |
New York Municipal Income | 69,168 | 62,528 |
Institutional Class | 538 | 272 |
Total | $ 72,377 | $ 65,025 |
From net realized gain |
|
|
Class A | $ 6 | $ - |
Class T | 1 | - |
Class B | 1 | - |
Class C | 5 | - |
New York Municipal Income | 280 | - |
Institutional Class | 3 | - |
Total | $ 296 | $ - |
8. Share Transactions.
Transactions for each class of shares were as follows:
| Shares | Dollars | ||
Years ended January 31, | 2011 | 2010 | 2011 | 2010 |
Class A |
|
|
|
|
Shares sold | 843 | 1,547 | $ 10,950 | $ 19,503 |
Reinvestment of distributions | 67 | 58 | 864 | 737 |
Shares redeemed | (987) | (518) | (12,753) | (6,546) |
Net increase (decrease) | (77) | 1,087 | $ (939) | $ 13,694 |
Class T |
|
|
|
|
Shares sold | 170 | 181 | $ 2,210 | $ 2,264 |
Reinvestment of distributions | 20 | 19 | 257 | 245 |
Shares redeemed | (199) | (170) | (2,571) | (2,151) |
Net increase (decrease) | (9) | 30 | $ (104) | $ 358 |
Class B |
|
|
|
|
Shares sold | 40 | 143 | $ 515 | $ 1,808 |
Reinvestment of distributions | 7 | 10 | 90 | 123 |
Shares redeemed | (194) | (209) | (2,513) | (2,660) |
Net increase (decrease) | (147) | (56) | $ (1,908) | $ (729) |
Annual Report
Notes to Financial Statements - continued
(Amounts in thousands except ratios)
8. Share Transactions - continued
| Shares | Dollars | ||
Years ended January 31, | 2011 | 2010 | 2011 | 2010 |
Class C |
|
|
|
|
Shares sold | 721 | 965 | $ 9,405 | $ 12,161 |
Reinvestment of distributions | 39 | 29 | 501 | 363 |
Shares redeemed | (487) | (297) | (6,281) | (3,759) |
Net increase (decrease) | 273 | 697 | $ 3,625 | $ 8,765 |
New York Municipal Income |
|
|
|
|
Shares sold | 27,629 | 36,790 | $ 358,403 | $ 463,771 |
Reinvestment of distributions | 4,003 | 3,726 | 52,003 | 47,044 |
Shares redeemed | (38,771) | (21,286) | (496,938) | (269,003) |
Net increase (decrease) | (7,139) | 19,230 | $ (86,532) | $ 241,812 |
Institutional Class |
|
|
|
|
Shares sold | 713 | 452 | $ 9,276 | $ 5,689 |
Reinvestment of distributions | 20 | 9 | 258 | 110 |
Shares redeemed | (392) | (109) | (4,969) | (1,356) |
Net increase (decrease) | 341 | 352 | $ 4,565 | $ 4,443 |
9. Other.
The Fund's organizational documents provide former and current trustees and officers with a limited indemnification against liabilities arising in connection with the performance of their duties to the Fund. In the normal course of business, the Fund may also enter into contracts that provide general indemnifications. The Fund's maximum exposure under these arrangements is unknown as this would be dependent on future claims that may be made against the Fund. The risk of material loss from such claims is considered remote.
Annual Report
Report of Independent Registered Public Accounting Firm
To the Trustees of Fidelity New York Municipal Trust and Shareholders of Fidelity New York Municipal Income Fund:
We have audited the accompanying statement of assets and liabilities of Fidelity New York Municipal Income Fund (the Fund), a fund of Fidelity New York Municipal Trust, including the schedule of investments, as of January 31, 2011, and the related statement of operations for the year then ended, the statement of changes in net assets for each of the two years in the period then ended, and the financial highlights for each of the five years in the period then ended. These financial statements and financial highlights are the responsibility of the Fund's management. Our responsibility is to express an opinion on these financial statements and financial highlights based on our audits.
We conducted our audits in accordance with the standards of the Public Company Accounting Oversight Board (United States). Those standards require that we plan and perform the audit to obtain reasonable assurance about whether the financial statements and financial highlights are free of material misstatement. The Fund is not required to have, nor were we engaged to perform, an audit of its internal control over financial reporting. Our audits included consideration of internal control over financial reporting as a basis for designing audit procedures that are appropriate in the circumstances, but not for the purpose of expressing an opinion on the effectiveness of the Fund's internal control over financial reporting. Accordingly, we express no such opinion. An audit also includes examining, on a test basis, evidence supporting the amounts and disclosures in the financial statements, assessing the accounting principles used and significant estimates made by management, as well as evaluating the overall financial statement presentation. Our procedures included confirmation of securities owned as of January 31, 2011, by correspondence with the custodian. We believe that our audits provide a reasonable basis for our opinion.
In our opinion, the financial statements and financial highlights referred to above present fairly, in all material respects, the financial position of Fidelity New York Municipal Income Fund as of January 31, 2011, the results of its operations for the year then ended, the changes in its net assets for each of the two years in the period then ended, and its financial highlights for each of the five years in the period then ended, in conformity with accounting principles generally accepted in the United States of America.
/s/ Deloitte & Touche LLP
DELOITTE & TOUCHE LLP
Boston, Massachusetts
March 16, 2011
Annual Report
Trustees and Officers
The Trustees and executive officers of the trust and fund, as applicable, are listed below. The Board of Trustees governs the fund and is responsible for protecting the interests of shareholders. The Trustees are experienced executives who meet periodically throughout the year to oversee the fund's activities, review contractual arrangements with companies that provide services to the fund, oversee management of the risks associated with such activities and contractual arrangements, and review the fund's performance. Except for James C. Curvey, each of the Trustees oversees 190 funds advised by FMR or an affiliate. Mr. Curvey oversees 409 funds advised by FMR or an affiliate.
The Trustees hold office without limit in time except that (a) any Trustee may resign; (b) any Trustee may be removed by written instrument, signed by at least two-thirds of the number of Trustees prior to such removal; (c) any Trustee who requests to be retired or who has become incapacitated by illness or injury may be retired by written instrument signed by a majority of the other Trustees; and (d) any Trustee may be removed at any special meeting of shareholders by a two-thirds vote of the outstanding voting securities of the trust. Each Trustee who is not an interested person (as defined in the 1940 Act) (Independent Trustee), shall retire not later than the last day of the calendar year in which his or her 75th birthday occurs. The Independent Trustees may waive this mandatory retirement age policy with respect to individual Trustees. The executive officers hold office without limit in time, except that any officer may resign or may be removed by a vote of a majority of the Trustees at any regular meeting or any special meeting of the Trustees. Except as indicated, each individual has held the office shown or other offices in the same company for the past five years.
Experience, Skills, Attributes, and Qualifications of the Fund's Trustees. The Governance and Nominating Committee has adopted a statement of policy that describes the experience, qualifications, attributes, and skills that are necessary and desirable for potential Independent Trustee candidates (Statement of Policy). The Board believes that each Trustee satisfied at the time he or she was initially elected or appointed a Trustee, and continues to satisfy, the standards contemplated by the Statement of Policy. The Governance and Nominating Committee also engages professional search firms to help identify potential Independent Trustee candidates who have the experience, qualifications, attributes, and skills consistent with the Statement of Policy. From time to time, additional criteria based on the composition and skills of the current Independent Trustees, as well as experience or skills that may be appropriate in light of future changes to board composition, business conditions, and regulatory or other developments, have also been considered by the professional search firms and the Governance and Nominating Committee. In addition, the Board takes into account the Trustees' commitment and participation in Board and committee meetings, as well as their leadership of standing and ad hoc committees throughout their tenure.
In determining that a particular Trustee was and continues to be qualified to serve as a Trustee, the Board has considered a variety of criteria, none of which, in isolation, was controlling. The Board believes that, collectively, the Trustees have balanced and diverse experience, qualifications, attributes, and skills, which allow the Board to operate effectively in governing the fund and protecting the interests of shareholders. Information about the specific experience, skills, attributes, and qualifications of each Trustee, which in each case led to the Board's conclusion that the Trustee should serve (or continue to serve) as a trustee of the fund, is provided below.
Annual Report
Board Structure and Oversight Function. Abigail P. Johnson is an interested person (as defined in the 1940 Act) and currently serves as Chairman. The Trustees have determined that an interested Chairman is appropriate and benefits shareholders because an interested Chairman has a personal and professional stake in the quality and continuity of services provided to the fund. Independent Trustees exercise their informed business judgment to appoint an individual of their choosing to serve as Chairman, regardless of whether the Trustee happens to be independent or a member of management. The Independent Trustees have determined that they can act independently and effectively without having an Independent Trustee serve as Chairman and that a key structural component for assuring that they are in a position to do so is for the Independent Trustees to constitute a substantial majority for the Board. The Independent Trustees also regularly meet in executive session. Kenneth L. Wolfe serves as Chairman of the Independent Trustees and as such (i) acts as a liaison between the Independent Trustees and management with respect to matters important to the Independent Trustees and (ii) with management prepares agendas for Board meetings.
Fidelity funds are overseen by different Boards of Trustees. The fund's Board oversees Fidelity's investment-grade bond, money market, and asset allocation funds and another Board oversees Fidelity's equity and high income funds. The asset allocation funds may invest in Fidelity funds that are overseen by such other Board. The use of separate Boards, each with its own committee structure, allows the Trustees of each group of Fidelity funds to focus on the unique issues of the funds they oversee, including common research, investment, and operational issues. On occasion, the separate Boards establish joint committees to address issues of overlapping consequences for the Fidelity funds overseen by each Board.
The Trustees operate using a system of committees to facilitate the timely and efficient consideration of all matters of importance to the Trustees, the fund, and fund shareholders and to facilitate compliance with legal and regulatory requirements and oversight of the fund's activities and associated risks. The Board, acting through its committees, has charged FMR and its affiliates with (i) identifying events or circumstances the occurrence of which could have demonstrably adverse effects on the fund's business and/or reputation; (ii) implementing processes and controls to lessen the possibility that such events or circumstances occur or to mitigate the effects of such events or circumstances if they do occur; and (iii) creating and maintaining a system designed to evaluate continuously business and market conditions in order to facilitate the identification and implementation processes described in (i) and (ii) above. Because the day-to-day operations and activities of the fund are carried out by or through FMR, its affiliates and other service providers, the fund's exposure to risks is mitigated but not eliminated by the processes overseen by the Trustees. While each of the Board's committees has responsibility for overseeing different aspects of the fund's activities, oversight is exercised primarily through the Operations and Audit Committees. Appropriate personnel, including but not limited to the fund's Chief Compliance Officer (CCO), FMR's internal auditor, the independent accountants, the fund's Treasurer and portfolio management personnel, make periodic reports to the Board's committees, as appropriate. The responsibilities of each committee, including their oversight responsibilities, are described further under "Standing Committees of the Fund's Trustees."
Annual Report
Trustees and Officers - continued
The fund's Statement of Additional Information (SAI) includes more information about the Trustees. To request a free copy, call Fidelity at 1-877-208-0098.
Interested Trustees*:
Correspondence intended for each Trustee who is an interested person may be sent to Fidelity Investments, 82 Devonshire Street, Boston, Massachusetts 02109.
Name, Age; Principal Occupations and Other Relevant Experience+ | |
Abigail P. Johnson (49) | |
| Year of Election or Appointment: 2009 Ms. Johnson is Trustee and Chairman of the Board of Trustees of certain Trusts. Ms. Johnson serves as President of Personal, Workplace and Institutional Services (2005-present). Ms. Johnson is the Vice Chairman and Director (2007-present) of FMR LLC. Previously, Ms. Johnson served as President and a Director of FMR (2001-2005), a Trustee of other investment companies advised by FMR, Fidelity Investments Money Management, Inc., and FMR Co., Inc. (2001-2005), Senior Vice President of the Fidelity funds (2001-2005), and managed a number of Fidelity funds. Ms. Abigail P. Johnson and Mr. Arthur E. Johnson are not related. |
James C. Curvey (75) | |
| Year of Election or Appointment: 2007 Mr. Curvey also serves as Trustee (2007-present) of other investment companies advised by FMR. Mr. Curvey is a Director of Fidelity Investments Money Management, Inc. (2009-present), Director of Fidelity Research & Analysis Co. (2009-present) and Director of FMR and FMR Co., Inc. (2007-present). Mr. Curvey is also Vice Chairman (2007-present) and Director of FMR LLC. In addition, Mr. Curvey serves as an Overseer for the Boston Symphony Orchestra and a member of the Trustees of Villanova University. Previously, Mr. Curvey was the Vice Chairman (2006-2007) and Director (2000-2007) of FMR Corp. |
* Trustees have been determined to be "Interested Trustees" by virtue of, among other things, their affiliation with the trust or various entities under common control with FMR.
+ The information above includes each Trustee's principal occupation during the last five years and other information relating to the experience, attributes, and skills relevant to each Trustee's qualifications to serve as a Trustee, which led to the conclusion that each Trustee should serve as a Trustee for the fund.
Annual Report
Independent Trustees:
Correspondence intended for each Independent Trustee (that is, the Trustees other than the Interested Trustees) may be sent to Fidelity Investments, P.O. Box 55235, Boston, Massachusetts 02205-5235.
Name, Age; Principal Occupations and Other Relevant Experience+ | |
Albert R. Gamper, Jr. (68) | |
| Year of Election or Appointment: 2006 Prior to his retirement in December 2004, Mr. Gamper served as Chairman of the Board of CIT Group Inc. (commercial finance). During his tenure with CIT Group Inc. Mr. Gamper served in numerous senior management positions, including Chairman (1987-1989; 1999-2001; 2002-2004), Chief Executive Officer (1987-2004), and President (2002-2003). He also served as President and Chief Executive Officer of Tyco Capital Corporation (2001-2002). Mr. Gamper currently serves as a member of the Board of Directors of Public Service Enterprise Group (utilities, 2000-present), a member of the Board of Trustees, Rutgers University (2004-present), and Chairman of the Board of Saint Barnabas Health Care System. Previously, Mr. Gamper served as Chairman of the Board of Governors, Rutgers University (2004-2007). |
Robert F. Gartland (59) | |
| Year of Election or Appointment: 2010 Mr. Gartland is a partner and investor of Vietnam Partners LLC (investments and consulting, 2008-present) and is Chairman and an investor in Gartland and Mellina Group Corp. (consulting, 2009-present). Prior to his retirement, Mr. Gartland held a variety of positions at Morgan Stanley (financial services, 1979-2007) including Managing Director (1987-2007). |
Arthur E. Johnson (64) | |
| Year of Election or Appointment: 2008 Mr. Johnson serves as a member of the Board of Directors of Eaton Corporation (diversified power management, 2009-present) and AGL Resources, Inc. (holding company). Prior to his retirement, Mr. Johnson served as Senior Vice President of Corporate Strategic Development of Lockheed Martin Corporation (defense contractor, 1999-2009). He previously served on the Board of Directors of IKON Office Solutions, Inc. (1999-2008) and Delta Airlines (2005-2007). Mr. Arthur E. Johnson and Ms. Abigail P. Johnson are not related. |
Michael E. Kenneally (56) | |
| Year of Election or Appointment: 2009 Previously, Mr. Kenneally served as a Member of the Advisory Board for certain Fidelity Fixed Income and Asset Allocation Funds (2008-2009). Prior to his retirement, Mr. Kenneally served as Chairman and Global Chief Executive Officer of Credit Suisse Asset Management (2003-2005). Mr. Kenneally was a Director of the Credit Suisse Funds (U.S. mutual funds, 2004-2008) and certain other closed-end funds (2004-2005) and was awarded the Chartered Financial Analyst (CFA) designation in 1991. |
James H. Keyes (70) | |
| Year of Election or Appointment: 2007 Mr. Keyes serves as a member of the Boards of Navistar International Corporation (manufacture and sale of trucks, buses, and diesel engines, since 2002) and Pitney Bowes, Inc. (integrated mail, messaging, and document management solutions, since 1998). Prior to his retirement, Mr. Keyes served as Chairman and Chief Executive Officer of Johnson Controls (automotive, building, and energy, 1998-2002) and as a member of the Board of LSI Logic Corporation (semiconductor technologies, 1984-2008). |
Marie L. Knowles (64) | |
| Year of Election or Appointment: 2001 Prior to Ms. Knowles' retirement in June 2000, she served as Executive Vice President and Chief Financial Officer of Atlantic Richfield Company (ARCO) (diversified energy, 1996-2000). From 1993 to 1996, she was a Senior Vice President of ARCO and President of ARCO Transportation Company. She served as a Director of ARCO from 1996 to 1998. Ms. Knowles currently serves as a Director and Chairman of the Audit Committee of McKesson Corporation (healthcare service, since 2002). Ms. Knowles is an Honorary Trustee of the Brookings Institution and a member of the Board of the Catalina Island Conservancy and of the Santa Catalina Island Company (2009-present). She also serves as a member of the Advisory Board for the School of Engineering of the University of Southern California and the Foundation Board of the School of Architecture at the University of Virginia (2007-present). Previously, Ms. Knowles served as a Director of Phelps Dodge Corporation (copper mining and manufacturing, 1994-2007). |
Kenneth L. Wolfe (71) | |
| Year of Election or Appointment: 2005 Mr. Wolfe is Chairman of the Independent Trustees of the Fixed Income and Asset Allocation Funds (2008-present). Prior to his retirement, Mr. Wolfe served as Chairman and a Director (2007-2009) and Chairman and Chief Executive Officer (1994-2001) of Hershey Foods Corporation. He also served as a member of the Boards of Adelphia Communications Corporation (telecommunications, 2003-2006), Bausch & Lomb, Inc. (medical/pharmaceutical, 1993-2007), and Revlon, Inc. (personal care products, 2004-2009). |
+ The information above includes each Trustee's principal occupation during the last five years and other information relating to the experience, attributes, and skills relevant to each Trustee's qualifications to serve as a Trustee, which led to the conclusion that each Trustee should serve as a Trustee for the fund.
Executive Officers:
Correspondence intended for each executive officer may be sent to Fidelity Investments, 82 Devonshire Street, Boston, Massachusetts 02109.
Name, Age; Principal Occupation | |
John R. Hebble (52) | |
| Year of Election or Appointment: 2008 President and Treasurer of Fidelity's Fixed Income and Asset Allocation Funds. Mr. Hebble also serves as Treasurer and Chief Financial Officer of The North Carolina Capital Management Trust: Cash and Term Portfolio (2008-present), Assistant Treasurer of other Fidelity funds (2009-present) and is an employee of Fidelity Investments. |
Boyce I. Greer (54) | |
| Year of Election or Appointment: 2005 Vice President of Fidelity's Fixed Income Funds and Asset Allocation Funds (2005). Mr. Greer is also a Trustee of other investment companies advised by FMR. Mr. Greer is President of The North Carolina Capital Management Trust: Cash and Term Portfolio (2003-present), the Asset Allocation Division (2008-present), President and a Director of Strategic Advisers, Inc. (2008-present), President of FIMM 130/30 LLC (2008-present), Director of Ballyrock Investment Advisors LLC (2006-present), and an Executive Vice President of FMR (2005-present). Previously, Mr. Greer served as Executive Vice President of FMR Co., Inc. (2005-2009), President and Director of Fidelity Investments Money Management, Inc. (2007-2009) and as a Director and Managing Director of Strategic Advisers, Inc. (2002-2005). |
Christopher P. Sullivan (56) | |
| Year of Election or Appointment: 2009 Vice President of Fidelity's Bond Funds. Mr. Sullivan also serves as President of Fidelity's Bond Division (2009-present). Mr. Sullivan is Executive Vice President of Fidelity Investments Money Management, Inc. (2009-present), and a Director of Fidelity Management & Research (U.K.) Inc. (2010-present). Previously, Mr. Sullivan served as Managing Director, Co-Head of U.S. Fixed Income at Goldman Sachs Asset Management (2001-2009). |
Christine J. Thompson (52) | |
| Year of Election or Appointment: 2010 Vice President of Fidelity's Bond Funds. Ms. Thompson also serves as Chief Investment Officer of FMR's Bond Group (2010-present) and is an employee of Fidelity Investments. Previously, Ms. Thompson served as Director of Municipal Bond Portfolio Managers (2002-2010). |
Scott C. Goebel (43) | |
| Year of Election or Appointment: 2008 Secretary and Chief Legal Officer (CLO) of the Fidelity funds. Mr. Goebel also serves as Secretary and CLO of The North Carolina Capital Management Trust: Cash and Term Portfolio (2008-present); General Counsel, Secretary, and Senior Vice President of FMR (2008-present) and FMR Co., Inc. (2008-present); Deputy General Counsel of FMR LLC; Chief Legal Officer of Fidelity Management & Research (Hong Kong) Limited (2008-present) and Assistant Secretary of Fidelity Management & Research (Japan) Inc. (2008-present), Fidelity Investments Money Management, Inc. (2008-present), Fidelity Management & Research (U.K.) Inc. (2008-present), and Fidelity Research and Analysis Company (2008-present). Previously, Mr. Goebel served as Assistant Secretary of the Funds (2007-2008) and as Vice President and Secretary of Fidelity Distributors Corporation (FDC) (2005-2007). |
David J. Carter (37) | |
| Year of Election or Appointment: 2010 Assistant Secretary of Fidelity's Fixed Income and Asset Allocation Funds. Mr. Carter also serves as Vice President, Associate General Counsel (2010-present) and is an employee of Fidelity Investments (2005-present). |
Holly C. Laurent (56) | |
| Year of Election or Appointment: 2008 Anti-Money Laundering (AML) Officer of the Fidelity funds. Ms. Laurent also serves as AML Officer of The North Carolina Capital Management Trust: Cash and Term Portfolio (2008-present) and is an employee of Fidelity Investments. Previously, Ms. Laurent was Senior Vice President and Head of Legal for Fidelity Business Services India Pvt. Ltd. (2006-2008), and Senior Vice President, Deputy General Counsel and Group Head for FMR LLC (2005-2006). |
Christine Reynolds (52) | |
| Year of Election or Appointment: 2008 Chief Financial Officer of the Fidelity funds. Ms. Reynolds became President of Fidelity Pricing and Cash Management Services (FPCMS) in August 2008. Ms. Reynolds served as Chief Operating Officer of FPCMS (2007-2008). Previously, Ms. Reynolds served as President, Treasurer, and Anti-Money Laundering officer of the Fidelity funds (2004-2007). |
Michael H. Whitaker (43) | |
| Year of Election or Appointment: 2008 Chief Compliance Officer of Fidelity's Fixed Income and Asset Allocation Funds. Mr. Whitaker also serves as Chief Compliance Officer of The North Carolina Capital Management Trust: Cash and Term Portfolio (2008-present). Mr. Whitaker is an employee of Fidelity Investments (2007-present). Prior to joining Fidelity Investments, Mr. Whitaker worked at MFS Investment Management where he served as Senior Vice President and Chief Compliance Officer (2004-2006), and Assistant General Counsel. |
Jeffrey S. Christian (49) | |
| Year of Election or Appointment: 2009 Deputy Treasurer of the Fidelity funds. Mr. Christian is an employee of Fidelity Investments. Previously, Mr. Christian served as Chief Financial Officer (2008-2009) of certain Fidelity funds and Senior Vice President of Fidelity Pricing and Cash Management Services (FPCMS) (2004-2009). |
Bryan A. Mehrmann (49) | |
| Year of Election or Appointment: 2005 Deputy Treasurer of the Fidelity funds. Mr. Mehrmann is an employee of Fidelity Investments. |
Stephanie J. Dorsey (41) | |
| Year of Election or Appointment: 2008 Deputy Treasurer of Fidelity's Fixed Income and Asset Allocation Funds. Ms. Dorsey also serves as Assistant Treasurer of other Fidelity funds (2010-present) and is an employee of Fidelity Investments (2008-present). Previously, Ms. Dorsey served as Treasurer (2004-2008) of the JPMorgan Mutual Funds and Vice President (2004-2008) of JPMorgan Chase Bank. |
Adrien E. Deberghes (43) | |
| Year of Election or Appointment: 2010 Assistant Treasurer of Fidelity's Fixed Income and Asset Allocation Funds. Mr. Deberghes also serves as Deputy Treasurer of other Fidelity funds (2008-present) and is an employee of Fidelity Investments (2008-present). Previously, Mr. Deberghes served as Senior Vice President of Mutual Fund Administration at State Street Corporation (2007-2008), Senior Director of Mutual Fund Administration at Investors Bank & Trust (2005-2007), and Director of Finance for Dunkin' Brands (2000-2005). |
Kenneth B. Robins (41) | |
| Year of Election or Appointment: 2009 Assistant Treasurer of the Fidelity Fixed Income and Asset Allocation Funds. Mr. Robins also serves as President and Treasurer of other Fidelity funds (2008-present; 2010-present) and is an employee of Fidelity Investments (2004-present). Previously, Mr. Robins served as Deputy Treasurer of the Fidelity funds (2005-2008) and Treasurer and Chief Financial Officer of The North Carolina Capital Management Trust: Cash and Term Portfolios (2006-2008). |
Gary W. Ryan (52) | |
| Year of Election or Appointment: 2005 Assistant Treasurer of the Fidelity funds. Mr. Ryan is an employee of Fidelity Investments. Previously, Mr. Ryan served as Vice President of Fund Reporting in Fidelity Pricing and Cash Management Services (FPCMS) (1999-2005). |
Jonathan Davis (42) | |
| Year of Election or Appointment: 2010 Assistant Treasurer of the Fidelity funds. Mr. Davis is an employee of Fidelity Investments. Previously, Mr. Davis served as Vice President and Associate General Counsel of FMR LLC (2003-2010). |
Annual Report
Distributions (Unaudited)
The Board of Trustees of Fidelity New York Municipal Income Fund voted to pay to shareholders of record at the opening of business on record date, the following distribution per share derived from capital gains realized from sales of portfolio securities:
| Pay Date | Record Date | Capital Gains |
Institutional Class | 03/07/2011 | 03/04/2011 | $0.03 |
During fiscal year ended 2011, 100% of the fund's income dividends was free from federal income tax, and 14.53% of the fund's income dividends was subject to the federal alternative minimum tax.
The fund hereby designates as a capital gain dividend with the respect to the taxable year end January 31, 2011, $4,801,494 or if subsequently determined to be different, the net capital gain of such year.
The fund will notify shareholders in January 2012 of amounts for use in preparing 2011 income tax returns.
Annual Report
Board Approval of Investment Advisory Contracts and Management Fees
Fidelity New York Municipal Income Fund
Each year, the Board of Trustees, including the Independent Trustees (together, the Board), votes on the renewal of the management contract and sub-advisory agreements (together, the Advisory Contracts) for the fund. The Board, assisted by the advice of fund counsel and Independent Trustees' counsel, requests and considers a broad range of information relevant to the renewal of the Advisory Contracts throughout the year.
The Board meets regularly and considers at each of its meetings factors that are relevant to its annual consideration of the renewal of the fund's Advisory Contracts, including the services and support provided to the fund and its shareholders. The Board has established three standing committees, each composed of Independent Trustees with varying backgrounds, to which the Board has assigned specific subject matter responsibilities in order to enhance effective decision-making by the Board. The Operations Committee, of which all of the Independent Trustees are members, meets regularly throughout the year and, among other matters, considers matters specifically related to the annual consideration of the renewal of the fund's Advisory Contracts. The Board, acting directly and through its Committees, requests and receives information concerning the annual consideration of the renewal of the fund's Advisory Contracts. The Board also meets as needed to consider matters specifically related to the Board's annual consideration of the renewal of Advisory Contracts. Members of the Board may also meet with trustees of other Fidelity funds through ad hoc joint committees to discuss certain matters relevant to the Fidelity funds.
At its September 2010 meeting, the Board of Trustees, including the Independent Trustees, unanimously determined to renew the fund's Advisory Contracts. In reaching its determination, the Board considered all factors it believed relevant, including (i) the nature, extent, and quality of the services to be provided to the fund and its shareholders (including the investment performance of the fund); (ii) the competitiveness of the fund's management fee and total expenses; (iii) the total costs of the services to be provided by and the profits to be realized by Fidelity from its relationship with the fund; (iv) the extent to which economies of scale would be realized as the fund grows; and (v) whether fee levels reflect these economies of scale, if any, for the benefit of fund shareholders.
In considering whether to renew the Advisory Contracts for the fund, the Board reached a determination, with the assistance of fund counsel and Independent Trustees' counsel and through the exercise of its business judgment, that the renewal of the Advisory Contracts is in the best interests of the fund and its shareholders and that the compensation to be received by Fidelity under the management contract is fair and reasonable. The Board's decision to renew the Advisory Contracts was not based on any single factor, but rather was based on a comprehensive consideration of all the information provided to the Board at its meetings throughout the year. The Board, in reaching its determination to renew the Advisory Contracts, is aware that shareholders in the fund have a broad range of investment choices available to them, including a wide choice among mutual funds offered by Fidelity's competitors, and that the fund's shareholders, with the opportunity to review and weigh the disclosure provided by the fund in its prospectus and other public disclosures, have chosen to invest in this fund, managed by Fidelity.
Annual Report
Board Approval of Investment Advisory Contracts and
Management Fees - continued
Nature, Extent, and Quality of Services Provided. The Board considered the staffing within the investment adviser, FMR, and the sub-advisers (together, the Investment Advisers), including the backgrounds of the fund's investment personnel and the fund's investment objective and discipline. The Independent Trustees also had discussions with senior management of Fidelity's investment operations and investment groups. The Board considered the structure of the portfolio manager compensation program and whether this structure provides appropriate incentives to act in the best interest of the fund.
Resources Dedicated to Investment Management and Support Services. The Board reviewed the size, education, and experience of the Investment Advisers' investment staff, their use of technology, and the Investment Advisers' approach to recruiting, training, and retaining portfolio managers and other research, advisory, and management personnel. The Board noted that Fidelity's analysts have access to a variety of technological tools and market and securities data that enable them to perform both fundamental and quantitative analysis and to specialize in various disciplines. The Board considered Fidelity's extensive global research capabilities that enable the Investment Advisers to aggregate data from various sources in an effort to produce positive investment results. The Board also considered that Fidelity's portfolio managers and analysts have access to daily portfolio attribution that allows for monitoring of a fund's portfolio, as well as an electronic communication system that provides immediate real-time access to research concerning issuers and credit enhancers. In addition, the Board considered the trading resources that are an integral part of the fixed-income portfolio management investment process.
Shareholder and Administrative Services. The Board considered (i) the nature, extent, quality, and cost of advisory, administrative, and shareholder services performed by the Investment Advisers and their affiliates under the Advisory Contracts and under separate agreements covering transfer agency and pricing and bookkeeping services for the fund; (ii) the nature and extent of the investment adviser's supervision of third party service providers, principally custodians and subcustodians; and (iii) the resources devoted to, and the record of compliance with, the fund's compliance policies and procedures.
The Board noted that the growth of fund assets over time across the complex allows Fidelity to reinvest in the development of services designed to enhance the value or convenience of the Fidelity funds as investment vehicles. These services include 24-hour access to account information and market information through telephone representatives and over the Internet, and investor education materials and asset allocation tools.
Annual Report
Investment in a Large Fund Family. The Board considered the benefits to shareholders of investing in a Fidelity fund, including the benefits of investing in a fund that is part of a large family of funds offering a variety of investment disciplines and providing a large variety of mutual fund investor services. The Board noted that Fidelity had taken, or had made recommendations that resulted in the Fidelity funds taking, a number of actions over the previous year that benefited particular funds, including (i) dedicating additional resources to investment research and restructuring and broadening the focus of the investment research teams; (ii) bolstering the senior management team that oversees asset management; (iii) launching Class F of certain funds as a lower-fee class available to Freedom K and Freedom Index Funds; (iv) lowering the initial investment minimums and ongoing balance requirements for Real Estate High Income Fund; (v) eliminating subsequent purchase minimums for all funds and adding a waiver of the investment minimum requirement for new accounts opened with the proceeds of a systematic withdrawal plan; (vi) eliminating the withdrawal minimum and maximum limits for systematic withdrawals from Advisor funds; (vii) expanding sales load waivers on Class A shares for Destiny Planholders and expanding Institutional Class eligibility for Class O Destiny Planholders; and (viii) changing certain Class A and Class T sales charge structures to further align them with industry practices.
Investment Performance. The Board considered whether the fund has operated in accordance with its investment objective, as well as its record of compliance with its investment restrictions. It also reviewed the fund's absolute investment performance for each class, as well as the fund's relative investment performance for each class measured over multiple periods against (i) a broad-based securities market index, and (ii) a peer group of mutual funds deemed appropriate by Fidelity and reviewed by the Board. The following charts considered by the Board show, over the one-, three-, and five-year periods ended December 31, 2009, the cumulative total returns of the retail class and Class C of the fund, the cumulative total returns of a broad-based securities market index ("benchmark"), and a range of cumulative total returns of a peer group of mutual funds identified by Lipper Inc. as having an investment objective similar to that of the fund. The returns of the retail class and Class C show the performance of the highest and lowest performing classes, respectively (based on five-year performance). The box within each chart shows the 25th percentile return (bottom of box) and the 75th percentile return (top of box) of the peer group. Returns shown above the box are in the first quartile and returns shown below the box are in the fourth quartile. The percentage beaten numbers noted below each chart correspond to the percentile box and represent the percentage of funds in the peer group whose performance was equal to or lower than that of the class indicated.
Annual Report
Board Approval of Investment Advisory Contracts and
Management Fees - continued
Fidelity New York Municipal Income Fund
The Board reviewed the fund's relative investment performance against its peer group and noted that the performance of the retail class of the fund was in the fourth quartile for the one-year period and the first quartile for the three- and five-year periods. The Board also noted that the investment performance of the fund was lower than its benchmark for all the periods shown. The Board considered that the variations in performance among the fund's classes reflect the variations in class expenses, which result in lower performance for higher expense classes. The Board discussed with FMR actions that have been taken by FMR to improve the fund's below-benchmark performance. The Board also reviewed the fund's performance since inception as well as performance in the current year.
Based on its review, and giving particular weight to the nature and quality of the resources dedicated by the Investment Advisers to maintain and improve relative performance and factoring in the unprecedented market events in recent years, the Board concluded that the nature, extent, and quality of investment management and support services and of shareholder and administrative services provided to the fund will benefit the fund's shareholders, particularly in light of the Board's view that the fund's shareholders benefit from investing in a fund that is part of a large family of funds offering a variety of investment disciplines and services.
Competitiveness of Management Fee and Total Fund Expenses. The Board considered the fund's management fee and total expenses compared to "mapped groups" of competitive funds and classes. Fidelity creates "mapped groups" by combining similar
Annual Report
Lipper investment objective categories that have comparable management fee characteristics. Combining Lipper investment objective categories aids the Board's management fee and total expense comparisons by broadening the competitive group used for comparison and by reducing the number of universes to which various Fidelity funds are compared.
Management Fee. The Board considered two proprietary management fee comparisons for the 12-month periods shown in the chart below. The group of Lipper funds used by the Board for management fee comparisons is referred to below as the "Total Mapped Group" and, for the reasons explained above, is broader than the Lipper peer group used by the Board for performance comparisons. The Total Mapped Group comparison focuses on a fund's standing relative to the total universe of comparable funds available to investors, in terms of gross management fees before expense reimbursements or caps. "TMG%" represents the percentage of funds in the Total Mapped Group that had management fees that were lower than the fund's. For example, a TMG% of 7% means that 93% of the funds in the Total Mapped Group had higher management fees than the fund. The "Asset-Size Peer Group" (ASPG) comparison focuses on a fund's standing relative to non-Fidelity funds similar in size to the fund within the Total Mapped Group. The ASPG represents at least 15% of the funds in the Total Mapped Group with comparable asset size and management fee characteristics, subject to a minimum of 50 funds (or all funds in the Total Mapped Group if fewer than 50). Additional information, such as the ASPG quartile in which the fund's management fee ranked, is also included in the chart and considered by the Board.
Fidelity New York Municipal Income Fund
Annual Report
Board Approval of Investment Advisory Contracts and
Management Fees - continued
The Board noted that the fund's management fee ranked below the median of its Total Mapped Group and below the median of its ASPG for 2009.
Based on its review, the Board concluded that the fund's management fee is fair and reasonable in light of the services that the fund receives and the other factors considered.
Total Expenses. In its review of each class's total expenses, the Board considered the fund's management fee as well as other fund or class expenses, as applicable, such as transfer agent fees, pricing and bookkeeping fees, fund-paid 12b-1 fees, and custodial, legal, and audit fees. The Board also noted the effects of any waivers and reimbursements on fees and expenses. As part of its review, the Board also considered current and historical total expenses of each class of the fund compared to competitive fund median expenses. Each class of the fund is compared to those funds and classes in the Total Mapped Group (used by the Board for management fee comparisons) that have a similar sales load structure.
The Board noted that the total expenses of each of Class A, Class T, Class B, Institutional Class, and the retail class ranked below its competitive median for 2009 and the total expenses of Class C ranked above its competitive median for 2009. The Board noted that the funds and classes in the Total Mapped Group that have a similar sales load structure have a range of 12b-1 fees, and, when compared to a subset of funds with the same 12b-1 fee, Class C ranked below the median for 2009. The Board noted that the fund offers multiple classes, each of which has a different sales load and 12b-1 fee structure, and that the multiple structures are intended to offer a range of pricing options for the intermediary market. The Board also noted that the total expenses of the classes vary primarily by the level of their 12b-1 fees, although differences in transfer agent fees may also cause expenses to vary from class to class.
Fees Charged to Other Fidelity Clients. The Board also considered Fidelity fee structures and other information with respect to clients of FMR and its affiliates, such as other mutual funds advised or subadvised by FMR or its affiliates, pension plan clients, and other institutional clients. In March 2010, the Board created an ad hoc joint committee with the board of other Fidelity funds (the Committee) to review and compare Fidelity's institutional investment advisory business with its business of providing services to the Fidelity funds, including the differences in services provided, fees charged, and costs incurred, as well as competition in their respective marketplaces.
Based on its review of total expenses and fees charged to other Fidelity clients, the Board concluded that the total expenses of each class of the fund were reasonable, although in one case above the median of the universe presented for comparison, in light of the services that the fund and its shareholders receive and the other factors considered, including the findings of the Committee.
Annual Report
Costs of the Services and Profitability. The Board considered the revenues earned and the expenses incurred by Fidelity in conducting the business of developing, marketing, distributing, managing, administering and servicing the fund and its shareholders. The Board also considered the level of Fidelity's profits in respect of all the Fidelity funds.
On an annual basis, FMR presents to the Board Fidelity's profitability for the fund. Fidelity calculates the profitability for each fund, as well as aggregate profitability for groups of Fidelity funds and all Fidelity funds, using a series of detailed revenue and cost allocation methodologies which originate with the audited books and records of Fidelity. The Audit Committee of the Board reviews any significant changes from the prior year's methodologies.
PricewaterhouseCoopers LLP (PwC), independent registered public accounting firm and auditor to Fidelity and certain Fidelity funds, has been engaged annually by the Board as part of the Board's assessment of Fidelity's profitability analysis. PwC's engagement includes the review and assessment of Fidelity's methodologies used in determining the revenues and expenses attributable to Fidelity's mutual fund business, and completion of agreed-upon procedures surrounding the mathematical accuracy of fund profitability and its conformity to allocation methodologies. After considering PwC's reports issued under the engagement and information provided by Fidelity, the Board believes that while other allocation methods may also be reasonable, Fidelity's profitability methodologies are reasonable in all material respects.
The Board has also reviewed Fidelity's non-fund businesses and fall-out benefits related to the mutual fund business as well as cases where Fidelity's affiliates may benefit from or be related to the fund's business.
The Board considered the costs of the services provided by and the profits realized by Fidelity in connection with the operation of the fund and were satisfied that the profitability was not excessive in the circumstances.
Economies of Scale. The Board considered whether there have been economies of scale in respect of the management of the Fidelity funds, whether the Fidelity funds (including the fund) have appropriately benefited from any such economies of scale, and whether there is potential for realization of any further economies of scale. The Board considered the extent to which the fund will benefit from economies of scale through increased services to the fund, through waivers or reimbursements, or through fee or expense reductions.
In February 2009, the Board and the board of other Fidelity funds created an ad hoc committee (the Economies of Scale Committee) to analyze whether FMR attains economies of scale in respect of the management and servicing of the Fidelity funds, whether the Fidelity funds have appropriately benefited from such economies of scale, and whether there is potential for realization of any further economies of scale.
Annual Report
Board Approval of Investment Advisory Contracts and
Management Fees - continued
The Board recognized that the fund's management contract incorporates a "group fee" structure, which provides for lower group fee rates as total fund assets under FMR's management increase, and for higher group fee rates as total fund assets under FMR's management decrease. FMR calculates the group fee rates based on a tiered asset "breakpoint" schedule that varies based on asset class. The Board considered that the group fee is designed to deliver the benefits of economies of scale to fund shareholders when total Fidelity fund assets increase, even if assets of any particular fund are unchanged or have declined, because some portion of Fidelity's costs are attributable to services provided to all Fidelity funds, and all funds benefit if those costs can be allocated among more assets. The Board concluded that, given the group fee structure, fund shareholders will benefit from lower management fees as assets under FMR's management increase at the fund complex level, regardless of whether Fidelity achieves any such economies of scale.
The Board concluded, considering the findings of the Economies of Scale Committee, that any potential economies of scale are being appropriately shared between fund shareholders and Fidelity.
Additional Information Requested by the Board. In order to develop fully the factual basis for consideration of the Fidelity funds' Advisory Contracts, the Board requested and received additional information on certain topics, including (i) fund performance trends, actions to be taken by FMR to improve certain funds' overall performance, and Fidelity's long-term strategies for certain funds; (ii) Fidelity's fund profitability methodology and profitability trends for certain funds; (iii) portfolio manager changes that have occurred during the past year and the amount of the investment that each portfolio manager has made in the Fidelity fund(s) that he or she manages; (iv) Fidelity's compensation structure for portfolio managers, research analysts, and other key personnel, including its effects on fund profitability, the rationale for the compensation structure, and the extent to which current market conditions have affected retention and recruitment; (v) the compensation paid by FMR to fund sub-advisers on behalf of the Fidelity funds; (vi) Fidelity's fee structures and rationale for recommending different fees among different categories of funds and classes, as well as Fidelity's voluntary waiver of fees to maintain minimum yields for certain funds and classes; (vii) the rationale for any differences between fund fee structures and fee structures in place for other Fidelity clients; and (viii) explanations regarding the relative total expenses borne by certain funds and classes, total expense competitive trends, and actions that might be taken by FMR to reduce total expenses for certain funds and classes or to achieve further economies of scale.
Based on its evaluation of all of the conclusions noted above, and after considering all factors it believed relevant, the Board ultimately concluded that the advisory fee structures are fair and reasonable, and that the fund's Advisory Contracts should be renewed.
Annual Report
Investment Adviser
Fidelity Management & Research Company
Boston, MA
Investment Sub-Advisers
Fidelity Investments
Money Management, Inc.
Fidelity Management & Research (U.K.) Inc.
Fidelity Management & Research
(Hong Kong) Limited
Fidelity Management & Research
(Japan) Inc.
General Distributor
Fidelity Distributors Corporation
Boston, MA
Transfer and Service Agents
Citibank, N.A.
New York, NY
Fidelity Investments Institutional Operations Company, Inc.
Boston, MA
Fidelity Service Company, Inc.
Boston, MA
Custodian
Citibank, N.A.
New York, NY
ASNMI-UANN-0311
1.789706.108
Item 2. Code of Ethics
As of the end of the period, January 31, 2011, Fidelity New York Municipal Trust (the trust) has adopted a code of ethics, as defined in Item 2 of Form N-CSR, that applies to its President and Treasurer and its Chief Financial Officer. A copy of the code of ethics is filed as an exhibit to this Form N-CSR.
Item 3. Audit Committee Financial Expert
The Board of Trustees of the trust has determined that Marie L. Knowles is an audit committee financial expert, as defined in Item 3 of Form N-CSR. Ms. Knowles is independent for purposes of Item 3 of Form N-CSR.
Item 4. Principal Accountant Fees and Services
Fees and Services
The following table presents fees billed by Deloitte & Touche LLP, the member firms of Deloitte Touche Tohmatsu, and their respective affiliates (collectively, "Deloitte Entities") in each of the last two fiscal years for services rendered to Fidelity New York Municipal Income Fund (the "Fund"):
Services Billed by Deloitte Entities
January 31, 2011 FeesA
| Audit Fees | Audit-Related Fees | Tax Fees | All Other Fees |
Fidelity New York Municipal Income Fund | $44,000 | $- | $4,600 | $- |
January 31, 2010 FeesA
| Audit Fees | Audit-Related Fees | Tax Fees | All Other Fees |
Fidelity New York Municipal Income Fund | $44,000 | $- | $4,500 | $- |
A Amounts may reflect rounding.
The following table presents fees billed by Deloitte Entities that were required to be approved by the Audit Committee for services that relate directly to the operations and financial reporting of the Fund and that are rendered on behalf of Fidelity Management & Research Company ("FMR") and entities controlling, controlled by, or under common control with FMR (not including any sub-adviser whose role is primarily portfolio management and is subcontracted with or overseen by another investment adviser) that provide ongoing services to the Fund ("Fund Service Providers"):
Services Billed by Deloitte Entities
| January 31, 2011A | January 31, 2010A |
Audit-Related Fees | $645,000 | $725,000 |
Tax Fees | $- | $- |
All Other Fees | $705,000 | $450,000 |
A Amounts may reflect rounding.
"Audit-Related Fees" represent fees billed for assurance and related services that are reasonably related to the performance of the fund audit or the review of the fund's financial statements and that are not reported under Audit Fees.
"Tax Fees" represent fees billed for tax compliance, tax advice or tax planning that relate directly to the operations and financial reporting of the fund.
"All Other Fees" represent fees billed for services provided to the fund or Fund Service Provider, a significant portion of which are assurance related, that relate directly to the operations and financial reporting of the fund, excluding those services that are reported under Audit Fees, Audit-Related Fees or Tax Fees.
Assurance services must be performed by an independent public accountant.
* * *
The aggregate non-audit fees billed by Deloitte Entities for services rendered to the Fund, FMR (not including any sub-adviser whose role is primarily portfolio management and is subcontracted with or overseen by another investment adviser), and any Fund Service Provider for each of the last two fiscal years of the Fund are as follows:
Billed By | January 31, 2011 A | January 31, 2010 A |
Deloitte Entities | $1,450,000 | $1,180,000 |
A Amounts may reflect rounding.
The trust's Audit Committee has considered non-audit services that were not pre-approved that were provided by Deloitte Entities to Fund Service Providers to be compatible with maintaining the independence of Deloitte Entities in its audit of the Fund, taking into account representations from Deloitte Entities, in accordance with Public Company Accounting Oversight Board rules, regarding its independence from the Fund and its related entities and FMR's review of the appropriateness and permissibility under applicable law of such non-audit services prior to their provision to the Fund Service Providers.
Audit Committee Pre-Approval Policies and Procedures
The trust's Audit Committee must pre-approve all audit and non-audit services provided by a fund's independent registered public accounting firm relating to the operations or financial reporting of the fund. Prior to the commencement of any audit or non-audit services to a fund, the Audit Committee reviews the services to determine whether they are appropriate and permissible under applicable law.
The Audit Committee has adopted policies and procedures to, among other purposes, provide a framework for the Committee's consideration of non-audit services by the audit firms that audit the Fidelity funds. The policies and procedures require that any non-audit service provided by a fund audit firm to a Fidelity fund and any non-audit service provided by a fund auditor to a Fund Service Provider that relates directly to the operations and financial reporting of a Fidelity fund ("Covered Service") are subject to approval by the Audit Committee before such service is provided.
All Covered Services must be approved in advance of provision of the service either: (i) by formal resolution of the Audit Committee, or (ii) by oral or written approval of the service by the Chair of the Audit Committee (or if the Chair is unavailable, such other member of the Audit Committee as may be designated by the Chair to act in the Chair's absence). The approval contemplated by (ii) above is permitted where the Treasurer determines that action on such an engagement is necessary before the next meeting of the Audit Committee.
Non-audit services provided by a fund audit firm to a Fund Service Provider that do not relate directly to the operations and financial reporting of a Fidelity fund are reported to the Audit Committee on a periodic basis.
Non-Audit Services Approved Pursuant to Rule 2-01(c)(7)(i)(C) and (ii) of Regulation S-X ("De Minimis Exception")
There were no non-audit services approved or required to be approved by the Audit Committee pursuant to the De Minimis Exception during the Fund's last two fiscal years relating to services provided to (i) the Fund or (ii) any Fund Service Provider that relate directly to the operations and financial reporting of the Fund.
Item 5. Audit Committee of Listed Registrants
Not applicable.
Item 6. Investments
(a) Not applicable.
(b) Not applicable
Item 7. Disclosure of Proxy Voting Policies and Procedures for Closed-End Management Investment Companies
Not applicable.
Item 8. Portfolio Managers of Closed-End Management Investment Companies
Not applicable.
Item 9. Purchase of Equity Securities by Closed-End Management Investment Company and Affiliated Purchasers
Not applicable.
Item 10. Submission of Matters to a Vote of Security Holders
There were no material changes to the procedures by which shareholders may recommend nominees to the trust's Board of Trustees.
Item 11. Controls and Procedures
(a)(i) The President and Treasurer and the Chief Financial Officer have concluded that the trust's disclosure controls and procedures (as defined in Rule 30a-3(c) under the Investment Company Act) provide reasonable assurances that material information relating to the trust is made known to them by the appropriate persons, based on their evaluation of these controls and procedures as of a date within 90 days of the filing date of this report.
(a)(ii) There was no change in the trust's internal control over financial reporting (as defined in Rule 30a-3(d) under the Investment Company Act) that occurred during the second fiscal quarter of the period covered by this report that has materially affected, or is reasonably likely to materially affect, the trust's internal control over financial reporting.
Item 12. Exhibits
(a) | (1) | Code of Ethics pursuant to Item 2 of Form N-CSR is filed and attached hereto as EX-99.CODE ETH. |
(a) | (2) | Certification pursuant to Rule 30a-2(a) under the Investment Company Act of 1940 (17 CFR 270.30a-2(a)) is filed and attached hereto as Exhibit 99.CERT. |
(a) | (3) | Not applicable. |
(b) |
| Certification pursuant to Rule 30a-2(b) under the Investment Company Act of 1940 (17 CFR 270.30a-2(b)) is furnished and attached hereto as Exhibit 99.906CERT. |
SIGNATURES
Pursuant to the requirements of the Securities Exchange Act of 1934 and the Investment Company Act of 1940, the registrant has duly caused this report to be signed on its behalf by the undersigned, thereunto duly authorized.
Fidelity New York Municipal Trust
By: | /s/John R. Hebble |
| John R. Hebble |
| President and Treasurer |
|
|
Date: | March 30, 2011 |
Pursuant to the requirements of the Securities Exchange Act of 1934 and the Investment Company Act of 1940, this report has been signed below by the following persons on behalf of the registrant and in the capacities and on the dates indicated.
By: | /s/John R. Hebble |
| John R. Hebble |
| President and Treasurer |
|
|
Date: | March 30, 2011 |
By: | /s/Christine Reynolds |
| Christine Reynolds |
| Chief Financial Officer |
|
|
Date: | March 30, 2011 |