UNITED STATES
SECURITIES AND EXCHANGE COMMISSION
Washington, D.C. 20549
FORM N-CSR
CERTIFIED SHAREHOLDER REPORT OF REGISTERED
MANAGEMENT INVESTMENT COMPANIES
Investment Company Act file number 811-03723
Fidelity New York Municipal Trust
(Exact name of registrant as specified in charter)
245 Summer St., Boston, Massachusetts 02210
(Address of principal executive offices) (Zip code)
Margaret Carey, Secretary
245 Summer St.
Boston, Massachusetts 02210
(Name and address of agent for service)
Registrant's telephone number, including area code:
617-563-7000
Date of fiscal year end: | January 31 |
Date of reporting period: | January 31, 2024 |
Item 1.
Reports to Stockholders


Contents
| Average Annual Total Returns | |||
Periods ended January 31, 2024 | Past 1 year | Past 5 years | Past 10 years |
Class A (incl. 4.00% sales charge) | -0.69% | 0.75% | 1.98% |
Class M (incl. 4.00% sales charge) | -0.64% | 0.80% | 2.03% |
Class C (incl. contingent deferred sales charge) | 1.72% | 0.85% | 1.79% |
| Fidelity® New York Municipal Income Fund | 3.77% | 1.92% | 2.73% |
| Class I | 3.69% | 1.83% | 2.65% |
| Class Z | 3.81% | 1.93% | 2.71% |
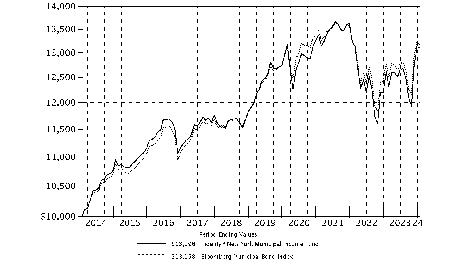
| $10,000 Over 10 Years |
Let's say hypothetically that $10,000 was invested in Fidelity® New York Municipal Income Fund, a class of the fund, on January 31, 2014. The chart shows how the value of your investment would have changed, and also shows how the Bloomberg Municipal Bond Index performed over the same period. |
 |
| Revenue Sources (% of Fund's net assets) | ||
| Transportation | 27.5 | |
| Special Tax | 22.9 | |
| Education | 14.8 | |
| General Obligations | 12.1 | |
| Health Care | 9.2 | |
| Housing | 5.4 | |
| Others* (Individually Less Than 5%) | 8.1 | |
| 100.0 | ||
| *Includes net other assets | ||
Quality Diversification (% of Fund's net assets) |
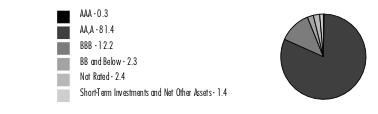 |
| We have used ratings from Moody's Investors Service, Inc. Where Moody's® ratings are not available, we have used S&P® ratings. All ratings are as of the date indicated and do not reflect subsequent changes. |
| Municipal Bonds - 98.6% | |||
Principal Amount (a) (000s) | Value ($) (000s) | ||
| New York - 87.3% | |||
| Brighton Central School Distri Series 2020, 2.125% 6/15/32 | 1,000 | 876 | |
| Brookhaven Loc Dev. Corp. Series 2020, 4% 11/1/45 | 1,000 | 846 | |
| Buffalo and Erie County Indl. Land Rev. (Catholic Health Sys., Inc. Proj.) Series 2015: | |||
| 5% 7/1/24 | 600 | 596 | |
| 5% 7/1/25 | 590 | 577 | |
| 5% 7/1/26 | 450 | 433 | |
| 5% 7/1/27 | 600 | 570 | |
| 5% 7/1/28 | 360 | 338 | |
| 5% 7/1/29 | 300 | 279 | |
| 5% 7/1/30 | 575 | 525 | |
| 5% 7/1/40 | 1,000 | 845 | |
| 5.25% 7/1/35 | 1,000 | 875 | |
| Buffalo Muni. Wtr. Fin. Auth. Series 2015 A, 5% 7/1/29 | 500 | 511 | |
| Dobbs Ferry Series 2017 A, 2.65% 10/15/33 | 325 | 292 | |
| Dorm. Auth. New York Univ. Rev.: | |||
| (Fordham Univ. Proj.) Series 2017: | |||
5% 7/1/30 | 625 | 665 | |
5% 7/1/32 | 1,500 | 1,595 | |
| (Orange Reg'l. Med. Ctr. Proj.) Series 2017, 5% 12/1/28 (b) | 4,000 | 3,940 | |
| (St Johns Univ., NY. Proj.) Series 2017 A: | |||
5% 7/1/28 | 750 | 796 | |
5% 7/1/30 | 1,250 | 1,325 | |
| (State Univ. of New York Proj.) Series 2017 A: | |||
5% 7/1/32 | 1,500 | 1,605 | |
5% 7/1/34 | 3,000 | 3,207 | |
| Series 2016 A: | |||
5% 7/1/41 | 2,500 | 2,559 | |
5% 7/1/46 | 8,000 | 8,130 | |
5% 7/1/50 | 6,280 | 6,359 | |
| Series 2017, 5% 12/1/32 (b) | 4,000 | 3,872 | |
| Dutchess County Local Dev. Corp. Rev.: | |||
| (Health Quest Systems, Inc. Proj.) Series 2016 B, 5% 7/1/46 | 9,025 | 8,721 | |
| (Marist College Proj.) Series 2015 A: | |||
5% 7/1/26 | 550 | 566 | |
5% 7/1/27 | 350 | 359 | |
5% 7/1/28 | 500 | 513 | |
5% 7/1/29 | 725 | 745 | |
5% 7/1/31 | 2,610 | 2,684 | |
5% 7/1/32 | 2,660 | 2,733 | |
5% 7/1/33 | 2,770 | 2,846 | |
5% 7/1/34 | 2,935 | 3,014 | |
5% 7/1/40 | 8,500 | 8,638 | |
| (The Culinary Institute of America Proj.) Series 2018: | |||
5% 7/1/26 | 850 | 873 | |
5% 7/1/30 | 1,100 | 1,161 | |
5% 7/1/35 | 855 | 896 | |
| Erie County Fiscal Stability Auth. Series 2017 D: | |||
| 5% 9/1/33 | 525 | 567 | |
| 5% 9/1/34 | 850 | 916 | |
| Farmingdale Union Free School District Series 2020, 2% 9/15/36 | 330 | 258 | |
| Hempstead Local Dev. Corp. Rev.: | |||
| (Adelphi Univ. Proj.) Series 2021: | |||
5% 6/1/25 | 400 | 408 | |
5% 6/1/26 | 550 | 572 | |
5% 6/1/28 | 155 | 167 | |
5% 6/1/30 | 200 | 223 | |
5% 6/1/32 | 200 | 225 | |
| (Hofstra Univ. Proj.) Series 2021 A, 3% 7/1/51 | 14,635 | 10,577 | |
| (Molloy College Proj.) Series 2017: | |||
5% 7/1/32 | 740 | 764 | |
5% 7/1/33 | 475 | 489 | |
| Hudson Yards Infrastructure Corp. New York Rev. Series 2017 A: | |||
| 3.5% 2/15/38 | 405 | 395 | |
| 5% 2/15/34 | 6,130 | 6,497 | |
| Islip Gen. Oblig. Series 2021 A: | |||
| 2% 5/1/33 | 345 | 294 | |
| 2% 5/1/37 | 1,575 | 1,224 | |
| Kingston NY City School District Series 2021, 2% 6/15/35 | 425 | 339 | |
| Liberty Dev. Corp. Rev. Series 2005, 5.25% 10/1/35 | 11,440 | 13,477 | |
| Long Island Pwr. Auth. Elec. Sys. Rev.: | |||
| Series 2020 A: | |||
5% 9/1/34 | 1,700 | 1,962 | |
5% 9/1/35 | 1,200 | 1,380 | |
5% 9/1/37 | 500 | 567 | |
5% 9/1/38 | 1,450 | 1,630 | |
| Series 2022 A: | |||
5% 9/1/38 | 1,275 | 1,476 | |
5% 9/1/39 | 1,375 | 1,572 | |
5% 9/1/40 | 1,500 | 1,715 | |
5% 9/1/41 | 1,375 | 1,556 | |
5% 9/1/42 | 2,000 | 2,251 | |
| Series 2023 E: | |||
5% 9/1/39 | 1,750 | 2,032 | |
5% 9/1/40 | 1,915 | 2,221 | |
5% 9/1/41 | 2,100 | 2,431 | |
5% 9/1/42 | 2,375 | 2,714 | |
| Madison County Cap. Resource Corp. Rev. (Colgate Univ. Rfdg. Proj.) Series 2015 A, 5% 7/1/33 | 1,000 | 1,025 | |
| Mahopac Cent Scd Series 2021, 1.7% 6/1/35 | 635 | 490 | |
| Massapequa Union Free School District Series 2019: | |||
| 2% 10/1/32 | 1,745 | 1,506 | |
| 2% 10/1/33 | 1,775 | 1,514 | |
| Monroe County Indl. Dev. Agcy. Rev. (Rochester Schools Modernization Proj.) Series 2018, 5% 5/1/32 | 5,000 | 5,460 | |
| Monroe County Indl. Dev. Corp.: | |||
| (Highland Hosp. of Rochester Proj.) Series 2020, 3% 7/1/50 | 4,265 | 3,142 | |
| (Rochester Reg'l. Health Proj.) Series 2020 A, 4% 12/1/46 | 2,500 | 2,225 | |
| (The Rochester Gen. Hosp. Proj.) Series 2017: | |||
5% 12/1/31 | 1,595 | 1,653 | |
5% 12/1/34 | 760 | 787 | |
5% 12/1/35 | 700 | 723 | |
5% 12/1/36 | 700 | 721 | |
| (Univ. of Rochester Proj.): | |||
Series 2017 A, 5% 7/1/34 | 1,310 | 1,404 | |
Series 2017 C, 4% 7/1/32 | 1,680 | 1,726 | |
| MTA Hudson Rail Yards Trust Oblig. Series 2016 A: | |||
| 5% 11/15/51 | 3,000 | 3,000 | |
| 5% 11/15/56 | 9,000 | 8,918 | |
| Nassau County Local Econ. Assistance Corp. Series 2014 B, 5% 7/1/27 | 1,000 | 1,005 | |
| New Rochelle City School District Series 2020, 2% 6/15/33 | 2,625 | 2,184 | |
| New Rochelle N Y Series 2020, 2% 2/15/34 | 590 | 486 | |
| New York Bridge Auth. Gen. Rev. Series 2021 A, 4% 1/1/51 | 1,085 | 1,058 | |
| New York City Edl. Construction Fund Series 2021 B, 5% 4/1/52 | 5,610 | 5,917 | |
| New York City Gen. Oblig.: | |||
| Series 2018 F, 5% 4/1/45 | 8,485 | 8,969 | |
| Series 2018 F1, 3.375% 4/1/38 | 490 | 477 | |
| Series 2019 D: | |||
5% 12/1/41 | 4,305 | 4,623 | |
5% 12/1/44 | 9,810 | 10,469 | |
| Series 2020 D1, 4% 3/1/44 | 1,475 | 1,476 | |
| Series 2021 A1, 4% 8/1/34 | 3,250 | 3,471 | |
| Series 2021 F1: | |||
3% 3/1/51 (Build America Mutual Assurance Insured) | 5,825 | 4,562 | |
5% 3/1/43 | 1,500 | 1,646 | |
| Series 2022 A1, 5% 8/1/47 | 18,895 | 20,532 | |
| Series 2022 D1, 5.25% 5/1/38 | 5,000 | 5,806 | |
| Series 2023 F1, 5% 8/1/37 | 1,000 | 1,170 | |
| New York City Hsg. Dev. Corp. Multifamily Hsg.: | |||
| Series 2019 G1B, 3.05% 5/1/50 | 4,270 | 3,347 | |
| Series 2019 J: | |||
3% 11/1/44 | 8,030 | 6,677 | |
3.05% 11/1/49 | 9,115 | 7,190 | |
| Series 2020 A1C, 2.8% 11/1/45 | 1,000 | 774 | |
| Series 2021 C1, 2.4% 11/1/46 | 2,535 | 1,794 | |
| Series 2021 F1: | |||
2.25% 11/1/41 | 10,000 | 7,314 | |
2.4% 11/1/46 | 1,000 | 708 | |
| Series 2021 I: | |||
2.45% 11/1/41 | 6,200 | 4,786 | |
2.7% 11/1/51 | 8,285 | 5,921 | |
| New York City Indl. Dev. Agcy. Rev.: | |||
| (Queens Baseball Stadium Proj.) Series 2021 A: | |||
3% 1/1/37 (Assured Guaranty Corp. Insured) (Assured Guaranty Muni. Corp. Insured) | 1,000 | 902 | |
3% 1/1/46 (Assured Guaranty Corp. Insured) (Assured Guaranty Muni. Corp. Insured) | 9,945 | 7,841 | |
| (Yankee Stadium Proj.) Series 2020 A, 3% 3/1/49 | 1,700 | 1,282 | |
| New York City Muni. Wtr. Fin. Auth. Wtr. & Swr. Sys. Rev.: | |||
| Series 2019 DD, 5.25% 6/15/49 | 4,410 | 4,702 | |
| Series 2021 BB1, 3% 6/15/50 | 4,395 | 3,474 | |
| New York City Transitional Fin. Auth. Bldg. Aid Rev.: | |||
| Series 2016 S1, 5% 7/15/33 | 2,165 | 2,246 | |
| Series 2018 S4, 5.25% 7/15/36 | 8,095 | 8,882 | |
| Series 2019 S1, 5% 7/15/43 | 1,715 | 1,820 | |
| Series 2022 1A, 3% 7/15/39 | 1,690 | 1,532 | |
| New York City Transitional Fin. Auth. Rev.: | |||
| Series 2016 A1, 3.25% 8/1/35 | 325 | 319 | |
| Series 2017 B, 5% 8/1/34 | 2,640 | 2,772 | |
| Series 2017 E-1, 5% 2/1/34 | 4,500 | 4,773 | |
| Series 2017 F, 5% 5/1/34 | 7,000 | 7,462 | |
| Series 2018 B-1, 5% 8/1/34 | 3,000 | 3,214 | |
| Series 2018 C2, 5% 5/1/37 | 4,690 | 5,056 | |
| Series 2020 C1, 3% 5/1/46 | 4,200 | 3,482 | |
| Series 2021 B1, 4% 8/1/38 | 1,340 | 1,381 | |
| Series 2021 F1, 4% 11/1/38 | 1,500 | 1,542 | |
| Series 2022 B1, 5.25% 11/1/37 | 6,120 | 7,242 | |
| Series 2024 A1: | |||
5% 5/1/40 | 5,115 | 5,857 | |
5% 5/1/41 | 8,000 | 9,115 | |
| Series C1, 4% 5/1/47 | 1,000 | 992 | |
| New York Convention Ctr. Dev. Corp. Rev.: | |||
| Series 2015: | |||
5% 11/15/29 | 5,000 | 5,114 | |
5% 11/15/30 | 2,000 | 2,046 | |
5% 11/15/33 | 9,115 | 9,323 | |
5% 11/15/34 | 3,000 | 3,067 | |
5% 11/15/40 | 9,990 | 10,145 | |
| Series 2016, 0% 11/15/38 | 1,275 | 698 | |
| New York Dorm. Auth. Rev.: | |||
| Series 2015 A: | |||
5% 7/1/28 | 5,000 | 5,089 | |
5% 7/1/29 | 5,000 | 5,090 | |
5% 5/1/30 | 3,450 | 3,517 | |
5% 7/1/30 | 5,000 | 5,084 | |
5% 5/1/31 | 11,000 | 11,207 | |
5% 7/1/31 | 15,000 | 15,223 | |
| Series 2015 B, 5% 10/1/34 | 1,070 | 1,102 | |
| Series 2015: | |||
5% 12/1/24 (b) | 600 | 601 | |
5% 12/1/27 (b) | 1,200 | 1,202 | |
| Series 2016 A: | |||
5% 7/1/31 | 1,200 | 1,257 | |
5% 7/1/33 | 800 | 838 | |
5% 7/1/34 | 650 | 679 | |
5% 7/1/35 | 500 | 522 | |
| Series 2018 A, 5% 8/1/35 | 3,800 | 3,951 | |
| Series 2019 1, 2% 7/1/33 | 6,980 | 6,051 | |
| Series 2019 A: | |||
4% 7/1/40 | 1,000 | 745 | |
4% 7/1/45 | 3,750 | 2,640 | |
5% 7/1/26 | 545 | 525 | |
5% 7/1/27 | 390 | 371 | |
5% 7/1/28 | 465 | 437 | |
5% 7/1/29 | 750 | 695 | |
5% 7/1/30 | 1,475 | 1,347 | |
5% 7/1/32 | 1,540 | 1,373 | |
5% 7/1/33 | 5,800 | 6,118 | |
5% 7/1/34 | 1,300 | 1,134 | |
5% 7/1/35 | 600 | 526 | |
5% 7/1/36 | 500 | 435 | |
5% 7/1/38 | 3,440 | 3,772 | |
5% 7/1/41 | 1,345 | 1,130 | |
5% 7/1/42 | 8,500 | 9,176 | |
| Series 2019 B, 5% 7/1/50 | 3,000 | 3,179 | |
| Series 2020 A: | |||
3% 7/1/48 | 5,000 | 3,911 | |
4% 9/1/50 | 7,120 | 6,315 | |
4% 7/1/53 | 5,805 | 5,643 | |
5% 7/1/40 | 1,265 | 1,365 | |
| Series 2021 A: | |||
3% 7/1/41 | 1,000 | 869 | |
4% 7/1/48 | 4,000 | 3,869 | |
5% 7/1/46 | 1,025 | 1,037 | |
5% 7/1/51 | 3,040 | 3,048 | |
| Series 2022 A: | |||
4% 7/1/49 | 2,500 | 2,364 | |
5% 7/1/35 | 1,425 | 1,563 | |
5% 7/1/36 | 1,495 | 1,630 | |
5% 7/1/37 | 785 | 850 | |
5% 7/15/37 | 6,500 | 6,842 | |
5% 7/1/38 | 500 | 538 | |
5% 7/1/39 | 865 | 925 | |
5% 7/1/40 | 915 | 974 | |
5% 7/1/41 | 830 | 881 | |
5% 7/1/42 | 1,005 | 1,062 | |
| Series 2022: | |||
4% 7/1/46 | 4,625 | 4,634 | |
5% 7/1/35 | 1,095 | 1,167 | |
5% 7/1/47 | 5,625 | 5,649 | |
5% 7/1/52 | 4,675 | 5,024 | |
| New York Dorm. Auth. Revs. (New York Univ. Proj.) Series 2001 1, 5.5% 7/1/40 (AMBAC Insured) | 3,000 | 3,639 | |
| New York Dorm. Auth. Sales Tax Rev.: | |||
| Series 2018 A: | |||
5% 3/15/42 | 9,940 | 10,511 | |
5% 3/15/43 | 9,940 | 10,492 | |
| Series 2018 C: | |||
5% 3/15/35 | 18,870 | 20,379 | |
5% 3/15/43 | 6,185 | 6,528 | |
| Series 2018 E, 5% 3/15/44 | 5,000 | 5,302 | |
| Series 2018, 5% 3/15/48 | 12,700 | 13,355 | |
| New York Envir. Facilities Corp. Clean Wtr. & Drinking Wtr. (New York City Muni. Wtr. Fin. Auth. Proj.) Series 2018 B, 5% 6/15/43 | 1,000 | 1,068 | |
| New York Liberty Dev. Corp.: | |||
| (Bank of America Tower at One Bryant Park Proj.) Series 2019 1, 2.45% 9/15/69 | 8,000 | 7,425 | |
| (World Trade Ctr. Proj.) Series 2021 A, 3% 11/15/51 | 5,500 | 4,113 | |
| New York Metropolitan Trans. Auth. Rev.: | |||
| Series 2014 D, 5.25% 11/15/44 | 5,000 | 5,035 | |
| Series 2015 A1, 5% 11/15/45 | 1,200 | 1,204 | |
| Series 2015 B, 5% 11/15/29 | 2,125 | 2,158 | |
| Series 2015 C, 5% 11/15/35 | 600 | 612 | |
| Series 2016 A1, 5% 11/15/46 | 22,890 | 23,163 | |
| Series 2016 B: | |||
5% 11/15/34 | 1,490 | 1,547 | |
5% 11/15/35 | 8,375 | 8,678 | |
| Series 2016 C1: | |||
5% 11/15/31 | 1,175 | 1,225 | |
5% 11/15/32 | 730 | 760 | |
| Series 2016 D: | |||
5% 11/15/30 | 1,805 | 1,883 | |
5% 11/15/31 | 665 | 694 | |
5.25% 11/15/31 | 500 | 527 | |
| Series 2017 A1, 5% 11/15/51 | 1,500 | 1,528 | |
| Series 2017 C-2: | |||
0% 11/15/29 | 15,820 | 13,075 | |
0% 11/15/32 | 18,000 | 13,328 | |
| Series 2017 C1: | |||
5% 11/15/27 | 620 | 665 | |
5% 11/15/30 | 1,015 | 1,094 | |
| Series 2017 D: | |||
5% 11/15/28 | 2,125 | 2,293 | |
5% 11/15/30 | 5,000 | 5,389 | |
5% 11/15/32 | 925 | 994 | |
| Series 2020 C1, 5% 11/15/50 | 1,310 | 1,373 | |
| New York State Dorm. Auth.: | |||
| Series 2017 A, 5% 2/15/37 (Pre-Refunded to 2/15/27 @ 100) | 5 | 5 | |
| Series 2019 A, 5% 3/15/46 | 7,500 | 8,049 | |
| Series 2020 A: | |||
3% 3/15/38 | 1,590 | 1,473 | |
3% 3/15/39 | 5,000 | 4,568 | |
| Series 2021 A, 5% 3/15/49 | 6,500 | 7,022 | |
| Series 2021 E: | |||
3% 3/15/50 | 10,285 | 8,241 | |
4% 3/15/37 | 3,700 | 3,881 | |
4% 3/15/39 | 735 | 756 | |
| Series 2022 A: | |||
4% 3/15/39 | 1,000 | 1,029 | |
5% 3/15/41 | 5,000 | 5,630 | |
| Series 2023 A: | |||
5% 3/15/37 | 2,625 | 3,074 | |
5% 3/15/38 | 1,645 | 1,907 | |
5% 3/15/39 | 2,100 | 2,418 | |
| New York State Hsg. Fin. Agcy. Rev.: | |||
| Series 2017 K, 3% 11/1/32 | 1,500 | 1,427 | |
| Series 2021 D1, 2.4% 11/1/41 | 2,740 | 2,091 | |
| New York State Mtg. Agcy. Homeowner Mtg.: | |||
| Series 2020 227, 2.5% 10/1/47 | 12,730 | 8,793 | |
| Series 2021 232, 5% 10/1/28 (c) | 1,680 | 1,784 | |
| Series 221, 3.5% 10/1/32 (c) | 3,905 | 3,832 | |
| Series 223, 3.5% 4/1/49 | 1,380 | 1,365 | |
| Series 226, 3.5% 10/1/50 (c) | 8,875 | 8,702 | |
| New York State Urban Dev. Corp.: | |||
| Series 2020 A, 5% 3/15/42 | 2,175 | 2,388 | |
| Series 2020 C: | |||
4% 3/15/39 | 1,000 | 1,031 | |
4% 3/15/49 | 3,165 | 3,111 | |
| Series 2022 A, 5% 3/15/40 | 8,000 | 9,086 | |
| New York Thruway Auth. Gen. Rev.: | |||
| Series 2016 A: | |||
5% 1/1/34 | 3,000 | 3,107 | |
5% 1/1/35 | 6,455 | 6,679 | |
5% 1/1/41 | 9,320 | 9,571 | |
5% 1/1/51 | 8,625 | 8,785 | |
| Series 2019 B: | |||
3% 1/1/53 | 5,405 | 4,082 | |
3% 1/1/53 (Assured Guaranty Muni. Corp. Insured) | 2,000 | 1,540 | |
4% 1/1/45 | 5,000 | 4,937 | |
| Series 2020 N, 3% 1/1/50 | 5,000 | 3,829 | |
| New York Thruway Auth. Personal Income Tax Rev. Series 2021 A1, 3% 3/15/50 | 8,945 | 7,059 | |
| New York Trans. Dev. Corp.: | |||
| (Delta Air Lines, Inc. - Laguardia Arpt. Terminals C&D Redev. Proj.) Series 2023, 6% 4/1/35 (c) | 5,000 | 5,610 | |
| (Delta Air Lines, Inc. Laguardia Arpt. Terminals C&D Redev. Proj.) Series 2018, 5% 1/1/33 (c) | 5,000 | 5,150 | |
| (John F. Kennedy Int'l. Arpt. New Term. One Proj.) Series 2023, 5% 6/30/49 (Assured Guaranty Muni. Corp. Insured) (c) | 5,000 | 5,247 | |
| (Laguardia Arpt. Term. B Redev. Proj.) Series 2016 A, 5% 7/1/34 (c) | 4,000 | 4,012 | |
| (Term. 4 JFK Int'l. Arpt. Proj.): | |||
Series 2020 A: | |||
4% 12/1/38 (c) | 600 | 587 | |
4% 12/1/41 (c) | 1,700 | 1,616 | |
5% 12/1/31 (c) | 1,200 | 1,301 | |
5% 12/1/33 (c) | 1,950 | 2,101 | |
5% 12/1/35 (c) | 1,540 | 1,644 | |
Series 2020 C: | |||
5% 12/1/29 | 1,300 | 1,425 | |
5% 12/1/30 | 500 | 552 | |
| (Term. 4 John F. Kennedy Int'l. Arpt. Proj.) Series 2022: | |||
5% 12/1/35 (c) | 8,465 | 9,245 | |
5% 12/1/36 (c) | 7,500 | 8,123 | |
| New York Urban Dev. Corp. Rev.: | |||
| (New York State Gen. Oblig. Proj.) Series 2017 A, 5% 3/15/34 | 5,000 | 5,312 | |
| Series 2019 A, 5% 3/15/43 | 10,830 | 11,451 | |
| Niagara Area Dev. Corp. Rev. (Catholic Health Sys., Inc. Proj.) Series 2022, 5% 7/1/52 | 3,000 | 2,404 | |
| Niagara Frontier Trans. Auth. Arpt. Rev. Series 2019 A: | |||
| 5% 4/1/29 (c) | 350 | 375 | |
| 5% 4/1/30 (c) | 750 | 800 | |
| 5% 4/1/32 (c) | 900 | 959 | |
| 5% 4/1/33 (c) | 650 | 693 | |
| 5% 4/1/34 (c) | 1,765 | 1,879 | |
| 5% 4/1/36 (c) | 1,150 | 1,204 | |
| 5% 4/1/38 (c) | 750 | 783 | |
| North Hempstead Gen. Oblig. Series 2017 C, 2.9% 9/15/33 | 850 | 799 | |
| Oneida County Local Dev. Corp. Rev.: | |||
| (Mohawk Valley Health Sys. Proj.) Series 2019 A: | |||
4% 12/1/37 (Assured Guaranty Muni. Corp. Insured) | 1,000 | 1,004 | |
4% 12/1/38 (Assured Guaranty Muni. Corp. Insured) | 1,000 | 1,000 | |
4% 12/1/49 (Assured Guaranty Muni. Corp. Insured) | 11,305 | 10,619 | |
5% 12/1/30 (Assured Guaranty Muni. Corp. Insured) | 755 | 834 | |
5% 12/1/31 (Assured Guaranty Muni. Corp. Insured) | 545 | 600 | |
| (Utica College Proj.) Series 2019, 4% 7/1/39 | 2,625 | 2,444 | |
| Onondaga Civic Dev. Corp.: | |||
| (Le Moyne College Proj.) Series 2020 B: | |||
4% 7/1/36 | 425 | 423 | |
4% 7/1/37 | 275 | 270 | |
4% 7/1/38 | 510 | 492 | |
4% 7/1/39 | 650 | 620 | |
4% 7/1/40 | 600 | 566 | |
5% 7/1/24 | 215 | 216 | |
5% 7/1/25 | 235 | 238 | |
5% 7/1/27 | 815 | 852 | |
5% 7/1/28 | 855 | 903 | |
5% 7/1/31 | 340 | 365 | |
5% 7/1/32 | 265 | 284 | |
5% 7/1/33 | 300 | 320 | |
5% 7/1/34 | 300 | 320 | |
5% 7/1/35 | 400 | 426 | |
| (Syracuse Univ. Proj.) Series 2020 A, 5% 12/1/35 | 1,110 | 1,260 | |
| Onondaga County: | |||
| Series 2018, 3.375% 4/15/36 | 1,020 | 987 | |
| Series 2020, 2% 10/15/34 | 1,295 | 1,051 | |
| Onondaga County Wtr. Auth. Series 2022 A, 2.5% 9/15/51 | 1,855 | 1,269 | |
| Orange County: | |||
| Series 2016 A, 2.25% 3/15/33 | 250 | 217 | |
| Series 2021 A, 2% 6/15/29 | 250 | 228 | |
| Pearl River Union Free School Series 2021, 2% 6/1/36 | 650 | 513 | |
| Port Chester-Rye Series 2020, 2% 6/1/36 | 1,925 | 1,527 | |
| Saratoga County Cap. Resources Rev. (Skidmore College Proj.) Series 2020 A: | |||
| 4% 7/1/50 | 1,500 | 1,461 | |
| 5% 7/1/45 | 1,625 | 1,751 | |
| Saratoga County Gen. Oblig. Series 2016, 3.125% 7/15/36 | 1,510 | 1,452 | |
| Suffolk County Econ. Dev. Corp. Rev. Series 2021, 5.375% 11/1/54 (b) | 3,500 | 2,727 | |
| Suffolk County Gen. Oblig.: | |||
| Series 2021 A: | |||
2% 6/15/33 | 7,555 | 6,400 | |
2% 6/15/34 | 7,105 | 5,883 | |
| Series 2022 C, 4% 9/1/36 | 2,000 | 2,085 | |
| Suffolk Tobacco Asset Securitization Corp.: | |||
| Series 2021 A2, 4% 6/1/50 | 3,000 | 2,765 | |
| Series 2021 B1, 4% 6/1/50 | 5,260 | 5,313 | |
| Syracuse Reg'l. Arpt. Auth. Series 2021: | |||
| 4% 7/1/35 (c) | 500 | 498 | |
| 4% 7/1/36 (c) | 500 | 493 | |
| 5% 7/1/28 (c) | 1,640 | 1,731 | |
| 5% 7/1/29 (c) | 1,500 | 1,604 | |
| 5% 7/1/30 (c) | 1,500 | 1,623 | |
| 5% 7/1/31 (c) | 2,060 | 2,246 | |
| 5% 7/1/32 (c) | 1,145 | 1,247 | |
| 5% 7/1/33 (c) | 755 | 819 | |
| 5% 7/1/34 (c) | 815 | 880 | |
| Tobacco Settlement Asset Securitization Corp. Series 2017 A, 5% 6/1/30 | 2,525 | 2,634 | |
| Triborough Brdg & Tunl Auth. Series 2023 A: | |||
| 5% 5/15/36 | 800 | 953 | |
| 5% 5/15/38 | 1,125 | 1,312 | |
| 5% 5/15/39 | 1,545 | 1,791 | |
| Triborough Bridge & Tunnel Auth.: | |||
| Series 2022 D 1A, 5% 11/15/38 | 10,000 | 11,525 | |
| Series 2023 C, 5.25% 11/15/39 | 6,000 | 7,099 | |
| Triborough Bridge & Tunnel Auth. Revs.: | |||
| Series 2018 D, 4% 11/15/37 | 3,000 | 3,104 | |
| Series 2019 C, 3% 11/15/46 | 5,000 | 4,122 | |
| Series 2022 A: | |||
4% 11/15/52 | 3,000 | 2,928 | |
5% 11/15/40 | 2,000 | 2,283 | |
5% 11/15/41 | 2,000 | 2,270 | |
| Troy Cap. Resource Corp. Rev. (Rensselaer Polytechnic Institute Proj.): | |||
| Series 2015: | |||
5% 8/1/27 | 1,600 | 1,646 | |
5% 8/1/28 | 1,565 | 1,612 | |
5% 8/1/32 | 1,000 | 1,030 | |
| Series 2020 A, 5% 9/1/36 | 1,500 | 1,647 | |
| Uniondale Union Free School District Series 2021: | |||
| 1.75% 5/1/33 | 3,385 | 2,863 | |
| 1.75% 5/1/34 | 3,810 | 3,058 | |
| West Islip Union Free School District Series 2020, 2% 6/15/32 | 2,880 | 2,450 | |
| Westchester County Gen. Oblig. Series 2021 A: | |||
| 2% 10/15/32 | 3,990 | 3,426 | |
| 2% 10/15/33 | 570 | 482 | |
| Westchester County Local Dev. Co. Series 2024: | |||
| 5% 7/1/35 | 3,500 | 3,975 | |
| 5% 7/1/38 | 2,000 | 2,220 | |
| Western Nassau County Wtr. Auth. Series 2015 A, 5% 4/1/30 | 350 | 357 | |
| Yonkers Gen. Oblig.: | |||
| Series 2019 A: | |||
4% 5/1/34 (Build America Mutual Assurance Insured) | 1,500 | 1,571 | |
5% 5/1/33 (Build America Mutual Assurance Insured) | 1,000 | 1,110 | |
| Series 2021 B, 4% 2/15/37 | 1,200 | 1,250 | |
TOTAL NEW YORK | 1,078,482 | ||
| New York And New Jersey - 9.8% | |||
| Port Auth. of New York & New Jersey: | |||
| 85th Series, 5.375% 3/1/28 | 3,885 | 4,102 | |
| Series 193, 5% 10/15/28 (c) | 2,015 | 2,061 | |
| Series 2019 218, 5% 11/1/36 (c) | 4,820 | 5,183 | |
| Series 202, 5% 10/15/36 (c) | 5,455 | 5,673 | |
| Series 2020 221, 4% 7/15/50 (c) | 2,900 | 2,740 | |
| Series 2021 224, 5% 7/15/56 | 6,795 | 7,317 | |
| Series 2021 227: | |||
2% 10/1/31 (c) | 6,295 | 5,408 | |
2% 10/1/34 (c) | 4,380 | 3,545 | |
| Series 2022 234: | |||
5% 8/1/38 (c) | 1,750 | 1,918 | |
5% 8/1/39 (c) | 1,500 | 1,640 | |
5.25% 8/1/40 (c) | 2,000 | 2,236 | |
| Series 2023 238: | |||
5% 7/15/35 (c) | 8,475 | 9,621 | |
5% 7/15/36 (c) | 7,060 | 7,941 | |
5% 7/15/37 (c) | 4,235 | 4,713 | |
| Series 214: | |||
4% 9/1/37 (c) | 4,000 | 4,009 | |
4% 9/1/39 (c) | 1,920 | 1,915 | |
4% 9/1/43 (c) | 6,500 | 6,375 | |
5% 9/1/33 (c) | 2,005 | 2,179 | |
| Series 218: | |||
4% 11/1/47 (c) | 11,280 | 10,970 | |
5% 11/1/30 (c) | 1,130 | 1,235 | |
5% 11/1/44 (c) | 5,080 | 5,308 | |
| Series 221: | |||
4% 7/15/36 (c) | 3,000 | 3,081 | |
4% 7/15/38 (c) | 1,000 | 1,009 | |
4% 7/15/40 (c) | 2,000 | 1,982 | |
4% 7/15/45 (c) | 8,000 | 7,760 | |
5% 7/15/32 (c) | 1,500 | 1,656 | |
| Series 223, 5% 7/15/56 (c) | 8,850 | 9,209 | |
TOTAL NEW YORK AND NEW JERSEY | 120,786 | ||
| Non-State Specific - 0.1% | |||
| Port Auth. of New York & New Jersey Series 217, 5% 11/1/44 | 1,000 | 1,077 | |
| Puerto Rico - 1.4% | |||
| Puerto Rico Commonwealth Aqueduct & Swr. Auth. Series 2021 B, 5% 7/1/37 (b) | 3,345 | 3,409 | |
| Puerto Rico Commonwealth Pub. Impt. Gen. Oblig. Series 2021 A1: | |||
| 0% 7/1/33 | 3,720 | 2,365 | |
| 5.625% 7/1/27 | 455 | 480 | |
| 5.625% 7/1/29 | 1,350 | 1,462 | |
| 5.75% 7/1/31 | 3,120 | 3,476 | |
| Puerto Rico Sales Tax Fing. Corp. Sales Tax Rev.: | |||
| Series 2018 A1: | |||
4.55% 7/1/40 | 325 | 325 | |
4.75% 7/1/53 | 2,250 | 2,204 | |
| Series 2019 A2, 4.329% 7/1/40 | 3,632 | 3,609 | |
TOTAL PUERTO RICO | 17,330 | ||
| TOTAL MUNICIPAL BONDS (Cost $1,236,807) | 1,217,675 | ||
| Money Market Funds - 0.5% | |||
| Shares | Value ($) (000s) | ||
Fidelity Municipal Cash Central Fund 4.36% (d)(e) (Cost $6,576) | 6,575,074 | 6,577 | |
| TOTAL INVESTMENT IN SECURITIES - 99.1% (Cost $1,243,383) | 1,224,252 |
NET OTHER ASSETS (LIABILITIES) - 0.9% | 10,499 |
| NET ASSETS - 100.0% | 1,234,751 |
| (a) | Amount is stated in United States dollars unless otherwise noted. |
| (b) | Security exempt from registration under Rule 144A of the Securities Act of 1933. These securities may be resold in transactions exempt from registration, normally to qualified institutional buyers. At the end of the period, the value of these securities amounted to $15,751,000 or 1.3% of net assets. |
| (c) | Private activity obligations whose interest is subject to the federal alternative minimum tax for individuals. |
| (d) | Information in this report regarding holdings by state and security types does not reflect the holdings of the Fidelity Municipal Cash Central Fund. |
| (e) | Affiliated fund that is generally available only to investment companies and other accounts managed by Fidelity Investments. The rate quoted is the annualized seven-day yield of the fund at period end. A complete unaudited listing of the fund's holdings as of its most recent quarter end is available upon request. In addition, each Fidelity Central Fund's financial statements, which are not covered by the Fund's Report of Independent Registered Public Accounting Firm, are available on the SEC's website or upon request. |
| Affiliate (Amounts in thousands) | Value, beginning of period ($) | Purchases ($) | Sales Proceeds ($) | Dividend Income ($) | Realized Gain (loss) ($) | Change in Unrealized appreciation (depreciation) ($) | Value, end of period ($) | % ownership, end of period |
| Fidelity Municipal Cash Central Fund 4.36% | - | 204,090 | 197,514 | 394 | - | 1 | 6,577 | 0.3% |
| Total | - | 204,090 | 197,514 | 394 | - | 1 | 6,577 | |
| Valuation Inputs at Reporting Date: | ||||
Description (Amounts in thousands) | Total ($) | Level 1 ($) | Level 2 ($) | Level 3 ($) |
Investments in Securities: | ||||
| Municipal Securities | 1,217,675 | - | 1,217,675 | - |
| Money Market Funds | 6,577 | 6,577 | - | - |
| Total Investments in Securities: | 1,224,252 | 6,577 | 1,217,675 | - |
| Statement of Assets and Liabilities | ||||
| Amounts in thousands (except per-share amounts) | January 31, 2024 | |||
| Assets | ||||
| Investment in securities, at value - See accompanying schedule: | ||||
Unaffiliated issuers (cost $1,236,807) | $ | 1,217,675 | ||
Fidelity Central Funds (cost $6,576) | 6,577 | |||
| Total Investment in Securities (cost $1,243,383) | $ | 1,224,252 | ||
| Cash | 100 | |||
| Receivable for fund shares sold | 695 | |||
| Interest receivable | 11,639 | |||
| Distributions receivable from Fidelity Central Funds | 28 | |||
| Prepaid expenses | 1 | |||
Total assets | 1,236,715 | |||
| Liabilities | ||||
| Payable for fund shares redeemed | $ | 402 | ||
| Distributions payable | 1,029 | |||
| Accrued management fee | 354 | |||
| Distribution and service plan fees payable | 11 | |||
| Other affiliated payables | 110 | |||
| Other payables and accrued expenses | 58 | |||
| Total Liabilities | 1,964 | |||
| Net Assets | $ | 1,234,751 | ||
| Net Assets consist of: | ||||
| Paid in capital | $ | 1,291,148 | ||
| Total accumulated earnings (loss) | (56,397) | |||
| Net Assets | $ | 1,234,751 | ||
| Net Asset Value and Maximum Offering Price | ||||
| Class A : | ||||
Net Asset Value and redemption price per share ($31,611 ÷ 2,549 shares)(a) | $ | 12.40 | ||
| Maximum offering price per share (100/96.00 of $12.40) | $ | 12.92 | ||
| Class M : | ||||
Net Asset Value and redemption price per share ($4,222 ÷ 340 shares)(a)(b) | $ | 12.41 | ||
| Maximum offering price per share (100/96.00 of $12.41) | $ | 12.93 | ||
| Class C : | ||||
Net Asset Value and offering price per share ($4,321 ÷ 348 shares)(a)(b) | $ | 12.40 | ||
| New York Municipal Income : | ||||
Net Asset Value, offering price and redemption price per share ($1,126,404 ÷ 90,783 shares) | $ | 12.41 | ||
| Class I : | ||||
Net Asset Value, offering price and redemption price per share ($45,211 ÷ 3,648 shares) | $ | 12.39 | ||
| Class Z : | ||||
Net Asset Value, offering price and redemption price per share ($22,982 ÷ 1,855 shares) | $ | 12.39 | ||
(a)Redemption price per share is equal to net asset value less any applicable contingent deferred sales charge. | ||||
(b)Corresponding Net Asset Value does not calculate due to rounding of fractional net assets and/or shares. | ||||
| Statement of Operations | ||||
| Amounts in thousands | Year ended January 31, 2024 | |||
| Investment Income | ||||
| Interest | $ | 39,214 | ||
| Income from Fidelity Central Funds | 394 | |||
| Total Income | 39,608 | |||
| Expenses | ||||
| Management fee | $ | 4,170 | ||
| Transfer agent fees | 1,066 | |||
| Distribution and service plan fees | 154 | |||
| Accounting fees and expenses | 239 | |||
| Custodian fees and expenses | 13 | |||
| Independent trustees' fees and expenses | 4 | |||
| Registration fees | 93 | |||
| Audit | 59 | |||
| Legal | 9 | |||
| Miscellaneous | 12 | |||
| Total expenses before reductions | 5,819 | |||
| Expense reductions | (51) | |||
| Total expenses after reductions | 5,768 | |||
| Net Investment income (loss) | 33,840 | |||
| Realized and Unrealized Gain (Loss) | ||||
| Net realized gain (loss) on: | ||||
| Investment Securities: | ||||
| Unaffiliated issuers | (11,872) | |||
| Total net realized gain (loss) | (11,872) | |||
| Change in net unrealized appreciation (depreciation) on: | ||||
| Investment Securities: | ||||
| Unaffiliated issuers | 22,945 | |||
| Fidelity Central Funds | 1 | |||
| Total change in net unrealized appreciation (depreciation) | 22,946 | |||
| Net gain (loss) | 11,074 | |||
| Net increase (decrease) in net assets resulting from operations | $ | 44,914 | ||
| Statement of Changes in Net Assets | ||||
| Amount in thousands | Year ended January 31, 2024 | Year ended January 31, 2023 | ||
| Increase (Decrease) in Net Assets | ||||
| Operations | ||||
| Net investment income (loss) | $ | 33,840 | $ | 32,467 |
| Net realized gain (loss) | (11,872) | (26,842) | ||
| Change in net unrealized appreciation (depreciation) | 22,946 | (87,257) | ||
| Net increase (decrease) in net assets resulting from operations | 44,914 | (81,632) | ||
| Distributions to shareholders | (32,646) | (34,385) | ||
| Share transactions - net increase (decrease) | (15,328) | (351,098) | ||
| Total increase (decrease) in net assets | (3,060) | (467,115) | ||
| Net Assets | ||||
| Beginning of period | 1,237,811 | 1,704,926 | ||
| End of period | $ | 1,234,751 | $ | 1,237,811 |
| Fidelity Advisor® New York Municipal Income Fund Class A |
| Years ended January 31, | 2024 | 2023 | 2022 | 2021 | 2020 | |||||
Selected Per-Share Data | ||||||||||
| Net asset value, beginning of period | $ | 12.28 | $ | 13.19 | $ | 13.75 | $ | 13.71 | $ | 12.96 |
| Income from Investment Operations | ||||||||||
Net investment income (loss) A,B | .303 | .261 | .248 | .270 | .287 | |||||
| Net realized and unrealized gain (loss) | .108 | (.894) | (.462) | .105 | .804 | |||||
| Total from investment operations | .411 | (.633) | (.214) | .375 | 1.091 | |||||
| Distributions from net investment income | (.291) | (.260) | (.248) | (.270) | (.287) | |||||
| Distributions from net realized gain | - | (.017) | (.098) | (.065) | (.054) | |||||
| Total distributions | (.291) | (.277) | (.346) | (.335) | (.341) | |||||
| Net asset value, end of period | $ | 12.40 | $ | 12.28 | $ | 13.19 | $ | 13.75 | $ | 13.71 |
Total Return C,D | 3.45% | (4.75)% | (1.61)% | 2.81% | 8.51% | |||||
Ratios to Average Net Assets B,E,F | ||||||||||
| Expenses before reductions | .78% | .78% | .77% | .78% | .79% | |||||
| Expenses net of fee waivers, if any | .77% | .78% | .77% | .78% | .79% | |||||
| Expenses net of all reductions | .77% | .78% | .77% | .78% | .79% | |||||
| Net investment income (loss) | 2.51% | 2.14% | 1.81% | 2.01% | 2.14% | |||||
| Supplemental Data | ||||||||||
| Net assets, end of period (in millions) | $ | 32 | $ | 34 | $ | 41 | $ | 43 | $ | 42 |
Portfolio turnover rate G | 15% | 17% | 16% | 16% | 15% |
| Fidelity Advisor® New York Municipal Income Fund Class M |
| Years ended January 31, | 2024 | 2023 | 2022 | 2021 | 2020 | |||||
Selected Per-Share Data | ||||||||||
| Net asset value, beginning of period | $ | 12.29 | $ | 13.21 | $ | 13.76 | $ | 13.73 | $ | 12.97 |
| Income from Investment Operations | ||||||||||
Net investment income (loss) A,B | .309 | .268 | .254 | .275 | .293 | |||||
| Net realized and unrealized gain (loss) | .108 | (.904) | (.452) | .095 | .814 | |||||
| Total from investment operations | .417 | (.636) | (.198) | .370 | 1.107 | |||||
| Distributions from net investment income | (.297) | (.267) | (.254) | (.275) | (.293) | |||||
| Distributions from net realized gain | - | (.017) | (.098) | (.065) | (.054) | |||||
| Total distributions | (.297) | (.284) | (.352) | (.340) | (.347) | |||||
| Net asset value, end of period | $ | 12.41 | $ | 12.29 | $ | 13.21 | $ | 13.76 | $ | 13.73 |
Total Return C,D | 3.50% | (4.77)% | (1.50)% | 2.77% | 8.63% | |||||
Ratios to Average Net Assets B,E,F | ||||||||||
| Expenses before reductions | .73% | .72% | .74% | .75% | .74% | |||||
| Expenses net of fee waivers, if any | .73% | .72% | .73% | .75% | .74% | |||||
| Expenses net of all reductions | .73% | .72% | .73% | .75% | .74% | |||||
| Net investment income (loss) | 2.56% | 2.20% | 1.85% | 2.05% | 2.18% | |||||
| Supplemental Data | ||||||||||
| Net assets, end of period (in millions) | $ | 4 | $ | 4 | $ | 6 | $ | 7 | $ | 8 |
Portfolio turnover rate G | 15% | 17% | 16% | 16% | 15% |
| Fidelity Advisor® New York Municipal Income Fund Class C |
| Years ended January 31, | 2024 | 2023 | 2022 | 2021 | 2020 | |||||
Selected Per-Share Data | ||||||||||
| Net asset value, beginning of period | $ | 12.28 | $ | 13.19 | $ | 13.75 | $ | 13.71 | $ | 12.96 |
| Income from Investment Operations | ||||||||||
Net investment income (loss) A,B | .219 | .175 | .148 | .173 | .188 | |||||
| Net realized and unrealized gain (loss) | .108 | (.893) | (.461) | .105 | .804 | |||||
| Total from investment operations | .327 | (.718) | (.313) | .278 | .992 | |||||
| Distributions from net investment income | (.207) | (.175) | (.149) | (.173) | (.188) | |||||
| Distributions from net realized gain | - | (.017) | (.098) | (.065) | (.054) | |||||
| Total distributions | (.207) | (.192) | (.247) | (.238) | (.242) | |||||
| Net asset value, end of period | $ | 12.40 | $ | 12.28 | $ | 13.19 | $ | 13.75 | $ | 13.71 |
Total Return C,D | 2.72% | (5.42)% | (2.33)% | 2.07% | 7.71% | |||||
Ratios to Average Net Assets B,E,F | ||||||||||
| Expenses before reductions | 1.48% | 1.48% | 1.50% | 1.51% | 1.53% | |||||
| Expenses net of fee waivers, if any | 1.48% | 1.48% | 1.50% | 1.51% | 1.52% | |||||
| Expenses net of all reductions | 1.48% | 1.48% | 1.50% | 1.51% | 1.52% | |||||
| Net investment income (loss) | 1.81% | 1.44% | 1.08% | 1.28% | 1.40% | |||||
| Supplemental Data | ||||||||||
| Net assets, end of period (in millions) | $ | 4 | $ | 6 | $ | 9 | $ | 13 | $ | 17 |
Portfolio turnover rate G | 15% | 17% | 16% | 16% | 15% |
| Fidelity® New York Municipal Income Fund |
| Years ended January 31, | 2024 | 2023 | 2022 | 2021 | 2020 | |||||
Selected Per-Share Data | ||||||||||
| Net asset value, beginning of period | $ | 12.29 | $ | 13.20 | $ | 13.75 | $ | 13.72 | $ | 12.96 |
| Income from Investment Operations | ||||||||||
Net investment income (loss) A,B | .341 | .300 | .292 | .314 | .331 | |||||
| Net realized and unrealized gain (loss) | .108 | (.894) | (.452) | .095 | .814 | |||||
| Total from investment operations | .449 | (.594) | (.160) | .409 | 1.145 | |||||
| Distributions from net investment income | (.329) | (.299) | (.292) | (.314) | (.331) | |||||
| Distributions from net realized gain | - | (.017) | (.098) | (.065) | (.054) | |||||
| Total distributions | (.329) | (.316) | (.390) | (.379) | (.385) | |||||
| Net asset value, end of period | $ | 12.41 | $ | 12.29 | $ | 13.20 | $ | 13.75 | $ | 13.72 |
Total Return C | 3.77% | (4.45)% | (1.22)% | 3.07% | 8.94% | |||||
Ratios to Average Net Assets B,D,E | ||||||||||
| Expenses before reductions | .47% | .47% | .46% | .46% | .46% | |||||
| Expenses net of fee waivers, if any | .46% | .46% | .46% | .46% | .46% | |||||
| Expenses net of all reductions | .46% | .46% | .45% | .46% | .46% | |||||
| Net investment income (loss) | 2.83% | 2.45% | 2.13% | 2.34% | 2.47% | |||||
| Supplemental Data | ||||||||||
| Net assets, end of period (in millions) | $ | 1,126 | $ | 1,140 | $ | 1,576 | $ | 1,600 | $ | 1,734 |
Portfolio turnover rate F | 15% | 17% | 16% | 16% | 15% |
| Fidelity Advisor® New York Municipal Income Fund Class I |
| Years ended January 31, | 2024 | 2023 | 2022 | 2021 | 2020 | |||||
Selected Per-Share Data | ||||||||||
| Net asset value, beginning of period | $ | 12.27 | $ | 13.18 | $ | 13.74 | $ | 13.70 | $ | 12.95 |
| Income from Investment Operations | ||||||||||
Net investment income (loss) A,B | .331 | .290 | .281 | .303 | .320 | |||||
| Net realized and unrealized gain (loss) | .108 | (.894) | (.462) | .105 | .805 | |||||
| Total from investment operations | .439 | (.604) | (.181) | .408 | 1.125 | |||||
| Distributions from net investment income | (.319) | (.289) | (.281) | (.303) | (.321) | |||||
| Distributions from net realized gain | - | (.017) | (.098) | (.065) | (.054) | |||||
| Total distributions | (.319) | (.306) | (.379) | (.368) | (.375) | |||||
| Net asset value, end of period | $ | 12.39 | $ | 12.27 | $ | 13.18 | $ | 13.74 | $ | 13.70 |
Total Return C | 3.69% | (4.53)% | (1.38)% | 3.07% | 8.79% | |||||
Ratios to Average Net Assets B,D,E | ||||||||||
| Expenses before reductions | .55% | .54% | .54% | .53% | .53% | |||||
| Expenses net of fee waivers, if any | .54% | .54% | .53% | .53% | .53% | |||||
| Expenses net of all reductions | .54% | .54% | .53% | .53% | .53% | |||||
| Net investment income (loss) | 2.75% | 2.38% | 2.05% | 2.26% | 2.39% | |||||
| Supplemental Data | ||||||||||
| Net assets, end of period (in millions) | $ | 45 | $ | 40 | $ | 52 | $ | 55 | $ | 54 |
Portfolio turnover rate F | 15% | 17% | 16% | 16% | 15% |
| Fidelity Advisor® New York Municipal Income Fund Class Z |
| Years ended January 31, | 2024 | 2023 | 2022 | 2021 | 2020 | |||||
Selected Per-Share Data | ||||||||||
| Net asset value, beginning of period | $ | 12.27 | $ | 13.18 | $ | 13.74 | $ | 13.70 | $ | 12.95 |
| Income from Investment Operations | ||||||||||
Net investment income (loss) A,B | .344 | .303 | .295 | .317 | .334 | |||||
| Net realized and unrealized gain (loss) | .109 | (.894) | (.461) | .105 | .804 | |||||
| Total from investment operations | .453 | (.591) | (.166) | .422 | 1.138 | |||||
| Distributions from net investment income | (.333) | (.302) | (.296) | (.317) | (.334) | |||||
| Distributions from net realized gain | - | (.017) | (.098) | (.065) | (.054) | |||||
| Total distributions | (.333) | (.319) | (.394) | (.382) | (.388) | |||||
| Net asset value, end of period | $ | 12.39 | $ | 12.27 | $ | 13.18 | $ | 13.74 | $ | 13.70 |
Total Return C | 3.81% | (4.43)% | (1.27)% | 3.17% | 8.89% | |||||
Ratios to Average Net Assets B,D,E | ||||||||||
| Expenses before reductions | .43% | .43% | .43% | .43% | .43% | |||||
| Expenses net of fee waivers, if any | .43% | .43% | .42% | .43% | .43% | |||||
| Expenses net of all reductions | .43% | .43% | .42% | .43% | .43% | |||||
| Net investment income (loss) | 2.86% | 2.49% | 2.16% | 2.36% | 2.49% | |||||
| Supplemental Data | ||||||||||
| Net assets, end of period (in millions) | $ | 23 | $ | 13 | $ | 20 | $ | 9 | $ | 6 |
Portfolio turnover rate F | 15% | 17% | 16% | 16% | 15% |
| Fidelity Central Fund | Investment Manager | Investment Objective | Investment Practices | Expense RatioA |
| Fidelity Money Market Central Funds | Fidelity Management & Research Company LLC (FMR) | Each fund seeks to obtain a high level of current income consistent with the preservation of capital and liquidity. | Short-term Investments | Less than .005% |
| Gross unrealized appreciation | $24,665 |
| Gross unrealized depreciation | (42,414) |
| Net unrealized appreciation (depreciation) | $(17,749) |
| Tax Cost | $1,242,001 |
| Undistributed tax-exempt income | $66 |
| Capital loss carryforward | $(38,714) |
| Net unrealized appreciation (depreciation) on securities and other investments | $(17,749) |
Short-term | $(9,659) |
Long-term | (29,055) |
| Total capital loss carryforward | $(38,714) |
| January 31, 2024 | January 31, 2023 | |
| Tax-exempt Income | $32,646 | $32,278 |
| Long-term Capital Gains | - | 2,107 |
| Total | $32,646 | $34,385 |
| Purchases ($) | Sales ($) | |
| Fidelity New York Municipal Income Fund | 202,228 | 173,810 |
| Distribution Fee | Service Fee | Total Fees | Retained by FDC | |
| Class A | - % | .25% | $83 | $ 3 |
| Class M | - % | .25% | 12 | -A |
| Class C | .75% | .25% | 59 | 5 |
| $154 | $8 |
| Retained by FDC | |
| Class A | $1 |
| Class M | $-A |
| $1 |
| % of Class-Level Average Net Assets | |
| Class A | 0.1465 |
| Class M | 0.1020 |
| Class C | 0.0975 |
| New York Municipal Income | 0.0839 |
| Class I | 0.1619 |
| Amount | % of Class-Level Average Net Assets | |
| Class A | $49 | .15 |
| Class M | 5 | .10 |
| Class C | 6 | .10 |
| New York Municipal Income | 932 | .08 |
| Class I | 66 | .16 |
| Class Z | 8 | .05 |
| $1,066 |
| % of Average Net Assets | |
| Fidelity New York Municipal Income Fund | 0.0198 |
| % of Average Net Assets | |
| Fidelity New York Municipal Income Fund | .02 |
| Maximum Management Fee Rate % | |
| Class A | 0.49 |
| Class M | 0.45 |
| Class C | 0.44 |
| New York Municipal Income | 0.43 |
| Class I | 0.51 |
| Class Z | 0.40 |
| Purchases ($) | Sales ($) | Realized Gain (Loss) ($) | |
| Fidelity New York Municipal Income Fund | - | 4,500 | - |
| Amount | |
| Fidelity New York Municipal Income Fund | $2 |
Year ended January 31, 2024 | Year ended January 31, 2023 | |
| Fidelity New York Municipal Income Fund | ||
| Distributions to shareholders | ||
| Class A | $806 | $845 |
| Class M | 117 | 127 |
| Class C | 101 | 116 |
| New York Municipal Income | 30,094 | 31,897 |
| Class I | 1,069 | 982 |
| Class Z | 459 | 418 |
Total | $32,646 | $34,385 |
| Shares | Shares | Dollars | Dollars | |
Year ended January 31, 2024 | Year ended January 31, 2023 | Year ended January 31, 2024 | Year ended January 31, 2023 | |
| Fidelity New York Municipal Income Fund | ||||
| Class A | ||||
| Shares sold | 321 | 424 | $3,875 | $5,191 |
| Reinvestment of distributions | 59 | 61 | 708 | 741 |
| Shares redeemed | (638) | (812) | (7,664) | (9,782) |
| Net increase (decrease) | (258) | (327) | $(3,081) | $(3,850) |
| Class M | ||||
| Shares sold | 121 | 33 | $1,466 | $408 |
| Reinvestment of distributions | 8 | 9 | 92 | 104 |
| Shares redeemed | (139) | (170) | (1,674) | (2,037) |
| Net increase (decrease) | (10) | (128) | $(116) | $(1,525) |
| Class C | ||||
| Shares sold | 93 | 42 | $1,137 | $502 |
| Reinvestment of distributions | 8 | 9 | 99 | 114 |
| Shares redeemed | (268) | (255) | (3,217) | (3,111) |
| Net increase (decrease) | (167) | (204) | $(1,981) | $(2,495) |
| New York Municipal Income | ||||
| Shares sold | 19,120 | 42,002 | $227,745 | $507,549 |
| Reinvestment of distributions | 1,622 | 1,747 | 19,554 | 21,265 |
| Shares redeemed | (22,728) | (70,345) | (271,606) | (857,599) |
| Net increase (decrease) | (1,986) | (26,596) | $(24,307) | $(328,785) |
| Class I | ||||
| Shares sold | 1,525 | 1,646 | $18,128 | $19,824 |
| Reinvestment of distributions | 56 | 56 | 674 | 682 |
| Shares redeemed | (1,184) | (2,422) | (14,131) | (29,665) |
| Net increase (decrease) | 397 | (720) | $4,671 | $(9,159) |
| Class Z | ||||
| Shares sold | 1,167 | 963 | $14,015 | $11,660 |
| Reinvestment of distributions | 18 | 15 | 212 | 185 |
| Shares redeemed | (395) | (1,422) | (4,741) | (17,129) |
| Net increase (decrease) | 790 | (444) | $9,486 | $(5,284) |
| The Example is based on an investment of $1,000 invested at the beginning of the period and held for the entire period (August 1, 2023 to January 31, 2024). |
Annualized Expense Ratio- A | Beginning Account Value August 1, 2023 | Ending Account Value January 31, 2024 | Expenses Paid During Period- C August 1, 2023 to January 31, 2024 | |||||||
| Fidelity® New York Municipal Income Fund | ||||||||||
| Class A | .76% | |||||||||
| Actual | $ 1,000 | $ 1,031.70 | $ 3.89 | |||||||
Hypothetical-B | $ 1,000 | $ 1,021.37 | $ 3.87 | |||||||
| Class M | .71% | |||||||||
| Actual | $ 1,000 | $ 1,032.00 | $ 3.64 | |||||||
Hypothetical-B | $ 1,000 | $ 1,021.63 | $ 3.62 | |||||||
| Class C | 1.45% | |||||||||
| Actual | $ 1,000 | $ 1,028.10 | $ 7.41 | |||||||
Hypothetical-B | $ 1,000 | $ 1,017.90 | $ 7.38 | |||||||
| Fidelity® New York Municipal Income Fund | .45% | |||||||||
| Actual | $ 1,000 | $ 1,033.30 | $ 2.31 | |||||||
Hypothetical-B | $ 1,000 | $ 1,022.94 | $ 2.29 | |||||||
| Class I | .53% | |||||||||
| Actual | $ 1,000 | $ 1,032.90 | $ 2.72 | |||||||
Hypothetical-B | $ 1,000 | $ 1,022.53 | $ 2.70 | |||||||
| Class Z | .42% | |||||||||
| Actual | $ 1,000 | $ 1,033.50 | $ 2.15 | |||||||
Hypothetical-B | $ 1,000 | $ 1,023.09 | $ 2.14 | |||||||
- Highly liquid investments - cash or convertible to cash within three business days or less
- Moderately liquid investments - convertible to cash in three to seven calendar days
- Less liquid investments - can be sold or disposed of, but not settled, within seven calendar days
- Illiquid investments - cannot be sold or disposed of within seven calendar days
| A special meeting of shareholders was held on October 18, 2023. The results of votes taken among shareholders on the proposal before them are reported below. Each vote reported represents one dollar of net asset value held on the record date for the meeting. | ||
| Proposal 1 | ||
| To elect a Board of Trustees. | ||
# of Votes | % of Votes | |
| Abigail P. Johnson | ||
| Affirmative | 1,037,686,236.62 | 92.17 |
| Withheld | 88,203,424.19 | 7.83 |
| TOTAL | 1,125,889,660.81 | 100.00 |
| Jennifer Toolin McAuliffe | ||
| Affirmative | 1,043,475,435.74 | 92.68 |
| Withheld | 82,414,225.07 | 7.32 |
| TOTAL | 1,125,889,660.81 | 100.00 |
| Christine J. Thompson | ||
| Affirmative | 1,042,561,503.82 | 92.60 |
| Withheld | 83,328,156.99 | 7.40 |
| TOTAL | 1,125,889,660.81 | 100.00 |
| Elizabeth S. Acton | ||
| Affirmative | 1,040,114,788.66 | 92.38 |
| Withheld | 85,774,872.15 | 7.62 |
| TOTAL | 1,125,889,660.81 | 100.00 |
| Laura M. Bishop | ||
| Affirmative | 1,039,560,821.74 | 92.33 |
| Withheld | 86,328,839.07 | 7.67 |
| TOTAL | 1,125,889,660.81 | 100.00 |
| Ann E. Dunwoody | ||
| Affirmative | 1,035,310,702.43 | 91.95 |
| Withheld | 90,578,958.38 | 8.05 |
| TOTAL | 1,125,889,660.81 | 100.00 |
| John Engler | ||
| Affirmative | 1,025,483,665.76 | 91.08 |
| Withheld | 100,405,995.05 | 8.92 |
| TOTAL | 1,125,889,660.81 | 100.00 |
| Robert F. Gartland | ||
| Affirmative | 1,039,771,476.35 | 92.35 |
| Withheld | 86,118,184.46 | 7.65 |
| TOTAL | 1,125,889,660.81 | 100.00 |
| Robert W. Helm | ||
| Affirmative | 1,037,116,738.38 | 92.12 |
| Withheld | 88,772,922.43 | 7.88 |
| TOTAL | 1,125,889,660.81 | 100.00 |
| Arthur E. Johnson | ||
| Affirmative | 1,029,438,320.20 | 91.43 |
| Withheld | 96,451,340.61 | 8.57 |
| TOTAL | 1,125,889,660.81 | 100.00 |
| Michael E. Kenneally | ||
| Affirmative | 1,038,752,628.82 | 92.26 |
| Withheld | 87,137,031.99 | 7.74 |
| TOTAL | 1,125,889,660.81 | 100.00 |
| Mark A. Murray | ||
| Affirmative | 1,036,967,725.99 | 92.10 |
| Withheld | 88,921,934.82 | 7.90 |
| TOTAL | 1,125,889,660.81 | 100.00 |
| Carol J. Zierhoffer | ||
| Affirmative | 1,042,942,960.12 | 92.63 |
| Withheld | 82,946,700.69 | 7.37 |
| TOTAL | 1,125,889,660.81 | 100.00 |
| Proposal 1 reflects trust wide proposal and voting results. | ||
 |
Item 2.
Code of Ethics
As of the end of the period, January 31, 2024, Fidelity New York Municipal Trust (the trust) has adopted a code of ethics, as defined in Item 2 of Form N-CSR, that applies to its President and Treasurer and its Chief Financial Officer. A copy of the code of ethics is filed as an exhibit to this Form N-CSR.
Item 3.
Audit Committee Financial Expert
The Board of Trustees of the trust has determined that Elizabeth S. Acton is an audit committee financial expert, as defined in Item 3 of Form N-CSR. Ms. Acton is independent for purposes of Item 3 of Form N-CSR.
Item 4.
Principal Accountant Fees and Services
Fees and Services
The following table presents fees billed by Deloitte & Touche LLP, the member firms of Deloitte Touche Tohmatsu, and their respective affiliates (collectively, “Deloitte Entities”) in each of the last two fiscal years for services rendered to Fidelity New York Municipal Income Fund (the “Fund”):
Services Billed by Deloitte Entities
January 31, 2024 FeesA
Audit Fees | Audit-Related Fees | Tax Fees | All Other Fees | |
Fidelity New York Municipal Income Fund | $44,000 | $- | $7,400 | $1,100 |
January 31, 2023 FeesA
Audit Fees | Audit-Related Fees | Tax Fees | All Other Fees | |
Fidelity New York Municipal Income Fund | $44,200 | $- | $7,700 | $1,000 |
A Amounts may reflect rounding.
The following table(s) present(s) fees billed by Deloitte Entities that were required to be approved by the Audit Committee for services that relate directly to the operations and
financial reporting of the Fund(s) and that are rendered on behalf of Fidelity Management & Research Company LLC ("FMR") and entities controlling, controlled by, or under common control with FMR (not including any sub-adviser whose role is primarily portfolio management and is subcontracted with or overseen by another investment adviser) that provide ongoing services to the Fund(s) (“Fund Service Providers”):
Services Billed by Deloitte Entities
January 31, 2024A | January 31, 2023A | |
Audit-Related Fees | $- | $- |
Tax Fees | $- | $- |
All Other Fees | $935,000 | $- |
A Amounts may reflect rounding.
“Audit-Related Fees” represent fees billed for assurance and related services that are reasonably related to the performance of the fund audit or the review of the fund's financial statements and that are not reported under Audit Fees.
“Tax Fees” represent fees billed for tax compliance, tax advice or tax planning that relate directly to the operations and financial reporting of the fund.
“All Other Fees” represent fees billed for services provided to the fund or Fund Service Provider, a significant portion of which are assurance related, that relate directly to the operations and financial reporting of the fund, excluding those services that are reported under Audit Fees, Audit-Related Fees or Tax Fees.
Assurance services must be performed by an independent public accountant.
* * *
The aggregate non-audit fees billed by Deloitte Entities for services rendered to the Fund(s), FMR (not including any sub-adviser whose role is primarily portfolio management and is subcontracted with or overseen by another investment adviser), and any Fund Service Provider for each of the last two fiscal years of the Fund(s) are as follows:
Billed By | January 31, 2024A | January 31, 2023A |
Deloitte Entities | $1,198,500 | $251,300 |
A Amounts may reflect rounding.
The trust's Audit Committee has considered non-audit services that were not pre-approved that were provided by Deloitte Entities to Fund Service Providers to be compatible with maintaining the independence of Deloitte Entities in its(their) audit of the Fund(s), taking into account representations from Deloitte Entities, in accordance with Public Company Accounting Oversight Board rules, regarding its independence from the Fund(s) and its(their) related entities and FMR’s review of the appropriateness and permissibility under applicable law of such non-audit services prior to their provision to the Fund(s) Service Providers.
Audit Committee Pre-Approval Policies and Procedures
The trust’s Audit Committee must pre-approve all audit and non-audit services provided by a fund’s independent registered public accounting firm relating to the operations or financial reporting of the fund. Prior to the commencement of any audit or non-audit services to a fund, the Audit Committee reviews the services to determine whether they are appropriate and permissible under applicable law.
The Audit Committee has adopted policies and procedures to, among other purposes, provide a framework for the Committee’s consideration of non-audit services by the audit firms that audit the Fidelity funds. The policies and procedures require that any non-audit service provided by a fund audit firm to a Fidelity fund and any non-audit service provided by a fund auditor to a Fund Service Provider that relates directly to the operations and financial reporting of a Fidelity fund (“Covered Service”) are subject to approval by the Audit Committee before such service is provided.
All Covered Services must be approved in advance of provision of the service either: (i) by formal resolution of the Audit Committee, or (ii) by oral or written approval of the service by the Chair of the Audit Committee (or if the Chair is unavailable, such other member of the Audit Committee as may be designated by the Chair to act in the Chair’s absence). The approval contemplated by (ii) above is permitted where the Treasurer determines that action on such an engagement is necessary before the next meeting of the Audit Committee.
Non-audit services provided by a fund audit firm to a Fund Service Provider that do not relate directly to the operations and financial reporting of a Fidelity fund are reported to the Audit Committee periodically.
Non-Audit Services Approved Pursuant to Rule 2-01(c)(7)(i)(C) and (ii) of Regulation S-X (“De Minimis Exception”)
There were no non-audit services approved or required to be approved by the Audit Committee pursuant to the De Minimis Exception during the Fund’s(s’) last two fiscal years relating to services provided to (i) the Fund(s) or (ii) any Fund Service Provider that relate directly to the operations and financial reporting of the Fund(s).
The Registrant has not retained, for the preparation of the audit report on the financial statements included in the Form N-CSR, a registered public accounting firm that has a branch or office that is located in a foreign jurisdiction and that the Public Company Accounting Oversight Board (the “PCAOB”) has determined that the PCAOB is unable to inspect or investigate completely because of a position taken by an authority in the foreign jurisdiction.
The Registrant is not a “foreign issuer,” as defined in 17 CFR 240.3b-4.
Item 5.
Audit Committee of Listed Registrants
Not applicable.
Item 6.
Investments
(a)
Not applicable.
(b)
Not applicable.
Item 7.
Disclosure of Proxy Voting Policies and Procedures for Closed-End Management Investment Companies
Not applicable.
Item 8.
Portfolio Managers of Closed-End Management Investment Companies
Not applicable.
Item 9.
Purchase of Equity Securities by Closed-End Management Investment Company and Affiliated Purchasers
Not applicable.
Item 10.
Submission of Matters to a Vote of Security Holders
There were no material changes to the procedures by which shareholders may recommend nominees to the trust’s Board of Trustees.
Item 11.
Controls and Procedures
(a)(i) The President and Treasurer and the Chief Financial Officer have concluded that the trust’s disclosure controls and procedures (as defined in Rule 30a-3(c) under the Investment Company Act) provide reasonable assurances that material information relating to the trust is made known to them by the appropriate persons, based on their evaluation of these controls and procedures as of a date within 90 days of the filing date of this report.
(a)(ii) There was no change in the trust’s internal control over financial reporting (as defined in Rule 30a-3(d) under the Investment Company Act) that occurred during the period covered by this report that has materially affected, or is reasonably likely to materially affect, the trust’s internal control over financial reporting.
Item 12.
Disclosure of Securities Lending Activities for Closed-End Management
Investment Companies
Not applicable.
Item 18.
Recovery of Erroneously Awarded Compensation
(a)
Not applicable.
(b)
Not applicable.
Item 19.
Exhibits
(a) | (1) | Code of Ethics pursuant to Item 2 of Form N-CSR is filed and attached hereto as EX-99.CODE ETH. |
(a) | (2) | |
(a) | (3) | Not applicable. |
(b) |
SIGNATURES
Pursuant to the requirements of the Securities Exchange Act of 1934 and the Investment Company Act of 1940, the registrant has duly caused this report to be signed on its behalf by the undersigned, thereunto duly authorized.
Fidelity New York Municipal Trust
By: | /s/Laura M. Del Prato |
Laura M. Del Prato | |
President and Treasurer | |
Date: | March 21, 2024 |
Pursuant to the requirements of the Securities Exchange Act of 1934 and the Investment Company Act of 1940, this report has been signed below by the following persons on behalf of the registrant and in the capacities and on the dates indicated.
By: | /s/Laura M. Del Prato |
Laura M. Del Prato | |
President and Treasurer | |
Date: | March 21, 2024 |
By: | /s/John J. Burke III |
John J. Burke III | |
Chief Financial Officer | |
Date: | March 21, 2024 |