UNITED STATES
SECURITIES AND EXCHANGE COMMISSION
Washington, D.C. 20549
FORM N-CSR
CERTIFIED SHAREHOLDER REPORT OF REGISTERED
MANAGEMENT INVESTMENT COMPANIES
Investment Company Act file number 811-03723
Fidelity New York Municipal Trust
(Exact name of registrant as specified in charter)
245 Summer St., Boston, MA 02210
(Address of principal executive offices) (Zip code)
Margaret Carey, Secretary
245 Summer St.
Boston, Massachusetts 02210
(Name and address of agent for service)
Registrant's telephone number, including area code:
617-563-7000
| |
Date of fiscal year end: | January 31 |
|
|
Date of reporting period: | July 31, 2024 |
Item 1.
Reports to Stockholders
| |
| | SEMI-ANNUAL SHAREHOLDER REPORT | AS OF JULY 31, 2024 | |
| | Fidelity® New York Municipal Income Fund Fidelity Advisor® New York Municipal Income Fund Class A : FNMAX |
| | | |
This semi-annual shareholder report contains information about Fidelity® New York Municipal Income Fund for the period February 1, 2024 to July 31, 2024. You can find additional information about the Fund at fundresearch.fidelity.com/prospectus/sec. You can also request this information by contacting us at 1-877-208-0098 or by sending an e-mail to fidfunddocuments@fidelity.com.
What were your Fund costs for the last six months?(based on hypothetical $10,000 investment)
| | Costs of a $10,000 investment | Costs paid as a percentage of a $10,000 investment | |
| Class A | $ 38 | 0.77% | |
Key Fund Statistics (as of July 31, 2024)
KEY FACTS | | |
| Fund Size | $1,224,414,030 | |
| Number of Holdings | 386 | |
| Portfolio Turnover | 8% | |
What did the Fund invest in?
(as of July 31, 2024)
REVENUE SOURCES (% of Fund's net assets) |
| Transportation | 27.1 | |
| Special Tax | 22.2 | |
| Education | 15.0 | |
| General Obligations | 12.1 | |
| Health Care | 9.2 | |
| Housing | 6.4 | |
| Others(Individually Less Than 5%) | 8.0 | |
| 100.0 | |
| |
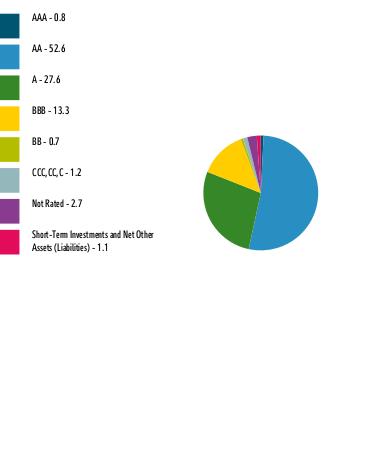
| AAA | 0.8 |
| AA | 52.6 |
| A | 27.6 |
| BBB | 13.3 |
| BB | 0.7 |
| CCC,CC,C | 1.2 |
| Not Rated | 2.7 |
| Short-Term Investments and Net Other Assets (Liabilities) | 1.1 |
QUALITY DIVERSIFICATION (% of Fund's net assets) |
|
| |
| We have used ratings from Moody's Investors Service, Inc. Where Moody's® ratings are not available, we have used S&P® ratings. All ratings are as of the date indicated and do not reflect subsequent changes. |
| Fidelity, the Fidelity Investments Logo and all other Fidelity trademarks or service marks used herein are trademarks or service marks of FMR LLC. Any third-party marks that are used herein are trademarks or service marks of their respective owners. © 2024 FMR LLC. All rights reserved. |
| | For additional information about the Fund; including its prospectus, financial information, holdings and proxy information, scan the QR code or visit fundresearch.fidelity.com/prospectus/sec 1.9914419.100 1105-TSRS-0924 |
| |
| | SEMI-ANNUAL SHAREHOLDER REPORT | AS OF JULY 31, 2024 | |
| | Fidelity® New York Municipal Income Fund Fidelity Advisor® New York Municipal Income Fund Class I : FEMIX |
| | | |
This semi-annual shareholder report contains information about Fidelity® New York Municipal Income Fund for the period February 1, 2024 to July 31, 2024. You can find additional information about the Fund at fundresearch.fidelity.com/prospectus/sec. You can also request this information by contacting us at 1-877-208-0098 or by sending an e-mail to fidfunddocuments@fidelity.com.
What were your Fund costs for the last six months?(based on hypothetical $10,000 investment)
| | Costs of a $10,000 investment | Costs paid as a percentage of a $10,000 investment | |
| Class I | $ 27 | 0.53% | |
Key Fund Statistics (as of July 31, 2024)
KEY FACTS | | |
| Fund Size | $1,224,414,030 | |
| Number of Holdings | 386 | |
| Portfolio Turnover | 8% | |
What did the Fund invest in?
(as of July 31, 2024)
REVENUE SOURCES (% of Fund's net assets) |
| Transportation | 27.1 | |
| Special Tax | 22.2 | |
| Education | 15.0 | |
| General Obligations | 12.1 | |
| Health Care | 9.2 | |
| Housing | 6.4 | |
| Others(Individually Less Than 5%) | 8.0 | |
| 100.0 | |
| |
| AAA | 0.8 |
| AA | 52.6 |
| A | 27.6 |
| BBB | 13.3 |
| BB | 0.7 |
| CCC,CC,C | 1.2 |
| Not Rated | 2.7 |
| Short-Term Investments and Net Other Assets (Liabilities) | 1.1 |
QUALITY DIVERSIFICATION (% of Fund's net assets) |
|
| |
| We have used ratings from Moody's Investors Service, Inc. Where Moody's® ratings are not available, we have used S&P® ratings. All ratings are as of the date indicated and do not reflect subsequent changes. |
| Fidelity, the Fidelity Investments Logo and all other Fidelity trademarks or service marks used herein are trademarks or service marks of FMR LLC. Any third-party marks that are used herein are trademarks or service marks of their respective owners. © 2024 FMR LLC. All rights reserved. |
| | For additional information about the Fund; including its prospectus, financial information, holdings and proxy information, scan the QR code or visit fundresearch.fidelity.com/prospectus/sec 1.9914422.100 1109-TSRS-0924 |
| |
| | SEMI-ANNUAL SHAREHOLDER REPORT | AS OF JULY 31, 2024 | |
| | Fidelity® New York Municipal Income Fund Fidelity® New York Municipal Income Fund : FTFMX |
| | | |
This semi-annual shareholder report contains information about Fidelity® New York Municipal Income Fund for the period February 1, 2024 to July 31, 2024. You can find additional information about the Fund at fundresearch.fidelity.com/prospectus/sec. You can also request this information by contacting us at 1-800-544-8544 or by sending an e-mail to fidfunddocuments@fidelity.com.
What were your Fund costs for the last six months?(based on hypothetical $10,000 investment)
| | Costs of a $10,000 investment | Costs paid as a percentage of a $10,000 investment | |
| Fidelity® New York Municipal Income Fund | $ 23 | 0.45% | |
Key Fund Statistics (as of July 31, 2024)
KEY FACTS | | |
| Fund Size | $1,224,414,030 | |
| Number of Holdings | 386 | |
| Portfolio Turnover | 8% | |
What did the Fund invest in?
(as of July 31, 2024)
REVENUE SOURCES (% of Fund's net assets) |
| Transportation | 27.1 | |
| Special Tax | 22.2 | |
| Education | 15.0 | |
| General Obligations | 12.1 | |
| Health Care | 9.2 | |
| Housing | 6.4 | |
| Others(Individually Less Than 5%) | 8.0 | |
| 100.0 | |
| |
| AAA | 0.8 |
| AA | 52.6 |
| A | 27.6 |
| BBB | 13.3 |
| BB | 0.7 |
| CCC,CC,C | 1.2 |
| Not Rated | 2.7 |
| Short-Term Investments and Net Other Assets (Liabilities) | 1.1 |
QUALITY DIVERSIFICATION (% of Fund's net assets) |
|
| |
| We have used ratings from Moody's Investors Service, Inc. Where Moody's® ratings are not available, we have used S&P® ratings. All ratings are as of the date indicated and do not reflect subsequent changes. |
| Fidelity, the Fidelity Investments Logo and all other Fidelity trademarks or service marks used herein are trademarks or service marks of FMR LLC. Any third-party marks that are used herein are trademarks or service marks of their respective owners. © 2024 FMR LLC. All rights reserved. |
| | For additional information about the Fund; including its prospectus, financial information, holdings and proxy information, scan the QR code or visit fundresearch.fidelity.com/prospectus/sec 1.9914424.100 71-TSRS-0924 |
| |
| | SEMI-ANNUAL SHAREHOLDER REPORT | AS OF JULY 31, 2024 | |
| | Fidelity® New York Municipal Income Fund Fidelity Advisor® New York Municipal Income Fund Class Z : FIJAX |
| | | |
This semi-annual shareholder report contains information about Fidelity® New York Municipal Income Fund for the period February 1, 2024 to July 31, 2024. You can find additional information about the Fund at fundresearch.fidelity.com/prospectus/sec. You can also request this information by contacting us at 1-877-208-0098 or by sending an e-mail to fidfunddocuments@fidelity.com.
What were your Fund costs for the last six months?(based on hypothetical $10,000 investment)
| | Costs of a $10,000 investment | Costs paid as a percentage of a $10,000 investment | |
| Class Z | $ 21 | 0.43% | |
Key Fund Statistics (as of July 31, 2024)
KEY FACTS | | |
| Fund Size | $1,224,414,030 | |
| Number of Holdings | 386 | |
| Portfolio Turnover | 8% | |
What did the Fund invest in?
(as of July 31, 2024)
REVENUE SOURCES (% of Fund's net assets) |
| Transportation | 27.1 | |
| Special Tax | 22.2 | |
| Education | 15.0 | |
| General Obligations | 12.1 | |
| Health Care | 9.2 | |
| Housing | 6.4 | |
| Others(Individually Less Than 5%) | 8.0 | |
| 100.0 | |
| |
| AAA | 0.8 |
| AA | 52.6 |
| A | 27.6 |
| BBB | 13.3 |
| BB | 0.7 |
| CCC,CC,C | 1.2 |
| Not Rated | 2.7 |
| Short-Term Investments and Net Other Assets (Liabilities) | 1.1 |
QUALITY DIVERSIFICATION (% of Fund's net assets) |
|
| |
| We have used ratings from Moody's Investors Service, Inc. Where Moody's® ratings are not available, we have used S&P® ratings. All ratings are as of the date indicated and do not reflect subsequent changes. |
| Fidelity, the Fidelity Investments Logo and all other Fidelity trademarks or service marks used herein are trademarks or service marks of FMR LLC. Any third-party marks that are used herein are trademarks or service marks of their respective owners. © 2024 FMR LLC. All rights reserved. |
| | For additional information about the Fund; including its prospectus, financial information, holdings and proxy information, scan the QR code or visit fundresearch.fidelity.com/prospectus/sec 1.9914423.100 3232-TSRS-0924 |
| |
| | SEMI-ANNUAL SHAREHOLDER REPORT | AS OF JULY 31, 2024 | |
| | Fidelity® New York Municipal Income Fund Fidelity Advisor® New York Municipal Income Fund Class M : FNYPX |
| | | |
This semi-annual shareholder report contains information about Fidelity® New York Municipal Income Fund for the period February 1, 2024 to July 31, 2024. You can find additional information about the Fund at fundresearch.fidelity.com/prospectus/sec. You can also request this information by contacting us at 1-877-208-0098 or by sending an e-mail to fidfunddocuments@fidelity.com.
What were your Fund costs for the last six months?(based on hypothetical $10,000 investment)
| | Costs of a $10,000 investment | Costs paid as a percentage of a $10,000 investment | |
| Class M | $ 36 | 0.72% | |
Key Fund Statistics (as of July 31, 2024)
KEY FACTS | | |
| Fund Size | $1,224,414,030 | |
| Number of Holdings | 386 | |
| Portfolio Turnover | 8% | |
What did the Fund invest in?
(as of July 31, 2024)
REVENUE SOURCES (% of Fund's net assets) |
| Transportation | 27.1 | |
| Special Tax | 22.2 | |
| Education | 15.0 | |
| General Obligations | 12.1 | |
| Health Care | 9.2 | |
| Housing | 6.4 | |
| Others(Individually Less Than 5%) | 8.0 | |
| 100.0 | |
| |
| AAA | 0.8 |
| AA | 52.6 |
| A | 27.6 |
| BBB | 13.3 |
| BB | 0.7 |
| CCC,CC,C | 1.2 |
| Not Rated | 2.7 |
| Short-Term Investments and Net Other Assets (Liabilities) | 1.1 |
QUALITY DIVERSIFICATION (% of Fund's net assets) |
|
| |
| We have used ratings from Moody's Investors Service, Inc. Where Moody's® ratings are not available, we have used S&P® ratings. All ratings are as of the date indicated and do not reflect subsequent changes. |
| Fidelity, the Fidelity Investments Logo and all other Fidelity trademarks or service marks used herein are trademarks or service marks of FMR LLC. Any third-party marks that are used herein are trademarks or service marks of their respective owners. © 2024 FMR LLC. All rights reserved. |
| | For additional information about the Fund; including its prospectus, financial information, holdings and proxy information, scan the QR code or visit fundresearch.fidelity.com/prospectus/sec 1.9914421.100 1108-TSRS-0924 |
| |
| | SEMI-ANNUAL SHAREHOLDER REPORT | AS OF JULY 31, 2024 | |
| | Fidelity® New York Municipal Income Fund Fidelity Advisor® New York Municipal Income Fund Class C : FNYCX |
| | | |
This semi-annual shareholder report contains information about Fidelity® New York Municipal Income Fund for the period February 1, 2024 to July 31, 2024. You can find additional information about the Fund at fundresearch.fidelity.com/prospectus/sec. You can also request this information by contacting us at 1-877-208-0098 or by sending an e-mail to fidfunddocuments@fidelity.com.
What were your Fund costs for the last six months?(based on hypothetical $10,000 investment)
| | Costs of a $10,000 investment | Costs paid as a percentage of a $10,000 investment | |
| Class C | $ 73 | 1.47% | |
Key Fund Statistics (as of July 31, 2024)
KEY FACTS | | |
| Fund Size | $1,224,414,030 | |
| Number of Holdings | 386 | |
| Portfolio Turnover | 8% | |
What did the Fund invest in?
(as of July 31, 2024)
REVENUE SOURCES (% of Fund's net assets) |
| Transportation | 27.1 | |
| Special Tax | 22.2 | |
| Education | 15.0 | |
| General Obligations | 12.1 | |
| Health Care | 9.2 | |
| Housing | 6.4 | |
| Others(Individually Less Than 5%) | 8.0 | |
| 100.0 | |
| |
| AAA | 0.8 |
| AA | 52.6 |
| A | 27.6 |
| BBB | 13.3 |
| BB | 0.7 |
| CCC,CC,C | 1.2 |
| Not Rated | 2.7 |
| Short-Term Investments and Net Other Assets (Liabilities) | 1.1 |
QUALITY DIVERSIFICATION (% of Fund's net assets) |
|
| |
| We have used ratings from Moody's Investors Service, Inc. Where Moody's® ratings are not available, we have used S&P® ratings. All ratings are as of the date indicated and do not reflect subsequent changes. |
| Fidelity, the Fidelity Investments Logo and all other Fidelity trademarks or service marks used herein are trademarks or service marks of FMR LLC. Any third-party marks that are used herein are trademarks or service marks of their respective owners. © 2024 FMR LLC. All rights reserved. |
| | For additional information about the Fund; including its prospectus, financial information, holdings and proxy information, scan the QR code or visit fundresearch.fidelity.com/prospectus/sec 1.9914420.100 1107-TSRS-0924 |
Item 2.
Code of Ethics
Not applicable.
Item 3.
Audit Committee Financial Expert
Not applicable.
Item 4.
Principal Accountant Fees and Services
Not applicable.
Item 5.
Audit Committee of Listed Registrants
Not applicable.
Item 6.
Investments
(a)
Not applicable.
(b)
Not applicable
Item 7.
Financial Statements and Financial Highlights for Open-End Management Investment Companies
Fidelity® New York Municipal Income Fund
Semi-Annual Report
July 31, 2024
Includes Fidelity and Fidelity Advisor share classes
Contents
To view a fund's proxy voting guidelines and proxy voting record for the 12-month period ended June 30, visit http://www.fidelity.com/proxyvotingresults or visit the Securities and Exchange Commission's (SEC) web site at http://www.sec.gov.
You may also call 1-800-544-8544 if you're an individual investing directly with Fidelity, call 1-800-835-5092 if you're a plan sponsor or participant with Fidelity as your recordkeeper or call 1-877-208-0098 on institutional accounts or if you're an advisor or invest through one to request a free copy of the proxy voting guidelines.
Standard & Poor's, S&P and S&P 500 are registered service marks of The McGraw-Hill Companies, Inc. and have been licensed for use by Fidelity Distributors Corporation.
Other third-party marks appearing herein are the property of their respective owners.
All other marks appearing herein are registered or unregistered trademarks or service marks of FMR LLC or an affiliated company. © 2024 FMR LLC. All rights reserved.
This report and the financial statements contained herein are submitted for the general information of the shareholders of the Fund. This report is not authorized for distribution to prospective investors in the Fund unless preceded or accompanied by an effective prospectus.
A fund files its complete schedule of portfolio holdings with the SEC for the first and third quarters of each fiscal year on Form N-PORT. Forms N-PORT are available on the SEC's web site at http://www.sec.gov. A fund's Forms N-PORT may be reviewed and copied at the SEC's Public Reference Room in Washington, DC. Information regarding the operation of the SEC's Public Reference Room may be obtained by calling 1-800-SEC-0330.
For a complete list of a fund's portfolio holdings, view the most recent holdings listing, semiannual report, or annual report on Fidelity's web site at http://www.fidelity.com, http://www.institutional.fidelity.com, or http://www.401k.com, as applicable.
NOT FDIC INSURED •MAY LOSE VALUE •NO BANK GUARANTEE
Neither the Fund nor Fidelity Distributors Corporation is a bank.
Item 7: Financial Statements and Financial Highlights for Open-End Management Investment Companies (Semi-Annual Report)
Fidelity® New York Municipal Income Fund
Schedule of Investments July 31, 2024 (Unaudited)
Showing Percentage of Net Assets
| Municipal Bonds - 98.9% |
| | | Principal Amount (a) (000s) | Value ($) (000s) |
| New York - 87.7% | | | |
| Brighton Central School Distri Series 2020, 2.125% 6/15/32 | | 1,000 | 848 |
| Bronxville Union Free School District Series 2019, 2% 9/15/32 | | 1,000 | 831 |
| Brookhaven Loc Dev. Corp. Series 2020, 4% 11/1/45 | | 1,000 | 917 |
| Buffalo and Erie County Indl. Land Rev. (Catholic Health Sys., Inc. Proj.) Series 2015: | | | |
| 5% 7/1/25 | | 590 | 587 |
| 5% 7/1/26 | | 450 | 446 |
| 5% 7/1/27 | | 600 | 593 |
| 5% 7/1/28 | | 360 | 355 |
| 5% 7/1/29 | | 300 | 295 |
| 5% 7/1/30 | | 575 | 565 |
| 5% 7/1/40 | | 1,000 | 949 |
| 5.25% 7/1/35 | | 1,000 | 984 |
| Dobbs Ferry Series 2017 A, 2.65% 10/15/33 | | 325 | 281 |
| Dorm. Auth. New York Univ. Rev.: | | | |
| (Fordham Univ. Proj.) Series 2017, 5% 7/1/32 | | 1,500 | 1,572 |
| (Orange Reg'l. Med. Ctr. Proj.) Series 2017, 5% 12/1/28 (b) | | 4,000 | 3,976 |
| (St Johns Univ., NY. Proj.) Series 2017 A, 5% 7/1/30 | | 1,250 | 1,302 |
| (State Univ. of New York Proj.) Series 2017 A: | | | |
5% 7/1/32 | | 1,500 | 1,570 |
5% 7/1/34 | | 3,000 | 3,140 |
| Series 2016 A: | | | |
5% 7/1/41 | | 2,500 | 2,544 |
5% 7/1/46 | | 8,000 | 8,098 |
5% 7/1/50 | | 6,280 | 6,340 |
| Series 2017, 5% 12/1/32 (b) | | 4,000 | 3,959 |
| Dutchess County Local Dev. Corp. Rev.: | | | |
| (Health Quest Systems, Inc. Proj.) Series 2016 B, 5% 7/1/46 | | 9,025 | 9,076 |
| (Marist College Proj.) Series 2015 A: | | | |
5% 7/1/27 | | 350 | 355 |
5% 7/1/29 | | 725 | 736 |
5% 7/1/31 | | 2,610 | 2,649 |
5% 7/1/32 | | 2,660 | 2,699 |
5% 7/1/33 | | 2,770 | 2,810 |
5% 7/1/34 | | 2,935 | 2,973 |
| (The Culinary Institute of America Proj.) Series 2018: | | | |
5% 7/1/26 | | 850 | 870 |
5% 7/1/30 | | 1,100 | 1,150 |
5% 7/1/35 | | 855 | 889 |
| Erie County Fiscal Stability Auth. Series 2017 D: | | | |
| 5% 9/1/33 | | 525 | 553 |
| 5% 9/1/34 | | 850 | 896 |
| Farmingdale Union Free School District Series 2020, 2% 9/15/36 | | 330 | 250 |
| Hempstead Local Dev. Corp. Rev.: | | | |
| (Adelphi Univ. Proj.) Series 2021: | | | |
5% 6/1/25 | | 400 | 405 |
5% 6/1/26 | | 550 | 565 |
5% 6/1/28 | | 155 | 164 |
5% 6/1/30 | | 200 | 217 |
5% 6/1/32 | | 200 | 219 |
| (Hofstra Univ. Proj.) Series 2021 A, 3% 7/1/51 | | 14,635 | 10,896 |
| (Molloy College Proj.) Series 2017: | | | |
5% 7/1/32 | | 740 | 755 |
5% 7/1/33 | | 475 | 484 |
| Hudson Yards Infrastructure Corp. New York Rev. Series 2017 A: | | | |
| 3.5% 2/15/38 | | 405 | 384 |
| 5% 2/15/34 | | 6,130 | 6,397 |
| Islip Gen. Oblig. Series 2021 A: | | | |
| 2% 5/1/33 | | 345 | 285 |
| 2% 5/1/37 | | 1,575 | 1,195 |
| Kingston NY City School District Series 2021, 2% 6/15/35 | | 425 | 327 |
| Liberty Dev. Corp. Rev. Series 2005, 5.25% 10/1/35 | | 11,440 | 13,287 |
| Long Island Pwr. Auth. Elec. Sys. Rev.: | | | |
| Series 2020 A: | | | |
5% 9/1/34 | | 1,700 | 1,895 |
5% 9/1/35 | | 1,200 | 1,335 |
5% 9/1/37 | | 500 | 553 |
5% 9/1/38 | | 1,450 | 1,602 |
| Series 2022 A: | | | |
5% 9/1/38 | | 1,275 | 1,447 |
5% 9/1/39 | | 1,375 | 1,552 |
5% 9/1/40 | | 1,500 | 1,682 |
5% 9/1/41 | | 1,375 | 1,533 |
5% 9/1/42 | | 2,000 | 2,220 |
| Series 2023 E: | | | |
5% 9/1/39 | | 1,750 | 1,995 |
5% 9/1/40 | | 1,915 | 2,166 |
5% 9/1/41 | | 2,100 | 2,361 |
5% 9/1/42 | | 2,375 | 2,657 |
| Madison County Cap. Resource Corp. Rev. (Colgate Univ. Rfdg. Proj.) Series 2015 A, 5% 7/1/33 | | 1,000 | 1,016 |
| Mahopac Cent Scd Series 2021, 1.7% 6/1/35 | | 635 | 473 |
| Massapequa Union Free School District Series 2019: | | | |
| 2% 10/1/32 | | 1,745 | 1,465 |
| 2% 10/1/33 | | 1,775 | 1,460 |
| Monroe County Indl. Dev. Corp.: | | | |
| (Highland Hosp. of Rochester Proj.) Series 2020, 3% 7/1/50 | | 4,265 | 3,310 |
| (Rochester Reg'l. Health Proj.) Series 2020 A, 4% 12/1/46 | | 2,500 | 2,283 |
| (The Rochester Gen. Hosp. Proj.) Series 2017: | | | |
5% 12/1/31 | | 1,595 | 1,634 |
5% 12/1/34 | | 760 | 777 |
5% 12/1/35 | | 700 | 715 |
5% 12/1/36 | | 700 | 714 |
| (Univ. of Rochester Proj.): | | | |
Series 2017 A, 5% 7/1/34 | | 1,310 | 1,378 |
Series 2017 C, 4% 7/1/32 | | 1,680 | 1,708 |
| MTA Hudson Rail Yards Trust Oblig. Series 2016 A: | | | |
| 5% 11/15/51 | | 3,000 | 3,000 |
| 5% 11/15/56 | | 9,000 | 9,000 |
| Nassau County Local Econ. Assistance Corp. Series 2014 B, 5% 7/1/27 | | 1,000 | 1,001 |
| New Rochelle City School District Series 2020, 2% 6/15/33 | | 2,625 | 2,213 |
| New Rochelle N Y Series 2020, 2% 2/15/34 | | 590 | 491 |
| New York Bridge Auth. Gen. Rev. Series 2021 A, 4% 1/1/51 | | 1,085 | 1,056 |
| New York City Edl. Construction Fund Series 2021 B, 5% 4/1/52 | | 5,610 | 5,945 |
| New York City Gen. Oblig.: | | | |
| Series 2018 F, 5% 4/1/45 | | 8,485 | 8,791 |
| Series 2018 F1, 3.375% 4/1/38 | | 490 | 471 |
| Series 2019 D: | | | |
5% 12/1/41 | | 4,305 | 4,523 |
5% 12/1/44 | | 9,810 | 10,241 |
| Series 2020 D1, 4% 3/1/44 | | 1,475 | 1,456 |
| Series 2021 A1, 4% 8/1/34 | | 3,250 | 3,354 |
| Series 2021 F1: | | | |
3% 3/1/51 (Build America Mutual Assurance Insured) | | 5,825 | 4,493 |
5% 3/1/43 | | 1,500 | 1,625 |
| Series 2022 A1, 5% 8/1/47 | | 18,895 | 20,282 |
| Series 2022 D1, 5.25% 5/1/38 | | 5,000 | 5,712 |
| Series 2023 F1, 5% 8/1/37 | | 1,000 | 1,134 |
| New York City Hsg. Dev. Corp. Series 2017 G1, 3.45% 11/1/37 | | 1,730 | 1,596 |
| New York City Hsg. Dev. Corp. Multifamily Hsg.: | | | |
| Series 2019 G1B, 3.05% 5/1/50 | | 4,270 | 3,319 |
| Series 2019 J: | | | |
3% 11/1/44 | | 8,030 | 6,515 |
3.05% 11/1/49 | | 9,115 | 7,158 |
| Series 2020 A1C, 2.8% 11/1/45 | | 1,000 | 767 |
| Series 2021 C1, 2.4% 11/1/46 | | 2,535 | 1,767 |
| Series 2021 F1: | | | |
2.1% 11/1/36 | | 2,000 | 1,567 |
2.25% 11/1/41 | | 10,000 | 7,261 |
2.4% 11/1/46 | | 1,000 | 697 |
| Series 2021 I: | | | |
2.45% 11/1/41 | | 6,200 | 4,664 |
2.7% 11/1/51 | | 8,285 | 5,702 |
| Series 2021, 2.65% 11/1/46 | | 7,135 | 5,271 |
| New York City Indl. Dev. Agcy. Rev.: | | | |
| (Queens Baseball Stadium Proj.) Series 2021 A: | | | |
3% 1/1/37 (Assured Guaranty Muni. Corp. Insured) (Assured Guaranty, Inc. Insured) | | 1,000 | 906 |
3% 1/1/46 (Assured Guaranty Muni. Corp. Insured) (Assured Guaranty, Inc. Insured) | | 9,945 | 7,971 |
| (Yankee Stadium Proj.) Series 2020 A, 3% 3/1/49 | | 1,700 | 1,269 |
| New York City Muni. Wtr. Fin. Auth. Wtr. & Swr. Sys. Rev.: | | | |
| Series 2019 DD, 5.25% 6/15/49 | | 4,410 | 4,666 |
| Series 2021 BB1, 3% 6/15/50 | | 4,395 | 3,426 |
| New York City Transitional Fin. Auth. Bldg. Aid Rev.: | | | |
| Series 2018 S4, 5.25% 7/15/36 | | 8,095 | 8,706 |
| Series 2019 S1, 5% 7/15/43 | | 1,715 | 1,792 |
| Series 2022 1A, 3% 7/15/39 | | 1,690 | 1,491 |
| New York City Transitional Fin. Auth. Rev.: | | | |
| Series 2016 A1, 3.25% 8/1/35 | | 325 | 311 |
| Series 2017 E-1, 5% 2/1/34 | | 4,500 | 4,681 |
| Series 2017 F, 5% 5/1/34 | | 7,000 | 7,310 |
| Series 2018 B-1, 5% 8/1/34 | | 3,000 | 3,146 |
| Series 2018 C2, 5% 5/1/37 | | 4,690 | 4,963 |
| Series 2020 C1, 3% 5/1/46 | | 4,200 | 3,396 |
| Series 2021 B1, 4% 8/1/38 | | 1,340 | 1,365 |
| Series 2021 F1, 4% 11/1/38 | | 1,500 | 1,526 |
| Series 2022 B1, 5.25% 11/1/37 | | 6,120 | 7,045 |
| Series 2024 A1: | | | |
5% 5/1/40 | | 5,115 | 5,721 |
5% 5/1/41 | | 8,000 | 8,928 |
| Series C1, 4% 5/1/47 | | 1,000 | 982 |
| New York Convention Ctr. Dev. Corp. Rev.: | | | |
| Series 2015: | | | |
5% 11/15/29 | | 5,000 | 5,091 |
5% 11/15/30 | | 2,000 | 2,035 |
5% 11/15/33 | | 9,115 | 9,271 |
5% 11/15/34 | | 3,000 | 3,051 |
5% 11/15/40 | | 9,990 | 10,098 |
| Series 2016: | | | |
0% 11/15/30 | | 3,400 | 2,675 |
0% 11/15/38 | | 1,275 | 692 |
| New York Dorm. Auth. Rev.: | | | |
| Series 2015 A: | | | |
5% 7/1/28 | | 5,000 | 5,043 |
5% 7/1/29 | | 5,000 | 5,040 |
5% 5/1/30 | | 3,450 | 3,482 |
5% 7/1/30 | | 5,000 | 5,028 |
5% 5/1/31 | | 11,000 | 11,100 |
5% 7/1/31 | | 15,000 | 15,086 |
| Series 2015 B, 5% 10/1/34 | | 1,070 | 1,091 |
| Series 2015: | | | |
5% 12/1/24 (b) | | 600 | 600 |
5% 12/1/27 (b) | | 1,200 | 1,199 |
| Series 2016 A: | | | |
5% 7/1/33 | | 800 | 824 |
5% 7/1/34 | | 650 | 669 |
5% 7/1/35 | | 500 | 515 |
| Series 2018 A, 5% 8/1/35 | | 3,800 | 3,905 |
| Series 2019 1, 2% 7/1/33 | | 7,600 | 6,424 |
| Series 2019 A: | | | |
4% 7/1/40 | | 1,000 | 839 |
4% 7/1/45 | | 3,750 | 3,024 |
5% 7/1/26 | | 545 | 540 |
5% 7/1/27 | | 390 | 385 |
5% 7/1/28 | | 465 | 458 |
5% 7/1/29 | | 750 | 739 |
5% 7/1/30 | | 1,475 | 1,449 |
5% 7/1/32 | | 1,540 | 1,501 |
5% 7/1/33 | | 5,800 | 6,083 |
5% 7/1/34 | | 1,300 | 1,256 |
5% 7/1/35 | | 600 | 578 |
5% 7/1/36 | | 500 | 480 |
5% 7/1/38 | | 3,440 | 3,720 |
5% 7/1/41 | | 1,345 | 1,281 |
5% 7/1/42 | | 8,500 | 9,084 |
| Series 2019 B, 5% 7/1/50 | | 3,000 | 3,148 |
| Series 2020 A: | | | |
3% 7/1/48 | | 5,000 | 4,015 |
4% 9/1/50 | | 7,120 | 6,544 |
4% 7/1/53 | | 5,805 | 5,577 |
5% 7/1/40 | | 1,265 | 1,353 |
| Series 2021 A: | | | |
3% 7/1/41 | | 1,000 | 862 |
4% 7/1/48 | | 4,000 | 3,827 |
5% 7/1/46 | | 1,025 | 1,046 |
5% 7/1/51 | | 3,040 | 3,076 |
| Series 2022 A: | | | |
4% 7/1/49 | | 2,500 | 2,350 |
5% 7/1/35 | | 1,425 | 1,538 |
5% 7/1/36 | | 1,495 | 1,610 |
5% 7/1/37 | | 785 | 844 |
5% 7/15/37 | | 6,500 | 6,855 |
5% 7/1/38 | | 500 | 535 |
5% 7/1/39 | | 865 | 920 |
5% 7/1/40 | | 915 | 967 |
5% 7/1/41 | | 830 | 874 |
5% 7/1/42 | | 1,005 | 1,054 |
| Series 2022: | | | |
4% 7/1/46 | | 4,625 | 4,599 |
5% 7/1/35 | | 1,095 | 1,150 |
5% 7/1/47 | | 5,625 | 5,641 |
5% 7/1/52 | | 4,675 | 4,983 |
| Series 2024 A: | | | |
5.5% 5/1/49 | | 1,500 | 1,648 |
5.5% 7/1/54 | | 7,500 | 8,574 |
5.5% 5/1/56 | | 2,985 | 3,251 |
| New York Dorm. Auth. Revs. (New York Univ. Proj.) Series 2001 1, 5.5% 7/1/40 (AMBAC Insured) | | 3,000 | 3,554 |
| New York Dorm. Auth. Sales Tax Rev.: | | | |
| Series 2018 A: | | | |
5% 3/15/42 | | 9,940 | 10,390 |
5% 3/15/43 | | 9,940 | 10,373 |
| Series 2018 C: | | | |
5% 3/15/35 | | 18,870 | 19,969 |
5% 3/15/43 | | 6,185 | 6,454 |
| Series 2018 E, 5% 3/15/44 | | 5,000 | 5,244 |
| Series 2018, 5% 3/15/48 | | 12,700 | 13,250 |
| New York Envir. Facilities Corp. Clean Wtr. & Drinking Wtr. (New York City Muni. Wtr. Fin. Auth. Proj.) Series 2018 B, 5% 6/15/43 | | 1,000 | 1,050 |
| New York Liberty Dev. Corp.: | | | |
| (Bank of America Tower at One Bryant Park Proj.) Series 2019 1, 2.45% 9/15/69 | | 8,000 | 7,338 |
| (World Trade Ctr. Proj.) Series 2021 A, 3% 11/15/51 | | 5,500 | 4,132 |
| New York Metropolitan Trans. Auth. Rev.: | | | |
| Series 2014 D, 5.25% 11/15/44 | | 5,000 | 5,017 |
| Series 2015 B, 5% 11/15/29 | | 2,125 | 2,148 |
| Series 2015 C, 5% 11/15/35 | | 600 | 608 |
| Series 2016 A1, 5% 11/15/46 | | 22,890 | 23,207 |
| Series 2016 B: | | | |
5% 11/15/34 | | 1,490 | 1,535 |
5% 11/15/35 | | 8,375 | 8,627 |
| Series 2016 C1: | | | |
5% 11/15/31 | | 1,175 | 1,213 |
5% 11/15/32 | | 730 | 753 |
| Series 2016 D: | | | |
5% 11/15/30 | | 1,805 | 1,864 |
5% 11/15/31 | | 665 | 686 |
5.25% 11/15/31 | | 500 | 519 |
| Series 2017 A1, 5% 11/15/51 | | 1,500 | 1,549 |
| Series 2017 C-2: | | | |
0% 11/15/29 | | 15,820 | 13,091 |
0% 11/15/32 | | 18,000 | 13,183 |
| Series 2017 C1: | | | |
5% 11/15/27 | | 620 | 655 |
5% 11/15/30 | | 1,015 | 1,077 |
| Series 2017 D: | | | |
5% 11/15/30 | | 5,000 | 5,305 |
5% 11/15/32 | | 925 | 980 |
| Series 2020 C1, 5% 11/15/50 | | 1,310 | 1,369 |
| New York State Dorm. Auth.: | | | |
| Series 2017 A, 5% 2/15/37 (Pre-Refunded to 2/15/27 @ 100) | | 5 | 5 |
| Series 2019 A, 5% 3/15/46 | | 7,500 | 7,865 |
| Series 2020 A: | | | |
3% 3/15/38 | | 1,590 | 1,439 |
3% 3/15/39 | | 5,000 | 4,442 |
| Series 2021 A, 5% 3/15/49 | | 6,500 | 6,929 |
| Series 2021 E: | | | |
3% 3/15/50 | | 10,285 | 7,994 |
4% 3/15/37 | | 3,700 | 3,805 |
4% 3/15/39 | | 735 | 748 |
| Series 2022 A: | | | |
4% 3/15/39 | | 1,000 | 1,017 |
5% 3/15/41 | | 5,000 | 5,518 |
| Series 2023 A: | | | |
5% 3/15/37 | | 2,625 | 2,989 |
5% 3/15/38 | | 1,645 | 1,866 |
5% 3/15/39 | | 2,100 | 2,367 |
| New York State Hsg. Fin. Agcy. Rev.: | | | |
| Series 2017 K: | | | |
3% 11/1/32 | | 1,500 | 1,377 |
3.3% 11/1/37 | | 1,800 | 1,626 |
| Series 2019 I: | | | |
3.15% 11/1/44 | | 1,500 | 1,253 |
3.25% 11/1/52 | | 5,000 | 3,979 |
| Series 2021 D1, 2.4% 11/1/41 | | 2,740 | 2,038 |
| New York State Mtg. Agcy. Homeowner Mtg.: | | | |
| Series 2020 227, 2.5% 10/1/47 | | 12,730 | 8,961 |
| Series 2021 232, 5% 10/1/28 (c) | | 1,680 | 1,752 |
| Series 221, 3.5% 10/1/32 (c) | | 3,495 | 3,429 |
| Series 223, 3.5% 4/1/49 | | 1,130 | 1,121 |
| Series 226, 3.5% 10/1/50 (c) | | 7,815 | 7,662 |
| New York State Urban Dev. Corp.: | | | |
| Series 2020 A, 5% 3/15/42 | | 2,175 | 2,356 |
| Series 2020 C, 4% 3/15/49 | | 3,165 | 3,079 |
| Series 2022 A, 5% 3/15/40 | | 8,000 | 8,936 |
| New York Thruway Auth. Gen. Rev.: | | | |
| Series 2016 A: | | | |
5% 1/1/41 | | 9,320 | 9,465 |
5% 1/1/51 | | 8,625 | 8,727 |
| Series 2019 B: | | | |
3% 1/1/53 | | 5,405 | 4,077 |
3% 1/1/53 (Assured Guaranty Muni. Corp. Insured) | | 2,000 | 1,521 |
4% 1/1/45 | | 5,000 | 4,892 |
| Series 2020 N, 3% 1/1/50 | | 5,000 | 3,850 |
| New York Thruway Auth. Personal Income Tax Rev. Series 2021 A1, 3% 3/15/50 | | 8,945 | 6,901 |
| New York Trans. Dev. Corp.: | | | |
| (Delta Air Lines, Inc. - Laguardia Arpt. Terminals C&D Redev. Proj.) Series 2023, 6% 4/1/35 (c) | | 5,000 | 5,640 |
| (Delta Air Lines, Inc. Laguardia Arpt. Terminals C&D Redev. Proj.) Series 2018, 5% 1/1/33 (c) | | 5,000 | 5,155 |
| (John F. Kennedy Int'l. Arpt. New Term. One Proj.): | | | |
Series 2023, 5% 6/30/49 (Assured Guaranty Muni. Corp. Insured) (c) | | 5,000 | 5,177 |
Series 2024, 5.5% 6/30/54 (c) | | 8,000 | 8,536 |
| (Laguardia Arpt. Term. B Redev. Proj.) Series 2016 A, 5% 7/1/34 (c) | | 4,000 | 4,005 |
| (Term. 4 JFK Int'l. Arpt. Proj.): | | | |
Series 2020 A: | | | |
4% 12/1/38 (c) | | 600 | 591 |
4% 12/1/41 (c) | | 1,700 | 1,642 |
5% 12/1/31 (c) | | 1,200 | 1,283 |
5% 12/1/33 (c) | | 1,950 | 2,077 |
5% 12/1/35 (c) | | 1,540 | 1,636 |
Series 2020 C: | | | |
5% 12/1/29 | | 1,300 | 1,406 |
5% 12/1/30 | | 500 | 547 |
| (Term. 4 John F. Kennedy Int'l. Arpt. Proj.) Series 2022: | | | |
5% 12/1/35 (c) | | 8,465 | 9,132 |
5% 12/1/36 (c) | | 7,500 | 8,055 |
| New York Urban Dev. Corp. Rev. Series 2019 A, 5% 3/15/43 | | 10,830 | 11,315 |
| Niagara Area Dev. Corp. Rev. (Catholic Health Sys., Inc. Proj.) Series 2022, 5% 7/1/52 | | 3,000 | 2,728 |
| Niagara Frontier Trans. Auth. Arpt. Rev. Series 2019 A: | | | |
| 5% 4/1/29 (c) | | 615 | 645 |
| 5% 4/1/30 (c) | | 750 | 783 |
| 5% 4/1/32 (c) | | 900 | 938 |
| 5% 4/1/33 (c) | | 650 | 677 |
| 5% 4/1/34 (c) | | 1,765 | 1,839 |
| 5% 4/1/36 (c) | | 1,150 | 1,183 |
| 5% 4/1/38 (c) | | 750 | 774 |
| North Hempstead Gen. Oblig. Series 2017 C, 2.9% 9/15/33 | | 850 | 773 |
| Oneida County Local Dev. Corp. Rev.: | | | |
| (Mohawk Valley Health Sys. Proj.) Series 2019 A: | | | |
4% 12/1/37 (Assured Guaranty Muni. Corp. Insured) | | 1,000 | 993 |
4% 12/1/38 (Assured Guaranty Muni. Corp. Insured) | | 1,000 | 997 |
4% 12/1/49 (Assured Guaranty Muni. Corp. Insured) | | 11,305 | 10,809 |
5% 12/1/30 (Assured Guaranty Muni. Corp. Insured) | | 755 | 812 |
5% 12/1/31 (Assured Guaranty Muni. Corp. Insured) | | 545 | 586 |
| (Utica College Proj.) Series 2019, 4% 7/1/39 | | 2,625 | 2,395 |
| Onondaga Civic Dev. Corp.: | | | |
| (Le Moyne College Proj.) Series 2020 B: | | | |
4% 7/1/36 | | 425 | 416 |
4% 7/1/37 | | 275 | 268 |
4% 7/1/38 | | 510 | 490 |
4% 7/1/39 | | 650 | 616 |
4% 7/1/40 | | 600 | 563 |
5% 7/1/25 | | 235 | 237 |
5% 7/1/27 | | 815 | 840 |
5% 7/1/28 | | 855 | 890 |
5% 7/1/31 | | 340 | 358 |
5% 7/1/32 | | 265 | 278 |
5% 7/1/33 | | 300 | 314 |
5% 7/1/34 | | 300 | 315 |
5% 7/1/35 | | 400 | 420 |
| (Syracuse Univ. Proj.) Series 2020 A, 5% 12/1/35 | | 1,110 | 1,225 |
| Series 2024 A: | | | |
5.125% 8/1/44 | | 1,000 | 1,015 |
5.375% 8/1/54 | | 1,250 | 1,281 |
| Onondaga County: | | | |
| Series 2018, 3.375% 4/15/36 | | 1,020 | 954 |
| Series 2020, 2% 10/15/34 | | 1,295 | 1,013 |
| Onondaga County Wtr. Auth. Series 2022 A, 2.5% 9/15/51 | | 1,855 | 1,234 |
| Orange County: | | | |
| Series 2016 A, 2.25% 3/15/33 | | 250 | 213 |
| Series 2021 A, 2% 6/15/29 | | 250 | 226 |
| Pearl River Union Free School Series 2021, 2% 6/1/36 | | 650 | 496 |
| Pelham Union Free School District Series 2020 A: | | | |
| 2% 11/1/31 | | 2,180 | 1,854 |
| 2% 11/1/32 | | 1,445 | 1,204 |
| 2% 11/1/33 | | 530 | 433 |
| 2% 11/1/34 | | 2,015 | 1,612 |
| 2% 11/1/35 | | 2,225 | 1,736 |
| Port Chester-Rye Series 2020, 2% 6/1/36 | | 1,925 | 1,495 |
| Saratoga County Cap. Resources Rev. (Skidmore College Proj.) Series 2020 A: | | | |
| 4% 7/1/50 | | 1,500 | 1,445 |
| 5% 7/1/45 | | 1,625 | 1,732 |
| Saratoga County Gen. Oblig. Series 2016, 3.125% 7/15/36 | | 1,510 | 1,396 |
| Suffolk County Econ. Dev. Corp. Rev. Series 2021, 5.375% 11/1/54 (b) | | 3,500 | 2,937 |
| Suffolk County Gen. Oblig.: | | | |
| Series 2021 A: | | | |
2% 6/15/33 | | 7,555 | 6,417 |
2% 6/15/34 | | 7,105 | 5,909 |
| Series 2022 C, 4% 9/1/36 | | 2,000 | 2,055 |
| Suffolk Tobacco Asset Securitization Corp.: | | | |
| Series 2021 A2, 4% 6/1/50 | | 3,000 | 2,692 |
| Series 2021 B1, 4% 6/1/50 | | 4,805 | 4,766 |
| Syracuse Reg'l. Arpt. Auth. Series 2021: | | | |
| 4% 7/1/35 (c) | | 500 | 494 |
| 4% 7/1/36 (c) | | 500 | 491 |
| 5% 7/1/28 (c) | | 1,640 | 1,702 |
| 5% 7/1/29 (c) | | 1,500 | 1,570 |
| 5% 7/1/30 (c) | | 1,500 | 1,582 |
| 5% 7/1/31 (c) | | 2,060 | 2,183 |
| 5% 7/1/32 (c) | | 1,145 | 1,212 |
| 5% 7/1/33 (c) | | 755 | 796 |
| 5% 7/1/34 (c) | | 815 | 857 |
| Tobacco Settlement Asset Securitization Corp. Series 2017 A, 5% 6/1/30 | | 2,525 | 2,623 |
| Triborough Brdg & Tunl Auth. Series 2023 A: | | | |
| 5% 5/15/36 | | 800 | 919 |
| 5% 5/15/38 | | 1,125 | 1,288 |
| 5% 5/15/39 | | 1,545 | 1,758 |
| Triborough Bridge & Tunnel Auth.: | | | |
| Series 2022 D 1A, 5% 11/15/38 | | 10,000 | 11,268 |
| Series 2023 C, 5.25% 11/15/39 | | 6,000 | 6,977 |
| Triborough Bridge & Tunnel Auth. Revs.: | | | |
| Series 2018 D, 4% 11/15/37 | | 3,000 | 3,095 |
| Series 2019 C, 3% 11/15/46 | | 5,000 | 3,977 |
| Series 2022 A: | | | |
4% 11/15/52 | | 3,000 | 2,919 |
5% 11/15/40 | | 2,000 | 2,231 |
5% 11/15/41 | | 2,000 | 2,220 |
| Troy Cap. Resource Corp. Rev. (Rensselaer Polytechnic Institute Proj.): | | | |
| Series 2015: | | | |
5% 8/1/28 | | 1,565 | 1,598 |
5% 8/1/32 | | 1,000 | 1,018 |
| Series 2020 A, 5% 9/1/36 | | 1,500 | 1,626 |
| Uniondale Union Free School District Series 2021: | | | |
| 1.75% 5/1/33 | | 3,385 | 2,762 |
| 1.75% 5/1/34 | | 3,810 | 2,950 |
| West Islip Union Free School District Series 2020, 2% 6/15/32 | | 2,880 | 2,376 |
| Westchester County Gen. Oblig. Series 2021 A: | | | |
| 2% 10/15/32 | | 3,990 | 3,384 |
| 2% 10/15/33 | | 570 | 473 |
| Westchester County Local Dev. Co. Series 2024: | | | |
| 5% 7/1/35 | | 3,500 | 3,869 |
| 5% 7/1/38 | | 2,000 | 2,193 |
| Western Nassau County Wtr. Auth. Series 2015 A, 5% 4/1/30 | | 350 | 354 |
| Yonkers Gen. Oblig.: | | | |
| Series 2019 A: | | | |
4% 5/1/34 (Build America Mutual Assurance Insured) | | 1,500 | 1,543 |
5% 5/1/33 (Build America Mutual Assurance Insured) | | 1,000 | 1,095 |
| Series 2021 B: | | | |
2% 2/15/41 (Assured Guaranty Muni. Corp. Insured) | | 1,000 | 684 |
4% 2/15/37 | | 1,200 | 1,236 |
TOTAL NEW YORK | | | 1,074,342 |
| New York And New Jersey - 9.7% | | | |
| Port Auth. of New York & New Jersey: | | | |
| 85th Series, 5.375% 3/1/28 | | 3,885 | 4,059 |
| Series 193, 5% 10/15/28 (c) | | 2,015 | 2,045 |
| Series 2019 218, 5% 11/1/36 (c) | | 4,820 | 5,084 |
| Series 202, 5% 10/15/36 (c) | | 5,455 | 5,608 |
| Series 2020 221, 4% 7/15/50 (c) | | 2,900 | 2,715 |
| Series 2021 224, 5% 7/15/56 | | 6,795 | 7,252 |
| Series 2021 227: | | | |
2% 10/1/31 (c) | | 6,295 | 5,264 |
2% 10/1/34 (c) | | 4,380 | 3,399 |
| Series 2022 234: | | | |
5% 8/1/38 (c) | | 1,750 | 1,873 |
5% 8/1/39 (c) | | 1,500 | 1,602 |
5.25% 8/1/40 (c) | | 2,000 | 2,175 |
| Series 2023 238: | | | |
5% 7/15/35 (c) | | 8,475 | 9,261 |
5% 7/15/36 (c) | | 7,060 | 7,670 |
5% 7/15/37 (c) | | 4,235 | 4,589 |
| Series 214: | | | |
4% 9/1/37 (c) | | 4,000 | 4,032 |
4% 9/1/39 (c) | | 1,920 | 1,914 |
4% 9/1/43 (c) | | 6,500 | 6,277 |
5% 9/1/33 (c) | | 2,005 | 2,119 |
| Series 218: | | | |
4% 11/1/47 (c) | | 11,280 | 10,748 |
5% 11/1/30 (c) | | 1,130 | 1,200 |
5% 11/1/44 (c) | | 5,080 | 5,256 |
| Series 221: | | | |
4% 7/15/36 (c) | | 3,000 | 3,038 |
4% 7/15/38 (c) | | 1,000 | 1,005 |
4% 7/15/40 (c) | | 2,000 | 1,991 |
4% 7/15/45 (c) | | 8,000 | 7,669 |
5% 7/15/32 (c) | | 1,500 | 1,607 |
| Series 223, 5% 7/15/56 (c) | | 8,850 | 9,172 |
TOTAL NEW YORK AND NEW JERSEY | | | 118,624 |
| Non-State Specific - 0.1% | | | |
| Port Auth. of New York & New Jersey Series 217, 5% 11/1/44 | | 1,000 | 1,068 |
| Puerto Rico - 1.4% | | | |
| Puerto Rico Commonwealth Aqueduct & Swr. Auth. Series 2021 B, 5% 7/1/37 (b) | | 3,345 | 3,496 |
| Puerto Rico Commonwealth Pub. Impt. Gen. Oblig. Series 2021 A1: | | | |
| 0% 7/1/33 | | 3,720 | 2,504 |
| 5.625% 7/1/27 | | 455 | 475 |
| 5.625% 7/1/29 | | 1,350 | 1,449 |
| 5.75% 7/1/31 | | 3,120 | 3,453 |
| Puerto Rico Sales Tax Fing. Corp. Sales Tax Rev.: | | | |
| Series 2018 A1: | | | |
4.55% 7/1/40 | | 325 | 325 |
4.75% 7/1/53 | | 2,250 | 2,230 |
| Series 2019 A2, 4.329% 7/1/40 | | 2,652 | 2,629 |
TOTAL PUERTO RICO | | | 16,561 |
| TOTAL MUNICIPAL BONDS (Cost $1,233,810) | | | 1,210,595 |
| | | | |
| Money Market Funds - 0.3% |
| | | Shares | Value ($) (000s) |
Fidelity Municipal Cash Central Fund 3.90% (d)(e) (Cost $3,871) | | 3,870,186 | 3,871 |
| | | | |
| TOTAL INVESTMENT IN SECURITIES - 99.2% (Cost $1,237,681) | 1,214,466 |
NET OTHER ASSETS (LIABILITIES) - 0.8% | 9,948 |
| NET ASSETS - 100.0% | 1,224,414 |
| | |
Any values shown as $0 in the Schedule of Investments may reflect amounts less than $500.
Legend
| (a) | Amount is stated in United States dollars unless otherwise noted. |
| (b) | Security exempt from registration under Rule 144A of the Securities Act of 1933. These securities may be resold in transactions exempt from registration, normally to qualified institutional buyers. At the end of the period, the value of these securities amounted to $16,167,000 or 1.3% of net assets. |
| (c) | Private activity obligations whose interest is subject to the federal alternative minimum tax for individuals. |
| (d) | Information in this report regarding holdings by state and security types does not reflect the holdings of the Fidelity Municipal Cash Central Fund. |
| (e) | Affiliated fund that is generally available only to investment companies and other accounts managed by Fidelity Investments. The rate quoted is the annualized seven-day yield of the fund at period end. A complete unaudited listing of the fund's holdings as of its most recent quarter end is available upon request. In addition, each Fidelity Central Fund's financial statements are available on the SEC's website or upon request. |
Affiliated Central Funds
Fiscal year to date information regarding the Fund's investments in Fidelity Central Funds, including the ownership percentage, is presented below.
| Affiliate (Amounts in thousands) | Value, beginning of period ($) | Purchases ($) | Sales Proceeds ($) | Dividend Income ($) | Realized Gain (loss) ($) | Change in Unrealized appreciation (depreciation) ($) | Value, end of period ($) | % ownership, end of period |
| Fidelity Municipal Cash Central Fund 3.90% | 6,577 | 80,637 | 83,341 | 326 | (1) | (1) | 3,871 | 0.2% |
| Total | 6,577 | 80,637 | 83,341 | 326 | (1) | (1) | 3,871 | |
| | | | | | | | | |
Amounts in the dividend income column in the above table include any capital gain distributions from underlying funds, which are presented in the corresponding line item in the Statement of Operations, if applicable.
Amounts included in the purchases and sales proceeds columns may include in-kind transactions, if applicable.
Investment Valuation
The following is a summary of the inputs used, as of July 31, 2024, involving the Fund's assets and liabilities carried at fair value. The inputs or methodology used for valuing securities may not be an indication of the risk associated with investing in those securities. For more information on valuation inputs, and their aggregation into the levels used below, please refer to the Investment Valuation section in the accompanying Notes to Financial Statements.
| Valuation Inputs at Reporting Date: |
Description (Amounts in thousands) | Total ($) | Level 1 ($) | Level 2 ($) | Level 3 ($) |
Investments in Securities: | | | | |
|
| Municipal Securities | 1,210,595 | - | 1,210,595 | - |
|
| Money Market Funds | 3,871 | 3,871 | - | - |
| Total Investments in Securities: | 1,214,466 | 3,871 | 1,210,595 | - |
Financial Statements (Unaudited)
| Statement of Assets and Liabilities |
| As of July 31, 2024 (Unaudited) Amounts in thousands (except per-share amounts) |
| Assets | | | | |
| Investment in securities, at value - See accompanying schedule: | | | | |
Unaffiliated issuers (cost $1,233,810) | $ | 1,210,595 | | |
Fidelity Central Funds (cost $3,871) | | 3,871 | | |
| | | | | |
| | | | | |
| Total Investment in Securities (cost $1,237,681) | | | $ | 1,214,466 |
| Cash | | | | 100 |
| Receivable for investments sold | | | | 292 |
| Receivable for fund shares sold | | | | 780 |
| Interest receivable | | | | 11,394 |
| Distributions receivable from Fidelity Central Funds | | | | 25 |
Total assets | | | | 1,227,057 |
| Liabilities | | | | |
| Payable for fund shares redeemed | $ | 1,045 | | |
| Distributions payable | | 1,105 | | |
| Accrued management fee | | 441 | | |
| Distribution and service plan fees payable | | 10 | | |
| Other payables and accrued expenses | | 42 | | |
| Total liabilities | | | | 2,643 |
| Net Assets | | | $ | 1,224,414 |
| Net Assets consist of: | | | | |
| Paid in capital | | | $ | 1,284,061 |
| Total accumulated earnings (loss) | | | | (59,647) |
| Net Assets | | | $ | 1,224,414 |
| | | | | |
| Net Asset Value and Maximum Offering Price | | | | |
| Class A : | | | | |
Net Asset Value and redemption price per share ($30,659 ÷ 2,478 shares)(a) | | | $ | 12.37 |
| Maximum offering price per share (100/96.00 of $12.37) | | | $ | 12.89 |
| Class M : | | | | |
Net Asset Value and redemption price per share ($3,911 ÷ 316 shares)(a) | | | $ | 12.38 |
| Maximum offering price per share (100/96.00 of $12.38) | | | $ | 12.90 |
| Class C : | | | | |
Net Asset Value and offering price per share ($3,821 ÷ 309 shares)(a) | | | $ | 12.37 |
| New York Municipal Income : | | | | |
Net Asset Value, offering price and redemption price per share ($1,112,571 ÷ 89,885 shares) | | | $ | 12.38 |
| Class I : | | | | |
Net Asset Value, offering price and redemption price per share ($44,181 ÷ 3,574 shares) | | | $ | 12.36 |
| Class Z : | | | | |
Net Asset Value, offering price and redemption price per share ($29,271 ÷ 2,368 shares) | | | $ | 12.36 |
(a)Redemption price per share is equal to net asset value less any applicable contingent deferred sales charge. |
| Statement of Operations |
Six months ended July 31, 2024 (Unaudited) Amounts in thousands |
| Investment Income | | | | |
| Interest | | | $ | 20,511 |
| Income from Fidelity Central Funds | | | | 326 |
| Total income | | | | 20,837 |
| Expenses | | | | |
| Management fee | $ | 2,565 | | |
| Transfer agent fees | | 90 | | |
| Distribution and service plan fees | | 65 | | |
| Accounting fees and expenses | | 20 | | |
| Custodian fees and expenses | | 10 | | |
| Independent trustees' fees and expenses | | 2 | | |
| Registration fees | | 75 | | |
| Audit fees | | 29 | | |
| Legal | | 5 | | |
| Miscellaneous | | 3 | | |
| Total expenses before reductions | | 2,864 | | |
| Expense reductions | | (13) | | |
| Total expenses after reductions | | | | 2,851 |
| Net Investment income (loss) | | | | 17,986 |
| Realized and Unrealized Gain (Loss) | | | | |
| Net realized gain (loss) on: | | | | |
| Investment Securities: | | | | |
| Unaffiliated issuers | | (370) | | |
| Fidelity Central Funds | | (1) | | |
| Total net realized gain (loss) | | | | (371) |
| Change in net unrealized appreciation (depreciation) on: | | | | |
| Investment Securities: | | | | |
| Unaffiliated issuers | | (4,083) | | |
| Fidelity Central Funds | | (1) | | |
| Total change in net unrealized appreciation (depreciation) | | | | (4,084) |
| Net gain (loss) | | | | (4,455) |
| Net increase (decrease) in net assets resulting from operations | | | $ | 13,531 |
| Statement of Changes in Net Assets |
| |
| Amount in thousands | | Six months ended July 31, 2024 (Unaudited) | | Year ended January 31, 2024 |
| Increase (Decrease) in Net Assets | | | | |
| Operations | | | | |
| Net investment income (loss) | $ | 17,986 | $ | 33,840 |
| Net realized gain (loss) | | (371) | | (11,872) |
| Change in net unrealized appreciation (depreciation) | | (4,084) | | 22,946 |
| Net increase (decrease) in net assets resulting from operations | | 13,531 | | 44,914 |
| Distributions to shareholders | | (16,781) | | (32,646) |
| | | | | |
| Share transactions - net increase (decrease) | | (7,087) | | (15,328) |
| Total increase (decrease) in net assets | | (10,337) | | (3,060) |
| | | | | |
| Net Assets | | | | |
| Beginning of period | | 1,234,751 | | 1,237,811 |
| End of period | $ | 1,224,414 | $ | 1,234,751 |
| | | | | |
| | | | | |
Financial Highlights
Fidelity Advisor® New York Municipal Income Fund Class A |
| |
| | Six months ended (Unaudited) July 31, 2024 | | Years ended January 31, 2024 | | 2023 | | 2022 | | 2021 | | 2020 |
Selected Per-Share Data | | | | | | | | | | | | |
| Net asset value, beginning of period | $ | 12.40 | $ | 12.28 | $ | 13.19 | $ | 13.75 | $ | 13.71 | $ | 12.96 |
| Income from Investment Operations | | | | | | | | | | | | |
Net investment income (loss) A,B | | .162 | | .303 | | .261 | | .248 | | .270 | | .287 |
| Net realized and unrealized gain (loss) | | (.042) | | .108 | | (.894) | | (.462) | | .105 | | .804 |
| Total from investment operations | | .120 | | .411 | | (.633) | | (.214) | | .375 | | 1.091 |
| Distributions from net investment income | | (.150) | | (.291) | | (.260) | | (.248) | | (.270) | | (.287) |
| Distributions from net realized gain | | - | | - | | (.017) | | (.098) | | (.065) | | (.054) |
| Total distributions | | (.150) | | (.291) | | (.277) | | (.346) | | (.335) | | (.341) |
| Net asset value, end of period | $ | 12.37 | $ | 12.40 | $ | 12.28 | $ | 13.19 | $ | 13.75 | $ | 13.71 |
Total Return C,D,E | | | | 3.45% | | (4.75)% | | (1.61)% | | 2.81% | | 8.51% |
Ratios to Average Net Assets B,F,G | | | | | | | | | | | | |
| Expenses before reductions | | .77% H | | .78% | | .78% | | .77% | | .78% | | .79% |
| Expenses net of fee waivers, if any | | | | .77% | | .78% | | .77% | | .78% | | .79% |
| Expenses net of all reductions | | .77% H | | .77% | | .78% | | .77% | | .78% | | .79% |
| Net investment income (loss) | | 2.66% H | | 2.51% | | 2.14% | | 1.81% | | 2.01% | | 2.14% |
| Supplemental Data | | | | | | | | | | | | |
| Net assets, end of period (in millions) | $ | 31 | $ | 32 | $ | 34 | $ | 41 | $ | 43 | $ | 42 |
Portfolio turnover rate I | | | | 15% | | 17% | | 16% | | 16% | | 15% |
ACalculated based on average shares outstanding during the period.
BNet investment income (loss) is affected by the timing of the declaration of dividends by any underlying mutual funds or exchange-traded funds (ETFs). Net investment income (loss) of any mutual funds or ETFs is not included in the Fund's net investment income (loss) ratio.
CTotal returns for periods of less than one year are not annualized.
DTotal returns would have been lower if certain expenses had not been reduced during the applicable periods shown.
ETotal returns do not include the effect of the sales charges.
FFees and expenses of any underlying mutual funds or exchange-traded funds (ETFs) are not included in the Fund's expense ratio. The Fund indirectly bears its proportionate share of these expenses. For additional expense information related to investments in Fidelity Central Funds, please refer to the "Investments in Fidelity Central Funds" note found in the Notes to Financial Statements section of the most recent Annual or Semi-Annual report.
GExpense ratios reflect operating expenses of the class. Expenses before reductions do not reflect amounts reimbursed, waived, or reduced through arrangements with the investment adviser, brokerage services, or other offset arrangements, if applicable, and do not represent the amount paid by the class during periods when reimbursements, waivers or reductions occur.
HAnnualized.
IAmount does not include the portfolio activity of any underlying mutual funds or exchange-traded funds (ETFs).
Fidelity Advisor® New York Municipal Income Fund Class M |
| |
| | Six months ended (Unaudited) July 31, 2024 | | Years ended January 31, 2024 | | 2023 | | 2022 | | 2021 | | 2020 |
Selected Per-Share Data | | | | | | | | | | | | |
| Net asset value, beginning of period | $ | 12.41 | $ | 12.29 | $ | 13.21 | $ | 13.76 | $ | 13.73 | $ | 12.97 |
| Income from Investment Operations | | | | | | | | | | | | |
Net investment income (loss) A,B | | .165 | | .309 | | .268 | | .254 | | .275 | | .293 |
| Net realized and unrealized gain (loss) | | (.042) | | .108 | | (.904) | | (.452) | | .095 | | .814 |
| Total from investment operations | | .123 | | .417 | | (.636) | | (.198) | | .370 | | 1.107 |
| Distributions from net investment income | | (.153) | | (.297) | | (.267) | | (.254) | | (.275) | | (.293) |
| Distributions from net realized gain | | - | | - | | (.017) | | (.098) | | (.065) | | (.054) |
| Total distributions | | (.153) | | (.297) | | (.284) | | (.352) | | (.340) | | (.347) |
| Net asset value, end of period | $ | 12.38 | $ | 12.41 | $ | 12.29 | $ | 13.21 | $ | 13.76 | $ | 13.73 |
Total Return C,D,E | | | | 3.50% | | (4.77)% | | (1.50)% | | 2.77% | | 8.63% |
Ratios to Average Net Assets B,F,G | | | | | | | | | | | | |
| Expenses before reductions | | .73% H | | .73% | | .72% | | .74% | | .75% | | .74% |
| Expenses net of fee waivers, if any | | | | .73% | | .72% | | .73% | | .75% | | .74% |
| Expenses net of all reductions | | .72% H | | .73% | | .72% | | .73% | | .75% | | .74% |
| Net investment income (loss) | | 2.70% H | | 2.56% | | 2.20% | | 1.85% | | 2.05% | | 2.18% |
| Supplemental Data | | | | | | | | | | | | |
| Net assets, end of period (in millions) | $ | 4 | $ | 4 | $ | 4 | $ | 6 | $ | 7 | $ | 8 |
Portfolio turnover rate I | | | | 15% | | 17% | | 16% | | 16% | | 15% |
ACalculated based on average shares outstanding during the period.
BNet investment income (loss) is affected by the timing of the declaration of dividends by any underlying mutual funds or exchange-traded funds (ETFs). Net investment income (loss) of any mutual funds or ETFs is not included in the Fund's net investment income (loss) ratio.
CTotal returns for periods of less than one year are not annualized.
DTotal returns would have been lower if certain expenses had not been reduced during the applicable periods shown.
ETotal returns do not include the effect of the sales charges.
FFees and expenses of any underlying mutual funds or exchange-traded funds (ETFs) are not included in the Fund's expense ratio. The Fund indirectly bears its proportionate share of these expenses. For additional expense information related to investments in Fidelity Central Funds, please refer to the "Investments in Fidelity Central Funds" note found in the Notes to Financial Statements section of the most recent Annual or Semi-Annual report.
GExpense ratios reflect operating expenses of the class. Expenses before reductions do not reflect amounts reimbursed, waived, or reduced through arrangements with the investment adviser, brokerage services, or other offset arrangements, if applicable, and do not represent the amount paid by the class during periods when reimbursements, waivers or reductions occur.
HAnnualized.
IAmount does not include the portfolio activity of any underlying mutual funds or exchange-traded funds (ETFs).
Fidelity Advisor® New York Municipal Income Fund Class C |
| |
| | Six months ended (Unaudited) July 31, 2024 | | Years ended January 31, 2024 | | 2023 | | 2022 | | 2021 | | 2020 |
Selected Per-Share Data | | | | | | | | | | | | |
| Net asset value, beginning of period | $ | 12.40 | $ | 12.28 | $ | 13.19 | $ | 13.75 | $ | 13.71 | $ | 12.96 |
| Income from Investment Operations | | | | | | | | | | | | |
Net investment income (loss) A,B | | .120 | | .219 | | .175 | | .148 | | .173 | | .188 |
| Net realized and unrealized gain (loss) | | (.043) | | .108 | | (.893) | | (.461) | | .105 | | .804 |
| Total from investment operations | | .077 | | .327 | | (.718) | | (.313) | | .278 | | .992 |
| Distributions from net investment income | | (.107) | | (.207) | | (.175) | | (.149) | | (.173) | | (.188) |
| Distributions from net realized gain | | - | | - | | (.017) | | (.098) | | (.065) | | (.054) |
| Total distributions | | (.107) | | (.207) | | (.192) | | (.247) | | (.238) | | (.242) |
| Net asset value, end of period | $ | 12.37 | $ | 12.40 | $ | 12.28 | $ | 13.19 | $ | 13.75 | $ | 13.71 |
Total Return C,D,E | | | | 2.72% | | (5.42)% | | (2.33)% | | 2.07% | | 7.71% |
Ratios to Average Net Assets B,F,G | | | | | | | | | | | | |
| Expenses before reductions | | 1.47% H | | 1.48% | | 1.48% | | 1.50% | | 1.51% | | 1.53% |
| Expenses net of fee waivers, if any | | | | 1.48% | | 1.48% | | 1.50% | | 1.51% | | 1.52% |
| Expenses net of all reductions | | 1.47% H | | 1.48% | | 1.48% | | 1.50% | | 1.51% | | 1.52% |
| Net investment income (loss) | | 1.95% H | | 1.81% | | 1.44% | | 1.08% | | 1.28% | | 1.40% |
| Supplemental Data | | | | | | | | | | | | |
| Net assets, end of period (in millions) | $ | 4 | $ | 4 | $ | 6 | $ | 9 | $ | 13 | $ | 17 |
Portfolio turnover rate I | | | | 15% | | 17% | | 16% | | 16% | | 15% |
ACalculated based on average shares outstanding during the period.
BNet investment income (loss) is affected by the timing of the declaration of dividends by any underlying mutual funds or exchange-traded funds (ETFs). Net investment income (loss) of any mutual funds or ETFs is not included in the Fund's net investment income (loss) ratio.
CTotal returns for periods of less than one year are not annualized.
DTotal returns would have been lower if certain expenses had not been reduced during the applicable periods shown.
ETotal returns do not include the effect of the contingent deferred sales charge.
FFees and expenses of any underlying mutual funds or exchange-traded funds (ETFs) are not included in the Fund's expense ratio. The Fund indirectly bears its proportionate share of these expenses. For additional expense information related to investments in Fidelity Central Funds, please refer to the "Investments in Fidelity Central Funds" note found in the Notes to Financial Statements section of the most recent Annual or Semi-Annual report.
GExpense ratios reflect operating expenses of the class. Expenses before reductions do not reflect amounts reimbursed, waived, or reduced through arrangements with the investment adviser, brokerage services, or other offset arrangements, if applicable, and do not represent the amount paid by the class during periods when reimbursements, waivers or reductions occur.
HAnnualized.
IAmount does not include the portfolio activity of any underlying mutual funds or exchange-traded funds (ETFs).
Fidelity® New York Municipal Income Fund |
| |
| | Six months ended (Unaudited) July 31, 2024 | | Years ended January 31, 2024 | | 2023 | | 2022 | | 2021 | | 2020 |
Selected Per-Share Data | | | | | | | | | | | | |
| Net asset value, beginning of period | $ | 12.41 | $ | 12.29 | $ | 13.20 | $ | 13.75 | $ | 13.72 | $ | 12.96 |
| Income from Investment Operations | | | | | | | | | | | | |
Net investment income (loss) A,B | | .182 | | .341 | | .300 | | .292 | | .314 | | .331 |
| Net realized and unrealized gain (loss) | | (.043) | | .108 | | (.894) | | (.452) | | .095 | | .814 |
| Total from investment operations | | .139 | | .449 | | (.594) | | (.160) | | .409 | | 1.145 |
| Distributions from net investment income | | (.169) | | (.329) | | (.299) | | (.292) | | (.314) | | (.331) |
| Distributions from net realized gain | | - | | - | | (.017) | | (.098) | | (.065) | | (.054) |
| Total distributions | | (.169) | | (.329) | | (.316) | | (.390) | | (.379) | | (.385) |
| Net asset value, end of period | $ | 12.38 | $ | 12.41 | $ | 12.29 | $ | 13.20 | $ | 13.75 | $ | 13.72 |
Total Return C,D | | | | 3.77% | | (4.45)% | | (1.22)% | | 3.07% | | 8.94% |
Ratios to Average Net Assets B,E,F | | | | | | | | | | | | |
| Expenses before reductions | | .46% G | | .47% | | .47% | | .46% | | .46% | | .46% |
| Expenses net of fee waivers, if any | | | | .46% | | .46% | | .46% | | .46% | | .46% |
| Expenses net of all reductions | | .45% G | | .46% | | .46% | | .45% | | .46% | | .46% |
| Net investment income (loss) | | 2.97% G | | 2.83% | | 2.45% | | 2.13% | | 2.34% | | 2.47% |
| Supplemental Data | | | | | | | | | | | | |
| Net assets, end of period (in millions) | $ | 1,113 | $ | 1,126 | $ | 1,140 | $ | 1,576 | $ | 1,600 | $ | 1,734 |
Portfolio turnover rate H | | | | 15% | | 17% | | 16% | | 16% | | 15% |
ACalculated based on average shares outstanding during the period.
BNet investment income (loss) is affected by the timing of the declaration of dividends by any underlying mutual funds or exchange-traded funds (ETFs). Net investment income (loss) of any mutual funds or ETFs is not included in the Fund's net investment income (loss) ratio.
CTotal returns would have been lower if certain expenses had not been reduced during the applicable periods shown.
DTotal returns for periods of less than one year are not annualized.
EFees and expenses of any underlying mutual funds or exchange-traded funds (ETFs) are not included in the Fund's expense ratio. The Fund indirectly bears its proportionate share of these expenses. For additional expense information related to investments in Fidelity Central Funds, please refer to the "Investments in Fidelity Central Funds" note found in the Notes to Financial Statements section of the most recent Annual or Semi-Annual report.
FExpense ratios reflect operating expenses of the class. Expenses before reductions do not reflect amounts reimbursed, waived, or reduced through arrangements with the investment adviser, brokerage services, or other offset arrangements, if applicable, and do not represent the amount paid by the class during periods when reimbursements, waivers or reductions occur.
GAnnualized.
HAmount does not include the portfolio activity of any underlying mutual funds or exchange-traded funds (ETFs).
Fidelity Advisor® New York Municipal Income Fund Class I |
| |
| | Six months ended (Unaudited) July 31, 2024 | | Years ended January 31, 2024 | | 2023 | | 2022 | | 2021 | | 2020 |
Selected Per-Share Data | | | | | | | | | | | | |
| Net asset value, beginning of period | $ | 12.39 | $ | 12.27 | $ | 13.18 | $ | 13.74 | $ | 13.70 | $ | 12.95 |
| Income from Investment Operations | | | | | | | | | | | | |
Net investment income (loss) A,B | | .176 | | .331 | | .290 | | .281 | | .303 | | .320 |
| Net realized and unrealized gain (loss) | | (.042) | | .108 | | (.894) | | (.462) | | .105 | | .805 |
| Total from investment operations | | .134 | | .439 | | (.604) | | (.181) | | .408 | | 1.125 |
| Distributions from net investment income | | (.164) | | (.319) | | (.289) | | (.281) | | (.303) | | (.321) |
| Distributions from net realized gain | | - | | - | | (.017) | | (.098) | | (.065) | | (.054) |
| Total distributions | | (.164) | | (.319) | | (.306) | | (.379) | | (.368) | | (.375) |
| Net asset value, end of period | $ | 12.36 | $ | 12.39 | $ | 12.27 | $ | 13.18 | $ | 13.74 | $ | 13.70 |
Total Return C,D | | | | 3.69% | | (4.53)% | | (1.38)% | | 3.07% | | 8.79% |
Ratios to Average Net Assets B,E,F | | | | | | | | | | | | |
| Expenses before reductions | | .54% G | | .55% | | .54% | | .54% | | .53% | | .53% |
| Expenses net of fee waivers, if any | | | | .54% | | .54% | | .53% | | .53% | | .53% |
| Expenses net of all reductions | | .53% G | | .54% | | .54% | | .53% | | .53% | | .53% |
| Net investment income (loss) | | 2.89% G | | 2.75% | | 2.38% | | 2.05% | | 2.26% | | 2.39% |
| Supplemental Data | | | | | | | | | | | | |
| Net assets, end of period (in millions) | $ | 44 | $ | 45 | $ | 40 | $ | 52 | $ | 55 | $ | 54 |
Portfolio turnover rate H | | | | 15% | | 17% | | 16% | | 16% | | 15% |
ACalculated based on average shares outstanding during the period.
BNet investment income (loss) is affected by the timing of the declaration of dividends by any underlying mutual funds or exchange-traded funds (ETFs). Net investment income (loss) of any mutual funds or ETFs is not included in the Fund's net investment income (loss) ratio.
CTotal returns for periods of less than one year are not annualized.
DTotal returns would have been lower if certain expenses had not been reduced during the applicable periods shown.
EFees and expenses of any underlying mutual funds or exchange-traded funds (ETFs) are not included in the Fund's expense ratio. The Fund indirectly bears its proportionate share of these expenses. For additional expense information related to investments in Fidelity Central Funds, please refer to the "Investments in Fidelity Central Funds" note found in the Notes to Financial Statements section of the most recent Annual or Semi-Annual report.
FExpense ratios reflect operating expenses of the class. Expenses before reductions do not reflect amounts reimbursed, waived, or reduced through arrangements with the investment adviser, brokerage services, or other offset arrangements, if applicable, and do not represent the amount paid by the class during periods when reimbursements, waivers or reductions occur.
GAnnualized.
HAmount does not include the portfolio activity of any underlying mutual funds or exchange-traded funds (ETFs).
Fidelity Advisor® New York Municipal Income Fund Class Z |
| |
| | Six months ended (Unaudited) July 31, 2024 | | Years ended January 31, 2024 | | 2023 | | 2022 | | 2021 | | 2020 |
Selected Per-Share Data | | | | | | | | | | | | |
| Net asset value, beginning of period | $ | 12.39 | $ | 12.27 | $ | 13.18 | $ | 13.74 | $ | 13.70 | $ | 12.95 |
| Income from Investment Operations | | | | | | | | | | | | |
Net investment income (loss) A,B | | .182 | | .344 | | .303 | | .295 | | .317 | | .334 |
| Net realized and unrealized gain (loss) | | (.041) | | .109 | | (.894) | | (.461) | | .105 | | .804 |
| Total from investment operations | | .141 | | .453 | | (.591) | | (.166) | | .422 | | 1.138 |
| Distributions from net investment income | | (.171) | | (.333) | | (.302) | | (.296) | | (.317) | | (.334) |
| Distributions from net realized gain | | - | | - | | (.017) | | (.098) | | (.065) | | (.054) |
| Total distributions | | (.171) | | (.333) | | (.319) | | (.394) | | (.382) | | (.388) |
| Net asset value, end of period | $ | 12.36 | $ | 12.39 | $ | 12.27 | $ | 13.18 | $ | 13.74 | $ | 13.70 |
Total Return C,D | | | | 3.81% | | (4.43)% | | (1.27)% | | 3.17% | | 8.89% |
Ratios to Average Net Assets B,E,F | | | | | | | | | | | | |
| Expenses before reductions | | .43% G | | .43% | | .43% | | .43% | | .43% | | .43% |
| Expenses net of fee waivers, if any | | | | .43% | | .43% | | .42% | | .43% | | .43% |
| Expenses net of all reductions | | .43% G | | .43% | | .43% | | .42% | | .43% | | .43% |
| Net investment income (loss) | | 2.99% G | | 2.86% | | 2.49% | | 2.16% | | 2.36% | | 2.49% |
| Supplemental Data | | | | | | | | | | | | |
| Net assets, end of period (in millions) | $ | 29 | $ | 23 | $ | 13 | $ | 20 | $ | 9 | $ | 6 |
Portfolio turnover rate H | | | | 15% | | 17% | | 16% | | 16% | | 15% |
ACalculated based on average shares outstanding during the period.
BNet investment income (loss) is affected by the timing of the declaration of dividends by any underlying mutual funds or exchange-traded funds (ETFs). Net investment income (loss) of any mutual funds or ETFs is not included in the Fund's net investment income (loss) ratio.
CTotal returns for periods of less than one year are not annualized.
DTotal returns would have been lower if certain expenses had not been reduced during the applicable periods shown.
EFees and expenses of any underlying mutual funds or exchange-traded funds (ETFs) are not included in the Fund's expense ratio. The Fund indirectly bears its proportionate share of these expenses. For additional expense information related to investments in Fidelity Central Funds, please refer to the "Investments in Fidelity Central Funds" note found in the Notes to Financial Statements section of the most recent Annual or Semi-Annual report.
FExpense ratios reflect operating expenses of the class. Expenses before reductions do not reflect amounts reimbursed, waived, or reduced through arrangements with the investment adviser, brokerage services, or other offset arrangements, if applicable, and do not represent the amount paid by the class during periods when reimbursements, waivers or reductions occur.
GAnnualized.
HAmount does not include the portfolio activity of any underlying mutual funds or exchange-traded funds (ETFs).
Notes to Financial Statements
(Unaudited)For the period ended July 31, 2024
(Amounts in thousands except percentages)
1. Organization.
Fidelity New York Municipal Income Fund (the Fund) is a non-diversified fund of Fidelity New York Municipal Trust (the Trust) and is authorized to issue an unlimited number of shares. The Trust is registered under the Investment Company Act of 1940, as amended (the 1940 Act), as an open-end management investment company organized as a Massachusetts business trust. The Fund offers Class A, Class M, Class C, New York Municipal Income, Class I and Class Z shares, each of which has equal rights as to assets and voting privileges. Class A, Class M, Class C, Class I and Class Z are Fidelity Advisor classes. Each class has exclusive voting rights with respect to matters that affect that class. Class C shares will automatically convert to Class A shares after a holding period of eight years from the initial date of purchase, with certain exceptions. The Fund may be affected by economic and political developments in the state of New York.
2. Investments in Fidelity Central Funds.
Funds may invest in Fidelity Central Funds, which are open-end investment companies generally available only to other investment companies and accounts managed by the investment adviser and its affiliates. The Schedule of Investments lists any Fidelity Central Funds held as an investment as of period end, but does not include the underlying holdings of each Fidelity Central Fund. An investing fund indirectly bears its proportionate share of the expenses of the underlying Fidelity Central Funds.
Based on its investment objective, each Fidelity Central Fund may invest or participate in various investment vehicles or strategies that are similar to those of the investing fund. These strategies are consistent with the investment objectives of the investing fund and may involve certain economic risks which may cause a decline in value of each of the Fidelity Central Funds and thus a decline in the value of the investing fund.
| Fidelity Central Fund | Investment Manager | Investment Objective | Investment Practices | Expense RatioA |
| Fidelity Money Market Central Funds | Fidelity Management & Research Company LLC (FMR) | Each fund seeks to obtain a high level of current income consistent with the preservation of capital and liquidity. | Short-term Investments | Less than .005% |
A Expenses expressed as a percentage of average net assets and are as of each underlying Central Fund's most recent annual or semi-annual shareholder report.
A complete unaudited list of holdings for each Fidelity Central Fund is available upon request or at the Securities and Exchange Commission website at www.sec.gov. In addition, the financial statements of the Fidelity Central Funds which contain the significant accounting policies (including investment valuation policies) of those funds, and are not covered by the Report of Independent Registered Public Accounting Firm, are available on the Securities and Exchange Commission website or upon request.
3. Significant Accounting Policies.
The Fund is an investment company and applies the accounting and reporting guidance of the Financial Accounting Standards Board (FASB) Accounting Standards Codification Topic 946 Financial Services - Investment Companies. The financial statements have been prepared in conformity with accounting principles generally accepted in the United States of America (GAAP), which require management to make certain estimates and assumptions at the date of the financial statements. Actual results could differ from those estimates. Subsequent events, if any, through the date that the financial statements were issued have been evaluated in the preparation of the financial statements. The Fund's Schedule of Investments lists any underlying mutual funds or exchange-traded funds (ETFs) but does not include the underlying holdings of these funds. The following summarizes the significant accounting policies of the Fund:
Investment Valuation. Investments are valued as of 4:00 p.m. Eastern time on the last calendar day of the period. The Board of Trustees (the Board) has designated the Fund's investment adviser as the valuation designee responsible for the fair valuation function and performing fair value determinations as needed. The investment adviser has established a Fair Value Committee (the Committee) to carry out the day-to-day fair valuation responsibilities and has adopted policies and procedures to govern the fair valuation process and the activities of the Committee. In accordance with these fair valuation policies and procedures, which have been approved by the Board, the Fund attempts to obtain prices from one or more third party pricing services or brokers to value its investments. When current market prices, quotations or currency exchange rates are not readily available or reliable, investments will be fair valued in good faith by the Committee, in accordance with the policies and procedures. Factors used in determining fair value vary by investment type and may include market or investment specific events, transaction data, estimated cash flows, and market observations of comparable investments. The frequency that the fair valuation procedures are used cannot be predicted and they may be utilized to a significant extent. The Committee manages the Fund's fair valuation practices and maintains the fair valuation policies and procedures. The Fund's investment adviser reports to the Board information regarding the fair valuation process and related material matters.
The Fund categorizes the inputs to valuation techniques used to value its investments into a disclosure hierarchy consisting of three levels as shown below:
Level 1 - unadjusted quoted prices in active markets for identical investments
Level 2 - other significant observable inputs (including quoted prices for similar investments, interest rates, prepayment speeds, etc.)
Level 3 - unobservable inputs (including the Fund's own assumptions based on the best information available)
Valuation techniques used to value the Fund's investments by major category are as follows:
Debt securities, including restricted securities, are valued based on evaluated prices received from third party pricing services or from brokers who make markets in such securities. Municipal securities are valued by pricing services who utilize matrix pricing which considers yield or price of bonds of comparable quality, coupon, maturity and type or by broker-supplied prices. When independent prices are unavailable or unreliable, debt securities may be valued utilizing pricing methodologies which consider similar factors that would be used by third party pricing services.
Investments in open-end mutual funds, including the Fidelity Central Funds, are valued at their closing net asset value (NAV) each business day and are categorized as Level 1 in the hierarchy.
Changes in valuation techniques may result in transfers in or out of an assigned level within the disclosure hierarchy. The aggregate value of investments by input level as of July 31, 2024 is included at the end of the Fund's Schedule of Investments.
Investment Transactions and Income. For financial reporting purposes, the Fund's investment holdings and NAV include trades executed through the end of the last business day of the period. The NAV per share for processing shareholder transactions is calculated as of the close of business of the New York Stock Exchange (NYSE), normally 4:00 p.m. Eastern time and includes trades executed through the end of the prior business day. Gains and losses on securities sold are determined on the basis of identified cost. Income and capital gain distributions from Fidelity Central Funds, if any, are recorded on the ex-dividend date. Interest income is accrued as earned and includes coupon interest and amortization of premium and accretion of discount on debt securities as applicable.
Class Allocations and Expenses. Investment income, realized and unrealized capital gains and losses, common expenses of a fund, and certain fund-level expense reductions, if any, are allocated daily on a pro-rata basis to each class based on the relative net assets of each class to the total net assets of a fund. Each class differs with respect to transfer agent and distribution and service plan fees incurred, as applicable. Certain expense reductions may also differ by class, if applicable. For the reporting period, the allocated portion of income and expenses to each class as a percent of its average net assets may vary due to the timing of recording these transactions in relation to fluctuating net assets of the classes. Expenses directly attributable to a fund are charged to that fund. Expenses attributable to more than one fund are allocated among the respective funds on the basis of relative net assets or other appropriate methods. Expenses included in the accompanying financial statements reflect the expenses of that fund and do not include any expenses associated with any underlying mutual funds or exchange-traded funds (ETFs). Although not included in a fund's expenses, a fund indirectly bears its proportionate share of these expenses through the net asset value of each underlying mutual fund or exchange-traded fund (ETF). Expense estimates are accrued in the period to which they relate and adjustments are made when actual amounts are known.
Income Tax Information and Distributions to Shareholders. Each year, the Fund intends to qualify as a regulated investment company under Subchapter M of the Internal Revenue Code, including distributing substantially all of its taxable income and realized gains. As a result, no provision for U.S. Federal income taxes is required. The Fund files a U.S. federal tax return, in addition to state and local tax returns as required. The Fund's federal income tax returns are subject to examination by the Internal Revenue Service (IRS) for a period of three fiscal years after they are filed. State and local tax returns may be subject to examination for an additional fiscal year depending on the jurisdiction.
Distributions are declared and recorded daily and paid monthly from net investment income. Distributions from realized gains, if any, are declared and recorded on the ex-dividend date. Income and capital gain distributions are declared separately for each class. Income and capital gain distributions are determined in accordance with income tax regulations, which may differ from GAAP.
Capital accounts within the financial statements are adjusted for permanent book-tax differences. These adjustments have no impact on net assets or the results of operations. Capital accounts are not adjusted for temporary book-tax differences which will reverse in a subsequent period.
Book-tax differences are primarily due to market discount and capital loss carryforward.
The Fund purchases municipal securities whose interest, in the opinion of the issuer, is free from federal income tax. There is no assurance that the IRS will agree with this opinion. In the event the IRS determines that the issuer does not comply with relevant tax requirements, interest payments from a security could become federally taxable, possibly retroactively to the date the security was issued.
As of period end, the cost and unrealized appreciation (depreciation) in securities, and derivatives if applicable, for federal income tax purposes were as follows:
| Gross unrealized appreciation | $20,737 |
| Gross unrealized depreciation | (41,367) |
| Net unrealized appreciation (depreciation) | $(20,630) |
| Tax cost | $1,235,096 |
Capital loss carryforwards are only available to offset future capital gains of the Fund to the extent provided by regulations and may be limited. The capital loss carryforward information presented below, including any applicable limitation, is estimated as of prior fiscal period end and is subject to adjustment.
Short-term | $(9,659) |
Long-term | (29,055) |
| Total capital loss carryforward | $(38,714) |
4. Purchases and Sales of Investments.
Purchases and sales of securities, other than short-term securities and in-kind transactions, as applicable, are noted in the table below.
| | Purchases ($) | Sales ($) |
| Fidelity New York Municipal Income Fund | 50,841 | 48,232 |
5. Fees and Other Transactions with Affiliates.
Management Fee. Fidelity Management & Research Company LLC (the investment adviser) and its affiliates provide the Fund with investment management related services for which the Fund pays a monthly management fee.
Effective March 1, 2024, the Fund's management contract was amended to incorporate administrative services previously covered under separate services agreements (Transfer Agent and Accounting agreements). The amended contract incorporates a management fee rate that may vary by class. The investment adviser or an affiliate pays certain expenses of managing and operating the Fund out of each class's management fee. Each class of the Fund pays a management fee to the investment adviser. The management fee is calculated and paid to the investment adviser every month. When determining a class's management fee, a mandate rate is calculated based on the monthly average net assets of a group of funds advised by FMR within a designated asset class. A discount rate is subtracted from the mandate rate once the Fund's monthly average net assets reach a certain level. The mandate rate and discount rate may vary by class. The annual management fee rate for a class of shares of the Fund is the lesser of (1) the class's mandate rate reduced by the class's discount rate (if applicable) or (2) the amount set forth in the following table.
| | Maximum Management Fee Rate % |
| Class A | .49 |
| Class M | .45 |
| Class C | .44 |
| New York Municipal Income | .43 |
| Class I | .51 |
| Class Z | .40 |
One-twelfth of the management fee rate for a class is applied to the average net assets of the class for the month, giving a dollar amount which is the management fee for the class for that month. A different management fee rate may be applicable to each class of the Fund. The difference between classes is the result of separate arrangements for class-level services and/or waivers of certain expenses. It is not the result of any difference in advisory or custodial fees or other expenses related to the management of the Fund's assets, which do not vary by class. For the portion of the reporting period on or after March 1, 2024, the total annualized management fee rates were as follows:
| | Total Management Fee Rate % |
| Class A | .49 |
| Class M | .45 |
| Class C | .44 |
| New York Municipal Income | .43 |
| Class I | .51 |
| Class Z | .40 |
Prior to March 1, 2024, the management fee was the sum of an individual fund fee rate that was based on an annual rate of .25% of the Fund's average net assets and an annualized group fee rate that averaged .09% during the period. The group fee rate was based upon the monthly average net assets of a group of registered investment companies with which the investment adviser has management contracts. The group fee rate decreased as assets under management increased and increased as assets under management decreased. For the portion of the reporting period prior to March 1, 2024, the total annualized management fee rate was .34%.
Effective March 1, 2024, the Fund's sub-advisory agreements with FMR Investment Management (UK) Limited, Fidelity Management & Research (Hong Kong) Limited, and Fidelity Management & Research (Japan) Limited were amended to provide that the investment adviser pays each sub-adviser monthly fees equal to 110% of the sub-adviser's costs for providing sub-advisory services.
Distribution and Service Plan Fees. In accordance with Rule 12b-1 of the 1940 Act, the Fund has adopted separate Distribution and Service Plans for each class of shares. Certain classes pay Fidelity Distributors Company LLC (FDC), an affiliate of the investment adviser, separate Distribution and Service Fees, each of which is based on an annual percentage of each class' average net assets. In addition, FDC may pay financial intermediaries for selling shares of the Fund and providing shareholder support services. For the period, the Distribution and Service Fee rates, total fees and amounts retained by FDC were as follows:
| | Distribution Fee | Service Fee | Total Fees ($) | Retained by FDC ($) |
| Class A | -% | .25% | 39 | 30 |
| Class M | -% | .25% | 5 | 2 |
| Class C | .75% | .25% | 21 | 16 |
| | | | 65 | 48 |
Sales Load. FDC may receive a front-end sales charge of up to 4.00% for selling Class A shares and Class M shares, some of which is paid to financial intermediaries for selling shares of the Fund. Depending on the holding period, FDC may receive contingent deferred sales charges levied on Class A, Class M and Class C redemptions. The deferred sales charges are 1.00% for Class C shares, .75% for certain purchases of Class A shares and .25% for certain purchases of Class M shares.
For the period, sales charge amounts retained by FDC were as follows:
| | Retained by FDC ($) |
| Class A | 3 |
| Class M | -B |
Class CA | -B |
| | 3 |
A When Class C shares are initially sold, FDC pays commissions from its own resources to financial intermediaries through which the sales are made.
B Amount represents less than five hundred dollars.
Transfer Agent Fees. Fidelity Investments Institutional Operations Company LLC (FIIOC), an affiliate of the investment adviser, is the transfer, dividend disbursing and shareholder servicing agent for each class of the Fund. Effective March 1, 2024, the Fund's management contract was amended to incorporate transfer agent services and associated fees previously covered under a separate services agreement. FIIOC pays for typesetting, printing and mailing of shareholder reports, except proxy statements.
During the period February 1, 2024 through February 29, 2024, the transfer agent fees for each class were a fixed annual rate of class-level average net assets as follows:
| | Amount ($) | % of Class-Level Average Net Assets | |
| Class A | 4 | .1465 | |
| Class M | - | .1020 | |
| Class C | - | .0975 | |
| New York Municipal Income | 79 | .0839 | |
| Class I | 6 | .1619 | |
| Class Z | 1 | .0500 | |
| | 90 | |
| | | | |
Accounting Fees. Fidelity Service Company, Inc. (FSC), an affiliate of the investment adviser, maintains the Fund's accounting records. Effective March 1, 2024, the Fund's management contract was amended to incorporate accounting services and associated fees previously covered under a separate services agreement.
During the period February 1, 2024 through February 29, 2024, the accounting fees were a fixed annual rate of average net assets as follows:
| | % of Average Net Assets |
| Fidelity New York Municipal Income Fund | .0198 |
Interfund Trades. Funds may purchase from or sell securities to other Fidelity Funds under procedures adopted by the Board. The procedures have been designed to ensure these interfund trades are executed in accordance with Rule 17a-7 of the 1940 Act. Any interfund trades are included within the respective purchases and sales amounts shown in the Purchases and Sales of Investments note. During the period, there were no interfund trades.
6. Committed Line of Credit.
Certain Funds participate with other funds managed by the investment adviser or an affiliate in a $4.25 billion credit facility (the "line of credit") to be utilized for temporary or emergency purposes to fund shareholder redemptions or for other short-term liquidity purposes. The participating funds have agreed to pay commitment fees on their pro-rata portion of the line of credit, which are reflected in Miscellaneous expenses on the Statement of Operations, and are listed below. During the period, there were no borrowings on this line of credit.
| | Amount ($) |
| Fidelity New York Municipal Income Fund | 1 |
7. Expense Reductions.
During the period the investment adviser or an affiliate reimbursed and/or waived a portion of fund-level operating expenses in the amount of $13.
8. Distributions to Shareholders.
Distributions to shareholders of each class were as follows:
| | Six months ended July 31, 2024 | Year ended January 31, 2024 |
| Fidelity New York Municipal Income Fund | | |
| Distributions to shareholders | | |
| Class A | $380 | $806 |
| Class M | 51 | 117 |
| Class C | 36 | 101 |
| New York Municipal Income | 15,365 | 30,094 |
| Class I | 600 | 1,069 |
| Class Z | 349 | 459 |
Total | $16,781 | $32,646 |
9. Share Transactions.
Share transactions for each class were as follows and may contain in-kind transactions, automatic conversions between classes or exchanges between affiliated funds:
| | Shares | Shares | Dollars | Dollars |
| | Six months ended July 31, 2024 | Year ended January 31, 2024 | Six months ended July 31, 2024 | Year ended January 31, 2024 |
| Fidelity New York Municipal Income Fund | | | | |
| Class A | | | | |
| Shares sold | 180 | 321 | $2,214 | $3,875 |
| Reinvestment of distributions | 27 | 59 | 334 | 708 |
| Shares redeemed | (278) | (638) | (3,418) | (7,664) |
| Net increase (decrease) | (71) | (258) | $(870) | $(3,081) |
| Class M | | | | |
| Shares sold | 14 | 121 | $158 | $1,466 |
| Reinvestment of distributions | 3 | 8 | 42 | 92 |
| Shares redeemed | (41) | (139) | (500) | (1,674) |
| Net increase (decrease) | (24) | (10) | $(300) | $(116) |
| Class C | | | | |
| Shares sold | 28 | 93 | $348 | $1,137 |
| Reinvestment of distributions | 3 | 8 | 36 | 99 |
| Shares redeemed | (70) | (268) | (864) | (3,217) |
| Net increase (decrease) | (39) | (167) | $(480) | $(1,981) |
| New York Municipal Income | | | | |
| Shares sold | 7,375 | 19,120 | $90,806 | $227,745 |
| Reinvestment of distributions | 770 | 1,622 | 9,454 | 19,554 |
| Shares redeemed | (9,043) | (22,728) | (111,096) | (271,606) |
| Net increase (decrease) | (898) | (1,986) | $(10,836) | $(24,307) |
| Class I | | | | |
| Shares sold | 349 | 1,525 | $4,286 | $18,128 |
| Reinvestment of distributions | 31 | 56 | 375 | 674 |
| Shares redeemed | (454) | (1,184) | (5,579) | (14,131) |
| Net increase (decrease) | (74) | 397 | $(918) | $4,671 |
| Class Z | | | | |
| Shares sold | 591 | 1,167 | $7,278 | $14,015 |
| Reinvestment of distributions | 14 | 18 | 174 | 212 |
| Shares redeemed | (92) | (395) | (1,135) | (4,741) |
| Net increase (decrease) | 513 | 790 | $6,317 | $9,486 |
10. Other.
A fund's organizational documents provide former and current trustees and officers with a limited indemnification against liabilities arising in connection with the performance of their duties to the fund. In the normal course of business, a fund may also enter into contracts that provide general indemnifications. A fund's maximum exposure under these arrangements is unknown as this would be dependent on future claims that may be made against a fund. The risk of material loss from such claims is considered remote.
11. Risk and Uncertainties.
Many factors affect a fund's performance. Developments that disrupt global economies and financial markets, such as pandemics, epidemics, outbreaks of infectious diseases, war, terrorism, and environmental disasters, may significantly affect a fund's investment performance. The effects of these developments to a fund will be impacted by the types of securities in which a fund invests, the financial condition, industry, economic sector, and geographic location of an issuer, and a fund's level of investment in the securities of that issuer. Significant concentrations in security types, issuers, industries, sectors, and geographic locations may magnify the factors that affect a fund's performance.
Item 8: Changes in and Disagreements with Accountants for Open-End Management Investment Companies
Note: This is not applicable for any fund included in this document.
Item 9: Proxy Disclosures for Open-End Management Investment Companies
Note: This is not applicable for any fund included in this document.
Item 10: Remuneration Paid to Directors, Officers, and others of Open-End Management Investment Companies
Note: This information is disclosed as part of the financial statements for each Fund as part of Item 7: Financial Statements and Financial Highlights for Open-End Management Investment companies.
Item 11: Statement Regarding Basis for Approval of Investment Advisory Contract
Note: This is not applicable for any fund included in this document.
1.789717.122
NFY-SANN-0924
Item 8.
Changes in and Disagreements with Accountants for Open-End Management Investment Companies
See Item 7.
Item 9.
Proxy Disclosures for Open-End Management Investment Companies
See Item 7.
Item 10.
Remuneration Paid to Directors, Officers, and Others of Open-End Management Investment Companies
See Item 7.
Item 11.
Statement Regarding Basis for Approval of Investment Advisory Contract
See Item 7.
Item 12.
Disclosure of Proxy Voting Policies and Procedures for Closed-End Management Investment Companies
Not applicable.
Item 13.
Portfolio Managers of Closed-End Management Investment Companies
Not applicable.
Item 14.
Purchases of Equity Securities by Closed-End Management Investment Company and Affiliated Purchasers
Not applicable.
Item 15.
Submission of Matters to a Vote of Security Holders
There were no material changes to the procedures by which shareholders may recommend nominees to the Fidelity New York Municipal Trust’s Board of Trustees.
Item 16.
Controls and Procedures
(a)(i) The President and Treasurer and the Chief Financial Officer have concluded that the Fidelity New York Municipal Trust’s (the “Trust”) disclosure controls and procedures (as defined in Rule 30a-3(c) under the Investment Company Act) provide reasonable assurances that material information relating to the Trust is made known to them by the appropriate persons, based on their evaluation of these controls and procedures as of a date within 90 days of the filing date of this report.
(a)(ii) There was no change in the Trust’s internal control over financial reporting (as defined in Rule 30a-3(d) under the Investment Company Act) that occurred during the period covered by this report that has materially affected, or is reasonably likely to materially affect, the Trust’s internal control over financial reporting.
Item 17.
Disclosure of Securities Lending Activities for Closed-End Management Investment Companies
Not applicable.
Item 18.
Recovery of Erroneously Awarded Compensation
(a)
Not applicable.
(b)
Not applicable.
Item 19.
Exhibits
SIGNATURES
Pursuant to the requirements of the Securities Exchange Act of 1934 and the Investment Company Act of 1940, the registrant has duly caused this report to be signed on its behalf by the undersigned, thereunto duly authorized.
Fidelity New York Municipal Trust
|
By: | /s/Laura M. Del Prato |
| Laura M. Del Prato |
| President and Treasurer (Principal Executive Officer) |
|
|
Date: | September 20, 2024 |
Pursuant to the requirements of the Securities Exchange Act of 1934 and the Investment Company Act of 1940, this report has been signed below by the following persons on behalf of the registrant and in the capacities and on the dates indicated.
|
By: | /s/Laura M. Del Prato |
| Laura M. Del Prato |
| President and Treasurer (Principal Executive Officer) |
|
|
Date: | September 20, 2024 |
|
By: | /s/John J. Burke III |
| John J. Burke III |
| Chief Financial Officer (Principal Financial Officer) |
|
|
Date: | September 20, 2024 |